Article

An Actor-Oriented Multi-Criteria Assessment Framework to Support a Transition towards Sustainable Agricultural Systems Based on Crop Diversification

by
Ileana Iocola
1,*,
Frederique Angevin
2,
Christian Bockstaller
3,
Rui Catarino
3,
Michael Curran
4,
Antoine Messéan
2,
Christian Schader
4,
Didier Stilmant
5,
Florence Van Stappen
5,
Paul Vanhove
5,
Hauke Ahnemann
6,
Jérémy Berthomier
7,
Luca Colombo
8,
Giovanni Dara Guccione
8,9,
Emmanuel Mérot
7,
Massimo Palumbo
10,
Nino Virzì
10 and
Stefano Canali
1
1
CREA, Research Centre for Agriculture and Environment, via della Navicella 2-4, 00184 Rome, Italy
2
INRAE-Eco-Innov, F-78850 Thiverval, Grignon, France
3
Université de Lorraine, INRAE, LAE, F-68000 Colmar, France
4
Research Institute for Organic Agriculture (FiBL), Department of Socioeconomic Sciences, Ackerstrasse 113 CH-5070 Frick, Switzerland
5
Centre wallon de Recherches agronomiques, CRA-W, 9 Rue de Liroux, 5030 Gembloux, Belgium
6
Chamber of Agriculture Lower Saxony, Nienburg office, Vor dem Zoll 2, 31582 Nienburg, Germany
7
Chambre Régionale d’Agriculture des Pays de la Loire CRA-PDL 9, Rue André Brouard 49000 Angers, France
8
Fondazione italiana per la ricerca in agricoltura biologica e biodinamica, FIRAB, Via Pio Molajoni 76, 00159 Rome, Italy
9
CREA Research Centre for Agricultural Policies and Bioeconomy, Via Libertà, 203 90143 Palermo, Italy
10
CREA Research Centre for Cereal and Industrial Crops, Corso Savoia 190, 95024 Acireale, Italy
*
Author to whom correspondence should be addressed.
Sustainability 2020, 12(13), 5434; https://0-doi-org.brum.beds.ac.uk/10.3390/su12135434
Submission received: 5 June 2020 / Revised: 26 June 2020 / Accepted: 29 June 2020 / Published: 6 July 2020
(This article belongs to the Special Issue Biodiversity 2020: Agriculture, Environment and Wellbeing)

Abstract

:
Crop diversification represents a key lever to support the development of sustainable agri-food systems. Knowledge on trade-offs and carry over effects from different crop diversification strategies is essential to inform agricultural stakeholders of potential costs and benefits. This knowledge is limited by existing data and performance measures predominantly focused on single crops, rather than complete rotations. Moreover, sustainability performance indicators are often used for assessment purposes, rather than supporting stakeholder learning and actions. A new set of 32 indicators was developed to address these needs, and used to evaluate the environmental, economic and social sustainability of the diversified agricultural systems highlighted in the case studies, which are often characterized by data availability constraints. This approach was tested in France, Germany and Italy to determine a critical ex-post diagnosis of the existing systems, and for the assessment of ex-ante innovative scenarios. The results will be used to support these case studies in the identification and design of more sustainable agricultural systems. Although the framework is based on feasible and proxy indicators, the assessment outcomes have allowed local actors to reflect on the effects generated by the implemented crop diversification strategies. Key issues include trade-offs occurring between optimizing economic and environmental performance.

1. Introduction

Current agricultural systems have succeeded in supplying large volumes of food to a range of global markets. However, they often generate a range of negative outcomes on multiple fronts, including the widespread degradation of land, water and ecosystems, high greenhouse gas emissions, the depletion of non-renewable resources and resulting in livelihood stress for farmers around the world [1,2]. As a result, agriculture plays a major role in pushing the biosphere beyond planetary boundaries in terms of biodiversity and biogeochemical flows of nitrogen and phosphorus, and is a major contributor to climate change [3]. Many of these problems are specifically linked to highly specialized and simplified industrial agri-food systems dominating farming landscapes in many world regions [4,5].
Crop diversification has been highlighted as a key lever to promote the re-design and the sustainable development of agricultural systems [6]. The temporal and spatial diversification of crops in the field and complimentary rotations can fulfil the need to produce multiple outputs while enhancing ecosystem services [7,8]. This strategy has the potential to limit revenue risk while reducing environmental pressures. However, in spite of potential ecological and economic benefits provided by crop diversification, multiple barriers to its implementation have emerged, linked to the overall functioning of the dominant agro-industrial system [9,10]. Furthermore, there is still limited knowledge relating to the synergies and trade-offs resulting from the implementation of crop diversification strategies [4,11]. These effects must to be accurately evaluated to avoid introducing new problems into the system.
Measuring and benchmarking performance is crucial when determining how well an agricultural system functions and how sustainable it may be. Broad interest in sustainability has led to a proliferation of indicators [12,13] that are often integrated in sustainability frameworks [14,15]. However, their mainstream design has been acknowledged to lead to a potential lock-in, as they tend to favour large scale, specialized agricultural models [1]. This is due in part to inadequate modelling of multifunctional agro-ecological processes (e.g., ecosystem services alongside food provision), limited consideration of temporal effects (e.g., nutrient carryover in the crop rotation) and dubious counter-factual assumptions that higher yields will spare land elsewhere [16]. Furthermore, many indicators developed for sustainability studies have been conceived and utilized for evaluation and assessment purposes (e.g., Agri-Environmental Indicators [17]), rather than to support stakeholder learning and drive their actions during the sustainability transition [18].
To address these needs, improved indicator sets that are sensitive to the holistic sustainability performance of different crop diversification strategies are required. These should adequately represent trade-offs (e.g., the enhancement of ecosystem services countered with less profitability or the increase of the costs due the establishment of new crops) and carry-over (e.g., the reduction of nitrogen fertilization after a grain legume, weed suppression in the succeeding crops after a ley) effects occurring within innovative diversified agricultural systems. Furthermore these indicators should be useful in case studies characterized by data availability constraints and implementation hurdles caused by scaling from experimental plots to an operational farm. To ensure sufficient uptake and policy impact, the relevance of such indicators to key stakeholders (farmers and other agri-food actors) should be ensured via participatory and actor-lead processes of indicator identification [19]. Such an approach can stimulate reflexive analysis and exchanges among actors mobilizing crop diversification as a lever to support the development of sustainable agri-food value chains.
The objectives of this article are to contribute to this gap by developing an actor-oriented framework of feasible and useful indicators to assess the sustainability of crop diversification strategies. This approach was developed in the DiverIMPACTS project (described in the methods) and used to support the transition by using case studies of farmers who employed a range of innovative diversification strategies. The hypothesis is that actor-oriented indicators allow users to evaluate trade-offs that inevitably occur within and between the relevant sustainability dimensions. The participatory process should increase confidence in the assessment process by encouraging actors to find solutions addressing identified weak points. Reflections and learnings emerging from the assessment, and those resulting from bringing together participants possessing different types of knowledge, creates conditions for generating further innovation to promote the transition towards a more robust sustainable agriculture.

2. Materials and Methods

2.1. Design of the Sustainability Assessment Framework of Indicators

The DiverIMPACTS project (2017–2022) set up at its beginning a network of 25 Case Studies (CSs) based on existing and newly elaborated initiatives relating to crop diversification in Europe. In each CS, the creation of a comprehensive learning environment aimed to engage different actors in the agri-food sector, such as farmers, cooperatives, civil society organizations, agri-food industries, interested private companies and researchers, to generate relevant knowledge. The multi-actor network was tasked to promote and help the adoption of crop diversification within the existing socio-technical system.
In this context, a framework of indicators for crop diversification assessment was co-designed by integrating top-down (researchers) and bottom-up (stakeholders’ perspective) approaches. The top-down approach was based on the hierarchical structure of the FAO SAFA (Sustainability Assessment of Food and Agriculture) framework and guidelines [20]. The SAFA framework consists of four pillars of sustainability (governance, economy, society and environment), 21 nested themes (general areas of concern) and 58 sub-themes (specific topics with formulated goals and proposed indicators).
The authors identified a priori important criteria (themes and sub-themes among the sustainability pillars) to articulate the benefits and disadvantages of crop diversification strategies. An initial list of indicators considered relevant by the scientific community (e.g., proposed in SAFA or in the literature pertaining to a specific theme or subtheme) were chosen to reflect the potential benefits and trade-offs of diversified cropping systems. These topics and indicators were integrated with stakeholder perspectives by way of a series of ‘Co-Innovation Workshops’ (CIWs). The CIWs brought together researchers and CS actors to consider the initial criteria and indicator set, and to collect feedback and suggestions for further areas of interest to be studied. Collected feedback was subsequently clustered according to issue similarity and level of stakeholder interest, and placed within the SAFA framework and list of criteria obtained by the top-down approach. A final list of criteria was then developed and made available for comment.
Once the sustainability criteria framework and potential indicators were defined, the researchers narrowed the indicator list based on the following indicator evaluation criteria:
  • Relevance for crop diversification and sustainability—indicators had to be sensitive to crop diversification and consistent with the sustainability objectives of the underlying criterion;
  • Non-redundancy—indicators had to supply complementary information in order to reduce their number, and the related data collection and processing cost, while being able to evaluate trade-offs;
  • Scientific value—indicators had to be calculated in well-founded technical and scientific terms;
  • Feasibility—indicators had to be easily measurable or calculable based on commonly available or easy to collect data on-farm;
  • Indicator type—indicators were classified and selected according to their nature and structure [21]: (i) causal indicators providing insight in the causes determining an effect (proxies could be used to assess an effect) and (ii) effect indicators based on an assessment of the effect variable;
  • System boundaries—for some criteria (e.g., greenhouse gas balance), indirect impacts due to input production were tackled according to the Life Cycle Assessment approach as recommended by Bockstaller et al. [21].
Further interactions with the CSs took place during a second round of CIWs and through a specific survey on indicator relevance, ease of understanding and computational problems (e.g., lack of input data). Due to high constraints on data availability, three approaches were followed in order to obtain useful and operational indicators:
  • The use of literature values for reference data and data gaps (e.g., harvest index used for the crop residue estimation);
  • The use of causal or proxy-indicators that refer indirectly to the process of interest (e.g., the amount of the nitrogen applied on crops through mineral and organic fertilizers as a proxy of nitrous oxide emissions);
  • The use of qualitative information (e.g., quality of harvest products in relation to market standards).
Consequently, a final set of performance indicators covering the economic, environmental and social sustainability pillars was determined. In order to be sensitive to crop diversification in time and space, indicators of the framework were designed accordingly. Specifically, they were adapted to encompass the whole rotation using rotation or multi-annual length as temporal scale and averaging results over the number of the assessed years to capture the carry-over effects of the diversified systems over time. Agricultural systems composed of several rotational areas or groups of fields with different surfaces were also considered in the formulae in order to assess the diversification effects over space.

2.2. The Assessment Process in the Case Studies

The framework of indicators was used for a critical diagnosis of the existing systems (ex post evaluation), to build up knowledge relating to their sustainability performances, and for the assessment of scenarios (ex ante evaluation) to support CSs in the identification and design of sustainable agricultural systems to be field tested.
Representative CSs were selected to test the feasibility of the assessment framework based on: (i) the availability of existing data and/or willingness to collect new data for the assessment, and (ii) whether the CSs represented diverse conditions and objectives in terms of crop diversification. Three CSs were ultimately engaged to test the framework.
A data collection Excel® file was prepared to allow CS participants to collect their own data using farmer interviews, records and direct field observations.
Specifically, the Excel® file was designed to collect the following information on: (i) the cropping systems of the farms (length of rotation, crop succession, area size); (ii) the work processes with the associated machines (speed, depth and workforce); (iii) the cropping practices carried out in each field with the associated work processes, inputs (seeds, fertilizers, pesticides, etc.) and dates; (iv) costs (purchase prices of inputs, workforce, subcontracts, etc.); and (v) quantity, quality and selling prices of outputs.
Data quality was checked by researchers before the final computation of the indicators. Formulae were implemented in the Excel® file to perform the computation of most of the indicators.
Seven indicators were calculated by SYSTERRE® software, a web-based information system to collect and store farm data, and calculate technical, economic and environmental indicators (https://www.arvalis-infos.fr/systerre--@/view-277-arvoad.html).

2.2.1. Case Study 1: Pays de la Loire, France (CS PL)

This CS aimed to enhance crop diversification in order to reduce the detrimental environmental impacts of agriculture (i.e., the loss of biodiversity and the use of harmful plant protection products) and create local value chains able to improve the economic and ecological robustness of the whole agri-food system.
A first farmer was engaged in CS PL to identify the agricultural systems to assess with the set of indicators. After 2016, the farmer made some changes in a group of fields (63.7 ha) characterized by an arable cropping system. He was interested in a better understanding of the effects of the newly implemented diversified strategies. The farmer increased the surface of legume crops from an annual mean of 6.15 ha to 17.27 ha and replaced sunflower (a common rotation crop) with hemp (Cannabis sativa L.). Hemp was selected because of a market opportunity to sell this new crop to a local processor.
In collaboration with the farmer, an ex-post assessment was carried out to evaluate the relative sustainability of two cropping systems (Table A1 in Appendix A):
1.
The reference system—the rotation implemented in the field before 2016 (harvest years: 2015, 2016) characterized by common winter wheat, pea and sunflower as cash crops, and winter oats as cover crop;
2.
The diversified system—rotation titled ‘After 2016’ (harvest years: 2017, 2018). Cash crops were common winter wheat, pea, hemp, spring and winter barley, and a cover crop of winter oats.

2.2.2. Case Study 2: Lower Saxony, Germany (CS LS)

The main objective of this CS was to improve a catchment basin’s water quality, mainly by the improved regulation of nitrate leaching through crop diversification. At the same time, crop diversification may also improve farmers’ incomes. With the aim to explore and reflect up on the effects of crop diversification before implementing any new strategies, two scenarios were identified on a group of fields (50 ha) by the Chamber of Agriculture of Lower Saxony, in collaboration with one farmers participating in this CS, and were assessed using an ex ante evaluation.
The scenarios (Table A1 in Appendix A) were composed of:
1.
The reference system—the current situation characterized by a four-year arable rotation representing similar common local practices (harvest years: 2019–2022; cash crops: potato, common winter wheat, forage maize and rye; cover/catch crop in intercropping: buckwheat and phacelia);
2.
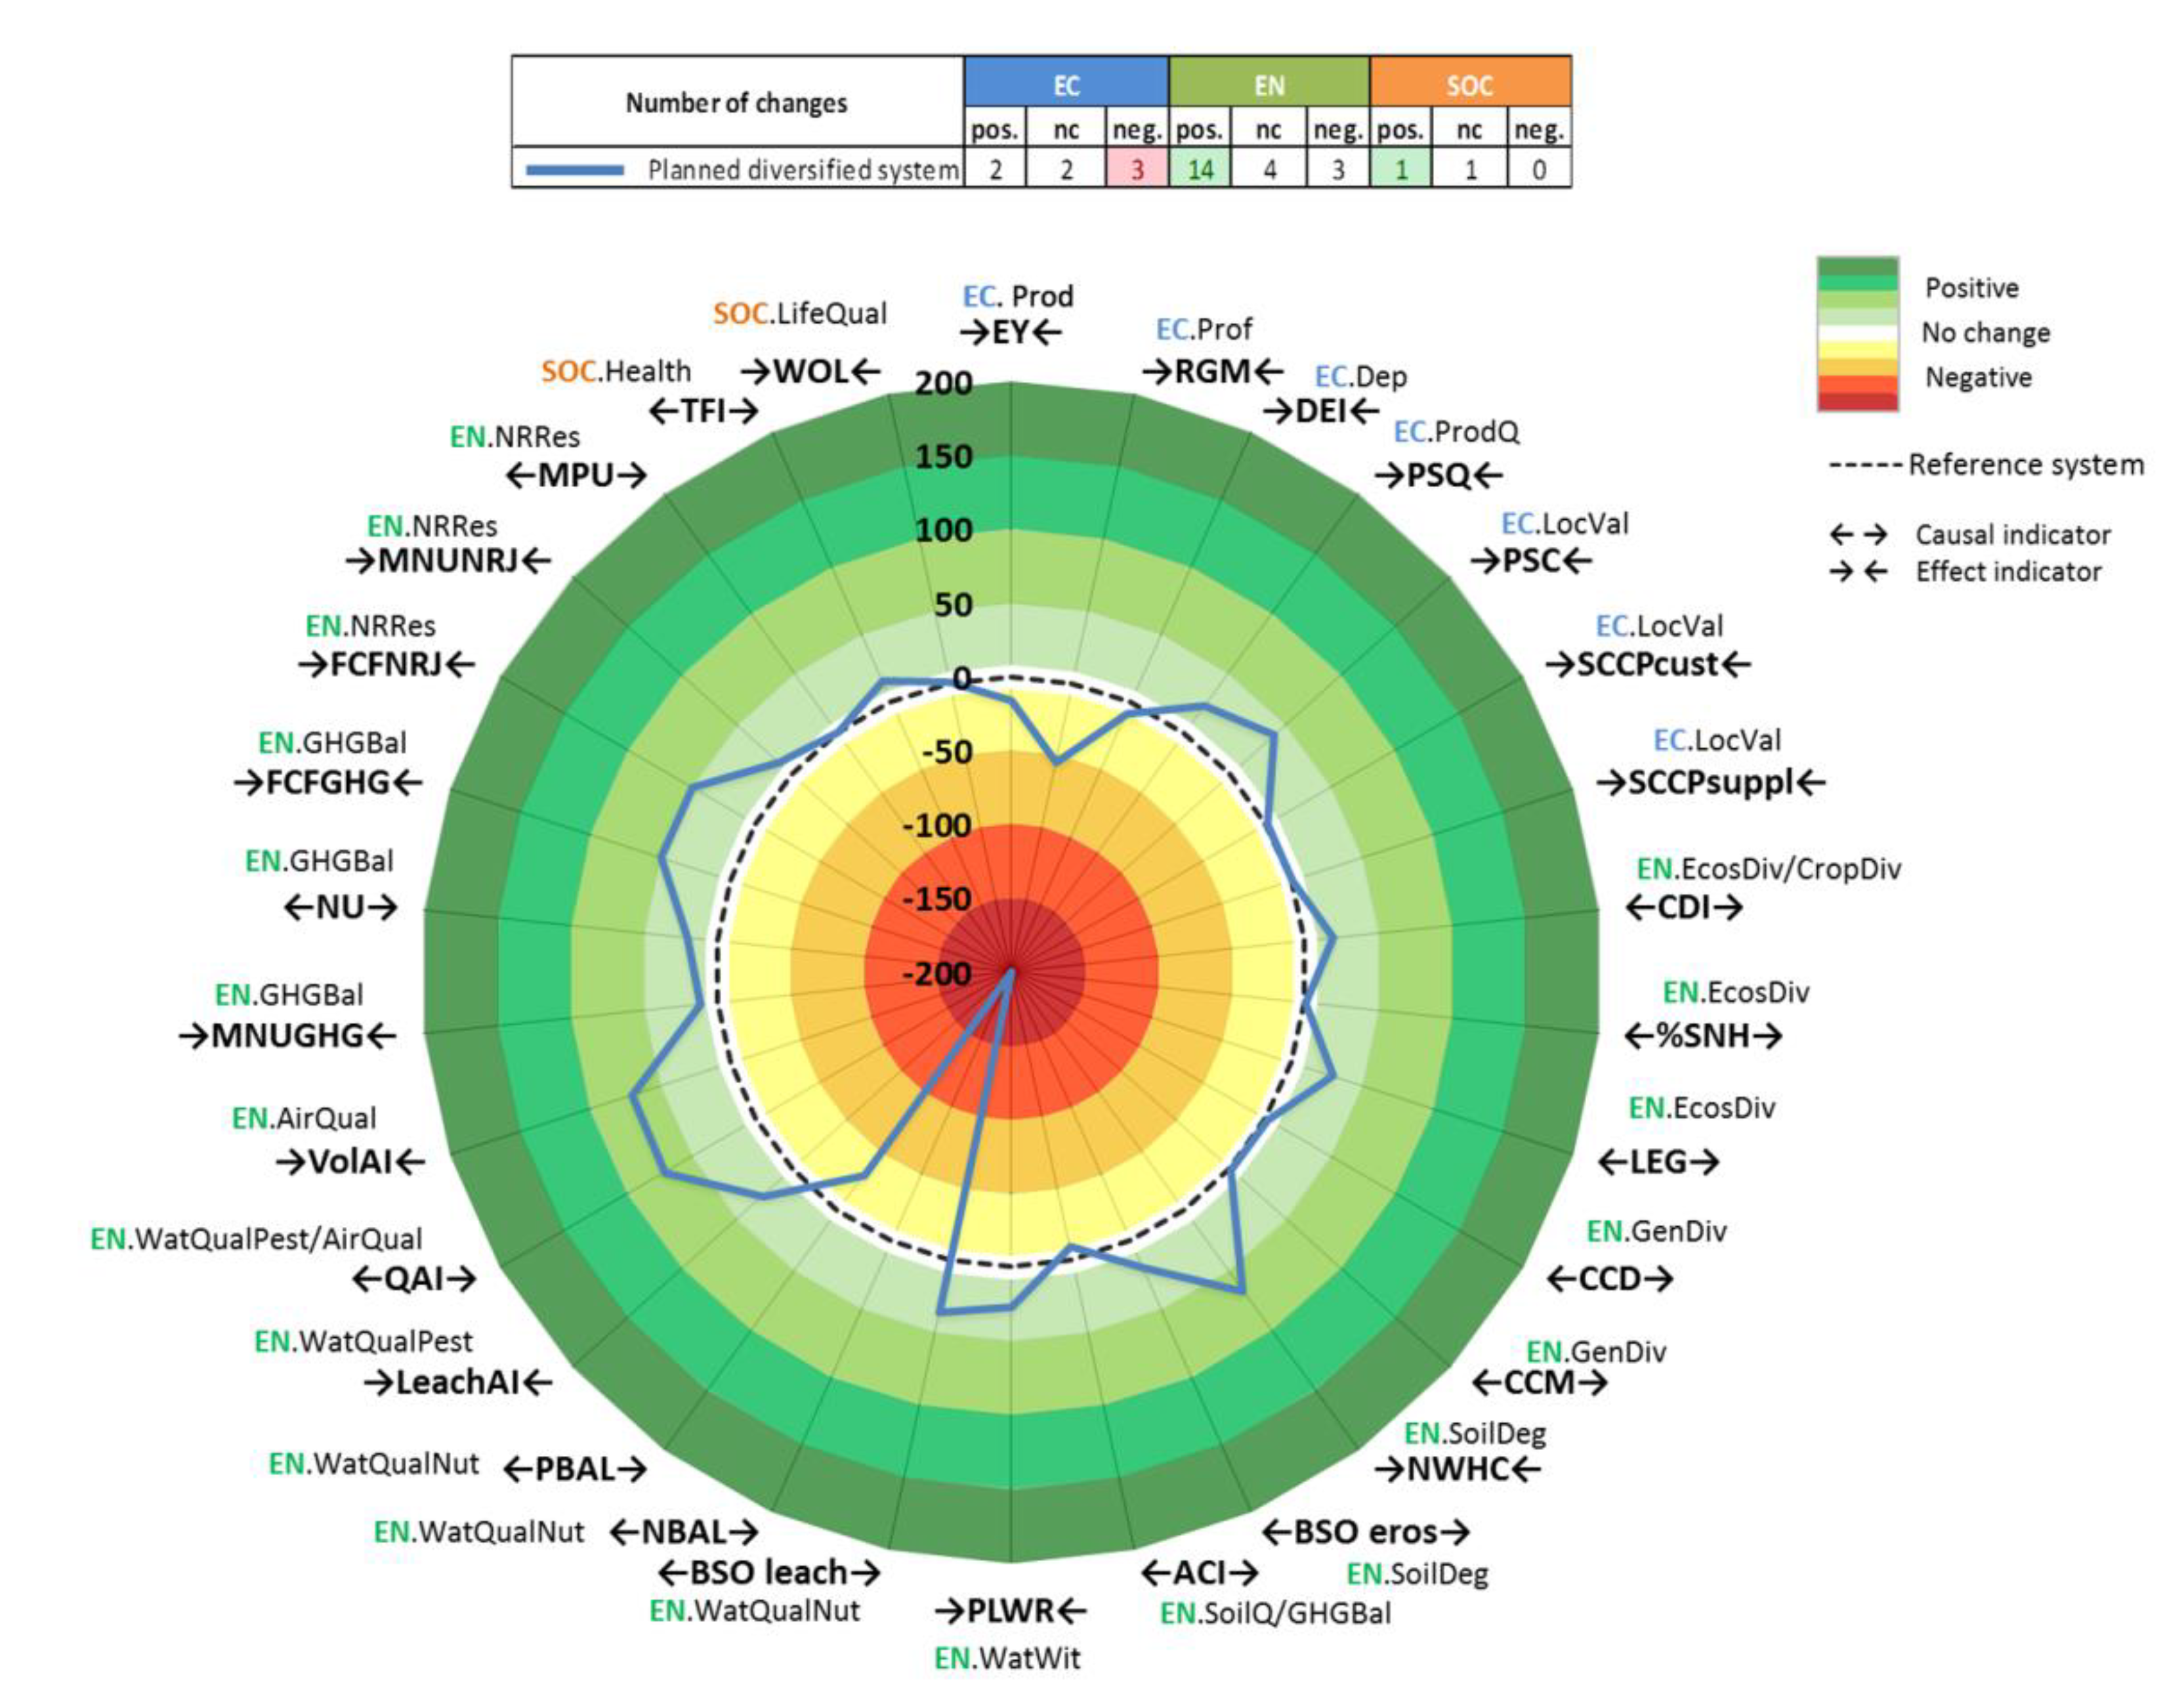
The diversified system—a six-year rotation (‘Planned diversified system’) combined with the introduction of legume cover and cereal catch crops (harvest years: 2019–2024; cash crops: winter barley, winter rapeseed, common winter wheat, rye and forage maize; cover/catch crops: spring oats, niger-Guizotia abyssinica; cover crop intercropping with the main crop rye: clover)

2.2.3. Case Study 3: Sicily (Italy), (CS SI)

The main CS SI goal was to identify pathways for innovative agronomic solutions creating value chain options to improve the sustainability of durum wheat-based cropping systems in dry and rain-fed conditions. In this CS, an innovative farmer began converting to organic production in 2016, and enhancing crop diversification with the introduction of hemp and three Sicilian landraces of durum wheat in a cereal based cropping system. An ex post evaluation of a group of fields (10 ha) was carried out to compare the two systems (Table A1 in Appendix A):
1.
The reference system was a conventional cereal cropping system implemented by the farmer before the organic conversion (harvest years: 2013–2016; Cash crops: durum winter wheat, multi-annual artichoke);
2.
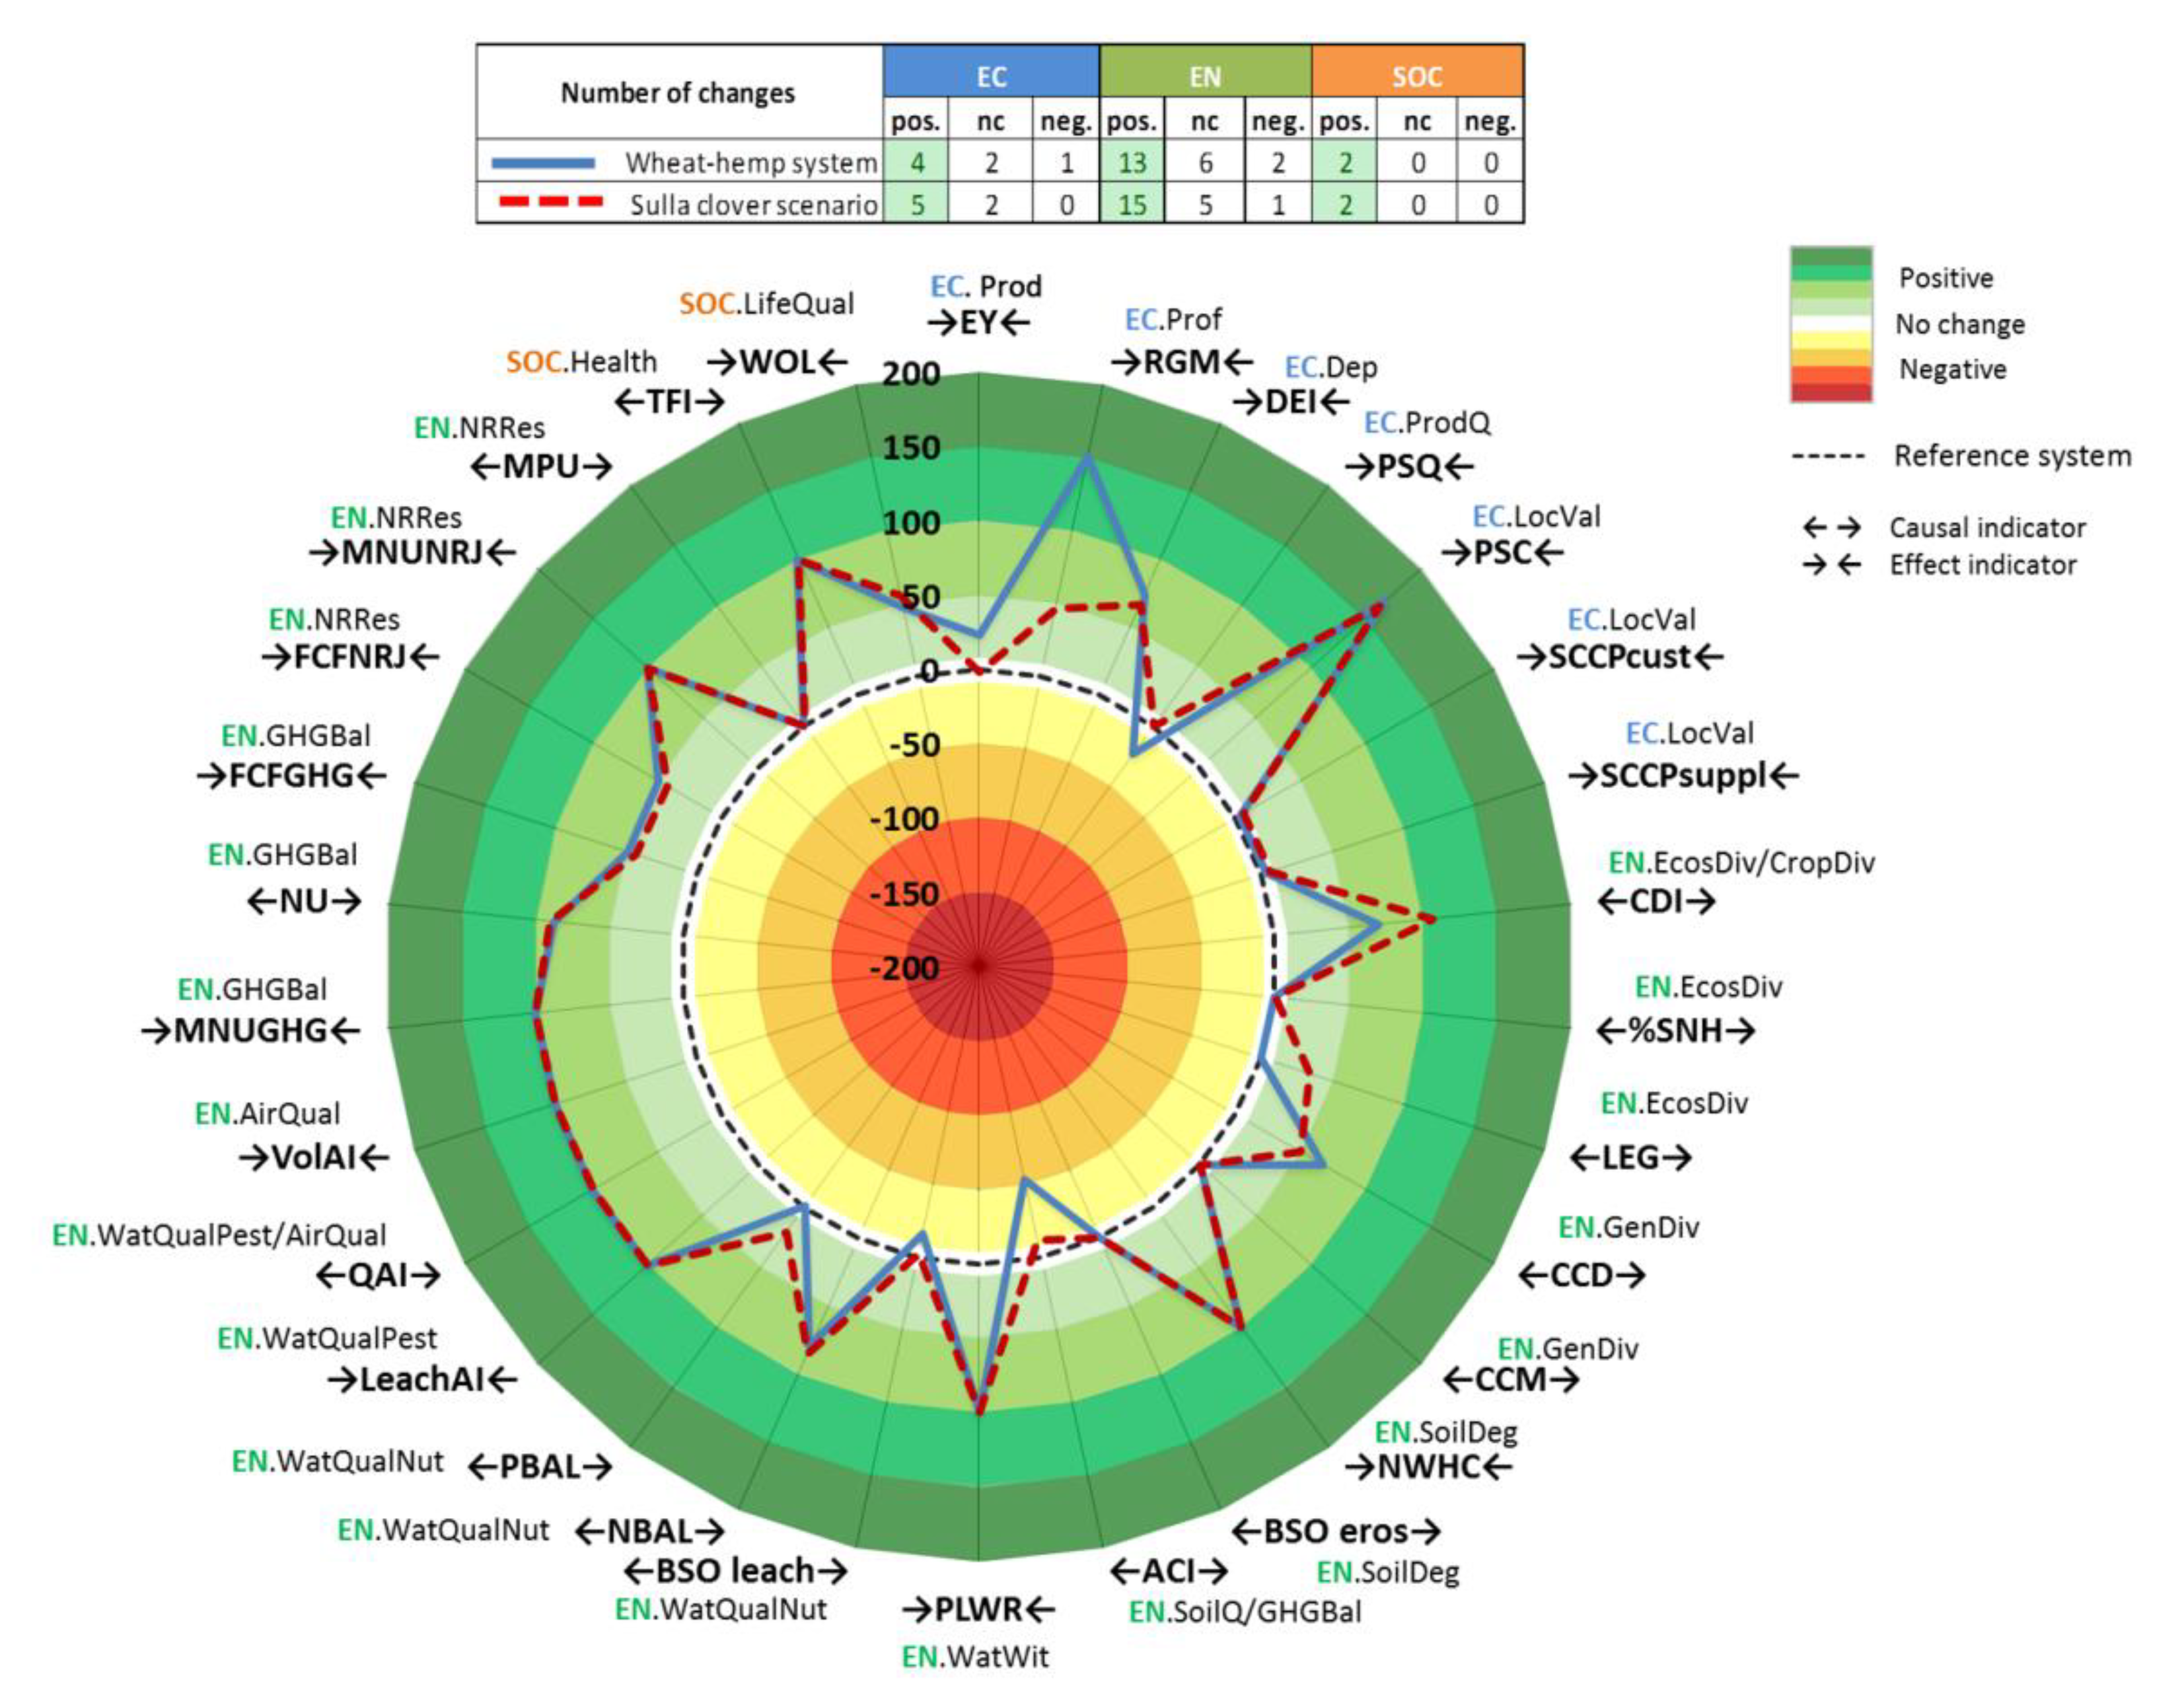
The diversified organic system was a ‘wheat–hemp system’ (harvest years: 2017–2018) characterized by the following cash crops: hemp, common winter wheat, durum winter wheat with three Sicilian landraces.
After the ex post assessment, a further analysis was performed. Researchers identified a potential ex ante scenario based on the introduction of the legume fava bean minor (Vicia faba minor) as a cover crop before wheat, aimed at improving the weaknesses of the diversified ‘Wheat–hemp system’. In the scenario, hemp residues were chopped and left in the field with an addition of 24 kg N/ha as a commercial off-farm organic fertilizer to facilitate their decomposition. Showing the preliminary results of the analysis during a stakeholder meeting and discussing it further with the farmer, the previous scenario was refined and re-assessed. Specifically, fava bean minor was replaced by sulla clover (Hedysarum coronarium L.). The sulla clover was used as a dual-purpose crop for grain production (harvested in June) and green manure. The crop was left to grow until October, and was tilled into the soil for the succeeding crop. Following farmer’s suggestions, sulla clover was inserted into the rotation before hemp to exploit the potential positive effect of this last crop in suppressing weeds during the wheat cycle. However, since hemp was a relatively novel crop in the region, its price was not reflective of an established, stable market (high demand combined with low initial supply). Looking at market trends, researchers and CS actors agreed to reduce the selling price of hemp inflorescence in the ex ante sulla clover scenario from 250 €/kg (mean price in 2017–2018) to 100 €/kg to simulate market stability.

2.2.4. Assessment Result Presentation

Final indicators were calculated across reference and diversified cropping systems for each CS. A performance summary was visualized using radar charts for the purpose of discussion with stakeholders, relating to the performance sustainability of the relevant cropping systems. In each graph, the reference system was set to zero and the results of the innovative diversified systems for each indicator were provided as a percentage change in respect to the reference system. The diversified systems were represented by lines, one per innovative system analyzed, to assess the effects of diversification and to monitor the evolution of further changes over time in relation to the reference situation. All improvements were expressed as positive changes to facilitate graphical interpretation (the wider the area within the line, the better the system’s performance). In the graphs, percentage changes exceeding the value of ±200% were capped to improve visualization. Colour rings were included in the graph to better highlight changes in performance ranging from light to dark green for improvement, and yellow to dark red for underperformance. A white band from −5% to +5% was introduced to indicate a non-relevant change. Finally, a trade-off summary table was also embedded in the graph to report numbers of positive, negative and no change results between systems in each pillar.

3. Results

3.1. Assessment Framework of Indicators

The final framework consists of 19 criteria (six for the economic pillar, 11 for the environmental sustainability, and two for social dimensions) and 32 performance indicators. The criteria are associated with FAO-SAFA themes and sub-themes, but are more specific in nature, thereby allowing more unambiguous indicator selection. The assessment framework comprising criteria and indicators is presented in Table 1.

3.1.1. Economic Sustainability

The two indicators relating to the Productivity (Prod) criterion were: the Energy Yield (EY) and the Land Equivalent Ratio (LER). The EY indicator was selected to evaluate the productivity of different crops in a cropping system as a normalized value of productivity for different crops whose yield cannot be summed up. The energy content values proposed by Villalobos et al. [26] were used for the computation of this indicator. LER [27] can be only used in CSs where intercropping systems are implemented, as it measures the effect of the interactions between crops, quantifying the potential yield advantage of intercrops compared to pure crops.
The Stability (Stab) criterion represents the capability of a system to remain close to stable states of equilibrium. Diversified cropping systems are expected to be associated with an increased stability of yields and a reduced economic risk [28]. The aim of the Yield Coefficient of Variation (YCV) indicator associated to the Stability criterion is to capture this functional propriety. However, its computation requires at least 3 years of data.
The Profitability (Prof) and Dependency on external inputs (Dep) criteria were included to evaluate whether diversified systems would increase or stabilize farmer’s revenues while enhancing yields with fewer inputs, thus potentially increasing the net margins for the farmers and reducing their dependence on external inputs. The Average gross margin at rotation level (RGM) indicator was identified to assess the profitability of crops at the rotation level by calculating a gross margin, while the Total input/turnover (DEI) indicator was selected to quantify the dependency of a system on external inputs, rather than on-farm resources.
Considering the Product quality (ProdQ) criterion, the Product standard quality required by the sector/market (PSQ) [29] was identified as an indicator to quantify this criterion. Due to the data required, the proposed indicator does not consider the measurement of the technical and intrinsic quality of the products; rather, it is based on farmers’ risk perception regarding quality.
Local valorization (LocVal) is a criterion that explores the structure of a supply value chain, how it operates and the location of the involved intermediaries. In general, crop diversification is associated with mechanisms relating to where the products are sold through short supply chains, which tend to result in fairer trade and larger return for producers. The indicators proposed for this criterion provide an idea of farmer participation in short supply chain mechanisms and on their relative economic satisfaction. The Proportion of short food supply chain and local distribution (PSC) is an indicator that associates the increase in the level of sustainability with a decrease in the percentage of products sold to large-scale distribution (for both export and national market). Finally, the Supplier/customer contributions to profitability (SCCPsuppl and SCCPcust) are qualitative indicators aimed at capturing the quality of business relationships of a farmer with his/her suppliers and customers, respectively.

3.1.2. Environmental Sustainability

The three fundamental biodiversity hierarchic categories [30] were included in the framework: the Ecosystem/landscape Diversity (EcosDiv) criterion, the Crop diversification (or diversity between species —CropDiv) criterion and the Genetic diversification (diversity within species—GenDiv) criterion. The Semi Natural Habitat (%SNH) indicator is applied at the ecosystem/landscape level. It is relevant for nature conservation and connectivity among natural areas, and it is strongly correlated with the presence of useful species of different taxa (e.g., bees, bugs) at the landscape scale [31]. The Crop Diversity Index (CDI) is an indicator used for both Ecosystem/landscape Diversity and Crop diversification criteria. It is based on the reciprocal Simpson indicator [32], but it was modified to assess both the spatial and temporal diversification of a farm. The % Legume in rotation (LEG) indicator was included in the biodiversity assessment, because the introduction of legumes may have not only positive agronomic effects but also an influence on the associated diversity of the wild flora, fauna and soil microbes critical in creating resilient agroecosystems [33]. To assess the Genetic diversification, two indicators were included in the framework: the Crop-cultivar diversity (CCD) and the Crop-cultivar mixture (CCM).
Two criteria were included in the framework to evaluate the impacts of crop diversification on the soil: Soil degradation (SoilDeg) and Soil quality (SoilQ). The determination of Soil degradation relied on two proxy indicators to evaluate soil compaction and soil erosion. As soil compaction induced by agricultural equipment is highly dependent on the water status of the soil, the Proportion of crops harvested in wet conditions (NWHC) was identified as an indirect indicator highlighting a likely compaction risk [29]. The Percentage of bare soil during the erosion risk period (BSO eros) was identified as a proxy for erosion risk. The Soil quality criterion is related to the presence of soil organic carbon. Because systematic soil organic carbon measurements are unavailable for a farm, the amount of organic carbon provided as an input over the course of the rotation (C input during the rotation—ACI) was used as a proxy indicator.
Within the water theme, three criteria were considered in the framework: water withdrawal addressing the quantitative aspect and water quality with a focus on nutrients and pesticides. Water withdrawal (WatWit) was measured by an indicator from the LCA community (Pressure on local water resources—PLWR), which assesses the relative pressure of water use for irrigation on local water resource in a watershed as a function of the total water use in the region [34]. The Surface nutrient balances (NBAL and PBAL), at a rotational or pluri-annual temporal scale, were identified to assess water quality (WatQualNut). Moreover, for a better evaluation of the risks related to N leaching and P runoff to surface waters, indicators assessing soil cover during the leaching period (BSO leach) and evaluating soil erosion (BSOeros) were associated with the surface nutrient balances of N [35] and P [36].
The potential impact of pesticides on water bodies (WatQualPest) was evaluated using both a causal and an effect indicator. The Amount of active sprayed ingredients (QAI) is a causal variable used to evaluate the risk for different environmental impacts (e.g., the potential transfer to surface and ground water, as well as air). The Leaching risk of active ingredients (LeachAI) is an effect indicator where the active ingredient susceptible to leaching into ground or surface water bodies is calculated by means of a leaching risk factor, as per an improved version of I-Pest [25].
This approach was used to measure the criterion for Air quality (AirQual), and is composed of the causal indicator QAI and the effect indicator Volatilization risk of active ingredients (VoLAI), where a volatilization risk factor is used to calculate the amount of the active ingredient susceptible to volatility.
A criterion measuring Greenhouse Gas balance (GHGB) was also included. It was assessed using four proxy indicators to consider the net reduction obtained with the soil organic carbon storage (ACI indicator) and emissions from other agriculturally related activities. This latter subset includes the following three indicators: a) Mineral Nitrogen Use for GHG balance calculation (MNUGHG) to assess the global warming potential associated with the production of synthetic fertilizers applied in the system; b) Nitrogen Use (NU) to consider the amount of the nitrogen applied on crops through synthetic and organic fertilizers as a proxy of nitrous oxide emissions from field; c) Global warming potential from total fuel consumption (FCFGHG) to calculate the indirect and direct GHG emissions from fossil fuels used in the system and associated to their production and combustion on the field.
The last environmental criterion was represented by Non-renewable resources (NRRes), where the consumption of fossil energy and phosphorus depletion were considered. The Total fuel consumption for fossil energy use (FCFNRJ) indicator considers the energy required for producing fossil fuel consumed by field operations and other farm related production processes. Moreover, as mineral fertilizer production is one of the largest contributors to fossil energy consumption by agricultural systems, the Mineral Nitrogen Use for fossil energy use (MNUNRJ) was added to the framework to calculate the fossil energy consumption associated with the production of synthetic fertilizers applied on crops. Lastly, the Mineral Phosphorus use (MPU) approximates the resource depletion of mineral phosphorus used in the agricultural systems.

3.1.3. Social Sustainability

The social dimension was assessed by way of two criteria included in the framework: the Farmer and public health (Health) and the Farmers’ quality of life (LifeQual) criteria.
For the first criterion, the Treatment Frequency Index (TFI) was identified to assess indirectly the human health risks resulting from pesticide use [37]. The TFI is measured using the number of reference pesticide doses used per hectare over a rotation.
Work overload (WOL) was selected as a key factor affecting farmers’ quality of life. This indicator assesses the potential work overload associated with diversification.

3.2. The Assessment Framework Applied in the Selected Case Studies

3.2.1. CS PL—Pays de la Loire (FR)

The assessment results (Figure 1) suggest that the changes introduced after 2016 improved the economic performances of the diversified system, with a slight increase in EY (+12.95%) and RGM (+8.04%), and a higher rise in SCCPcust (+45.06%) and SCCPsuppl (+22.40%).
Considering biodiversity, CDI and LEG improved because there were more crop species and an increased area planted with pea. On the other hand, CCD decreased (−33.33%). A reduced use of manure and a reduction of the crop residues left in the fields after the harvest of the total hemp aboveground biomass resulted in a decrease of soil carbon inputs (ACI = 0.39 t C/ha in ‘After 2016’ compared to 0.50 t C/ha in reference system). The nutrient balances of the diversified system showed a slight reduction of the P deficit, as compared to the reference system (PBAL = −15.70 kg P2O5/ha in reference system and −9.00 kg P2O5/ha in the diversified system) and a higher N surplus (NBAL = +39.60 kg N/ha in reference system and +52.00 kg N/ha in diversified system). The diversified system was also characterized by a greater amount of active ingredients included in the pesticides applied (QAI = 2.59 kg/ha in system ‘After 2016’ versus 2.10 kg/ha in the reference system) increasing the risks of pollutant volatilization and leaching. Ammonium nitrate was also used, instead of urea, contributing to worsening the value of the MNUGHG indicator. However, this substitution may reduce ammonia emissions, which is not otherwise addressed by this method.
Further, the diversified system presented potential increased risks for public and worker health, as indicated by a poor performance of the TFI indicator (a change of −58.19%).
Overall, the diversified system ‘After 2016’ showed some positive and no change outcomes for the economic dimension, more negative changes than positive changes for the environment dimension and one negative change for the social dimension in comparison with the reference system.

3.2.2. CS LS—Lower Saxony (DE)

The radar graph of the German CS is reported in Figure 2. Considering the economic dimension, EY and RGM showed lower values in the diversified system (EY = 130,432.50 MJ/ha; RGM = 846.27 €/ha) compared to the reference (EY = 156,710.00 MJ/ha; RGM = 1884.23 €/ha). At the same time, PSQ and PSC increased.
Regarding the environmental pillar, the diversified system performed better in terms of CDI and LEG, which rose +33.93% and +20.00%, respectively. Moreover, the planned system performed better than the reference system in terms of NWHC, by +66.67%. Introducing a greater number of cover and catch crops in the diversified system guaranteed a well-covered soil, thus reducing leaching (BSOleach +35.71%) and erosion (BSOeros + 19.03%) risks. The nitrogen surplus at the rotational level increased (NBAL = +15.47 kg N/ha in ‘Planned diversified system’ and −3.18 kg N/ha in the reference system). In contrast, the diversified system showed a slight increase in the P deficit (PBAL = −16.5 kg P2O5/ha in ‘Planned diversified system’ relatively to −12.75 kg P2O5/ha in the reference system).
The diversified system performed better in terms of the risks of the volatilization (VolAI +70.41%) and leaching (LeachAI +26.63%) of polluting components due to fewer pesticide applications (QAI = 2.85 kg/ha and 0.82 kg/ha, respectively). The use of fewer inputs (i.e., pesticides, synthetic nitrogen fertilizers) in the planned scenario also improved the value of MNUGHG (+11.69%), MNUNRJ (+11.76%), FCFGHG and FCFNRJ (each +50.16%) for the environmental dimension, and TFI (+15.3%) for the social dimension.
Overall, the ‘Planned diversified system’ showed slightly more negative than positive changes in terms of the economic dimension, more positive changes than negative for the environment dimension, and one positive change for the social dimension, when compared to the reference system.

3.2.3. CS SI—Sicily (IT)

Both the ex post and ex ante assessments carried out in this CS are reported in Figure 3.
Regarding the ex post analysis, and specifically the economic dimension of the evaluated systems, both EY and RGM resulted in greater economic values in the ‘Wheat–hemp system’ (EY = 55,936.76 MJ/ha; RGM = 5211.71 €/ha) compared to the reference (EY = 45,506.72 MJ/ha; RGM = 2078.58 €/ha). Conversely, PSQ decreased (−23.08%) due to the greater risk of hemp of not reaching the required quality. PSC significantly increased (+167.92%) due to sale of local wheat landrace products through short supply chain mechanisms.
Considering the environmental dimension, CDI (+70.59%), CCD (+67.00%), NWHC (+100%) and PLWR (+100%) improved in the ex-post diversified system. Nevertheless, the assessment detected a decrease of soil carbon inputs in the ‘Wheat–hemp system’ (ACI = 0.06 t C/ha) compared to the reference value (ACI = 0.13 t C/ha) due to the removal of hemp residues from the field by the farmer because of their slow decomposition rate.
The reduction of the N fertilization rate in the organic diversified system improved the performance of the N balance (+79.97%), even if the nitrogen deficit obtained at the rotational level (NBAL = −25.6 kg N/ha) could affect soil fertility in the long-term. The decreased amount of N fertilizer applied in the organic diversified system also improved the performance of both NU and MNUGHG.
Organic conversion also improved the value of indicators related to pesticides (+100% for QAI, LeachAI, VolAI). Moreover, the replacement of artichoke with hemp reduced tillage and crop operations, improving the performances for FCFGHG and FCFNRJ.
Additionally, the diversified ‘Wheat–hemp system’ showed a reduction of the risk to public health (TFI + 100%) and work overload (WOL + 47.57%).
There was a reduction in economic performance (EY = 44,812.90 MJ/ha; RGM = 3,029.42 €/ha) in the ex-ante ‘Sulla clover scenario’, as compared to the ‘Wheat–hemp system’. However, this scenario was built in cooperation with the farmer to improve soil carbon stock and address the nitrogen deficit identified in the ‘Wheat–hemp system’. The introduction of sulla clover effectively mitigates these weaknesses, particularly in terms of the C-input (ACI = 0.11 t/ha). For the N deficit, the removal of sulla clover beans reduced the potential contribution of the crop to the replenishment of soil fertility (NBAL = −19.1 kg N/ha).
Overall, the two diversified systems (‘Wheat–hemp system’ and ‘Sulla clover Scenario’) showed more positive changes than negative changes for all three sustainability dimensions.

4. Discussion

4.1. Indicators Framework

Sustainability may be enhanced by crop diversification. However, potential trade-offs between sustainability dimensions and themes are often unavoidable. According to Bossel [38], the identification of an ‘essential’ set of indicators to consider trade-offs is a difficult task. Experience has shown that long lists of indicators are high-performing [39,40] but impractical for real-world use in farm case studies with limited resources. The framework presented in this study required a substantial data collection effort, but was practically implemented in the three presented case studies using widely available data from farm records and farmer/stakeholder interviews, and reference information from the literature and from experts.
The indicator set developed in the study was also of a manageable size, with a single key indicator used for the majority of sustainability criteria. While this approach reduces the coverage of sub-topics for each criterion, it also reduces redundancy and focuses on efforts to find key performance indicators. Redundancies in indicator sets introduces additional costs in data collection and processing efforts, and reduce the interpretability of results [41]. To avoid redundancy, correlation studies are needed in order to reduce the number of indicators. In a recent study, Sabourin [42] combined information derived from a meta-analysis on indicator correlation performed by German et al. [43] with an expert/stakeholders survey. This identified a minimal list of 16 uncorrelated indicators (six economic, seven environmental and three social) to apply for the sustainability assessment of arable cropping systems. The DiverIMPACTS framework was developed considering the complementarities found in this study. However, additional indicators were integrated to cover SAFA-FAO themes and sub-themes considered relevant by the scientific community to assess crop diversification (i.e., EcosDiv, CropDiv, GenDiv) and to better respond to actor needs (i.e., LocVal; ProdQ).
According to Olsson et al. [14], further indicators were also included in the framework for the evaluation of both impacts on the agricultural sector itself and the effects of agriculture on other external compartments. For example, the total annual nitrogen inputs, NU, may have a direct impact on farms, affecting crop yields and soil fertility, but the types of mineral fertilizers used on a farm could affect the encompassing system and/or society as a whole because of different global warming potentials associated with the production of the synthetic fertilizers (MNUGHG).
Additionally, both causal and effect indicators were included for the assessment of some criteria (i.e., WatQualPest, AirQual). In fact, causal indicators (i.e., QAI) detect changes in management, while effect indicators (i.e., VolAI; LeachAI) can be used for analysing cause–effect relations [21]. Agricultural systems with higher volatilization and/or leaching of active ingredients (effect) are not necessarily those characterized by an intensive use of pesticides (causal), since a few particularly risky substances may have disproportionate effects. Understanding these relations is relevant for finding sustainable solutions. However, due to the need of limiting the number of indicators, as well as for data availability constraints in the CSs, we did not select effect indicators for other criteria.
The list of indicators was co-designed in the DiverIMPACTS project by the scientific community and CSs actors, and aimed to create a learning environment to gain insights and knowledge for both parties [44] Actors were engaged from the beginning of the design process, in order to include different viewpoints and knowledge sources in the framework [45]. This stimulates awareness and process ownership [46], facilitating the acceptance of a shared and holistic concept of sustainability and interpretation of results [47].
The engagement of local actors was principally relevant in the definition of indicators. Indeed, the indicators were mainly identified to take into account data availability, collection feasibility and relative adaptability for a range of case studies, in order to reduce data collection efforts by CS actors. One actor noted “We have to keep in mind that diversified cropping systems can be very diversified. For example in farms characterized by vegetable cropping systems we could have around 30 crop species at the farm scale with two to three crops following each other within a year on the same field. This makes data collecting and processing very time consuming”. Simple and proxy indicators were therefore preferred to fulfil the feasibility requirement. This set of indicators provides a clear and quick overview of the sustainability of an agricultural system, allowing the identification of the strengths and weaknesses. However, these indicators provide estimations rather than an exact measure of variables and risks. Data from controlled field experiments (i.e., GHG emissions, soil organic carbon, N leaching, etc.) could be used to validate proxy indicators with actual measurements under local conditions.
Aspects related to life satisfaction and positive emotions were not included in the assessment framework because they were considered too subjective by researchers and difficult to quantify in hypothetical ex-ante scenarios to be useful. For example, the usefulness of happiness, cited by some CS actors in the course of the co-innovation workshops, or other generally subjective social indicators is still controversial in the scientific community [48]. However, many comments were reported by CS actors on the indicator selected for the assessment for quality of life: “WOL does not really cover insights in farmers’ quality of life. We need an indicator that covers the farmers’ satisfaction of working with diversification: for example it may require a greater workload, but provide more satisfaction’ and ‘Need to consider satisfaction of farmers/stakeholders working on diversification challenges”. Barbier et al. [49] pointed out that positive emotions have received scant attention in scientific literature, but they could serve as an incentive to boost the sustainability transition.
In any case, bringing together different types of knowledge is still challenging, as both stakeholders and researchers have to alter their way of thinking [50]. A certain reticence must be overcome on the part of all participants. Scientists are concerned with maintaining the quality of their work, while local actors sometimes seem to consider scientific knowledge not relevant for their particular needs and specific contexts.

4.2. Results from the Case Studies

The innovations introduced by the farmer in the CS PL (FR) mainly contributed to improve the economic sustainability dimension, as highlighted by the slight increase in RGM and by the improvement of SCCPcust and SCCPsuppl. The changes in the latter indicators were principally due to pea, and the related increasing interest and demand for plant-derived proteins and foods.
Nevertheless, some environmental constraints related to the use of plant protection products were detected in the diversified system. The assessment highlighted an increased pollution risk caused by the application of herbicides with greater risk factors of volatilization (i.e., pendimethaline in pea) and the leaching of the active ingredients (i.e., mecoprop-P in spring barley). The diversified system was also characterized by an increased use of mineral N fertilizers, and a decrease of the organic fertilizer that reduced soil carbon inputs and increased greenhouse gases emissions. Further sustainable agronomic practices must be re-discussed, re-defined and re-assessed through an ex-ante analysis in collaboration with the farmer in order to encourage decreasing pesticide use and/or to replace riskier pesticides with less hazardous ones. Furthermore, a more robust and diversified crop rotation might help the farmer adopt a system in which a potential for a natural regulation of weeds, pests and diseases exists. The introduction of hemp already supports farmers in this direction, thanks to the ability of this crop to suppress weeds [51,52].
In CS LS (DE), the hypothesis was of encouraging crop diversification to reduce N leaching. However, its economic attractiveness was not supported in the short term by the ex-ante assessment of the planned diversified system. In this scenario, the most productive and profitable crops, such as potato, were replaced by winter rapeseed and winter barley, both of which are characterized by lower yields and lower returns. The removal of potato was driven by its greater input costs related to more plant protection treatments, greater fuel consumption, and seed costs when compared to the other crops of the rotation. This led to only a slight reduction of dependence from external inputs (DEI,−9.1%), despite the introduction of more cover/catch crops in the diversified system. Moreover, the replacement of potato with other crops caused the value of PSQ to increase because of a greater perceived risk that potatoes would not reach market quality requirements (as reported by local actors during the data collection phase). The removal of this crop also reduced soil compaction risk, leaving only maize as the crop harvested under wet conditions. Considering the main CS objective of reducing water pollution, the planned diversified system scenario is predicted to improve the water quality of the catchment basin by reducing pesticide and nitrate leaching. The introduction of more cover/catch crops also increased soil cover during periods of leaching risk. However, this also led to negative changes in the surface nutrient balance; in particular, those related to N surplus at the rotational level. This result needs to be verified, as N leaching from croplands and the effectiveness of cover crops (especially non-legumes) varies from site to site. Validation in relation to local soil, climate and crop management factors is required [53,54]. This validation is underway through field experiments established by the project in this CS.
In the CS SI (IT), a further process of improving the cropping system was carried out, based on weaknesses identified in the initial evaluation. The involved farmer already reached, in his transition pathway, an adequate input substitution level [55,56] in the organic conversion. The elimination of synthetic chemical inputs generally increases the ability of farmers to utilize natural agroecological processes [49]. Accordingly, the farmer in this CS decided to enhance crop diversification by introducing hemp and increasing the number of winter wheat genotypes, favouring the locally adapted ones. These strategies improved the environmental sustainability of the agricultural system, in addition to improving the economic returns through the sale of the hemp inflorescence and the higher selling prices of local wheat landraces products through short supply chains.
However, the diversified ‘Wheat–hemp system’ led to a risk of a soil organic carbon reduction and a nitrogen deficit at the rotational level. The ex-ante scenario incorporating sulla clover was therefore co-designed by integrating scientific and local knowledge to overcome the perceived weaknesses of the diversified system. The farmer actively participated by suggesting improvements to the solution proposed by researchers in order to maintain environmental benefits without reducing the economic performance of the system. The end result was a compromise solution balancing economic returns and environmental concerns. While the economic performances of the ‘Wheat–hemp system’ and sulla clover scenario were strongly related to the sale of hemp flowers within a new market in Italy, there are uncertainties relating to market development. Increasing competition drives the diversification to process a range of hemp products (i.e., oil, pasta, etc.) in order to maintain the economic gains of the diversified systems.
Across all CSs, the assessment framework allowed actors to evaluate and reflect on the effects generated by the implementation of crop diversification strategies. The research presents evidence that crop diversification can lead to different trade-off patterns. Examples include an economic improvement with environmental detriments (CS PL), and an environmental improvement with a disadvantage to economic performance (CS LS). There is also evidence of ‘win–win’ solutions, where an improvement of all sustainability dimensions is observed (CS SI). Further assessments using longer datasets to take into account the annual variability of agricultural production are necessary in these and other CSs, to confirm the generality and frequency of such patterns. To accomplish this goal, additional data related to the diversified systems will be collected during the upcoming years of DiverIMPACTS project. Otherwise, data and information from different sources (such as agricultural statistics, expert opinions, data from other farms with similar situations of the same and/or different CSs) will be used to offset the absence of the reference systems and to simulate by an ex-ante assessment the current behavior of the reference situations.
The importance of data collection and the sustainability assessment of real-word farming systems is also strongly underpinned by the European Commission, which aims to create a Farm Sustainability Data Network for benchmarking farm performance against regional, national or sectorial averages [57]
The enriched datasets will be used to validate our first outcomes. The validation process should also be strengthened by assessing the sustainability of the tested agricultural systems with different methods and comparing their outcomes [58]. Further studies should also investigate the interactions among indicators of the DiverIMPACTs framework, and examine by quantitative analysis the trade-offs between the different sustainability dimensions in order to achieve better insights into the systems. Lastly, although innovations have been introduced in these CSs, more suitable strategies must be identified and designed, in collaboration with local actors, to resolve ecological and economic trade-offs where possible.

5. Conclusions

The actor-oriented framework of indicators proposed by DiverIMPACTS was developed to assess the environmental, economic and social sustainability of crop diversification strategies in Europe. An original set of 32 indicators was identified and constructed to be sensitive to crop diversification and capture the trade-offs and carry-over effects of diversified cropping systems over time and space. The indicators were developed by integrating research and stakeholder perspectives, and achieving a compromise between scientific accuracy and ease of measurement. Causal and proxy indicators were therefore preferred in order to fulfil the feasibility requirement. The sustainability assessments carried out in the three CSs demonstrated the capability of the DiverIMPACTS indicator set to evaluate trade-offs. The use of the framework in the other CSs, characterized by a diversity of environmental and socio-economic contexts, will provide an opportunity to validate these initial results. The DiverIMPACTS framework of indicators has also proven to be helpful in a learning and decision-making context. The process implemented in this study specifically support innovation based on crop diversification and farmers’ pathways towards more sustainable agriculture systems, which are often constrained by local contexts. Different actors of the broader agri-food systems in which the innovative farmers are embedded should be involved in the assessment process. This creates the conditions to strengthen the sustainability of the entire value chain. Future steps in the project to extend this approach to other case studies will serve to define local solutions throughout Europe and help CSs’ sustainability transition via crop diversification.

Author Contributions

Conceptualization, F.A., C.B., M.C., A.M., C.S., D.S., F.V.S. and S.C.; data curation, P.V.; investigation, H.A., J.B., L.C., G.D.G., E.M., M.P. and N.V.; project administration, A.M.; software, I.I., C.B., R.C., F.V.S. and P.V.; supervision, S.C.; visualization, I.I. and C.B.; writing—Original draft, I.I.; writing—Review and editing, I.I., F.A., C.B., R.C., M.C., C.S., D.S., F.V.S., P.V., L.C., G.D.G., M.P., N.V. and S.C. All authors have read and agreed to the published version of the manuscript.

Funding

This research is part of the DiverIMPACTS project funded by the European Union’s Horizon 2020 research and innovation programme under grant agreement N. 727482.

Acknowledgments

The Authors wish to greatly acknowledge all the actors involved in the case studies of DiverIMPACTS for their kind availability in sharing their time, knowledge and experiences.

Conflicts of Interest

The authors declare no conflict of interest.

Appendix A

Table A1. The reference and the diversified agricultural systems identified for the sustainability assessment by the involved Case Studies (CS). The yields (kg/ha) and the selling prices (€/kg, when sold) are reported for each crop.
CS PL (FR)
Reference System (Ex post): Before 2016
Harvest YearsFields
7.13 ha4 ha10.47 ha8.03 ha1.93 ha2.21 ha11.8 ha5.13 ha3.33 ha1.09 ha8.59 ha
2015sunflower- grain: 1800 kg/ha (0.32 €/kg)pea- bean: 600 kg/ha (0.19 €/kg)sunflower-grain: 2200 kg/ha (0.32 €/kg)soft winter wheat- grain: 7597 kg/ha (0.17 €/kg)soft winter wheat-grain: 8031 kg/ha (0.17 €/kg)sunflower- grain: 1799 kg/ha (0.32 €/kg)soft winter wheat-grain: 10,929 kg/ha (0.17 €/kg)sunflower- grain: 2200 kg/ha (0.32 €/kg)soft winter wheat-grain: 95,040 kg/ha (0.17 €/kg)sunflower- grain: 2600 kg/ha (0.32 €/kg)soft winter wheat-grain: 8489 kg/ha (0.17 €/kg)
2016soft winter wheat-grain: 6566 kg/ha (0.15 €/kg)soft winter wheat-grain: 6566 kg/ha (0.15 €/kg)soft winter wheat-grain: 6888 kg/ha (0.15 €/kg)winter oat (cover crop)-green manure: 2500 kg/hasoft winter wheat-grain: 3505 kg/ha (0.15 €/kg)soft winter wheat-grain: 4478 kg/ha (0.15 €/kg)winter oat (cover crop)--green manure: 2500 kg/hasoft winter wheat-grain: 5377 kg/ha (0.15 €/kg)soft winter wheat-grain: 3624 kg/ha (0.15 €/kg)soft winter wheat-grain: 6679 kg/ha (0.15 €/kg)s winter oat (cover crop)--green manure: 2500 kg/ha
pea- bean: 2847 kg/ha (0.19 €/kg)sunflower- grain: 4000 kg/ha (0.38 €/kg)sunflower-grain: 4000 kg/ha (0.38 €/kg)
Diversified system (Ex post): After 2016
2017winter oat (cover crop)-green manure: 2500 kg/hawinter oat (cover crop)-green manure: 2500 kg/hawinter oat (cover crop)-green manure: 2500 kg/hasoft winter wheat-grain: 7711 kg/ha (0.17 €/kg)winter oat (cover crop)-green manure: 2500 kg/hawinter oat (cover crop)-green manure: 2500 kg/hasoft winter wheat-grain: 8861 kg/ha (0.17 €/kg)soft winter wheat-grain: 6357 kg/ha (0.17 €/kg)winter oat (cover crop)-green manure: 2500 kg/hawinter oat (cover crop)-green manure: 2500 kg/hasoft winter wheat-grain: 7208 kg/ha (0.17 €/kg)
spring barley- grain: 5357 kg/ha (0.15 €/kg)spring barley- grain: 4659 kg/ha (0.15 €/kg)hemp –whole plant: 8950 kg/ha (0.11 €/kg)pea- bean: 4166 kg/ha (0.24 €/kg)pea- bean: 5087 kg/ha (0.24 €/kg)spring barley- grain: 4659 kg/hapea- bean: 4862 kg/ha (0.24 €/kg)
2018soft winter wheat-grain: 6952 kg/ha (0.17 €/kg)soft winter wheat-grain: 6952 kg/ha (0.17 €/kg)soft winter wheat-grain: 7331 kg/ha (0.17 €/kg)winter oat (cover crop)-green manure: 2500 kg/hawinter oat (cover crop)-green manure: 2500 kg/hawinter barley- grain: 6145 kg/ha (0.162 €/kg)winter barley- grain: 6199 kg/ha (0.162 €/kg)winter oat (cover crop)-green manure: 2500 kg/hawinter oat (cover crop)-green manure: 2500 kg/hasoft winter wheat-grain: 7284 kg/ha (0.17 €/kg)winter oat (cover crop)-green manure: 2500 kg/ha
hemp–whole plant: 8130 kg/ha (0.11 €/kg)pea- bean: 4285 kg/ha (0.24 €/kg)pea- bean: 4752 kg/ha (0.24 €/kg)pea- bean: 4499 kg/ha (0.24 €/kg)pea- bean: 4285 kg/ha (0.24 €/kg)
CS LS (DE)
Reference system (Ex ante): Current system Diversified system (Ex ante): Planned diversified system
Harvest years50 ha50 ha
2019potato- tuber: 45,000 kg/ha (0.14 €/kg)winter barley–grain: 6000 kg/ha (0.168 €/kg)
spring oats (catch crop)–green manure: 1000 kg/ha
2020soft winter wheat–grain: 7000 kg/ha (0.18 €/kg)winter rapeseed-grain: 3500 kg/ha (0.365 €/kg)
buckwheat + phacelia (cover/catch crops in intercropping)
- green manure: 2000 kg/ha
clover (cover crop)-green manure: 2500 kg/ha
2021forage maize–whole plant: 45,000 kg/ha (0.029 €/kg)soft winter wheat–grain: 7000 kg/ha (0.18 €/kg)
niger (Guizotia abyssinica, cover crop)-green manure: 1000 kg/ha
2022rye–grain: 7000 kg/ha (0.166 €/kg)rye–grain: 7000 kg/ha (0.166 €/kg)
buckwheat + phacelia (cover/catch crops in intercropping)
- green manure: 2000 kg/ha
clover (cover crop in intercropping with main crop)-green manure: 2500 kg/ha
2023-forage maize–whole plant: 45,000 kg/ha (0.029 €/kg)
2024-rye–grain: 7000 kg/ha (0.166 €/kg)
clover (cover crop in intercropping with main crop)-green manure: 2500 kg/ha
CS SI (IT)
Reference system (Ex post): Conventional durum wheat-artichoke system
Harvest years3 ha7 ha
2013durum winter wheat–
grain: 3800 kg/ha (0.2 €/kg); straw: 3900 kg/ha (0.027 €/kg)
artichoke-flower: 3940 kg/ha (1.4 €/kg)
2014durum winter wheat–
grain: 3800 kg/ha (0.2 €/kg); straw: 3900 kg/ha (0.027 €/kg)
artichoke-flower: 5890 kg/ha (1.4 €/kg)
2015durum winter wheat–
grain: 3800 kg/ha (0.2 €/kg); straw: 3900 kg/ha (0.027 €/kg)
artichoke-flower: 5890 kg/ha (1.4 €/kg)
2016durum winter wheat–
grain: 3800 kg/ha (0.2 €/kg); straw: 3900 kg/ha (0.027 €/kg)
artichoke-flower: 3940 kg/ha (1.4 €/kg)
Diversified system (Ex post): Organic wheat- hemp system
Harvest years1 ha2 ha1 ha4 ha2 ha
2017hemp-grain: 300 kg/ha (3 €/kg); flower: 120 kg/ha (200 €/kg)soft winter wheat-grain: 4000 kg/ha (0.6 €/kg); straw: 3857 kg/ha (0.027 €/kg)durum winter wheat-grain: 2950 kg/ha (0.6 €/kg); straw: 3857 kg/ha (0.027 €/kg)
2018durum winter wheat-grain: 2100 kg/ha (0.6 €/kg); straw: 3660 kg/ha (0.027 €/kg)soft winter wheat-grain: 3200 kg/ha (0.6 €/kg); straw: 3660 kg/ha (0.027 €/kg)bare soilhemp-grain: 220 kg/ha (3 €/kg); flower: 20 kg/ha (300 €/kg)bare soil
Diversified system (Ex ante): Sulla clover scenario
Harvest years1 ha2 ha1 ha1 ha1 ha2 ha1 ha1 ha
2020soft winter wheat-grain: 3600 kg/ha (0.6 €/kg); straw: 3750 kg/ha (0.027 €/kg)durum winter wheat-grain: 2500 kg/ha (0.6 €/kg); straw: 3750 kg/ha (0.027 €/kg)sulla clover (bean; cover crop)–
bean 1500 kg/ha (0.5€/kg); green manure: 2500 kg/ha
hemp-grain: 260 kg/ha (3 €/kg); flower: 70 kg/ha (100 €/kg)
2021sulla clover (bean; cover crop)–
bean 1500 kg/ha (0.5 €/kg); green manure: 2500 kg/ha
hemp-grain: 260 kg/ha (3 €/kg); flower: 70 kg/ha (100 €/kg)soft winter wheat-grain: 3600 kg/ha (0.6 €/kg); straw: 3750 kg/ha (0.027 €/kg)durum winter wheat-grain: 2500 kg/ha (0.6 €/kg); straw: 3750 kg/ha (0.027 €/kg)soft winter wheat-grain: 3600 kg/ha (0.6 €/kg); straw: 3750 kg/ha (0.027 €/kg)durum winter wheat-grain: 2500 kg/ha (0.6 €/kg); straw: 3750 kg/ha (0.027 €/kg)
2022hemp-grain: 260 kg/ha (3 €/kg); flower: 70 kg/ha (100 €/kg)soft winter wheat-grain: 3600 kg/ha (0.6 €/kg); straw: 3750 kg/ha (0.027 €/kg)durum winter wheat-grain: 2500 kg/ha (0.6 €/kg); straw: 3750 kg/ha (0.027 €/kg)sulla clover (bean; cover crop)–
bean 1500 kg/ha (0.5 €/kg); green manure: 2500 kg/ha

References

  1. Frison, E. From Uniformity to Diversity: A Paradigm Shift from Industrial Agriculture to Diversified Agroecological Systems; iPES Food, International Panel of Expert on Sustainable Food Systems: Brussels, Belgium, 2016. [Google Scholar]
  2. Stehle, S.; Schulz, R. Agricultural insecticides threaten surface waters at the global scale. Proc. Natl. Acad. Sci. USA 2015, 112, 5750–5755. [Google Scholar] [CrossRef] [PubMed] [Green Version]
  3. Campbell, B.M.; Beare, D.J.; Bennett, E.M.; Hall-Spencer, J.M.; Ingram, J.S.I.; Jaramillo, F.; Ortiz, R.; Ramankutty, N.; Sayer, J.A.; Shindell, D. Agriculture production as a major driver of the Earth system exceeding planetary boundaries. Ecol. Soc. 2017, 22, 8. [Google Scholar] [CrossRef]
  4. Kremen, C.; Miles, A. Ecosystem services in biologically diversified versus conventional farming systems: Benefits, externalities, and trade-offs. Ecol. Soc. 2012, 17, 40. [Google Scholar] [CrossRef]
  5. Robinson, G.M. Globalization of Agriculture. Annu. Rev. Resour. Econ. 2018, 10, 133–160. [Google Scholar] [CrossRef]
  6. Kremen, C.; Iles, A.; Bacon, C. Diversified farming systems: An agroecological, systems-based alternative to modern industrial agriculture. Ecol. Soc. 2012, 17, 44. [Google Scholar] [CrossRef]
  7. Beillouin, D.; Ben-Ari, T.; Makowski, D. Evidence map of crop diversification strategies at the global scale. Environ. Res. Lett. 2019, 14, 123001. [Google Scholar] [CrossRef]
  8. Palomo-Campesino, S.; González, J.; García-Llorente, M.; Palomo-Campesino, S.; González, J.A.; García-Llorente, M. Exploring the Connections between Agroecological Practices and Ecosystem Services: A Systematic Literature Review. Sustainability 2018, 10, 4339. [Google Scholar] [CrossRef] [Green Version]
  9. Meynard, J.M.; Messéan, A.; Charlier, A.; Charrier, F.; Farès, M.; Le Bail, M.; Magrini, M.B.; Savini, I. Crop Diversification: Obstacles and Levers: Study of Farms and Supply Chains. Synopsis of the Study Reports; INRA: Paris, France, 2013; p. 8. [Google Scholar]
  10. Kleijn, D.; Bommarco, R.; Fijen, T.P.M.; Garibaldi, L.A.; Potts, S.G.; van der Putten, W.H. Ecological Intensification: Bridging the Gap between Science and Practice. Trends Ecol. Evol. 2019, 34, 154–166. [Google Scholar] [CrossRef] [Green Version]
  11. Iverson, A.L.; Marín, L.E.; Ennis, K.K.; Gonthier, D.J.; Connor-Barrie, B.T.; Remfert, J.L.; Cardinale, B.J.; Perfecto, I. REVIEW: Do Polycultures Promote Win-Wins or Trade-Offs in Agricultural Ecosystem Services? A Meta-Analysis. J. Appl. Ecol. 2014, 51, 1593–1602. [Google Scholar] [CrossRef]
  12. Lampridi, M.G.; Sørensen, C.G.; Bochtis, D. Agricultural Sustainability: A Review of Concepts and Methods. Sustainability 2019, 11, 5120. [Google Scholar] [CrossRef] [Green Version]
  13. Wustenberghs, H.; Coteur, I.; Debruyne, L.; Marchand, F. TempAg Pilot Activity 1.1.1: Survey of Sustainability Assessment; ILVO: Merelbeke, Belgium, 2015. [Google Scholar]
  14. Olsson, A.J.; Bockstaller, C.; Stapleton, L.; Knapen, R.; Therond, O.; Turpin, N.; Geniaux, G.; Bellon, S.; Pinto Correia, T.; Bezlepkina, I.; et al. Indicator frameworks supporting ex-ante impact assessment of new policies for rural systems; a critical review of a goal oriented framework and its indicators. Environ. Sci. Policy 2009, 12, 562–572. [Google Scholar] [CrossRef]
  15. Sala, S.; Ciuffo, B.; Nijkamp, P. A Systemic Framework for Sustainability Assessment. Ecol. Econ. 2015, 119, 314–325. [Google Scholar] [CrossRef]
  16. Van der Werf, H.M.G.; Knudsen, M.T.; Cederberg, C. Towards Better Representation of Organic Agriculture in Life Cycle Assessment. Nat. Sustain. 2016. [Google Scholar] [CrossRef]
  17. Bockstaller, C.; Guichard, L.; Makowski, D.; Aveline, A.; Girardin, P.; Plantureux, S. Agri-Environmental Indicators to Assess Cropping and Farming Systems. A Review. Agron. Sust. Dev. 2008, 28, 139–149. [Google Scholar] [CrossRef]
  18. Toffolini, Q.; Jeuffroy, M.H.; Prost, L. Indicators used by farmers to design agricultural systems: A survey. Agron. Sust. Dev. 2016, 36, 5. [Google Scholar] [CrossRef] [Green Version]
  19. Craheix, D.; Bergez, J.-E.; Angevin, F.; Bockstaller, C.; Bohanec, M.; Colomb, B.; Doré, T.; Fortino, G.; Guichard, L.; Pelzer, E.; et al. Guidelines to design models assessing agricultural sustainability, based upon feedbacks from the DEXi decision support system. Agron. Sust. Dev. 2015, 35, 1431–1447. [Google Scholar] [CrossRef] [Green Version]
  20. FAO. Sustainability Assessment of Food and Agriculture Systems (SAFA) Guidelines, Vers. 3; Food and Agricultural Organization (FAO): Rome, Italy, 2013. [Google Scholar]
  21. Bockstaller, C.; Feschet, P.; Angevin, F. Issues in evaluating sustainability of farming systems with indicators. Ol. Corps Gras Lipides 2015, 22. [Google Scholar] [CrossRef] [Green Version]
  22. Hudson, N. Field Measurement of Soil Erosion and Runoff; Food and Agriculture Organization of the United Nations: Rome, Italy, 1993; ISBN 9789251034064. [Google Scholar]
  23. Panagos, P.; Borrelli, P.; Meusburger, K.; Alewell, C.; Lugato, E.; Montanarella, L. Estimating the soil erosion cover-management factor at the European scale. Land Use Policy 2015, 48, 38–50. [Google Scholar] [CrossRef]
  24. Lindahl, A.M.L.; Bockstaller, C. An indicator of pesticide leaching risk to groundwater. Ecol. Indic. 2012, 23, 95–108. [Google Scholar] [CrossRef]
  25. Van der Werf, H.M.G.; Zimmer, C. An indicator of pesticide environmental impact based on a fuzzy expert system. Chemosphere 1998, 36, 2225–2249. [Google Scholar] [CrossRef]
  26. Villalobos, F.J.; Testi, L.; Mateos, L.; Fereres, E. The Energy Balance. In Principles of Agronomy for Sustainable Agriculture; Villalobos, F., Fereres, E., Eds.; Springer: Cham, Switzerland, 2016; pp. 79–90. [Google Scholar]
  27. Mead, R.; Willey, R.W. The concept of a Land Equivalent Ratio and advantages in yield from Inter-cropping. Exp. Agric. 1980, 16, 217–218. [Google Scholar] [CrossRef] [Green Version]
  28. Altieri, M.A. Agroecology: The science of natural resource management for poor farmers in marginal environments. Agricult. Ecosyst. Environ. 2002, 93, 1–24. [Google Scholar] [CrossRef]
  29. Craheix, D.; Angevin, F.; Bergez, J.E.; Bockstaller, C.; Colomb, B.; Guichard, L.; Reau, R.; Doré, T. MASC 2.0, un outil d’évaluation multicritère pour estimer la contribution des systèmes de culture au développement durable. Innovat. Agronom. 2011, 20, 35–48. [Google Scholar]
  30. Noss, R.F. Indicators for monitoring biodiversity: A hierarchical approach. Conserv. Biol. 1990, 4, 355–364. [Google Scholar] [CrossRef]
  31. Billeter, R.; Liira, J.; Bailey, D.; Bugter, R.; Arens, P.; Augenstein, I.; Aviron, S.; Baudry, J.; Bukacek, R.; Burel, F.; et al. Indicators for biodiversity in agricultural landscapes: A pan-European study. J. Appl. Ecol. 2008, 45, 141–150. [Google Scholar] [CrossRef]
  32. Magurran, A.E. Measuring Biological Diversity; John Wiley & Sons: Hoboken, NJ, USA, 2013. [Google Scholar]
  33. Köpke, U.; Nemecek, T. Ecological services of faba bean. Field Crops Res. 2010, 115, 217–233. [Google Scholar] [CrossRef]
  34. Boulay, A.M.; Bare, J.; Benini, L.; Berger, M.; Lathuillière, M.J.; Manzardo, A.; Margni, M.; Motoshita, M.; Núñez, M.; Pastor, A.V.; et al. The WULCA consensus characterization model for water scarcity footprints: Assessing impacts of water consumption based on available water remaining (AWARE). Int. J. LCA 2018, 23, 368–378. [Google Scholar] [CrossRef] [Green Version]
  35. Aveline, A.; Rousseau, M.L.; Guichard, L.; Laurent, M.; Bockstaller, C. Evaluating an environmental indicator: Case study of MERLIN, an assessment method of the Risk of Nitrate Leaching. Agric. Syst. 2009, 100, 22–30. [Google Scholar] [CrossRef]
  36. Buczko, U.; Kuchenbuch, R.O. Phosphorus indices as risk-Assessment tools in the USA and Europe—A review. J. Plant Nutr. Soil Sci. 2007, 170, 445–460. [Google Scholar] [CrossRef]
  37. Uthes, S.; Heyer, I.; Kaiser, A.; Zander, P.; Bockstaller, C.; Desjeux, Y.; Keszthelyi, S.; Kis-Csatári, E.; Molnar, A.; Wrzaszcz, W.; et al. Costs, quantity and toxicity: Comparison of pesticide indicators collected from FADN farms in four EU-countries. Ecol. Indic. 2019, 104, 695–703. [Google Scholar] [CrossRef]
  38. Bossel, H. Assessing viability and sustainability: A systems-based approach for deriving comprehensive indicator sets. Conserv. Ecol. 2001, 5, 12. [Google Scholar] [CrossRef]
  39. Girardin, P.; Bockstaller, C.; Van der Werf, H. Assessment of potential impacts of agricultural practices on the environment: The AGRO*ECO method. Environ. Impact Assess. Rev. 2000, 20, 227–239. [Google Scholar] [CrossRef]
  40. Peeters, A.; Van Bol, V. Ecofarm: A research/development method for the implementation of a sustainable agriculture. In Methods and Tools of Extension for Mountain Farms; Peeters, A., Ed.; REU Technical Series; FAO: Rome, Italy, 2000; Volume 57, pp. 41–56. [Google Scholar]
  41. Van Cauwenbergh, N.; Biala, K.; Bielders, C.; Brouckaert, V.; Franchois, L.; Garcia Cidad, V.; Hermy, M.; Mathijs, E.; Muys, B.; Reijnders, J.; et al. SAFE-A hierarchical framework for assessing the sustainability of agricultural systems. Agric. Ecosyst. Environ. 2007, 120, 229–242. [Google Scholar] [CrossRef]
  42. Sabourin, G. Etablissement d’une Liste Minimale d’Indicateurs pour l’Évaluation de la Durabilité des Systèmes de Grandes Cultures. Bachelor’s Thesis, Université de Lorraine, Nancy, France, 2017. [Google Scholar]
  43. German, R.N.; Thompson, C.E.; Benton, T.G. Relationships among multiple aspects of agriculture’s environmental impact and productivity: A meta-Analysis to guide sustainable agriculture. Biol. Rev. 2017, 92, 716–738. [Google Scholar] [CrossRef] [PubMed]
  44. Arushanyan, Y.; Ekener, E.; Moberg, Å. Sustainability assessment framework for scenarios–SAFS. Environ. Impact Assess. Rev. 2017, 63, 23–34. [Google Scholar] [CrossRef]
  45. Lang, D.J.; Wiek, A.; Bergmann, M.; Stauffacher, M.; Martens, P.; Moll, P.; Swilling, M.; Thomas, C.J. Transdisciplinary research in sustainability science: Practice, principles, and challenges. Sustain. Sci. 2012, 7, 25–43. [Google Scholar] [CrossRef]
  46. Triste, L.; Marchand, F.; Debruyne, L.; Meul, M.; Lauwers, L. Reflection on the development process of a sustainability assessment tool: Learning from a Flemish case the MOTIFS case. Ecol. Soc. 2014, 19, 47. [Google Scholar] [CrossRef] [Green Version]
  47. DeMey, K.; Haene, K.D.; Marchand, F.; Meul, M.; Lauwers, L. Learning through stakeholder involvement in the implementation of MOTIFS: An integrated assessment model for sustainable farming in Flanders. Int. J. Agric. Sustain. 2011, 9, 350–363. [Google Scholar] [CrossRef]
  48. Noll, H.H. Subjective social indicators: Benefits and limitations for policy making—An introduction to this special issue. Soc. Indicat. Res. 2013, 114, 1–11. [Google Scholar] [CrossRef] [Green Version]
  49. Barbier, C.; Cerf, M.; Lusson, J.M. Cours de vie d’agriculteurs allant vers l’économie en intrants: Les plaisirs associés aux changements de pratiques. Activités 2015, 12. [Google Scholar] [CrossRef] [Green Version]
  50. Coteur, I.; Marchand, F.; Debruyne, L.; Dalemans, F.; Lauwers, L. A framework for guiding sustainability assessment and on-farm strategic decision making. Environ. Impact Assess. Rev. 2016, 60, 16–23. [Google Scholar] [CrossRef]
  51. Struik, P.C.; Amaducci, S.; Bullard, M.J.; Stutterheim, N.C.; Venturi, G.; Cromack, H.T.H. Agronomy of fibre hemp (Cannabis sativa L.) in Europe. Ind. Crops Prod. 2000, 11, 107–118. [Google Scholar] [CrossRef]
  52. Sipos, B.; Kreuger, E.; Svensson, S.E.; Reczey, K.; Bjornsson, L.; Zacchi, G. Steam pretreatment of dry and ensiled industrial hemp for ethanol production. Biomass Bioenergy 2010, 34, 1721–1731. [Google Scholar] [CrossRef] [Green Version]
  53. Tonitto, C.; David, M.B.; Drinkwater, L.E. Replacing bare fallows with cover crops in fertilizer-intensive cropping systems: A meta-analysis of crop yield and N dynamics. Agric. Ecosyst. Environ. 2006, 112, 58–72. [Google Scholar] [CrossRef]
  54. Teixeira, E.; Johnstone, P.; Chakwizira, E.; De Ruiter, J.; Malcolm, B.; Shaw, N.; Zyskowski, R.; Khaembah, E.; Sharp, J.; Meenken, E.; et al. Sources of variability in the effectiveness of winter cover crops for mitigating N leaching. Agric. Ecosyst. Environ. 2016, 220, 226–235. [Google Scholar] [CrossRef]
  55. Hill, S.B.; MacRae, R.J. Conceptual frameworks for the transition from conventional to sustainable agriculture. J. Sust. Agric. 1995, 7, 81–87. [Google Scholar] [CrossRef]
  56. Gliessman, S.R. Agroecology: The Ecology of Sustainable Food Systems, 3rd ed.; CRC Press/Taylor and Francis Group: Boca Raton, FL, USA, 2015. [Google Scholar]
  57. European Commission. Communication—A Farm to Fork Strategy for a Fair, Healthy and Environmentally-Friendly Food System; COM: Brussels, Belgium, 2020; p. 381. [Google Scholar]
  58. Bockstaller, C.; Guichard, L.; Keichinger, O.; Girardin, P.; Galan, M.B.; Gaillard, G. Comparison of methods to assess the sustainability of agricultural systems. A review. Agron. Sustain. Dev. 2009, 29, 223–235. [Google Scholar] [CrossRef] [Green Version]
Figure 1. Radar graph of the sustainability assessment of CS PL (FR). The dimensions (EN: environment, EC: economic, SOC: social) and criteria are given in small, and the indicator abbreviation is given between arrows. LER and YCV indicators are not included in the assessment, as their computation is not applicable in this CS. The performances of the diversified system ‘After 2016’ (blue line) are reported as percentage changes with respect to the reference system (the dashed black line). In the table, the numbers of positive (pos. > +5%), negative (neg. < + 5%) and absence of (−5% ≤ nc ≤ + 5%) changes obtained by the diversified system are reported for the economic (EC), environmental (EN) and social (SOC) pillars of sustainability.
Sustainability 12 05434 g001
Figure 2. Radar graph of the sustainability assessment of CS LS (DE). The dimensions (EN: environment, EC: economic, SOC: social) and criteria are given in small, and the indicator abbreviation is given between arrows. LER and YCV indicators are not included in the assessment, as their computation is not applicable in this CS. The performances of the Planned diversified system (blue line) are reported as percentage changes with respect to the reference system (dashed black line). In the table, the numbers of positive (pos. > + 5%), negative (neg. < + 5%) and absence of (−5% ≤ nc ≤ + 5%) changes obtained by the diversified system are reported for the economic (EC), environmental (EN) and social (SOC) pillars of sustainability.
Sustainability 12 05434 g002
Figure 3. Radar graph of the sustainability assessment of CS SI (IT). The dimensions (EN: environment, EC: economic, SOC: social) and criteria are given in small, and the indicator abbreviation is given between arrows. LER and YCV indicators are not included in the assessment, as their computation is not applicable in this CS. The performances of the ex-post diversified ‘Wheat–hemp system’ (blue line) and of the diversified ex-ante ‘Sulla clover scenario’ (dashed red line) are reported as percentage changes with respect to the reference system (dashed black line). In the table, the numbers of positive (pos. > +5%), negative (neg. < +5%) and absence of (−5% ≤ nc ≤ +5%) changes obtained by both diversified systems are reported for the economic (EC), environmental (EN) and social (SOC) pillars of sustainability.
Sustainability 12 05434 g003
Table 1. The assessment framework of indicators. The identified criteria are matched with the relative SAFA (Sustainability Assessment of Food and Agriculture systems) themes/sub-themes. The formula, inputs and outputs for each indicator are reported in the last column. For all indicators (when not diversely specified): S = total considered area (field, fields group or farm surface); n = length of the cropping system or number of the years taken into account (years).
SAFA Themes/Sub-ThemesCriteriaIndicators
Economic Dimension
Investment/Profitability1. Productivity (Prod)1.1 Energy yield (EY)   EY =   t = 1 n     i = 1 c Y t i K t i S t i     n S
Yti = Yield (kg/ha d.m.) of crop i in year t; Kti = energy content (MJ/kg) in crop i in year t; Sti = area (ha) where crop i is cropped in year t; c = number of crops per year (considering all assessed fields)
1.2 Land Equivalent Ratio (LER)    LER =     t = 1 n i = 1 c ( i n t e r t i / p u r e t i )   S t i           n S
interti = intercrop yield of the crop i (kg/ha d.m.) in year t; pureti = yield of the crop i in pure stand (kg/ha d.m.) in year t; Sti = area (ha) where crop i is cropped in the year t; c = number of crops per year (considering all assessed fields)
If two successive crops are in the same year in the same field, the indicator calculates first their mean values
Vulnerability/Stability of Production2.Stability of production (Stab)2.1 Yield Coefficient of Variation (YCV)    YCV =   i = 1 c C V i S i c S
CVi = coefficient of variation (standard deviation/mean) of the yield (t/ha) of crop i. The yield data (at least three values) for each crop must be referred to different harvested years; Si = area (ha) where crop i is cropped; c = number of assessed crops
Investment/Profitability3. Profitability (Prof) 3.1 Average gross margin at rotation level (RGM)   RGM =   t = 1 n i = 1 c ( P B t i O C t i ) S t i     n S
PBti = harvest yield of crop i (kg/ha d.m.) X market price (€/kg) in year t; OCti = Operational charges (€/ha) linked to inputs of seed, fertilizers, pesticides, work, irrigation for crop i in year t; Sti = area (ha) where crop i is cropped in year t; c = number of crops per year (considering all assessed fields)
Vulnerability/Risk Management4. Dependency on external inputs (Dep) 4.1 Total input/turnover (DEI)    DEI = t = 1 n i = 1 c O C t i   S t i / P B t i n S
PBti = harvest yield of crop i (kg/ha d.m.) X market price (€/kg) in year t; OCti = Operational charges (€/ha) linked to inputs of seed, fertilizers, pesticides, work, irrigation for crop i in year t; Sti = area (ha) where crop i is cropped in year t; c = number of crops per year (considering all assessed fields)
Investment/Profitability; Product Quality and Information/Food Quality5. Product quality (ProdQ)5.1 Product standard quality required by the sector/market (PSQ)   PSQ = i   =   1 c Q i c
Qi = Quality the crop i (0—Low quality and no possibility of sale; 1—Low quality but the crop can be sold to other markets or at a lower price; 2—Requested quality achieved); c = number of the crops
Investment/Profitability6. Local valorisation (LocVal)6.1 Proportion of short food supply chain and local distribution (PSC)   PSC = 100 − (LS + NM)
LS = % of products (kg) from the assessed cropping systems sold to large scale distribution for export; NM = % of products (kg) from the assessed cropping systems sold for national market
6.2 Supplier/customer contribution to profitability (SCCPsuppl and SCCPcust)   SCCP = (SC obtained for I Statement + SC obtained for II Statement)/2
SC = Seven-point Likert scale: 1 = completely disagree; 2 = moderately disagree; 3 = slightly unimportant; 4 = neither agree nor disagree; 5 = slightly agree; 6 = moderately agree; 7 = completely agree; I Statement: ‘Our business relationship with our suppliers or customers significantly contributes to our profitability’; II Statement: ‘Our business relationship with our suppliers or customers is very attractive because of getting fair prices’
Environmental Dimension
Biodiversity/Ecosystem Diversity 7. Ecosystem/landscape Diversity (EcosDiv)7.1 (8.1) Crop Diversity Index (CDI)   CDI = 1 i = 1 c p i 2
pi = area occupied by the crop i in the total assessed cropped area; c = number of crops
7.2% Semi Natural Habitat (%SNH)   %SNH = 100 A S N H   A a a
ASNH = total area of the semi-natural agricultural habitats (ha); Aaa = total agricultural area (ha)
Biodiversity/Species Diversity8. Crop diversification (CropDiv)8.1 (7.1) Crop Diversity Index (CDI)see 7.1
8.2% Legume in rotation (LEG)   LEG =   100   t = 1 n i = 1 l A L t i   t = 1 n i = 1 c A C t i
ALti = area (ha) covered by legume crop i (considering both cash and cover crops) in year t; ACti = area (ha) covered by the crop i in year t; l = number of the legume crop per year (considering all assessed fields); c = number of crops per year (considering all assessed fields)
Biodiversity/Genetic Diversity9. Genetic diversification (GenDiv)9.1 Crop-cultivar diversity (CCD)   CCD = C N C S
CN = number of crop cultivars and/or heterogeneous genetic materials in the assessed cropping systems; CS = number of crop species present in the assessed cropping systems
9.2 Number of crop in the rotation with cultivar mixture (CCM)   CCM = C M C T
CM = number of crops with mixed cultivars in the assessed cropping systems; CT = number of the crops in the assessed cropping systems
Land/Land Degradation10. Soil degradation (compaction, erosion) (SoilDeg)10.1 Proportion of crops harvested in wet conditions (NWHC)   NWHC = 100   t = 1 n i = 1 w W H S t i   t = 1 n i = 1 c S H t i
WHSti = area (ha) where crop i is harvested in wet conditions in year t; SHti = area (ha) covered by the harvested crop i in year t; w = number of the crops harvested in wet conditions per year (considering all assessed fields); c = number of the harvested crops per year (considering all assessed fields)
10.2 Bare soil during erosion risk (intensive rainfall) period (BSOeros)    BSOeros = 100 t = 1 n i = 1 m S t i   C   t i n S
The computation is performed only if the area presents potential run-off or erosion problems. m = number of main crops per year (considering all assessed fields); Sti = area (ha) of the main crop i in year t; Cti = management factor of the area i in year t = Cfactor from USLE [22] X C-tillage X Ccovercrop X Cintercropping
Cfactor, C-Tillage and Ccovercrop are derived from Paganos et al. [23]; Cintercropping = 0.9 to be applied to the main crop if it is intercropped
Land/Soil Quality11.Soil quality (SoilQ) 11.1 (16.4) Carbon input during the rotation (ACI)    ACI =   t = 1 n i = 1 c j = 1 m C t i j F t i j Isohu m t i j S t i j n S
Cti = amount of the component j (i.e., crop residues, crop roots and extra roots, manure, slurry, etc.) (t/ha) for the considered crop i in year t; Fti = Fraction of the carbon of component i for the considered crop i in year t; Isohumi = Isohumic coefficient of component i for the considered crop i in year t; Stij = area (ha) where the component i for the considered crop i is provided to the soil in year t; m = number of the components provided to the soil per crop; c = number of crops per year (considering all assessed fields)
Fresh water/Water withdrawal12. Water withdrawal (WatWit)12.1 Pressure on local water resources (PLWR)   PLWR = t = 1 n i = 1 c j = 1 m I c t i j C F m j S t i j   n S
Ictij = Water used for irrigation in month j on crop i (m3/ha) in year t; CFmj = characterization factor for month j (m3/m3); Stij = area (ha) where the water in month j is provided to crop i in year t; m = number of months; c = number of crops per year (considering all assessed fields)
Fresh water/Water Quality13. Water quality (nutrient) (WatQualNut)13.1 Surface nutrient balances (Nitrogen-NBAL and Phosphorus-PBAL)   N and PBAL = t = 1 n i = 1 c ( j = 1 m i n p u t t i j k = 1 f o u t p u t t i k ) S t i n S  
inputtij: amount of input j X nutrient content in input (kg N or P2O5/ha) removed during the cycle of crop i in year t; outputtik: amount of output k X nutrient content in output (kg N or P2O5/ha) provided during the cycle of crop i in year t; Sti = area (ha) where crop i is cropped in year t; c = number of crops per year (considering all assessed fields); m = number of inputs per crop; f = number of outputs per crop
13.2 (10.2) Bare soil during drainage periods (BSOleach)   BSOleach = 100 t = 1 n i = 1 m S t i   C   t i n S  
m = number of main crops per year (considering all assessed fields); Sti = area (ha) of the main crop i in year t; Cti = management factor of the area i in year t = C X Correction factor
where C derived from FLINT project: C = 0 if alfalfa, temporary grassland; C = 0.25 if winter rapeseed; C = 0.75 if other winter crop, artichoke; C = 1 if spring crop, bare soil; if the main crop is in intercropping, the identify C has to be reduced by 0.10
Correction factors to use if the main crop is preceded by a cover/catch crop: 0.30 if long (more than 2 months) catch crop; 0.70 if short (less or equal than 2 months) catch crop; 0.40 if long legume cover crop; 0.80 if short legume cover crop; 0.35 if long mix cover crops (legume + others); 0.75 if short mix cover crops (legume + others);
Fresh water/Water Quality14. Water quality (pesticide) (WatQualPes) 14.1 Leaching risk of active ingredient (LeachAI)   LeachAI = t = 1 n i = 1 c j = 1 m f ( Q A I t i j     L R t i j ) S   t i j n S
f() = aggregation function of risk and amount of active ingredient derived from Lindahl and Bockstaller [24]; QAItij = Amount of sprayed active ingredient j (g/ha) on crop i in year t = VAItik X CAItijk where VAItik = volume of sprayed pesticide k (commercial product) on crop i in year t and CAItijk = concentration of active ingredient j in pesticide k sprayed on crop i in year t; LRtij = Risk factor of leaching for the active ingredient j on crop i (between 0 and 1) in year t calculated with help of the groundwater component of the I-Phy2 indicator [25] for standard conditions; Stij = area (ha) where the active ingredient j is applied on crop i in year t; m = number of active ingredients per crop; c = number of crops per year (considering all assessed fields)
14.2 (15.2) Amount of active ingredients (QAI)    QAI = t = 1 n i = 1 c j = 1 m Q A I t i j   S   t i j n S
QAItij = amount of sprayed active ingredient j (g/ha) on crop i in year t = VAItik X CAItijk where VAItik = volume of sprayed pesticide k (commercial product) on crop i in year t and CAItijk = concentration of active ingredient j in pesticide k sprayed on crop i in year t; Stij = area (ha) where the active ingredient j is applied on crop i in year t; m = number of active ingredients per crop; c = number of crops per year (considering all assessed fields)
Atmosphere/Air Quality15. Air quality (AirQual)15.1 Volatilization risk of active ingredients (VolAI)     VolAI = t = 1 n i = 1 c j = 1 m f ( Q A I t i j     V R t i j ) S   t i j n S
f() = aggregation function of risk and amount of active ingredient derived from Lindahl and Bockstaller [24]; QAItij = Amount of sprayed active ingredient j (g/ha) on crop i in year t = VAItik X CAItijk where VAItik = volume of sprayed pesticide k (commercial product) on crop i in year t and CAItijk = concentration of active ingredient j in pesticide k sprayed on crop i in year t; VRtij = Risk factor of volatilisation for the active ingredient j on crop i (between 0 and 1) in year t calculated with help of the groundwater component of the I-Phy2 indicator [25] for standard conditions; Stij = area (ha) where the active ingredient j is applied on crop i in year t; m = number of active ingredients per crop; c = number of crops per year (considering all assessed fields)
15.2 (14.2) Amount of active ingredients (QAI)see 14.2
Atmosphere/Greenhouse gases16. GHG balance (GHGB)16.1 Mineral Nitrogen Use for GHG balance calculation (MNUGHG)   MNUGHG = t = 1 n i = 1 c j = 1 m N m i n t i j   G W P F j   S   t i j   n S
Nmintij = total mineral (= synthetic) nitrogen applied on crop i, in the form of fertilizer j (kg N/ha) in year t; GWPFj = global warming potential for fertilizer j production (kg CO2eq./kg N); Stij = area (ha) where the mineral nitrogen fertilizer j is applied on crop i in year t; m = number of mineral nitrogen fertilizers per crop; c = number of crops per year (considering all assessed fields)
16.2 Nitrogen Use (NU)    NU = t = 1 n i = 1 c N t i     S   t i   n S
Nti = amount of mineral + organic nitrogen (kg N/ha) applied on crop i in year t; Sti = area (ha) where crop i is cropped in year t; c = number of crops per year (considering all assessed fields)
16.3 Total fuel consumption for global warming potential calculation (FCFGHG)   FCFGHG = t = 1 n i = 1 c j = 1 m C F U t i j   ( G W P P j + G W P E j )   S   t i j   n S
CFUtij = total consumption of fuel j(kg/ha) for the crop i in year t; GWPPj = global warming potential for fuel j production (kg CO2eq./kg fuel j); GWPEj = global warming potential from fuel j combustion (kg CO2eq./kg fuel j); Stij = area (ha) where crop i is cropped in year t; m = number of fuel types per crop; c = number of crops per year (considering all assessed fields)
16.4 (11.1) C input during the rotation (ACI)see 11.1
Materials and Energy/Energy use and Material use17. Non-renewable resources (NRRes)17.1 Total fuel consumption for fossil energy use calculation (FCFNRJ)   FCFNRJ = t = 1 n i = 1 c j = 1 m C F t i j   F E D j   S   t i j   n S .
CFtij = total consumption of fuel j (kg/ha) for the crop i in year t; FEDj = fossil energy demand for fuel j production (MJ/kg); Stij = area (ha) where crop i is cropped in year t; m = number of fuel types per crop; c = number of crops per year (considering all assessed fields)
17.2 Mineral Nitrogen Use for fossil energy use calculation (MNUNRJ)    MNU NRJ = t = 1 n i = 1 c j = 1 m N m i n t i j   F E D j   S   t i j   n S
Nmintij = total mineral (=synthetic) nitrogen applied on crop i, in the form of fertilizer j (kg N/ha) in year t; FEDFj = fossil energy demand for fertilizer j production (MJ/kgN); Stij = area (ha) where the mineral nitrogen fertilizer j is applied on crop i in year t; m = number of mineral nitrogen fertilizers per crop; c = number of crops per year (considering all assessed fields)
17.3 Mineral Phosphorus use (MPU)    MPU = t = 1 n i = 1 c P m i n t i     S   t i   n S
Pminti = Total mineral (=synthetic) P applied on crop i (kg P/ha) in year t; Sti = area (ha) where crop i is cropped in year t; c = number of crops per year (considering all assessed fields)
Social Dimension
Human Safety and Health/Public Health18. Farmer and public health (Health) 18.1 Treatment frequency index (TFI)    TFI = t = 1 n i = 1 c j = 1 k A D t i j   D H j     S   t i j   n S
ADtij = applied dose of the pesticide j (accounting for insecticides, fungicides, herbicides, acaricides and other plant production) applied on crop i in year t; DHj = registered dose of the pesticide j; Stij = area (ha) where the pesticide j is applied on crop i in year t; k = number of pesticides per crop; c = number of crops per year (considering all assessed fields)If two successive crops or mixtures are in the same year in the same field, the indicator calculates first their mean values
Decent Livelihood/Quality of Life19. Farmers’ quality of life (LifeQual)19.1 Work overload (WOL)   WOL = 100 t n i m W O L t i S t i / 12 n S
WOLti: work overload for month i in year t expressed on a scale between 0 (low) and 3 (very high); Sti = area (ha) where the work for month i is applied in year t; m = number of months

