“Desigrated”-Desiccant Integrated Façade for the Hot-Humid Climate of Bangkok, Thailand


1
Urbanism and Building Sciences, Building Technology, Department of Architectural Engineering and Technology, Faculty of Architecture and the Built Environment, Delft University of Technology, 2628 Delft, The Netherlands
2
Architectural Facades & Products Research Group, Department of Architectural Engineering and Technology, Faculty of Architecture and the Built Environment, Delft University of Technology, 2628 Delft, The Netherlands
3
Department of Architectural Engineering and Technology, Faculty of Architecture and the Built Environment, Delft University of Technology, 2628 Delft, The Netherlands
*
Author to whom correspondence should be addressed.
Sustainability 2020, 12(13), 5490; https://0-doi-org.brum.beds.ac.uk/10.3390/su12135490
Submission received: 23 April 2020
/
Revised: 29 June 2020
/
Accepted: 2 July 2020
/
Published: 7 July 2020
(This article belongs to the Section Sustainable Engineering and Science)
Abstract
:“Desigrated” presented an attempt to integrate heat prevention strategies with low-ex cooling technologies, namely the desiccant and M-cycle evaporative cooling technology, in the form of a façade system for high-rise office buildings. The project targets to provide an alternative cooling solution for the hot and humid climate context of Bangkok. The results from experiments by various researchers are used as assumptions in developing the system, which was then evaluated through numerical methods and dynamic simulations. Being one of the prominent dehumidification technologies, a composite silica gel heat exchanger (CCHE) was implemented as the primary part of the façade system, while the M-cycle technology would also be implemented as a secondary cooling technique to cool down the supply air. The evaluation shows a promising result with up to 36% energy consumption reduction in comparison with the conventional cooling system, presenting itself as a transitioning tool in order to replace refrigerant cooling.
Keywords:
façade; building services; cooling; solar cooling; low-exergy; desiccants; evaporative cooling; heat exchanger; hot-humid; Bangkok1. Introduction
Global warming is an undeniable fact. Among the many effects it is having on our planet, we can count warming oceans, shrinking ice sheets, glacial retreats, decreased snow cover, sea level rise, declining Arctic sea ice, ocean acidification, and the most tangible one, temperature increase. According to NASA’s research, the planet’s average surface temperature has risen by approximately 0.9 °C since the 19th century, while 17 out of the 18 warmest years in the 136-year record have occurred since 2001 [1].
In parallel to the rising temperature, the use of energy for space cooling has been tripled during the last twenty years: the rising demand has driven up carbon emission by three times since 1990. The growing demand is essentially influenced by the high temperature as well as economic and population growth. Due to the limited effect of government policies throughout the world, it is expected that the current trend of cooling demand will continue growing in the following years [2]. This situation provokes a dilemma, where the use of active cooling further contributes to global warming (due to the emissions from both the energy usage and the refrigerants required in the cooling cycle), which in turn increases the cooling demands, hence increasing the need for active cooling.
In this regard, there is wide consensus on the application of passive cooling strategies as the first step for the design of sustainable buildings, under a climate-responsive approach [3,4]. Nonetheless, under increasing global temperatures, these strategies will not be enough, thus supplementary mechanical systems will be required, particularly in severe warm climate contexts such as desertic or tropical environments.
Current research in the field has been exploring alternative cooling technologies to the commonly used vapor compression cycle, aiming to increase their efficiency while using environmentally friendly materials and cooling processes [5,6]. At the same time, the application of these technologies in the built environment has been increasingly researched, resulting in the identification of possibilities for their integration in building components and several concepts and working prototypes [7,8,9,10].
This paper depicts the design and numerical evaluation of a novel desiccant cooling unit integrated into a prefabricated façade element, for application on tropical areas. The “Desigrated” project aimed to integrate heat prevention strategies with low-ex cooling technologies, namely the desiccant and M-cycle evaporative cooling technology, in the form of a façade system for high-rise office buildings in hot and humid climates. As it incorporated PVT panels as shading devices, the façade system is able to generate renewable energy for system operation while allowing a fresh air supply into the office space.
Tropical Context: The case of Bangkok
Bangkok is Thailand’s largest and most important city. It is the capital city both in terms of governance and commerce, housing over one-third of Thailand’s banks as well as the stock exchange. Over the last four decades, Thailand has made exceptional progress in social and economic development. After a long slow average growth, Thailand’s economic growth is increasing its pace. Its economic growth reached 4.8% in the first quarter of 2018, the highest pace since 2013. Economic growth is reflected in the substantial growth of office buildings. Collier International Thailand has reported a growing demand for office spaces in Bangkok due to limited supply and government policy to attract foreign investment. Currently, the office supply in Bangkok is at 8,618,862 sq.m, and it is predicted to increase by 662,676 sq.m within 2019–2022 [11].
Bangkok’s hot and humid climate context, as well as it’s growing population and economy, have imposed a pressing challenge in energy consumption, as cooling demands account for about 50% of the total electricity usage in office buildings [2]. According to the Eco-Business report, without new cooling technologies or strategies, air conditioning alone would be accounted for 40% of South East Asia’s electricity demand [12].
As a result of the growing demand for office spaces, several new office buildings will be built in the coming years. Throughout the past decades, Bangkok’s skyscrapers adopted an international façade typology which reflected a predominantly glass-and-steel aesthetic from modern architecture. However, these fully glazed buildings failed to adapt themselves to the context, both physically and culturally, but most importantly, environmentally [13]. With the high temperatures, humidity, and solar radiation of Bangkok, the glazed façade had shown characteristic poor performance, resulting in high space cooling demands.
To tackle this issue, a desiccant integrated façade system has been proposed. Due to its efficient control over humidity and low energy consumption, the desiccant cooling system has presented itself as a favorable alternative to conventional vapor compression air conditioning systems. With recent developments, the system could be coupled or integrated with other means of cooling technologies to increase its efficiency. Additionally, due to abundant solar radiation in Bangkok, the usage of solar energy harvesting technologies could be integrated as a thermal source for the regeneration process while serving as a part of the heat prevention strategy.
2. Materials and Methods
As a starting point, an extensive comparative review between desiccant technologies, cooling systems, and regeneration method was performed to define the suitable components and configuration of the integrated facade system. Being one of the most prominent dehumidification technologies, a composite silica gel heat exchanger (CCHE) was implemented as the primary part of the façade system, based on the experimental results from Ge et al. [14]. At the same time, an M-cycle evaporative cooling system, based on Riangvilaikul and Kumar’s experiment [15], was implemented as a secondary cooling technique to cool down the supply air via indirect evaporative cooling. The constraints derived from the data were used for sizing and system configuration. Furthermore, as a means to evaluate the proposed system, the evaluation process was conducted in two stages, namely energy efficiency assessment and solar autonomy assessment.
2.1. System Constraints
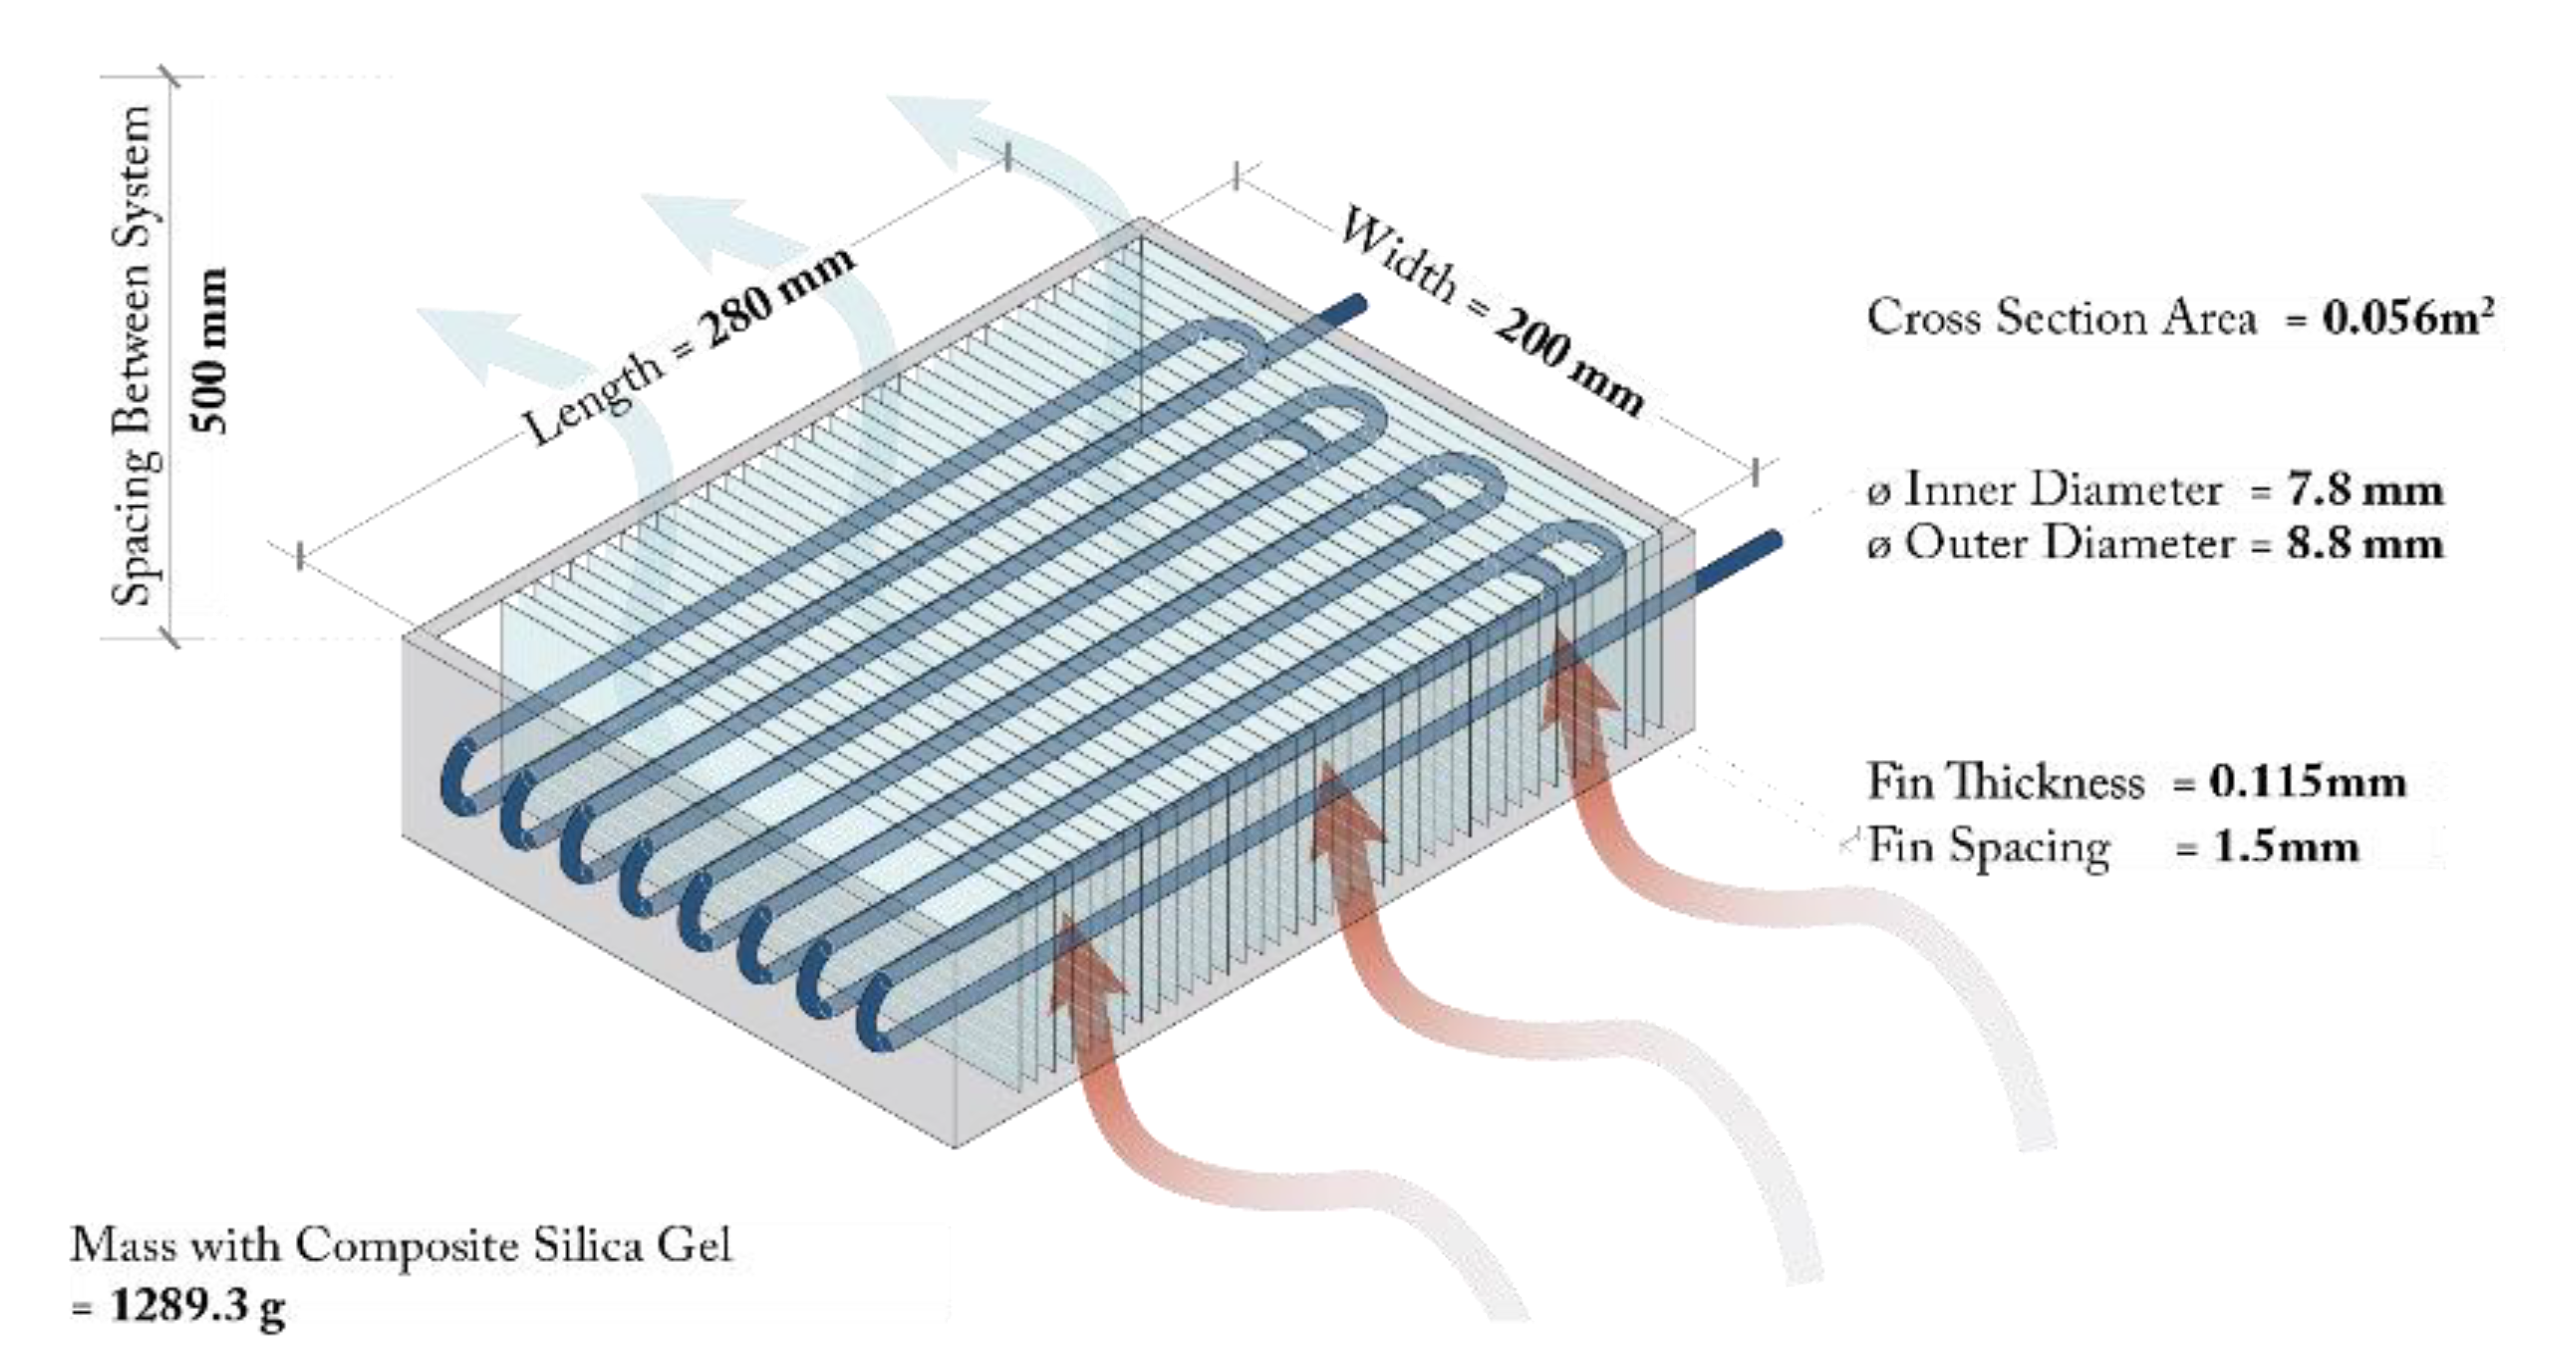
The composite silica gel heat exchanger (CCHE) works as a primary component of the system to dehumidify the ambient air condition, reducing the latent load the cooling system needs to process. The CCHE configuration used in this project was based on an experiment conducted by Ge et al. [14] depicted in Figure 1. The system constraints in Table 1 are referenced to the results based on an inlet air condition at 30 °C|70% RH, which is closest to Bangkok’s average ambient temperature of 28 °C|70%RH. Based on this assumption, the system is expected to perform under a cooling capacity of 1.25 kW and a dehumidification rate of 3.9 g/kg.
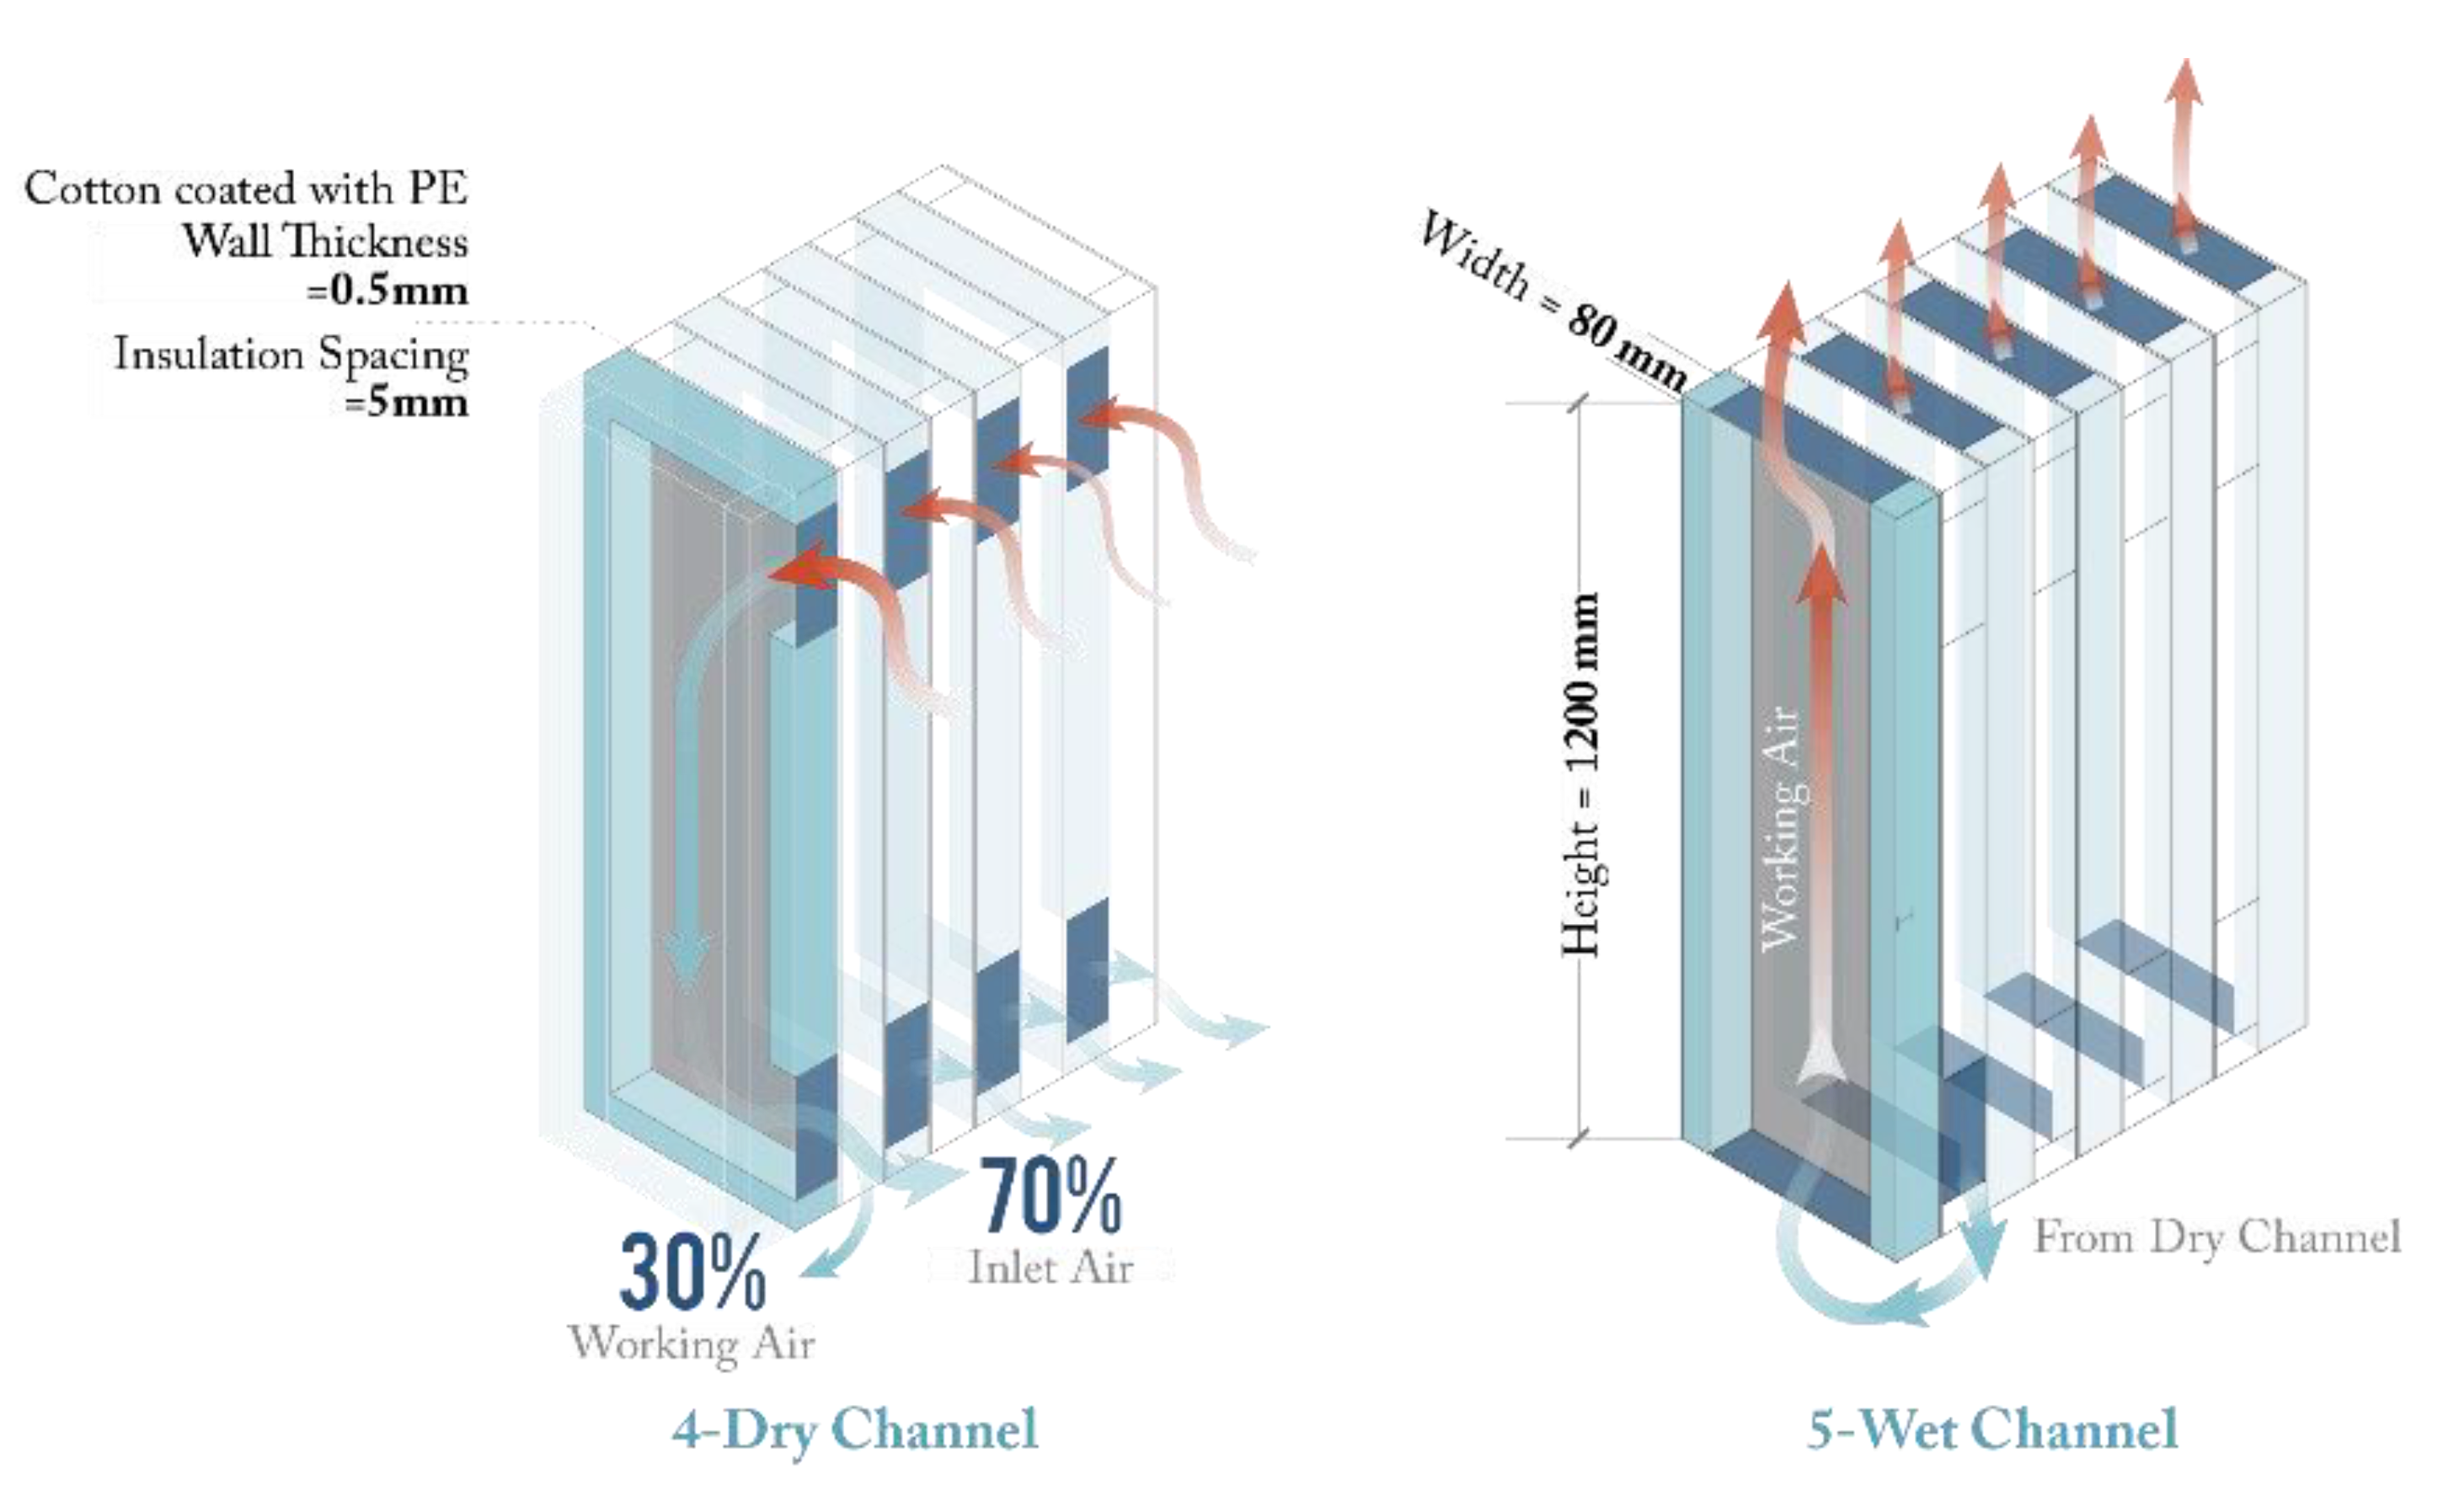
The M-cycle system served as a secondary element to cool down the air after it was dehumidified by the CCHEs. The dry air would enter through the dry channel counterflowing the water flow in the wet channel. The configuration would allow high heat and mass transfer for both the streams of air and water. However, it also requires 30% of the outlet air to serve as the working air in the cooling process. The system’s schematic design and its performance were based on a dynamic study conducted under the actual ambient condition of Bangkok by Riangvilaikul and Kumar depicted in Figure 2. According to the literature, the system can provide wet bulb effectiveness of 101–104% and a dew point effectiveness of 75–79% [15].
2.2. Energy Efficiency Assessment
2.2.1. Benchmark
To assess the performance of the proposed system, the evaluation was based on a comparative assessment in relation to a benchmark. The benchmark was established by collecting data of the energy performance of an existing building with a high window-to-wall ratio (WWR). Therefore, the 19th floor of the Krung Thai Bank (KTB)-Sukhumvit building (Figure 3) was selected as the case building for the system application and further evaluation. The building is located at No. 10 Sukhumvit Road, one of the major business arteries of Bangkok.
The KTB-Sukhumvit building opened its doors in 2005. It functions as a high-rise office serving its purpose as the headquarters for Krung Thai Bank. With its highly glazed façade and rectilinear form, the building’s style and appearance reflect the modernist design approach, resembling the typical high-rise typology on Bangkok’s skyline. The high-rise stands at 114m, consisting of 30 levels with two additional rooftop levels, and two basement levels. It has a total coverage area of 38,857 m2, in which 27,371 m2 serves as usable area and 11,486 m2 serves as parking space. Out of the usable area, 25,278 m2 (92%) works with an air conditioning system. The building operates 8 h per day, accounting 246 days per year.
2.2.2. Air Supply Simulation Parameters
Design Builder version 5.0.3.007 from Design Builder Software Ltd., a comprehensive graphical interface for Energy Plus and a validated simulation software in the field of building energy simulation was used as the main simulation tool. It was used to simulate the design cooling load and design flowrate requirements of the floor area. The results were used in further calculations to compare the performance of the proposed system to the existing benchmark which centered around the efficiency of the system regarding energy consumption and thermal comfort. The results of the design flow rate were then used in determining the systems requirements for space cooling.
The parameters used in the simulation are listed in Table 2. The occupancy rate is set at 0.11 people per m2 (approximately 70 people) while the cooling setpoint temperature is set at 25.5 °C. Two simulations were conducted to compare the results of the conventional A/C system and the “Desigrated” system. With the conventional A/C system, the supply air temperature is set at 12.0 °C with a 0.0077 g/g humidity ratio, while the set point temperature is configured at 25.5 °C. Furthermore, the air change rate is fixed at 1.75 ach which is equivalent to the minimum mechanical ventilation requirement from the Thai Ministerial Regulation No. 39 [16]. It should also be noted that the dehumidification control was set to constant humidity ratio while the cooling limit type was set as limit flowrate/capacity. The benchmark building’s facade was simplified and modelled with the parameters shown in Table 3, while the parameters used in the proposed system are presented in Table 4.
The simulation of the benchmark building showed a cooling design capacity of 134 kW with a 6.51 m3/s flow rate. These results were then validated by comparing them against the actual design values of the building’s cooling system (based on the as-built drawings and project data), showing a difference of approximately 10% below the actual design value. This difference may be explained by extra safety factors being considered by the engineering team, for sizing the systems in place. It was not possible to corroborate the simulated annual cooling demands against real operation data, due to the lack of access to that information; however, the comparison of the cooling capacities was deemed sufficient as a basis for the simulation through Energy Plus, a robust tool to assess building energy performance.
2.2.3. Desiccant System Performance Assessment
Further investigation was conducted to elaborate the extent of the desiccant system performance based on the variation in the ambient conditions to be processed into supply air by means of Equations (1)–(6). Hourly weather data of Bangkok between 8.00 and 18.00 were extracted and categorized in reference to the parameters used in determining the cooling capacity and dehumidification performance of the desiccant system in an experiment conducted by Ge et al. [14]. Therefore, as shown in Table 5, 4015 h of data are categorized under the three main temperature categories (25,30,35) with ± 2.5 °C tolerances, and three main humidity categories (50,60,70) with ±5% tolerances. To define the number of required desiccant units, the calculation is based on two cycles of calculations. The primary calculation is conducted to initiate the process with the assumption that the room is unconditioned, hence the inlet air is based on the ambient air condition. As the room is being conditioned after the first cycle, the mixed air with 30% fresh air and 70% return air was then used as the inlet air in the secondary cycle.
Since the room is unconditioned, the primary calculation considered the ambient air being dehumidified by 3 CCHEs before being processed by the M-cycle cooling system to achieve the optimal air condition. Equation (1) has been used to derive the enthalpy of the processed air as the ambient air is being dehumidified by the CCHE.
Q = M (Hain − Haout)
The processed air enthalpy was then mapped in the Psychometric Diagram Viewer software version 3.5.0 by Daikin to define the temperature and humidity of the processed air. To define the cooling performance of the M-cycle system, Equation (2), formulated by Riangvilaikul and Kumar, was used [15].
Tout = 7.65 + 0.152 Tin + 681 w
In order to calculate the return air condition, additional moisture from the occupants was assessed with Equation (3) based on the volume flowrate data results from Design Builder Software. This allows the return air condition to be calculated with Equation (4).
ΔC = P/n × v
(Tsupply − Treturn) = Q/V Cρ
The return air is then mixed with ambient air in a 70:30 ratio (Equations (5) and (6)) and used as the supply air in the secondary calculation.
Xmixed = (Qin × Xin + Qre × Xre)/(Qin + Qre)
Tmixed = (QinTin + QreTre)/Qin + Qre
The secondary calculation was conducted to assess the effective number of CCHEs required. The inlet air was the mixture of 70% return air from the primary calculation and 30% ambient air. The process undergoes a similar calculation cycle. However, the supply air condition was re-calculated after every CCHE dehumidification process to evaluate the optimal number of CCHEs required. The supply air condition is considered valid when its relative humidity level is under 55.5%. It is then cross-referenced with the hourly weather data of Bangkok to evaluate the effectiveness of the system considering the number of operable hours. It was then used in determining the cooling loads and volume flowrates to be used as the design parameters.
2.2.4. Energy Consumption Assessment
In order to define the energy consumption of the system, the requirements for operation were established. The requirements were categorized into three categories, which include, cold water for both cooling and dehumidification, hot water for regenerating the CCHEs, and electricity for the fans and blowers, which can be found in Table 6 and Table 7.
The cold water requirements for the M-cycle system were based on the experiment by Riangvilaikul and Kumar [15]. However, the water flow rate required for the CCHEs was derived from 3 different experiments by Jiang et al. and Ge et al. [14,17]. The energy needed for heating the hot water was calculated under the assumption that the water would lose 5.7 °C after the CCHEs process it. Meanwhile, the electricity required by the fans and blowers was referenced to Ebmpapst’s Centrifugal fans and blowers version 7 catalog [18]. In addition, a heat pump with a coefficient of performance (COP) of 3.5 was also included to explore the potential of reducing the heating energy demand required to heat up the hot water.
2.3. Solar Autonomy Assessment
2.3.1. PVT Integration/Energy Production Assessment
The potential to achieve energy autonomy or self-sufficiency was explored by integrating a PVT system into the design of the façade system. The PVT elements were integrated as a shading system, providing energy while decreasing the cooling demands through the use of passive design strategies. The available solar radiation on site was simulated with Ladybug, a Grasshopper plug-in which served as an interface for Radiance and EnergyPlus for analyzing and mapping weather data, to illustrate the relationship between the orientation of the façade and solar exposure.
In order to explore a suitable approach to integrate the PV(T) system, four concepts were developed. The concepts were based on the position and tilt angle of the PV(T), which was optimized through the means of Galapagos, a Grasshopper plug-in which works as an evolutionary solver, and Ladybug. The fixed parameters were the size of the panels and the rotation point, which is positioned at the center of the panels. This only allows the optimization engine to rotate the panels to a certain extent, in which the panel would not touch the main façade component. The optimization also includes movements in the z-axis to minimize the shadow of the upper panel from being cast onto the bottom one. To be able to assess the system efficiency in comparison to the electricity and energy requirements, their performances were based on the average daily alternating current (AC) energy production, considering a 0.825 conversion factor from the direct current (DC), and average daily thermal energy production. The average yield has been used due to low annual solar variations. The production results were calculated with the PV’s efficiency of 15% and thermal energy production of 70%. To further explore the design possibilities proposed in the earlier stages, six design concepts were introduced. They were based on three main aspects including the balance between the usage of PV and PVT components, cell coverage density, and the balance of the operation between the PV/PVT system and the heat pump system.
2.3.2. Energy Efficiency Assessment
To evaluate the “Desigrated” system’s efficiency, its energy demand and yield was assessed and compared with the energy consumption of a conventional air conditioning (AC) system, in which energy consumption of the conventional air condition system was based on three main components: air handling unit (AHU), heating system, and the centralized cooling system (cooling tower and chiller system). These data were extracted from the annual building audit data of the KTB building.
3. Results
3.1. System Design and Configurations
The first step in designing the façade system was to define the system size, specifically its cross-section. The cross-section plays a crucial role in determining the mass rate and volume flowrate of the inlet and outlet air. The preliminary assumption was based on a similar cross-section of the air chamber with an area of 0.12 m2, to achieve a constant air flow as it is being processed. With a 0.12 m2 cross-section area, the system can provide a constant mass flow rate of 0.22 kg/s and a volume flowrate of 0.18 m3/s. Once the system volume flowrate was defined, it was used in evaluating the fresh air intake ratio. Due to the 30% working air requirement, four schemes were proposed (Table 8).
The first three schemes considered the 0.12 m3 cross-section area as a constraint. On the other hand, the fourth scheme took the air velocity of each system as its main constraint. Based on the results, it could be concluded that the fourth scheme is able to provide a higher volume of supply air at 0.42 m3/s, under the condition that the M-cycle system cross-section increases to 0.25 m2.
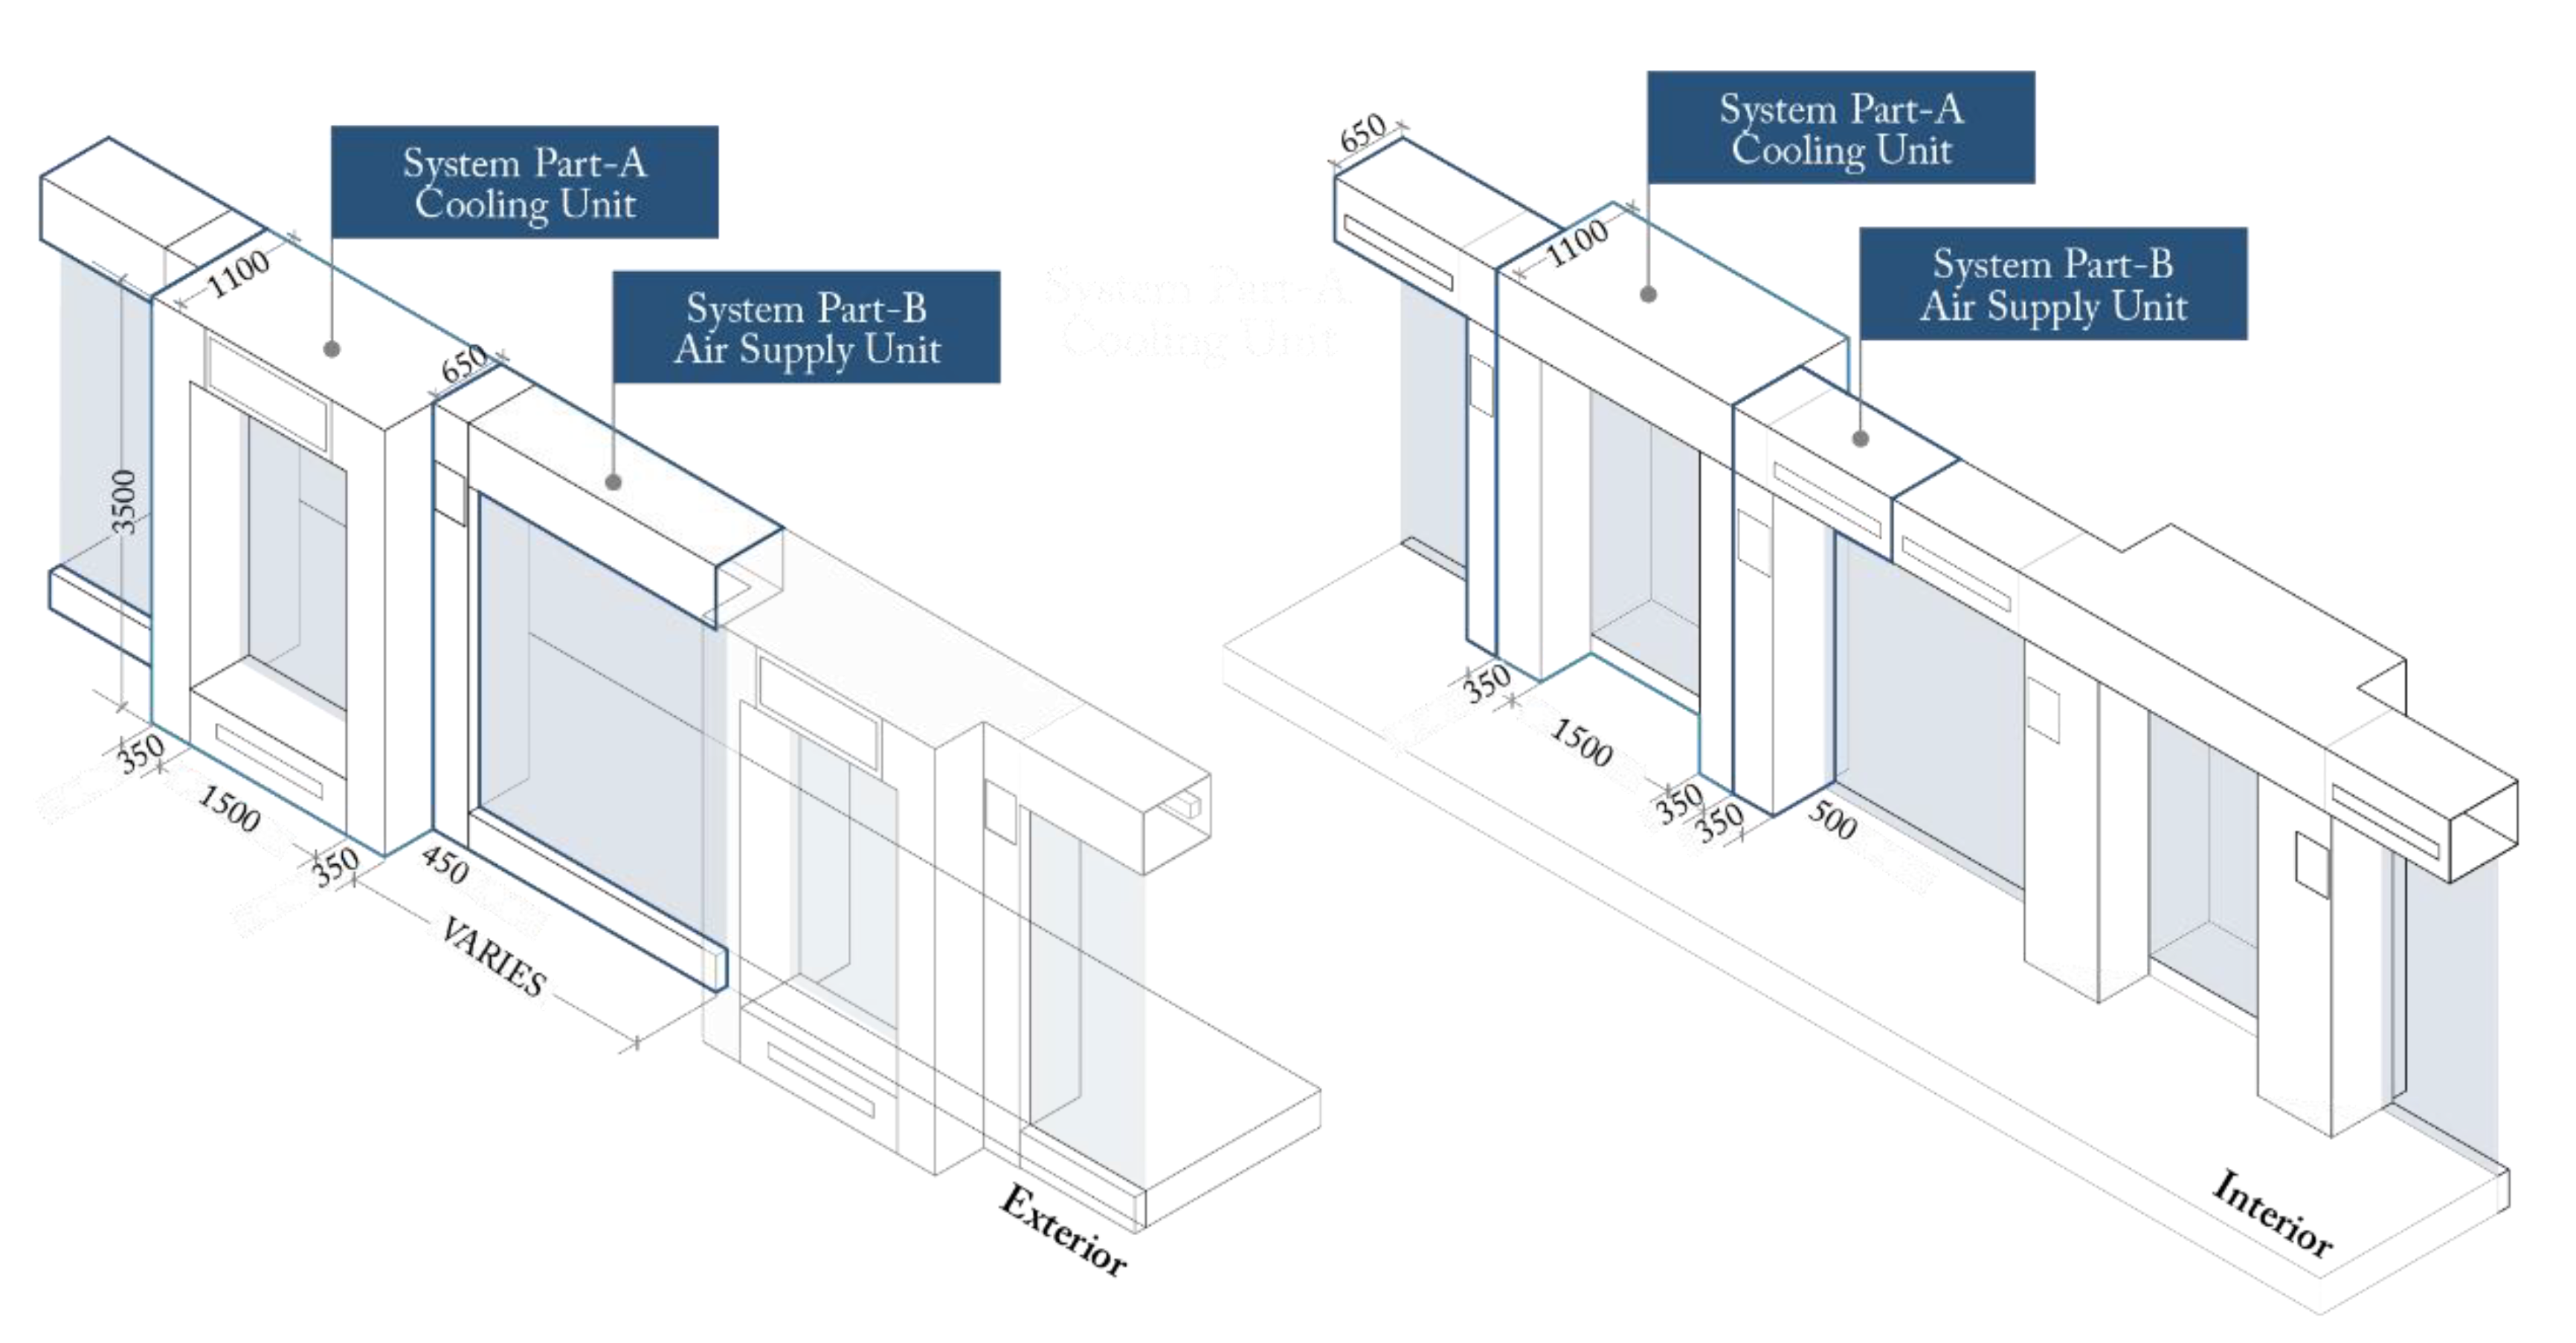
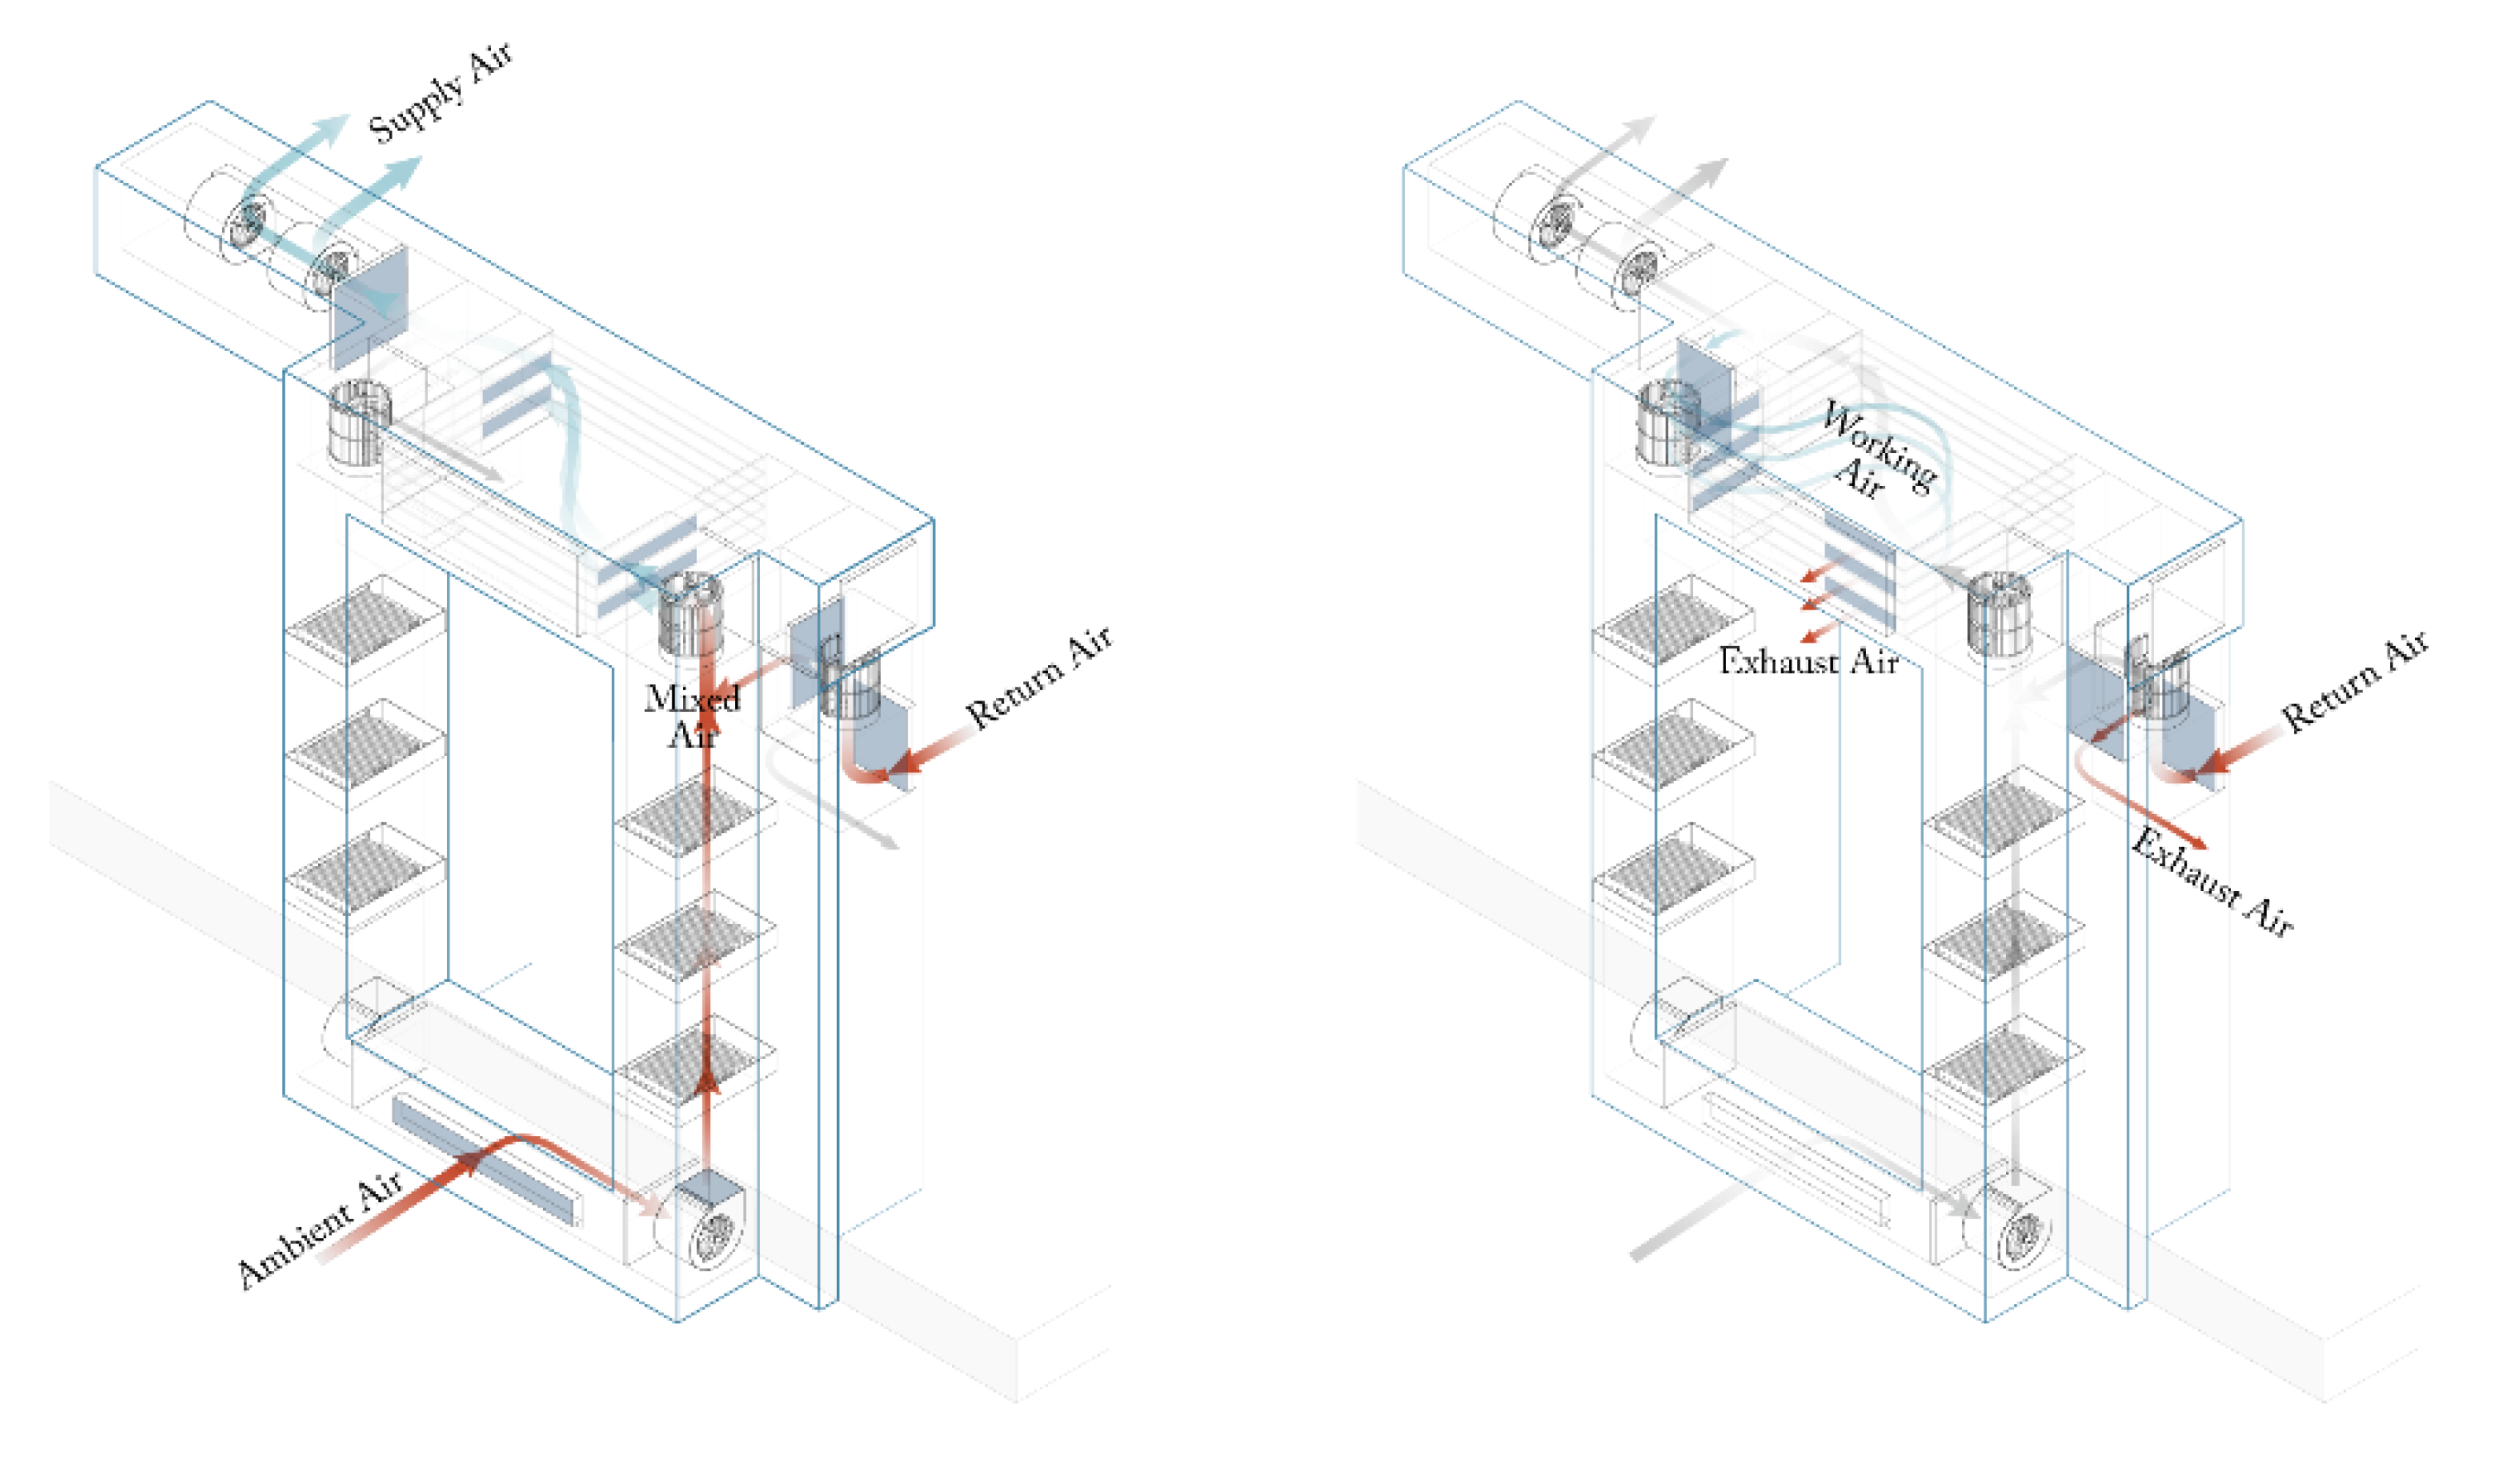
The façade design concept was developed as a stand-alone compact system, depicted in Figure 4. The system was designed as a frame, with modular features. The system configuration is presented in Figure 5. The air supply unit is positioned at ceiling level, therefore it provides the option of connecting to the ducting system. These aspects provided the system with high versatility for its implementation on site. The system consists of two parts, a cooling unit, and an air supply unit. The cooling unit consists of an air intake unit on the bottom, two sets of three CCHE units running parallel on the sides, and an M-cycle system on top. The components form a frame-like structure wrapping around the window opening. The outdoor air is taken in through the air inlet at the base of the frame, it is then dehumidified by the series of CCHEs before being cooled down by the M-cycle cooling system and sent to the air supply unit. The air supply unit rests on top of the adjacent window next to the cooling unit, allowing the conditioned air to be supplied at ceiling level. Furthermore, the return air duct is also incorporated as part of the supply air unit running on the side of the window opening, forming an interior frame. The attributes of the compact façade concept are summarized in Table 9.
To be able to define the number of systems required in cooling the floor, the design air flow rate needs to be determined. Two simulations were conducted to compare the results of the conventional A/C system and the “Desigrated” system. The simulation showed that the 19th floor requires a design cooling capacity of 134.31 kW with a 6.51 m3/s flow rate. On the other hand, the supply air temperature of the proposed system is fixed at 18.9 °C with a 0.0081 g/g humidity ratio based on the preliminary calculations in the design concept chapter, while the mechanical ventilation is turned off since 30% of fresh air has already been mixed with the supply air. Due to the mechanical ventilation being turned off, the design cooling capacity drops slightly to 84.24 kW, and the design flowrate is reduced to 4.42 m3/s. Considering the “Desigrated” system design flow rate at 0.42 m3/s, 11 systems are needed for cooling the 19th floor.
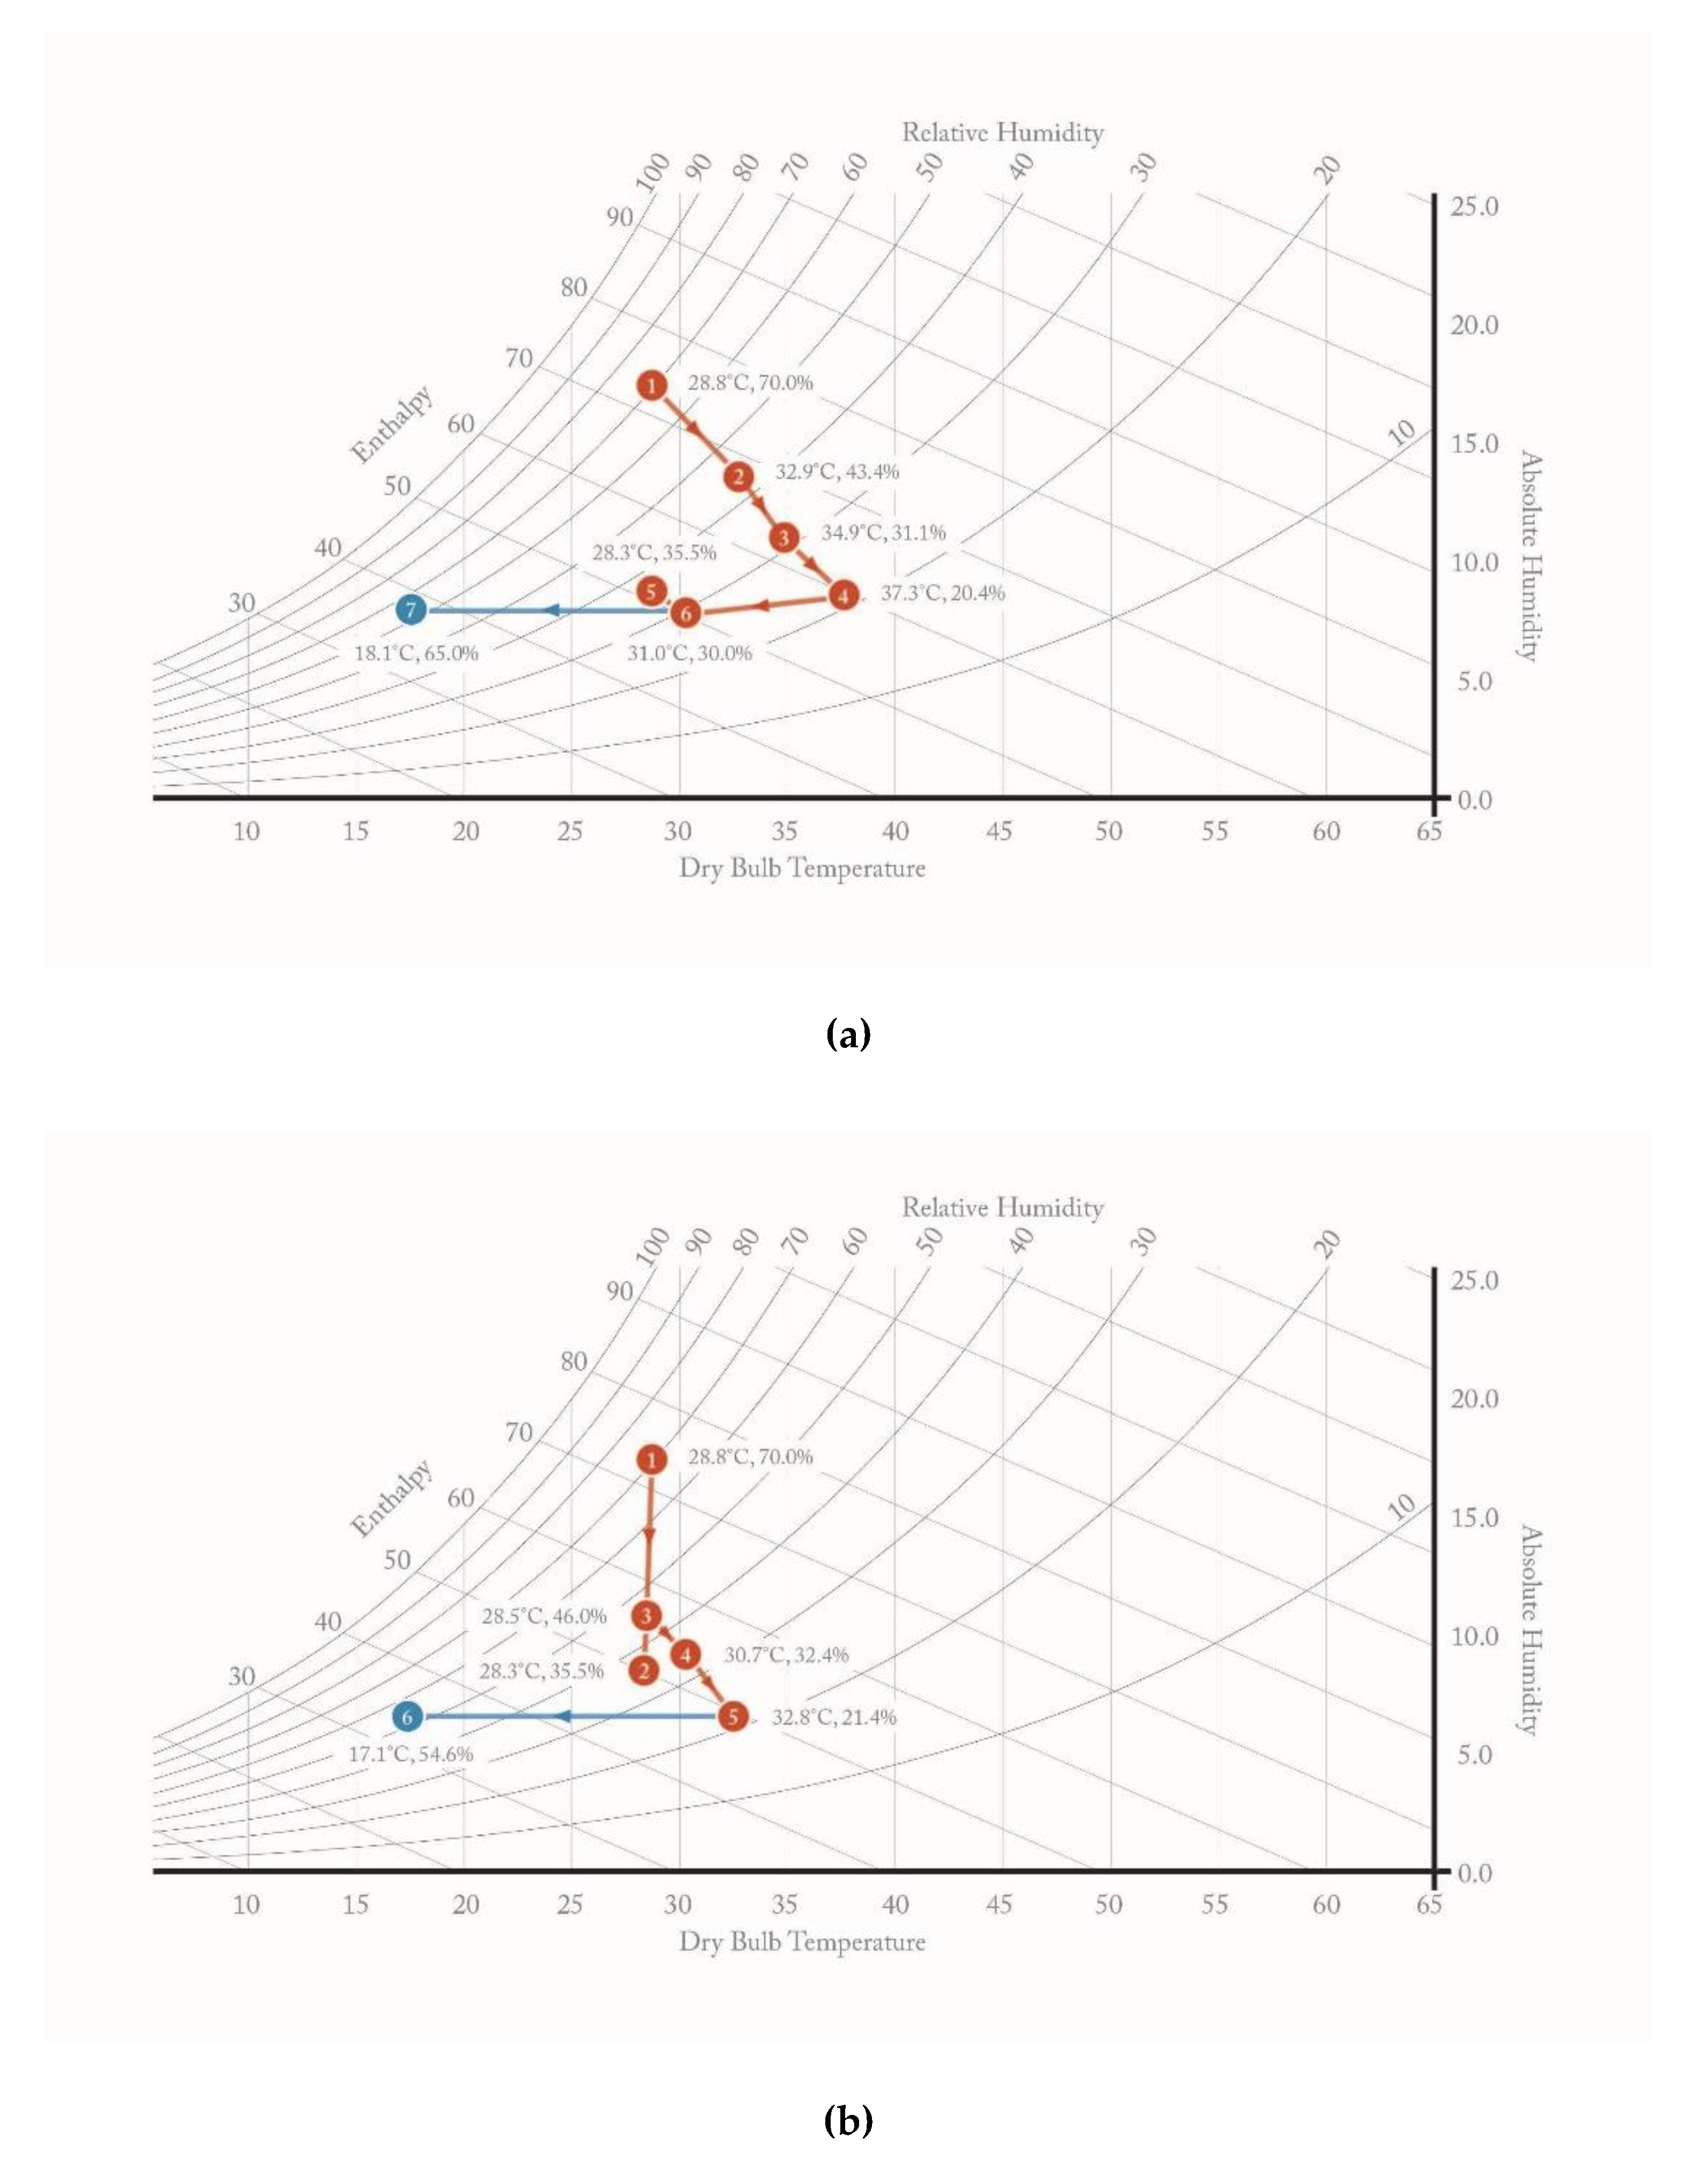
Two concepts have been studied to explore the impact of the mixed air chamber position. The first supply air was considered at 18.9 °C. The return air is assumed to be at 28.3 °C with an 8.5 g kg humidity ratio. In the first concept (1), the ambient air is processed by three series of CCHEs before being mixed with the return air from the room. The mixed air is then processed by the M-cycle system and supplied to the room as conditioned air. This results in a supply air temperature of 18.1 °C. While the supply air temperature reduces slightly by 0.8 °C, the relative humidity ratio rises to 65%, exceeding the comfortable relative humidity ratio by 10%.
The assumption used in calculating the supply air in Concept 1 was also applied in the calculation of Concept 2. However, in this concept, the mixed air chamber is positioned before the desiccant systems. Therefore, the ambient air and the return air will be mixed before getting dehumidified. After the dehumidification process, the processed air follows the same routine of entering the M-cycle system before being supplied into the room. With this configuration, only two CCHEs are required to dehumidify the incoming air to an acceptable level of relative humidity (below 55%). In comparison to the first concept, the second concept shows higher efficiency in cooling down the inlet air, reducing the temperature to 17.1 °C, with a relative humidity level of 54.6%. The result is plotted on the psychometric chart in Figure 6. Due to the potential in reducing the number of CCHEs required and its higher cooling capacity, the system configuration was based on the scheme proposed in Concept 2.
3.2. PVT System Integration
A PVT system was introduced into the design of the façade system, to provide energy autonomy while serving as an exterior sun-shading device. From the solar radiation simulation, a conclusion can be drawn that the south-facing façade received the highest solar radiation exposure annually. The east and west façade share a similar exposure level with the highest solar radiation level of 728 kWh/m2, while the north façade would be least exposed to solar radiation, as expected.
Furthermore, it is evident that the extended frame structure fails to provide sufficient shading by itself for the interior space, except on the north facade. However, it can prevent direct solar exposure of the top of the façade, due to the high incident angle of the sun. It should also be noted that the highest solar irradiance is registered at the base of the extended frame structure.
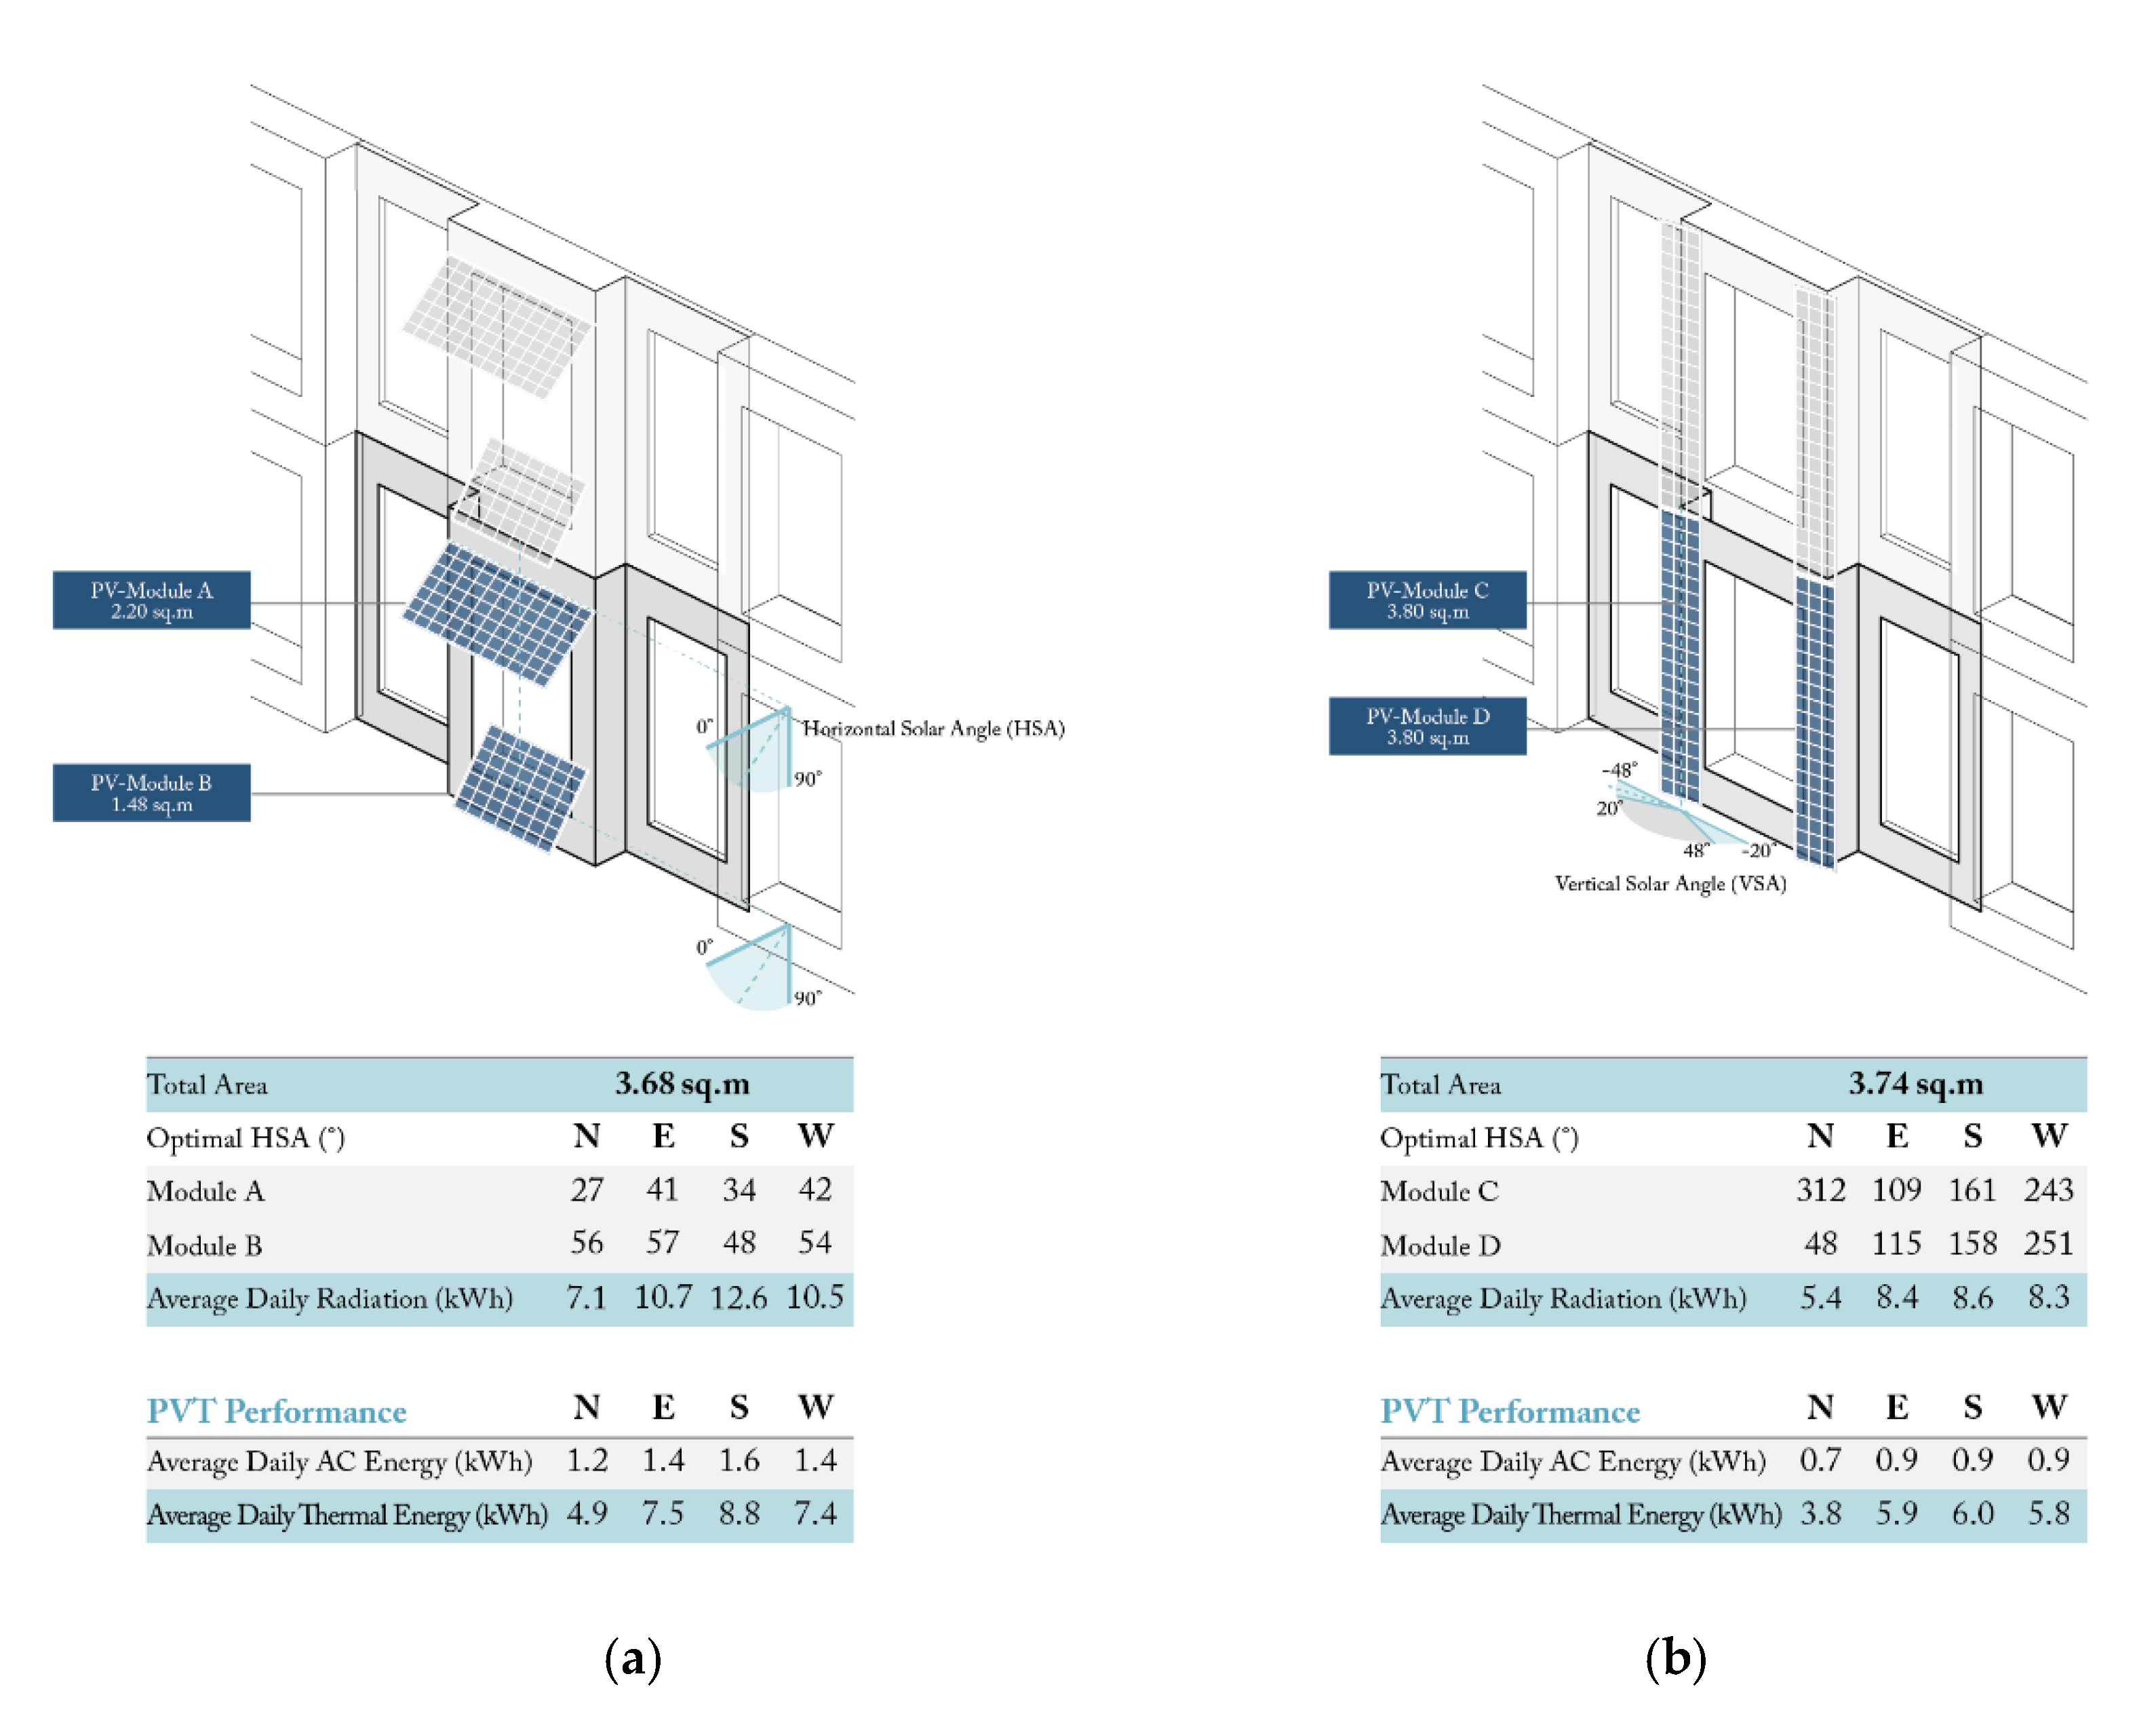
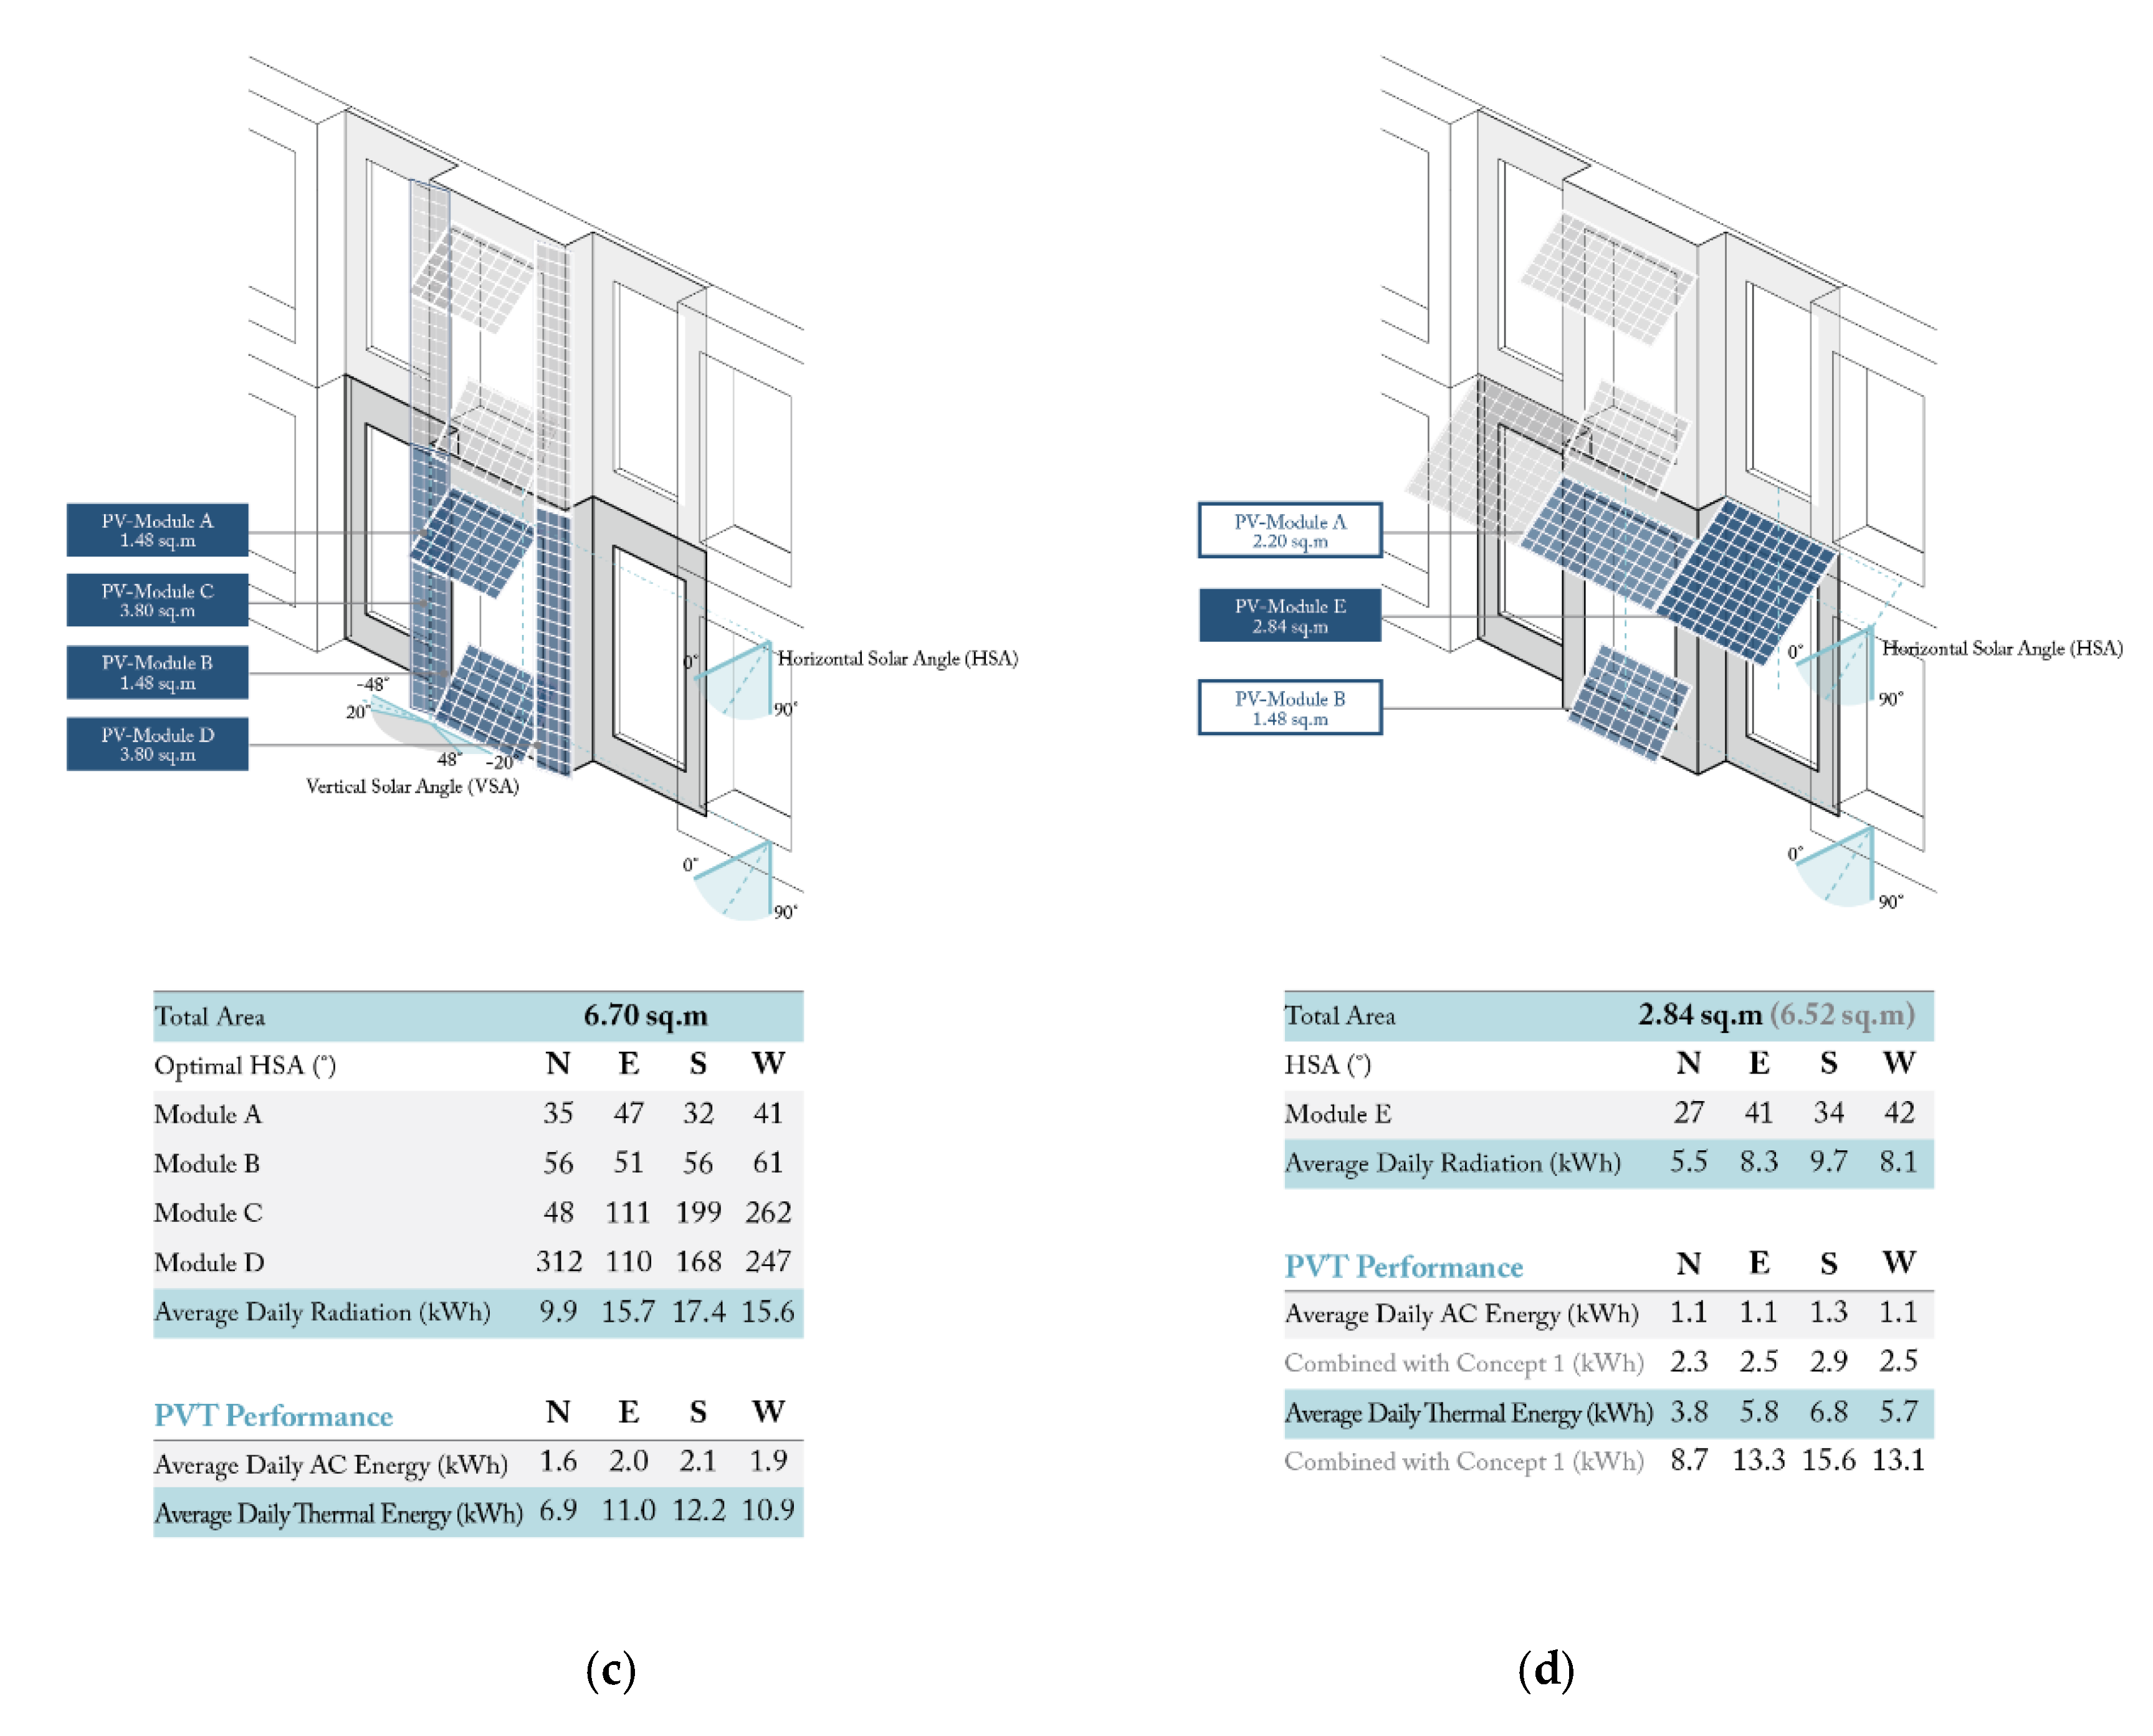
Four design concepts were initially proposed, which are depicted in Figure 7a–d.
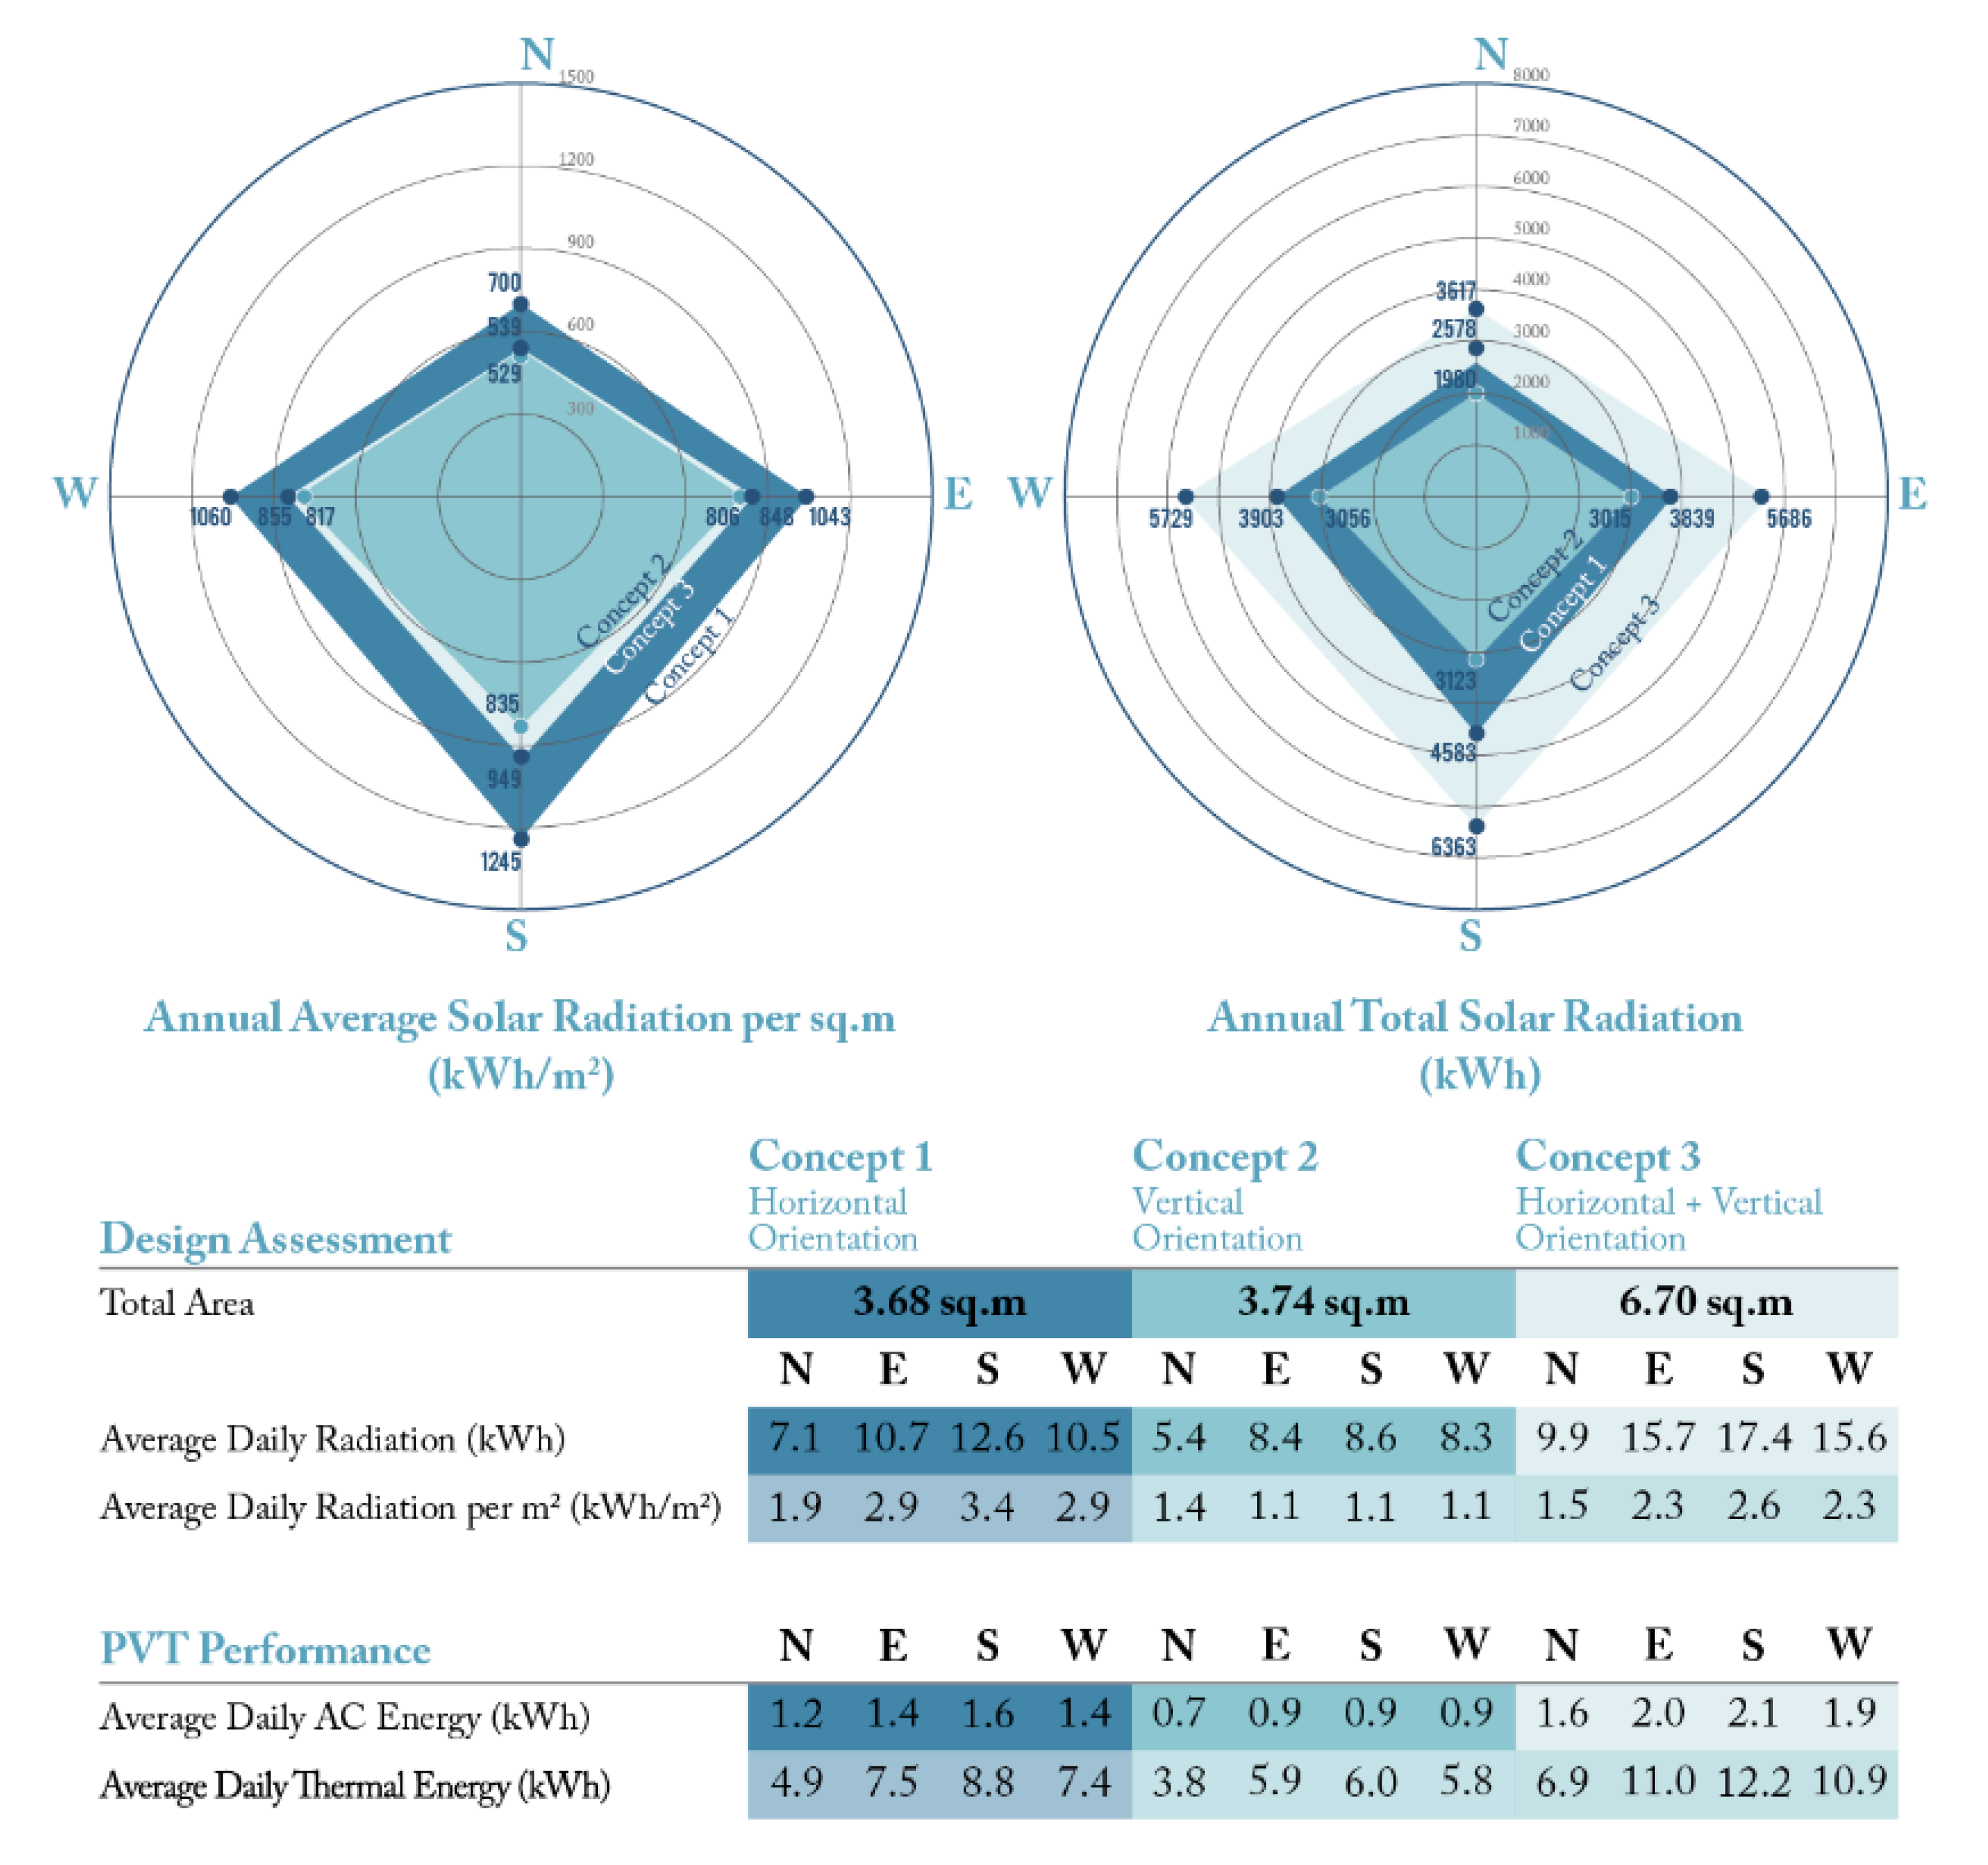
To assess the performance of the PV panels at each orientation, the annual average solar radiation exposure per m2 and the annual total solar radiation exposure were plotted in Figure 8. The results presented a corresponding conclusion with the solar study, in which the south façade would receive the highest solar radiation exposure, and the west and east façade share a similar exposure level, while the north façade exposure is minimal. Based on the results, it is evident that Concept 3 has the highest total solar radiation exposure due to its largest surface area coverage. However, when the results have been distributed evenly amongst the surface area, Concept 1 with horizontal configuration shows a higher exposure level. A conclusion could be drawn that, due to the high solar incident angle, horizontal orientation is the most suitable concept to integrate the PV system onto the façade. Therefore, the horizontal arrangement scheme was picked for further development.
Concept 4 was developed based on the assumption that the horizontal arrangement of the panels could obtain the highest solar radiation exposure per m2 (Figure 7d). Therefore, an additional set of PVT systems with an area of 2.84 m2 was added on the air supply unit part, hovering over the adjacent window. The additional system is connected to the top panel of the system proposed in Concept 1, therefore sharing a similar tilt angle and position. With the additional system, thermal energy production increases with an average of 77% in comparison with Concept 1, while the AC current production increases with an average of 83%. Furthermore, despite having a slightly lesser coverage area, its thermal productivity is 124% higher on average, while its AC productivity is 135% higher in comparison with Concept 3. With the drastic improvement in terms of energy production, Concept 4 had been used in the thermal and electrical energy requirement assessments.
The assessment was conducted considering the hot and cold water requirements derived by Jiang et al. and Ge et al. [14,17]. From the results in Table 10, it could be concluded that, despite having a higher production rate, Concept 4 failed to provide sufficient heating energy for Case 1 (200 L/hr) and Case 2 (155 L/hr). Therefore, additional PV(T) elements should be implemented. However, the scheme can provide sufficient energy for Case 3 (60 L/hr) from the majority of its orientation except for the north façade, which requires an additional area of 3.28 m2. Nevertheless, due to the relatively low efficiency rate of the PV panels, the scheme fails to satisfy the electrical requirements of the façade system, being able to supply an average of 47% of what is required.
3.3. Performance Assessment|Primary Calculation
To assess the performance of the “Desigrated façade system”, further calculations were made based on hourly ambient air data. The assessment was conducted on two cycles of calculations. The first calculation cycle is needed to initiate the process under the assumption that the room is unconditioned, hence the inlet air is based on the ambient air condition.
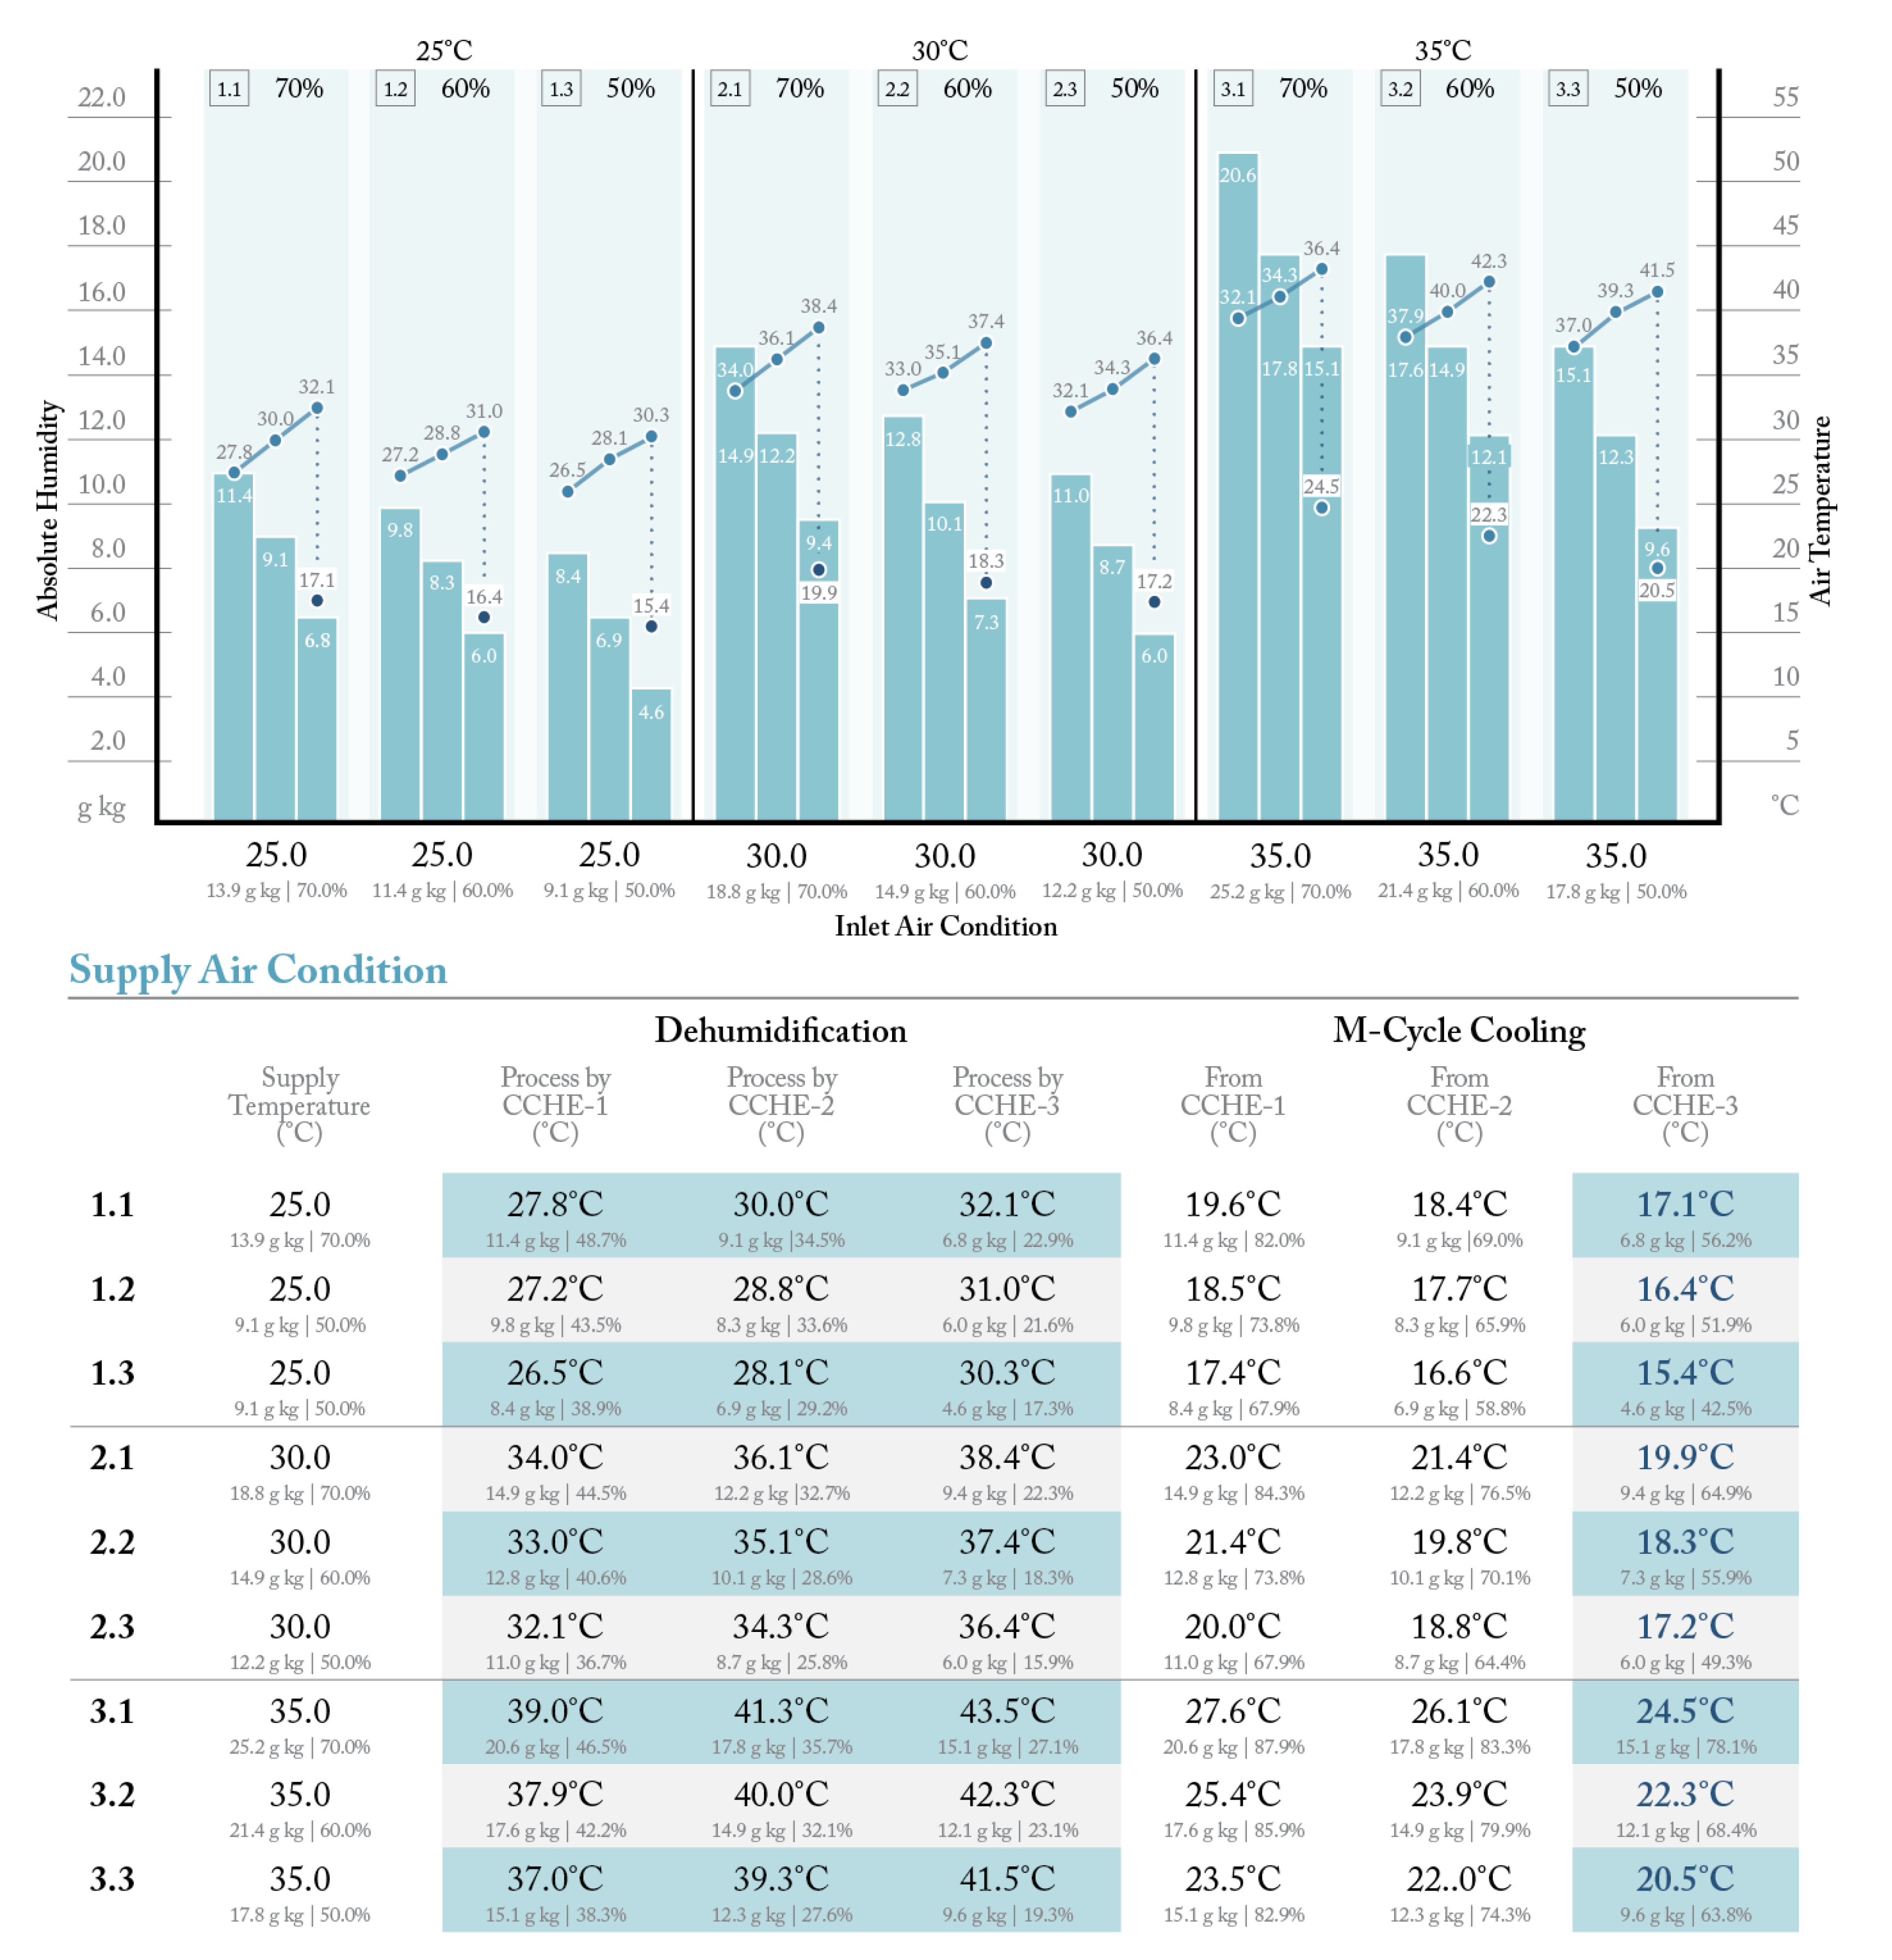
3.3.1. Supply Air Condition
To determine the supply air condition, the variation in Bangkok’s ambient temperature was used as the inlet temperature to evaluate the system supply temperature. From Figure 9, it is evident that the air temperature gradually increases, while the absolute humidity level decreases as the CCHE is processing the air. Furthermore, it could be concluded that the M-cycle performed more effectively as the air gets dehumidified. The results of the calculations showed that a lower temperature supply air could be achieved from the inlet air with a relatively more moderate temperature and humidity. With the ambient air condition of Bangkok, the supply air temperature ranges between 15.4 and 24.5 °C.
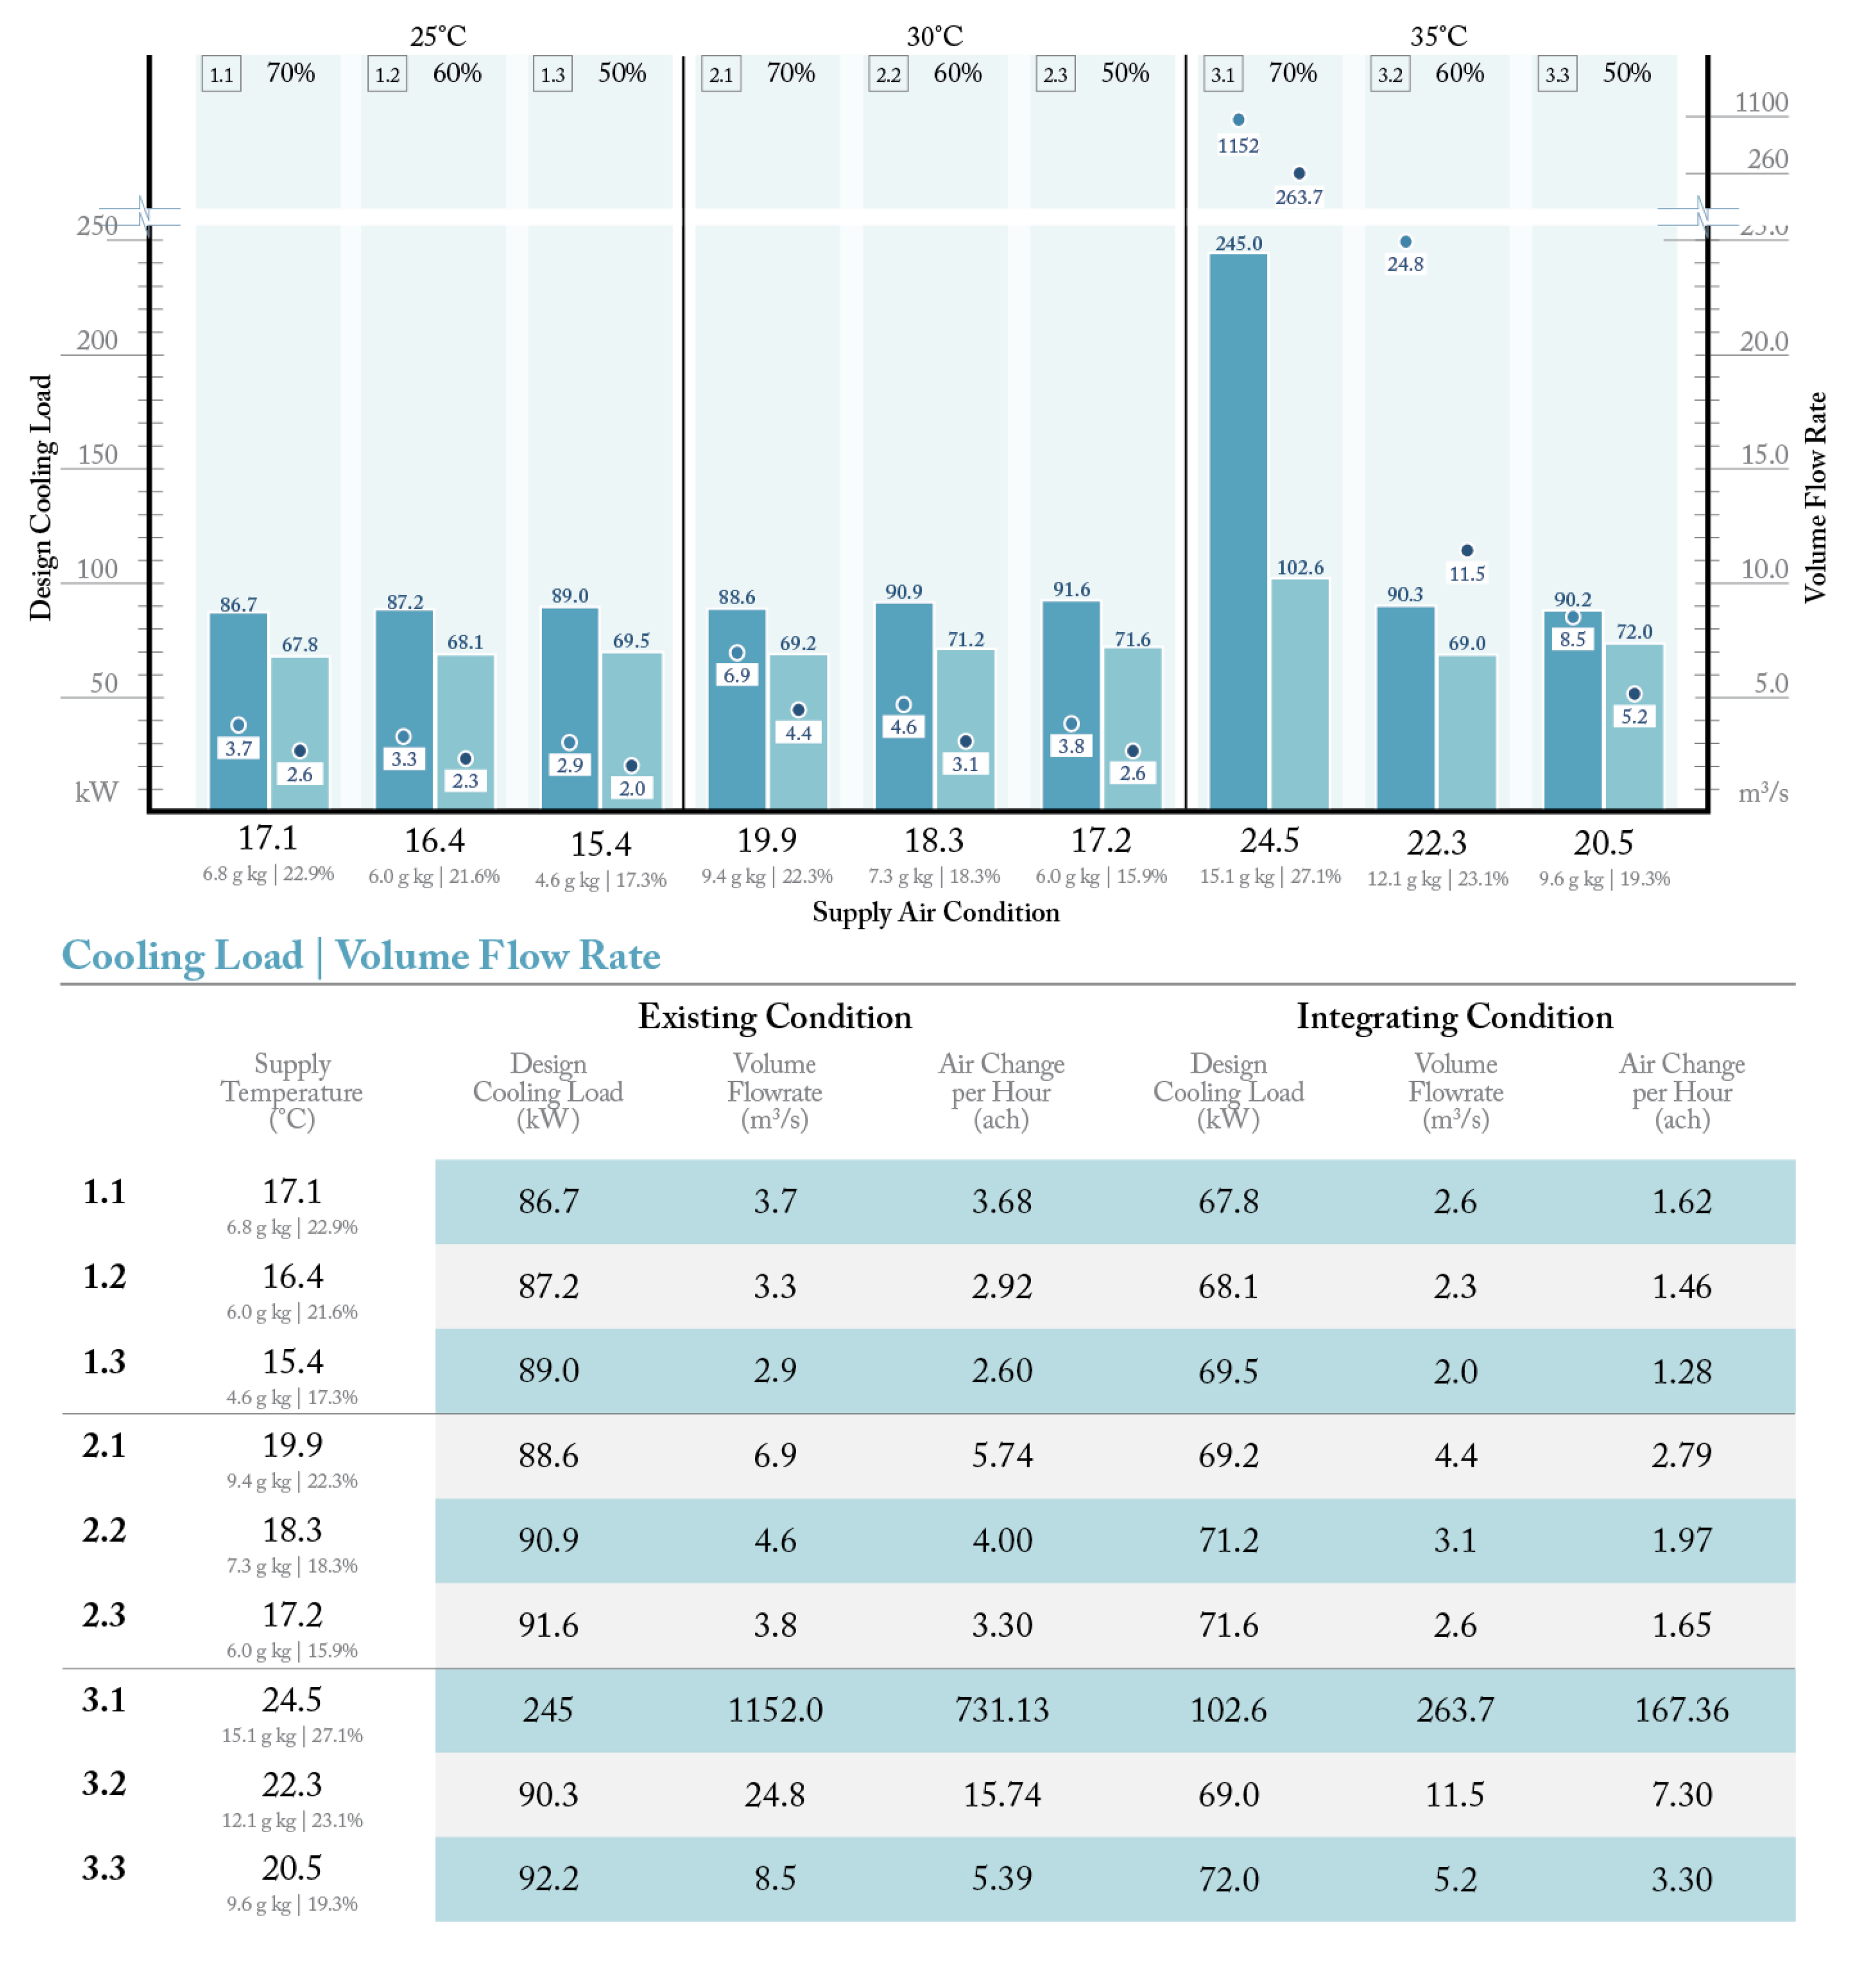
3.3.2. Cooling Load and Volume Flowrate Simulation
The supply air condition was used as an input value in Design Builder to define the cooling load and volume flowrate requirements. Both the existing condition of the building and the proposed façade design have been simulated. The three scenarios are mapped against each other in Figure 10. The results show that the proposed scenarios have lowered the cooling load of the room by an average of 19.7 kW, except for the irregular trend which occurs at scenario 3.1 due to the relatively high supply temperature. At the same time, the integration of the proposed scenarios has presented a similar pattern regarding the volume flowrate requirements. An average decreasing trend of 1.4 m3/s could be concluded from the first two scenarios. However, due to the relatively high supply temperature, irregular trends also occur in scenario 3, in which the decreasing rate varies from 888 to 3.3 m3/s.
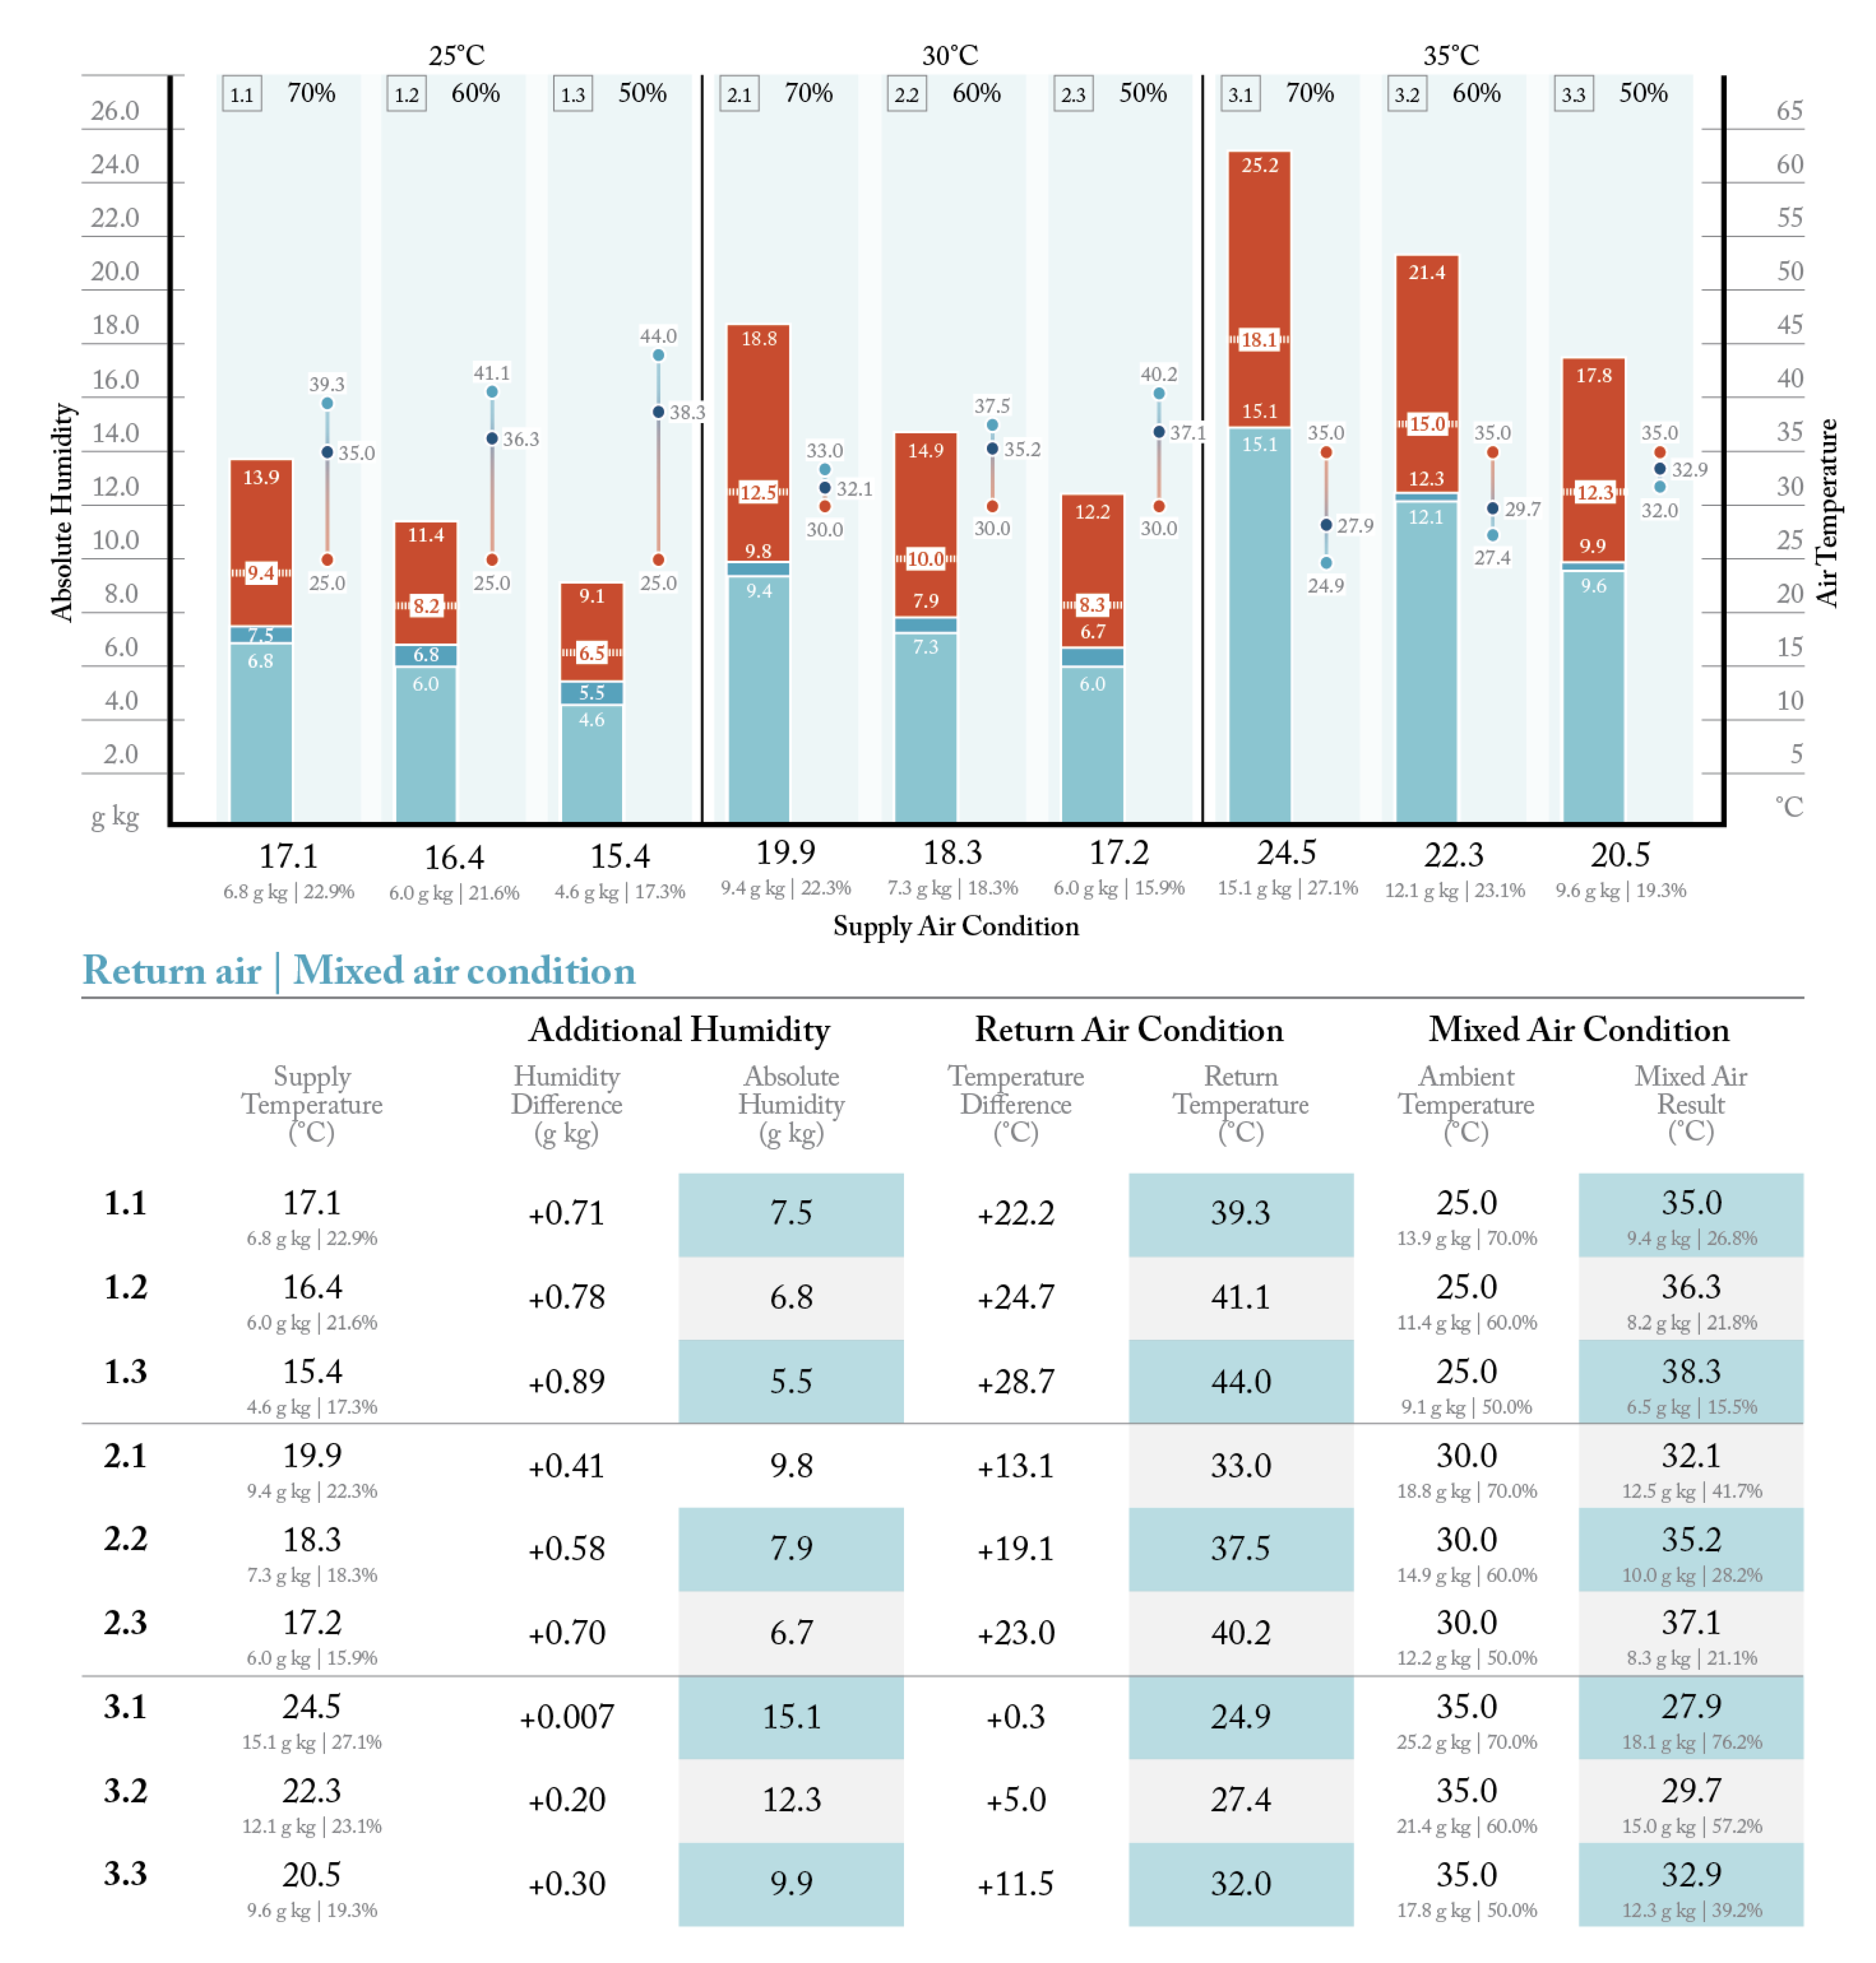
3.3.3. Mixed Air and Return Air Condition
The cooling load derived from the simulation was used in calculating the room’s air change rate to determine the temperature increase of the return air. The volume flowrate is used in calculating the room’s air change rate to assess the additional moisture from the room. From Figure 11, the calculation shows a trend in which the return air’s temperature tends to be relatively lower when the supply air temperature is higher. At the same time, a relatively lower volume flowrate would result in a higher additional moisture rate.
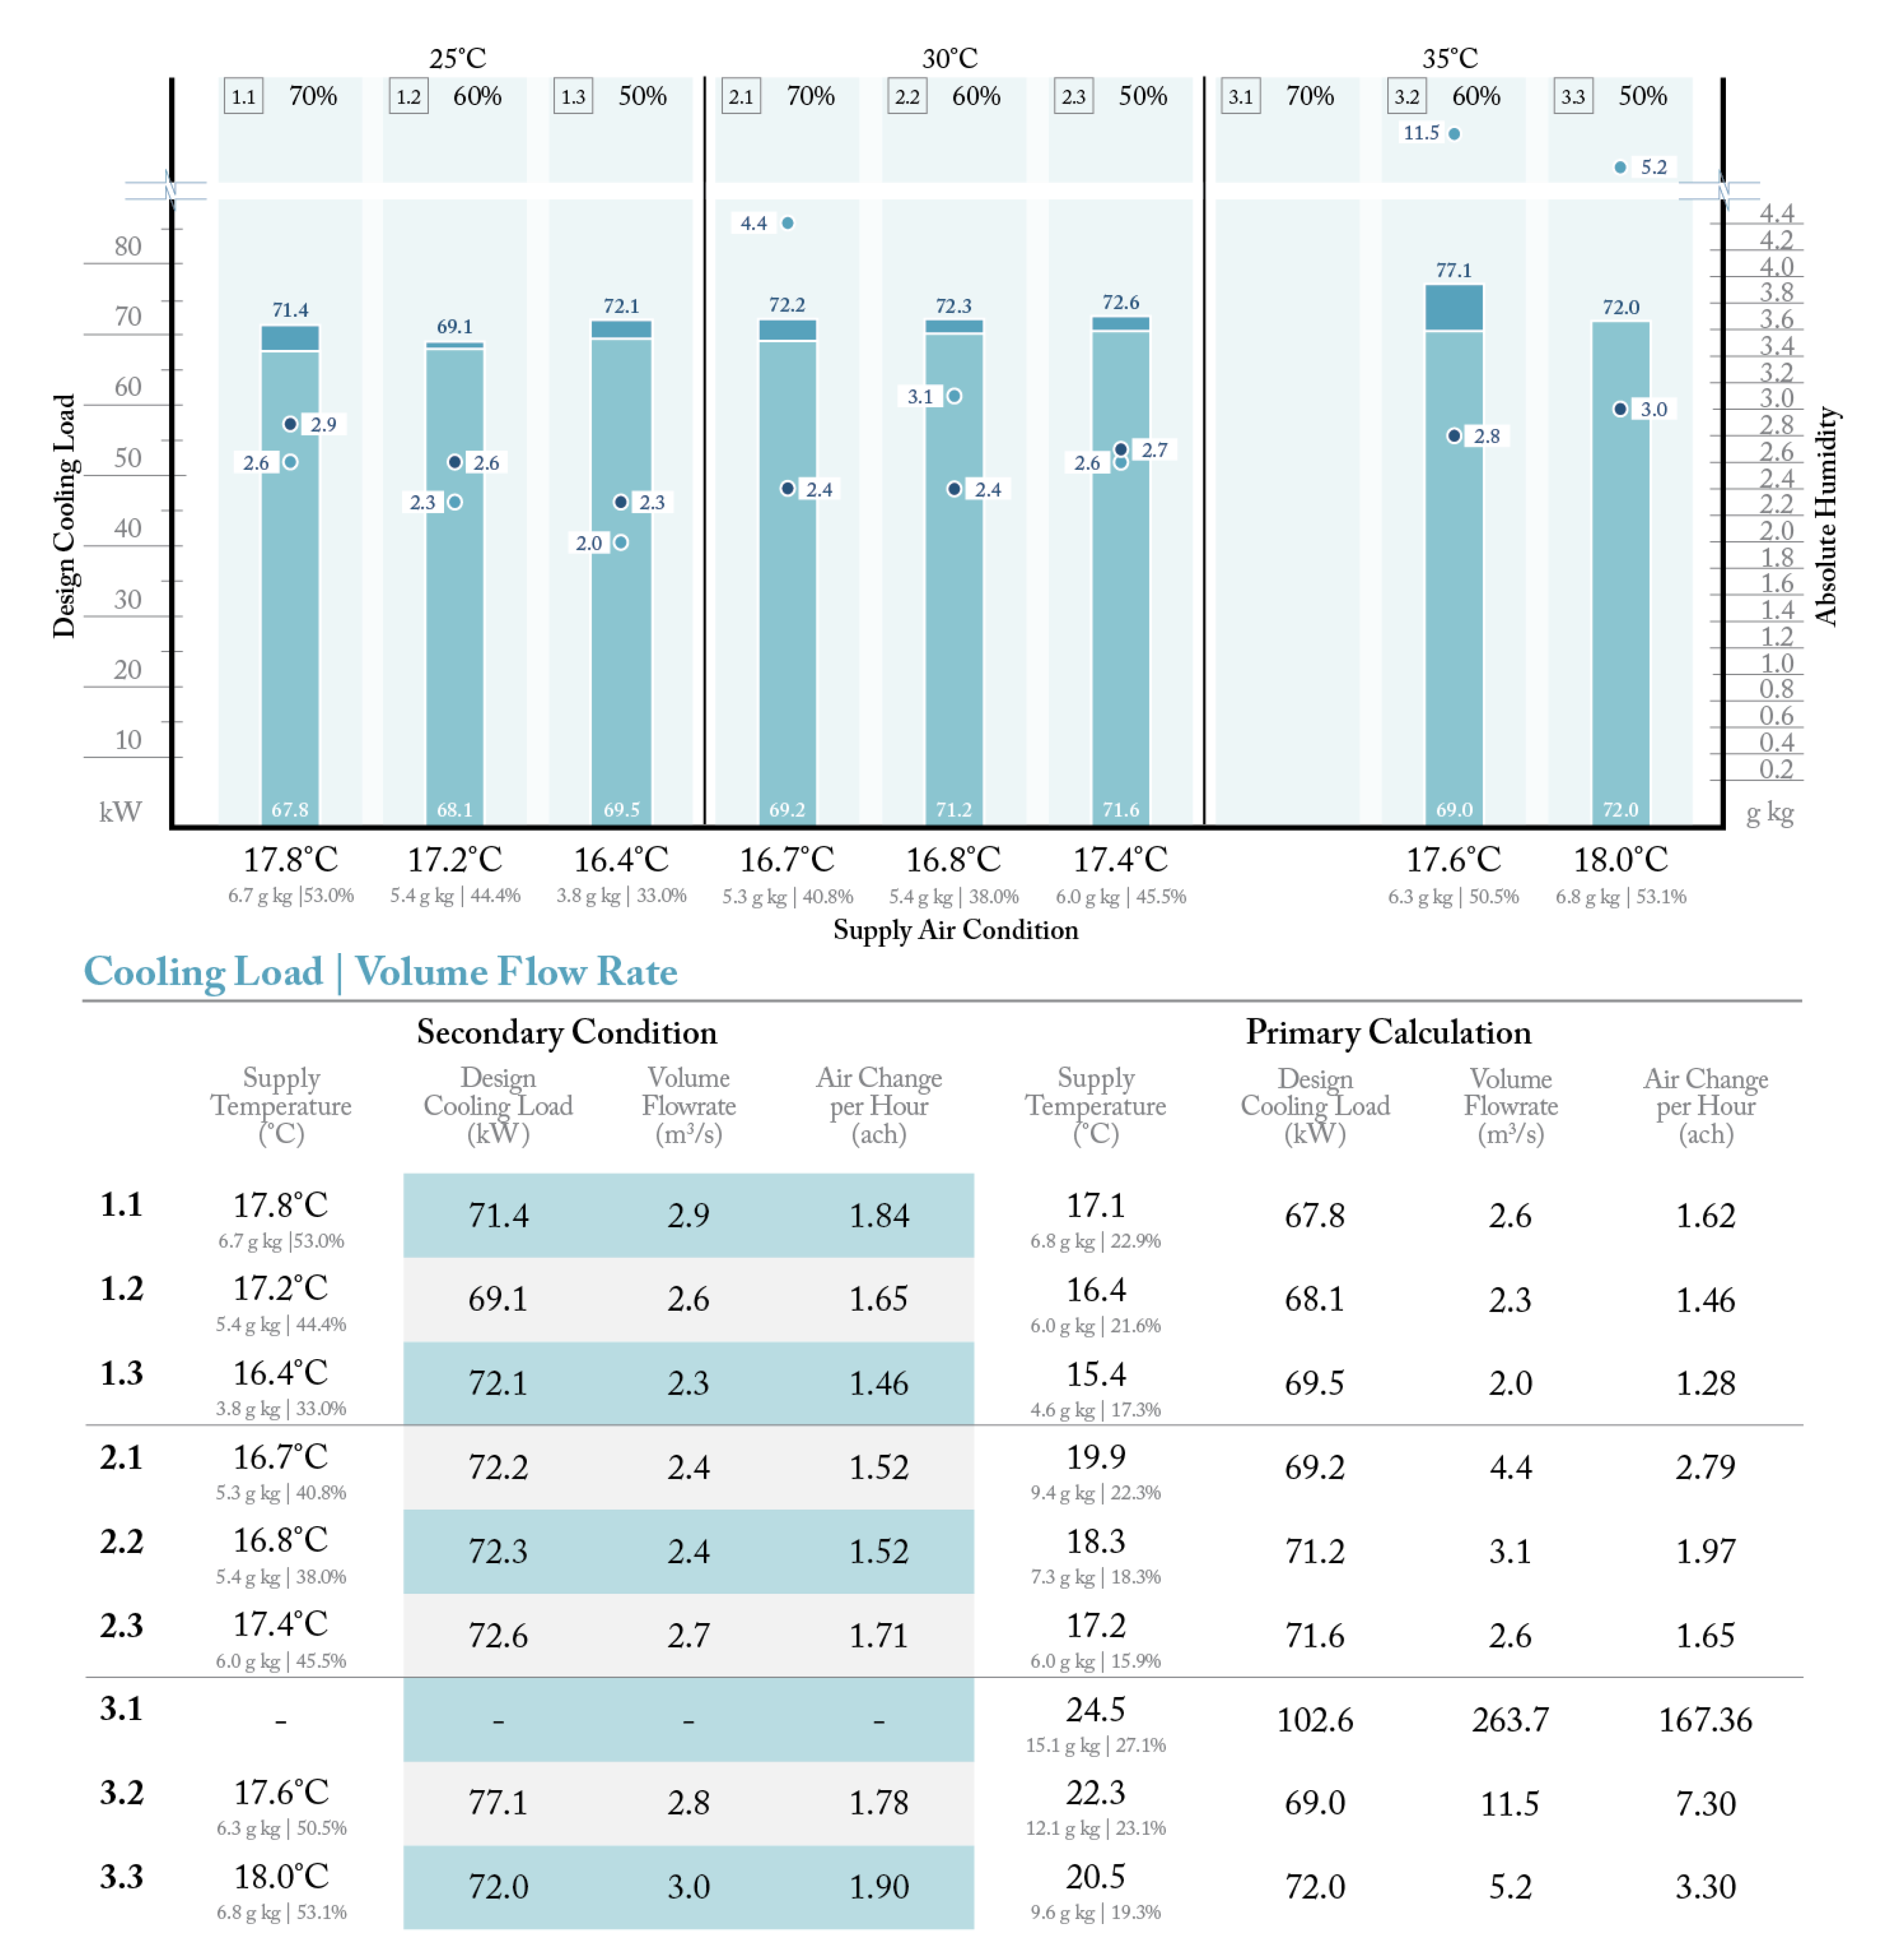
3.4. Performance Assessment|Secondary Calculation
A secondary calculation was conducted to assess the adequate number of CCHEs required to process the mixed air to achieve a supply air with a relative humidity level under 55.5%. As the room is being conditioned after the first cycle, mixed air with 30% fresh air and 70% return air was then used as the inlet air in the secondary calculation.
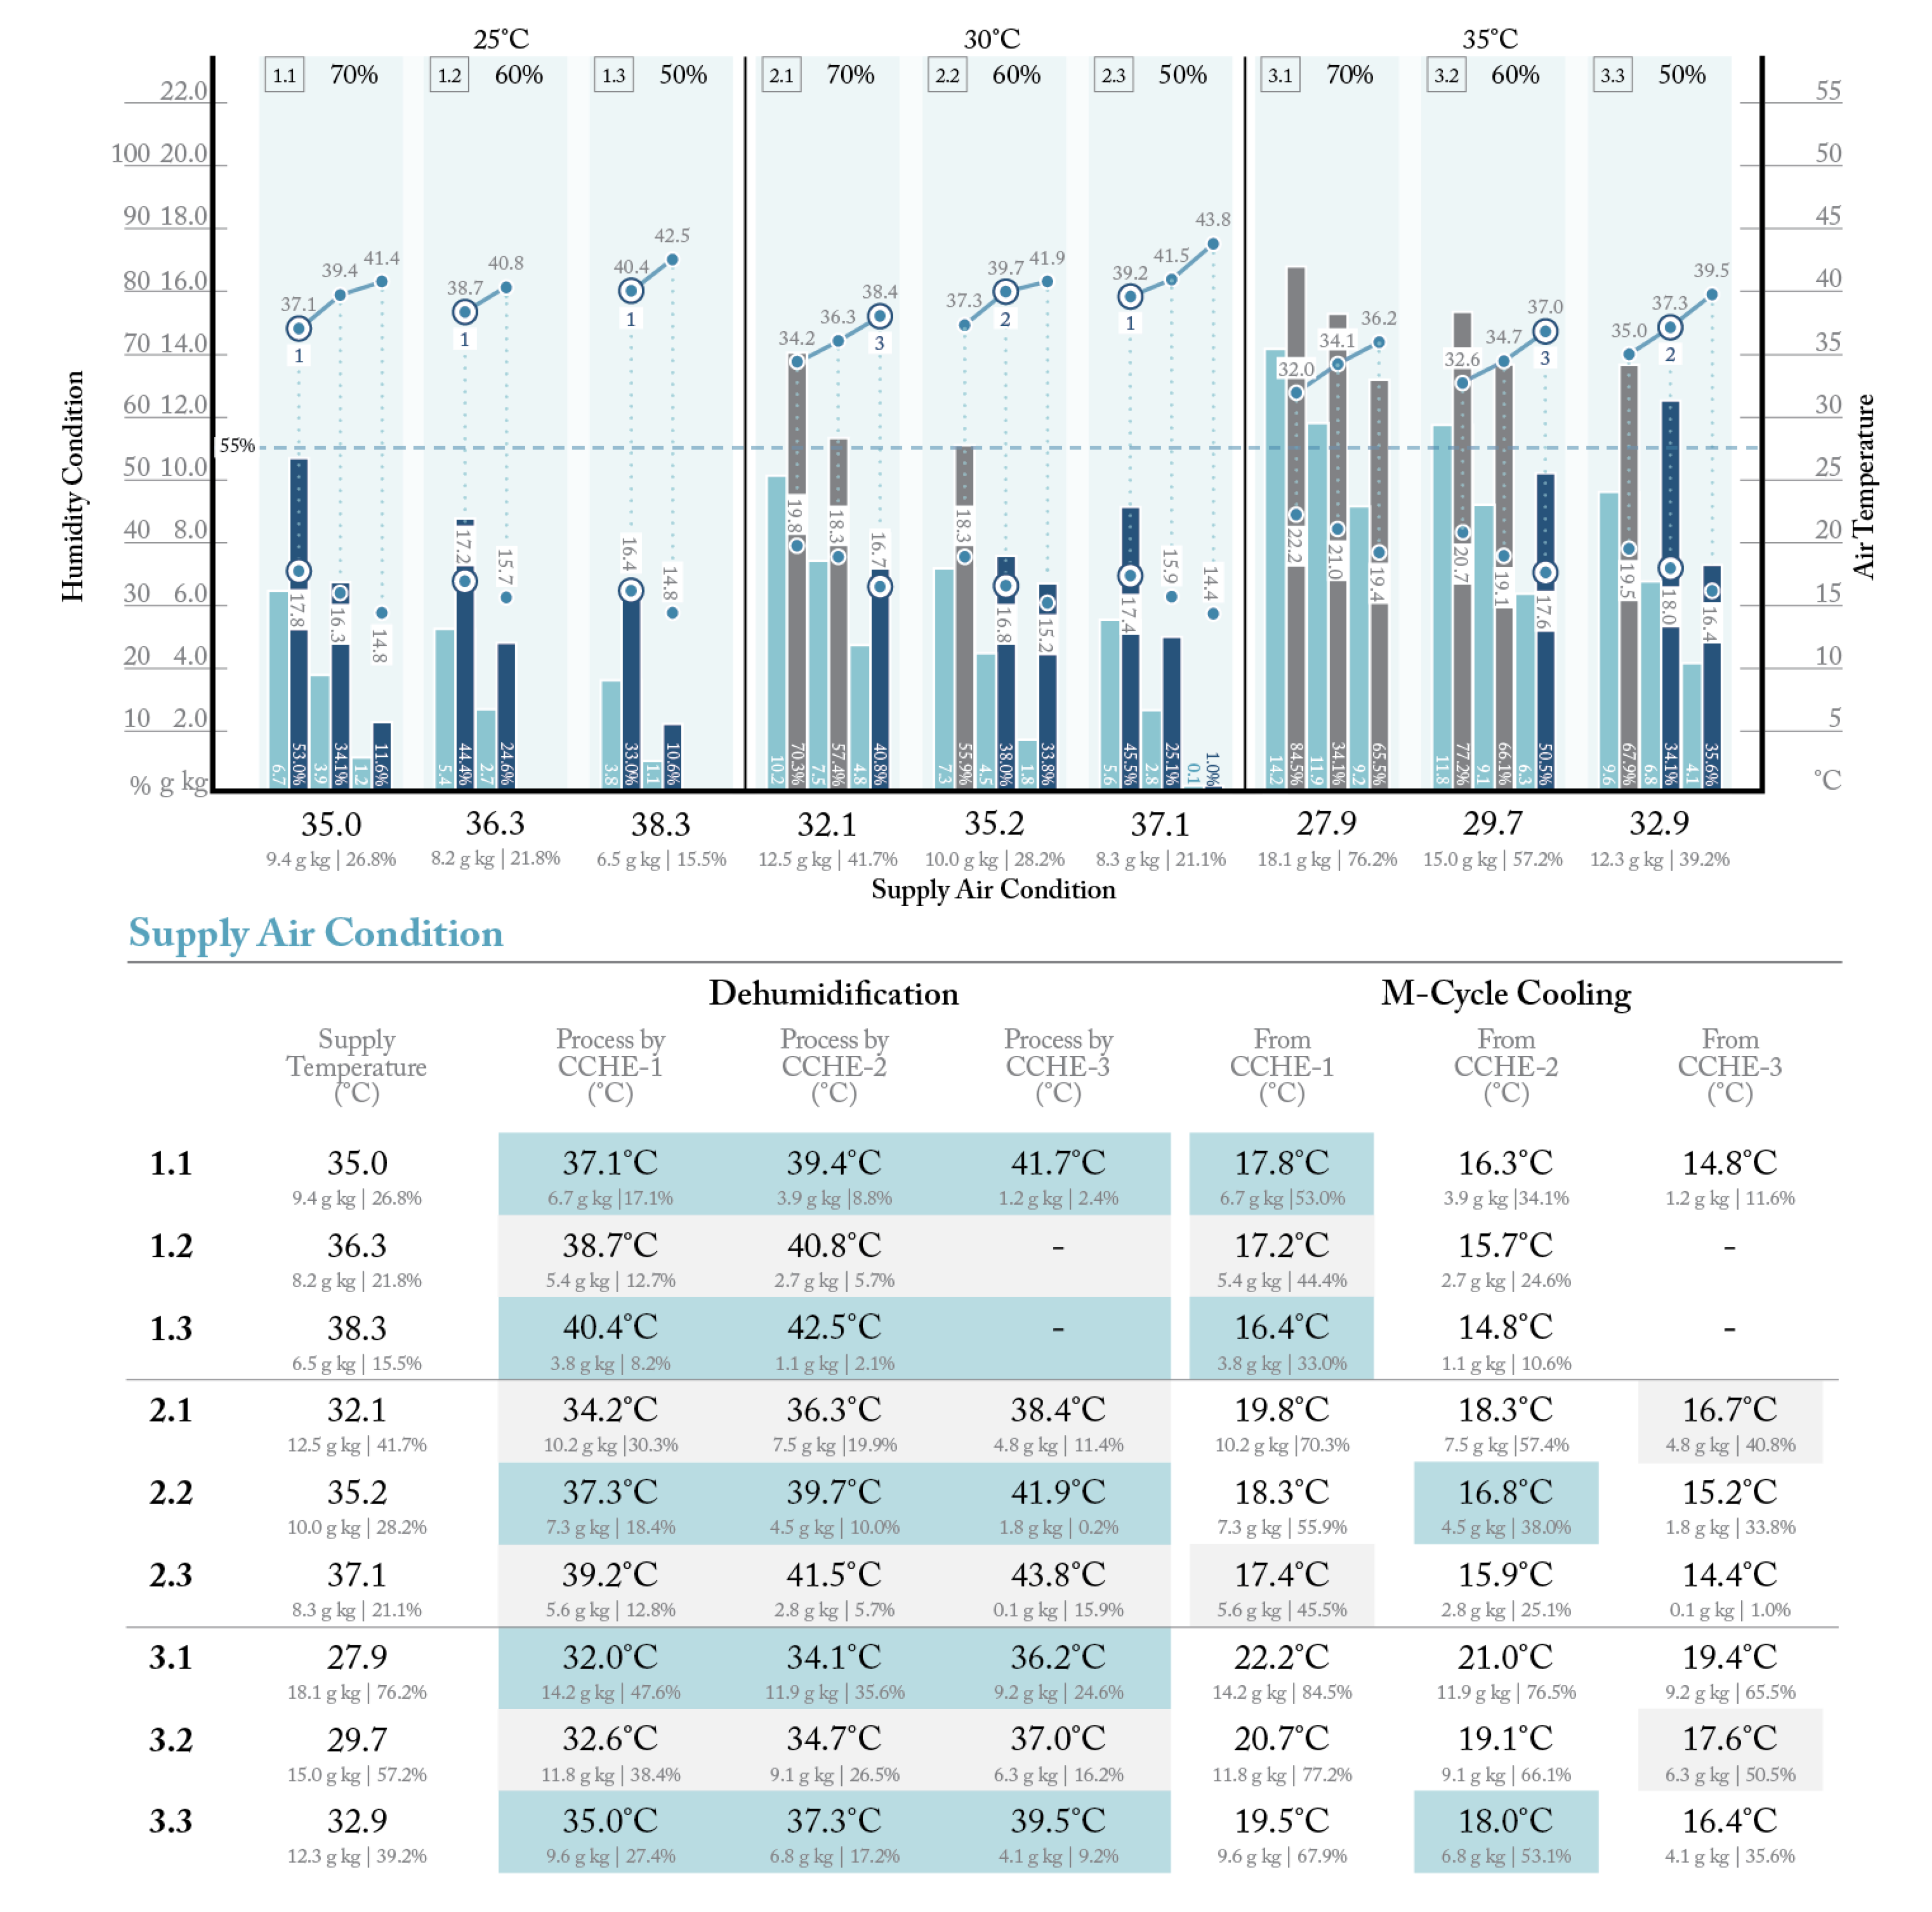
3.4.1. Supply Air Condition
From Figure 12, the results of the calculation show that the system is operable in all ambient conditions except for scenario 3.1. Despite being processed through three CCHEs, the relative humidity levels were still relatively high at 65.5%. On the other hand, four scenarios (1.1; 1.2; 1.3; 2.3) could be satisfied by only one CCHE, two scenarios by two CCHEs, and two scenarios by three CCHEs. It should also be noted that the variation between the highest supply temperature and the lowest supply temperature is at ± 1.6 °C from the temperature range of 16.4–18.0 °C, thus allowing the supply air to be supplied at a relatively constant temperature.
3.4.2. Cooling Load and Volume Flowrate Simulation
The supply air condition was used as an input parameter to re-evaluate the effect of the proposed façade in the room condition. The result of the calculation is mapped in Figure 13. Due to the relatively constant supply temperature, the design cooling loads show minimal differences, ranging from 69.1 to 77.1 kW. In comparison to the primary calculation, it could be concluded that the design cooling load corresponds relatively with the increasing supply temperature. Furthermore, a similar conclusion could be drawn regarding the volume flowrate, as it relatively corresponds with the air’s absolute humidity. In which the volume flowrate would decrease as the absolute humidity decreases. This resulted in a volume flowrate requirement between 2.3 and 3.0 m3/s. Due to the lower volume flowrate requirement, the air change rate also decreases; therefore, additional fresh air ventilation is required in cases where the air change rate falls below 1.75 ach.
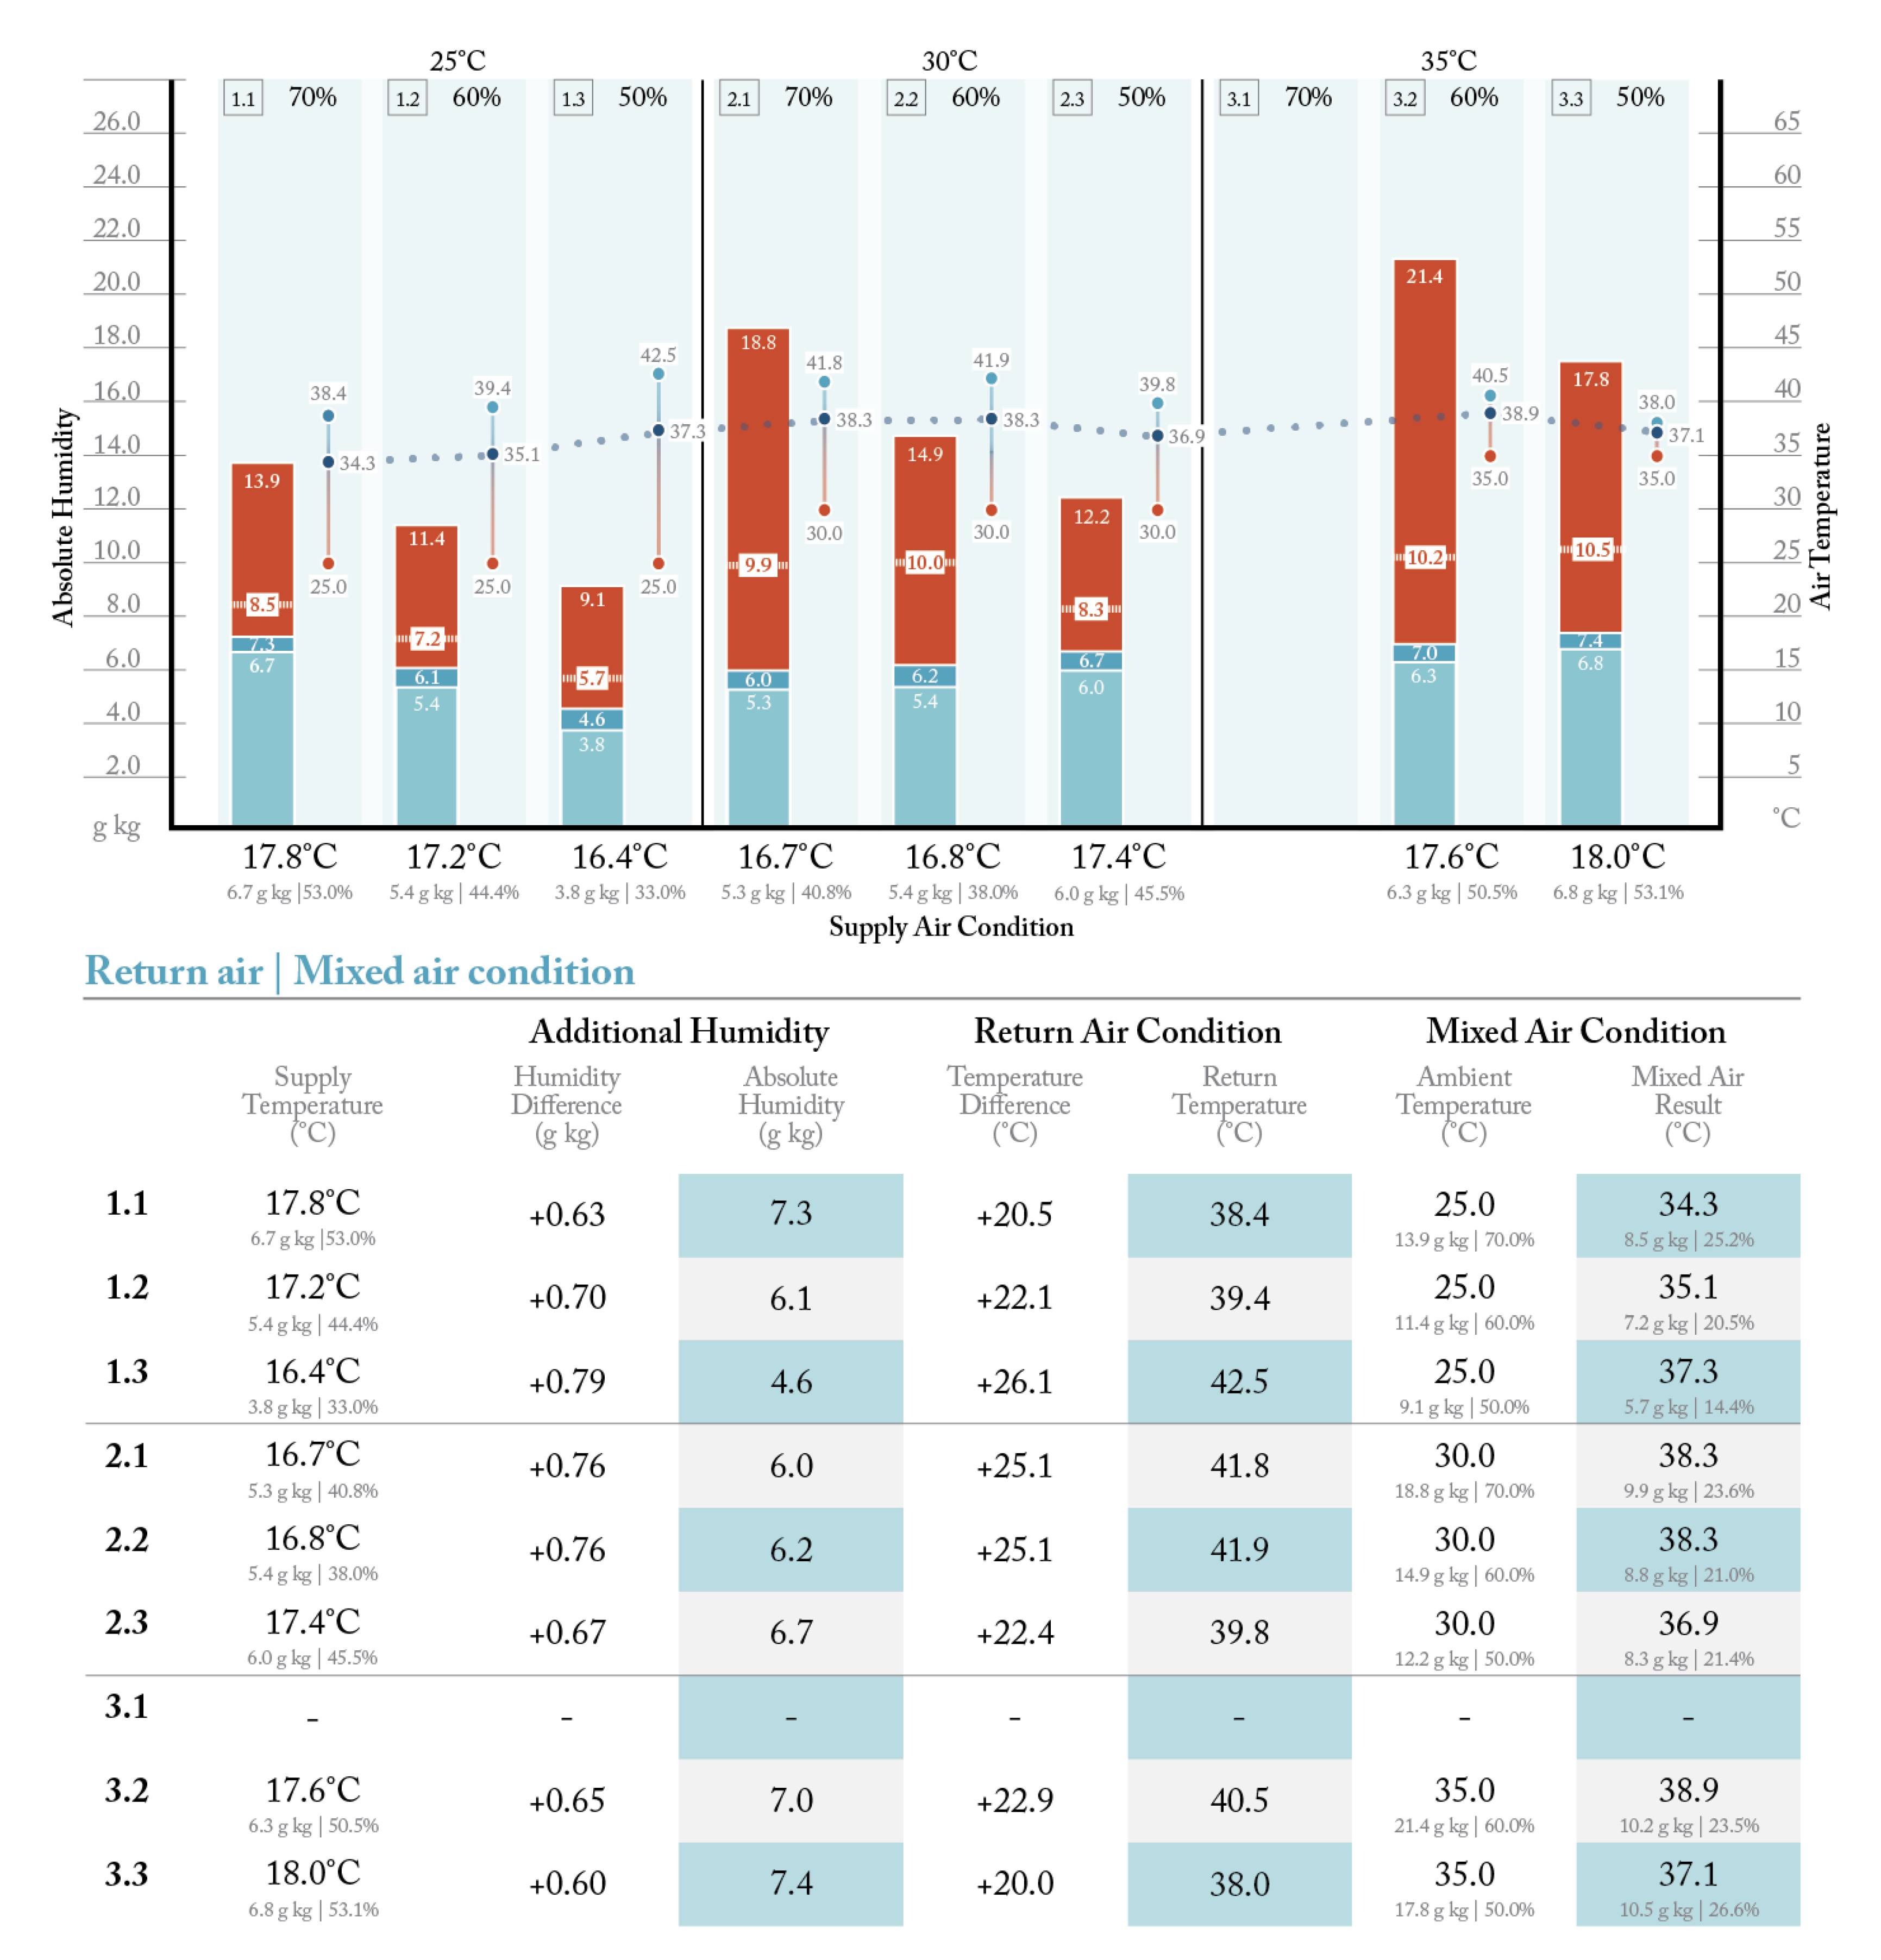
3.4.3. Return Air and Mixed Air Condition
A similar procedure as the primary calculation has been conducted to calculate the return air and the mixed air condition for the next cycle shown in Figure 14. Due to a more constant cooling load and volume flowrate requirements, the temperature variation of the return air reduces, as the return temperature ranges from 38.0 to 41.9 °C. Therefore, the mixed air temperature also shows minimal variations, ranging from 34.3 to 38.3 °C. Moreover, it should be noted that, in comparison to the primary calculations, the mixed air temperature rose up noticeably, while the absolute humidity levels are reduced due to the supply air condition with lower temperature and humidity levels.
3.4.4. Cross Referencing with Hourly Ambient Data
The results of the calculation showed that the proposed system was operable under most ambient scenarios except for the ambient condition at 35 °C|70% RH due to the high relative humidity of the supply air at 65.5%. To evaluate the performance of the system, the number of the required desiccant systems (CCHEs) is cross-referenced with the ambient hourly data in Table 11. Due to limited experimental data regarding the performance of the desiccant system in some scenarios, the data are categorized under inoperable/limited information. From the results, it could be assessed that with one CCHE, the system is effective 14.9% annually. As expected, due to the hot and humid ambient condition of Bangkok’s climate, it would require additional dehumidification and cooling. Therefore, with an additional CCHE coupled, the effectiveness rate drastically increases by 40.4%. Moreover, since the majority of Bangkok’s ambient condition falls under the 30 °C|70% RH category when three CCHEs are coupled, the system effectiveness can cope with indoor requirements during 82.7% of the year. Based on the calculation, it could be further predicted that an ambient condition with low temperature and humidity (highlighted in blue) could also be processed by the system. Under this assumption, with three CCHE components, the system will be able to handle 347 additional hours, coping with the demands 91.3% of the year. Based on this assumption, it is recommended that the system should be equipped with three CCHEs to be able to handle Bangkok’s condition all year round.
3.5. Energy Consumption Assessement
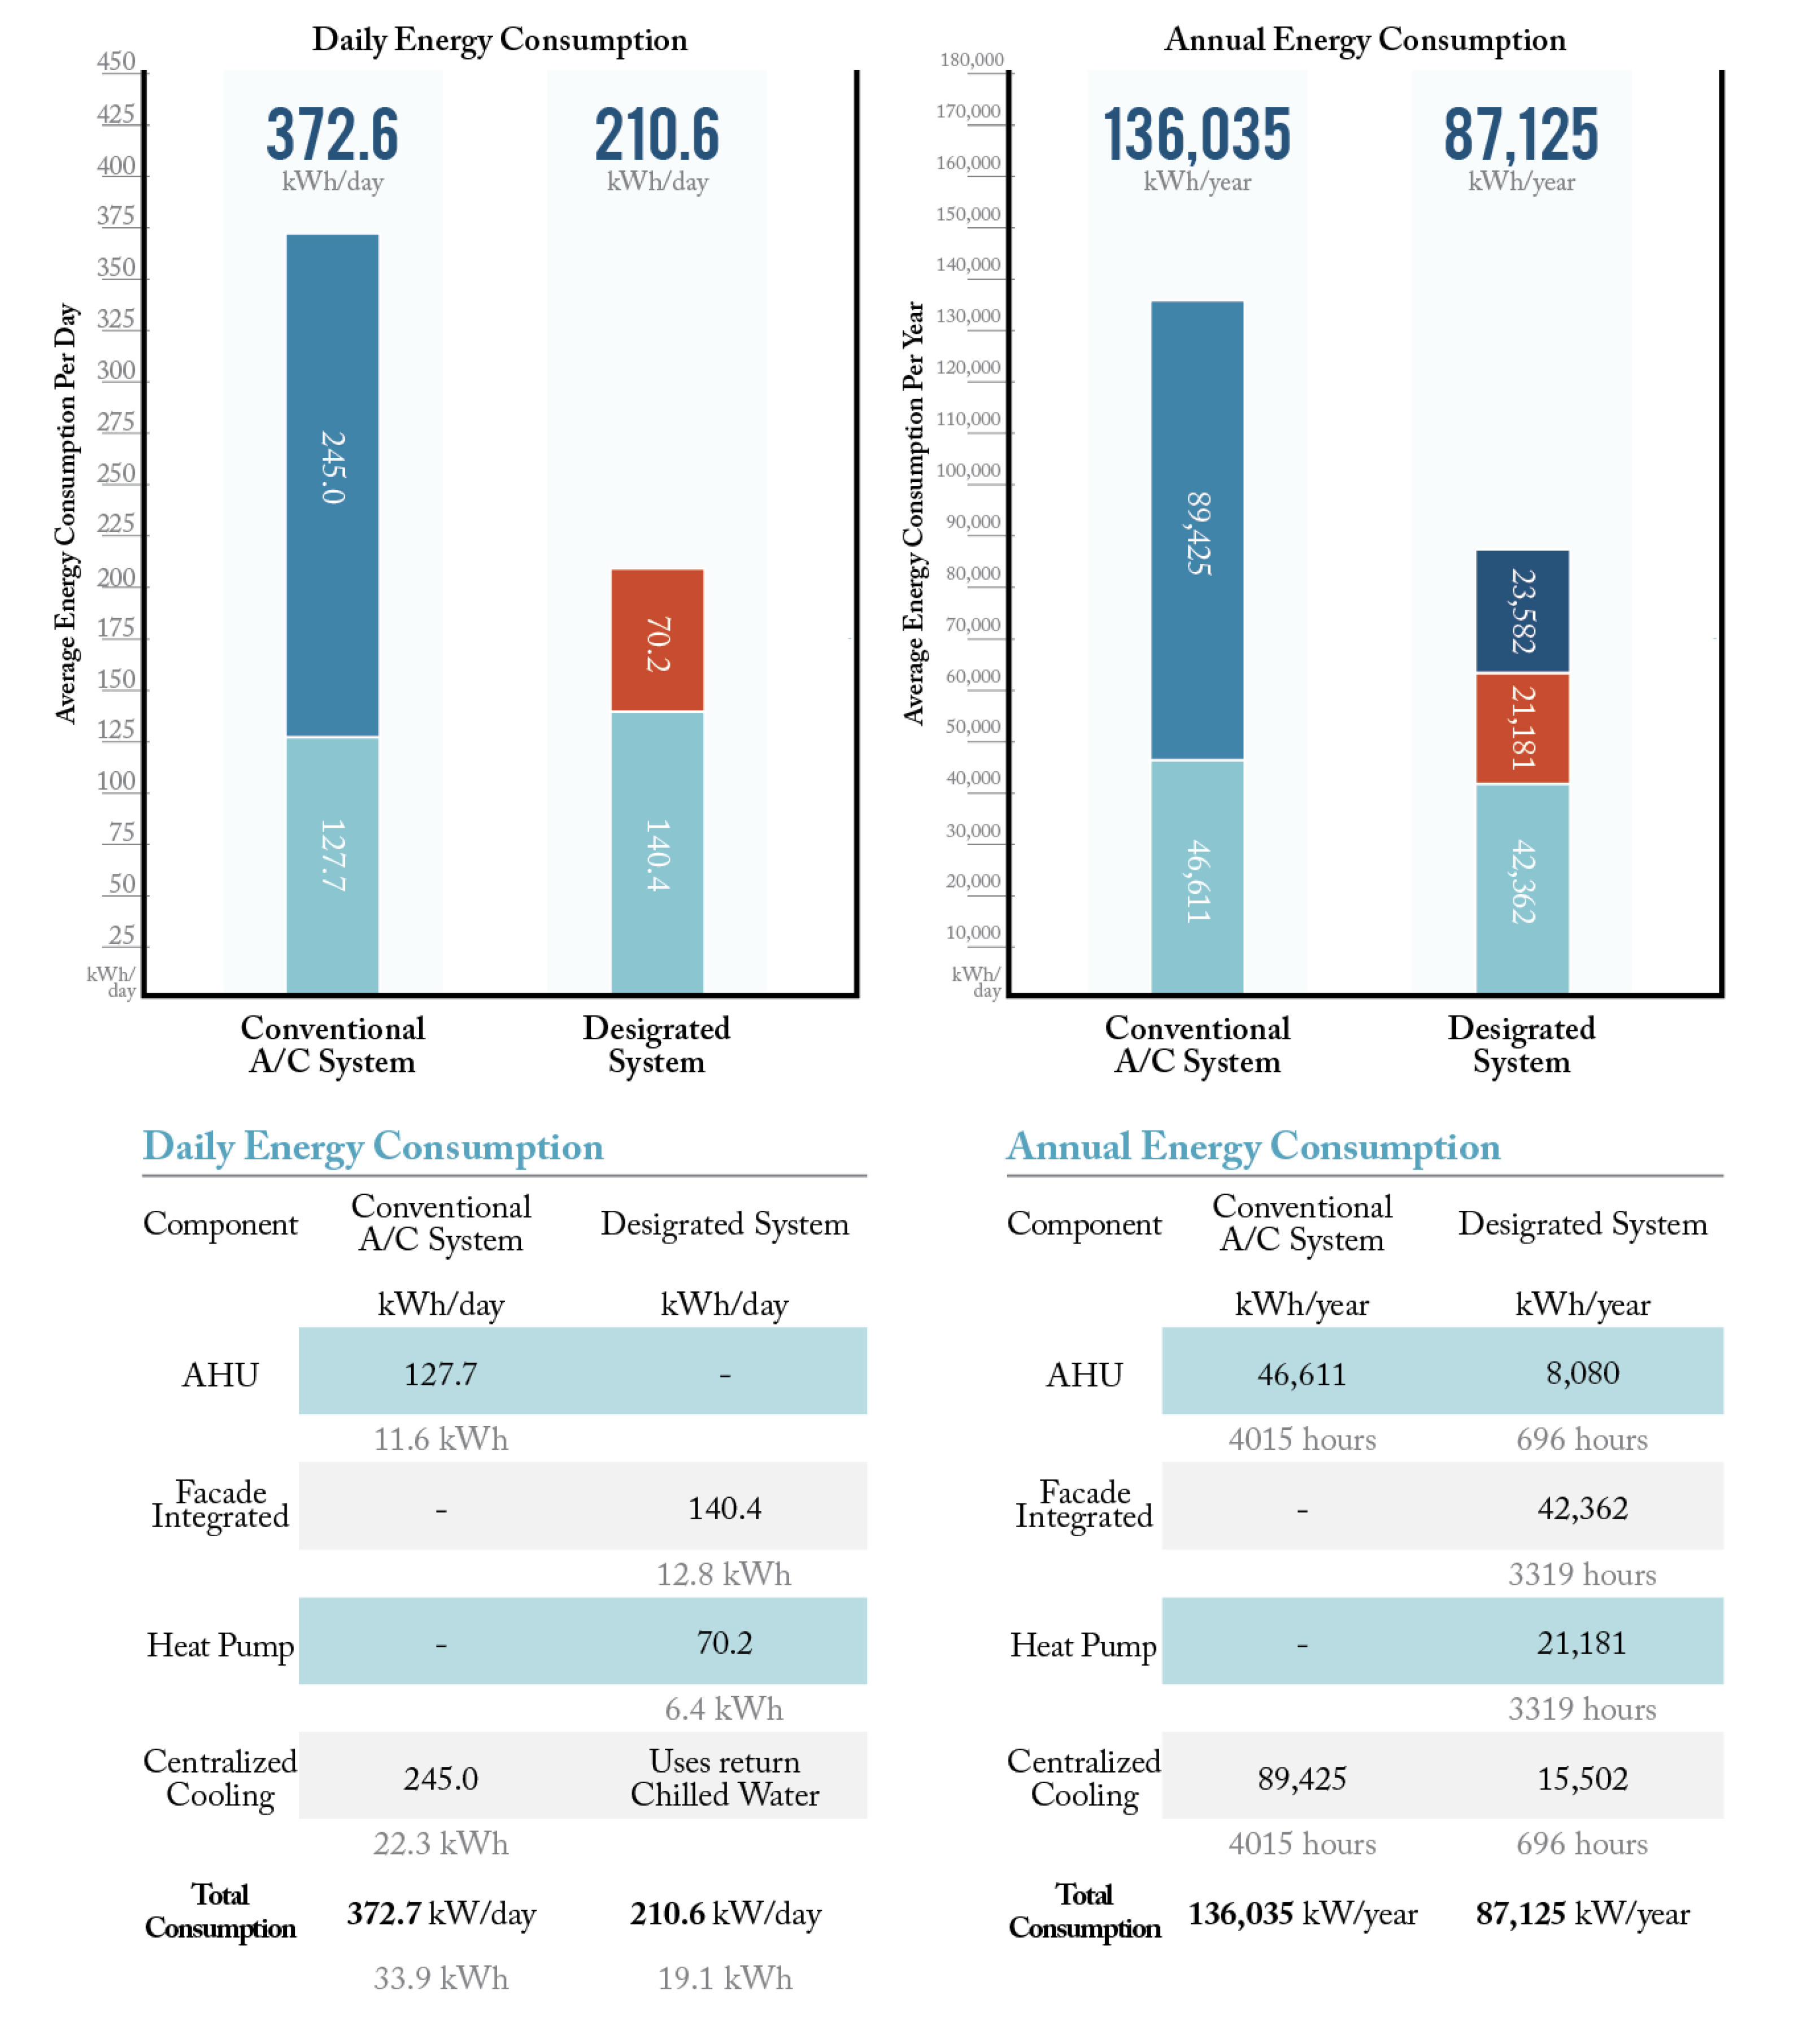
To elaborate on the energy requirements of the system, the annual thermal energy demands were assessed, based on the number of hours in which the system can operate. The number of the required desiccant systems was cross-referenced with the ambient hourly data. With 3319 operable hours, the system requires 2862.9 kWh/year which could be averaged to 9.5 kWh/day. Further calculations have been made to determine the energy needed for the water to be heated up with a heat pump system. Owing to its high COP of 3.5, the total energy consumption required annually is accounted to 818 kW/day, lowering its daily requirement to 2.7 kW/day. When combined with the electricity necessary to operate the façade system, the required energy will be summed up to 8.1 kWh/day per facade module. Based on the benchmark floor area, a maximum of 26 façade modules could be integrated into the floor. Therefore, the total energy required to operate the system would be accounted to 210.6 kWh/day. Considering the 19th floor, the conventional A/C system operates with two AHU, which requires 127.7 kWh/day for supplying the air. Moreover, the centralized system required 245 kWh/day to provide chilled water for the AC circuit on the 19th floor. Therefore, the total energy needed by the conventional system would sum up to 372.7 kWh/day.
With 26 proposed façade modules, the “Desigrated” system requires 210.6 kWh/day to operate. The energy required by the façade integrated components (fans and blowers) is accounted for 140.4 kWh/day. Moreover, since hot water is necessary for regenerating the CCHEs, 70.2 kWh/day is consumed by a central heat pump. It should be addressed that since the cold water required by the system will be taken from the return chilled water, no extra energy is required.
Two major conclusions could be drawn from the results illustrated in Figure 15. When considering solely the energy consumption of the air supply components (AHU and façade integrated components), the results show that the “Desigrated” system has 64.9% higher energy consumption due to additional components. However, when the whole system is being assessed, the calculation shows a 43.4% energy reduction. The reduction is due to the usage of return chilled water from the conventional system, which saves up to 245 kWh/day.
Furthermore, the annual energy consumption of the system was calculated, based on its operable hours. With 3319 operable hours, 42,362 kWh/year are required for both the façade integrated components and the heat pump. However, additional energy of 23,582 kWh/year will be required for a back-up A/C system for the 696 h where the system cannot be operated due to the exceeding level of ambient relative humidity. Due to the use of the back-up A/C system, the total annual energy required sums up to 87,125 kWh/year, which slightly reduces the predicted energy savings from 43.4% to 36%.
3.6. PVT Design and Configurations
The results from the evaluation have shown that the “Desigrated” system (using the heat pump as a hot water source) has the potential to reduce 43.4% of the energy consumption, in comparison with a conventional air-conditioning system. However, its efficiency could be further increased by acquiring thermal and electrical energy through the means of PVs and PVTs. In order to study this, six design concepts have been introduced, seeking to explore the overall system’s potential for self-sufficiency (Table 12).
The variation in the schemes is based on three main aspects including the balance between the usage of PV and PVT elements, cell coverage density, and a balanced operation between the PV/PVT system and the heat pump system. The variation offers a wide range of options for the user/designer to pursue, from a net-zero approach or the freedom to create a pattern according to the intention of the designer. The energy requirements are based on the calculation from the previous chapter, while the energy production calculation considers five façade modules on the north and south orientation and eight on the east and west orientation.
The first three concepts are explored with the implementation of the PVTs system, allowing thermal and electrical energy to be generated by the façade. With 100% PVT coverage in Concept 1, 392.5 kWh thermal energy could be produced daily. This exceeds the required thermal energy of 247 kWh by 146 kWh per day. However, due to the limited efficiency in terms of electricity production, 61.2 kWh/day is still needed. Nevertheless, Concept 1 shows the highest energy reduction potential with the potential to reduce energy consumption further by 71%. Concept 2 and 3 share a similar approach, in which the PVTs will only be installed at the bottom of the façade frame and on top of the air supply unit, while PV elements are installed in the other areas. The approach fails to provide sufficient thermal energy; therefore, 41.4 kWh/day is required for the heat pump. This reduces the efficiency of the system, as its energy reduction rate decreases to 42% and 28%, respectively. However, the concepts possessed higher transparency and flexibility in terms of design as the designers could adjust the cells patterns according to their potential design intention.
Concept 4 to 6 only consider PV panels, aiming to provide higher transparency and design versatility. It should be addressed that Concept 5 with 89% cell coverage is introduced to investigate the energy reduction potential if sufficient electrical energy could be generated to operate the heat pump. Corresponding the elimination of the PVTs system in Concepts 4 to 6, the efficiency of the system reduces drastically. With 100% cell coverage, the PV system can reduce energy consumption by 28% and still requires 151.9 kWh/day for its operation. However, the transparency of these elements should be carefully assessed, as minimizing the PV coverage area would reduce the shading capacity of the shading components.
4. Discussion
The “Desigrated” concept explored the possibilities of integrating a desiccant system coupled to an indirect evaporative cooler as façade components. The results have shown that it has the potential in reducing the cooling loads and energy consumption of a specific benchmark building, with a general possibility for implementation in other buildings in hot and humid climates. However, there are numerous limitations and recommendations which could be further elaborated and discussed. These aspects include limitations of performance, system operation scheduling, solar radiation analysis, and the integration scheme of the PV/PVT components.
4.1. Limitations of Performance
Due to the current efficiency of the systems, the “Desigrated” system still fails to achieve its ultimate goal in eliminating the use of refrigerants altogether in the cooling processes. To operate under high temperature and humidity scenarios, the system still requires cold water (15 °C). Therefore, further studies could be conducted considering alternative means of cooling the water needed for its operation.
4.2. System Operation Scheduling
The calculation in this study is based on an assumption of general system scheduling, focusing mainly on using either conventional air condition or the “Desigrated” system individually. Therefore, further analysis and calculation could be made to analyze the optimal operation schedule where both systems could operate simultaneously.
4.3. Solar Radiation Analysis
The solar radiation analysis was based on the average value of annual solar exposure due to low variation throughout the year. Therefore, to achieve more precise results, studies of solar radiation on a daily basis should be conducted. This result could be used to optimize the dependency of a heat pump, which could lead to a net-zero application in the future.
4.4. PV and PVT Integration
The concept proposed in this study only provides a few general ideas on façade application. To minimize on-site complications, thorough consideration should be made during the building design stage to generate a fully modular solution. Furthermore, attention on the PV/PVT coverage area should be analyzed, as minimizing the PV coverage area would reduce the shading capacity of the shading components. Therefore, other means of solar prevention, such as tinted glass or louver components should be thoroughly considered while designing.
5. Conclusions
The core components of the “Desigrated” system include three composite silica gel-coated heat exchangers (CCHE) connected in series and an M-cycle indirect evaporative system. The dehumidification and cooling capacity of the coupled system, along with a shading strategy, reduced WWR, and insulation, have been proven to provide reductions in the cooling demands and sufficient fresh air supply, under a decentral configuration.
The system configuration consists of two main components; the desiccant coated heat exchanger and the M-cycle unit. The constraints used in the calculations are based on a literature review of previous experiences, and particularly the experimental results of Ge et al. [14], and Riangvilaikul and Kumar [15]. The factors which influence the performance of the system, including the recommended flow velocity and 30% working air ratio, have been assessed and used in determining the system sizing and fresh air ratio scheme. As a result, the optimal airflow cross-section was fixed at 0.25 m2 with a fresh air ratio of 30:70. A further preliminary calculation has shown that the system requires three CCHEs to provide supply air with a relative humidity of 55%.
The integration of PVT and PV elements has been studied. Results of the simulation and calculation show that a horizontal arrangement was the optimal orientation for the PV/PVT application. However, the tilt angle varies according to the orientation of the building. The PVT component coverage area of 6.5 m2 provided sufficient thermal energy for the minimal hot water requirement of 60 L/hr on all orientations except the north façade. However, due to the low-efficiency rate of the PV panels, the scheme fails to satisfy the electrical requirements of the façade system, being able to supply an average of 47% of the required electricity.
The system configuration was developed within a modular frame which provides broader application possibilities. With this configuration, three CCHE components and an M-cycle unit require at least 180 m3/hr. of hot and cold water to operate, while the fan and blower system require 5.4 kWh/day. Since PVT integration fails to provide sufficient thermal energy for hot water, the implementation of a heat pump was considered. Owing to its high assumed COP of 3.5, the energy consumption accounts to 818 kW/year, lowering its daily requirement to 2.7 kW/day. When combined with the electricity needed to operate the façade system, the required energy will be summed up to 8.1 kWh/day per module.
To evaluate the “Desigrated” system efficiency, its energy consumption has been assessed and compared with the energy required by a conventional air-conditioning (A/C) system. The benchmark, at the 19th floor of the Krung Thai-Sukhumvit building with a conventional A/C system with two AHU, requires 372.7 kWh/day for the operation, while the 26 proposed façade modules require 210.6 kWh/day to operate. The energy required by the façade integrated components (fans and blowers) is 140.4 kWh/day. Moreover, since hot water is necessary to regenerate the CCHEs, 70.2 kWh/day is consumed by a heat pump.
Two significant conclusions could be drawn from the results. When considering solely the energy consumption of the decentral air supply components, the “Desigrated” system has 64.9% higher energy consumption, compared with common systems. However, when the whole system is assessed, the calculations show a 43.4% energy reduction. The reduction is evident on the annual assessment as the calculation considers the chillers and cooling tower energy requirements. This is mostly due to the recycling of return chilled water from the AHU operation, which saves up to 245 kWh/day. However, when evaluating the system performance based on annual operating hours, the results vary slightly. With 3319 operable hours, 42,362 kWh/year are required for both the façade integrated components and the heat pump. However, additional energy of 23,582 kWh/year will be required for the back-up A/C system for the 696 h, which is inoperable. Due to the use of the back-up A/C system, the total annual energy required adds up to 87,125 kWh/year, which slightly reduces the energy savings from 43.4% to 36%.
The variations explored for PVT integration offer a wide range of options for the user to pursue, from a net-zero approach or the freedom to create patterns according to the intention of the designer. Concept 1 with 100% PVT coverage shows the highest energy reduction with the potential to reduce the energy consumption further by 71%, but due to the limited efficiency in terms of electricity production, 61.2 kWh/day is still required. Moreover, to provide sufficient electricity for the heat pump, a PV system with 89% cell coverage is needed.
It should be addressed that the transparency of these elements should be considered during the early design stages, as minimizing the PV coverage area would reduce the shading capacity of the components. Therefore, other means of solar prevention, such as tinted glass or louver components could be simultaneously considered while designing. Finally, due to the current system’s efficiency, the “Desigrated” system fails to achieve its ultimate goal in eliminating the use of refrigerants altogether. Since cold water at 15 °C is required, the system still depends on a back-up cooling system. Nevertheless, it shows a positive potential in its application as a transition tool, gradually paving the way for a sustainable future.
Author Contributions
Conceptualization, N.S.; investigation, N.S.; supervision, A.P. and C.J.; writing—original draft, N.S.; writing—review and editing, A.P. and C.J. All authors have read and agreed to the published version of the manuscript.
Funding
This research received no external funding and the APC was funded by the TU Delft Open Access Fund.
Conflicts of Interest
The authors declare no conflict of interest.
Glossary
| Symbol | Meaning |
| Q | Cooling Capacity (kW) |
| M | Mass Flow rate (kg/s) |
| Hain | Inlet Enthalpy (kJ kg) |
| Haout | Outlet Air Enthalpy (kJ kg) |
| Tout | Inlet Temperature (°C) |
| Tin | Outlet Temperature (°C) |
| w | Absolute Humidity (g kg) |
| ΔC | Absolute Humidity Differences (g kg) |
| P | Vapor Production |
| n | Ventilation Rate (ach) |
| v | Room Volume (m3) |
| Tsupply | Supply Air Temperature (°C) |
| Treturn | Return Air Temperature (°C) |
| Q | Design Cooling Load (kW) |
| V | Volume Flowrate (m3/s) |
| Cρ | Specific Heat Capacity of Air (kJ/kg K) |
| Xmixed | Mixed Air Humidity Ratio (g kg) |
| Xin | Inlet Air Humidity Ratio (g kg) |
| Xre | Return Air Humidity Ratio (g kg) |
| Qin | Inlet Air Volume (m3/s) |
| Qre | Return Air Volume (m3/s) |
| Tmixed | Mixed Air Temperature (°C) |
| Tin | Inlet Air Temperature (°C) |
| Tre | Return Air Temperature (°C) |
References
- Climate Change: Vital Sign of the Planet. Available online: https://climate.nasa.gov/vital-signs/global-temperature (accessed on 15 January 2020).
- International Energy Agency. The Future of Cooling: Opportunities for Energy-Efficient Air Conditioning; IEA: Paris, France, 2018. [Google Scholar]
- Herzog, T.; Krippner, R.; Lang, W. Facade Construction Manual; DETAIL: Munich, Germany, 2018. [Google Scholar]
- Lechner, N. Heating, Cooling, Lighting: Sustainable Design Methods for Architects; Wiley: Hoboken, NJ, USA, 2015. [Google Scholar]
- Goetzler, W.; Guernsey, M.; Foley, K.; Young, J.; Chung, G. Energy Savings Potential and RD&D Opportunities for Commercial Building Appliances; Navigant Consulting Inc., Prepared for US Department of Energy: Washington, DC, USA, 2014. [Google Scholar]
- Henning, H.-M.; Döll, J. Solar Systems for Heating and Cooling of Buildings. Energy Procedia 2012, 30, 633–653. [Google Scholar] [CrossRef]
- Prieto, A.; Knaack, U.; Auer, T.; Klein, T. COOLFACADE: State-of-the-art review and evaluation of solar cooling technologies on their potential for façade integration. Renew. Sustain. Energy Rev. 2019, 101, 395–414. [Google Scholar] [CrossRef]
- Avesani, S.; Hallström, O.; Füldner, G.; Fedrizzi, R. Integration of Sorption Collector in Office Curtain Wall:Simulation Based Comparison of Different SystemConfigurations. In Proceedings of the ISES Conference Proceedings; International Solar Energy Society, Aix-les-Bains, France, 16–19 September 2014. [Google Scholar]
- Bonato, P.; D’Antoni, M.; Fedrizzi, R. Integration of a Sorption Collector Coupled with a Decentralized Mechanical Ventilation Unit in Curtain Wall Module. In Proceedings of the 11th Conference on Advanced Building Skins, Bern, Switzerland, 2–3 October 2016. [Google Scholar]
- Finocchiaro, P.; Beccali, M.; Gentile, V. Experimental results on adsorption beds for air dehumidification. Int. J. Refrig. 2016, 63, 100–112. [Google Scholar] [CrossRef]
- Colliers International Thailand Research Market Report—Bangkok Office 1Q 2018. Available online: http://news.colliers.com.cn/files/2018/docs/Thai.pdf (accessed on 15 January 2020).
- Hill, T. Freezing in the Tropics: Asean’s Air-Con Conundrum; Eco-Business, 2018; Available online: https://k-cep.org/wp-content/uploads/2018/01/freezing_in_the_tropics.pdf (accessed on 15 January 2020).
- Wood, A. Sustainability: A New High-Rise Vernacular? Struct. Des. Tall Spec. Build. 2007, 16, 401–410. [Google Scholar] [CrossRef]
- Ge, T.S.; Cao, W.; Pan, X.; Wang, R.Z. Experimental investigation on performance of desiccant coated heat exchanger and sensible heat exchanger operating in series. Int. J. Refrig. 2017, 83, 88–98. [Google Scholar] [CrossRef]
- Riangvilaikul, B.; Kumar, S. An experimental study of a novel dew point evaporative cooling system. Energy Build. 2010, 42, 637–644. [Google Scholar] [CrossRef]
- Ministry of Interior of the Kingdom of Thailand. Ministerial Regulation No.39, B.E.2537 (1994), Issued in Accordance with The Building Control Act, B.E.2522; Ministry of Interior of the Kingdom of Thailand: Bangkok, Thailand, 1979. [Google Scholar]
- Jiang, Y.; Ge, T.S.; Wang, R.Z.; Hu, L.M. Experimental investigation and analysis of composite silica-gel coated fin-tube heat exchangers. Int. J. Refrig. 2015, 51, 169–179. [Google Scholar] [CrossRef]
- Ebmpapst Centrifugal Fans and Blower Version 7. 2012. Available online: http://www.farnell.com/datasheets/1817068.pdf (accessed on 15 January 2020).
Figure 1.
Schematic diagram of a composite silica gel heat exchanger (CCHE).

Figure 2.
Schematic diagram of the M-cycle system based on Riangvilaikul and Kumar experiments [15].
Figure 2.
Schematic diagram of the M-cycle system based on Riangvilaikul and Kumar experiments [15].

Figure 3.
The Krung Thai Bank (KTB)-Sukhumvit building, a representation of a typical Bangkok office building which is used as a benchmark in this study.
Figure 3.
The Krung Thai Bank (KTB)-Sukhumvit building, a representation of a typical Bangkok office building which is used as a benchmark in this study.

Figure 4.
Façade design concept.

Figure 5.
Façade system configuration.

Figure 6.
Psychometric chart of mixed air calculation. (a) Concept 1, (b) Concept 2.

Figure 7.
Design alterations of PVT integrations with an optimized tilt angle. (a) Concept 1: horizontal scheme, (b) Concept 2: vertical scheme, (c) Concept 3: horizontal + vertical scheme, (d) Concept 4: additional horizontal scheme.
Figure 7.
Design alterations of PVT integrations with an optimized tilt angle. (a) Concept 1: horizontal scheme, (b) Concept 2: vertical scheme, (c) Concept 3: horizontal + vertical scheme, (d) Concept 4: additional horizontal scheme.


Figure 8.
Annual average solar radiation exposure per m2 and the annual total solar radiation exposure.
Figure 8.
Annual average solar radiation exposure per m2 and the annual total solar radiation exposure.

Figure 9.
Primary calculation: upply air condition.

Figure 10.
Primary calculation: cooling load and volume flowrate simulation.

Figure 11.
Primary calculation: mixed air and return air condition.

Figure 12.
Secondary calculation: supply air condition.

Figure 13.
Secondary calculation: cooling load and volume flowrate simulation.

Figure 14.
Secondary calculation: return air and mixed air condition.

Figure 15.
System’s energy consumption assessment.


Table 1.
Composite silica gel heat exchanger (CCHE) constraints [14].
Table 1.
Composite silica gel heat exchanger (CCHE) constraints [14].
| Cooling Water (°C) | Heating Water (°C) | Water Volume (L/h) | Inlet Air Temperature (°C) | Relative Humidity (%) | Flow Velocity (m/s) | Cycle Period (mins) |
|---|---|---|---|---|---|---|
| 15 | 50 | 200 | 30 | 70 | 1.54 | 10 |
Table 2.
Fixed parameters used in the Design Builder simulation.
| Floor Area (m2) | Floor Volume (m2) | Occupancy (ppl/m2) | Cooling Setpoint Temp. (°C) | Metabolic Rate (met) |
| 695 | 2430 | 0.11 | 25.5 | 0.9 |
| Office Equipment (W/m2) | Lighting (W/m2) | Humidity Control | Cooling Limit Type | |
| 11.77 | 2.5 | Constant Supply Humidity Ratio | Limit Flowrate/capacity |
Table 3.
Material layers of the façade of the benchmark building for the Design Builder simulation.
| Exterior Wall | Openings | ||||
|---|---|---|---|---|---|
| Layer | Material | Thickness | Layer | Material | Thickness |
| Layer 1 | Aluminum Cladding | 0.4 mm | Layer 1 | Clear Float Glass | 12 mm |
| Layer 2 | Insulation/Metal Frame | 200 mm | Layer 2 | Air Gap | 6 mm |
| Layer 3 | Concrete Panel | 100 mm | Layer 3 | Clear Float Glass | 12 mm |
Table 4.
Material layers of the proposed façade system for the Design Builder simulation.
| Exterior Wall | Openings | ||||
|---|---|---|---|---|---|
| Layer | Material | Thickness | Layer | Material | Thickness |
| Layer 1 | Aluminum Cladding | 0.4 mm | Layer 1 | Clear Float Glass | 12 mm |
| Layer 2 | Insulation/Metal Frame | 100 mm | Layer 2 | Air Gap | 6 mm |
| Layer 3 | Air Gap | 300 mm | Layer 3 | Clear Float Glass | 12 mm |
| Layer 4 | Insulation/Metal Frame | 100 mm | |||
| Layer 5 | Cement Board panel | 200 mm | |||
| Layer 6 | Aluminum Cladding | 0.4 mm | |||
Table 5.
Hourly weather data of Bangkok between 8.00 and 18.00.
| <22.5 °C | 25 °C | 30 °C | 35 °C | >37.5 °C | ||
| >75% | 6 | 300 | 329 | - | - | 635 |
| 70% | 12 | 99 | 806 | 13 | - | 918 |
| 60% | 22 | 72 | 750 | 374 | - | 1196 |
| 50% | 7 | 55 | 307 | 537 | - | 899 |
| <45% | - | 29 | 136 | 154 | 7 | 319 |
| 6 | 555 | 2328 | 1078 | 7 |
Temperature is considered with ±2.5 °C tolerances. Humidity is considered with ±5% tolerances.
Table 6.
System’s water requirements.
| Cold Water (L/hr) | Hot Water (L/hr) | |||||
| M-cycle | 0.06 | - | ||||
| Case 1 | Case 2 | Case 3 | Case 1 | Case 2 | Case 3 | |
| CCHE | 200 | 155 | 60 | 200 | 155 | 60 |
Table 7.
Electricity Requirements.
| Series | Volume Flowrate (m3/s) | Energy Consumption (kWh) | |
|---|---|---|---|
| Intake Blower | D1G13 | 0.18 | 0.128 |
| Supply Blower | R63310 | 0.42 | 0.171 |
| Fan 1 | R4E255 | 0.18 | 0.037 |
| Fan 2 | R4E400 | 0.60 | 0.117 |
| Fan 3 | R4E255 | 0.18 | 0.037 |
Note: Source [17].
Table 8.
Fresh air ratio comparison.
| 100% Fresh Air | 70:30 | 30:70 | 30:70 * | |||||
|---|---|---|---|---|---|---|---|---|
| Volume Flowrate (m3/s) | Air Velocity (m/s) | Volume Flowrate (m3/s) | Air Velocity (m/s) | Volume Flowrate (m3/s) | Air Velocity (m/s) | Volume Flowrate (m3/s) | Air Velocity (m/s) | |
| CCHE | 0.18 | 1.54 | 0.18 | 1.54 | 0.09 | 1.08 | 0.18 | 1.54 |
| Return Air | - | - | 0.08 | 0.67 | 0.20 | 1.67 | 0.42 | 1.67 |
| Mixed Air | 0.18 | 1.54 | 0.26 | 2.16 | 0.29 | 2.40 | 0.60 | 2.40 |
| Conditioned Air | 0.13 | 0.97 | 0.18 | 1.54 | 0.20 | 1.08 | 0.42 | 1.68 |
| Working Air | 0.05 | 0.27 | 0.08 | 0.44 | 0.09 | 0.5 | 0.18 | 0.48 |
| Exhaust Air | 0.05 | 0.27 | 0.08 | 0.44 | 0.09 | 0.5 | 0.18 | 0.48 |
Notes: * M-cycle cross-section = 0.25 m2.
Table 9.
Design concept summary.
| Performance Aspect | ||
| Maximum Air Supply Capacity (m3/s) | Maximum Return Air Supply Capacity (m3/s) | Maximum Fresh Air Supply Capacity (m3/s) |
| 0.42 | 0.18 | 0.18 |
| Application Aspect | ||
| Exterior Dimension W × L × H (mm) | Interior Dimension W × L × H (mm) | Air supply Position |
| A: 450 × 2200 × 3500 | 500 × 2200 × 3500 | - |
| B: 150 × 2200 × 3500 | 500 × 1800 × 3500 | At Ceiling Level |
| Application Aspect | ||
| Façade Area Occupied (m2) | Window|Opaque Area (m2) | Window|Wall Percentage (%) |
| 7.7 | 3.80|3.90 | 49 |
| 6.45 | 3.15|3.30 | 49 |
Notes: A: Cooling unit module; B: air supply unit module.
Table 10.
Thermal and electrical energy requirement * assessment.
| N | E | S | W | |
|---|---|---|---|---|
| Energy Production | 8.7 kWh | 13.3 kWh | 15.6 kWh | 13.1 kWh |
| Concept 4 | 1.34 kW/m2 | 2.04 kW/m2 | 2.39 kW/m2 | 2.00 kW/m2 |
| Case 1: Energy Required | −34.9 kWh | −30.3 kWh | −28 kWh | −25 kWh |
| Case 1: Area required | +26.04 m2 | +14.85 m2 | +11.72 m2 | +12.5 m2 |
| Case 2: Energy Required | −25.1 kWh | −22.5 kWh | −18.2 kWh | −20.7 kWh |
| Case 2: Area required | +18.73 m2 | +6.52 m2 | +6.53 m2 | +10.35 m2 |
| Case 3: Energy Required | −4.4 kWh | +0.2 kWh | ±2.5 kWh | ±0.0 kWh |
| Case 3: Area required | +3.28 m2 | - | - | - |
Table 11.
Hourly weather data of Bangkok between 8.00 and 18.00 *.
| <22.5 °C | 25 °C | 30 °C | 35 °C | >37.5 °C | |
| >75% | - | - | - | - | - |
| 70% | - | 2 | 3 | - | - |
| 60% | - | 1 | 2 | 3 | - |
| 50% | - | 1 | 1 | 2 | - |
| <45% | - | 1 | 1 | 2 | - |
Note: * [-] = limited experimental data.
Table 12.
PVT integration concepts.
| Concept 1 | Concept 2 | Concept 3 | ||||
| Panel Type | PVT | PVT | PV | PVT | PV | |
| Coverage Area | 7.7 m2 | 7.7 m2 | 7.7 m2 | 7.7 m2 | 7.7 m2 | |
| Coverage % | 100 | 100 | 100 | 100 | 50 | |
| Thermal Energy/m2 | Electricity Energy/m2 | Thermal Energy/m2 | Electricity Energy/m2 | Thermal Energy/m2 | Electricity Energy/m2 | |
| N | 51.6 | 13.5 | 25.8 | 6.7 | 13.4 | 5.0 |
| E | 125.7 | 24.0 | 62.8 | 12.0 | 32.6 | 8.9 |
| S | 92.0 | 17.7 | 46.0 | 8.9 | 23.9 | 6.6 |
| W | 123.2 | 24.0 | 61.6 | 12.0 | 32.0 | 8.9 |
| Total Energy Production | 392.5 | 79.2 | 196.2 | 39.6 | 101.9 | 29.3 |
| Heat Pump Requirements * | - | 41.4 | 41.4 | |||
| Electricity Reduction Rate | 71% | 42% | 28% | |||
| Concept 4 | Concept 5 | Concept 6 | ||||
| Panel Type | PV | PV | PV | |||
| Coverage Area | 7.7 m2 | 7.7 m2 | 7.7 m2 | |||
| Coverage % | 100 | 100 | 100 | |||
| Electricity Energy/m2 | Electricity Energy/m2 | Electricity Energy/m2 | ||||
| N | 10.0 | 8.7 | 5.0 | |||
| E | 17.8 | 15.5 | 8.9 | |||
| S | 13.1 | 11.4 | 6.6 | |||
| W | 17.8 | 15.5 | 8.9 | |||
| Total Energy Production | 58.7 | 51.0 | 25.5 | |||
| Heat Pump Requirements * | 70.2 | 70.2 | 70.2 | |||
| Electricity Reduction Rate | 28% | 24% | 14% | |||
Note: * kWh per day.
© 2020 by the authors. Licensee MDPI, Basel, Switzerland. This article is an open access article distributed under the terms and conditions of the Creative Commons Attribution (CC BY) license (http://creativecommons.org/licenses/by/4.0/).
Share and Cite
MDPI and ACS Style
Suwannapruk, N.; Prieto, A.; Janssen, C. “Desigrated”-Desiccant Integrated Façade for the Hot-Humid Climate of Bangkok, Thailand. Sustainability 2020, 12, 5490. https://0-doi-org.brum.beds.ac.uk/10.3390/su12135490
AMA Style
Suwannapruk N, Prieto A, Janssen C. “Desigrated”-Desiccant Integrated Façade for the Hot-Humid Climate of Bangkok, Thailand. Sustainability. 2020; 12(13):5490. https://0-doi-org.brum.beds.ac.uk/10.3390/su12135490
Chicago/Turabian StyleSuwannapruk, Natchai, Alejandro Prieto, and Christien Janssen. 2020. "“Desigrated”-Desiccant Integrated Façade for the Hot-Humid Climate of Bangkok, Thailand" Sustainability 12, no. 13: 5490. https://0-doi-org.brum.beds.ac.uk/10.3390/su12135490
Note that from the first issue of 2016, this journal uses article numbers instead of page numbers. See further details here.