Article

A Multi-Criteria Structure for Sustainable Implementation of Urban Distribution Centers in Historical Cities

by
Nayara Louise de Carvalho
1,
José Geraldo Vidal Vieira
1,*,
Paula Nakamura da Fonseca
1 and
Maxim A. Dulebenets
2
1
Production Engineering, CCGT, Federal University of São Carlos, Sorocaba 18052-780, Brazil
2
Department of Civil & Environmental Engineering, Florida A&M University–Florida State University (FAMU–FSU) College of Engineering, Tallahassee, FL 32310-6046, USA
*
Author to whom correspondence should be addressed.
Sustainability 2020, 12(14), 5538; https://0-doi-org.brum.beds.ac.uk/10.3390/su12145538
Submission received: 25 May 2020 / Revised: 5 July 2020 / Accepted: 7 July 2020 / Published: 9 July 2020

Abstract

:
This paper proposes a structure for sustainable implementation of urban distribution centers (UDCs) in historical cities, considering the opinion of the main stakeholders involved in the urban distribution of goods and a set of additional criteria. Based on a survey that was conducted among carriers, traffic wardens, and retailers, a decision hierarchy structure, consisting of the relevant criteria evaluated by various statistical techniques, will be used for sustainable implementation of UDCs. The methodology uses a database collected in the historical center of Ouro Preto, a Brazilian city which contains common characteristics of other Latin American and some European cities that are included in the World Heritage List. This structure is unique, as it is based on a survey among the main stakeholders, and can be applied by logistics operators and local authorities for implementing UDCs to address urban distribution issues, especially in historical cities. However, without loss of generality, the proposed methodology can be adopted for different cities using the appropriate criteria according to the characteristics of the cities.

1. Introduction

The complexity of the urban distribution of goods is shown by the increase in the movement and delivery rate of goods, which result in traffic congestion and negative impacts on the city’s residents and on the environment [1]. In the centers and outskirts of large cities, the issue is even more severe because there is an assortment of small retailers, narrow streets [2] and a high concentration of pedestrians [3], as well as in heritage cities, where there are clusters of historical buildings and tourists [4,5]. In both cases, local authorities have usually implemented regulations, such as delivery time windows, delivery zones, vehicle weight and size, congestion charges, low-emission zones, pick-up deliveries and other restrictions for the central areas [6]. However, in some historical cities, the lack of control methods for the land use and for protection of historical areas is still a problem [4]. A viable solution would be to establish urban distribution centers (UDCs) close to the customers’ location, although at the same time, it challenges governmental regulations incurring high costs. There are many details to be addressed, including the following: (a) What the interests of the main stakeholders involved are; (b) which criteria should be considered.
The relevant stakeholders in the urban distribution of goods include transport operators, local authorities, residents who live in the urban area and retailers. The different interests of these stakeholders contribute to the complexity of the distribution of goods [3], and the engagement of these stakeholders [7] in a workshop can be a key point to meet their needs and to design a better urban freight distribution system [8].
Since this study considers the distribution of goods in dense areas as a challenge [8,9], specifically in historical city centers, substantially occupied with residents and tourists, and with no empty space available for building facilities, some requirements should be listed. The main problem, in this case, is that historical cities usually contain narrow streets which were not originally designed considering cars, trucks and people. Thus, the delivery of goods becomes very challenging, particularly during peak-hours, since there are no parking spots available for transport operations [6]. For each delivery, the freight costs can differ according to the vehicles that were used (in size and weight) and the capacity that was used (in a full truckload or not) [3]. Not to mention that these constraints should respect regulations, such as prohibiting construction, works that do not comply with the architecture of historical cities; the restrictions of load and size of trucks driving into the urban area; the geography of the city and the land; among other aspects that will influence the number of vehicles allowed and the quantity of goods delivered [10].
The objective of the present research is to propose a structure for sustainable implementation of distribution centers in historical cities, considering the opinion of carriers, traffic wardens and retailers. A survey was carried out with these stakeholders to build a decision hierarchy structure, comprising of the criteria evaluated by the statistical techniques to rank these criteria. The data was collected in the historical center of Ouro Preto (Brazil) [5], which contains common characteristics of other Latin American and some European cities that are included in the World Heritage List.
Differently to some participatory approaches [8,9,11,12,13] that involve the stakeholders in a decision-making process interactively, our proposal contributes to the state-of-the-art by providing a generic structure, based on a set of criteria according to the stakeholders’ preferences. While the latest studies have discussed the importance of certain criteria to implement UDCs in historical cities [4,5], including the residents’ opinion, the present study proposes an innovative methodological approach, which is inspired by the statistical techniques and Multiple-Criteria Decision Analysis (MCDA) concepts, to provide a generic structure that can be applied for implementing UDCs in historical cities. The proposed approach directly accounts for the opinions of the main stakeholders involved in urban freight distribution (i.e., traffic wardens who control the local traffic and enforce the legislation; retailers who receive the goods; and carriers who deliver the goods).
The novelty consists in the fact that we use the statistical techniques to incorporate the criteria and respective weights automatically in the proposed structure. In particular, a factor analysis is used to group the criteria, and the weights are assigned, taking into account the ranking of criteria by using the analysis of variance and t-tests. The structure is presented in a generalized form and can be further applied in most historical cities for sustainable implementation of UDCs with some appropriate modifications in terms of the criteria used. Moreover, the structure would be a helpful decision support system for all the relevant stakeholders involved. This paper is structured as follows: Section 2 describes the materials and methods. Section 3 describes the main steps required for developing the structure of the multiple hierarchical decision. Section 4 discusses the outcomes of the case study. Section 5 summarizes the conducted research and proposes some future research directions.

2. Materials and Methods

2.1. The Problem of Selecting the Location of Urban Distribution Centers

A UDC is a facility which is responsible for the transshipment of goods directed to urban areas to consolidate deliveries and provide greater efficiency in the distribution process [14,15]. However, the main problem is to decide how to select one from a potential set of locations of a UDC while considering and satisfying a set of criteria, such as investment costs, proximity to suppliers, legal, and tax implications [16]. Furthermore, it is up to a certain number of decision-makers to determine the number of distribution centers desired and then to decide where to locate them [14]. The decision-makers can, in some cases, choose one or more distribution centers among the potential locations according to different criteria.
Most local authorities agree that UDCs should become self-sustaining in the medium to long term, so that they do not need to provide financial support after the first years of operation [17]. Due to this, the public involvement in financing UDCs is usually explained by the benefits it can generate for citizens and in giving a solution to urban traffic issues. Two major difficulties regarding implementing the UDC are the allocation of costs and benefits and the willingness of transportation companies to cooperate. Both consignees and transportation companies can benefit financially from using a UDC. Its operation, however, incurs costs. The municipality should play a role in bringing the costs and benefits together. A solution could be to run the UDC as a cooperative initiative, including different transportation companies [18].

2.2. Criteria for Selecting a Location for a UDC

The criteria that can be used for selecting a UDC can be classified into five aspects: (a) The economic aspect covers local prosperity via job opportunities (e.g., for drivers, as well as operational and administrative employees of a UDC), more efficient freight distribution systems, currency value, business climate and many others [6,19]; (b) the environmental aspect considers the emission of gaseous pollutants, noise pollution and traffic jams [20,21]; (c) the social aspect includes the accessibility of platforms and their settlement areas, the ability to reduce insecurity and the number of accidents associated with loading and unloading operations [22,23,24]; (d) the operational aspect includes the facilitation of freeing parking spots [24] (p. 579), a reduction in the congestion caused by trucks blocking a street [23]; and (e) the cultural aspect that considers urban traffic and mechanical damages to historical heritage sites, caused by vehicles [25]. These criteria are essential for making the right decision, especially in the case of historical cities, such as the one studied in this paper. Several criteria can be used for selecting the location of a UDC. The criteria that will be considered in this study are summarized in Appendix A (see Table A1) that accompanies this manuscript.
The prevalence of some criteria in relation to others usually comes with trade-offs. For example, although the use of vehicles with alternative energies can reduce environmental impacts, such as air pollution, noise, traffic congestion [1] and less damage to the infrastructure of cities, it may cause several conflicts with pedestrians. Moreover, the transshipment of high-value products in small vehicles, such as bicycles, is prohibited by insurance companies [25]. Another trade-off found is related to location. When UDCs are designed to serve a whole city, the facilities are always located in the city’s perimeters and close to major communication lanes, which can reduce costs. However, in cases where the UDCs were designed to supply a central area within the city, they can be located either inside or outside of it. Likewise, the efficiency of the distribution can be a trade-off. In some cases, a higher rate of occupation of the load capacity is better because fewer vehicles must enter the main city center. However, it can also be more efficient to enter the main center with many smaller vehicles. The agreement regarding efficiency is that no matter the chosen situation, the efficiency of the supply chain can become greater by increasing transparency and improving information flows, by using the right vehicles and most suitable load carriers [18].

2.3. Relevant Approaches to Design Location of Urban Distribution Centers

The location problem of a UDC (inside a city) or logistics distribution centers (outskirt a city) is a complex task, and different criteria and methods could be used to address this task. The location problem for UDCs is classified as a special case of the more general facility location problems [3,26]. There are many different approaches to design the location of UDCs or logistics distribution centers [3,15,21]. However, the approaches for the location of UDCs address different aspects as compared to the approaches for the location of distribution centers outskirts a city. The UDC location problem involves much more aspects, the participation of different stakeholders, as well as social, cultural, and environmental criteria [5,21] beyond the criteria that are related to operational and economic aspects. Multi-criteria decision-making (MCDM) methods which consider a set of different criteria (not only financial criteria [27,28,29]) and the opinion of the engaged stakeholders are generally more appropriate for the identification of UDC locations. These methods can also be used to deal with e-commerce retailers, which face the challenge to fulfill their consumers with a large number of small orders, large assortment, tight delivery schedules, and varying workloads [30].
Some approaches rely on fuzzy TOPSIS theory to select a location for implementing UDCs and address certain qualitative criteria [3,21,26]; however, these studies do not take into account the opinion of stakeholders. On the other hand, the present study will consider a set of surveyed criteria based on the preferences of stakeholders and use the statistical techniques to provide a generic structure to be applied to any alternatives for implementing UDCs in historical cities. The developed structure is expected to offer more freedom in selecting any criteria to be addressed according to the stakeholders. Our approach has some similarities with the multi-actor multi-criteria analysis (MAMCA) and other participatory methods [8,11,12,13,31], which consider a value tree based on the opinion of different stakeholders. However, our hierarchical structure of the decision-making objectives (or criteria) focuses on the “value-focused thinking” approach [32] where the alternatives follow this structure, unlike MAMCA, which first selects the alternatives, and then, the criteria in the decision-making process. Moreover, by applying a set of statistical techniques, this approach needs the input of the relevance of the criteria only, without asking the stakeholders to compare the criteria in pairs, as required by the most of methods. In the meantime, the proposed structure can also be combined with the participatory approaches, including stakeholder engagement workshops (SEWs) [8], when the selection and assessment of criteria and the further potential alternatives have to be evaluated.

2.4. Procedures and Considered Stakeholders

The methodology that was adopted for this research is based on a descriptive survey [33] distributed to the three city logistics agents: Traffic wardens, retailers, and carriers. This research was conducted in Ouro Preto, one of the most famous historical cities in Brazil. The reasons why this city was chosen is because it has a lack of parking spaces and it has specific transport regulations, since it was the first Brazilian city included in the World Heritage List by UNESCO [34]. To aid a sustainable implementation of UDCs, this study was conducted as follows:
(1)
The main criteria that were fundamental for sustainable implementation of UDCs in historical cities, identified based on the literature review, were all included in surveys (see Table A1 in Appendix A);
(2)
The surveys were conducted among the decision-makers, such as carriers, traffic wardens and retailers. The pilot tests were also conducted considering the guidelines that were proposed by Forza [33];
(3)
The results were then observed in a descriptive statistics analysis, analysis of variance, t-tests, and a factor analysis. After that, there results were used for the development of a multiple hierarchical decision structure composed of different criteria. At this point, we used an attribute to measure the performance in relation to the criteria, and the preferential independence among the criteria was checked [32]. A linear value function [35] was used for evaluating each attribute, using a five-point linguistic scale (“0”—no relevance; “25”—marginal relevance; “50”—equal relevance; “75”—great relevance; “100”—considerable relevance).
The data set (step 2) and descriptive analysis (step 3) are the same as the ones used by Reference [5] when investigating the operational, social, economic, cultural, as well as environmental criteria that influence the implementation of a UDC in historical cities.
The data collection procedures varied depending on the logistics agent category. In particular, face-to-face interviews were conducted for retailers and carriers. On the other hand, semi-structured interviews were conducted for traffic wardens. In this research, a set of multiple-choice questions applying a five-point Likert scale (from strongly agree “1” to strongly disagree “5”) were used to determine the importance of each criterion for the UDC implementation (see Appendix A) (The full version of the questionnaire is available upon request to the authors).
To ensure the representativeness of the sample, the population of retailers was obtained from the municipality’s database (557 businesses) and only companies focused on commerce/retail were considered, except for those that work with services of high added value, such as retailing jewelry. A population of 196 retailers was generated after applying this refinement. A finite and known population of retailers was used to analyze the sample [36]. A confidence level of 95% and a standard deviation of 0.5 were considered. A total of 122 retailers were surveyed in this study, considering various sectors (such as textiles, pharmacies, clothing, foodstuffs, etc.). The majority of the interviewed retailers (67%) occupied executive positions (such as managers, partner owners, directors, etc.) and had 13 years of professional experience on average. On the other hand, the population of carriers was unknown. However, a total of 46 questionnaires were obtained from the drivers who had an average of 10 years of professional experience. From the total number of drivers, 63% were employed by carriers, while the remaining 37% were autonomous. All traffic wardens (33) participated in the survey.

3. Developing the Structure of the Multiple Hierarchical Decision

To develop the structure of the multiple hierarchical decision, the criteria are needed to be established for the UDC. This generic structure (see Figure 1) can be applied to any location (i.e., further alternatives), considering different criteria according to the specificities of a city. Figure 1. Shows, from the hierarchical decision structure, the goal of the problem’s decision which is where to locate a UDC, with several criteria (Cx, Cv, Cz) assembled into their indexes.
The steps for developing a decision hierarchy structure to address the problem are:
  • Step 1—Calculating the factors and respective indexes.
As a long list of criteria can be made to represent the problem, it is appropriate to group the criteria. Then, the method of main components was used to extract the factors, which establish similar criteria into the same factor. To compare the different criteria according to the hierarchical decision structure, indexes which summarize the information of each factor extracted were calculated through the weighted average of factor loadings for each criterion, as follows:
I j = i = 1 n b i j   X i j   i = 1 n b i j  
where I is the number of criteria, j is the number of factors, b is the factor loading, and X is the variable for each factor. Therefore, each Ij represents a group of similar criteria, and W represents the weights. The criteria are represented by Cxj, Cvj, Czj; where j = 1 to n, and x, v, z refer to different groups of criteria (Figure 1).
  • Step 2—Comparing the indexes/criteria and assignment of weights.
The weights were obtained by the ranking of indexes/criteria (from more important to less important, in their level). To do this, first, we compared the averages of pairs of indexes or criteria. To compare whether a criterion or an index (in their level) has a greater average than the other, the t-test for paired samples was carried out. The Kolmogorov-Smirnov test for normality must show that the indexes/criteria are normal, in their classes, at 1 percent statistical significance, which makes the paired t-test useful. The null hypothesis H0 was as follows: “The average of two indices/criteria is equal”. If H0 is rejected, it can be said that an index/criterion has a greater or smaller average than the other. If there was no statistical significance in the average between the indexes/criteria (in pairs), the one-sample t-test was applied to compare each criterion/index to a fixed value, and then to determine the greater average for each index and criterion. It may be relevant to verify the intensity and also to validate, with statistical significance, the measures (averages) among variables. This relevance may bring up nuances regarding the criteria to be considered in the decision hierarchy structure.
It is important to mention that each criterion and index will be given a specific weight (Wc and Wi), according to the level of importance assigned by the general evaluation of all the stakeholders. Any alternative can be added and evaluated by this structure.

4. Results

The city chosen to apply the proposed hierarchical decision structure is represented by the city of Ouro Preto, which has a relatively small number of trucks, combinations of high demand for the delivery of goods and limited parking spaces that increase logistics and social costs. As a result, transport operators have to search for the nearest parking spots for the supply destination or park illegally (most common). In both cases, there is a high delay in delivery, additional fuel consumption, and parking fine costs resulting in heightened levels of stress [6]. From the social perspective, there are also issues concerning the damage to the infrastructure of the historical heritage, increase in greenhouse gas emissions by vehicles and other types of pollution (air, visual, noise). Therefore, to find an efficient and effective solution for the distribution system, interviews with local authorities, such as the mayor’s secretary, the traffic warden commander and the coordinator of the Commercial and Business Association, were conducted. According to these stakeholders, the city has been facing these issues since 2008, and the idea of implementing UDCs is still being considered.

4.1. Prioritizing the Criteria Based on Stakeholders’ Opinion

This section follows the steps described in Section 3, and all the variables that were considered in the analysis are described in Appendix A (Table A1). The variables that were identified as the most important by all the stakeholders involved, based on their original scores, were: ‘parking spots’ (C1), ‘vehicle size’ (C4), ‘use of technology’ (C14), ‘service level’ (C15), ‘visual pollution’ (C10), and ‘professional qualifications’ (C3). In other words, these six variables can be considered as important criteria for implementing a UDC in historical centers. It is interesting to note the inclusion of ‘visual pollution’ on this list. We can infer that the stakeholders recognize the importance of reducing the number of trucks or large vehicles coming in and out of a historical city.
Additionally, regarding the ‘professional qualifications’, most of the stakeholders believe that it is crucial to use qualified personnel able to work with advanced communication devices, such as tablets, mobile phones, or even radios to improve the information flow between retailers and carriers, mostly. They mention that with better communication, more accurate delivery deadlines and customer satisfaction can be achieved in general.
On the other hand, the variables that were of minor importance include: Increase in ‘traffic congestion’ (C2), ‘noise nuisance level’ (C11) and ‘insecurity’ (C6), according to most carriers and retailers. It can be assumed that urban mobility solutions are still unknown or undervalued by the general population in Brazil. The need for educational programs provided by governmental or non-governmental organizations is urgent, so that traffic in cites can be minimized, occupation rates of the vehicles can be optimized, the municipality can help bring costs and benefits together, and city planning can be better organized, mostly heritage ones, among others.
To deal with the sample of 16 variables separately, and considering 181 answers, the factor analysis was used aiming to reduce the number of variables and help to understand the phenomenon. Analyzing all these variables separately would also increase the error type II. Furthermore, the factor analysis can be appropriate for this study because it reduces the variability of the sample.

4.2. Calculating the Indexes Based on the Factor Loadings

To analyze data adequacy for the technique, a Bartlett’s sphericity test was conducted and was found to be significant at 1 percent, which rejects the null hypothesis that the correlation matrix is an identity matrix. Furthermore, a value of 0.803 was obtained for the Kaiser–Meyer–Olkin (KMO) test, with consideration of the correlation matrix analysis (>0.3) and measures of sampling adequacy (MSA) by anti-image (>0.5). It is important to notice that the variables with factor loadings less than 0.5 were eliminated from the data. Based on the remaining 16 variables, the main component method was adopted to extract the common factors and obtain the number of factors. We used the varimax rotation method to determine the original variable distribution in their factors (called Factor_1, Factor_2, Factor_3, Factor_4, and Factor_5), as shown in Table 1. The factor loadings, communalities, and Cronbach’s Alpha are also presented.
The factors could be joined to measure the importance of each factor for the sustainable implementation of UDCs. Then, the allocation of variables into factors was done when the highest factor loadings for each variable were observed. It can be observed that Factor_1 has the highest percentage of the total variance explanation, followed by Factor_2, which means that they contribute the most to explaining the total variance of the variables. Hence, these factors can be considered as the most important ones to represent the best UDC location. The five factors represent approximately 58.755% of the variance of the 16 original variables. Due to the lowest Cronbach’s Alpha value, Factor_5 was eliminated from the analysis. Although Factor_4 has relatively low inter-item correlations showing a low Cronbach’s alpha, it was left in the analysis because its composition has support in theory [37]. Even after removing Factor_5, the results are still statistically significant.
Factor_F1 (ECON) contains the variables ‘damage to historical heritage’ (C8), ‘architectural impacts’ (C7), ‘visual pollution’ (C10), ‘use of alternative propulsion vehicles’ (C12) and ‘noise nuisance level’ (C11). Given that, we can assume that as ‘architectural impacts’ shows how buildings can be mechanically affected with collisions by vehicles (generating fissures, cracks and increase in damage to walls of historical buildings) [6]; and ‘noise nuisance level’ indicates the level of vibrations acting in communities and buildings [21,23]; these variables together represent the consequences of urban transportation vehicles (mostly) to historical buildings. According to Reference [6], the variables ‘architectural impacts’ and ‘damage to historical heritage’ are highly related to the conservancy of historical sites. Therefore, if fewer vehicles enter the city’s historical center, there will be lower impacts on ‘visual pollution’ and ‘insecurity’, which indicates that this factor represents the effects of the urban distribution of goods on the conservation of historical buildings and on the road safety.
Additionally, the variables ‘use of alternative propulsion vehicles’ (C12) and ‘noise nuisance level’ (C11) can bring positive aspects, such as noise reduction with the use of quieter vehicles (such as electric and hybrid vehicles or even bicycles). In general, Factor_1 contributes to some environmental improvements as well [23]. As a result, we can say that these variables are related to sustainability aspects, since the ‘use of alternative propulsion vehicles’ [6] can be used by many transportation companies as an environmentally friendly strategy to increase the number of clients; ’visual pollution’ [20,21] can also encompass the importance given by the rest of the community to the delivery zones (which should be respected so that pedestrian and cyclists can coexist).
Factor_2 (ENVI) contains the variables: ‘insecurity’ (C6), ‘compliance with legal regulations’ (C13), ‘traffic congestion’ (C2), and ‘professional qualifications’ (C3). According to some authors [15,20], ‘insecurity’ and ‘traffic congestion’ are considered as negative impacts related to the urban distribution of goods and may be attenuated using the UDC. In this case, the understanding of certain aspects of historical cities, such as their formation in narrow streets (without parking lots or alleys), is crucial for the mitigation of traffic congestion and insecurity as some cities were not originally designed for the coming and going of cars, people and trucks [6]. Moreover, the variable ‘professional qualifications’ can increase productivity and efficiency in urban distribution systems and reduce ‘traffic congestion’ (C2); therefore, it can also alleviate the traffic congestion issue. Given that, we can assume that Factor_2 also represents drivers’ behavior and decision-making. Although C2 (‘traffic congestion’) had a low communality (0.490), we kept this item in our analyses due to its strong contribution to the content validity of this factor. Traffic congestion negatively impacts the city’s residents and the environment [1].
Factor_3 (SOCI) considers ‘service level’ (C15) and ‘local gain’ (C5). These variables may indicate local prosperity through job creation and improvement of fulfillment to residents and retailers in the micro-region [6].
Factor_4 (OPERA) contains the variables ‘parking spots’ (C1), ‘vehicles size’ (C4) and ‘use of technology’ (C14). Considering the variables ‘parking spots’ and ‘vehicles size’, it can be assumed that using the ways to reduce the number of vehicles entering a city center (a UDC or a consolidation center, for example) decreases the urban traffic and increases the efficiency of deliveries [1], and it also increases the availability of parking spots during the loading and unloading of cargo. In the same way, more efficiency and productivity for urban distribution systems can be achieved in relation to the ‘use of technology’ [6]. Therefore, Factor_4 can be considered as an efficiency factor.
After extracting the factors, indexes were calculated for each factor from the weighted mean of factor loadings of the rotated component matrix. Therefore, the first index was calculated from the factor loading results of the first factor extracted. For instance, Index_1 essentially comprises the items related to the economic/local prosperity and was called ECON. Similarly, Index_2 (environmental) was called ENVI, Index_3 (social) was called SOCI, while Index_4 (operational) was called OPERA.

4.3. Assignment of Criteria Weights

To compare whether an index has a greater average than another, a t-test was conducted in pairs of indexes. Moreover, the same procedure was used for the variable sample. Although the Kolmogorov-Smirnov test for normality discards the null hypothesis that the samples/indexes follow the normal distribution, it was assumed that the distribution can be approximated by the normal distribution applying the central limit theorem (n > 30) [38]; thus, the paired t-test can be used. The results for the paired samples t-test showed that, for the indexes with the significance levels higher than 0.000, it could not be statistically stated that one index is different from another. Then, we applied one sample test with a certain fixed value for the pair of indexes in order to find each one that is greater than the other. Table 2 shows the descriptive statistics and the t-test statistic for the indexes. The (positive/negative) value of the t-test statistic shows that the average of the index (i) line is greater/smaller than the average of the second index (j) column. The results in Table 2 demonstrate that the differences between the averages of all pairs are different from zero. Therefore, the null hypothesis is rejected.
The analysis of the I_ECON x I_SOCI and I_ECON x I_OPERA relations indicates that I_ECON (economic) has a greater average than the I_SOCI (social) and I_OPERA (operational), respectively. That is, stakeholders care more about the economic aspects to implement a UDC than the social or operational aspects. When comparing I_ECON (economic) and I_ENVI (environmental), I_ECON has a smaller average than I_ENVI. Furthermore, the analysis of the I_ENVI x I_SOCI and I_ENVI x I_OPERA relations indicates that I_ENVI has a greater average than the I_SOCI and I_OPERA, respectively. Therefore, the stakeholders believe that the environmental aspects are the most important ones for sustainable UDC implementation in a historical city.
Last, the analysis of I_OPERA x I_SOCI relation indicates that we cannot claim that the averages are statistically significant due to the differences between them to be too small and the present high standard deviation. However, when we compare the average of I_OPERA (1.643) and the average of I_SOCI (1.702) to a fixed value (1.600) by using one sample t-test, the results reveal that only I_SOCI has a greater average than this fixed value, in this case at a 5 percent statistical significance. Therefore, we may infer that I_SOCI is more important than I_OPERA to locate a UDC according to the stakeholders. Having a good level of service or local gain is also important as having parking spaces or using smaller vehicles or using technology to operate a UDC. Maybe to achieve a good service level, other logistics solutions based on non-motorized vehicles can be considered. The same methodology was applied to ranking the criteria.

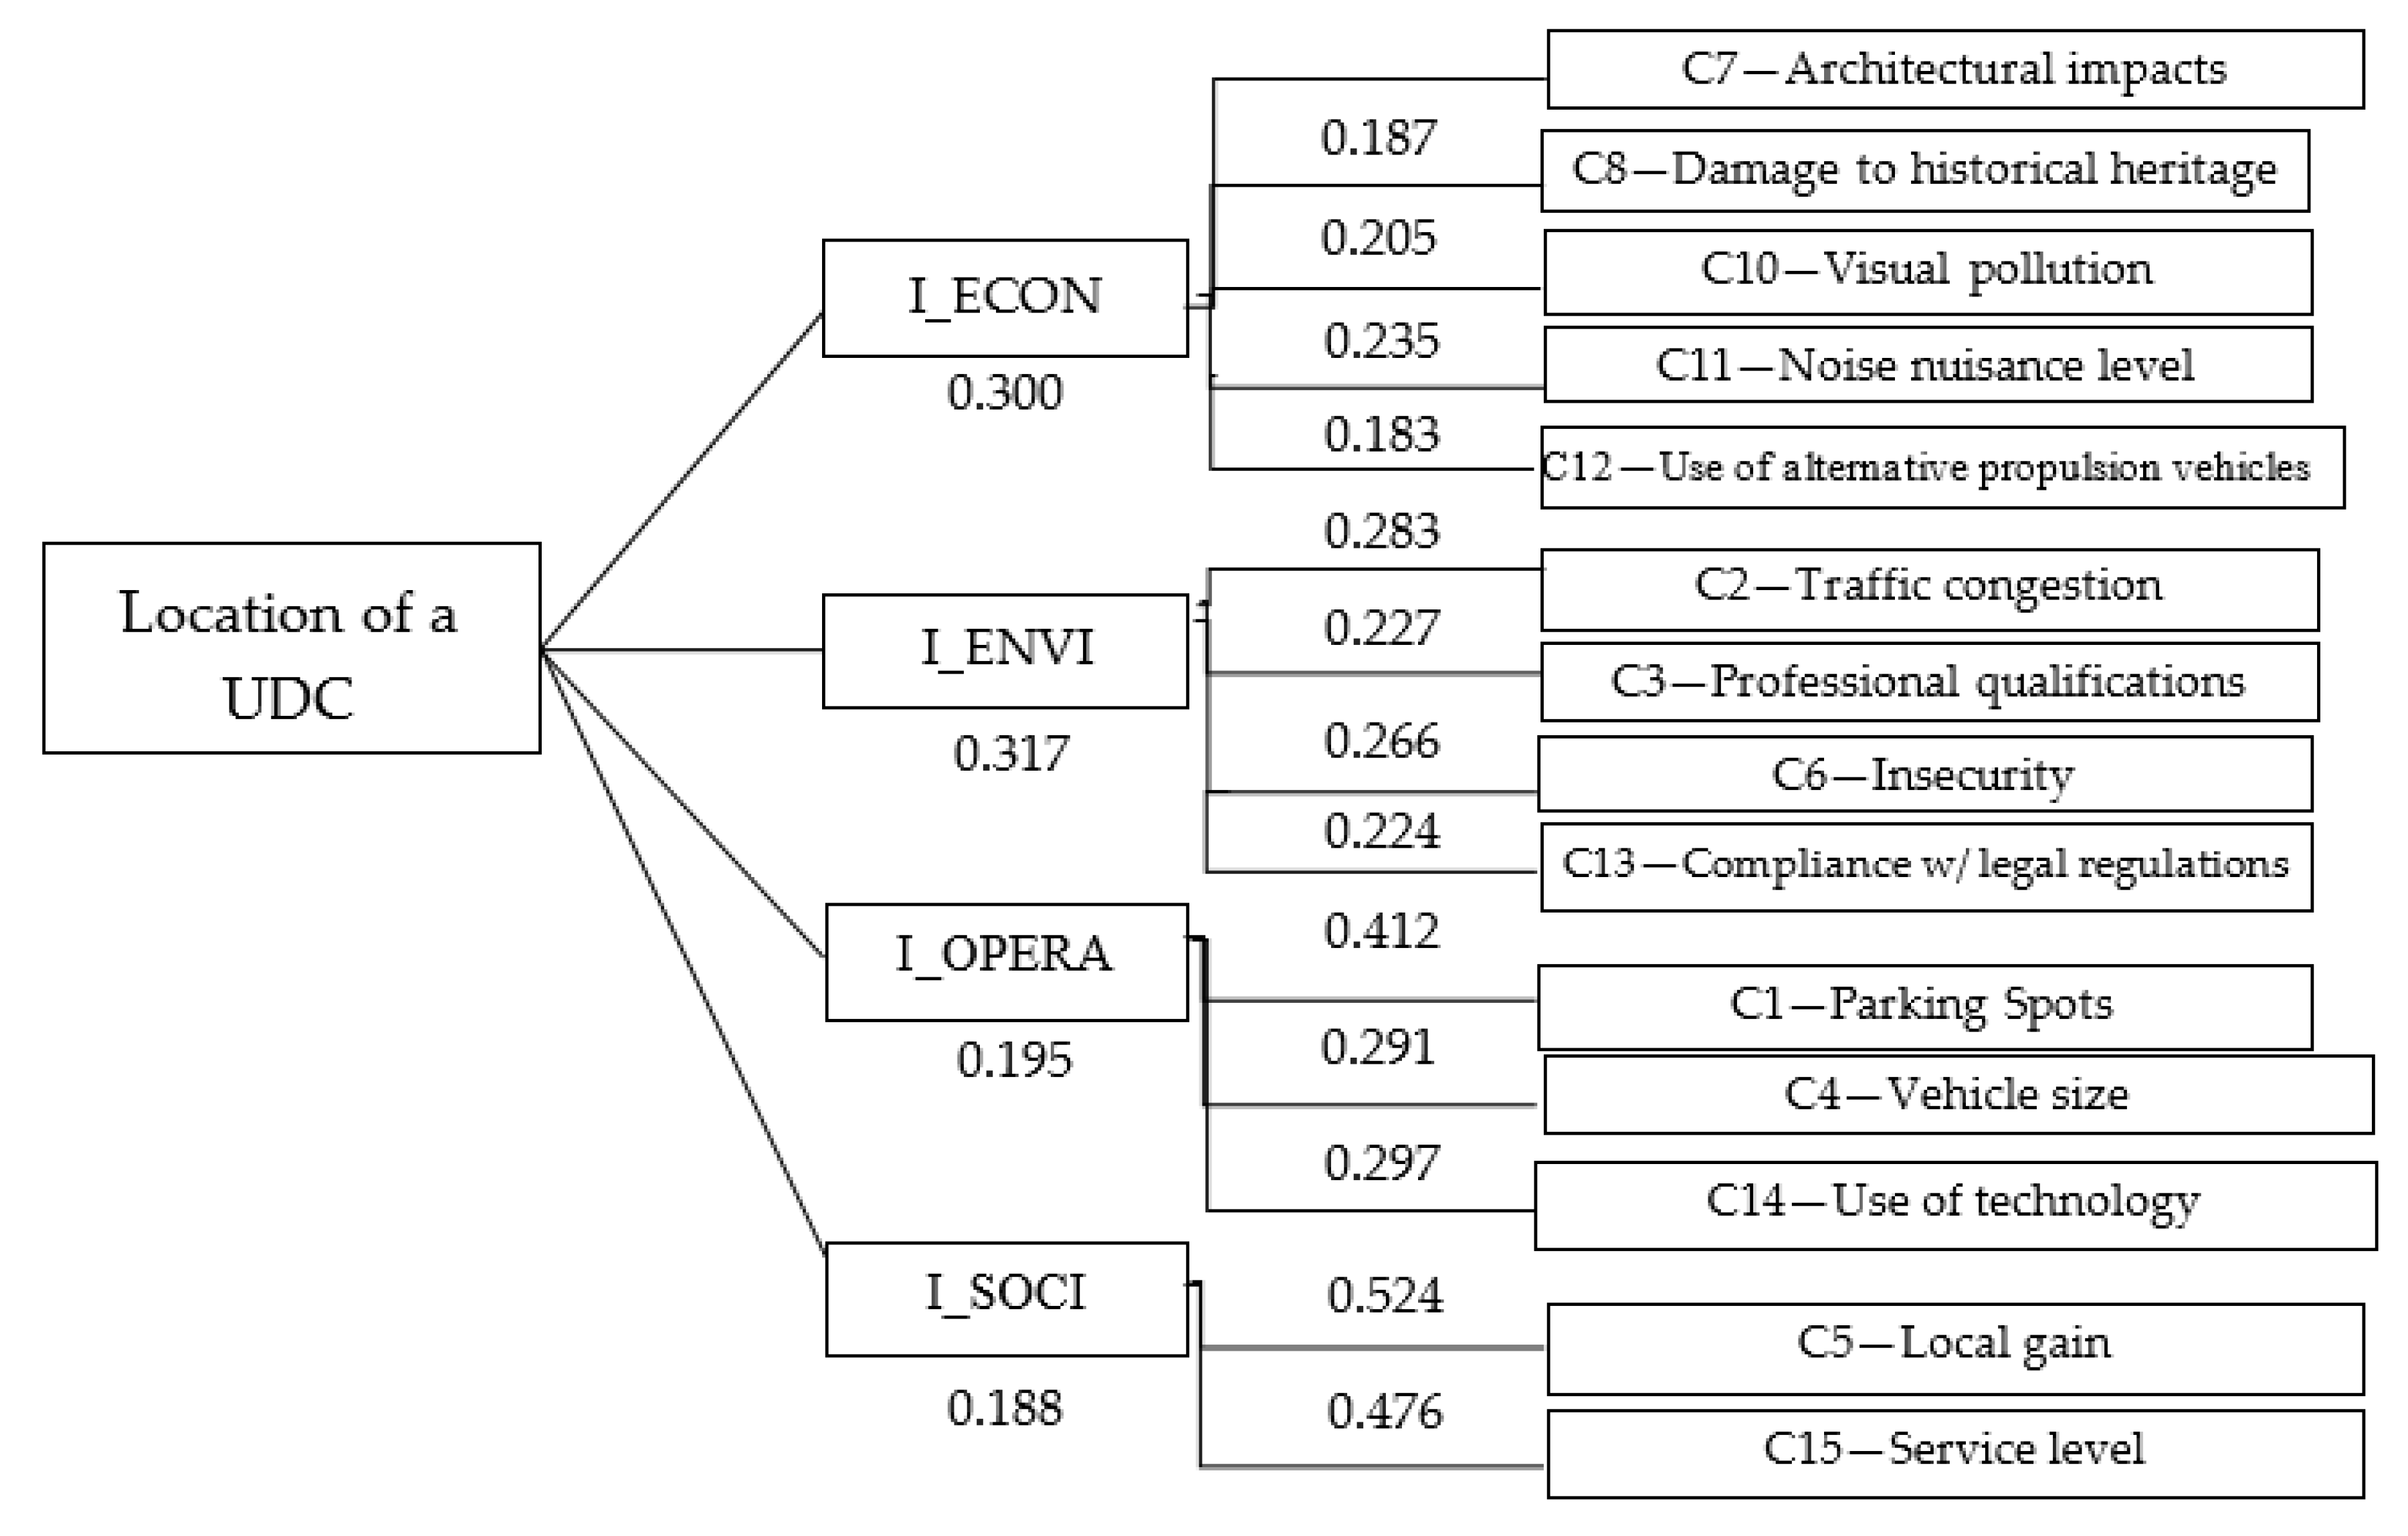
4.4. Building the Structure Based on Stakeholders’ Opinion

Figure 2. shows a decision hierarchy structure with normalized weights for the indexes and respective weights of variables. The results of the normalized weights for the indexes show the relevance of economic and environmental aspects for sustainable UDC implementation. Similarly, the statements of Reference [21] highlight the importance of reduction of atmospheric/air pollution, noise nuisance levels and visual intrusion for those decisions. The structure also reveals the prevalence of the local prosperity compared to service level, as described by Reference [5]. Peculiarly, this finding is also related to the reduction of local insecurity [39], provided by the uncontrolled acts of loading and unloading that are prohibited in the city center, recklessness of the drivers and large vehicle traffic.
In sum, the presented hierarchical decision structure identifies the most important criteria (regarding economic and environmental aspects) [5], which are also in accordance with the opinion of retailers and traffic wardens. Additionally, the findings from the multivariate analysis and t-tests show that carriers and retailers perceived with lower importance the criteria associated to operational and social aspects (vehicle size, use of technology, service level, local gain and parking spots), when comparing to the economic and environmental criteria. The proposed structure is ready to be applied to any alternatives for implementing UDCs in Ouro Preto.
Table 3 provides an example of applying the proposed hierarchical decision structure for sustainable UDC implementation. Two potential locations were analyzed: X presents the location far from the historical central area, while Y is closed to the historical central area, where the truck regulations take place. Each stakeholder gives the scores to the criteria based on the five-point Likert scale (from the most important “1” to the least important “5”). Then, we applied the equivalence procedure between the scores and the preferential scale, as described earlier in Section 2.4. It means a criterion strongly relevant (with a score of “1”) receives “100” (in the preferential scale); a criterion with a score of “2” receives “75”; etc. It is important to note that the attributes measure the criteria by using a value function [32,34]. Because we are using the Likert scale, where the importance increases in the opposite direction of preference, the inverted functions were used. Table 3 shows the criteria scores for both alternatives, taking into considerations the opinion of the stakeholders. For example, with regard to C7 (“architectural impacts”), traffic wardens and carriers are not concerned with this criterion, and it is not important to consider this criterion when they evaluate the location “Y” (close to the historical central area).
The total score of each alternative is calculated by multiplying the score and respective weights in Figure 2. The underlined total scores indicate the recommended alternative (the highest total score). In this case, carriers do not prefer the location “Y”, which can be explained by the existing truck regulations in the historical central area and potential fines for illegal parking. Similarly, traffic wardens indicate the location “X” to be preferential for the future UDC, while retailers prefer the location “Y”. The results, obtained using the proposed hierarchical decision structure, can be used in a variety of sensitivity analyses and enable robust decision-making. Moreover, the performance analysis among these criteria could be carried out in order to verify the impact of those criteria when implementing a UDC.

5. Conclusions

Based on carriers, traffic wardens and retailers’ opinions, this research proposed a multi-criteria decision structure for sustainable implementation of urban distribution centers (UDCs) in a historical city. The study was conducted in three stages. First, based on the literature review, the criteria for the evaluation of potential locations for the UDC were identified. Second, the criteria were summarized in four factors which were transformed in respective indexes, representing the hierarchical decision structure. Third, the ratings of the criteria/indexes, which were given by different decision-makers (i.e., carriers, traffic wardens and retailers), were further analyzed using the statistical techniques (t-tests and one sample test) in order to compare pairs of criteria/index, and ranking them by the averages. These averages represent the weights for the ranking of criteria/indexes in the structure. Finally, we demonstrated an example of applying this structure.
From the statistical techniques, the variables that were considered most important by all the stakeholders involved were determined, including the following: ‘parking spots’ (C1), ‘vehicle size’ (C4), ‘use of technology’ (C14), ‘service level’ (C15), ‘visual pollution’ (C10), and ‘professional qualifications’ (C3). These six variables can be considered as important criteria for implementing a UDC in historical centers. It can be concluded that one of the greatest goals of the UDC’s applicability is well-known by the stakeholders, since they recognize the importance of reducing the number of large vehicles coming in and out of a historical city (in this case). Additionally, regarding the ‘professional qualifications’, most of the stakeholders believe that it is crucial to use qualified personnel able to work with advanced communication devices to improve the information flow between retailers and carriers and achieve more accurate delivery deadlines and customer satisfaction in general.
Moreover, the variables of minor importance were identified, including the following: increase in ‘traffic congestion’ (C2), ‘noise nuisance level’ (C11), and ‘insecurity’ (C6), according to most carriers and retailers. Accordingly, it could be assumed that urban mobility solutions are still unknown or undervalued by the general population in Brazil. The need for educational programs provided by governmental or non-governmental organizations is urgent, so that traffic in cites can be minimized, occupation rates of the vehicles can be optimized, the municipality can help bring costs and benefits together and the preservation of cities, mostly those with historical heritage, can be initiated, among others.
Regarding the representativeness of the data, this study used a Likert scale with 1–5 points. In some cases, it is more appropriate to use a 0–10 scale, which may accurately reveal the opinion of each respondent and provide more statistical information to carry the descriptive analysis (for instance, estimation of the average or standard deviation values) and to facilitate accurate ranking of the criteria. Rank Order Centroid (ROC) [40] can also be applied to define the weights, since we have the rank of the criteria. Nevertheless, the performed statistical analyses and crosschecking revealed the robustness of the data. The sample was representative for retailers (122) and traffic wardens (the entire population interviewed), but not for carriers (46). Moreover, more robust statistical techniques could be applied for a bigger sample, for instance, post-hoc tests. Then, a type II error can be reduced by making more stringent criteria for rejecting the null hypothesis.
Concerning some other directions for the future research, we suggest using the idea of this study in similar implementations of UDCs in other cities (not only historical cities), provided that other groups of criteria will be selected according to the economic, cultural and political reality. For example, the proposed framework could take into account a set of regulatory elements and public issues focusing on the environment and quality of life to be addressed by the operators. This approach can also be used in combination with the other ones. For example, some criteria could be optimized [41]. As for the practitioners, the proposed structure can be used by logistics operators and local authorities for implementing UDCs to effectively address urban distribution issues in different geographical locations. The scientific contribution of this study is the approach that can be used for the design of the hierarchical decision structure. Although this approach is innovative, a survey among different stakeholders may require a lot of time.

Author Contributions

N.L.d.C. contributed to the acquisition of data and performed the questionnaire. J.G.V.V. contributed to the statistics analysis and also supervised of data analysis, writing, review and editing the paper, conceptualization, and project administration. P.N.d.F. contributed to draft and review the paper, performed statistics analysis. M.A.D. contributed to review and editing the paper and funding acquisition for the article processing charge. All authors have read and agreed to the published version of the manuscript.

Funding

This research was funded by the Brazilian Coordination for the Improvement of Higher Education Personnel (CAPES), the National Council for Scientific and Technological Development (CNPq), grant numbers 409128-2018-0 and 3099172019-0, and the Fundação de Amparo à Pesquisa do Estado de São Paulo – FAPESP, grant number 2017/06074-7.

Conflicts of Interest

The authors declare no conflict of interest.

Appendix A

The following question was used to identify the importance of criteria (listed in the table below) for the UDC implementation based on the stakeholders’ input: “Please indicate if a given criterion should be considered as important for the UDC implementation from “1” = Strongly agree to “5” = Strongly disagree”.
Table A1. Summary of the main criteria considered for the UDC implementation.
CodeCriteriaTraffic WardensRetailersCarriers
Mod1 QMed3 QMod1 QMed3 QMod1 QMed3 Q
C1Parking spots11.002.003.5011.001.002.0011.001.001.00
C2Traffic congestion11.001.002.0011.002.005.0052.004.005.00
C3Professional qualifications11.002.003.0011.001.003.0011.002.005.00
C4Vehicle size11.001.001.0011.001.001.0011.001.001.00
C5Local gain11.001.002.0011.001.002.0011.001.002.00
C6Insecurity11.001.003.5011.002.005.0051.004.005.00
C7Architectural impacts11.001.002.0011.002.002.0021.752.005.00
C8Damage to historical heritage11.001.002.0011.001.003.2511.002.005.00
C9Air pollution level11.001.002.0011.001.002.0011.002.004.00
C10Visual pollution11.001.001.5011.002.004.0051.002.005.00
C11Noise nuisance level11.001.002.0011.003.004.0052.004.005.00
C12Using alternative propulsion vehicle11.001.002.0011.002.003.0011.002.004.25
C13Compliance with legal regulations11.001.002.0011.001.004.0052.004.005.00
C14Use of technology11.001.002.0011.001.001.0011.001.001.00
C15Service level11.001.002.0011.001.002.0011.001.001.00
C16Investments and costs11.002.002.5011.001.002.0011.001.002.00

References

  1. Estrada, M.; Roca-R, M. Stakeholder’s profitability of carrier-led consolidation strategies in urban goods distribution. Transp. Res. Part E Logist. Transp. Rev. 2017, 104, 165188. [Google Scholar] [CrossRef]
  2. Vidal, V.J.G.; Fransoo, J.C. How logistics performance of freight operators is affected by urban freight distribution issues. Transp. Policy 2015, 44, 37–47. [Google Scholar] [CrossRef]
  3. Awash, A.; Chauhan, S.S.; Goyal, S.K. A multi-criteria decision-making approach for location planning for urban distribution centers under uncertainty. Math. Comput. Model. 2011, 53, 98–109. [Google Scholar]
  4. de Carvalho, N.L.A.; Ribeiro, P.C.C.; García-Martos, C.; Fernández, C.G.; Vieira, J.G.V. Urban distribution centre in historical cities from the perspective of residents, retailers and carriers. Res. Transp. Econ. 2019, 77, 100744. [Google Scholar] [CrossRef]
  5. Carvalho, N.L.A.; Ribeiro, P.C.C.; Oliveira, L.K.; Silva, J.E.A.R.; Vieira, J.G.V. Criteria to implement UDCs in historical cities: A Brazilian case study. Eur. Transp. Trasp. Eur. 2019, 72, 1–29. [Google Scholar]
  6. Marcucci, E.; Gatta, V.; Scaccia, L. Urban freight, parking and pricing policies: An evaluation from a transport providers’ perspective. Transp. Res. Part A Policy Pract. 2015, 74, 239–249. [Google Scholar] [CrossRef]
  7. Marcucci, E.; Gatta, V.; Le Pira, M. Gamification design to foster stakeholder engagement and behavior change: An application to urban freight transport. Transp. Res. Part A Policy Pract. 2018, 118, 119–132. [Google Scholar] [CrossRef]
  8. Paddeu, D.; Aditjandra, P. Shaping Urban Freight Systems via a Participatory Approach to Inform Policy-Making. Sustainability 2020, 12, 441. [Google Scholar] [CrossRef] [Green Version]
  9. Rubio, S.; Jiménez-Parra, B.; Chamorro-Mera, A.; Miranda, F.J. Reverse Logistics and Urban Logistics: Making a Link. Sustainability 2019, 11, 5684. [Google Scholar] [CrossRef] [Green Version]
  10. Allen, J.; Browne, M.; Cherrett, T. Investigating relationships between road freight transport, facility location, logistics management and urban form. J. Transp. Geogr. 2012, 24, 45–57. [Google Scholar] [CrossRef] [Green Version]
  11. Vermote, L.; Macharis, C.; Putman, K. A road network for freight transport in Flanders: Multi-actor multi-criteria assessment of alternative ring ways. Sustainability 2013, 5, 4222–4246. [Google Scholar] [CrossRef] [Green Version]
  12. Macharis, C. Multi-criteria Analysis as a Tool to Include Stakeholders in Project Evaluation: The MAMCA Method. In Transport Project Evaluation; Extending the Social Cost–Benefit Approach; Haezendonck, E., Ed.; Edward Elgar: Cheltenham, UK, 2007; pp. 115–131. [Google Scholar]
  13. Macharis, C. The importance of stakeholder analysis in freight transport. Q. J. Transp. Law, Econ. Eng. 2005, 8, 114–126. [Google Scholar]
  14. Chakraborty, R.; Ray, A.; Dan, P. Multi criteria decision making methods for location selection of distribution centers. Int. J. Ind. Eng. Comput. 2013, 4, 491–504. [Google Scholar] [CrossRef]
  15. Wang, B.; Xiong, H.; Jiang, C. A multicriteria decision making approach based on fuzzy theory and credibility mechanism for logistics center location selection. Sci. World J. 2014. [Google Scholar] [CrossRef] [Green Version]
  16. Chou, S.Y.; Chang, Y.H.; Shen, C.Y. A fuzzy simple additive weighting system under group decision-making for facility location selection with objective/subjective attributes. Eur. J. Oper. Res. 2008, 189, 132–145. [Google Scholar] [CrossRef]
  17. Panero, M.A.; SHin, H.S.; Lopez, D.P. Urban Distribution Centers–A Means to Reducing Freight Vehicle Miles Traveled; (Report No. C-08-23); The NYU Rudin Center for Transportation Policy and Management: New York, NY, USA, 2011. [Google Scholar]
  18. Van Duin, J.H.R.; Quak, H.; Muñuzuric, J. New challenges for urban consolidation centres: A case study in The Hague. Procedia–Social Behav. Sci. 2010, 2, 6177–6188. [Google Scholar] [CrossRef] [Green Version]
  19. Macharis, C.; Milan, L. Transition through dialogue: A stakeholder based decision process for cities: The case of city distribution. Habitat Int. 2015, 45, 82–91. [Google Scholar] [CrossRef]
  20. Quak, H.J. Sustainability of Urban Freight Transport: Retail Distribution and Local Regulations in Cities; Erasmus University Rotterdam: Rotterdam, The Netherlands, 2008; pp. 125–170. [Google Scholar]
  21. Rao, C.; Goh, M.; Zhao, Y.; Zheng, J. Location selection of city logistics centers under sustainability. Transp. Res. Part D 2015, 36, 29–44. [Google Scholar] [CrossRef]
  22. Anderson, S.; Allen, J.; Browne, M. Urban logistics: How can it meet policy makers’ sustainability objectives? J. Transp. Geogr. 2005, 13, 71–81. [Google Scholar] [CrossRef] [Green Version]
  23. Gonzalez-Feliu, J.; Morana, J. Are city logistics solutions sustainable? The Cityporto case. Territ. Ambiente. 2010, 3, 55–64. [Google Scholar]
  24. Awasthi, A.; Chauhan, S.S. A hybrid approach integrating Affinity Diagram, AHP and fuzzy TOPSIS for sustainable city logistics planning. Appl. Math. Model. 2012, 36, 573–584. [Google Scholar] [CrossRef]
  25. Browne, M.; Sweet, M.; Woodburn, A.; Allen, J. Urban freight consolidation centres final report. Transp. Stud. Group. 2005, 10. [Google Scholar]
  26. Yang, L.; Ji, X.; Gao, Z.; Li, K. Logistics distribution centers location problem and algorithm under fuzzy environment. J. Comput. Appl. Math. 2007, 208, 303–315. [Google Scholar] [CrossRef] [Green Version]
  27. Zhou, Y.; Wang, X. Decision- making for developing urban freight consolidation centers: Analysis with experimental economics. J. Transp. Eng. 2014, 140, 1–7. [Google Scholar] [CrossRef]
  28. Van Duin, J.H.R.; Van Dam, T.; Wiegmans, B.; Tavasszy, L.A. Understanding Financial Viability of Urban Consolidation Centres: Regent Street (London), Bristol/Bath & Nijmegen. Transp. Res. Procedia 2016, 16, 61–80. [Google Scholar]
  29. Veličković, M.; Stojanović, Đ.; Nikoličić, S.; Maslarić, M. Different urban consolidation centre scenarios: Impact on external costs of last-mile deliveries. Transport 2018, 33, 948–958. [Google Scholar]
  30. Boysen, N.; de Koster, R.; Weidinger, F. Warehousing in the e-commerce era: A survey. Eur. J. Oper. Res. 2019, 277, 396–411. [Google Scholar] [CrossRef]
  31. Macharis, C. The optimal location of an intermodal bargeterminal. In Transport Developments and Innovations in an Evolving World; Beuthe, M., Himanen, V., Reggiani, A., Zamparini, L., Eds.; Springer: Berlin, Germany, 2004. [Google Scholar]
  32. Keeney, R.L. Value-focused thinking: Identifying decision opportunities and creating alternatives. Eur. J. Oper. Res. 1996, 92, 537–549. [Google Scholar] [CrossRef]
  33. Forza, C. Survey research in operations management: A process based perspective. Int. J. Oper. Prod. Manag. 2002, 22, 152–194. [Google Scholar] [CrossRef] [Green Version]
  34. Oliveira, B.T. Revitalization of horto botanico and vale dos contos in ouro preto. In Proceedings of the 10th International Conference on Structural Analysis of Analysis of Historical Constructions, Leuven, Belgium, 13–15 September 2016. [Google Scholar]
  35. Dyer, J.S.; Sarin, R.K. Measurable multiattribute value functions. Oper. Res. 1979, 27, 810–822. [Google Scholar] [CrossRef]
  36. Cochran, W. Sampling Techniques, 2nd ed.; John Wiley & Sons: Boston, MA, USA, 1985. [Google Scholar]
  37. Cortina, J.M. What is coefficient alpha? An examination of theory and applications. J. Appl. Psychol. 1993, 78, 98–104. [Google Scholar] [CrossRef]
  38. Hair, F.J.; Black, W.C.; Babin, B.; Anderson, R.E. Multivariate Data Analysis, 6th ed.; Prentice Hall: Upper River, NJ, USA, 2005. [Google Scholar]
  39. Vieira, J.G.V.; Fransoo, J.C.; Carvalho, C.D. Freight distribution in megacities: Perspectives of shippers, logistics service providers and carriers. J. Transp. Geogr. 2015, 46, 46–54. [Google Scholar] [CrossRef]
  40. Edwards, W.; Barron, F.H. SMARTS and SMARTER: Improved Simple methods for multiattribute utility measurement. Organ. Behav. Hum. Decis. Process 1994, 60, 306–325. [Google Scholar] [CrossRef]
  41. Soto-de la Vega, D.; Vidal-Vieira, J.G.; Vitor-Toso, E.A. Metodología para localización de centros de distribución a través de análisis multicriterio y optimización. Dyna 2014, 81, 28–35. [Google Scholar] [CrossRef]
Figure 1. Multiple hierarchical decision-model. UDC, urban distribution centers.
Sustainability 12 05538 g001
Figure 2. Hierarchical decision structure for sustainable UDC implementation in a historical city.
Sustainability 12 05538 g002
Table 1. Extraction of common factors.
Factors ExtractedOriginal VariablesFactor loadings CommunalitiesCronbach’s Alpha Values (0–1)
12345
Factor_1 Economic(ECON)C8
C7
C10
C12
C11
0.823
0.791
0.653
0.591
0.586
0.123
0.265
0.337
0.050
0.367
−0.098
−0.016
0.096
0.220
−0.059
0.015
0.096
−0.014
0.171
0.107
−0.023
−0.088
0.121
0.366
−0.095
0.703
0.713
0.564
0.564
0.502
0.798
Factor_2 Environmental(ENVI)C6
C13
C2
C3
0.219
0.138
0.360
0.245
0.698
0.633
0.590
0.574
0.077
−0.174
0.031
0.208
−0.069
0.222
−0.096
0.288
0.119
−0.083
0.042
0.120
0.561
0.506
0.490
0.530
0.659
Factor_3 Social(SOCI)C15
C5
−0.052
0.084
−0.027
0.060
0.807
0.780
0.059
0.069
0.002
0.054
0.659
0.627
0.537
Factor_4 Operational(OPERA)C14
C1
C4
0.095
−0.221
0.376
−0.057
0.289
0.044
−0.077
0.301
0.134
0.722
0.629
0.582
0.183
0.017
−0.085
0.573
0.618
0.508
0.427
Factor_5 Cultural(CULTUR)C16
C9
−0.056
0.086
−0.060
0.436
0.002
0.062
0.206
−0.158
0.800
0.606
0.690
0.593
0.313
% of variance explained18.1213.689.569.557.84
% of cumulative variance18.1231.8041.3650.9158.76
Table 2. Averages of the paired indexes.
IndexI_SOCII_OPERAI_ENVI
I_OPERANS
(0.060)
I_ENVI14.814 *19.223 *
(1.053)(1.114)
I_ECON11.682 *15.153 *−3.681 *
(0.914)(0.974)(−0.139)
Note: Values between brackets represent the differences between the pair averages. H0: µij = 0. IC = 95 percent. * Indicates significance at 1 percent and ** at 5 percent. NS = no significance.
Table 3. Hypothetical alternatives evaluated by the stakeholders.
CodeCriteriaTraffic WardensRetailersCarriers
AlternativesXYXYXY
C7Architectural impacts100050501000
C8Damage to historical heritage752550501000
C10Visual pollution755050501000
C11Noise nuisance level75500501000
C12Using alternative propulsion vehicle75755050100100
C2Traffic congestion757505010075
C3Professional qualifications5050050100100
C6Insecurity507550501000
C13Compliance with legal regulations1001005050100100
C1Parking spots5000507575
C4Vehicle size7575075100100
C14Use of technology100100505010075
C5Local gain1005005010075
C15Service level757500100100
Total scores of the alternatives76.2057.5622.1446.9497.9958.90

