Thermal Conditions for Viticulture in Poland

Department of Environmental Management, West Pomeranian University of Technology in Szczecin, ul. Papieża Pawła VI, 71-459 Szczecin, Poland
*
Author to whom correspondence should be addressed.
Sustainability 2020, 12(14), 5665; https://0-doi-org.brum.beds.ac.uk/10.3390/su12145665
Submission received: 31 May 2020
/
Revised: 22 June 2020
/
Accepted: 9 July 2020
/
Published: 14 July 2020
(This article belongs to the Collection Sustainable Development of Rural Areas and Agriculture)
Abstract
:The ongoing global warming promotes an expansion of the areas of land already used for viticulture, as well as the establishment of new vineyards in areas that were previously considered unsuitable. In this study, a temporal and spatial assessment of the thermal conditions for viticulture in Poland was conducted using a series (1971–2019) of daily data on air temperature (mean, maximum and minimum) obtained from 52 stations of the Polish Institute of Meteorology and Water Management—National Research Institute. On the basis of the values of air temperature for the year (January–December), the vegetative period (April–September), and July, as well as the duration of the period of active growth of the plant (air temperature >10 °C) and the sum of active temperatures (SAT) in this period, five potential areas for viticulture in Poland were identified with respect to thermal conditions. It was found that approx. 60% of the country’s area shows conducive and moderately conducive conditions for intense viticulture. In the analysed multiannual period, there is a dynamic increase in air temperature in Poland, an increase in the sums of active temperatures (SAT) as well as an increase in the duration of the period of active growth of the plant. The ongoing global warming causes a shift of the current boundary of intense viticulture to the north of Poland (from 100 to 150 km). The greatest increases in air temperature and SAT values were found in the south-west and west of Poland, with a marked decrease shown towards the north-east and east.
1. Introduction
There is a long history of viticulture in Poland, contrary to the popular belief that grapevines are to be cultivated in low-latitude regions. Viticulture on Polish lands dates back to the 12th century, and in Europe to the times of the Ancient Greeks [1,2]. At the turn of the 16th and 17th centuries, viticulture was discontinued due to a marked cooling of the climate and then resumed (mainly in the area of the current Lubuskie and Dolnośląskie voivodeships) in the first half of the 19th century by German settlers [3]. During the Second World War, viticulture was again discontinued only to be reinstated gradually in the 1990s [4,5]. The current revised legal regulations on marketing wine produced from one’s own cultivation have also contributed to an increase in cultivation area as well as in the number of growers [3,6,7].
The region of viticulture is determined not only by the possibility of cultivation but also by its quality. The climate conditions are inseparable from the region of cultivation since they are the underlying factor of grape growth and ripening. For example, the Thermal Index of Winkler based on heat resources identifies five extensive regions of viticulture in California [8,9]. This index has been modified and adapted to other regions of the world [10,11,12,13]. According to the Thermal Index of Winkler, the western area of Poland (Zielona Góra, Lubuskie voivodeship) is considered to be the coldest of the identified regions (Ia), with a growing degree days (GDD) value of 1849, where very early maturing varieties, mainly hybrid grapes, are best cultivated [14,15,16]. In Europe, the Huglin index [17], rather than the Winkler index, is used more frequently to classify viticulture. The formula of the Huglin index ascribes greater importance to the maximum temperature and includes a correction owing to the latitude or the sum of active temperatures (SAT) [6,18]. Yet another, more comprehensive approach to climatic classification of viticulture was put forward by Tonietto and Carbonneau [19], who pointed to the following criteria: cool night index (CI), dryness index (DI) and Huglin’s heliothermal index (HI). However, it should be noted that the abovementioned paper mainly considers the southern regions of Europe, and therefore the suggested classification is representative of the Mediterranean climate rather than climates with transitional characteristics. In turn, the classification by the European Union divides the area depending on the climate conditions into three zones, from the poorest conditions (A) to the best (C) [3]. According to this classification, pursuant to the Council Regulation (EU) No 2165 of 20 December 2005, Poland was classified as the coldest cultivation region—similarly to the greater part of Germany as well as the Czech Republic, Belgium and the UK [20,21]. What is more, the geographical division, useful in terms of grapevine cultivation, into units of viticulture does not apply to Poland [2,3]. There is only the division of Poland into three regions with respect to thermal conditions—from favourable, through areas at risk from winter, to the regions where cultivation is impossible or very difficult [21,22].
The climate, just like the selection of a suitable variety, is one of the key factors affecting grape production as well as the kind and quality of the produced wine. Air temperature is considered the most important climate criterion affecting the growth and development of grapevines [19,20,22,23,24,25,26,27,28]. What is more, according to Santos et al. [28], Jones et al. [29], Keller [30], and Clingeleffer [31], it is the air temperature during the vegetative period in the cultivation year that shows a greater influence on a given wine vintage (composition of grapes, quality of wine) than cultivation practices. It is the temperature that determines the time of grape ripening, which varies depending on the variety [32,33,34]. For example, ‘Cabernet Sauvignon’ and ‘Shyrah’ need more warmth to complete maturation and, consequently, are best cultivated in a warmer climate as compared to ‘Pinot Noir’ and ‘Chardonnay’, which show less heat demand and thrive in a cooler climate. Considering thermal resources, it must be emphasised that excess heat in the vegetative period may cause earlier maturation of grapes, increased sugar content and lower acidity [35]. Contrariwise, not enough heat may result in delayed or limited maturation, and consequently, the produced wine is low in alcohol and manifests poor palatability [36].
In Europe, the basic grapevine species is Vitis vinifera L., characterised by late maturation and the requirement of a warm and dry autumn. In the climate conditions of Poland, varieties obtained from interspecies hybrids of vinifera, which are more resistant to frost, are best cultivated [37].
According to Robinson [38], the most favourable zone for viticulture in the northern hemisphere extends from the latitude 32° to 52°, i.e., half of the area of Poland (λ 49° to 52°). It is recognised that the climate conditions are conducive to cultivation if the following conditions are met: mean annual air temperature at least 8 °C, during vegetation period at least 14 °C, in the warmest month not less than 17 °C, and the annual sum of active temperatures (>10 °C) at least 2500 °C [39,40]. Apart from the aforementioned criteria, the following are also taken into account: air temperature in April (bud burst) and September (grape maturation), spring and autumn frost, temperature in January and sub-zero, the lowest (<−10 °C) temperature recorded in the cold half-year as well as the length of the grapevine’s active growth period above the threshold of 10 °C [25,41,42,43,44].
The undoubted global warming is consequential to various sectors of the economy. For example, with respect to agriculture, global warming enables the cultivation of thermophilic plants such as soy, corn or grapevine in areas that have been previously considered unsuitable for the cultivation of such crops. According to Lee et al. [45], grapevines are one of the plants most susceptible to climate change. The most recent warming has a generally positive effect on the improvement of wine quality [46,47], particularly the wine produced in the regions of less favourable climate zones [26,48]. Another positive effect of global warming is the shift of viticulture locations to the north (to high latitudes) and the possibility of cultivating grapevines in such regions of Europe as the UK, the Netherlands or Denmark [28,29,49,50,51,52]. However, global warming is considered negative in areas where this plant is cultivated under conditions close to the optimum temperature and higher [53,54].
The studies by Kryza et al. [6] confirmed the favourable changes in the structure of the climate in Poland with respect to viticulture. The observed lengthening of the warm half-year and the shortening of the winter period are, undoubtedly, other factors promoting the expansion of viticulture [55,56,57,58]. The changes in temperature are reflected in the length of the vegetative period and the period of active growth, with changing dates of the beginning and the end [59]. Greater changes are observed in terms of the date of the beginning, which show a tendency to begin the vegetative period earlier [59,60,61]. The global warming recorded so far is also evident in the increasing trends for sums of active temperatures of more than 8 and 10 °C and for latitude temperature index (LTI) [6,44].
Given the accelerated global warming and the dynamic increase in the grapevine acreage in Poland, the present paper aims to provide a comprehensive assessment of the climatic conditions for the purpose of grapevine cultivation, which allows for determination of the areas with the potential for viticulture.
2. Materials and Methods
For the purpose of establishing the thermal conditions for viticulture in Poland, daily air temperature (at) 200 cm above ground level (mean, maximum and minimum) for individual years in the period 1971–2019 was used. The data were obtained from 52 meteorological stations of the Polish Institute of Meteorology and Water Management—National Research Institute (IMGW-BIP), evenly distributed over the area of Poland. Following Myśliwiec [62], under the conditions of the climate of Poland, vineyards should be established up to the altitude 300–400 m above sea level. With this in mind, the analysis includes stations located at altitudes of less than 400 m asl.
Using data obtained from the National Agricultural Support Centre [7], the following were calculated: mean yield of grape for the whole country (q/ha) and the volume of wine production (hL/ha) in subsequent years from 2009/2010 to 2018/2019 (Table 1).
The changes in air temperature in Poland per year (January–December), during the vegetative season (April–September), in January and July, as well as during the active growth of grapevine (at >10 °C) were assessed from a temporal and spatial perspective. The variability of temperature in the subsequent years of the period 1971–2019 was discussed in detail based on the example of three stations (Wrocław, Warszawa, Białystok), which are representative of different climate regions of Poland. Moreover, temperature deviation (°C) recorded in subsequent years against the mean value of the reference period World Meteorological Organization (WMO) 1981–2010 is provided. The spatial distribution of individual characteristics was analysed in terms of the whole area of Poland.
The time of active growth of grapevine, i.e., the period with air temperature of more than 10 °C, was calculated using the Gumiński method [63], which is still referred to in numerous scientific studies [57,61,64,65]. The dates of the beginning and end, as well as the duration of the said period were determined. For the periods identified in the aforementioned way, the sums of active temperatures (SAT) were calculated. Additionally, to complement the SAT index, the present study provides the calculated values of latitude temperature index (LTI), which determines the maturation potential of grapevines and is the product of the average temperature of the hottest month in a year (°C) and degrees latitude of the area under analysis [42].
A significant threat to grapevine during active growth is posed by frost and, in the cold half-year (October–March), by sub-zero minimum air temperature. For these reasons, the number of days with frost at 200 cm agl and, in the cold period, the frequency of years with air temperature below <−10°, <−20° and <−30 °C were identified.
In the final stage of the present study, for every meteorological station, the magnitude of deviation (%) of the multiannual air temperature values was calculated for the year (January–December), the warm half-year (April–September), and July, as well as the sum of active temperatures (SAT) and the duration of the period with air temperature >10 °C against mean values for the whole country. The totalised percentage of deviation for the aforementioned characteristics was charted, which allowed for the assessment of the relative spatial differentiation of climate conditions in Poland. On such grounds, the potential areas for viticulture in Poland were identified. Additionally, the following were used in determining the boundaries of said areas: the spatial distribution of the sums of the lowest sub-zero temperatures in a month <−10 °C, the number of days with frost [66], and the dates of the beginning and end as well as the duration of the active growth of grapevine.
The final sections of the present paper provide thermal characteristics of the identified potential areas for viticulture in Poland, keeping in mind that thermal conditions are a crucial, yet not the only, element of climate that affect variability and the volume of grapevine yield.
3. Results and Discussion
3.1. Grape Yield in the Period 2009/2010–2018/2019
According to estimates by the National Agricultural Support Centre [7], in recent years there has been a dynamic increase both in the number of growers (from 21 in 2009/2010 to 294 in 2019/2020) as well as in the total grapevine cultivation area in Poland (from 36.0 to 468.6 ha) (Table 1). Consequently, there has been a significant increase in total grape harvest (from 598 to 18746 quintals), with a recent predominance of white grapes over red grapes.
In the analysed 10-year-long period, an increase in the yield per hectare from 19.7 q/ha in 2009/2010 to 62.4 q/ha in 2018/2019 can be attributed to the introduction of more efficient varieties of grapevine and the ongoing global warming. It is worth emphasising that despite the positive trend of grapevine yield, individual years were characterised by a great variability of its volume. Exceptionally unfavourable was the season of 2012/2013 (21.2 q/ha), characterised by a cold winter, and 2017/2018 (33.3 q/ha) with atmospheric drought. On the other hand, particularly favourable, considering the climate of Poland, was the season of 2018/2019, which produced a high yield—62.4 q/ha. As a consequence of the high yield, a positive trend in total wine production in Poland was observed—from 13.6 to 42.4 hL/ha. Low wine production was recorded in the seasons 2009/2010 (13.6 hL/ha) and 2012/2013 (13.3 hL/ha).
Apart from the dynamically increasing grapevine cultivation area in Poland (more than 1 ha), there is an increasing trend in the number of small vineyards (less than 1 ha), often located in agro-tourism farms [5,22,40,67]. Most vineyards are located in Podkarpackie and Małopolskie voivodeships, followed by Lubuskie, Lubelskie, Dolnośląskie and Świętokrzyskie voivodeships [40]. Currently, the largest grapevine plantation (>34 ha) is not located in the traditional area of viticulture in the south of Poland, but in the vicinity of Pyrzyce in Zachodniopomorskie voivodeship.
3.2. Temporal Distribution of Air Temperature 1971–2019
The dynamic growth in the number of grapevine plantations in Poland is predominantly the result of the ongoing climate warming, particularly after the year 1998, which is confirmed by the data presented in Figure 1 and Figure 2 developed for three stations that are representative of different climatic regions of Poland: from warmer (Wrocław), through moderate (Warszawa) to colder (Białystok).
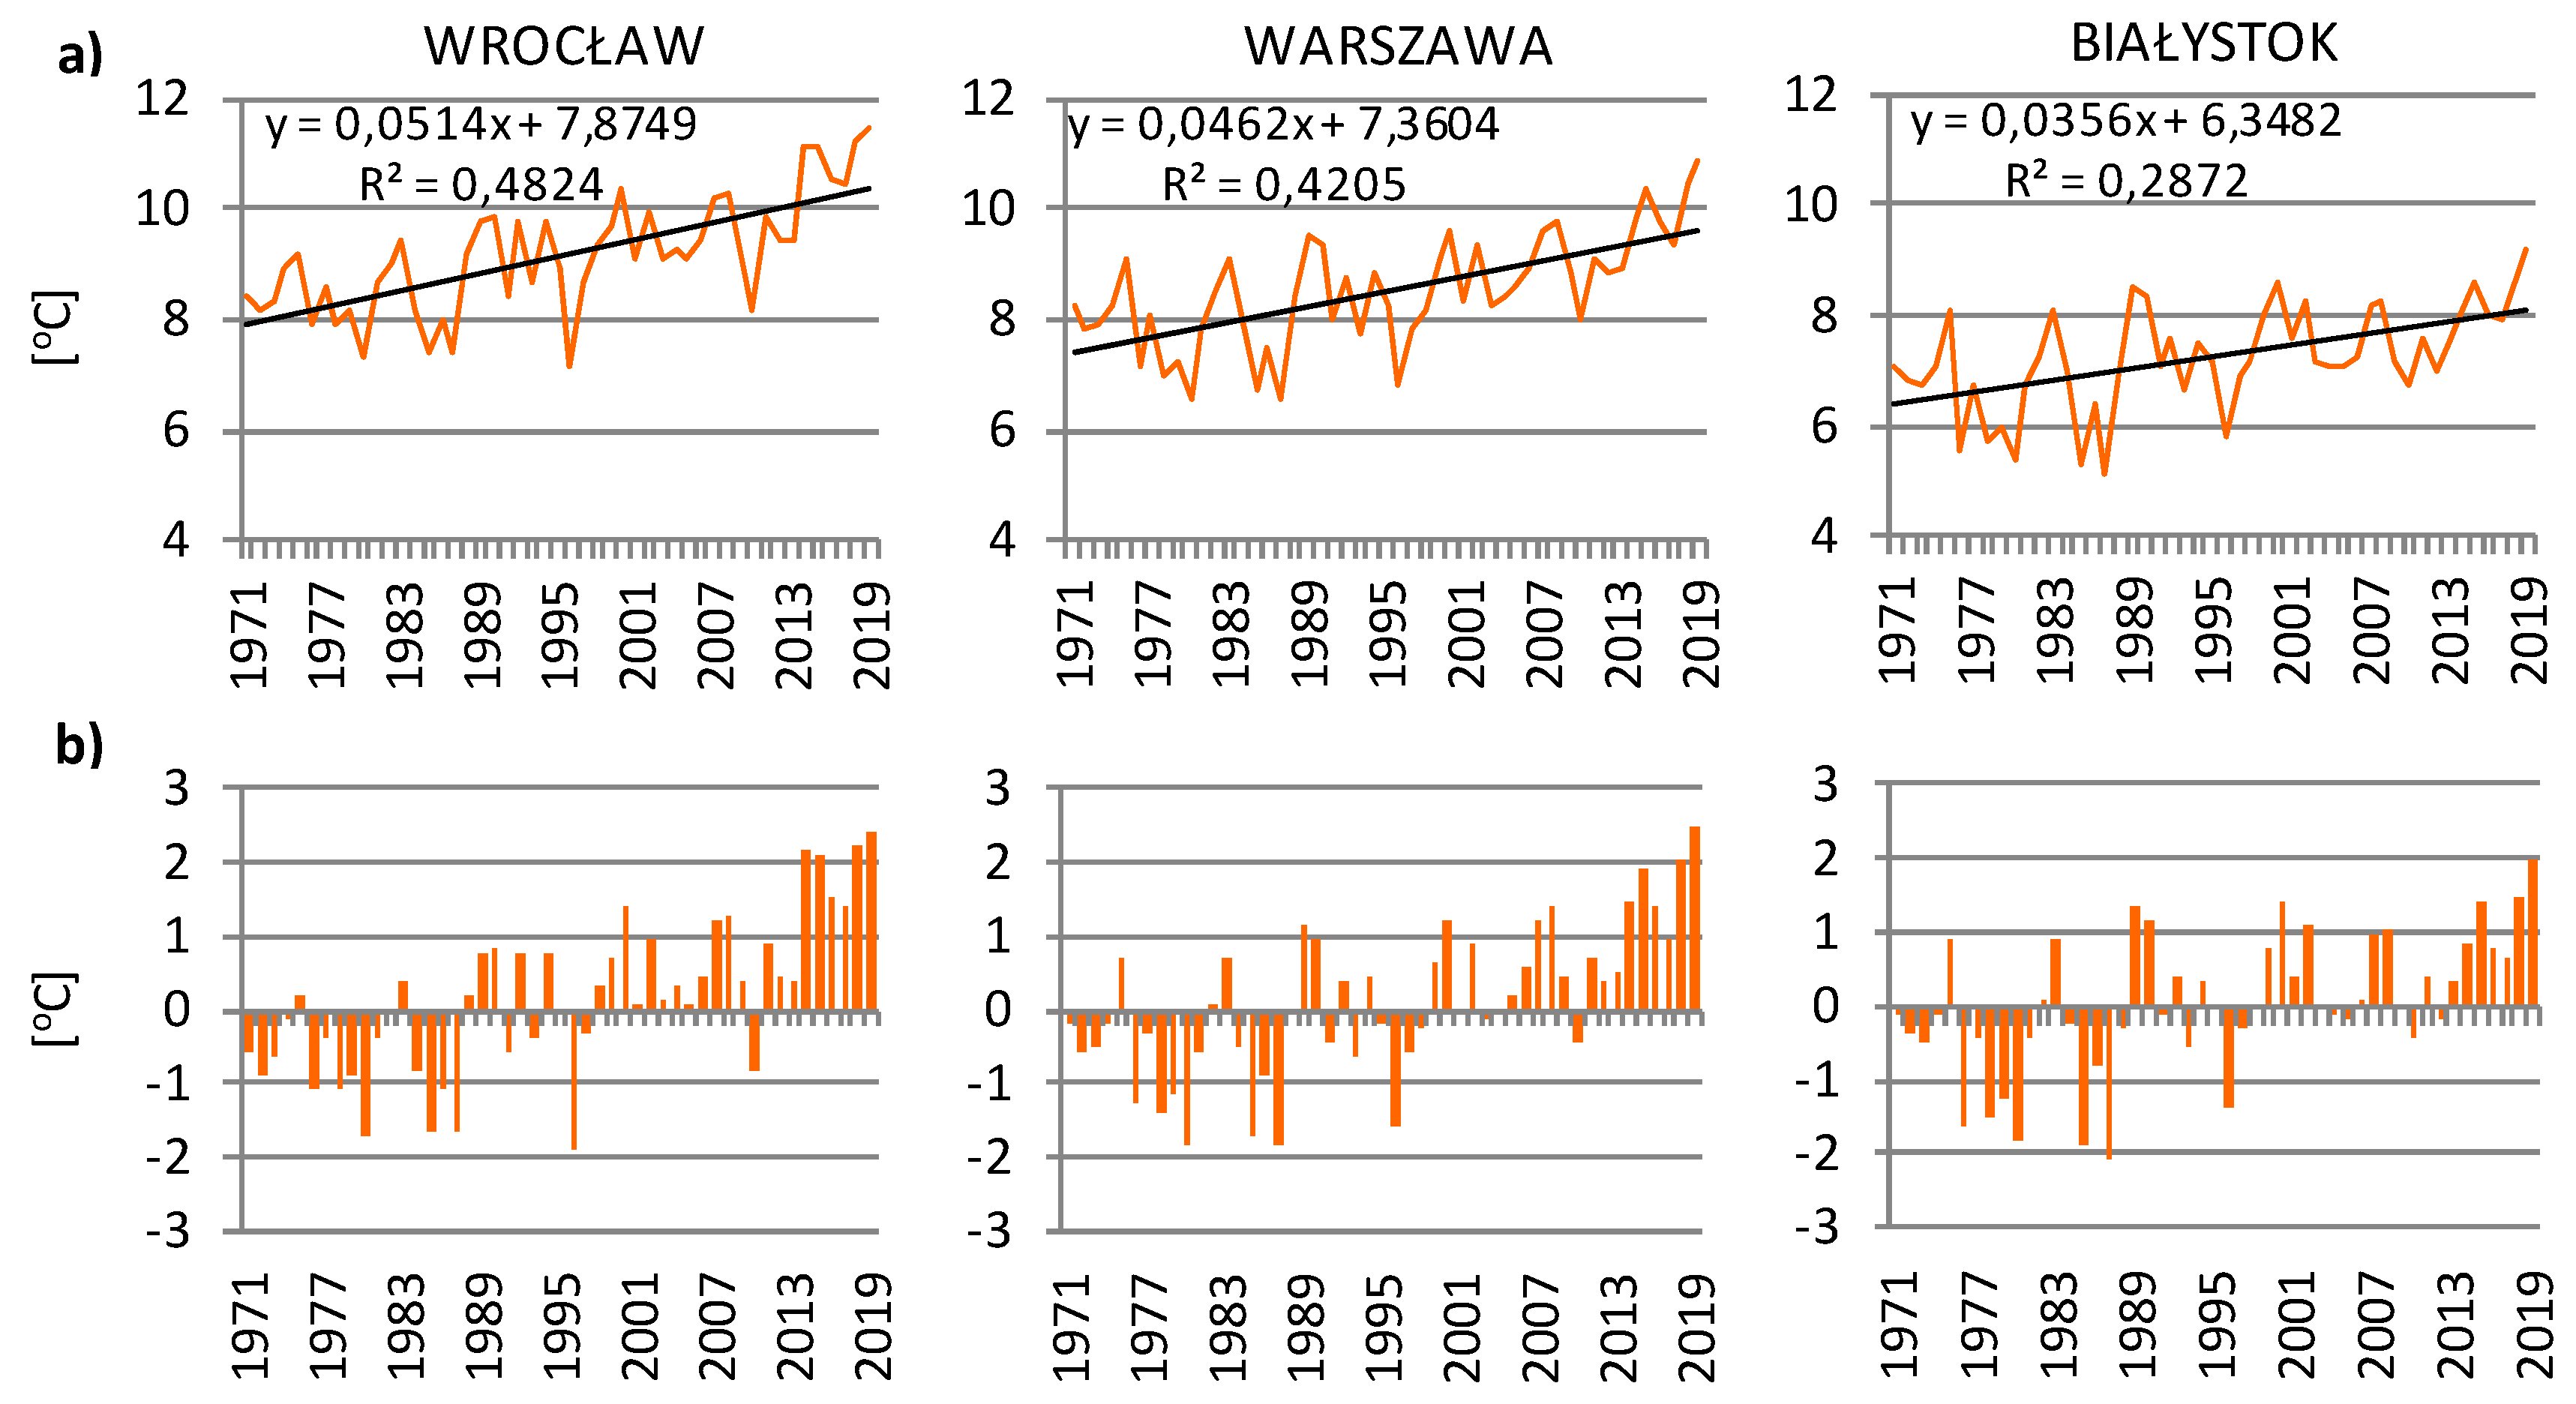
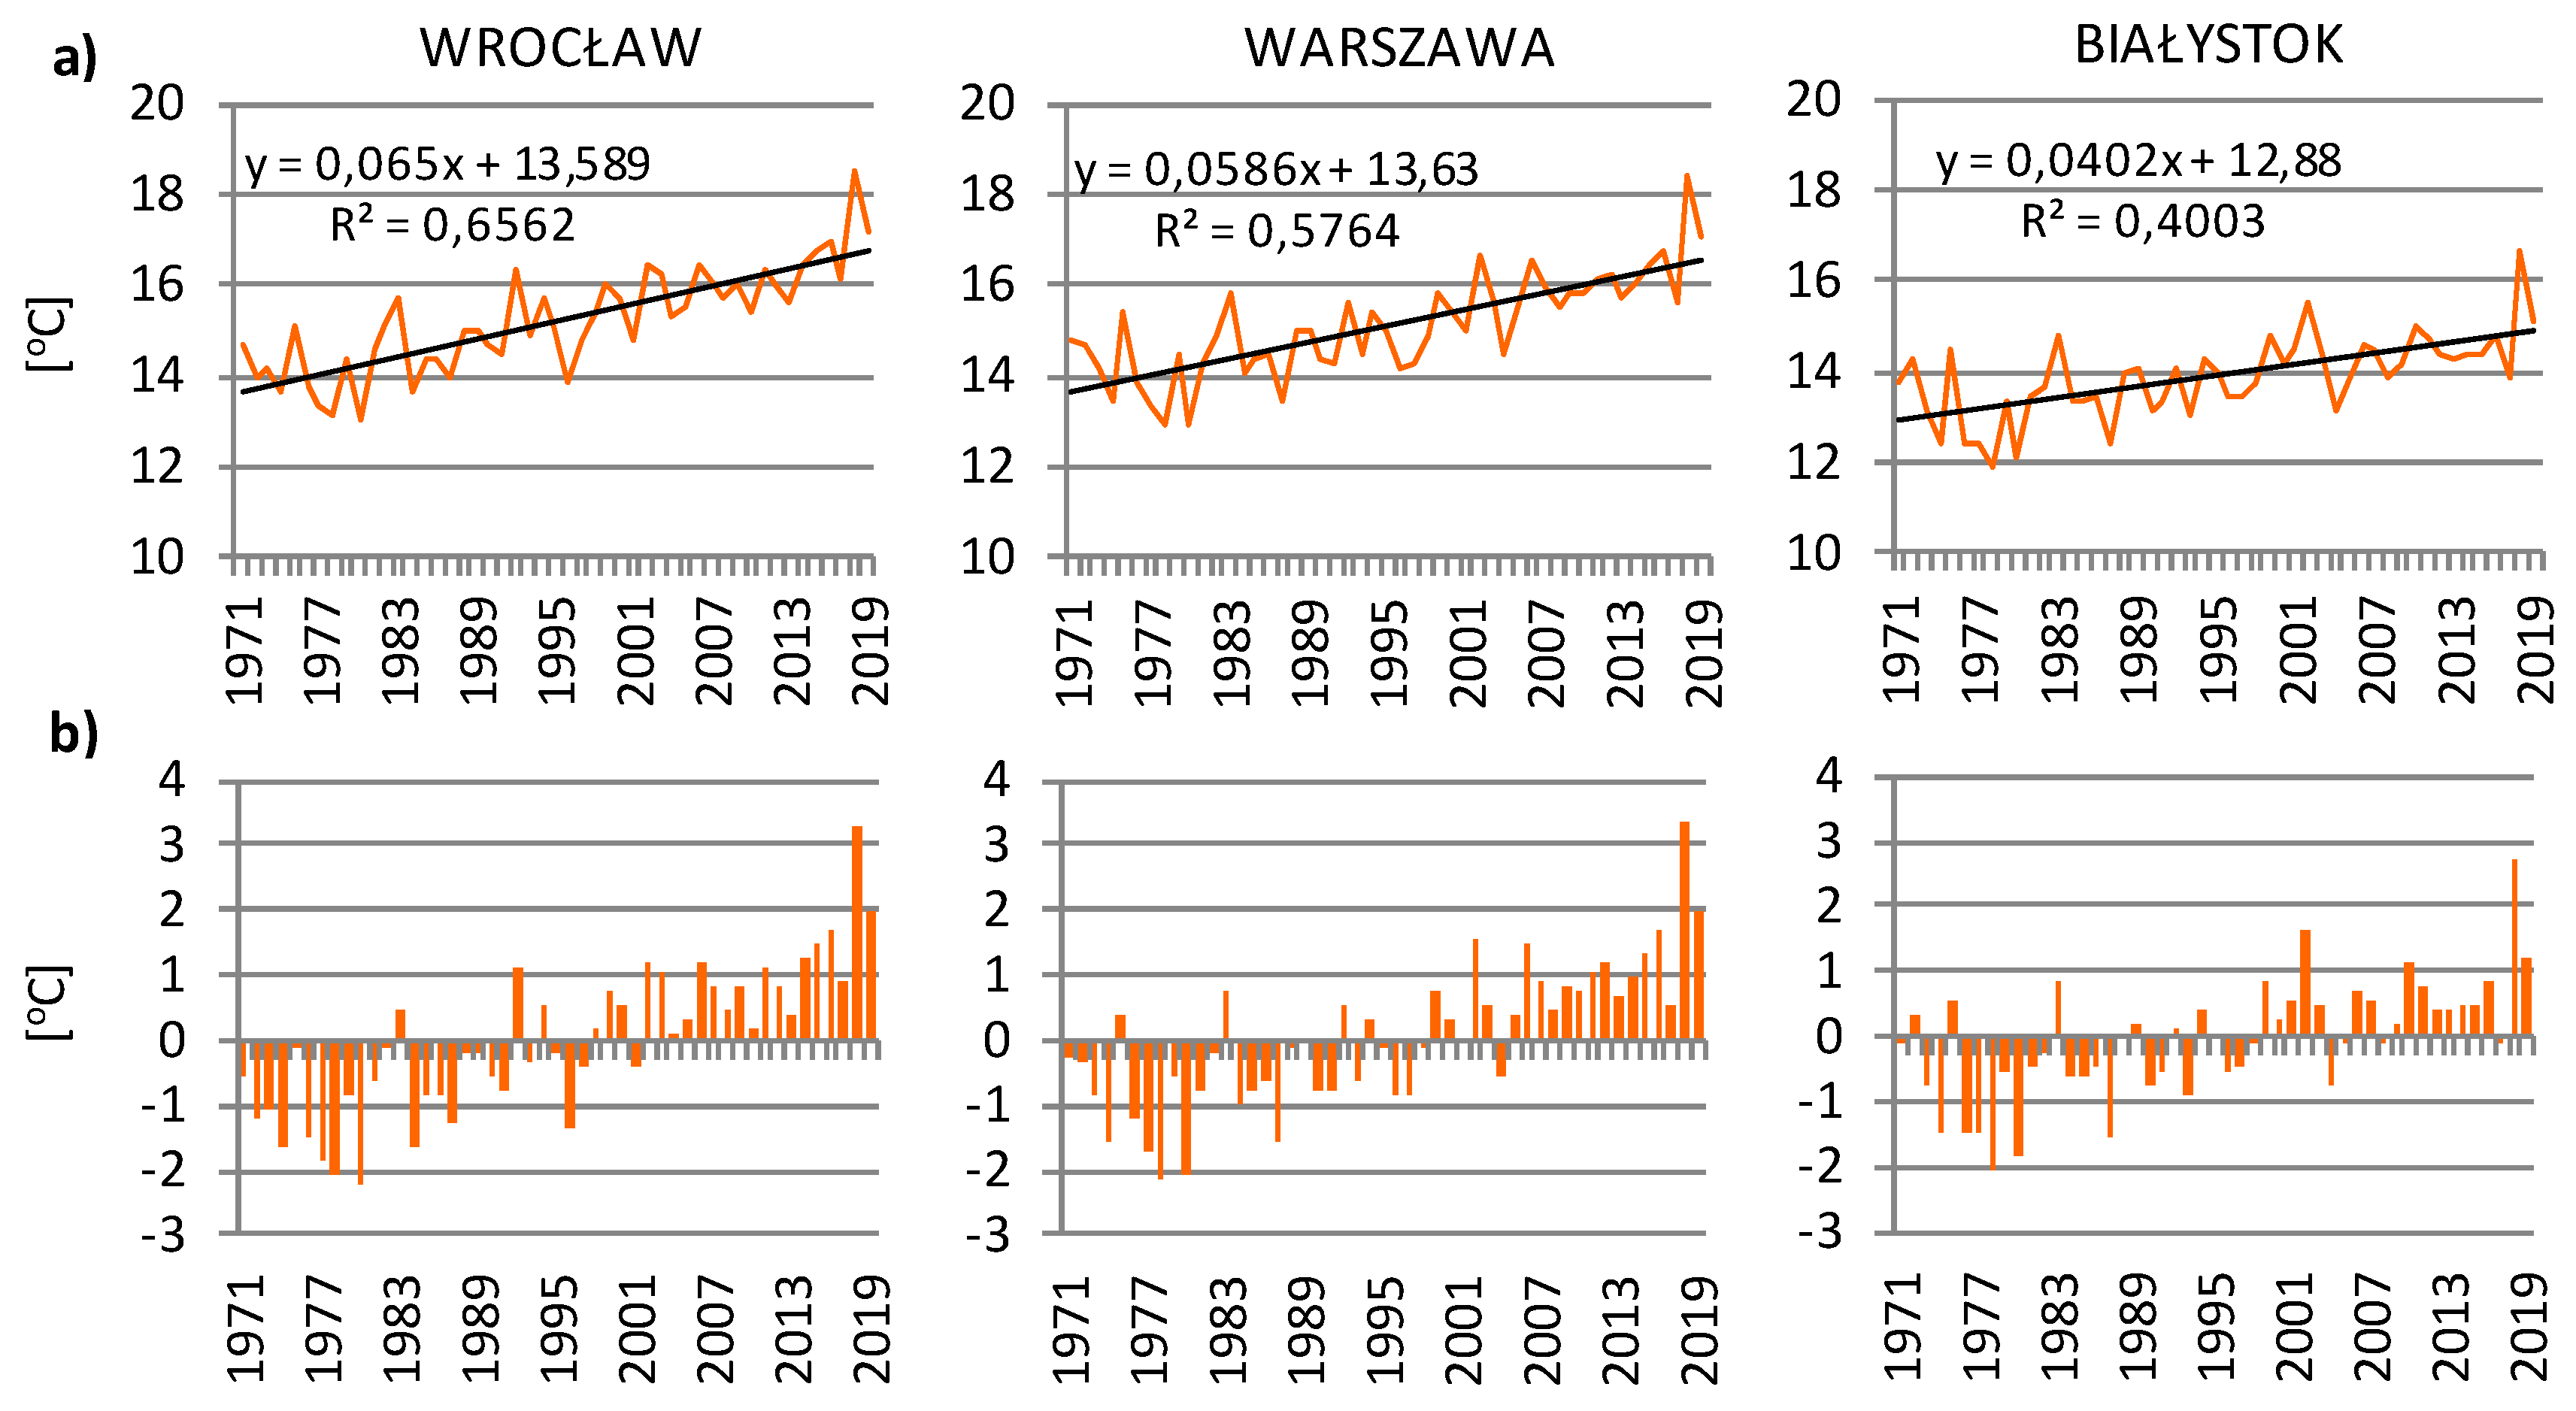
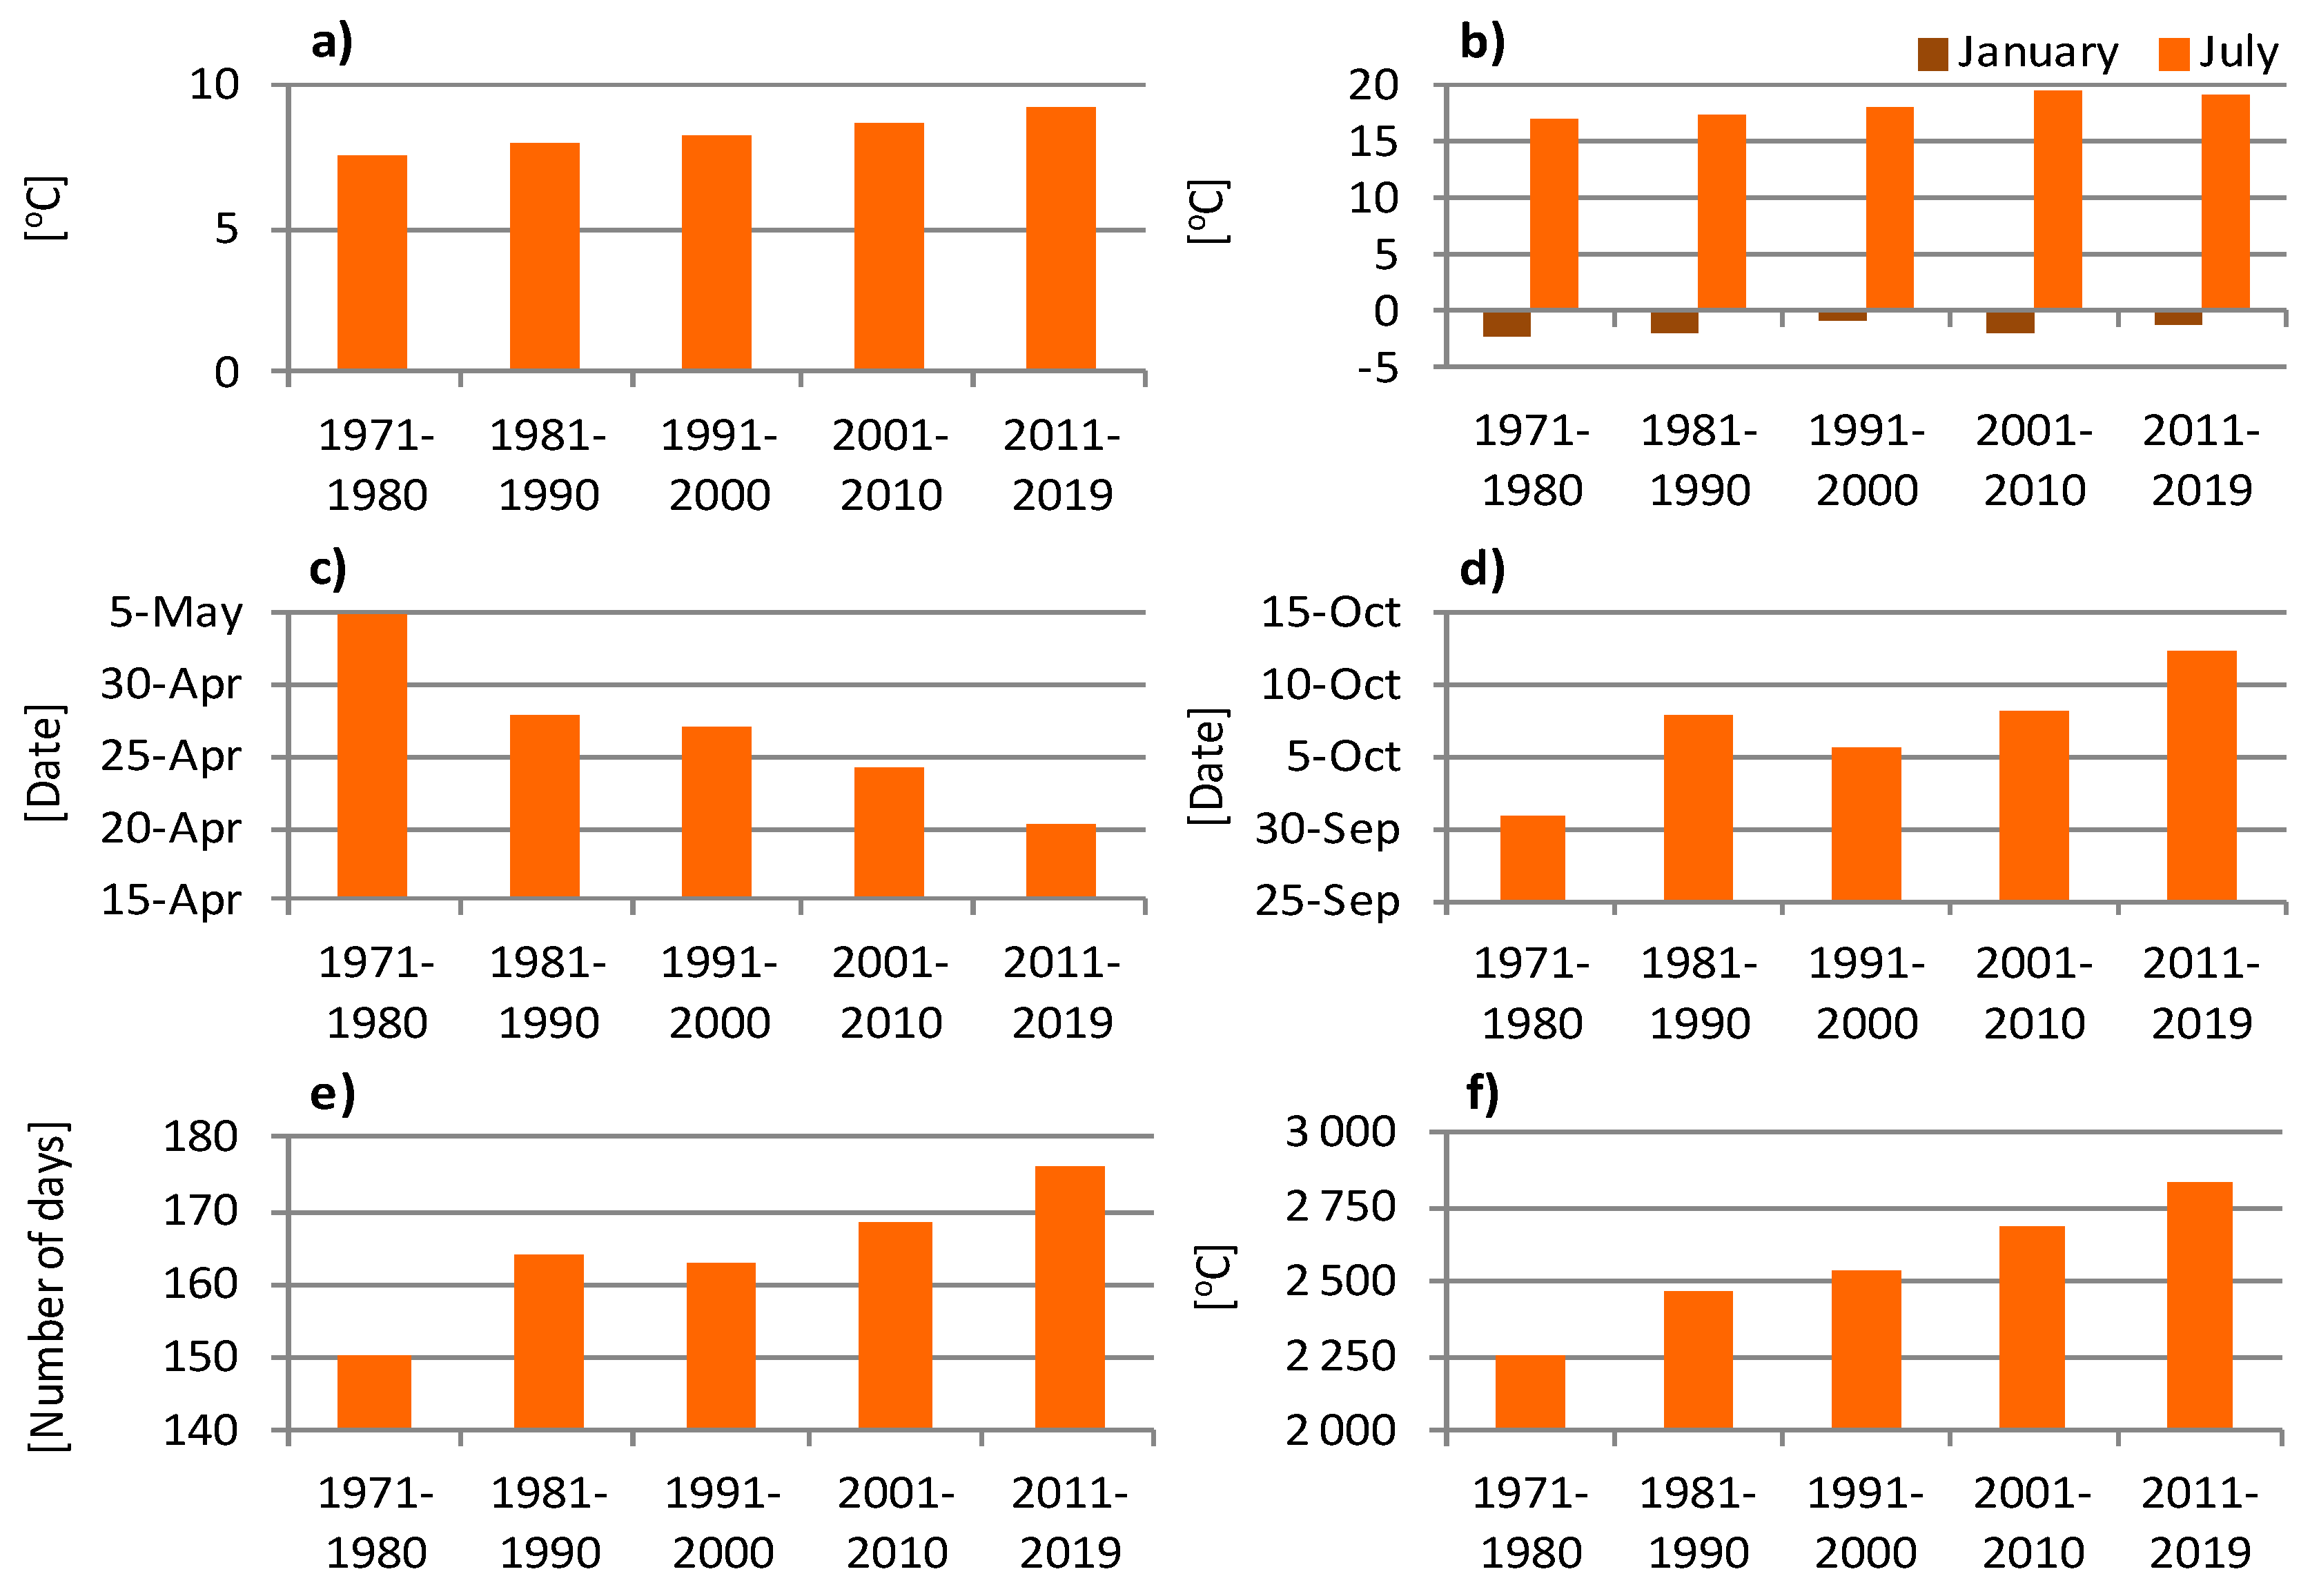
In Poland, in the analysed period of 1971–2019, there is a positive highly statistically significant linear trend of the mean annual air temperature as well as temperature during the vegetative period (April–September)—the highest values were recorded for Wrocław (R2 = 0.482 and 0.656) and Warszawa (R2 = 0.421 and 0.576), with markedly lower values for Białystok (R2 = 0.287 and 0.400). In the analysed period (1971–2019), there was an increase in the mean annual air temperature from 0.051 °C per year in Wrocław to 0.036 °C per year in Białystok, and in the vegetative period (April–September) the increase was more pronounced—0.065 °C and 0.040 °C—a fact promoting the establishment of vineyards in the north-west and west of Poland. Positive deviations of annual mean air temperature and that of the vegetative period were found to be particularly great after 2013—from 1.0 °C to more than 2.0 °C (Figure 1 and Figure 2). The results are in line with the spatial average for the whole area of Poland—in the subsequent decades in relation to the analysed period, there was a pronounced increase in the mean air temperatures in January, in July and in the year (Figure 3a,b), which significantly exceeds the criteria given in the literature on the subject concerning intense viticulture [62].
The consequences of the observed positive trend in temperature are the changing dates of the beginning and end of as well as the duration of the active growth period, which begins at >10 °C. As is shown in Figure 3c–e, a marked earlier beginning in the spring and later end in the autumn result in a significant lengthening of its duration—for Poland, on average, from 150 days in the decade 1971–1980 to 176 days in the most recent years (2011–2019).
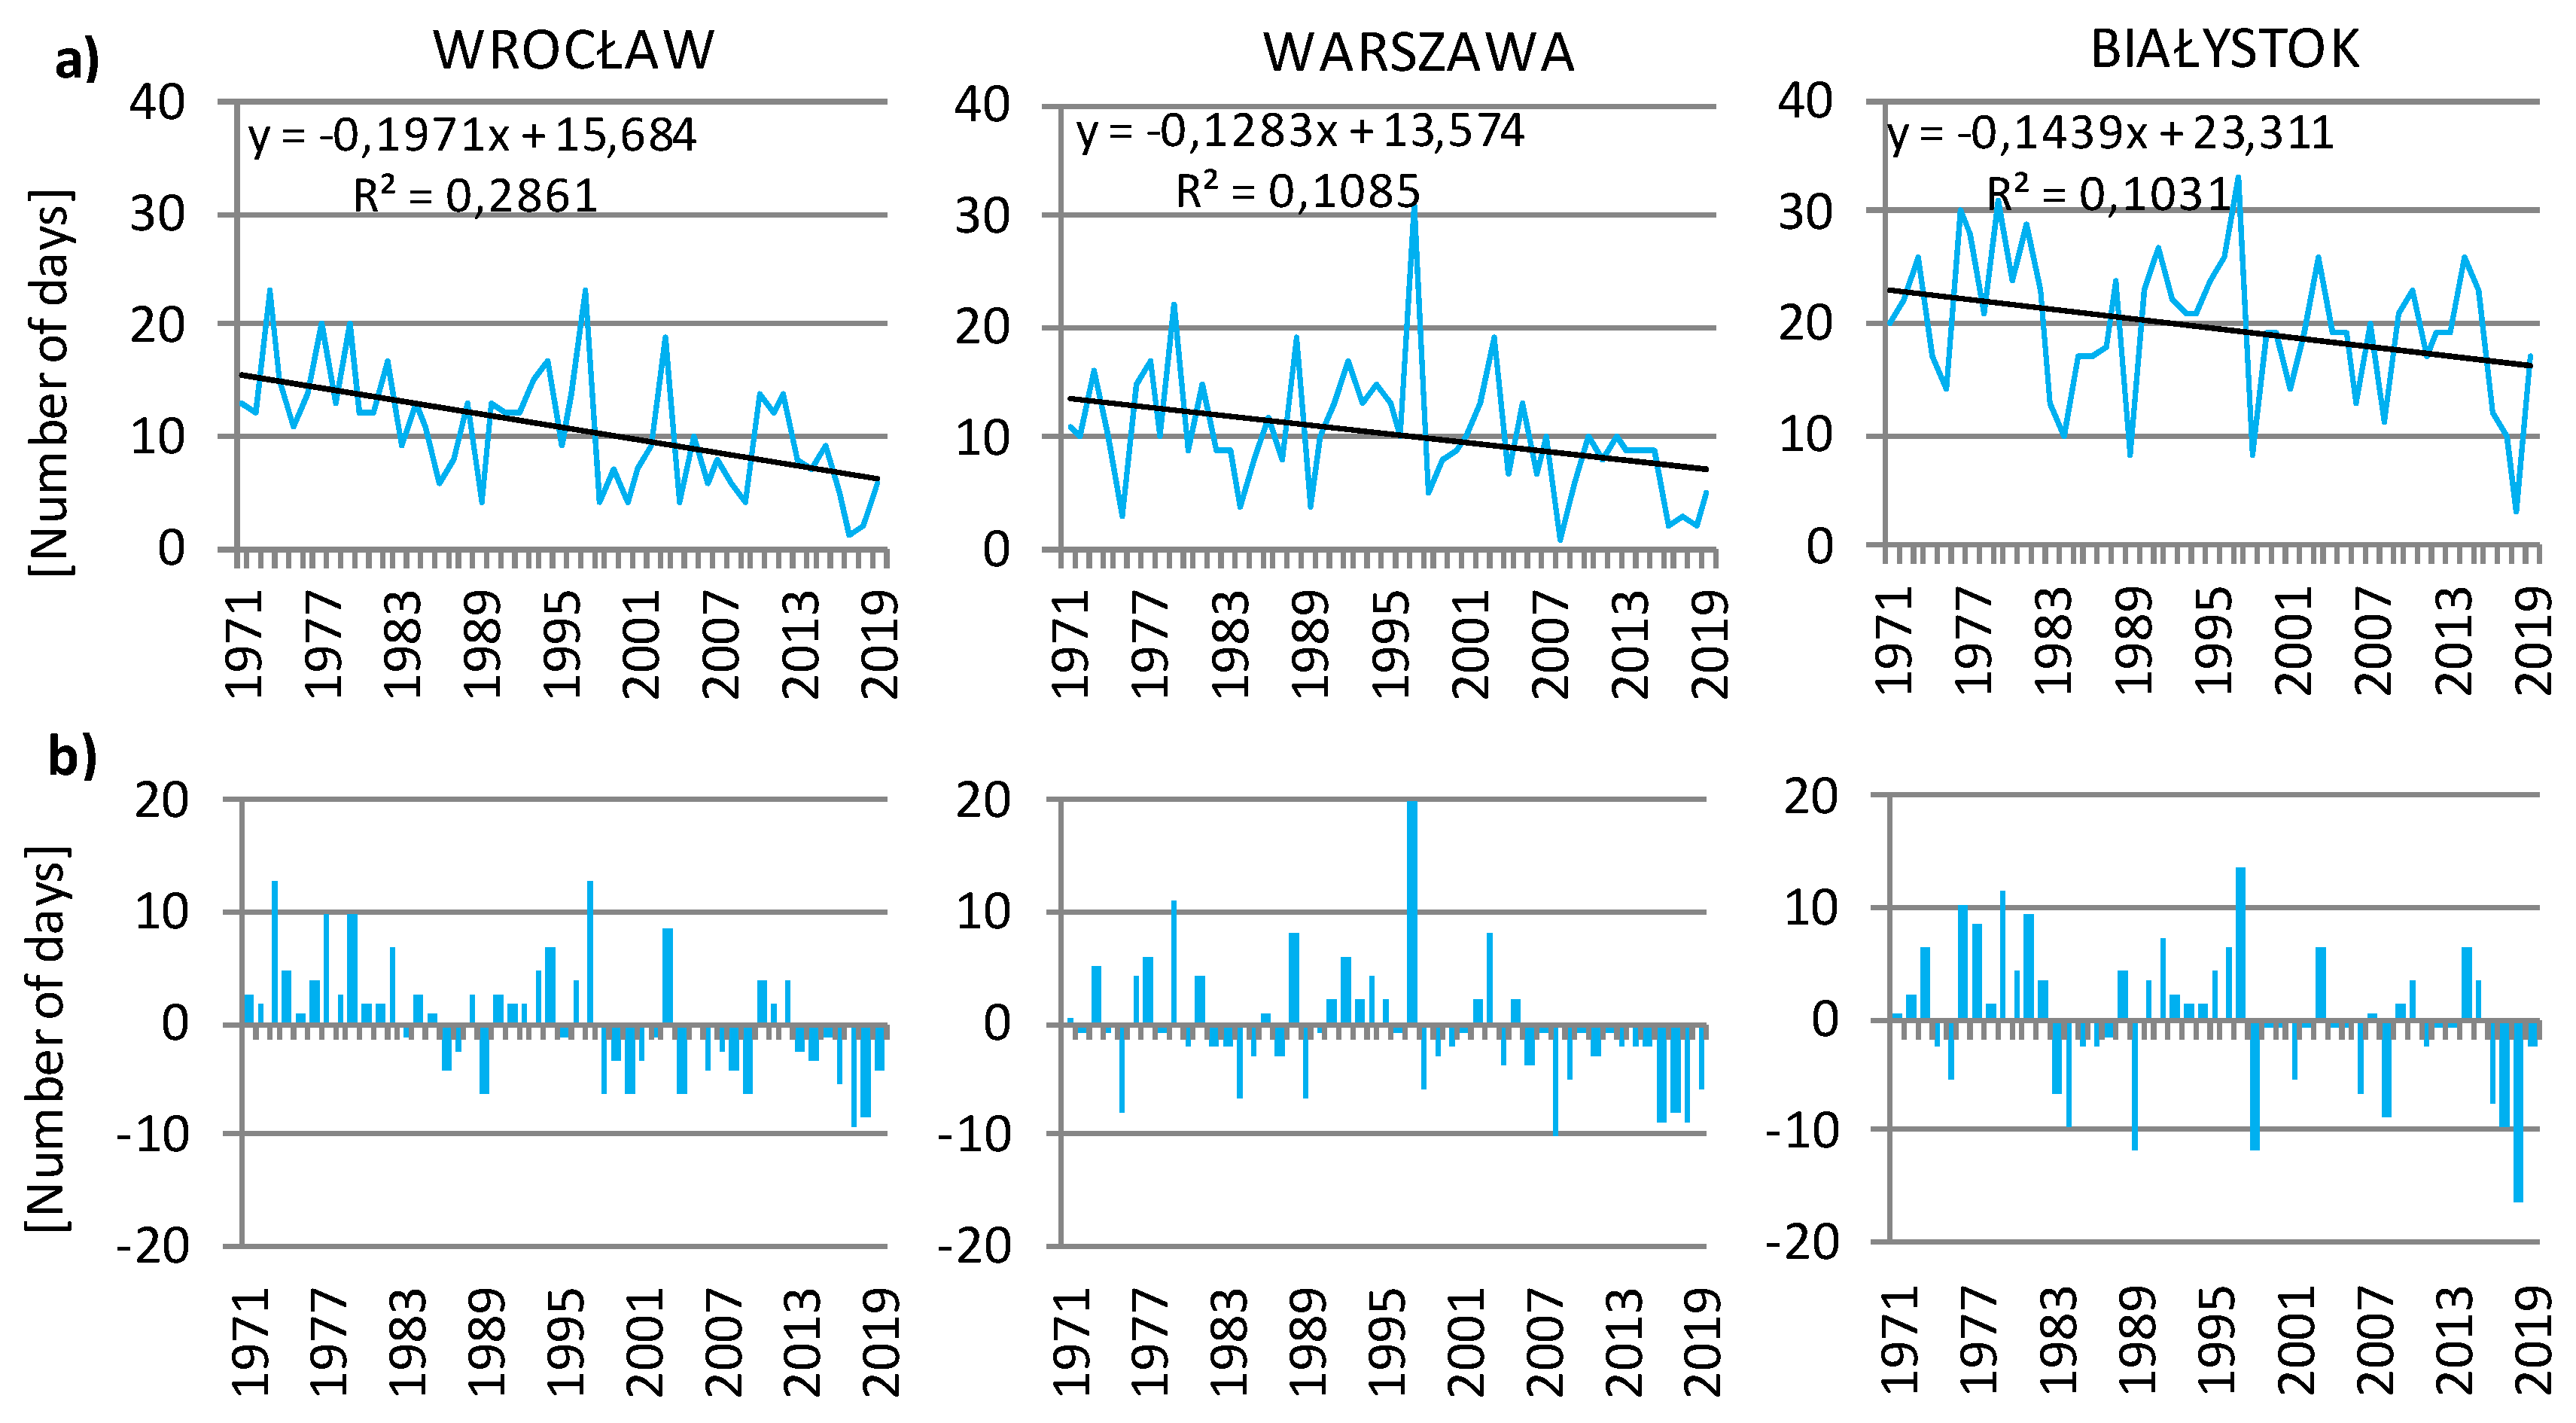
The trend of the length of the active plant vegetation period calculated for the stations in the analysed multiannual period 1971–2019 is positive and highly statistically significant, yet the R2 values decrease from the west to the east of the country (Figure 4). Since 1998, the subsequent years showed almost exclusively positive deviations in the length of the active growth period, particularly in the stations in Wrocław and Warszawa. The greatest positive deviations of the length of this period were observed in the years 2000, 2014, 2018 and 2019.
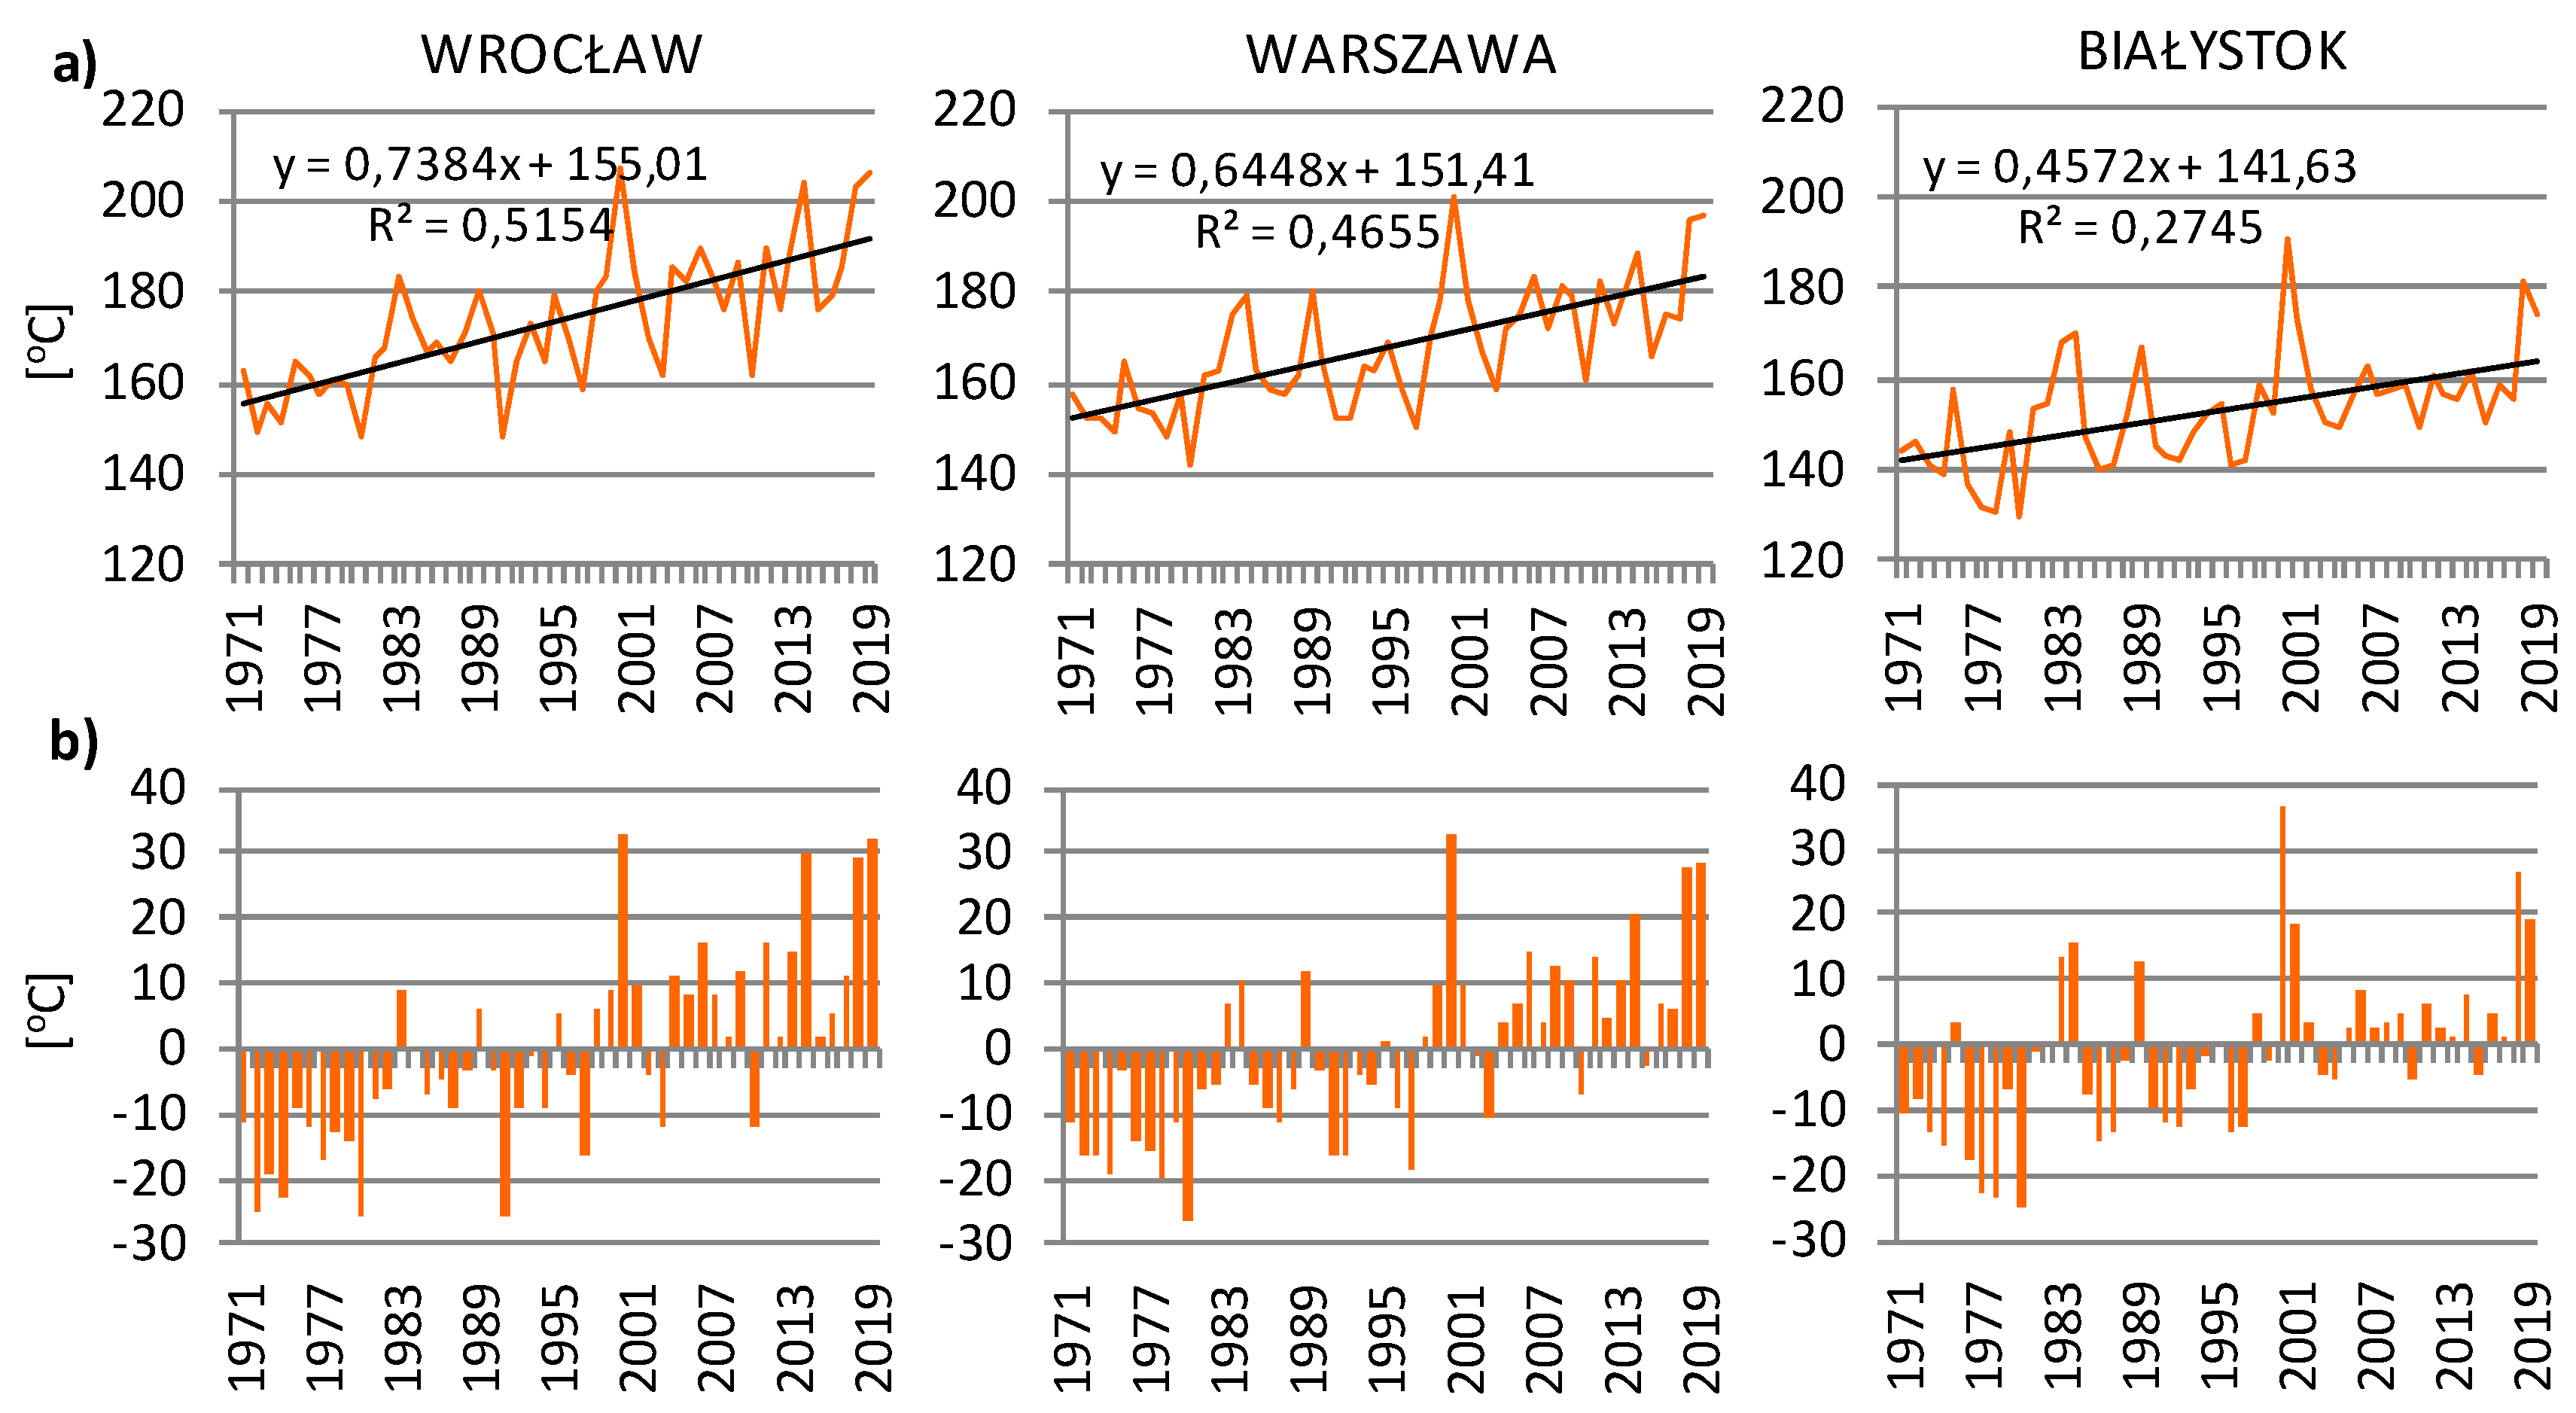
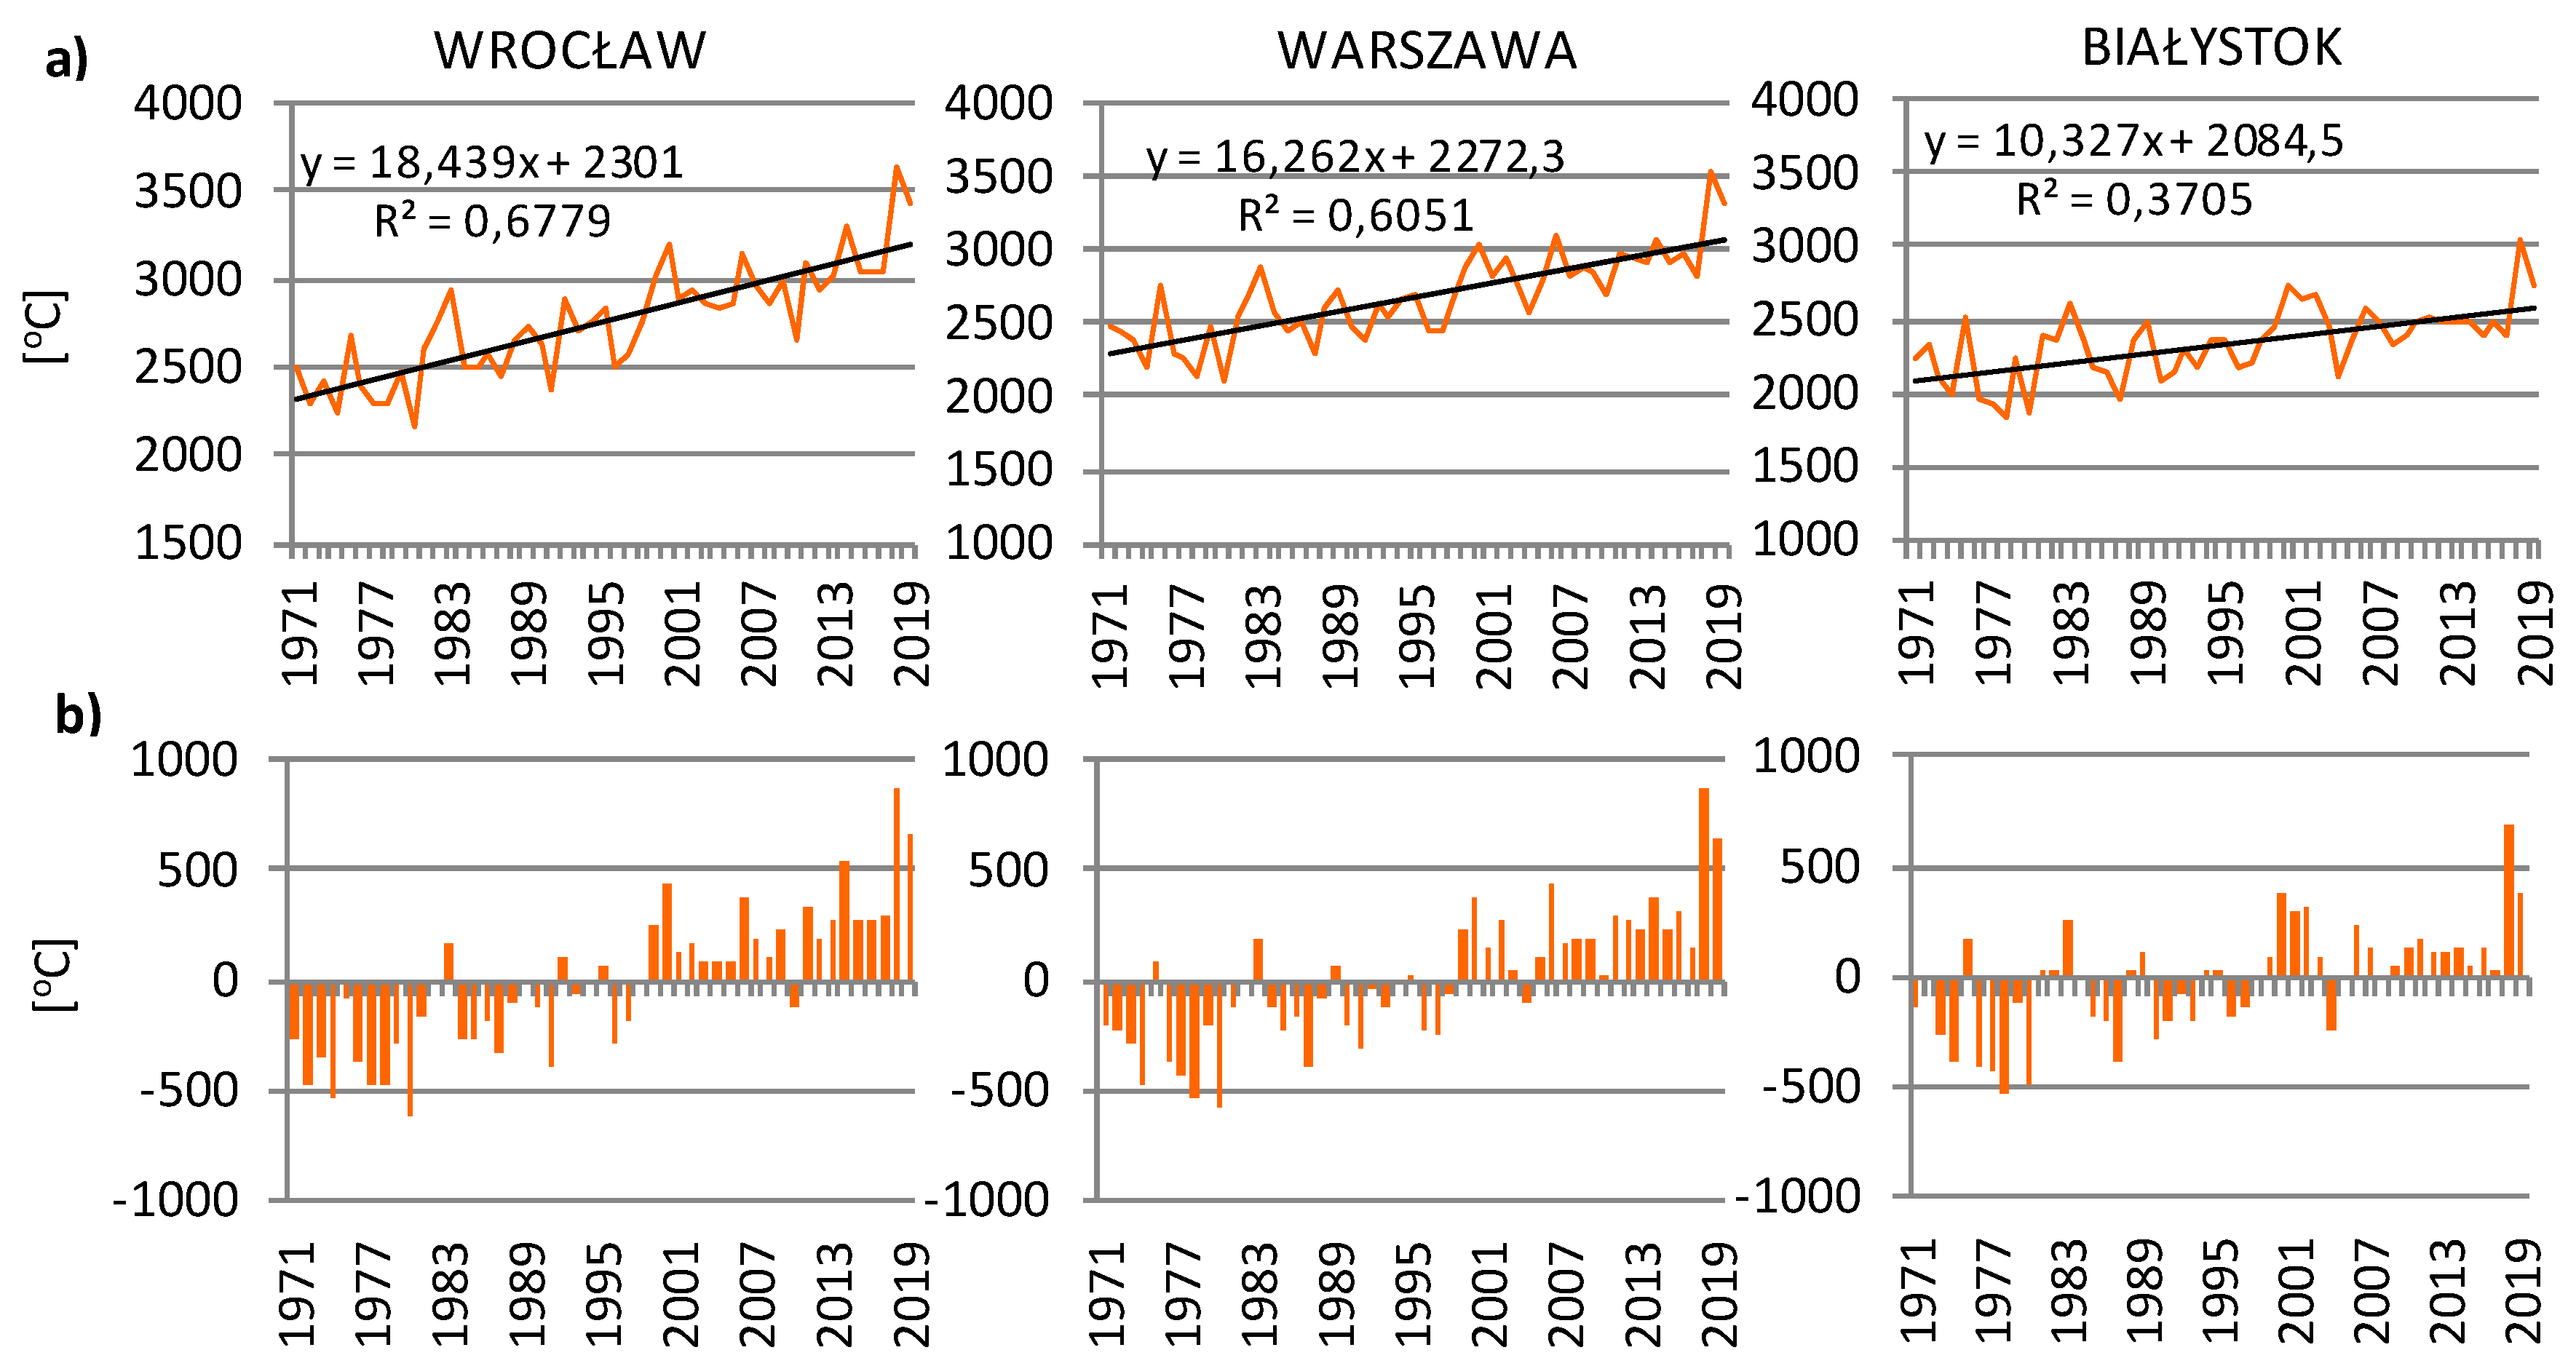
In the determined period of plant active growth (at >10 °C), the sums of active temperatures (SAT), i.e., the index commonly used for the purpose of the assessment of thermal conditions for viticulture, were calculated. As is shown in Figure 5, SAT values calculated for the selected three stations demonstrate a positive, highly statistically significant trend in the period 1971–2019 for Wrocław (R2 = 0.678) and Warszawa (R2 = 0.605), and slightly weaker for Białystok (R2 = 0.371). Very high as well as very low values of SAT index in individual years may be related to fluctuations in grapevine yield (Table 1). After the year 1998, SAT values in the following years amounted to more than 2500 °C in Wrocław and Warszawa, respectively, reaching 3647 and 3539 °C in 2018. Additionally, in Wrocław, since 2013, each year’s SAT values were higher than 3000 °C (Figure 5).
Despite the climate warming, the observed spring and autumn frosts still pose a threat to grapevines in Poland [37,43,66,68]. According to Figure 6, the number of days with frost recorded at the altitude of 2 m agl markedly decreases in the analysed multiannual period 1971–2019, which only confirms the negative, highly statistically significant trend. It can be assumed that in the western and central parts of the country, frost putting the plantation at risk occurs with a frequency of 1–2 years per 10, and in the eastern part of Poland 2–3 years per 10.
A significant risk to viticulture in a given area is also posed by a low sub-zero air temperature recorded mainly from December to February, and at times as late as till March (Table 2). Most frequently, such risks occur in January, for example in the region of Wrocław the frequency of years with a temperature below −10 °C amounts to 71.4%, and below −20 °C amounts to 16.3%; in the region of Warszawa, respectively, it is 83.7% and 22.4%, and in the region of Białystok, 87.8% and 40.8%. With the exception of the west of Poland, in the remaining area of the country there is a possibility of a very rare occurrence of a temperature below −30 °C, but only in January.
3.3. Spatial Distribution of Air Temperature
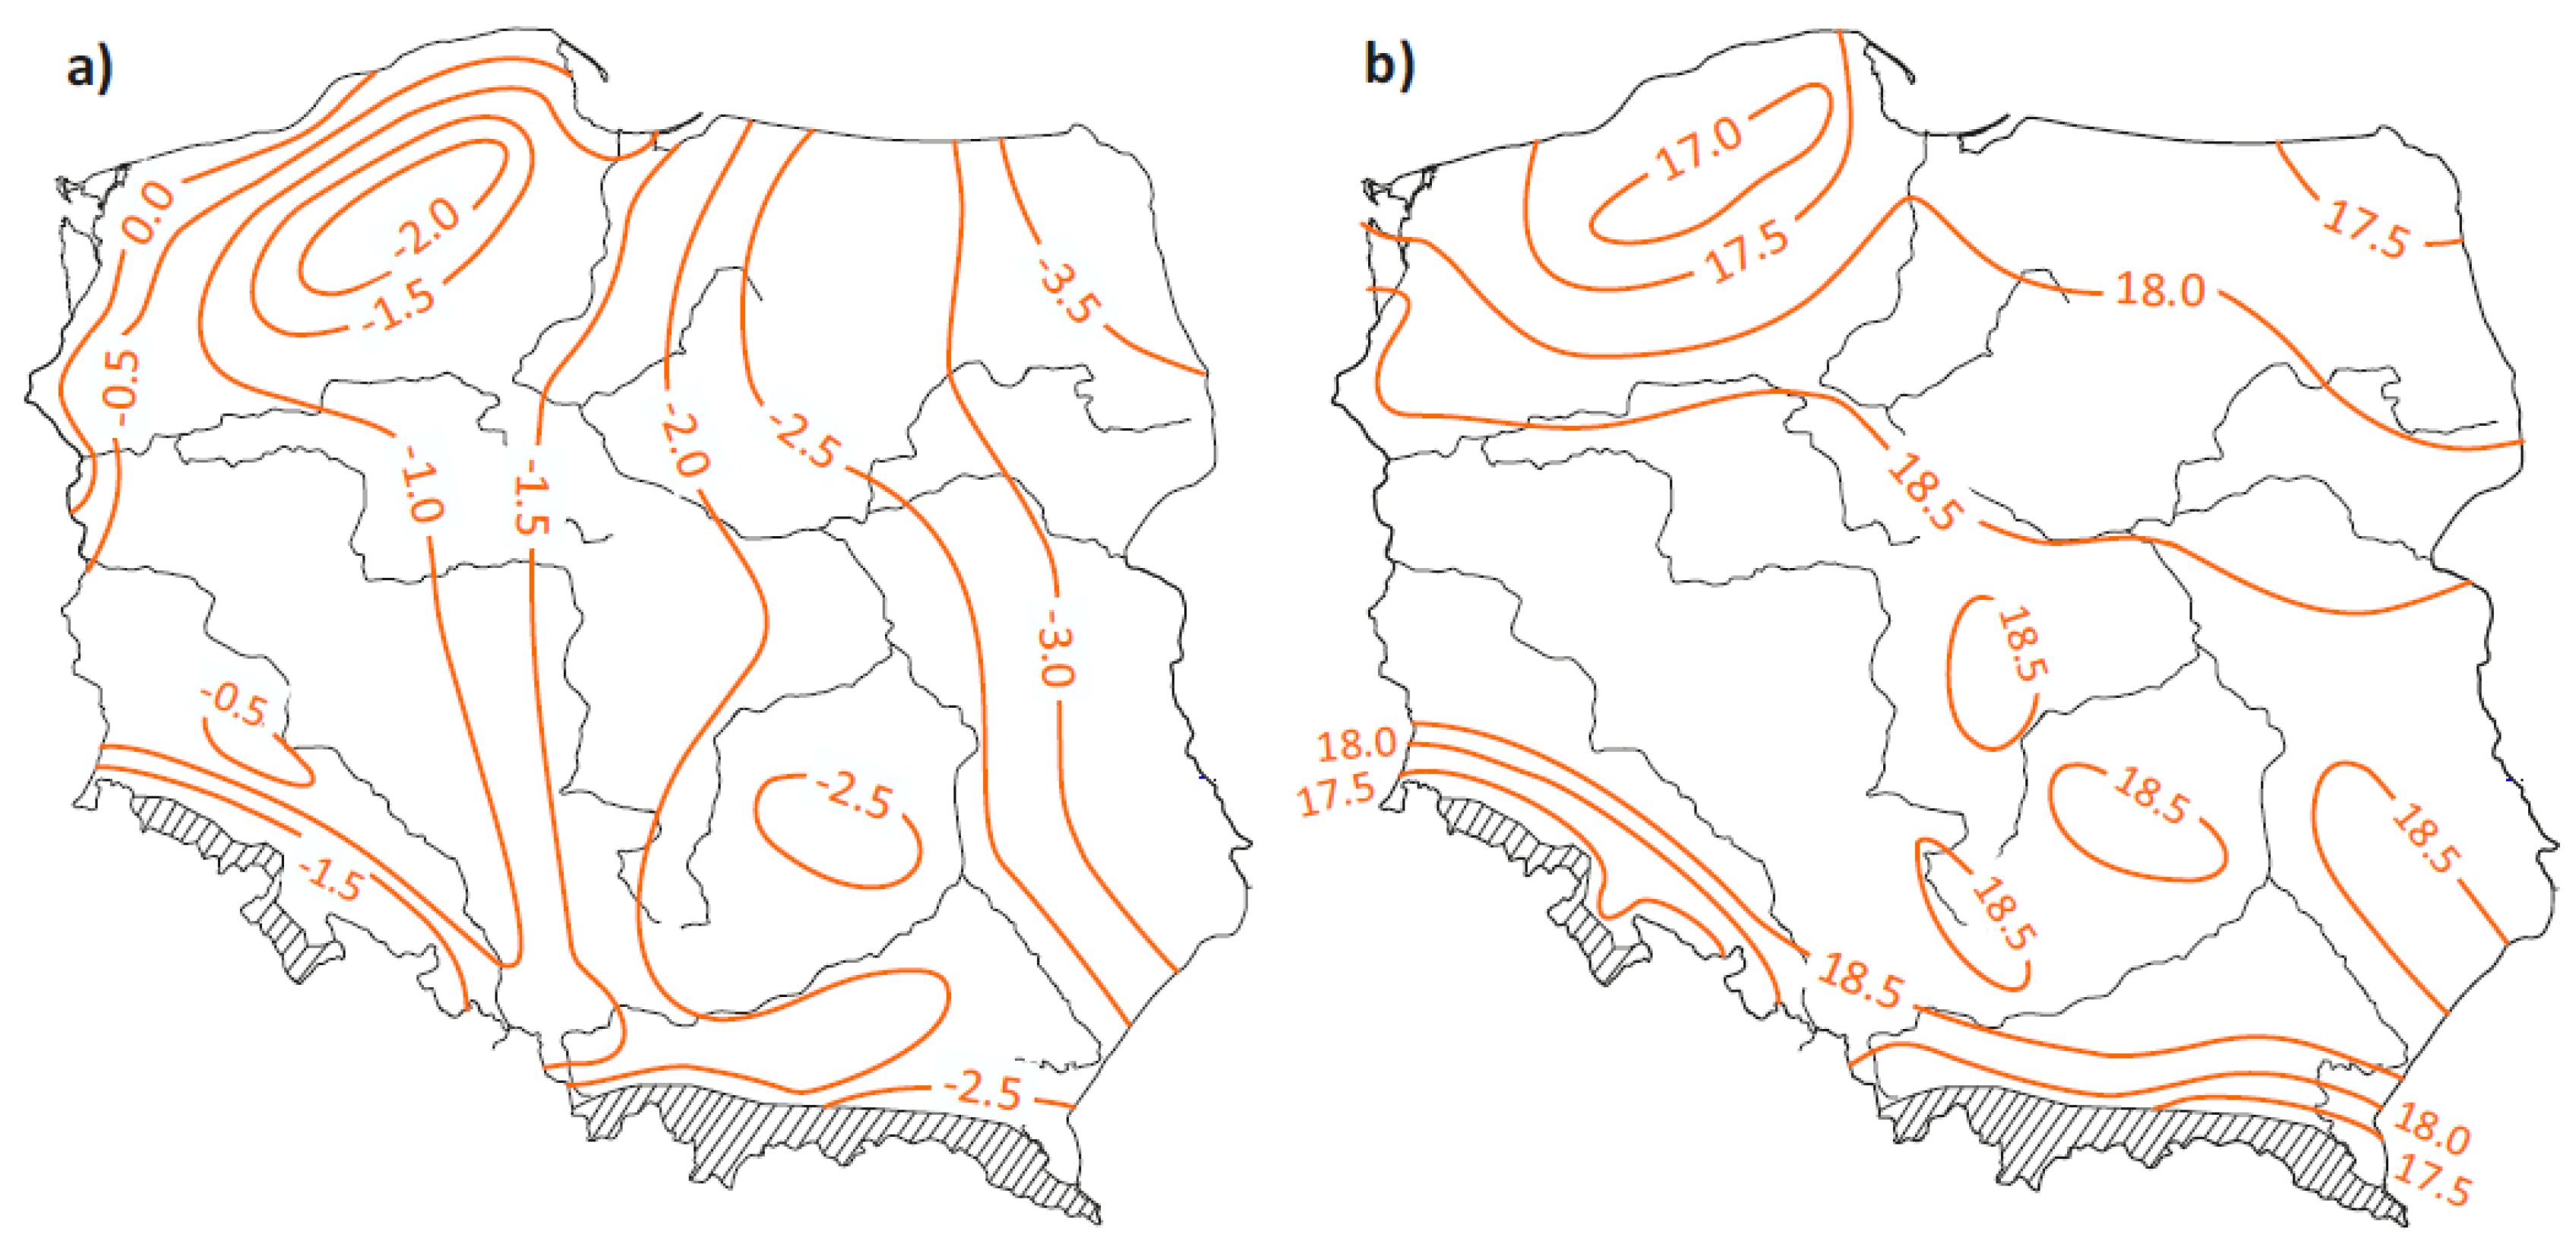
The dominanting effect of the warm oceanic air masses from the west and the cool continental masses from the east makes air temperature isotherms in January longitudinal, from 0.0 °C along the lower course of the Odra River and on the shores of the Baltic Sea to −3.5 °C in the Suwalskie Lakeland (Figure 7a). According to Bosak [42], areas where the temperature in January is not lower than −1.5 °C are suitable for relatively safe cultivation of Vitis vinifera L, without the necessity of covering the vines in winter. In January, the isotherm of −1.5 °C determined for the period 1971–2019 runs from the north to the south, almost through the centre of Poland, along the lower course of the Vistula river, through Toruń, Konin and further towards Bielsko-Biała. However, it must be emphasised that in recent years (2000–2019), there has been a shift in the isotherm of −1.5 °C towards the east. In turn, in July in the period of 1971–2019, the latitudinal course of isotherms is determined by sun angle and altitude asl. The mean values of air temperature in this month range from 17 °C in the higher parts of the Pomeranian Lakeland to 18.5 °C in the central lowland area of Poland, and locally they can amount to 19 °C (Figure 7b). Therefore, almost the whole area of Poland meets the viticulture criterion of air temperature in July of >17 °C specified in the literature on this subject.
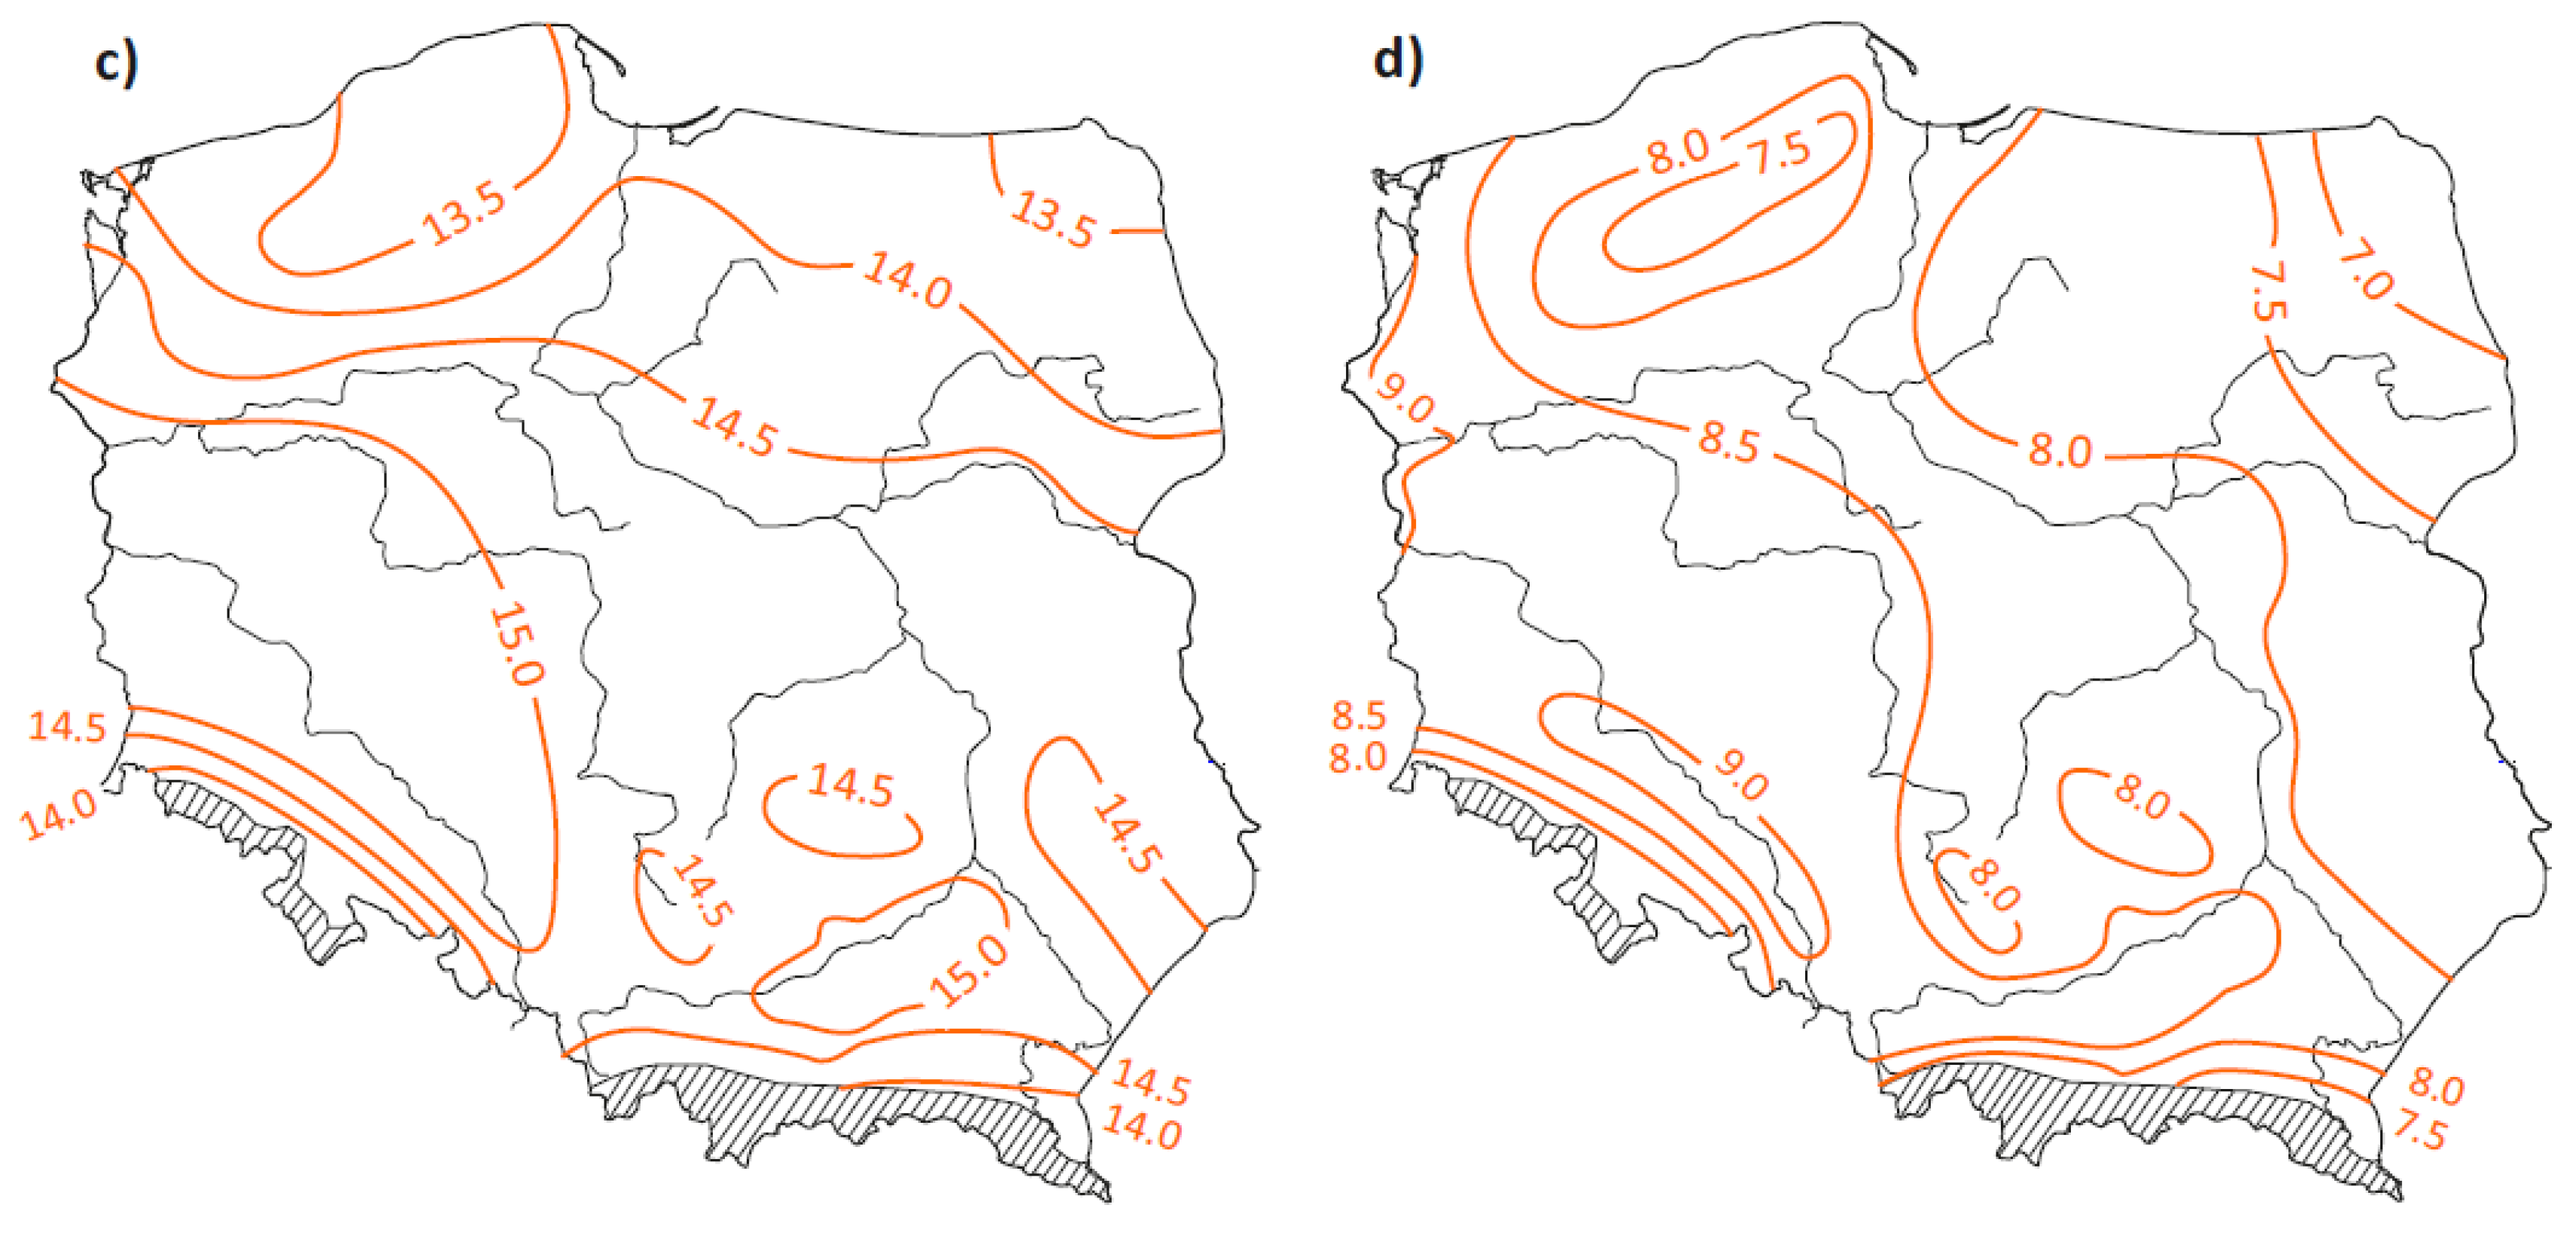
In turn, during the vegetative period, the air temperature conducive to viticulture, as given by the literature on the subject, should be >14 °C [42,69]. Such temperature values were identified for approx. 80% of the country’s area, yet the most favourable conditions in this period are recorded in the south-west region of Poland and the Sandomierz Basin (Figure 7c).
Another thermal criterion taken into account in the literature on the subject is mean annual air temperature >8.0 °C [42,69]. These values are characteristic for the areas located west of the San and Vistula Rivers (off the hills of the Pomeranian Lakeland), along the Odra River—the areas from the mouth of the Nysa Łużycka River to Szczecin and from Racibórz to Legnica—where the values are as high as over 9.0 °C (Figure 7d).
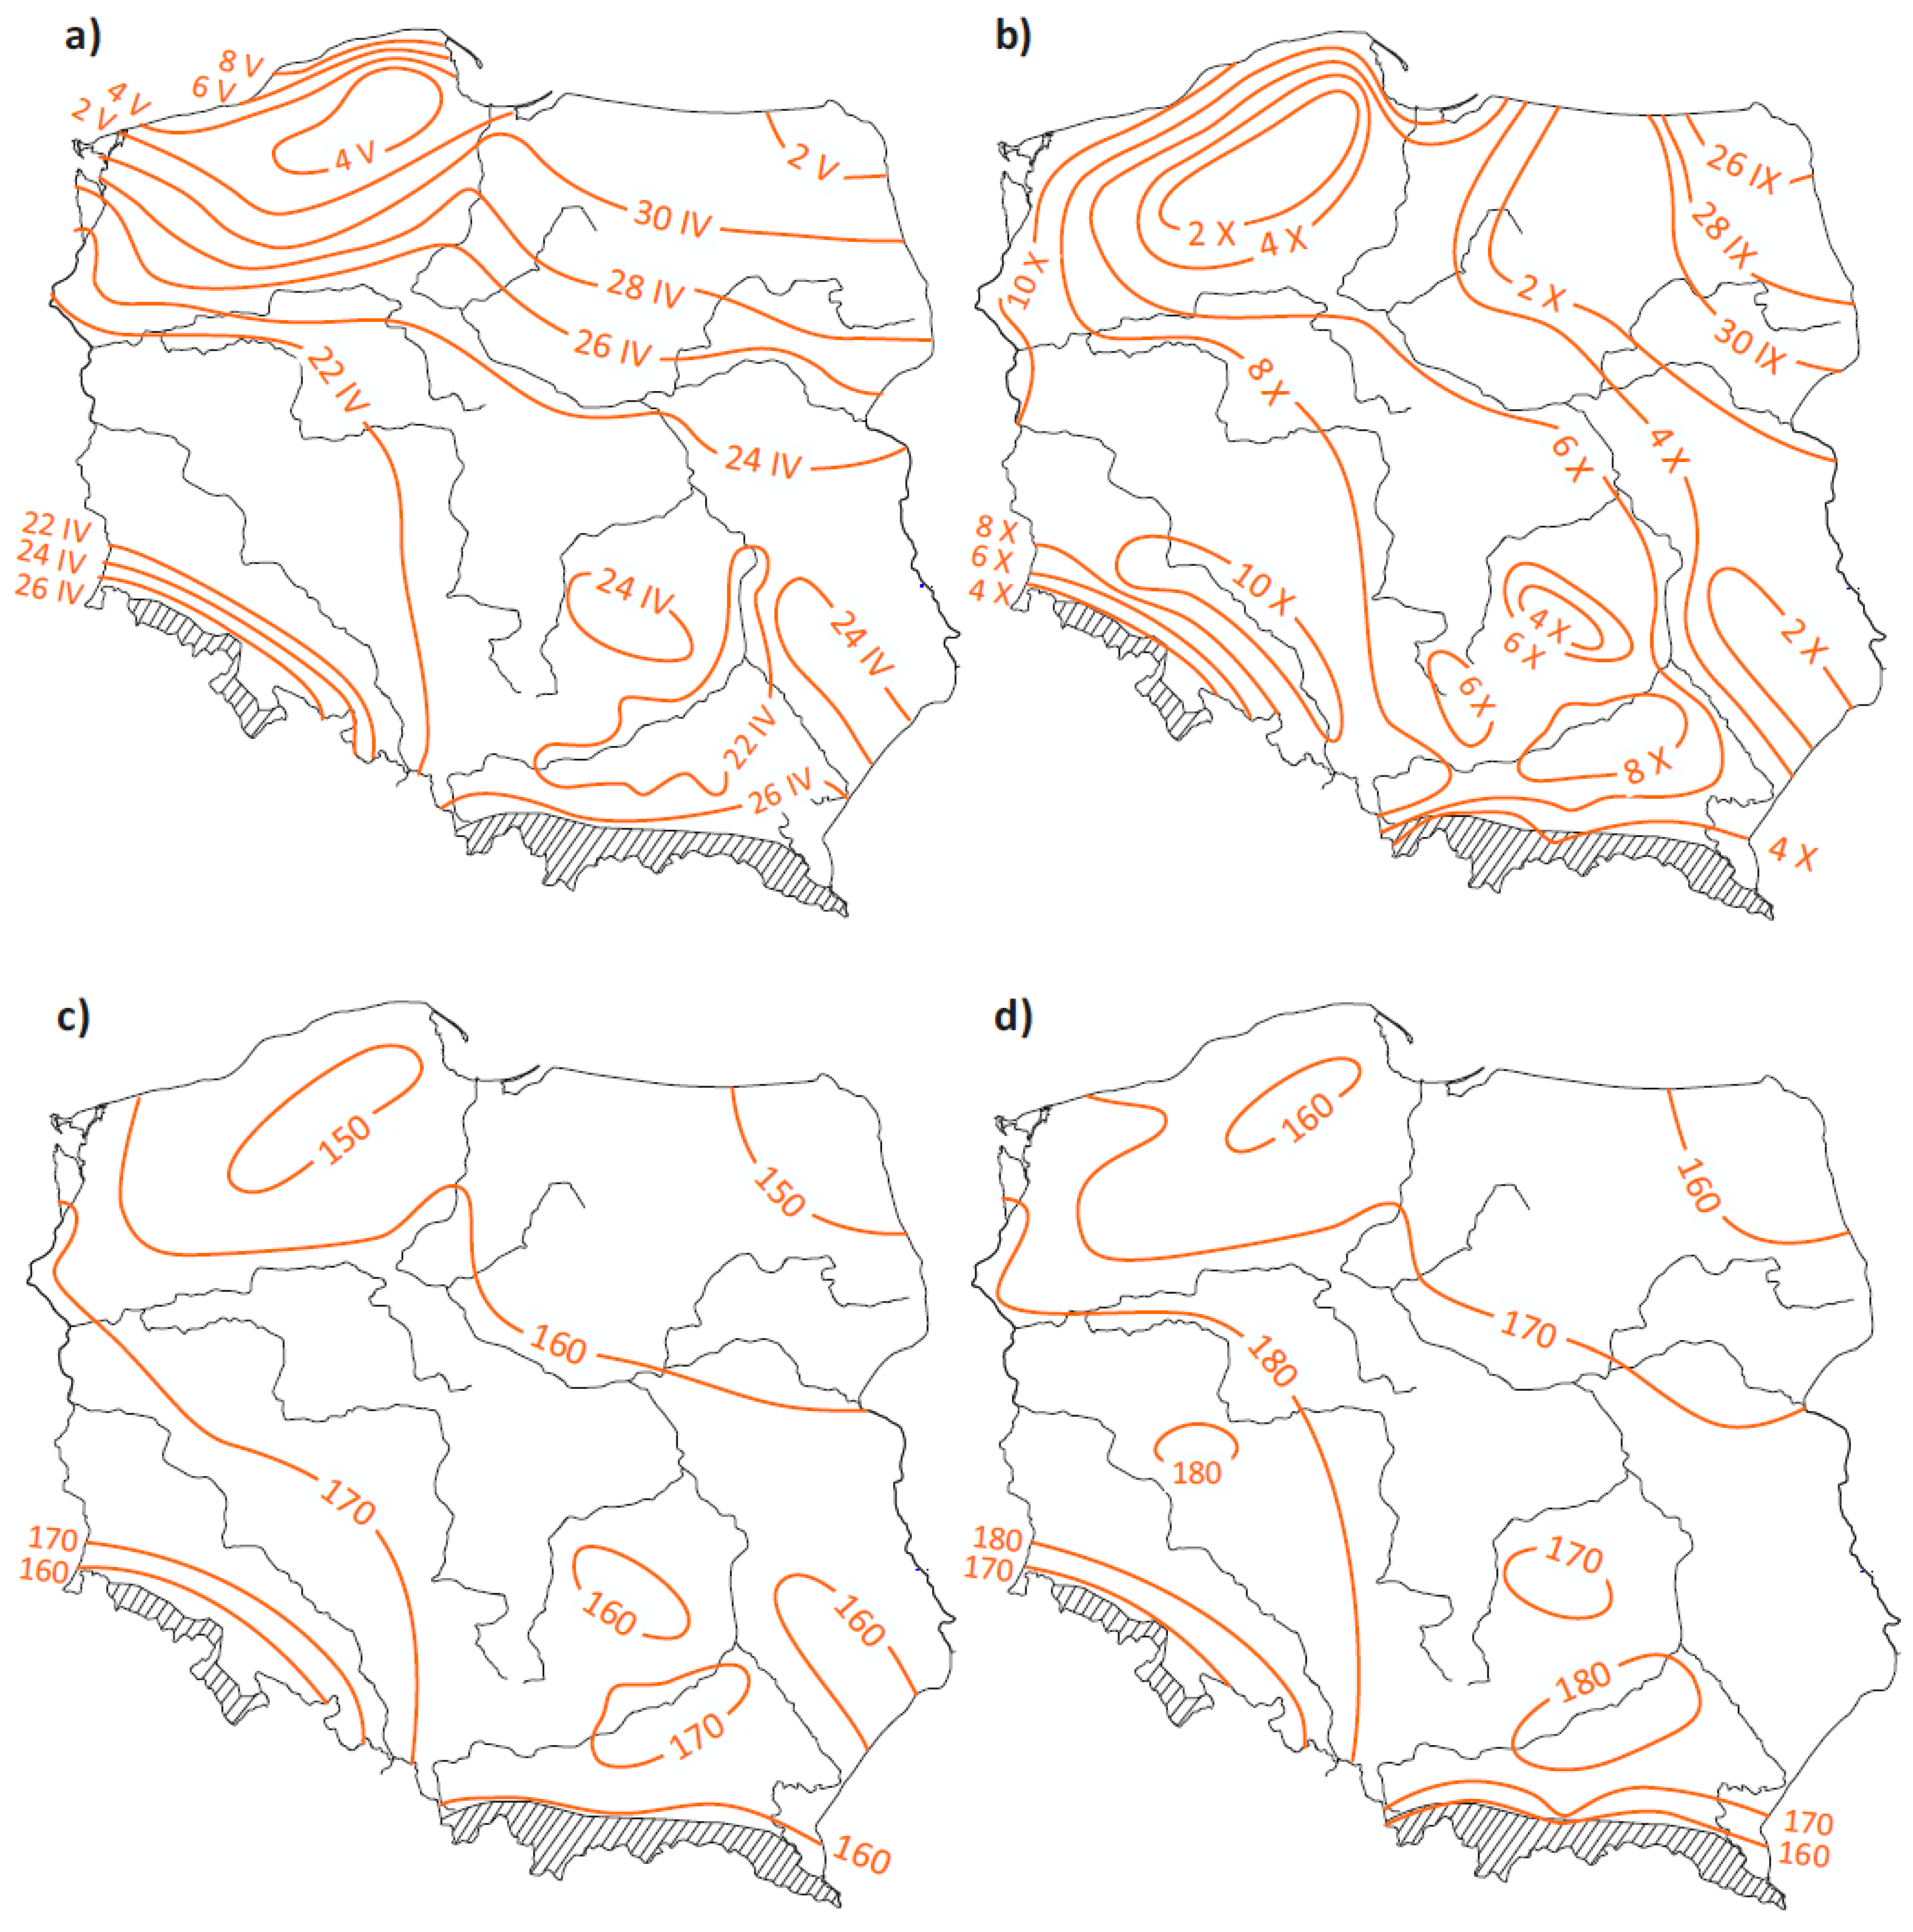
In Poland, high variability of thermal conditions on a year-to-year basis is demonstrated by high variability of the dates of the beginning and end of and, consequently, the duration of the active growth period (at >10 °C) (Figure 3c–e). In the analysed multiannual period, the beginning of the period occurred markedly earlier, particularly in the west of the country, by more than 20 days. In turn, the dates of the end of this period are recorded increasingly late. As a result, the duration of the active plant vegetation period shows a pronounced lengthening (by more than 23 days), especially in the west of the country (Figure 4 and Figure 8c,d), which is favourable for viticulture and obtaining a satisfactory yield.
In Poland, the average date of the beginning of the period with a temperature of more than 10 °C is 26 April, yet the earliest date is recorded in the basin of the Odra River (before 22 April), and the latest date in the zone of the Baltic Sea coast (after 4 May) (Figure 8a). The vicinity of the Baltic Sea and the elevation of the Pomeranian Lakeland cause the spatial differentiation of the dates of the beginning of the period with a temperature of >10 °C to be greater in Pomerania than in other areas of Poland [70].
In turn, the date of the end of this period in Poland falls on 6 October. The earliest date, i.e., on average before 28 September, is recorded in the Suwalskie Lakeland, and towards the west it occurs increasingly later—as late as 10 October (Figure 8b). It is assumed that for the varieties cultivated in Poland, the length of the period with air temperature >10 °C should be at least 160 days [42]. Isarithms of this value run from Rewal on the coast, through Piła, Świecie and Płock to Siedlce, and also on the Karpackie Foothills and the Sudeckie Foothills (Figure 8c). The period of the longest duration—on average longer than 170 days—occurs along the valley of the Odra River and in the Sandomierska Basin, where for many years vineyards are being dynamically established.
A significant climate warming in the last 10-year-long period (2010–2019) resulted in the lengthening of the duration of the period with a temperature of >10 °C by as much as 10 days, as compared to the average in the period 1971–2019. Consequently, the isarithm of 160 days runs through the Suwalskie Lakeland, in the higher parts of the Pomeranian Lakeland, and in almost the whole area of the basin of the Odra River and in the Sandomierska Basin the analysed period is more than 180 days long (Figure 8d)—creating favourable conditions for the cultivation of vines with increased thermal requirements.
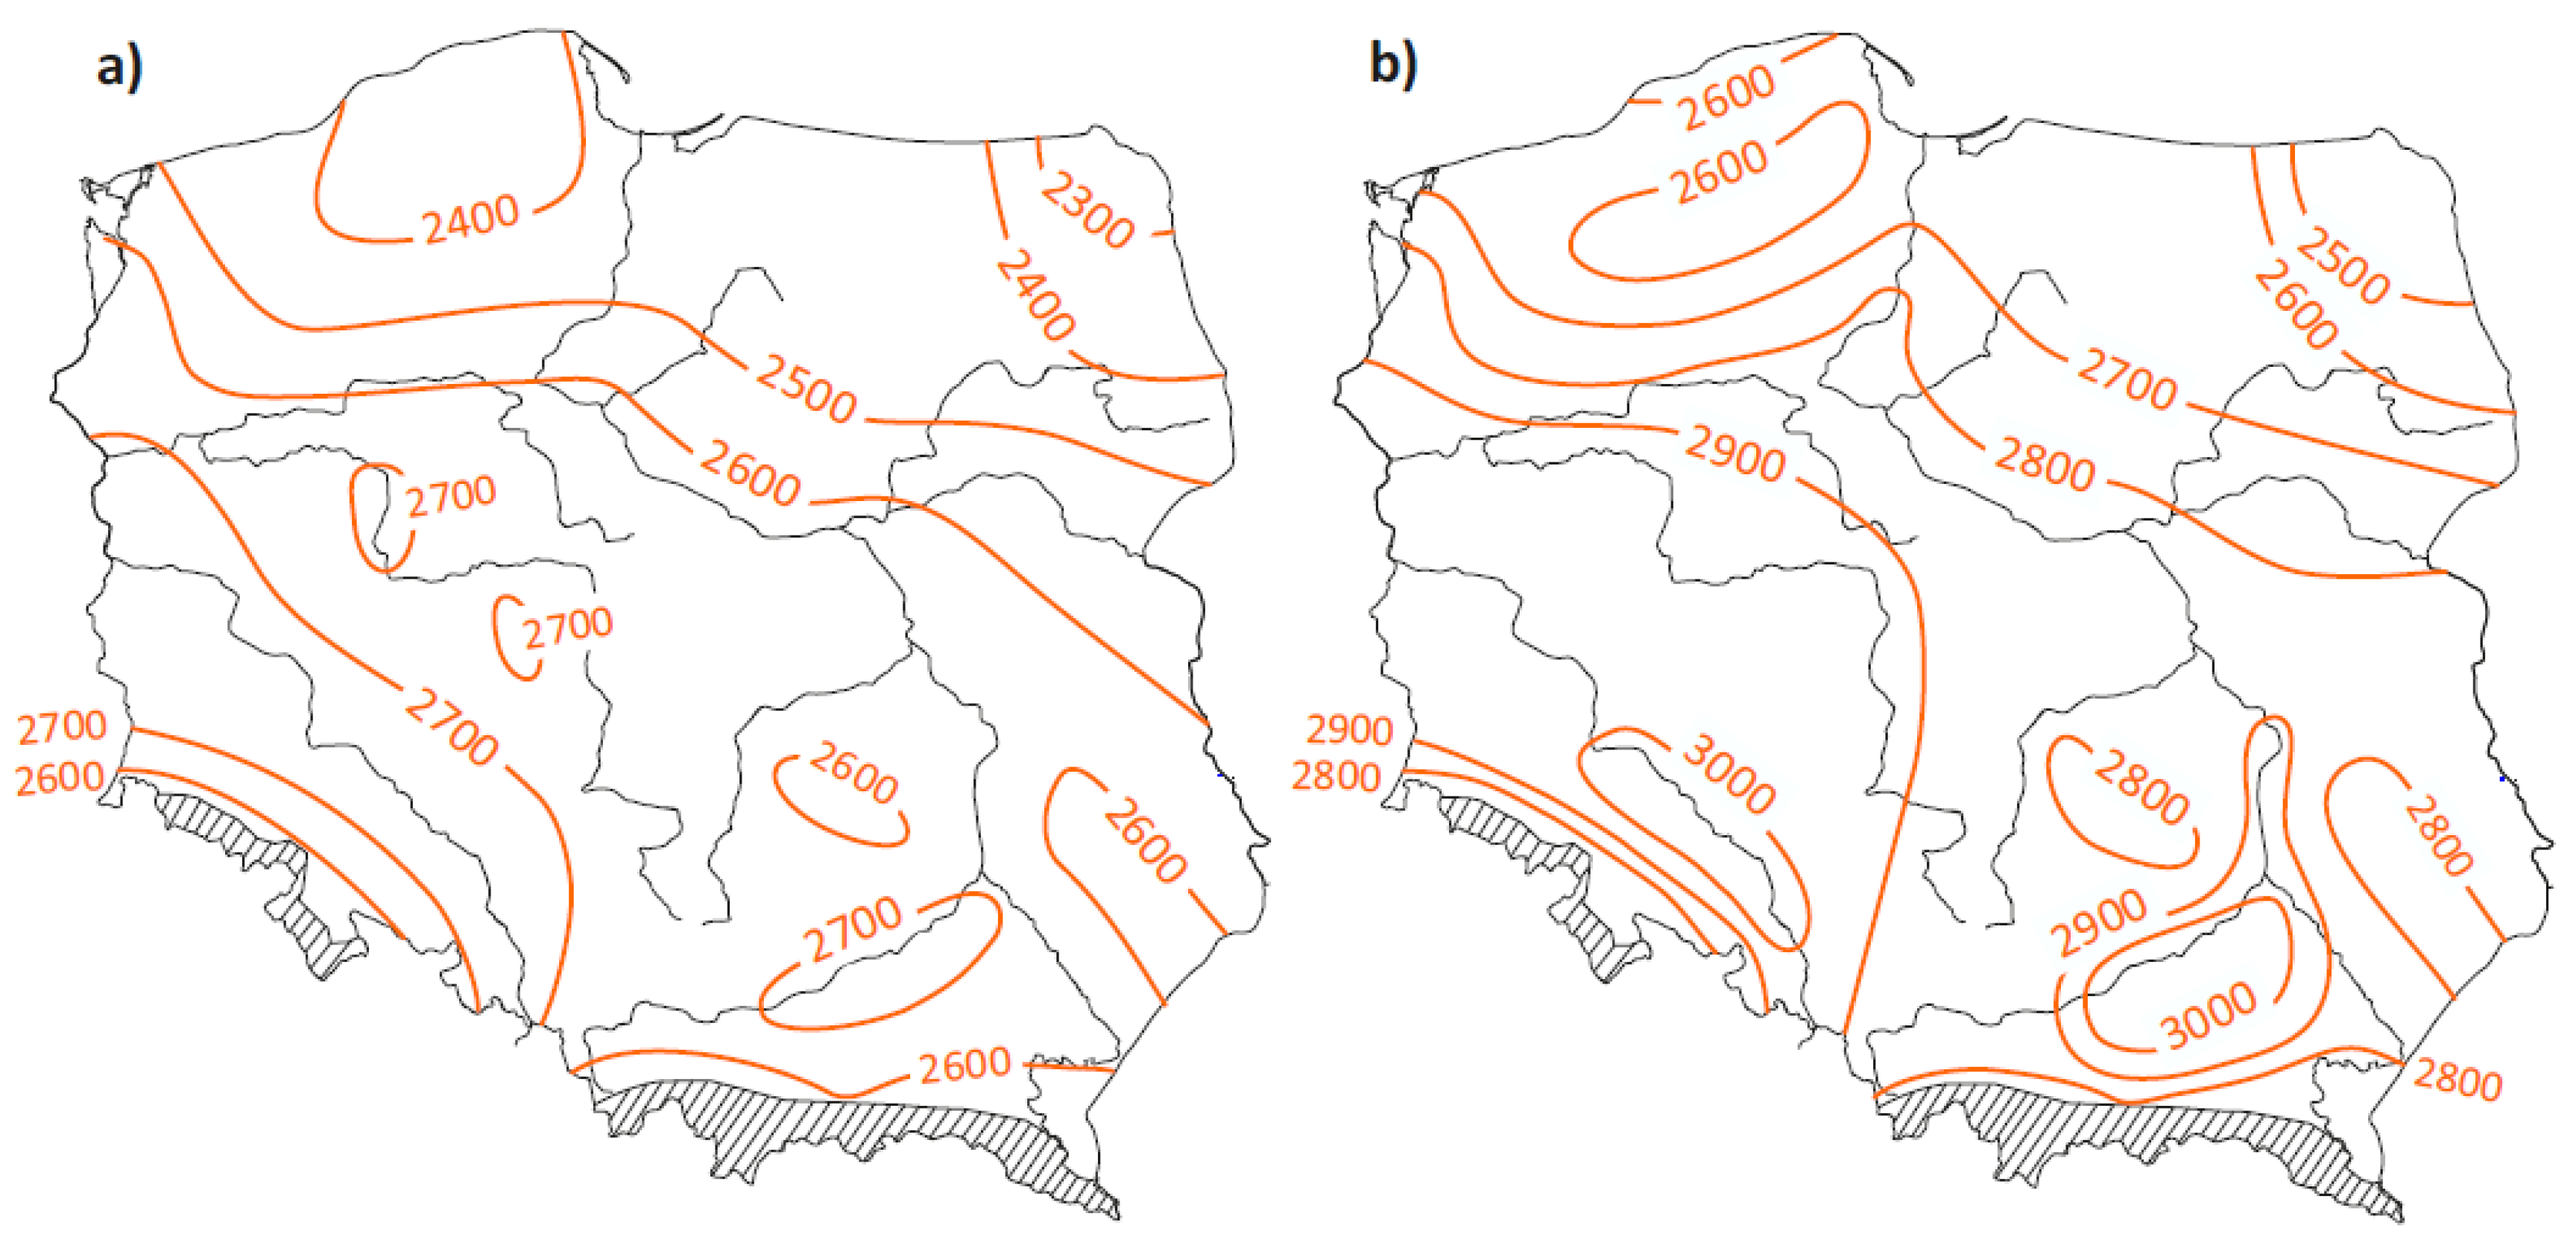
As has already been mentioned in the previous subsection, SAT is an important index used for the assessment of the thermal conditions in the area for viticulture [48,69]. The values of SAT determine which variety can be cultivated in a given area, for example, very early 2000–2200 °C, early 2200–2500 °C, medium-early 2500–2700 °C, medium-late 2700–2900 °C, and late >2900 °C [41].
In Poland, the average SAT values in the period 1971–2019 range from 2300 °C in the Suwalskie Lakeland to more than 2700 °C in the Sandomierska Basin. Along the Odra River, in the regions of Opole and Wrocław, the values exceed 2750 °C (Figure 9a). The isarithm of the recommended SAT value >2500 °C covers more than 60% of the country’s area, and its northern boundary runs from Świnoujście through Piła, Świecie, and Mława to south of Hajnówka. It is noticeable that a very high gradient of SAT value (from 2450 to 2650 °C) is recorded in the southern parts of the Pomeranian Lakeland and the Masurian Lakeland (Figure 9a). In the areas with mean annual SAT values of more than 2700 °C, the varieties with increased thermal requirements are suitable for cultivation, for example medium-early, and locally under favourable physiographical conditions (hillside with S and SW exposure, vicinity of water reservoirs and forests, warm soil) even medium-late varieties [69]. The possibility of cultivation of the latter variety is indicated by the values of SAT for the period 2010–2019, amounting to below 2500 °C in the Suwalskie Lakeland and more than 2900 °C in the basin of the Odra River. In the area of Opole and Wrocław as well as in the Sandomierska Basin, the values are above 3000 °C (Figure 9b), i.e., the same as in the Upper Rhine Plain. It can be assumed that every 10 years, the values of SAT will continue to increase to approx. 110 °C in the coastal zone, the higher parts of the Pomeranian Lakeland and the Suwalskie Lakeland, and to approx. 140 °C in Lower Silesia, the Wielkopolska Plain and the Sandomierska Basin. However, the possibility of occurrence of unfavourable years must be taken into account, including cold winters and cool vegetative periods (2–3 times every 10 years), which bring about a reduction in the yield. Therefore, according to common practice, the SAT values of >2500 °C adopted for intense cultivation of this plant should be increased by approx. 100 °C.
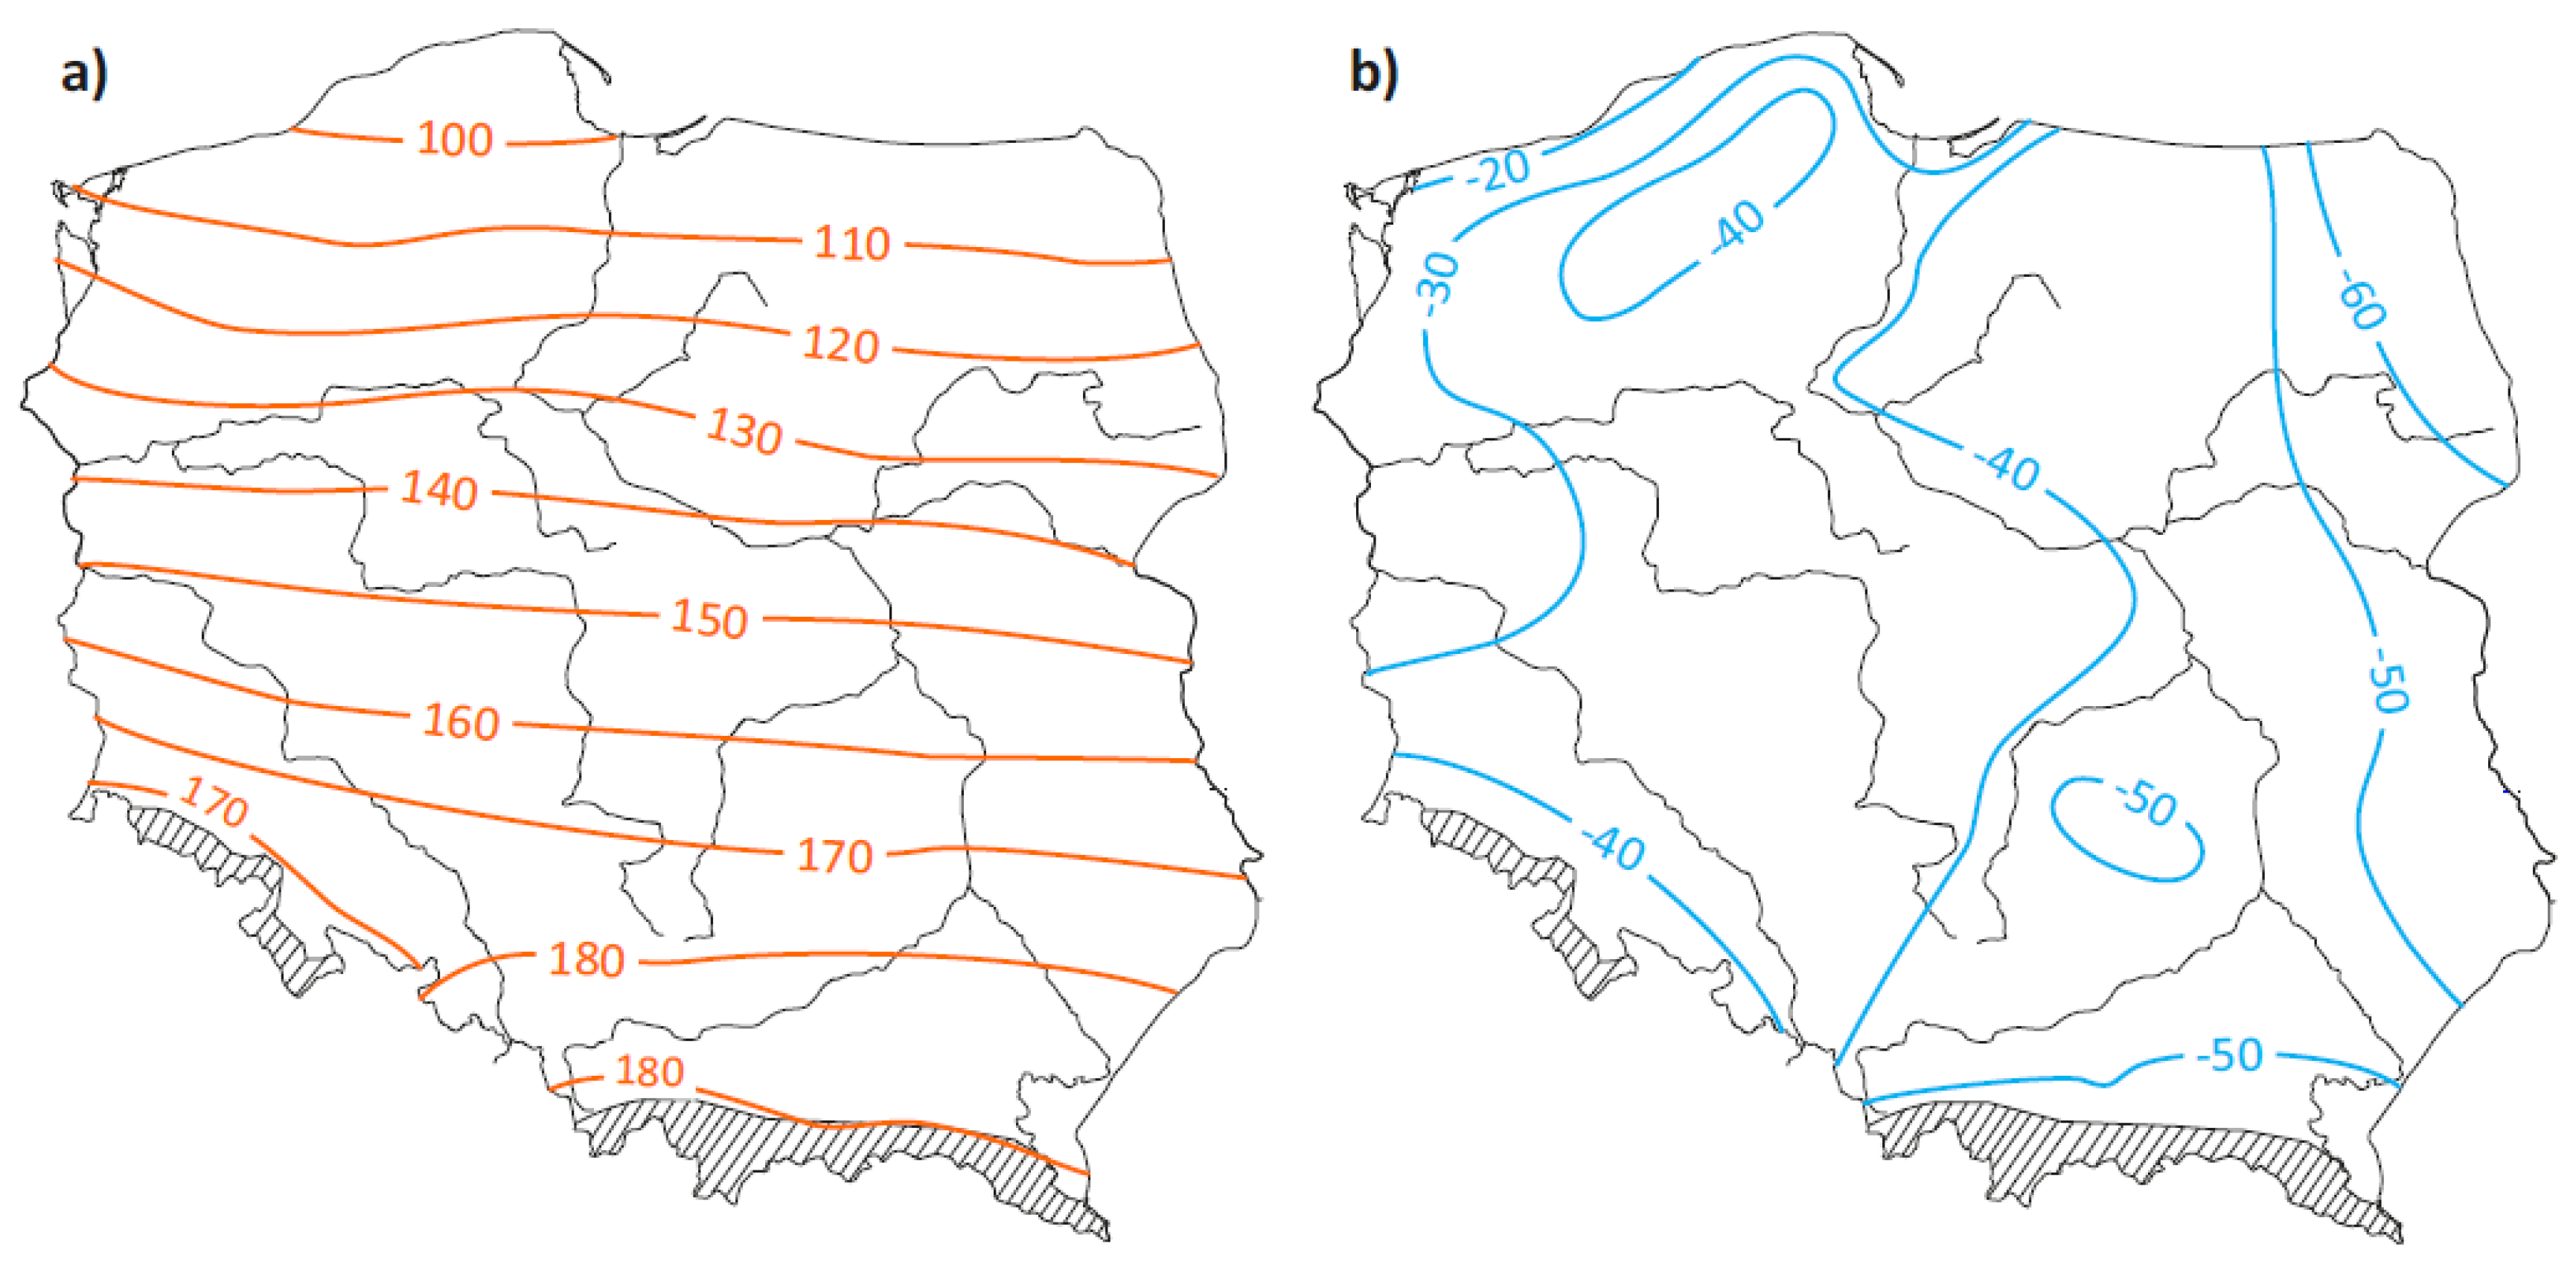
The literature on the subject often complements the values of the SAT index with the values of the latitude temperature index (LTI), which expresses the maturation potential of grapes with respect to latitude [42,71]. The higher the values, the greater the maturation potential of grapes in a given area. In light of Figure 10a, LTI values show a latitudinal distribution, increasing on average to approx. 100 in the Koszalińskie Coast to more than 180 in the Sandomierska Basin, the area of Kraków and Racibórz, and the Karpackie Foothills. The value of the LTI isarithm of 130 shows a comparable course to the SAT isarithm of 2500 °C in the country’s area (Figure 9). According to Figure 10a, satisfactory grape maturation is recorded to the south of the LTI isarithm of 130, and favourable to the south of the LTI isarithm of 170, where most of the vineyards in Poland are located. In Poland, the values of LTI index in the last decade (2010–2019) are comparable to those for the period of 1971–2019—higher on average by 10 units—and range from 100 in the area of Ustka and Łeba to more than 190 in the south-east of Poland. It is worth mentioning that the area with the highest LTI values >180 is representative of the viticulture regions of Champagne in France (191), Mozel (184) and Rheingau (188) in Germany, and Mìlnik (187) in the Czech Republic [43].
A large threat in the cold half-year can be posed by sub-zero air temperatures below −10 °C [41]. Therefore, the present paper totals the sub-zero temperatures below −10 °C recorded from October to March and presents the mean values for the period 1971–2019 (Figure 10b). The values of these sums are below −30 °C near the coast and along the lower course of the Odra River. Towards the east of the country, the magnitude of the discussed sub-zero air temperature sums shows a marked increase to −50 °C, and in the north-east part even to −60 °C, consequently constituting a potential risk for vineyards (Figure 10b).
3.4. Attempt to Determine the Potential Areas for Viticulture
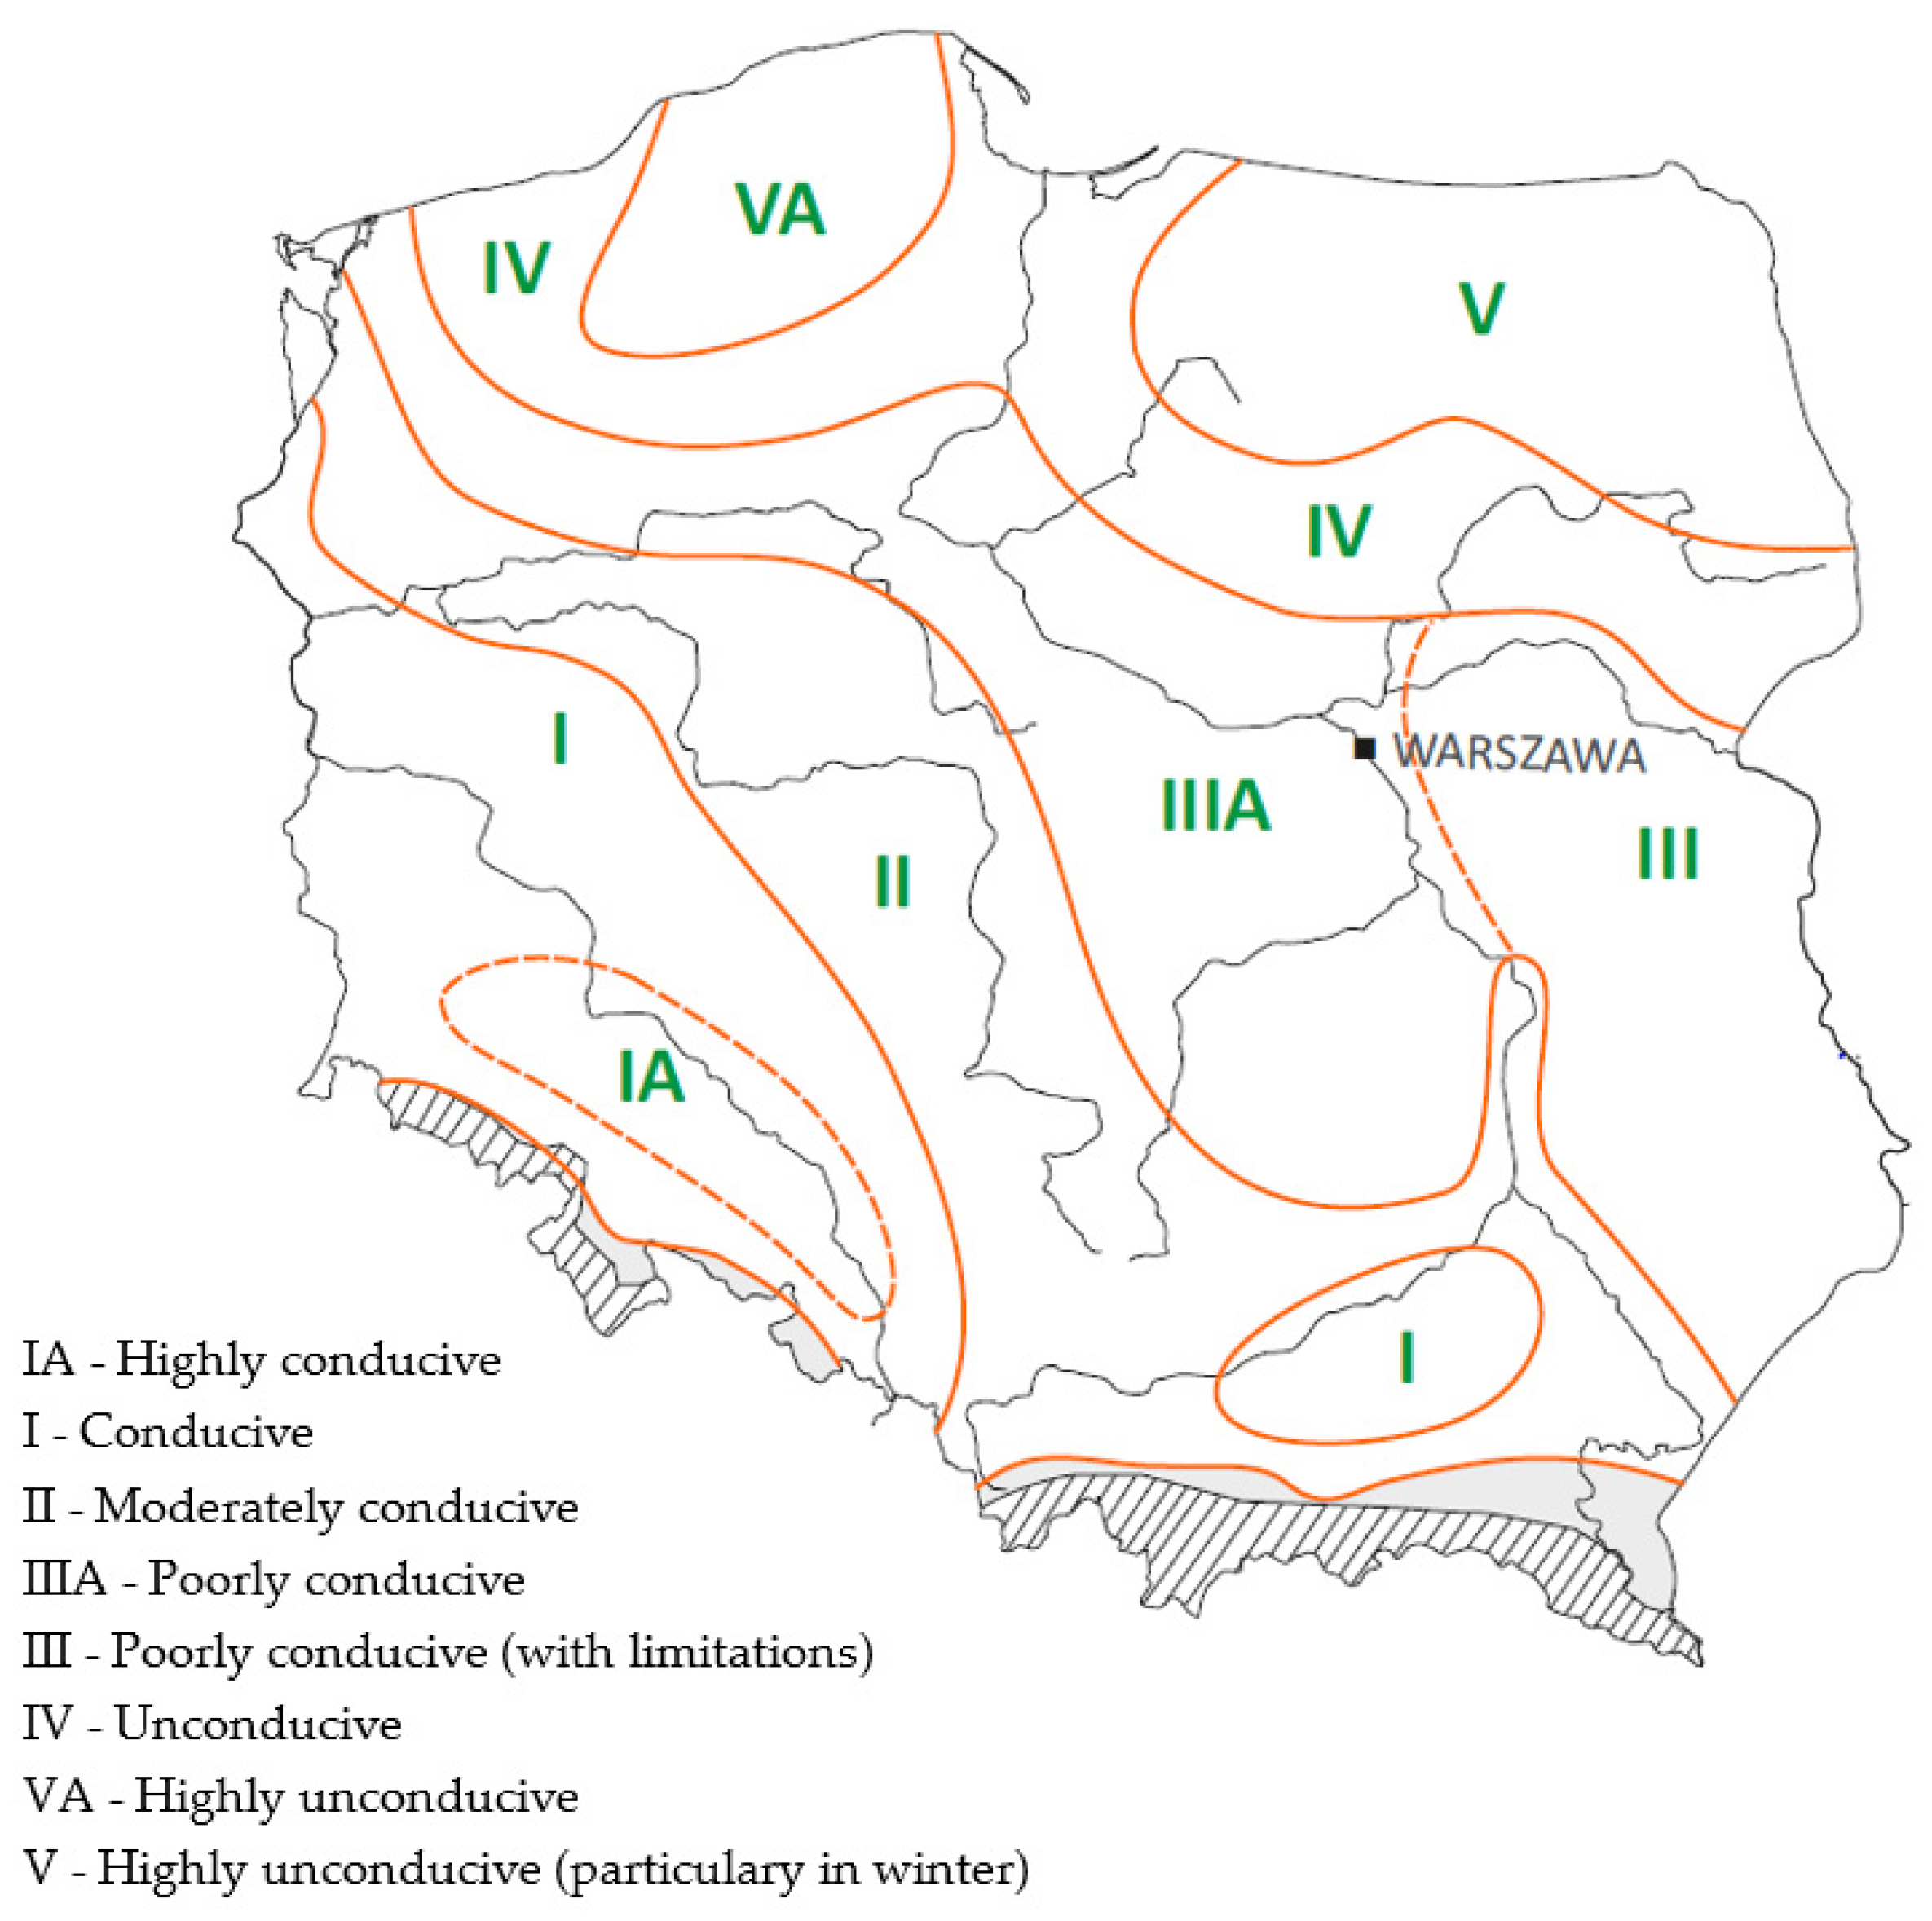
The last stage of the study was an attempt to determine the areas of diverse thermal relations with respect to intense viticulture in Poland. As a result of the analysis based on the values of deviations calculated for each of the 52 stations, in terms of the differences in the previously discussed five basic thermal characteristics (air temperature: in July, the vegetative period April–September, and the year January–December; the duration of the plant’s active growth >10 °C; and SAT) compared to the average spatial value for Poland, five areas were determined (Figure 11, Table 3).
The most favourable thermal conditions for viticulture in Poland are recorded in the area adjacent to the Odra River valley from Opole to Wrocław and Legnica (area IA), followed by the area along the basin of the Odra River (with the exception of the Warta River basin), from Racibórz to Szczecin (area I). Comparable thermal conditions are found in the Sandomierska Basin (area I). In areas I and IA, the values of the basic thermal characteristics significantly exceed the threshold values adopted in the literature on the subject, which favours the cultivation of grapevines with increased thermal requirements [40,43]. The values of SAT for the period 1971–2019 amount to, on average, from 2660 °C to 2700 °C, and for the period 2010–2019, amount to more than 3000 °C. The values of LTI show an increase from the north to the south from approx. 130 to approx. 180. In the delineated areas I and IA, some limitation is imposed by the occasional occurrence of cool years and years with a shortened period with at >10 °C, on average 2–3 cases per 10 years.
Area II extends from the Karpackie Foothills through the area adjacent to the Warta River valley to the Szczecin Lagoon (Figure 11). This area is slightly cooler than area I, particularly in winter; however, the thermal requirements for viticulture are markedly exceeded. Consequently, area I and area II have most of the vineyards in Poland. Along the shift from the north-west towards the south-east of Poland, the values of SAT index increase from approx. 2650 °C to approx. 2700 °C for the period 1971–2019 and from approx. 2800 °C to approx. 2900 °C for the period 2010–2019. Similarly, LTI values show an increase—from approx. 120 to approx. 180.
Most of the country is determined as belonging to the identified areas III and IIIA, which extend from the coast over the Pomeranian Bay to the Bug River valley (Figure 11). The thermal conditions identified for those areas also meet the basic, minimum criteria for viticulture, including the criterion of SAT values from 2500° to 2600 °C and an average duration of the period with a temperature of >10 °C of 160–166 days (Table 3). Area III is characterised by markedly colder winter periods, as compared to area IIIA. The isarithm of 2500 °C (SAT) (Figure 9) shows a similar course to that of the northern boundary of area III. The ongoing global warming will continue to improve the thermal conditions in areas III and IIIa and, consequently, will lead to an increase in the number of vine plantations.
The current thermal conditions in area IV are not conducive to viticulture, particularly given the low air temperature in winter, shortage of sums of active temperatures >10 °C, short periods with a temperature of >10 °C and very low values of LTI index (110–130).
The least conducive thermal conditions for viticulture are observed in the identified areas V and VA where, apart from air temperature in July, the remaining characteristics do not meet the adopted criteria, particularly with respect to SAT and LTI values as well as the duration of the period with temperature >10 °C.
The identified areas do not take into consideration the regional variability of thermal conditions, which due to altitude asl, land exposure, vicinity of water reservoirs and forests, and the type of soil may create more or less conducive conditions for viticulture than what is shown in the macrothermal assessments for a given area provided herein.
4. Conclusions
An assessment of the temporal and spatial distribution of several thermal characteristics of air in the multiannual period 1971–2019 has been carried out, which has allowed us to produce results and conclusions as well as to determine five potential areas for viticulture in Poland with respect to thermal conditions:
- In the multiannual period under analysis, there is a dynamic increase in air temperature over the area of Poland, especially after the year 1987, as well as in the sums of active temperatures (SAT) and the duration of the period of the plant’s active growth (at >10 °C).
- Acceleration occurrence of the dates of beginning of the period with air temperature >10 °C in spring is almost twice then their delayin the autumn.
- The ongoing global warming results in a significant shift to the north of the country (from 100 to 150 km) of the current boundary of intense viticulture and is conducive to the introduction of new varieties with increased thermal requirements.
- The greatest increases in air temperature and SAT values were found in the south-west and west of Poland, with a marked decrease shown towards the north-east and east.
- Despite the observed global warming, the occasional (2–3 times per 10 years) occurrence of cold years with a shortened duration of the period with at >10 °C must be taken into account, particularly in the south-west and west of Poland.
- In the southern area of the Pomeranian Lakeland and the Masurian Lakeland, a very high gradient of SAT was identified.
- In approx. 60% of the country’s area, there are favourable and moderately favourable thermal conditions for intense viticulture (areas I and II). Favourable thermal conditions for grapevine cultivation in areas I and II are recorded, on average, in 3–4 years per 10.
- The physiographic conditions of a given area, i.e., elevations and slope exposure, vicinity of water reservoirs and forests as well as the type of soil, may considerably affect the thermal relations in the five potential areas for viticulture determined in the present paper.
- The current thermal conditions and the ongoing global warming make the area of Poland an attractive location for viticulture.
Author Contributions
Conceptualization, C.K. and B.M.; Data curation, A.M. and J.N.-L.; Formal analysis, C.K., A.M., B.M. and J.N.-L.; Methodology, C.K., A.M., B.M. and J.N.-L.; Project administration, C.K.; Resources, A.M. and J.N.-L.; Software, A.M. and J.N.-L.; Supervision, C.K.; Visualization, A.M. and J.N.-L.; Writing—original draft, C.K., A.M., B.M. and J.N.-L.; Writing—review & editing, A.M. and J.N.-L. All authors have read and agreed to the published version of the manuscript.
Funding
This research received no external funding.
Conflicts of Interest
The authors declare no conflict of interest.
References
- Burkot, P.; Kulisz, B. Rynek wina w Polsce. Biul. Inf. Agencji Rynk. Rolnego 2008, 12, 19–26. [Google Scholar]
- Radziwiłko, B. Determinanty rozwoju oraz ich wpływ na obecny stan produkcji wina gronowego w Polsce. Roczniki Ekonomiczne Kujawsko-Pomorskiej Szkoły Wyższej w Bydgoszczy 2012, 5, 427–440. [Google Scholar]
- Wilk, K. Polski rynek win w świetle zmian w krajowych i wspólnotowych uregulowaniach prawnych. Studia I Pr. Wydziału Nauk Ekon. I Zarządzania 2011, 22, 135–148. [Google Scholar]
- Kunicka-Styczyńska, A.; Czyżowska, A.; Rajkowska, K.; Wilkowska, A.; Dziugan, P. The trends and prospects of winemaking in Poland. In Grape and Wine Biotechnology; Morata, A., Loira, I., Eds.; Intech: London, UK, 2019; pp. 401–414. [Google Scholar] [CrossRef] [Green Version]
- Charzyński, P.; Nowak, A.; Podgórski, Z. Turystyka winiarska na Ziemi Lubuskiej—Historyczne uwarunkowania konieczności czy nowatorskie rozwiązania. J. Health Sci. 2013, 3, 198–216. [Google Scholar]
- Kryza, M.; Szymanowski, M.; Błaś, M.; Migała, K.; Werner, M.; Sobik, M. Observed changes in SAT and GDD and the climatological suitability of the Poland-Germany-Chech Republic transboundary region for wine grapes cultivation. Theor. Appl. Climatol. 2015, 122, 207–218. [Google Scholar] [CrossRef] [Green Version]
- Krajowy Ośrodek Wsparcia Rolnictwa (KOWR). Rynek Wina w Liczbach. Available online: http://www.kowr.gov.pl (accessed on 26 March 2020).
- Amerine, M.A.; Winkler, A.J. Composition and quality of musts and wines of California grapes. Hilgardia 1944, 15, 493–675. [Google Scholar] [CrossRef] [Green Version]
- Winkler, A.J. General Viticulture; University of California Press: Davis, CA, USA, 1974; p. 710. [Google Scholar]
- Jones, G.V.; Duff, A.A.; Hall, A.; Myers, J.W. Spatial analysis of climate in winegrape growing regions in the western United States. Am. J. Enol. Vitic. 2010, 61, 313–326. [Google Scholar]
- Hall, A.; Jones, G.V. Spatial analysis of climate in winegrape-growing regions in Australia. Aust. J. Grape Wine Res. 2010, 16, 389–404. [Google Scholar] [CrossRef]
- Anderson, J.D.; Jones, G.V.; Tait, A.; Hall, A.; Trought, M.C.T. Analysis of viticulture region climate structure and suitability in New Zealand. J. Int. Des Sci. De La Vigne Et Du Vin 2012, 46, 149–165. [Google Scholar] [CrossRef] [Green Version]
- Bonfante, A.; Monaco, E.; Langella, G.; Mercogliano, P.; Bucchignani, P.; Manna, P.; Terribile, F. A dynamic viticultural zoning to explore the resilience of terroir concept under climate change. Sci. Total Environ. 2017, 624, 294–308. [Google Scholar] [CrossRef] [PubMed]
- Jones, G.V.; Reid, R.; Vilks, A. Climate, grapes, and wine: Structure and suitability in a variable and changing climate. In The Geography of Wine: Regions, Terroir and Techniques; Springer Press: Amsterdam, The Netherlands, 2012; pp. 109–133. [Google Scholar] [CrossRef]
- Robinson, J.; Johnson, H. The World Atlas of Wine; Mitchell Beazley: London, UK, 2013; p. 416. [Google Scholar]
- Jones, G.V.; Schultz, H.R. Climate change and emerging cool climate wine regions. Wine Vitic. J. 2016, 31, 51–53. [Google Scholar]
- Huglin, P. Nouveau mode d’évaluation des possibilités héliothermiques d’un milieu viticole. C. R. Acad. Agr. Fr. 1978, 64, 1117–1126. [Google Scholar]
- Kowalski, W.; Nawalany, G. New approach to determine the sum of the active temperatures (SAT) exemplified by weather conditions of western Malopolska. In Infrastructure and Environment; Krakowiak-Bal, A., Vaverkova, M., Eds.; Springer: Cham, Switzerland, 2019; pp. 203–216. [Google Scholar] [CrossRef]
- Tonietto, J.; Carbonneau, A. A multicriteria climatic classification system for grape-growing regions worldwide. Agric. For. Meteorol. 2004, 124, 81–97. [Google Scholar] [CrossRef] [Green Version]
- Filipiak, T.; Maciejczak, M. Zrównoważona uprawa winorośli i produkcja winogron, jako szansa na dostosowanie do zmian klimatu badane w projekcie Vitismart. Wieś JutraNaukaDoradz. Prakt. 2017, 4, 1–3. [Google Scholar]
- Maciejczak, M.; Mikiciuk, J. Climate change impact on viticulture in Poland. Int. J. Clim. Chang. Strateg. Manag. 2019, 11, 254–264. [Google Scholar] [CrossRef] [Green Version]
- Maciejczak, M. Korzyści zewnętrzne prowadzenia zrównoważonych winnic w Polsce w warunkach zmian klimatu. Roczn. Nauk. Ekon. Rol. I Rozw. Obsz. Wiej. 2019, 106, 106–118. [Google Scholar] [CrossRef] [Green Version]
- Coombe, B.G. Influence of temperature on composition and quality of grapes, Proceedings of the Symposium on Grapevine Canopy and Vigor Management. Acta Hortic. 1987, 206, 23–35. [Google Scholar] [CrossRef]
- Jones, G.V.; Alves, F. Impact of climate change on wine production: A global overview and regional assessment in the Douro Valley of Portugal. Int. J. Glob. Warm. 2012, 4, 383–406. [Google Scholar] [CrossRef]
- Koźmiński, C. Klimatyczne Uwarunkowania Uprawy Winorośli w Województwie Zachodniopomorskim; Zachodniopomorski Ośrodek Doradztwa Rolniczego w Barzkowicach: Barzkowice, Poland, 2019; p. 34. [Google Scholar]
- Lisek, J. Climatic factors affecting development and yielding of grapevine in Central Poland. J. Fruit Ornam. Plant Res. 2008, 16, 285–293. [Google Scholar]
- White, M.A.; Diffenbaugh, N.S.; Jones, G.V.; Pal, J.S.; Giorgi, F. Extreme heat reduces and shifts United States premium wine production in the 21st century. Proc. Natl. Acad. Sci. USA 2006, 103, 11217–11222. [Google Scholar] [CrossRef] [Green Version]
- Santos, J.A.; Malheiro, A.C.; Pinto, J.G.; Jones, G.V. Macroclimate and viticultural zoning in Europe: Observed trends and atmospheric forcing. Clim. Res. 2013, 51, 89–103. [Google Scholar] [CrossRef] [Green Version]
- Jones, G.V.; White, M.A.; Cooper, O.R.; Storchmann, K. Climate change and global wine quality. Clim. Chang. 2005, 73, 319–343. [Google Scholar] [CrossRef]
- Keller, M. Managing grapevines to optimise fruit development in a challenging environment: A climate change primer for viticulturists. Aust. J. Grape Wine Res. 2016, 16, 56–69. [Google Scholar] [CrossRef]
- Clingeleffer, P.R. Plant management research: Status and what it can offer to address challenges and limitations. Aust. J. Grape Wine Res. 2010, 16, 25–32. [Google Scholar] [CrossRef]
- Jones, G.V.; Davis, R.E. Climate influences on grapevine phenology, grape composition, and wine production and quality for Bordeaux, France. Am. J. Enol. Vitic. 2000, 51, 249–261. [Google Scholar]
- Malheiro, A.C.; Campos, R.; Fraga, H.; Eiras-Dias, J.; Silvestre, J.; Santos, J.A. Winegrape phenology and temperature relationships in the Lisbon wine region, Portugal. Int. Sci. Vigne Vin 2013, 47, 287–299. [Google Scholar] [CrossRef] [Green Version]
- Karvonen, J. Does climate change allow grapevine growing in the southernmost Finland. Int. J. Agric. Innov. Res. 2015, 4, 201–204. [Google Scholar]
- De Orduna, R.M. Climate change associated effects on grape and wine quality and production. Food Res. Int. 2010, 43, 1844–1855. [Google Scholar] [CrossRef]
- Jackson, D.I.; Lombard, P.B. Environmental and management practices affecting grape composition and wine quality—A Review. Am. J. Enol. Vitic. 1993, 44, 409–430. [Google Scholar]
- Lisek, J. Frost damage of grapevines in Poland following the winter 2005/2006. Folia Hortic. 2007, 19, 69–78. [Google Scholar]
- Robinson, J. The Oxford Companion to Wine; Oxford University Press: Oxford, UK, 2006. [Google Scholar]
- Johson, H.; Robinson, J. The World Atlas of Wine; Octopus: London, UK, 2001. [Google Scholar]
- Pink, M. Polska jako kraj winiarski? Od tradycji do rodzących się możliwości. Probl. Drob. Gospod. Rol. 2015, 2, 37–56. [Google Scholar]
- Myśliwiec, R. Nowoczesna Winnica; PWRiL: Warszawa, Poland, 1992; p. 220. [Google Scholar]
- Bosak, W. Uprawa Winorośli i Winiarstwo w Małym Gospodarstwie na Podkarpaciu; Polski Instytut Winorośli i Wina: Kraków, Poland, 2004; p. 80. [Google Scholar]
- Ostrowski, S.; Kaszuba, M.; Gajewski, K. Uprawa Winorośli i Amatorskie Przetwórstwo Winogron; Lubuskie Stowarzyszenie Winiarskie: Zielona Góra, Poland, 2004; p. 78. [Google Scholar]
- Kopeć, B. Uwarunkowania termiczne wegetacji winorośli na obszarze południowo-wschodniej części Polski. Infrastrukt. I Ekol. Teren. Wiej. 2009, 4, 251–262. [Google Scholar]
- Lee, H.; Roehrdanz, P.R.; Ikegami, M.; Shepard, A.V.; Shaw, M.R.; Tabor, G.; Zhi, L.; Marquet, P.A.; Hijmans, R.J. Climate change, wine, and conservation. Proc. Natl. Acad. Sci. USA 2013, 110, 6907–6912. [Google Scholar] [CrossRef] [Green Version]
- Nemani, R.R.; White, M.A.; Cayan, D.R.; Jones, G.V.; Running, S.W.; Coughlan, J.C. Asymmetric climatic warming improves California vintages. Clim. Res. 2001, 19, 25–34. [Google Scholar] [CrossRef] [Green Version]
- Ramos, M.; Jones, G.; Martnez-Casasnovas, J. Structure and trends in climate parameters affecting winegrape production in Northeast Spain. Clim. Res. 2008, 38, 1–15. [Google Scholar] [CrossRef] [Green Version]
- Caprio, J.M.; Quamme, H.A. Weather conditions associated with grape production in the Okanagan Valley of British Columbia and potential impact of climate change. Can. J. Plant Sci. 2002, 82, 755–763. [Google Scholar] [CrossRef] [Green Version]
- Kenny, G.J.; Harrison, P.A. The effects of climate variability and change on grape suitability in Europe. J. Wine Res. 1992, 3, 163–183. [Google Scholar] [CrossRef]
- Selley, R.C. The Winelands of Britain: Past, Present and Prospective; Petravin: Dorking, UK, 2008; pp. 102–115. [Google Scholar]
- Moriondo, M.; Bindi, M.; Fagarazzi, C.; Ferrise, R.; Trombi, G. Framework for high-resolution climate change impact assessment on grapevines at a regional scale. Reg. Environ. Chang. 2011, 11, 553–567. [Google Scholar] [CrossRef]
- Drappier, J.; Thibon, C.; Rabot, A.; Geny-Denis, L. Relationship between wine composition and temperature: Impact on Bordeaux wine typicity in the context of global warming—Review. Crit. Rev. Food Sci. Nutr. 2017, 59, 1–17. [Google Scholar] [CrossRef]
- Schultz, H. Climate change and viticulture: A European perspective on climatology, carbon dioxide and UV-B effects. Aust. J. Grape Wine Res. 2013, 6, 2–12. [Google Scholar] [CrossRef]
- Webb, L.B.; Whetton, P.H.; Barlow, E.W.R. Climate change and winegrape quality in Australia. Clim. Res. 2008, 36, 99–111. [Google Scholar] [CrossRef]
- Kożuchowski, K.; Żmudzka, E. Ocieplenie w Polsce: Skala i rozkład sezonowy zmian temperatury powietrza w drugiej połowie XX wieku. Przegląd Geofiz. 2001, 46, 81–90. [Google Scholar]
- Michalska, B. Tendencje zmian temperatury powietrza w Polsce. Pr. I Studia Geogr. 2011, 47, 67–75. [Google Scholar]
- Czernecki, B.; Miętus, M. The thermal seasons variability in Poland, 1951–2010. Theor. Appl. Climatol. 2015, 127, 481–493. [Google Scholar] [CrossRef] [Green Version]
- Czarnecka, M.; Nidzgorska-Lencewicz, J. Zmienność termicznej zimy w Polsce w latach 1960–2015. Acta Agroph. 2017, 24, 205–220. [Google Scholar]
- Żmudzka, E. Tło klimatyczne produkcji rolniczej w Polsce w drugiej połowie XX wieku. Acta Agroph. 2004, 3, 399–408. [Google Scholar]
- Krużel, J.; Ziernicka-Wojtaszek, A.; Borek, Ł.; Ostrowski, K. Zmiany czasu trwania meteorologicznego okresu wegetacyjnego w Polsce w latach 1971–2000 oraz 1981–2010. Inżynieria Ekol. 2015, 44, 47–52. [Google Scholar]
- Sulikowska, A.; Wypych, A.; Ustrnul, Z.; Czekierda, D. Zmienność Zasobów termicznych w Polsce w aspekcie obserwowanych zmian klimatu. Acta Sci. Pol. Form. Circumiectus 2016, 15, 127–139. [Google Scholar] [CrossRef]
- Myśliwiec, R. Uprawa Winorosli; Plantpress: Kraków, Poland, 2009; p. 160. [Google Scholar]
- Gumiński, R. Próba wydzielenia dzielnic rolniczo-klimatycznych w Polsce. Przegl. Met. I Hydr. 1948, 1, 7–20. [Google Scholar]
- Bartoszek, K.; Węgrzyn, A.; Kaszewski, B.; Siłuch, M. Porównanie wybranych metod wyznaczania dat początku i końca okresu wegetacyjnego na przykładzie Lubelszczyzny. Przegląd Geofizyczny 2012, 1, 123–134. [Google Scholar]
- Tomczyk, A.M.; Szyga-Pluta, K. Okres wegetacyjny w Polsce w latach 1971–2010. Przegląd Geogr. 2016, 88, 75–86. [Google Scholar] [CrossRef]
- Koźmiński, C.; Michalska, B. (Eds.) Atlas Klimatycznego Ryzyka Upraw Roślin w Polsce; Uniwersytet Szczeciński: Szczecin, Poland, 2001. [Google Scholar]
- Mazurkiewicz-Pizło, A.; Pizło, W. Determinants of the development of vineyards and vine tourism in Poland. Acta Sci. Pol. Oecon. 2018, 17, 115–121. [Google Scholar] [CrossRef]
- Wieteska, S. Ryzyko występowania przymrozków w Polsce i strefie klimatycznej. Acta Univ. Lodz. Folia Oecon. 2011, 259, 143–157. [Google Scholar]
- Sękowski, O. Możliwości oceny warunków mezoklimatycznych winnic w Polsce na podstawie sieci stacji IMGW-PIB. Pr. Geogr. 2019, 157, 109–120. [Google Scholar] [CrossRef] [Green Version]
- Koźmiński, C.; Świątek, M. Oddziaływanie Bałtyku na kształtowanie się temperatury i wilgotności powietrza oraz prędkości wiatru w strefie polskiego wybrzeża. Acta Agroph. 2012, 19, 597–610. [Google Scholar]
- Szymanowski, M.; Smaza, M. Zmiana Zasobów Klimatycznych a Możliwość Uprawy Winorośli na Dolnym Śląsku. In Proceedings of the XXXII Ogólnopolski Zjazd Agrometeorologów i Klimatologów, Kołobrzeg, Poland, 13–15 September 2007; Instytut Geografii i Rozwoju Regionalnego Uniwersytet Wrocławski: Wrocław, Poland, 2007; pp. 69–70. [Google Scholar]
Figure 1.
Mean annual air temperature 1971–2019 with the trend (a) and deviation from the multiannual values 1981–2010 (b) in selected stations in Poland: Wrocław, Warszawa and Białystok.
Figure 1.
Mean annual air temperature 1971–2019 with the trend (a) and deviation from the multiannual values 1981–2010 (b) in selected stations in Poland: Wrocław, Warszawa and Białystok.

Figure 2.
Mean air temperature during the vegetative period (April–September) in the period 1971–2019 with the trend (a) and deviation from the multiannual values 1981–2010 (b) in selected stations in Poland: Wrocław, Warszawa and Białystok.
Figure 2.
Mean air temperature during the vegetative period (April–September) in the period 1971–2019 with the trend (a) and deviation from the multiannual values 1981–2010 (b) in selected stations in Poland: Wrocław, Warszawa and Białystok.

Figure 3.
Mean air temperature in the year (a) and in January and July (b); the dates of the beginning (c) and end (d), and duration (e) of the active growth period of >10 °C; and the sum of active temperatures (SAT) (f) in 10-year-long periods in Poland. Years 1971–2019.
Figure 3.
Mean air temperature in the year (a) and in January and July (b); the dates of the beginning (c) and end (d), and duration (e) of the active growth period of >10 °C; and the sum of active temperatures (SAT) (f) in 10-year-long periods in Poland. Years 1971–2019.

Figure 4.
Mean number of days of the active growth period (at >10 °C) in the period 1971–2019 together with the trend (a) and deviation from the multiannual values 1981–2010 (b) in selected stations in Poland: Wrocław, Warszawa and Białystok.
Figure 4.
Mean number of days of the active growth period (at >10 °C) in the period 1971–2019 together with the trend (a) and deviation from the multiannual values 1981–2010 (b) in selected stations in Poland: Wrocław, Warszawa and Białystok.

Figure 5.
Mean sum of active temperatures (SAT) in the period 1971–2019 together with the trend (a) and deviation from the multiannual values of 1981–2010 (b) for selected stations in Poland: Wrocław, Warszawa and Białystok.
Figure 5.
Mean sum of active temperatures (SAT) in the period 1971–2019 together with the trend (a) and deviation from the multiannual values of 1981–2010 (b) for selected stations in Poland: Wrocław, Warszawa and Białystok.

Figure 6.
Mean number of days with frost at 2 m agl (a) in Poland in the period 1971–2019 with deviation (b) from the multiannual values of 1981–2010 in selected stations in Poland: Wrocław, Warszawa and Białystok.
Figure 6.
Mean number of days with frost at 2 m agl (a) in Poland in the period 1971–2019 with deviation (b) from the multiannual values of 1981–2010 in selected stations in Poland: Wrocław, Warszawa and Białystok.

Figure 7.
Distribution of air temperature in January (a), in July (b), in the vegetative period (April–September) (c) and in the year (January–December) (d). Years 1971–2019.
Figure 7.
Distribution of air temperature in January (a), in July (b), in the vegetative period (April–September) (c) and in the year (January–December) (d). Years 1971–2019.


Figure 8.
Dates of the beginning (a) and end (b) of the active plant growth (with at >10 °C) from the period 1971–2019 and its duration from 1971–2019 (c) and 2010–2019 (d) in Poland.
Figure 8.
Dates of the beginning (a) and end (b) of the active plant growth (with at >10 °C) from the period 1971–2019 and its duration from 1971–2019 (c) and 2010–2019 (d) in Poland.

Figure 9.
Distribution of sum of active temperatures (SAT) values in a year in Poland. Years: 1971–2019 (a) and 2010–2019 (b).
Figure 9.
Distribution of sum of active temperatures (SAT) values in a year in Poland. Years: 1971–2019 (a) and 2010–2019 (b).

Figure 10.
Distribution of latitude temperature index (LTI) (a) values and the sums of sub-zero temperatures <−10 °C in the cold half-year (b) in Poland. Years 1971–2019.
Figure 10.
Distribution of latitude temperature index (LTI) (a) values and the sums of sub-zero temperatures <−10 °C in the cold half-year (b) in Poland. Years 1971–2019.

Figure 11.
Potential areas for viticulture in Poland with respect to thermal conditions.


Table 1.
Vine yield in 2009–2019 in Poland.
| Marketing Year | The Number of Producers (in the Records) | Total Area of Vine Cultivation (ha) | Area of Vine Harvest for Wine Production (ha) | Total Vine Harvest (quintals) | Volume of Wine Production (hL) | Total Harvest of Vine per ha | |||
|---|---|---|---|---|---|---|---|---|---|
| Red | White | Red | White | Quintals | hL | ||||
| 2009/2010 | 21 | 36.01 | 30.35 | 301.9 | 296.3 | 174.5 | 237.9 | 19.7 | 13.59 |
| 2010/2011 | 20 | 37.02 | 28.90 | 369.3 | 342.0 | 245.0 | 192.1 | 24.6 | 15.12 |
| 2011/2012 | 26 | 51.28 | 20.98 | 222.6 | 461.4 | 173.4 | 255.1 | 32.6 | 20.42 |
| 2012/2013 | 35 | 96.87 | 67.99 | 692.0 | 748.1 | 463.0 | 440.0 | 21.2 | 13.28 |
| 2013/2014 | 49 | 99.49 | 84.07 | 1561.0 | 1593.1 | 1021.3 | 958.0 | 37.5 | 23.54 |
| 2014/2015 | 76 | 134.35 | 130.97 | 2233.2 | 2285.1 | 1315.1 | 1422.0 | 34.5 | 20.90 |
| 2015/2016 | 103 | 194.24 | 161.50 | 3640.8 | 4477.4 | 2380.1 | 2755.2 | 50.3 | 31.80 |
| 2016/2017 | 150 | 221.23 | 204.60 | 4769.2 | 6125.5 | 3119.6 | 3874.2 | 53.2 | 34.18 |
| 2017/2018 | 201 | 331.38 | 240.74 | 3346.7 | 4681.6 | 2211.3 | 2995.8 | 33.4 | 21.63 |
| 2018/2019 | 230 | 394.84 | 300.57 | 7302.2 | 11443.6 | 4968.9 | 7781.5 | 62.4 | 42.42 |
| 2019/2020 | 294 | 468.57 | - | - | - | - | - | - | |
Source: http://www.kowr.gov.pl, access: 26.03.2020, [7].
Table 2.
Frequency (%) of years with air temperature below 0 °C in the cold half-year. Years 1971–2019.
Table 2.
Frequency (%) of years with air temperature below 0 °C in the cold half-year. Years 1971–2019.
| Wrocław | Warszawa | Białystok | |||||||
|---|---|---|---|---|---|---|---|---|---|
| <−10 °C | <−20 °C | <−30 °C | <−10 °C | <−20 °C | <−30 °C | <−10 °C | <−20 °C | <−30 °C | |
| X | - | - | - | - | - | - | 4.1 | - | - |
| XI | 18.4 | - | - | 20.4 | - | - | 36.7 | - | - |
| XII | 53.1 | 6.1 | - | 59.2 | 8.2 | - | 77.6 | 24.5 | - |
| I | 71.4 | 16.3 | - | 83.7 | 22.4 | 2.0 | 87.8 | 40.8 | 2.0 |
| II | 57.1 | 10.2 | - | 67.3 | 10.2 | - | 85.7 | 30.6 | - |
| III | 22.4 | 2.0 | - | 30.6 | 4.1 | - | 57.1 | 10.2 | - |
Table 3.
Thermal characteristics of the identified areas of viticulture in Poland.
| Areas | Mean Air Temperature (°C) | SAT Values (°C) | Active Growth Period with at >10 °C | ||||||
|---|---|---|---|---|---|---|---|---|---|
| I | VII | IV–IX | I–XII | 1971–2019 | 2010–2019 | Start Date | End Date | Duration (Days) | |
| IA Highly conducive | −0.4 ÷ −1.0 | 18.8 ÷ 19.0 | 15.1 ÷ 15.4 | 9.0 ÷ 9.2 | >2750 | >3000 | 21–22 IV | 10–12 X | 173–174 |
| I Conducive | 0.0 ÷ −1.5 | 18.5 ÷ 18.8 | 14.8 ÷ 15.0 | 8.8 ÷ 9.0 | 2650–2750 | 2900–3000 | 22–24 IV | 8–11 X | 170–171 |
| II Moderately conducive | −0.2 ÷ −2.5 | 18.2 ÷ 18.8 | 14.5 ÷ 15.0 | 8.2 ÷ 9.0 | 2650–2700 | 2800–2900 | 22–24 IV | 6–10 X | 168–170 |
| IIIA Poorly conducive | −0.3 ÷ −2.5 | 18.0 ÷ 18.7 | 14.0 ÷ 15.0 | 8.1 ÷ 8.5 | 2500–2650 | 2700–2900 | 23–29 IV | 4–7 X | 162–165 |
| III Poorly conducive (with limitations) | −2.5 ÷ −3.2 | 18.1 ÷ 18.5 | 14.4 ÷ 14.7 | 7.8 ÷ 8.0 | 2500–2600 | 2700–2800 | 24–26 IV | 2–5 X | 162–163 |
| IV Unconducive | −0.5 ÷ −3.4 | 17.5 ÷ 18.3 | 13.8 ÷ 14.4 | 7.4 ÷ 8.4 | 2400–2500 | 2600–2700 | 26–30 IV | 30 IX −4 X | 154–158 |
| VA Highly unconducive | −0.3 ÷ −2.5 | 16.9 ÷ 17.5 | 13.2 ÷ 13.6 | 7.4 ÷ 8.2 | 2300–2400 | 2500 2600 | 4–8 V | 2–8 X | 152–154 |
| V Highly unconducive (particularly in winter) | −2.0 ÷ −4.0 | 17.4 ÷ 18.0 | 13.4 ÷ 14.0 | 6.7 ÷ 7.7 | 2250–2400 | 2500–2600 | 30 IV −3 V | 26 IX −2 X | 147–150 |
© 2020 by the authors. Licensee MDPI, Basel, Switzerland. This article is an open access article distributed under the terms and conditions of the Creative Commons Attribution (CC BY) license (http://creativecommons.org/licenses/by/4.0/).
Share and Cite
MDPI and ACS Style
Koźmiński, C.; Mąkosza, A.; Michalska, B.; Nidzgorska-Lencewicz, J. Thermal Conditions for Viticulture in Poland. Sustainability 2020, 12, 5665. https://0-doi-org.brum.beds.ac.uk/10.3390/su12145665
AMA Style
Koźmiński C, Mąkosza A, Michalska B, Nidzgorska-Lencewicz J. Thermal Conditions for Viticulture in Poland. Sustainability. 2020; 12(14):5665. https://0-doi-org.brum.beds.ac.uk/10.3390/su12145665
Chicago/Turabian StyleKoźmiński, Czesław, Agnieszka Mąkosza, Bożena Michalska, and Jadwiga Nidzgorska-Lencewicz. 2020. "Thermal Conditions for Viticulture in Poland" Sustainability 12, no. 14: 5665. https://0-doi-org.brum.beds.ac.uk/10.3390/su12145665
Note that from the first issue of 2016, this journal uses article numbers instead of page numbers. See further details here.