1. Introduction
Smart power systems refer to use of information technologies in power systems to attain reduced energy consumption, and subsequently will result in energy sustainability; reduced consumption will ensure future energy availability and secure its continuous delivery via the power grid by diminishing probability of blackouts. Lately, the world dependence on energy has increased exponentially [
1], and the building sector is accountable for a large share of this growth. In fact, the United Nations Environment Program (UNEP) recognized that more than 30% of global greenhouse gas emissions and 40% of total energy consumption are the responsibility of the building sector [
2]. Moreover, heating and cooling are the main reasons for electrical energy consumption in buildings around the world. It is worth mentioning that these systems are generally controlled in a very simplistic way, based on current technologies available. This topic has sparked much attention; higher education institutions and research teams have focused on energy efficiency and improving heating, ventilation, and air conditioning (HVAC) systems aiming at maintaining required indoor temperatures and lowering electrical energy consumption [
3].
The proportional integral derivative (PID) mechanism is the most commonly employed to optimize control technologies in order to make them more adaptative [
4]. However, the technologies improving the PID mechanism are concentrated on optimizing energy consumption and air supply through fan motor speed. Unfortunately, these types of models do not have much flexibility and responsiveness, among other drawbacks, when used in spaces with time-sensitive hygrothermal requirements, such as historic buildings [
5,
6,
7]. Recently, some statistical and computational methods have been developed in order to make the systems more responsive when immediate response is required to adapt to different environmental situations [
8].
Some published research projects optimized output signals through more refined control methods, and PID correction algorithms dealt with sensitive parameters and thresholds, achieving the implementation of computing applications and improving different control models [
9]. Other research in building HVAC systems dealt with demand–response by simulation and model predictive control (MPC) using statistical and mathematical predictive control approaches [
10,
11,
12]. A study worth mentioning by Muniak [
13] examined opening valve profiles inside the fluid HVAC system obtaining successful results, while other investigators focused on a much larger scale and district level, developing heating control models focused on optimization of the distribution system, lowering gas emissions and energy efficiency [
14,
15,
16,
17,
18,
19]. Most control models are created using advanced control strategies such as a fuzzy inference system (FIS) [
20,
21,
22,
23]; moreover, comparative research projects between these models and conventional control models are very reveling and informative [
24]. For instance, Fazzolari et al. [
25] compared signal control efficiency of a FIS model with a PID conventional rule, developing a genetic algorithm using HVAC case studies. Other comparative studies analyzed the energy consumption of different control models mixing PID and FIS models of HVAC controls [
26]. Finally, Soyguder et al. [
27] created a boiler control model operating a combination of FIS and PID strategies specifying theoretical configurations for outlining interfaces while using FIS and PID mechanisms.
The adapting and retrofitting of historic buildings, as well as the maintenance of their optimal internal environments for collections and structural preservation, are inherently complex, multifaceted tasks [
28]. Moreover, indoor microclimates do not only affect collections and buildings—occupants and visitors must also be considered [
29,
30]. What is the best way to accomplish these goals and to effectively preserve a balance between architecture and efficiency when adapting historic structures to modern comfort and environmental standards? This issue has also become the focus of countless research projects in the last twenty years and artificial intelligence could help in solving this challenging problem. In fact, just a few research studies have focused on the actual energy performance of religious buildings [
31,
32,
33]. Additionally, these unique buildings have very distinctive occupancy patterns, creating an added setback while trying to keep the required indoor environment for the three aspects: occupants’ satisfaction, building preservation and artwork conservation. Therefore, this multidimensional challenge cannot be dealt by using traditional electrical HVAC control systems.
This paper introduces the novel application of a FIS controller of an electric cooling system applied in enhancing historic building performance (i.e., electricity consumption and environment preservation), and presents the comparative investigation of traditional and intelligent cooling controls installed in a United Nations Educational, Scientific and Cultural Organization (UNESCO) World Heritage site building at San Antonio, TX. The ultimate goal of this comparative study is to describe the efficiency of both systems, traditional on/off and intelligent control implementing a FIS, in order to make the system more electrical energy efficient, provide a better thermal comfort for occupants and better preserve the buildings and the artwork housed in it. This paper also attempts to contribute to this field by linking historic building preservation strategies with artificial intelligence systems to control the indoor building environment.
2. Materials and Methods
2.1. Studied Church Description
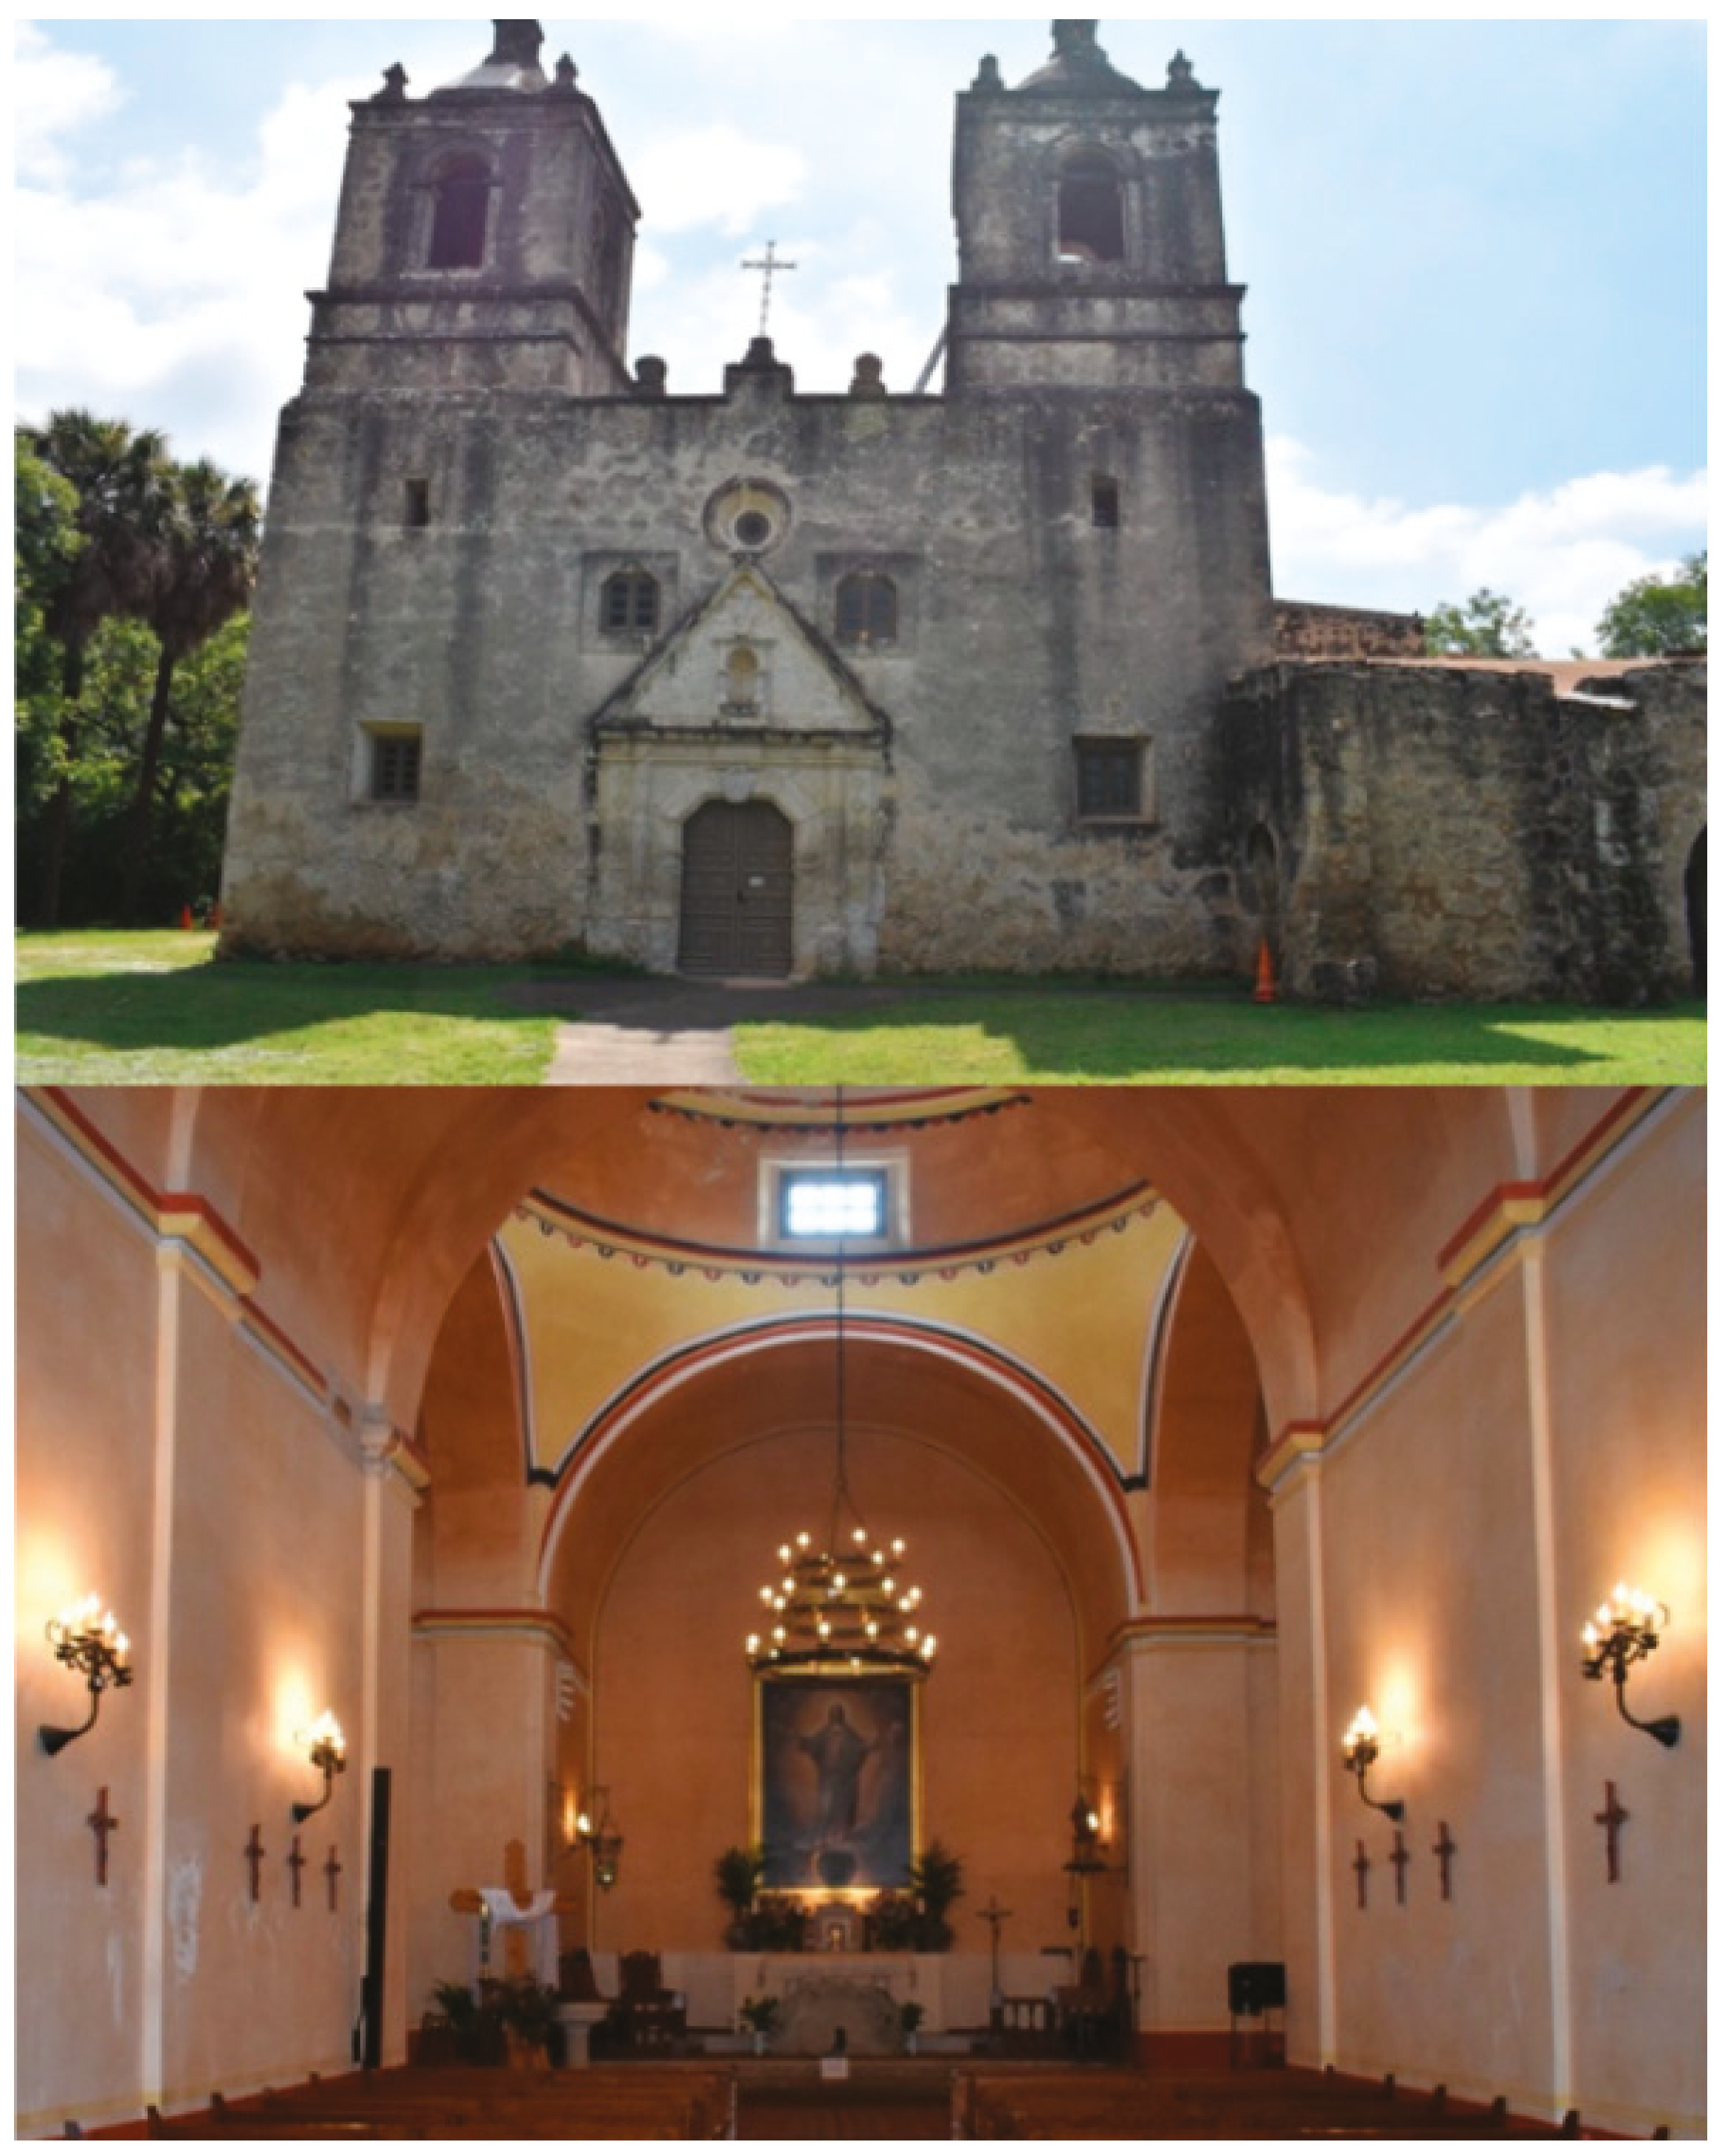
The church at Mission la Purisima Concepción de Acuña is the building used in this research and it is located in San Antonio, Texas (USA). The city has a Cfa-Humid Subtropical Climate and has a Bsk-, Semi-Arid Climate bordering on the west of the city, according to Köppen classification [
34], and is 240.5 m above sea level. The annual average temperature is 20.5 °C and temperatures can be as low as 11 °C in the coldest months and can reach as high as 29.5 °C during the hottest months.
Mission Concepcion was constructed in 1755 of local materials extracted from a nearby quarry. These materials included limestone, which was used for the construction of the surrounding walls of the complex. These walls stand over 6 m tall and are almost 1.50 m thick, and the only solid limestone features are the interior (60 cm) and exterior (84 cm) walls. A white lime-based plaster cover was used for the interior walls and the center of the building walls contain a rubble stone fill, along with wood framed windows and moldings with single pane glass and wood panel doors.
The church was built next to the San Antonio River as the center of a self-sustainable religious complex. The proximity to the river provided irrigation and the nearby military at the Presidio San Antonio de Bexar provided protection and safety for the site. The Mission is the oldest unrestored stone church in the United States; it became part of the San Antonio Missions National Historical Park in 1978 and has been a UNESCO World Heritage Site since 2015.
The main entrance of the church leads into the Nave, which holds 11 rows of pews that seat 5 to 6 people on each side and approaches the Chancel and the Sanctuary. Directly to either side of the main entrance along the Nave are the Baptistry, located directly to the right, and the Tower Room, located directly to the left. The two bell towers are located directly above these two rooms, framing the entrance, and are each approximately 18 m tall. There is a vaulted dome ceiling in the center of the Transept and the Sacristy is located to the right of the Transept. It houses the only window on the east side of the Church and leads to the back exit/entrance of the church. There are also inoperable windows located directly above the main entrance on the west side of the church as well as in the Baptistry and in the Tower room (
Figure 1).
The Church has massive infiltrations due to the very low airtightness, which allows the building to be naturally ventilated. In addition to these passive systems, there is a split system heat pump that is made of scroll air-conditioning compressor assembly, an air-cooled coil, propeller-type condenser fans, and a control box. The cooling system has a constant setpoint of 22 °C and is operated 24 h per day, 7 days a week, and conducts weekly mass services on Sundays at 10:00 and 12:00.
2.2. Environmental Monitoring
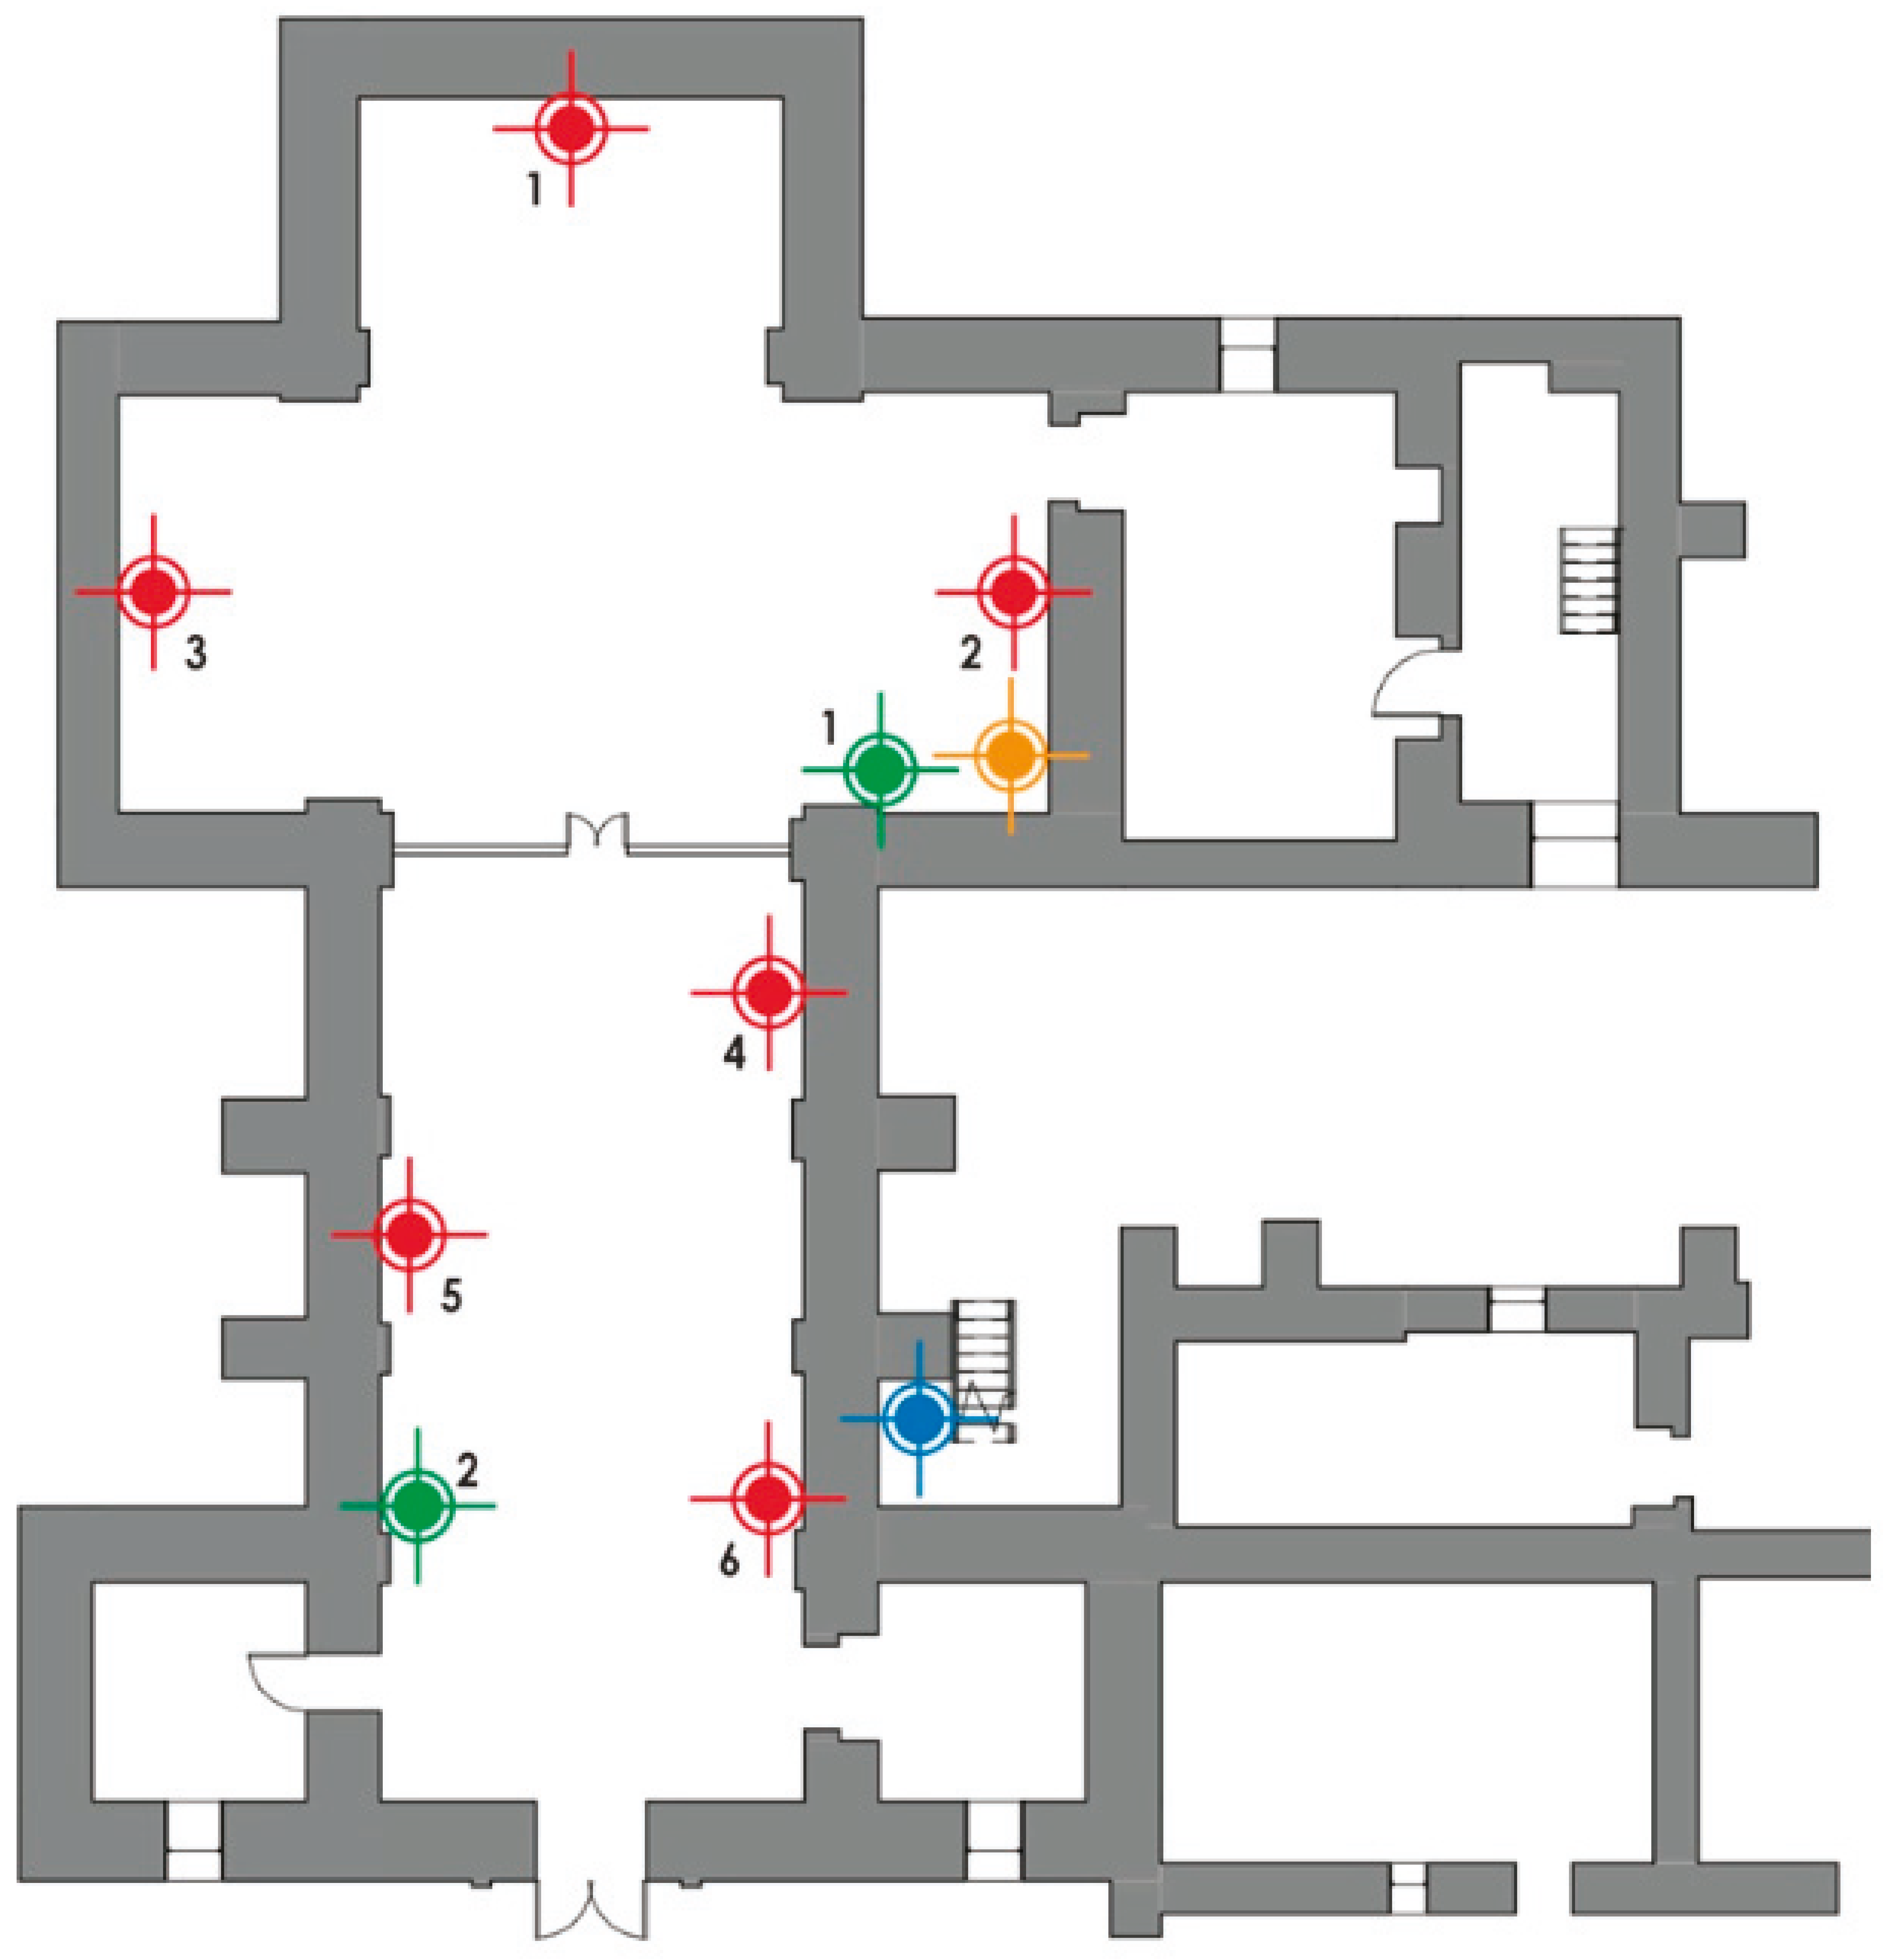
A series of data loggers were strategically placed throughout the building to monitor temperature (°C) and relative humidity (%) during the cooling season (July to October 2019). Six temperature and relative humidity indoor sensors and one temperature and relative humidity outdoor sensor were placed in planned locations according to the requirements of The American Society of Heating, Refrigerating and Air-Conditioning Engineers (ASHRAE) 55 [
35] (at least 1 m away from external walls and height at least 1.10 m from the ground) and the prescriptions of ISO 7726 (2012). These sensors were located far from light fixtures and windows to avoid incorrect measurements due to the additional heat. The data loggers were also installed out of people’s reach as another precaution to prevent tampering or theft and to maintain the historic architectural and material features of the mission (
Figure 2).
To obtain a wide range of indoor temperatures and relative humidity conditions, the data loggers were set to capture readings every 15 min. This also enabled the research to detect any drastic changes during the testing period of each day. Occupancy and HVAC operation rates were monitored using two and one data loggers, respectively. These devices recorded the occupancy and operation percentages in 15-min intervals as well.
Average air temperature and relative humidity values for the average indoor and outdoor conditions of the Mission are shown in
Table 1 during the research period of July through October 2019. The datalogger specifications are shown in
Table 2.
2.3. Design Strategy
This project proposes a simplified operational model for the electric HVAC system in this religious building in order to reduce energy consumption and increase sustainability while maintaining thermal comfort standards and keeping heritage values unaltered. As mentioned above, this construction has one independent module equipped with a cooling system with two main ducts. This model neglects thermal comfort values such as air speed changes and their impact on pressure, plus air leakage between envelope and duct systems. The studied room’s airflow is also homogenous.
Field measured data was used for the hygrothermal model in order to optimize the controls to meet the indoor environmental requirements for this building. This unique structure requires a comfortable hygrothermal environment for visitors and mass attendants, for artwork conservation and for preserving the building itself. Based on the ASHRAE 55 [
36], the recommended air temperature for occupants ranges from 22 to 28 °C with humidity between 30% and 60% during the cooling season. Additionally, historic buildings housing artwork are required to maintain these pieces and the historic buildings themselves unaltered, and to do so, air temperature values should be within the range of 21 to 24 °C, and relative humidity from 40% to 60% [
36]. Therefore, in order to meet both requirements, the ideal indoor environmental parameters should be the most restrictive by meeting both parameters and therefore are considered to be from 22 to 24 °C for air temperature and from 40% to 60% for relative humidity.
2.4. Intelligent Controller Model
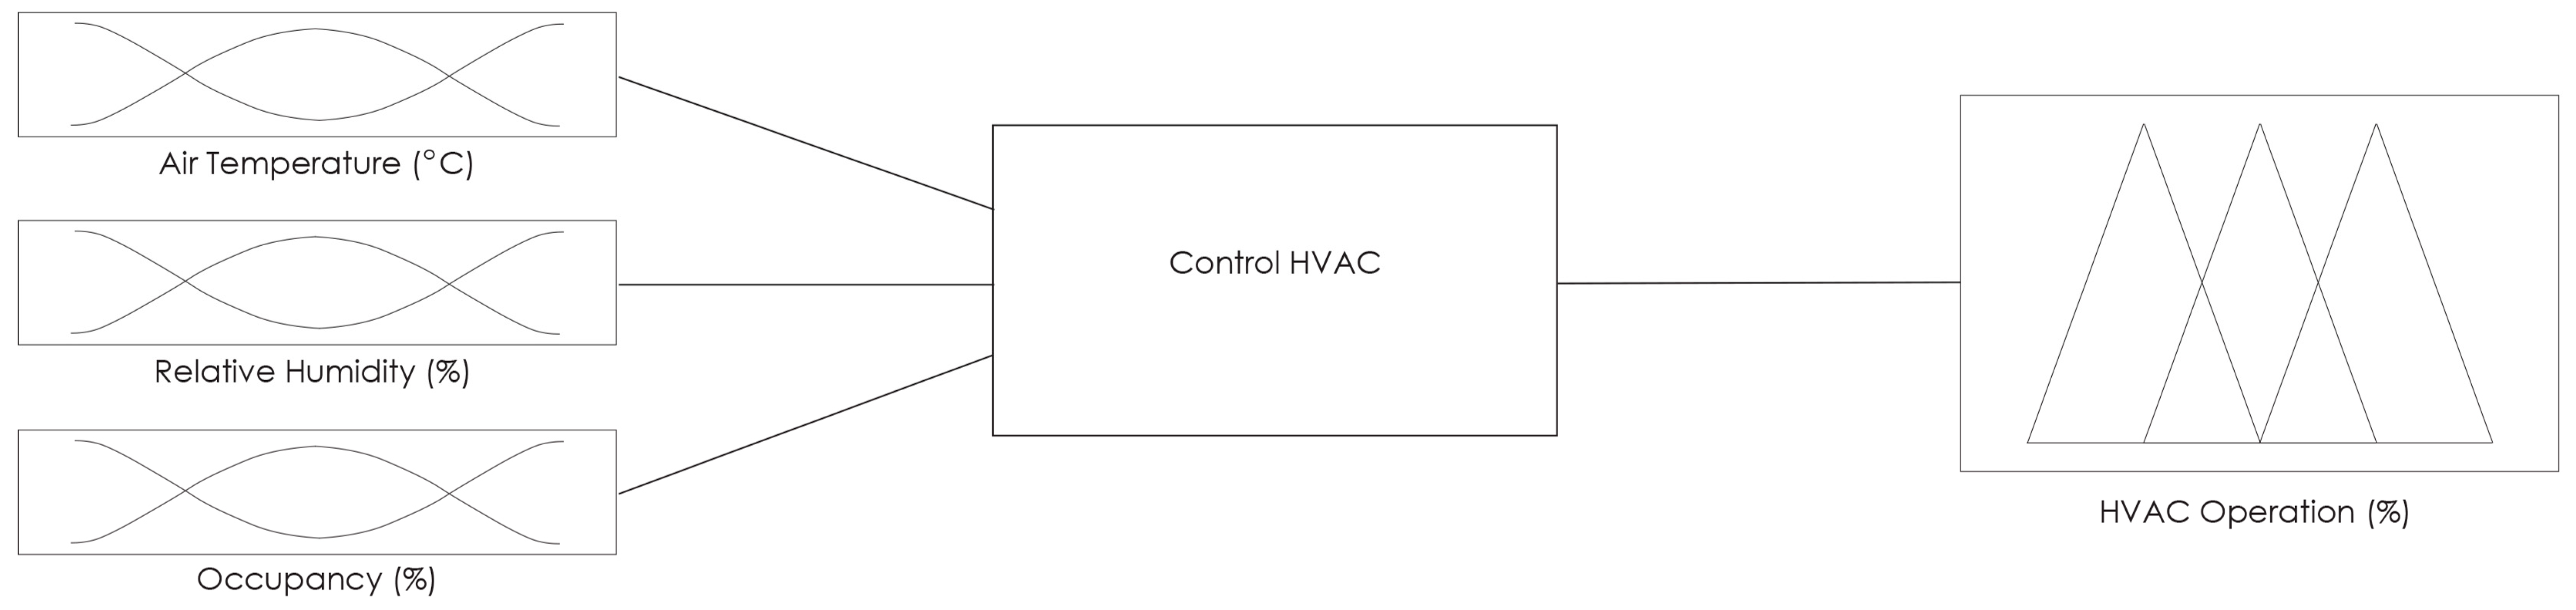
A baseline model and an intelligent control model were compared and tested using the expectations to define the successfulness of the controller. The reference model is a conventional thermostat on/off controller using temperature setpoints. While using the proposed thermostat, the controller activates the control algorithm fuzzy inference system. As shown in
Figure 3, and based on the assumptions, requirements, HVAC system and controllers, a simulation model was generated.
2.4.1. Thermostat on/off Control
The usual setpoint temperature for the building is set at 22 °C with a dead band setup of ±2 °C. For example, if the indoor air temperature goes over 24 °C, the difference between the setpoint and the indoor air temperature is +2 °C, then the on/off controller sends a turn-on signal to the HVAC unit. Due to the hot and humid climate of San Antonio (ASHRAE climate zone 2A), this study focuses on the cooling performance, therefore the low dead band setup −2 °C is neglected. Relative humidity values do not currently impact the HVAC operation.
2.4.2. Fuzzy Inference System (FIS) Control
As shown in
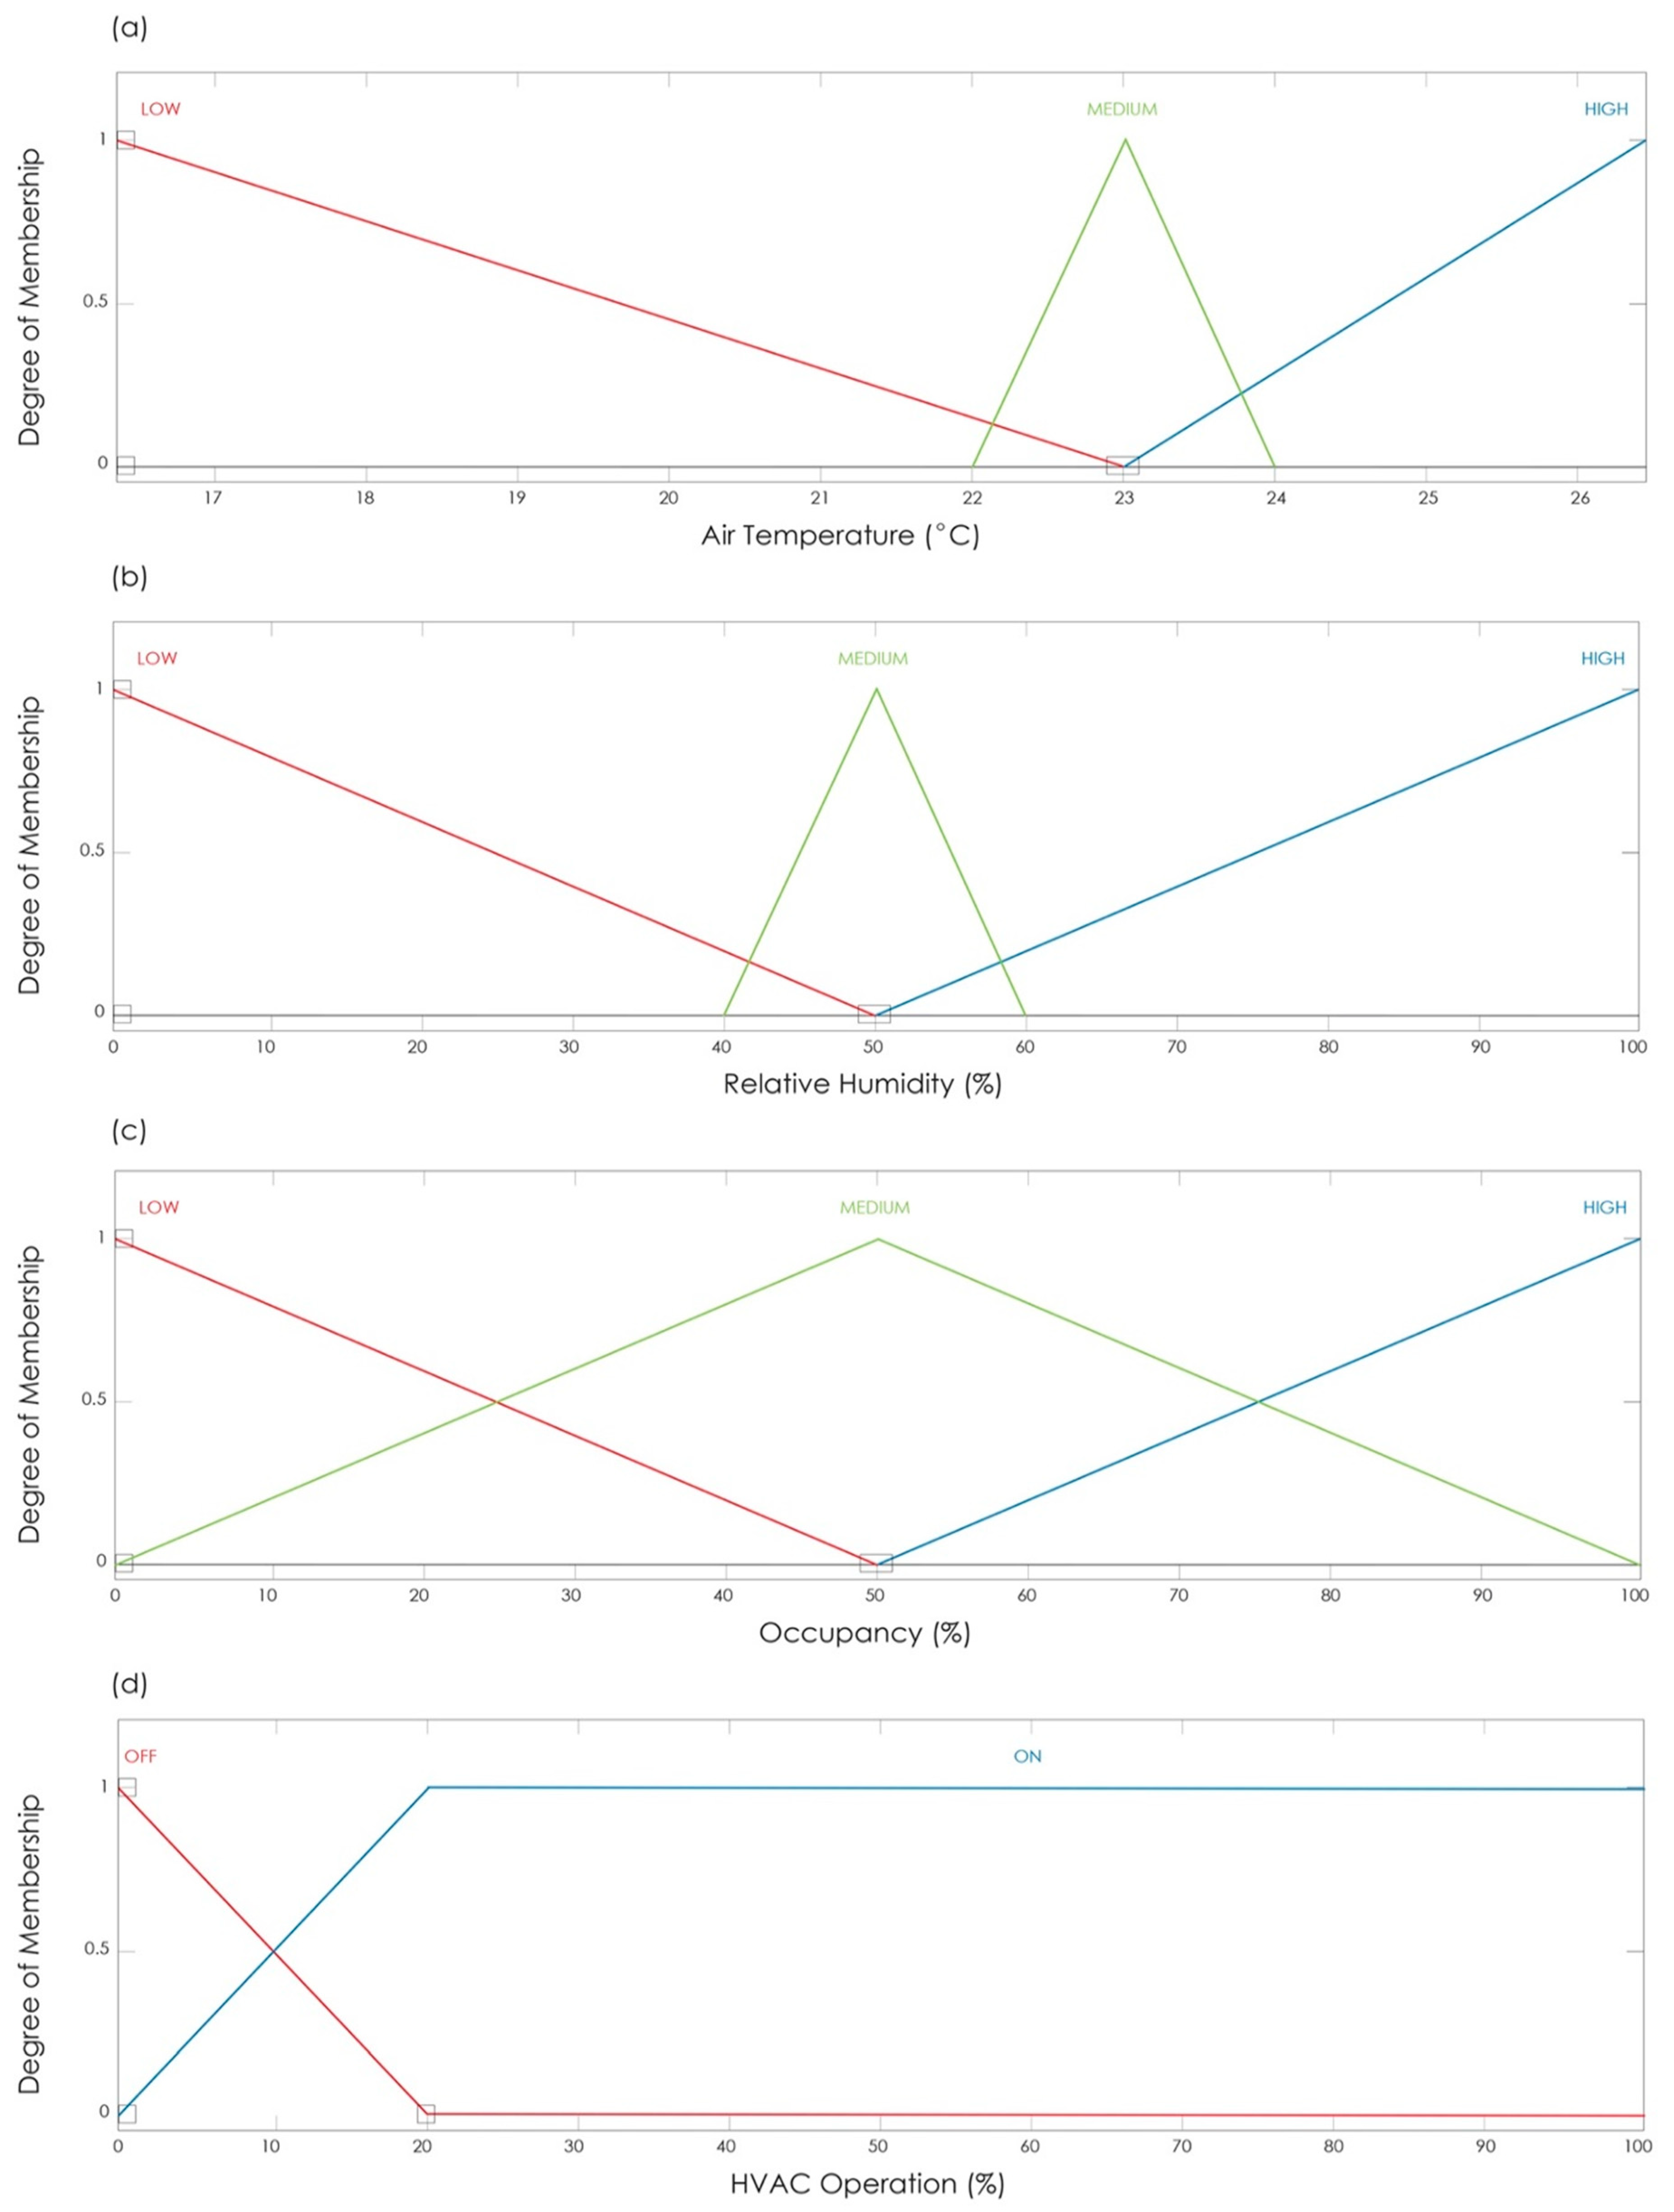
Figure 3, the FIS model has the objective of calculating the optimal HVAC operation values depending on the indoor air temperature, relative humidity, and occupancy levels. Each of the aforementioned variables is modeled with three fuzzy sets that span the value range of each variable. With regard to air temperature, authors used three fuzzy sets named LOW, MEDIUM and HIGH to span the range from 10 to 30 °C as presented in
Figure 4a. The range of temperature values was determined based on observation of the historical temperature data in the studied building. The other two variables—relative humidity and occupancy—were also modeled by adopting three fuzzy sets labeled as LOW, MEDIUM and HIGH that span the range from 0%–100% as shown in
Figure 4b,c, respectively. It is worth mentioning that occupancy input is established following the same format as the monitored occupancy during the monitoring campaign (percentage of occupied time every 15 min). Furthermore, selection of fuzzy set modeling was made in a way that the recommended operational values coincide with the MEDIUM fuzzy set. In addition, the shape of the membership function of the fuzzy sets exhibit a triangle shape as shown in
Figure 4b–d. In analytical terms, the triangle membership functions are given by Tsoukalas et al. [
37] as shown in Equation (1):
where
a and
b (
a <
b) are the two parameters that define the base of the triangle,
A is the name of the fuzzy set,
x is the input and
μ(
x) denotes the membership function of the fuzzy set. Furthermore, authors considered that all membership function maximum values are equal to 1.
With regard to control output, the FIS implements a single fuzzy variable named “operational percentage”. The output expresses the percentage of time that the electric cooling system should operate in the next 15 min. For instance, an FIS output equal to 50% implies that the cooling will operate for 7.5 min in the next 15 min. The fuzzy modeling of the output variable is attained by utilizing two fuzzy sets labeled as ON and OFF, whose membership functions are depicted in
Figure 4d. Notably, the fuzzy set OFF, which peaks at 0%, expresses the system state in which cooling does not operate, while the fuzzy set ON expresses the state in which the cooling system operates and peaks at the value of 100%. Analytically, as presented in Equation (2) [
37], the FIS output sets take the form of a trapezoidal with maximum value at 1 which is given below:
where parameters
a,
d define the long support and
b,
c the short support area of the trapezoid.
Correlation of the input variables with the output is performed via a set of fuzzy rules of the form [
37]:
where the left part expresses the condition that need to be valid in order to take the action on the right part of the rule. In the proposed FIS, the rules are comprised of more than one conditions that are connected via the AND operator as shown below:
which demands that the action is taken only if both conditions are valid.
Table 3 shows the fuzzy signal control rules for indoor temperature, indoor relative humidity and building occupancy (input variables) and one control action or HVAC operation (output). The overall number of rules developed for the FIS is equal to 27. Rule development was based on modeler’s experience derived from previous works on the needs for efficiently preserving the historic building and occupant’s thermal comfort. For example, the first rule provided in
Table 3 takes the following form:
IF Indoor_Temperature is LOW, AND Indoor Humidity is LOW, AND Occupancy is LOW, THEN HVAC Operation is OFF.
Evaluation of the fuzzy rules is performed using the
Mamdani Minimum operator whose analytical form is given in the Equation (3) below [
37]:
with
A,
B being the fuzzy sets and
μ(
x) are the respective membership function.
The output of the fuzzy rules will coincide with a fuzzy number that won’t be of practical use to the electric cooling system [
38]. Therefore, the authors implemented a last stage in the FIS that is comprised of the defuzzification whose goal is to transform the fuzzy number into a crisp number—in this case, this coincides with the operational percentage as shown in
Figure 3 [
39]. In this work, authors adopt the Smallest Of Maximum (SOM) defuzzification which determines as the final output of the system the smallest value among those that have the highest degrees of membership [
37].
3. Results
This section presents the results obtained with the two different controllers, the proposed intelligent controller and the original ON/OFF (manual) controller. The goal of each controller is to determine the amount of time that the electric HVAC system will operate in the next 15 min, so as to ensure the thermal comfort of people while enhancing building and artwork preservation. During the monitoring campaign, results are recorded every 15 min for an extensive period of time that covers the timeline from July to October 2019. Results taken with each of the controller are presented in terms of average operational percentage per 15 min and are bundled on a monthly basis—thus, results are given for the months of July, August, September and October (overall, there are 10,080 datapoints).
3.1. Manual Controller (ON/OFF) Measured Results
The manual controller is installed in the electric cooling system and regulates the air temperature in the building. Its operation is based exclusively on the predefined temperature setpoint. The results are presented in terms of average operational percentage per 15 min for each tested month.
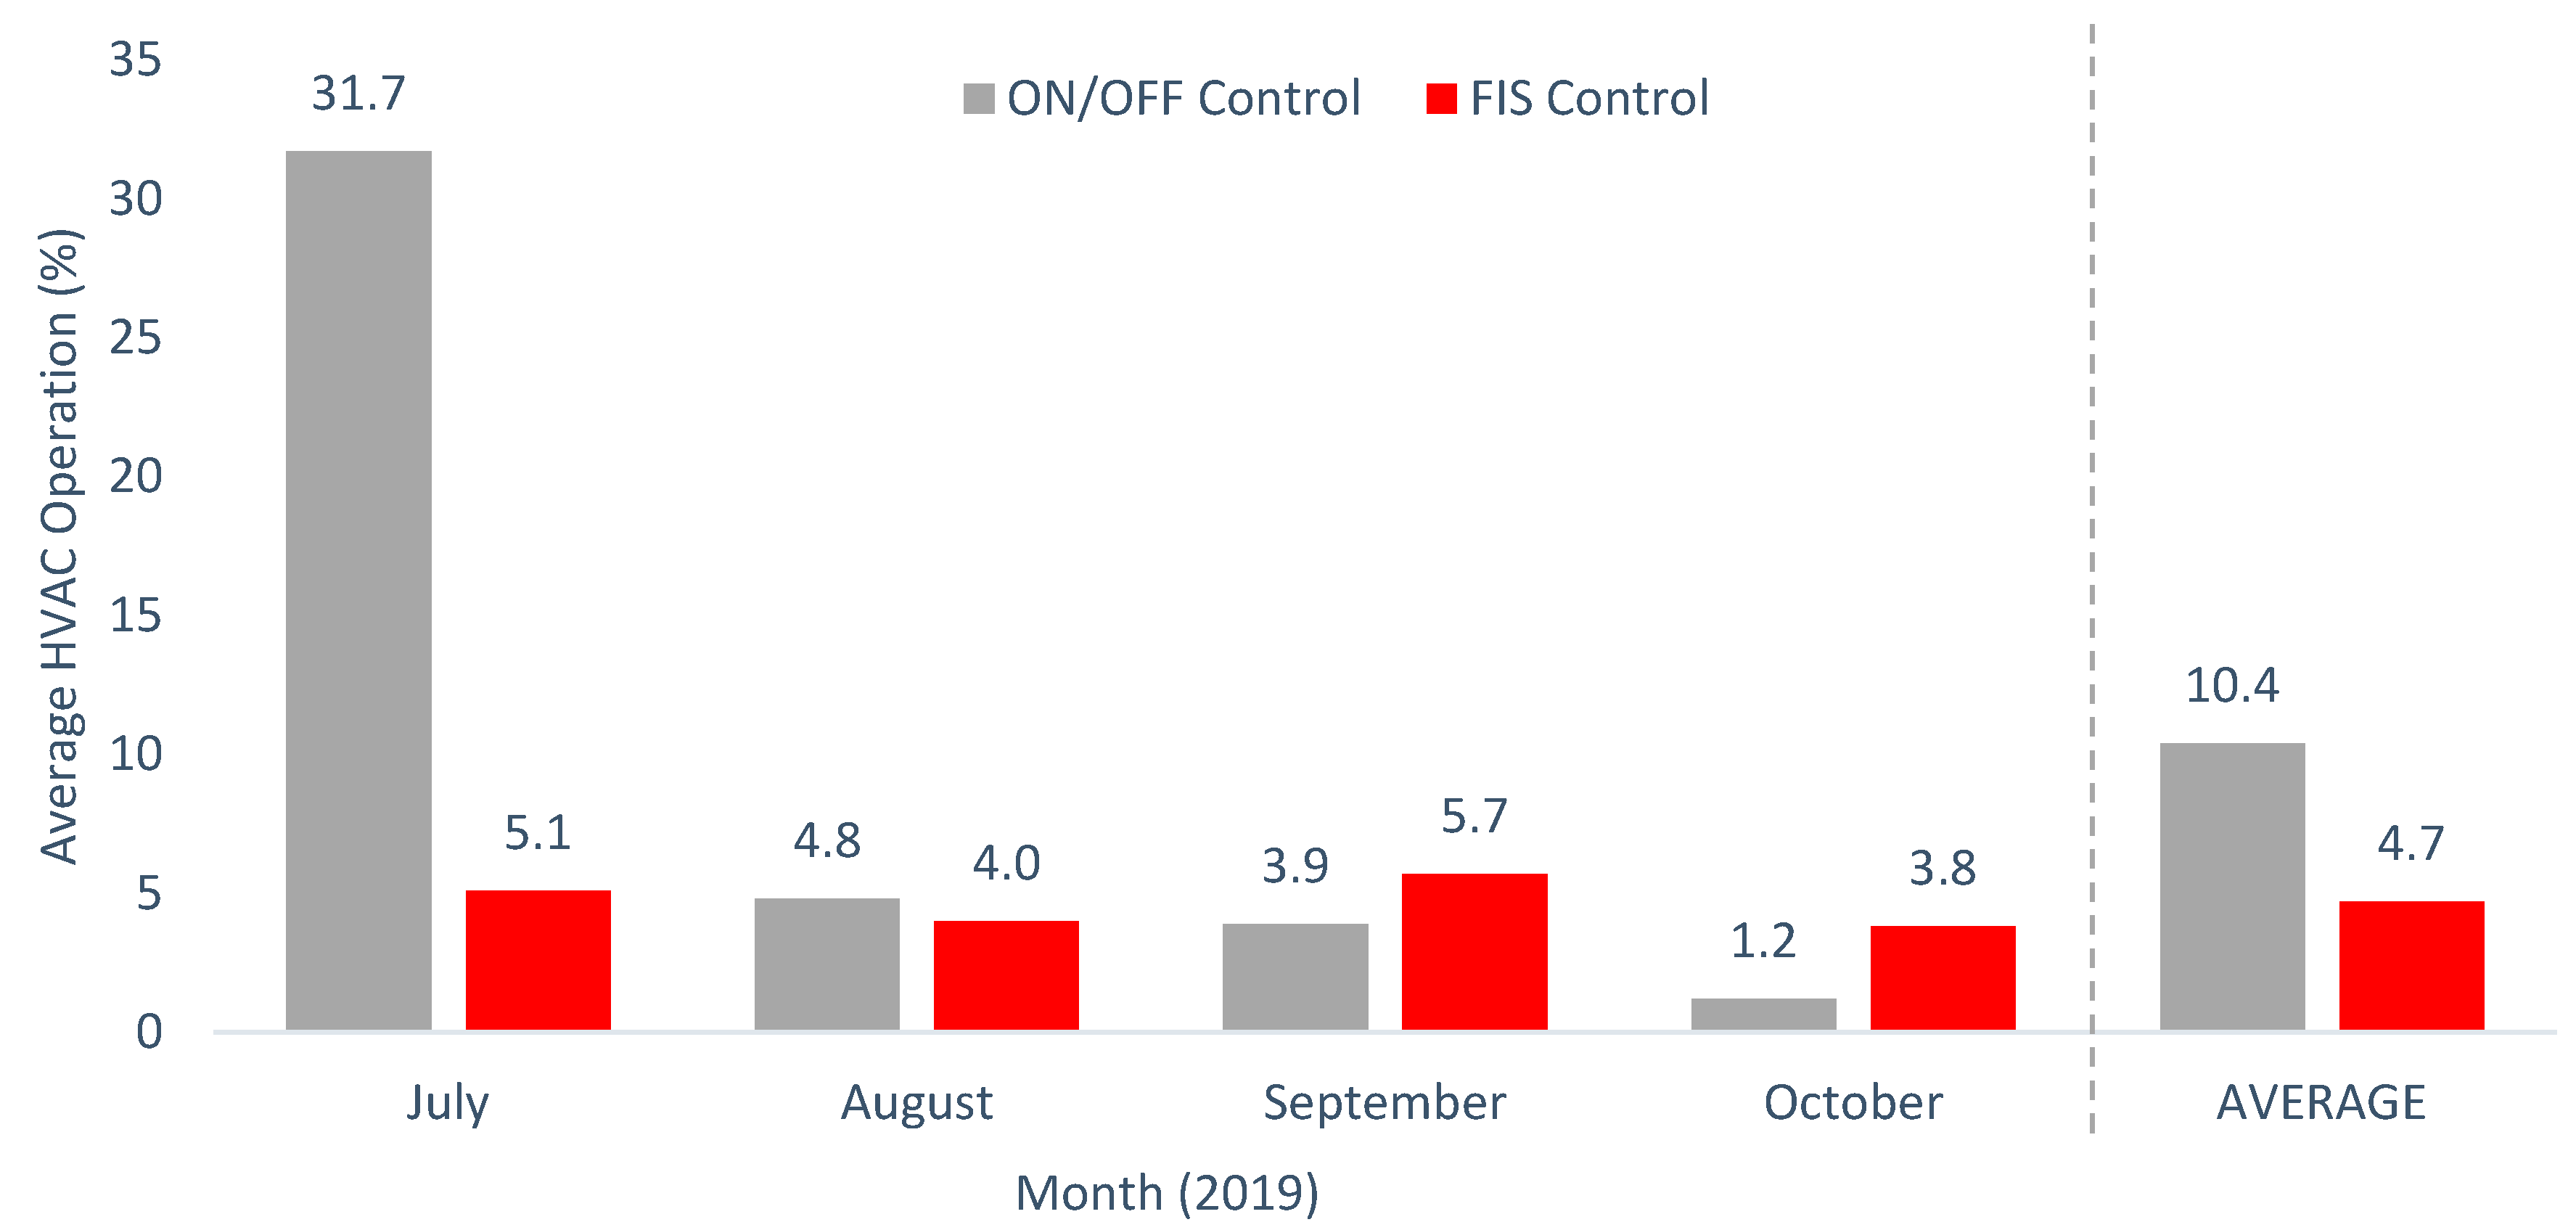
Table 4 provides the obtained results for the manual ON/OFF controller. It is worth mentioning that for the month of July the average operational percentage was as high as 31.7%, while for the rest months the average value was less than 5%. This observation is expected given the hot temperatures in the San Antonio area during the summer period, and especially in July, being the most humid month with almost 57% relative humidity outdoors. Additionally, this very high percentage of operation should be also attributed to the highest recorded occupancy in July of 25.5% (
Table 1). The average relative humidity and occupancy diminished in the following months, a factor that drove the manual ON/OFF controller to operate less, given that the controller is exclusively based on the temperature values and occupancy (radiant heat).
3.2. Intelligent Control Modeled Results
As shown in
Table 5, results of the FIS controller are provided for the same time period. The average operational percentage was lower than 5.1% in all tested months, with October giving the lowest percentage that was equal to 3.8%. As seen previously, the operational percentage gets lower as it moves from July to October, given that the intelligent controller is also partially driven by the temperature of the building. The largest decrease in time operation was achieved in July with a 26.6%. It should be noted that the controller evaluates the conditions at the beginning of each quarter of time (15 min) and then makes a decision over the portion of the next 15 min that the HVAC should operate.
3.3. Controller Comparison
The evaluation between the two controller types highlights the superiority of the intelligent controller over the manual ON/OFF controller. By comparing the performance of the two algorithms as depicted in
Table 4 and
Table 5, it can be concluded that the intelligent control is more efficient in the long term, even though it can be less efficient in certain particular situations. To facilitate the comparison of the controllers, the authors provide a graphical representation of the results from
Table 4 and
Table 5 augmented by the average operational percentage for the whole tested time period in
Figure 5.
With regard to the month of July, comparison between the two controllers exhibited a clear superiority of the FIS over the manual ON/OFF. In particular, the FIS control provided a much more efficient operation with the average percentage being equal to 5.1%, while the manual control provided an average of 31.7%, which is over six times higher than the FIS controller average time. This high difference is attributed to the inherent operational principle of the manual controller which is driven only by the air temperature as opposed to the FIS that is driven only partially by this input variable. Consequently, the high air temperature in July makes the manual controller operate for a far longer time than the FIS.
Results calculated for August show that the difference between the average operational percentage of the two controllers was equal to 0.8%, with the intelligent controller giving a percentage value of 4% (4.8% for the manual control). In September, the FIS operates averagely 5.7% of the time at each 15 min, while the respective time for the manual was 3.9%. The comparison of the two values revealed a difference equal to 1.8%, with the manual operating less than the FIS. Going further, can be observe in
Figure 5 that the intelligent controller operates, again, slightly more than the manual controller with respect to the month of October. In particular, the obtained average operation percentages were 3.8% and 1.2% for the FIS and manual controller, respectively. Overall, in September and October the manual controller operated for less time than the intelligent controller. This observation was fully anticipated given that the air temperature drops in these months and the manual temperature needs less time to operate as compared to the intelligent controller. However, the intelligent controller provides higher operational time—though the time percentage is still low given that was less than 6% for both months—since it takes into account the relative humidity and building occupancy. Relative humidity was higher (rain season) in San Antonio in these two months (September and October), as well as the number of visitors of the historic building decreased in the Fall. Additionally, as illustrated in
Table 1, monitored indoor relative humidity values in September and October, while using the manual on/off controller, are usually higher than the maximum recommended (60%) for an adequate thermal comfort and preservation requirements. Due to the fact that the FIS controller needed also to lower these relative humidity values below 60%, it explains the longer hours of operations compared to the traditional controller. Therefore, the intelligent controller operates for more time to account for relative humidity and occupancy of the building, factors that are significant for building preservation and occupant’s comfort. Thus, even though the intelligent controller operates for a longer time than the manual one at certain periods of time, it succeeds in enhancing the preservation of the building in a more efficient way as opposed to the manual controller, which does not account for relative humidity and occupancy but only for temperature.
Lastly, the authors computed the average values of the operation for the whole monitored time—July to October—in order to evaluate the performance of the controller over time. Thus, comparison of the total average values illustrates the advantage of the intelligent controller over the manual controller expressed as a difference of 5.7% (manual: 10.4% and FIS 4.7%), as shown in
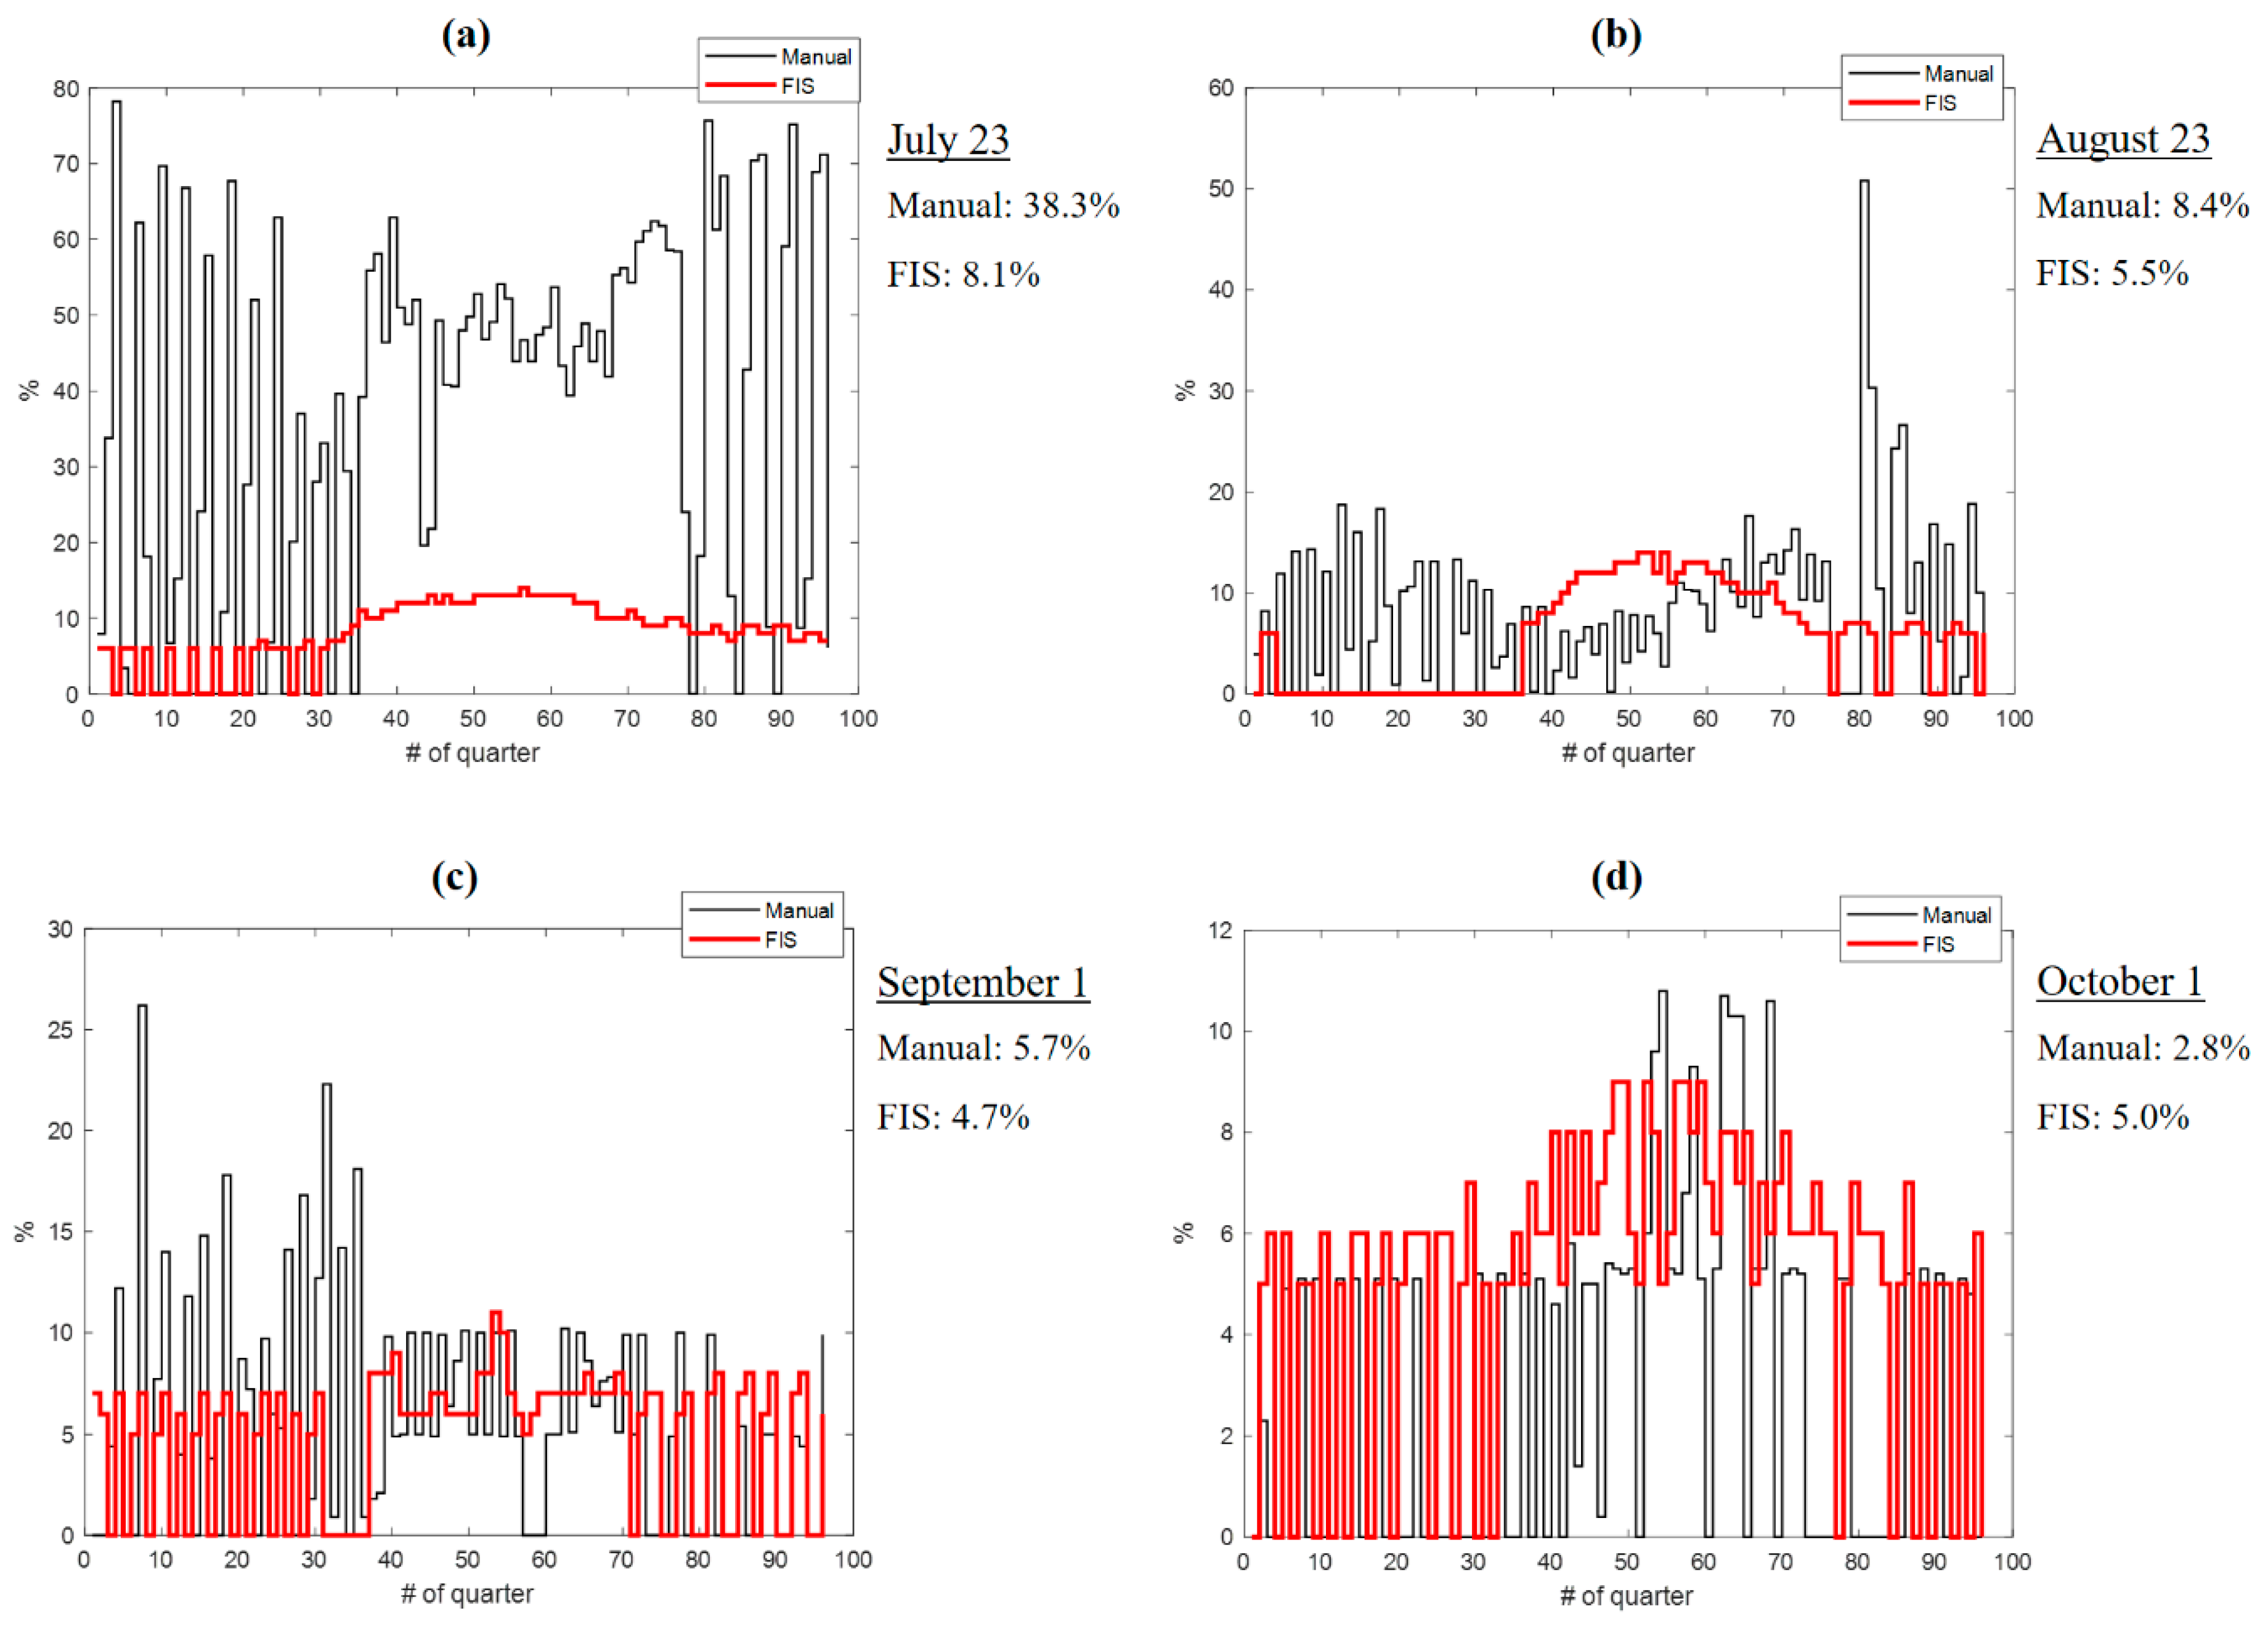
Figure 5. In order to make a much-detailed analysis, the authors provided the cooling system operation obtained by FIS and manual OFF/ON in
Figure 6 for four different days, one for each moth: 23 July, 23 August, 1 September, and 1 October 2019.
Figure 6 also provides the operational percentage of each day taken with the two controllers. It is clearly proven that the FIS controller is extraordinarily efficient over time compared to a regular ON/OFF controller, particularly under very hot environmental conditions.
4. Conclusions
Although the sustainable adaptation of historic buildings has become a recurrent choice, the embedded heritage value could represent an additional constraint in the process due to preservation requirements that can limit the range of intervention from an architectural and technological point of view. However, it is to be noted that traditional constructions could also contribute to reduce energy consumption. Research has demonstrated that adapting historic buildings to current energy efficiency and thermal comfort standards is essential for improving sustainability and energy performance and for maintaining built heritage of historic structures. This article presents a cooling air controller taking into consideration not only indoor air temperature, but also relative humidity and occupancy levels. Utilizing manual controls as a baseline, hybrid controls are created to evaluate the system control and indoor environmental variables for unpredicted changes in hygrothermal demands. Comparing the regular manual ON/OFF controller with the FIS controller, the intelligent controller high efficiency is directly linked to occupant’s comfort and building and artwork preservation.
The outcomes prove the value of a cooling air controller based on artificial intelligence tools using a FIS model. When the building requires sensitive controls such as historic buildings, the FIS model can be used to optimize the cooling supply to meet air temperature and relative humidity requirements, taking into account the building occupancy. This enhancement not only improves indoor air quality but also reduces energy consumption and the building becomes holistically more sustainable. The model can be also used in cases requiring frequent changes in occupancy such as organized religious services, as well as situations when the building experiences rapid air temperature or relative humidity changes.


