1. Introduction
From the report of the World Commission on Environment and Development in 1987, environment and development have been shown into particular actions in different domains, linked to sustainability principles, aspiring to higher parameters of quality of life without neglecting human rights, society, and its ecological processes [
1]. Reflections on urban environmental quality are related to the space or territory where individuals, activities, and nature coexist [
1]. Parks are prime sources of ecosystem services for city dwellers [
2] and are a chief example of the urban environment. Among some of the services they provide are scenic beauty, clean air, shelter, food and nesting of birds and insects, shade, thermal comfort, areas for rest, and leisure [
3].
The role of green areas in urban spaces is being increasingly appreciated [
4]; the term of urban ecosystem at the end of the last century considered the primary function of green areas for societies; it included all the "green and blue spaces" that you can find in urban and peri-urban areas, including parks, cemeteries, gardens, patios, urban plots, urban forests, individual trees, wetlands, streams, rivers, lakes, and ponds [
5].
In different regions of the planet and in Latin American countries in particular, green areas have gone through an intense process of urbanization that has resulted in significant impacts to the environment. The elements of the environment that have been affected the most are the quality of the air, water, and soil; in addition, it has particularly affected environmental quality in specific sites, that in turn influence social and economic development of cities [
6,
7].
In this sense, environmental pollution has become a serious problem for all countries, especially those in emerging economies, as reported by some studies on anthropogenic pollution in recent years [
8,
9,
10,
11]. The causes of pollution in urban areas have different ways of being studied and addressed, and some methods have included a classification relative to point sources or critical points of contamination corresponding to the areas that release higher concentrations. Second, multiple point sources, where the pollutant load comes from various point sources located in a relatively large space, make it difficult to identify the sources; as is the case of industrial parks. Finally, there are non-point sources, where the polluting load derives from the development of anthropogenic activities in large areas, for example, the use of fertilizers and the contamination of water by heavy metal industries [
10,
12].
The World Health Organization (WHO) estimates that each year more than 12.6 million people in the world die due to the unhealthiness of the environment, although only 847,000 of these correspond to America. It also refers, air, water, and soil pollution as a major health risk, in addition to exposure to chemicals, climate change, and ultraviolet radiation. Together, these factors are estimated to contribute to the development of more than 100 diseases or injuries [
13]. In addition, the Organization for Economic Cooperation and Development (OECD) visualizes a critical panorama for the year 2050, warning that air pollution will be the main environmental problem that causes premature deaths. The estimated figure is 3.6 million deaths per year, and it also adds that emissions of Sulfur Dioxide (SO
2) will be 90% higher, and Nitrogen Oxides (NOx) 50% higher. Regarding water, it states that more than 240 million people will not have access to safe sources in terms of sufficiency, availability, and quality [
14].
This discouraging scenario demands the design and application of practical public policies with an integrating approach involving society, environment, and economy, so that the environmental quality of cities is strengthened. Within these policies, an important issue is management of parks as the main source of ecosystem services for city dwellers [
1,
2,
3,
15]. It is out of the need for a closer knowledge of urban environments such as parks that environmental diagnosis is drawn up, which is a tool that provides methods and techniques for addressing environmental problems, thus compensating the lack of ecological and social information, that municipalities or local government entities do not provide [
16,
17,
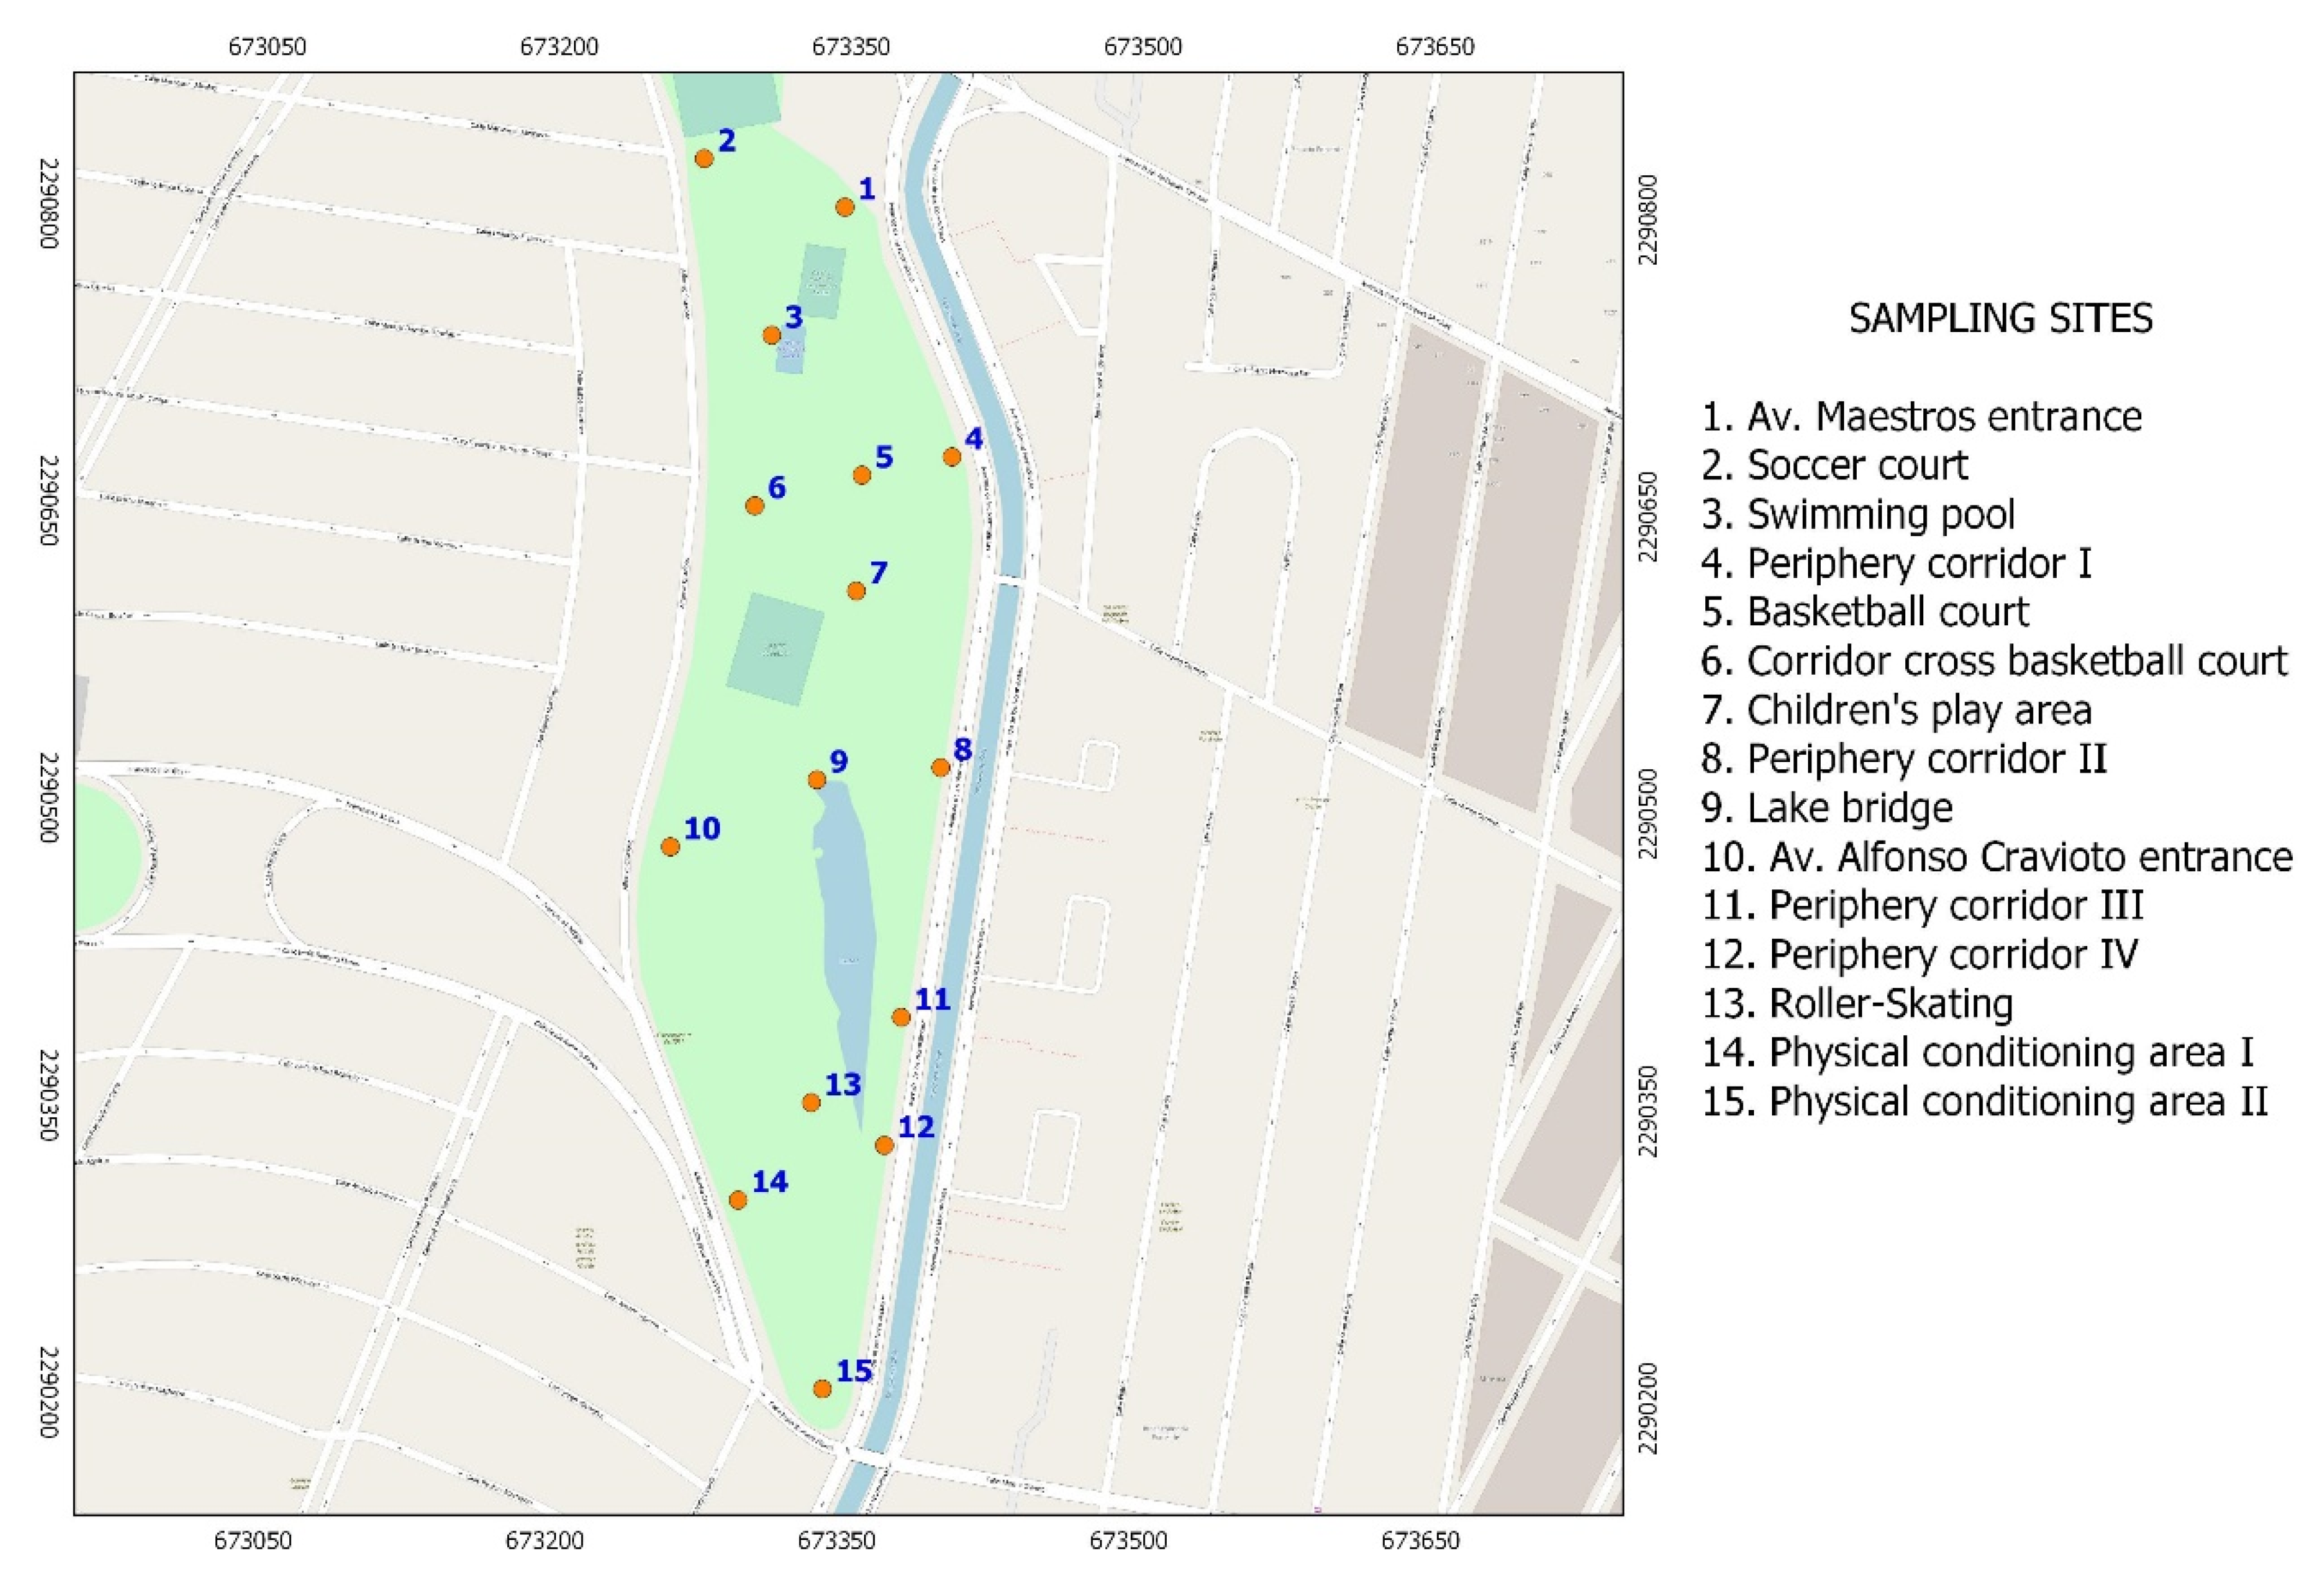
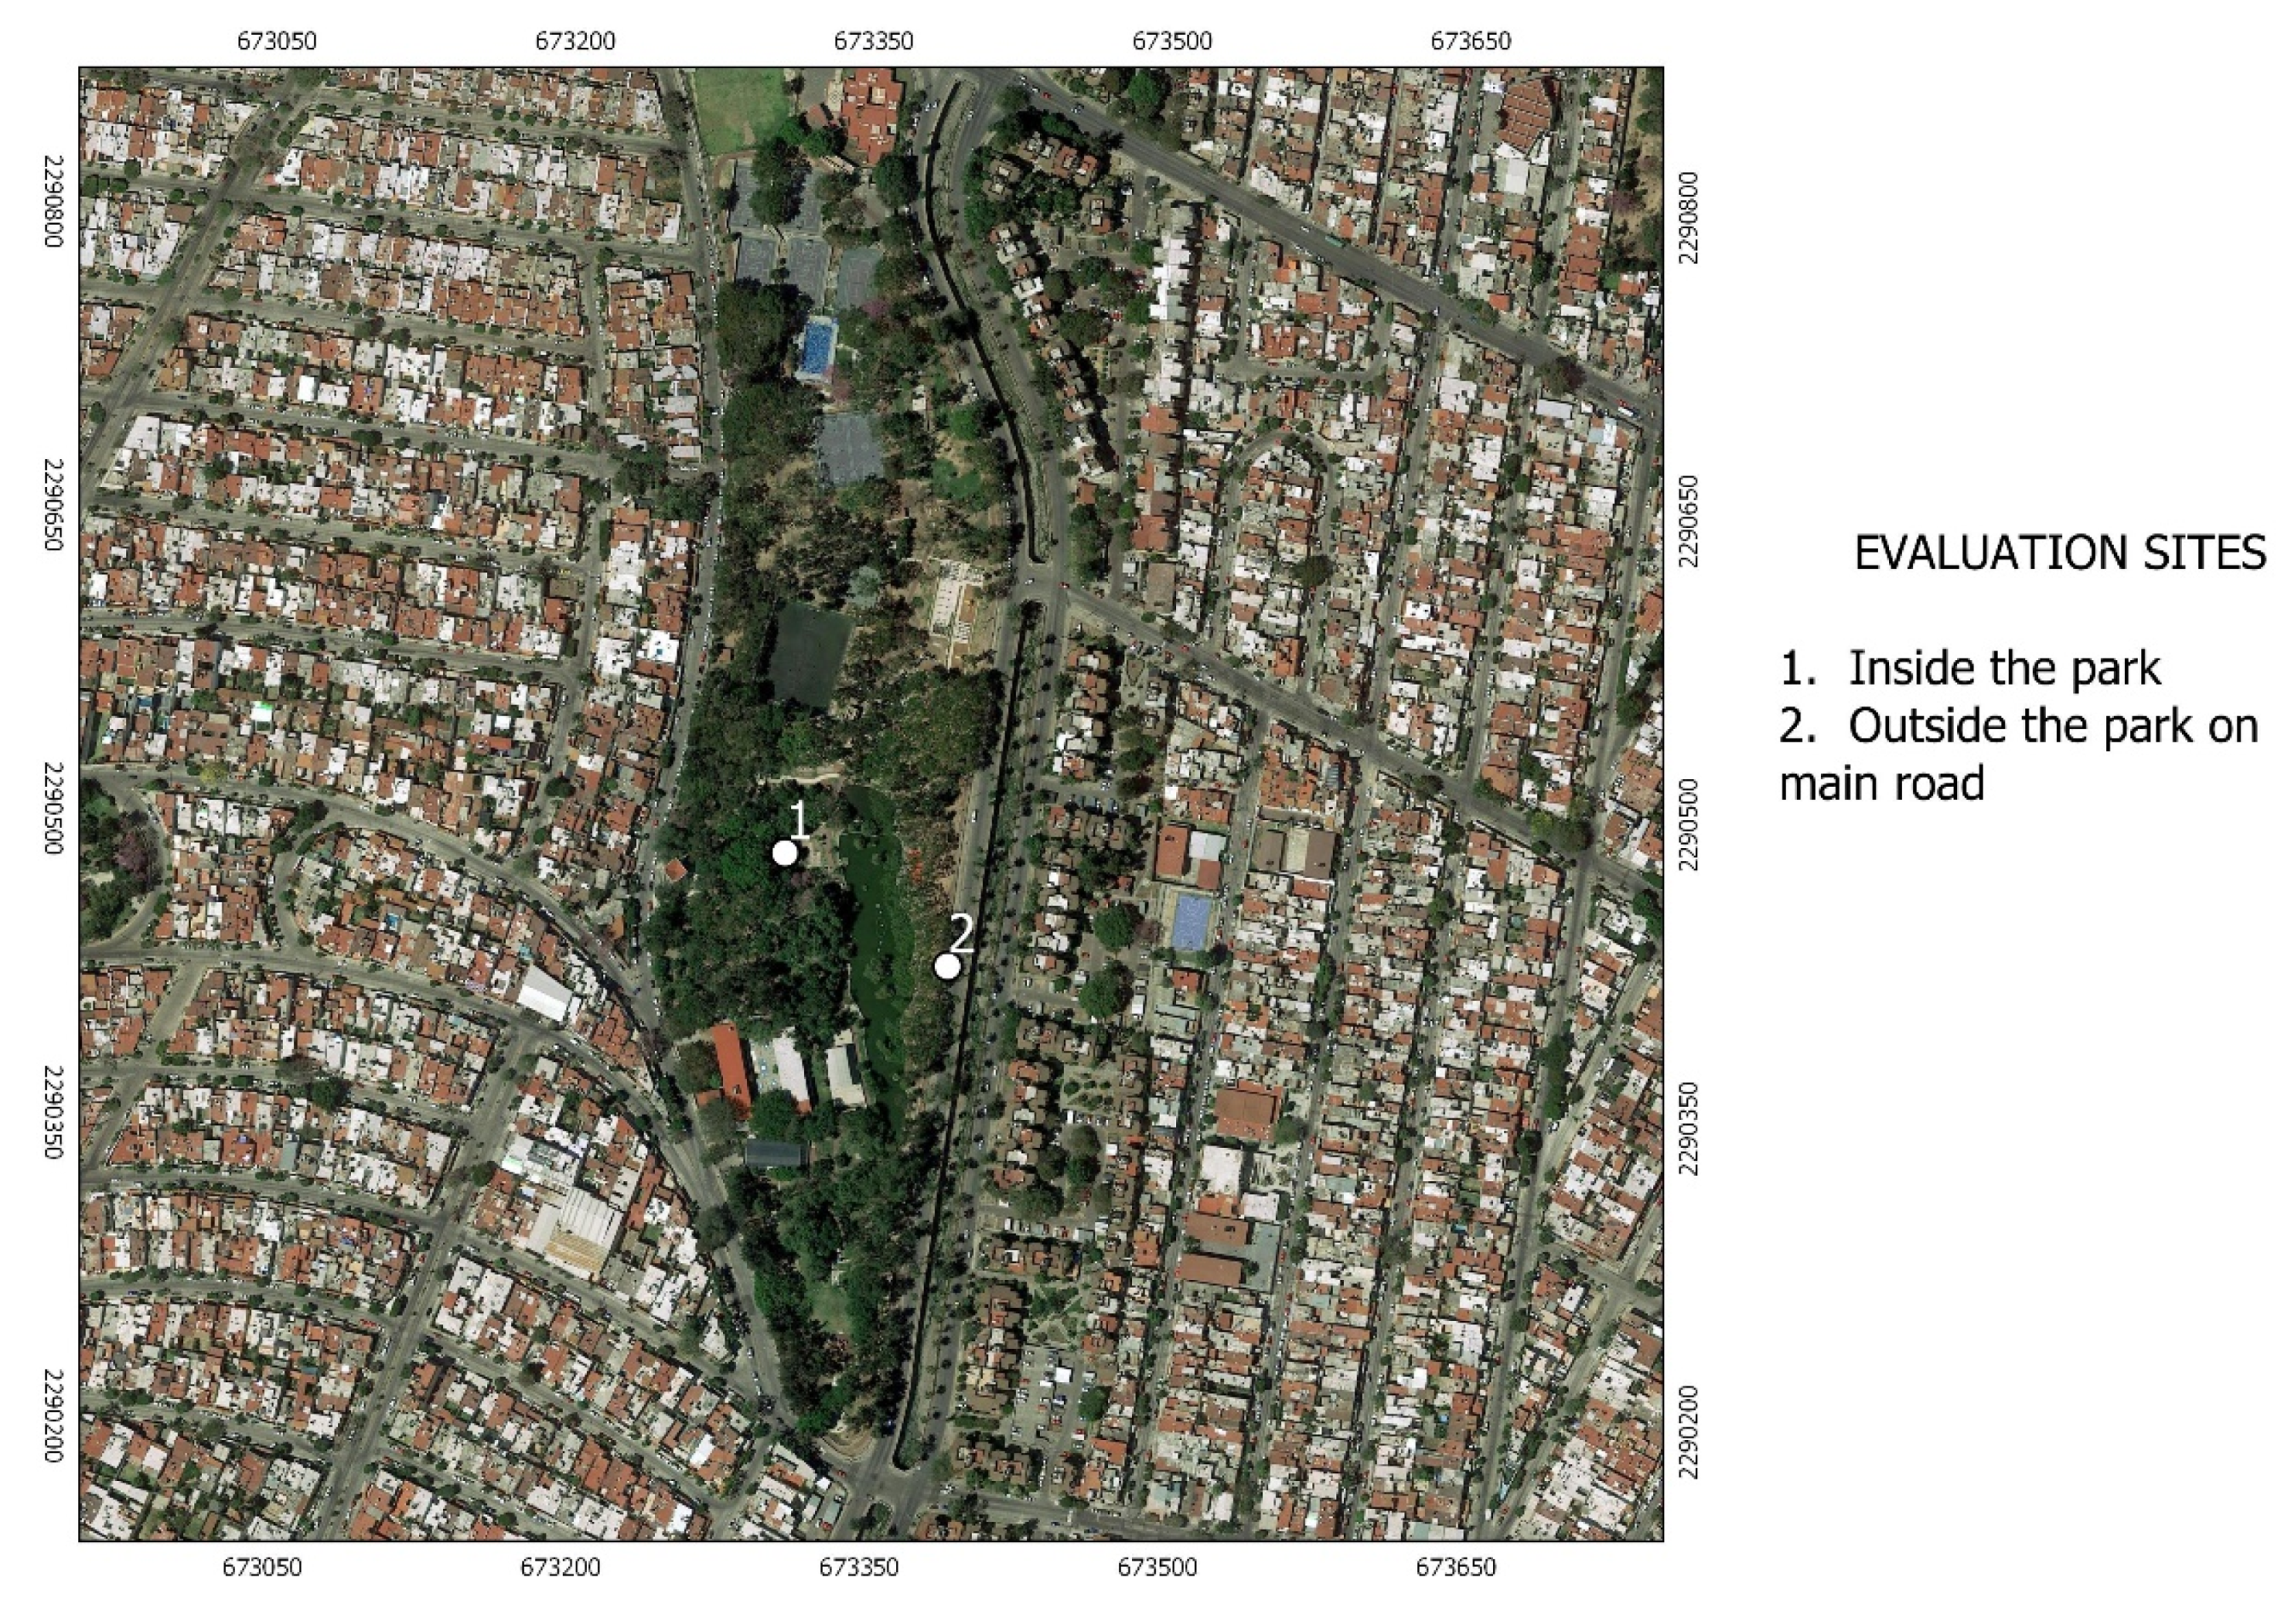
18]. Within this framework, an environmental health diagnosis is developed in a park in Guadalajara, Jalisco. The city is located in Western Mexico, this park has particular features due to its location in an area with a high influx of people, close to schools, shopping centers, and connected by primary roads. It offers different ecosystem services due to the presence of green areas, a small pond as reservoir of natural springs, sport areas such as basketball courts, volleyball, fast soccer, walking tracks, a barbecue area, and a playground for children. The results of the environmental diagnosis comprehend data on air quality, through the characterization of particulate matter, carbon dioxide, sound pressure, water quality through the development of a water quality index (WQI) based on physicochemical and bacteriological analysis, and the analysis of macroinvertebrates as a biological indicator. The phytosanitary state of trees was also performed, as well as direct interviews of users in order to know their environmental perception about the park. Completion of this project puts forward the importance of integrating socio-environmental studies in areas of conservation interest within cities, as it is the case of parks.
Environmental diagnostics in parks is a tool that allows the characterization of available natural resources, like green areas, bodies of water, as well as the evaluation of ecosystem services. Among urban ecosystems, parks provide several services, such as water and air purification, wind and noise reduction, carbon sequestration, microclimate regulation, wildlife habitat, landscape beauty, and social and psychological wellbeing [
19]. Janhäll, in 2015, made an exhaustive review emphasizing numerous benefits of vegetation, confirming that tree density functions as a filter of air pollutants [
20]. Similarly, Cortelezzi et. al., in 2020, performed an environmental diagnosis under a socio-ecological approach where the pressure of urbanization on natural resources was stressed [
18].
Concerning local studies, Bautista et al., in 2006, carried out a diagnosis in a neighborhood park in Mexico City. The study confirmed the importance of green areas in coexistence with urbanized surroundings to favor climatic conditions [
21]. Studies in the same city of Guadalajara are those of Vázquez, in 2012, in which ecosystem and cultural services of Colomos Park were evaluated and related to social wellbeing [
22]; and the book of Orozco et al., in 2018, about environmental diagnosis in cities, from which the specific air, water, and noise methods described in this paper were retrieved [
16]. Lastly in the Latinamerican context, Jiménez, in 2019, carried out an environmental diagnosis in the Colombian City of Medellin, in which the description of vegetation, climatic, and environmental factors are related to climate change and health [
23].
Environmental diagnosis in relation to health in public spaces is important from the ecosystem point of view, due to the influence of air and water quality, noise pollution, and the state of wooded areas that sum up to people’s health and wellbeing. Air contaminants like particulate matter aggravates cardiovascular and respiratory diseases and carbon dioxide is associated with respiratory problems and causes discomfort and tiredness. The presence of noise levels causes discomfort and difficulty in communicating and concentrating, as well as physiological effects on the nervous, auditory, and cardiovascular systems. In addition, it can also affect bird communities by limiting their communication and affecting reproduction and refuge patterns. In the case of water quality, the computing of a WQI is an easy way to summarize long lists of physicochemical and bacteriological indicators of good quality standards. The presence of macroinvertebrates is a bioindicator to evaluate water quality since the presence of certain family groups only occur in certain water conditions. The health of the trees represents an opportunity for analysis due to the information it provides, to help determine the phytosanitary status that can inform on the presence of pests and foliar damage, which in turn can affect scenic beauty and photosynthetic capacity.
The aim of this investigation is to perform an environmental health diagnosis in a sport and recreational park in the city of Guadalajara, Jalisco, Mexico. It focusses on environmental variables that are well recognized in the scientific literature [
5,
18,
24] as key elements of environmental health of ecosystems and, in turn, relevant relations to human health and wellbeing. Analyzed variables were air quality in terms of fine (0.3, 0.5, 1.0, and 2.5 µ) and coarse (5.0 and 10.0 µm) particles as well as carbon dioxide; environmental noise, water quality of springs and a pond according to national standards for water quality [
25,
26,
27]; and macroinvertebrates as biological indicators of water condition, as well as phytosanitary state of wooded area. Additionally, a survey was conducted to get insights of environmental perception from park´s visitors.
In recent years, the importance of parks and urban green spaces has been getting special attention in the field of sustainable communities. Sustainability indicators for urban development to a great extent focus on the state of natural elements as it is the case of green, air, and water parameters. It is well recognized that the more native plants in an area, the greater the protection against flooding, air, and water pollution. In addition, citizens’ satisfaction and perception of their living environments also play a role when developing sustainability programs that must not only be successful, but also sustainable. This paper explains the results of an environmental diagnosis concerning the state of water sources, air, and wooded area within an integrated approach of socio-environmental dimensions. These dimensions form part of the multi-dimensional structure of urban green areas evaluation that is used to improve a framework of the development and management of green areas in urban communities.
Initiatives to promote green areas in urban spaces have a positive impact on health and wellbeing of dwellers [
28,
29,
30], in addition to the development of microbiomes that enhance biodiversity conservation [
18,
31] and lessen the effects of climate change and urban heat islands [
28,
32,
33,
34].
The present environmental health diagnoses match some of the Sustainable Development Goals well, as it is the case of goal 3: Health and wellbeing, goal 6: Clean water and sanitation, goal 11: Sustainable cities and communities, goal 13: Climate action, and goal 15: Life of terrestrial ecosystems [
35,
36].
4. Discussion
Results from the environmental health diagnosis as a sustainable initiative in cities highlighted the presence of important health risks. In terms of sustainability, parks are a model to apply the different strategies that allow actions to be taken into conservation of natural resources. Characterization of park resources helps to know the state of occurring natural elements from which integrated policies can be put into practice to preserve value and ecosystem services. In the analyzed park, components of great value are water resources like scattered natural springs occurring within the park premises, and the pond, which is the reservoir of them. The wooded area is also important since trees function as natural air filters, shelter, bird nesting, soil stabilization, and microclimate regulators as they lessen the effects of urban heat island.
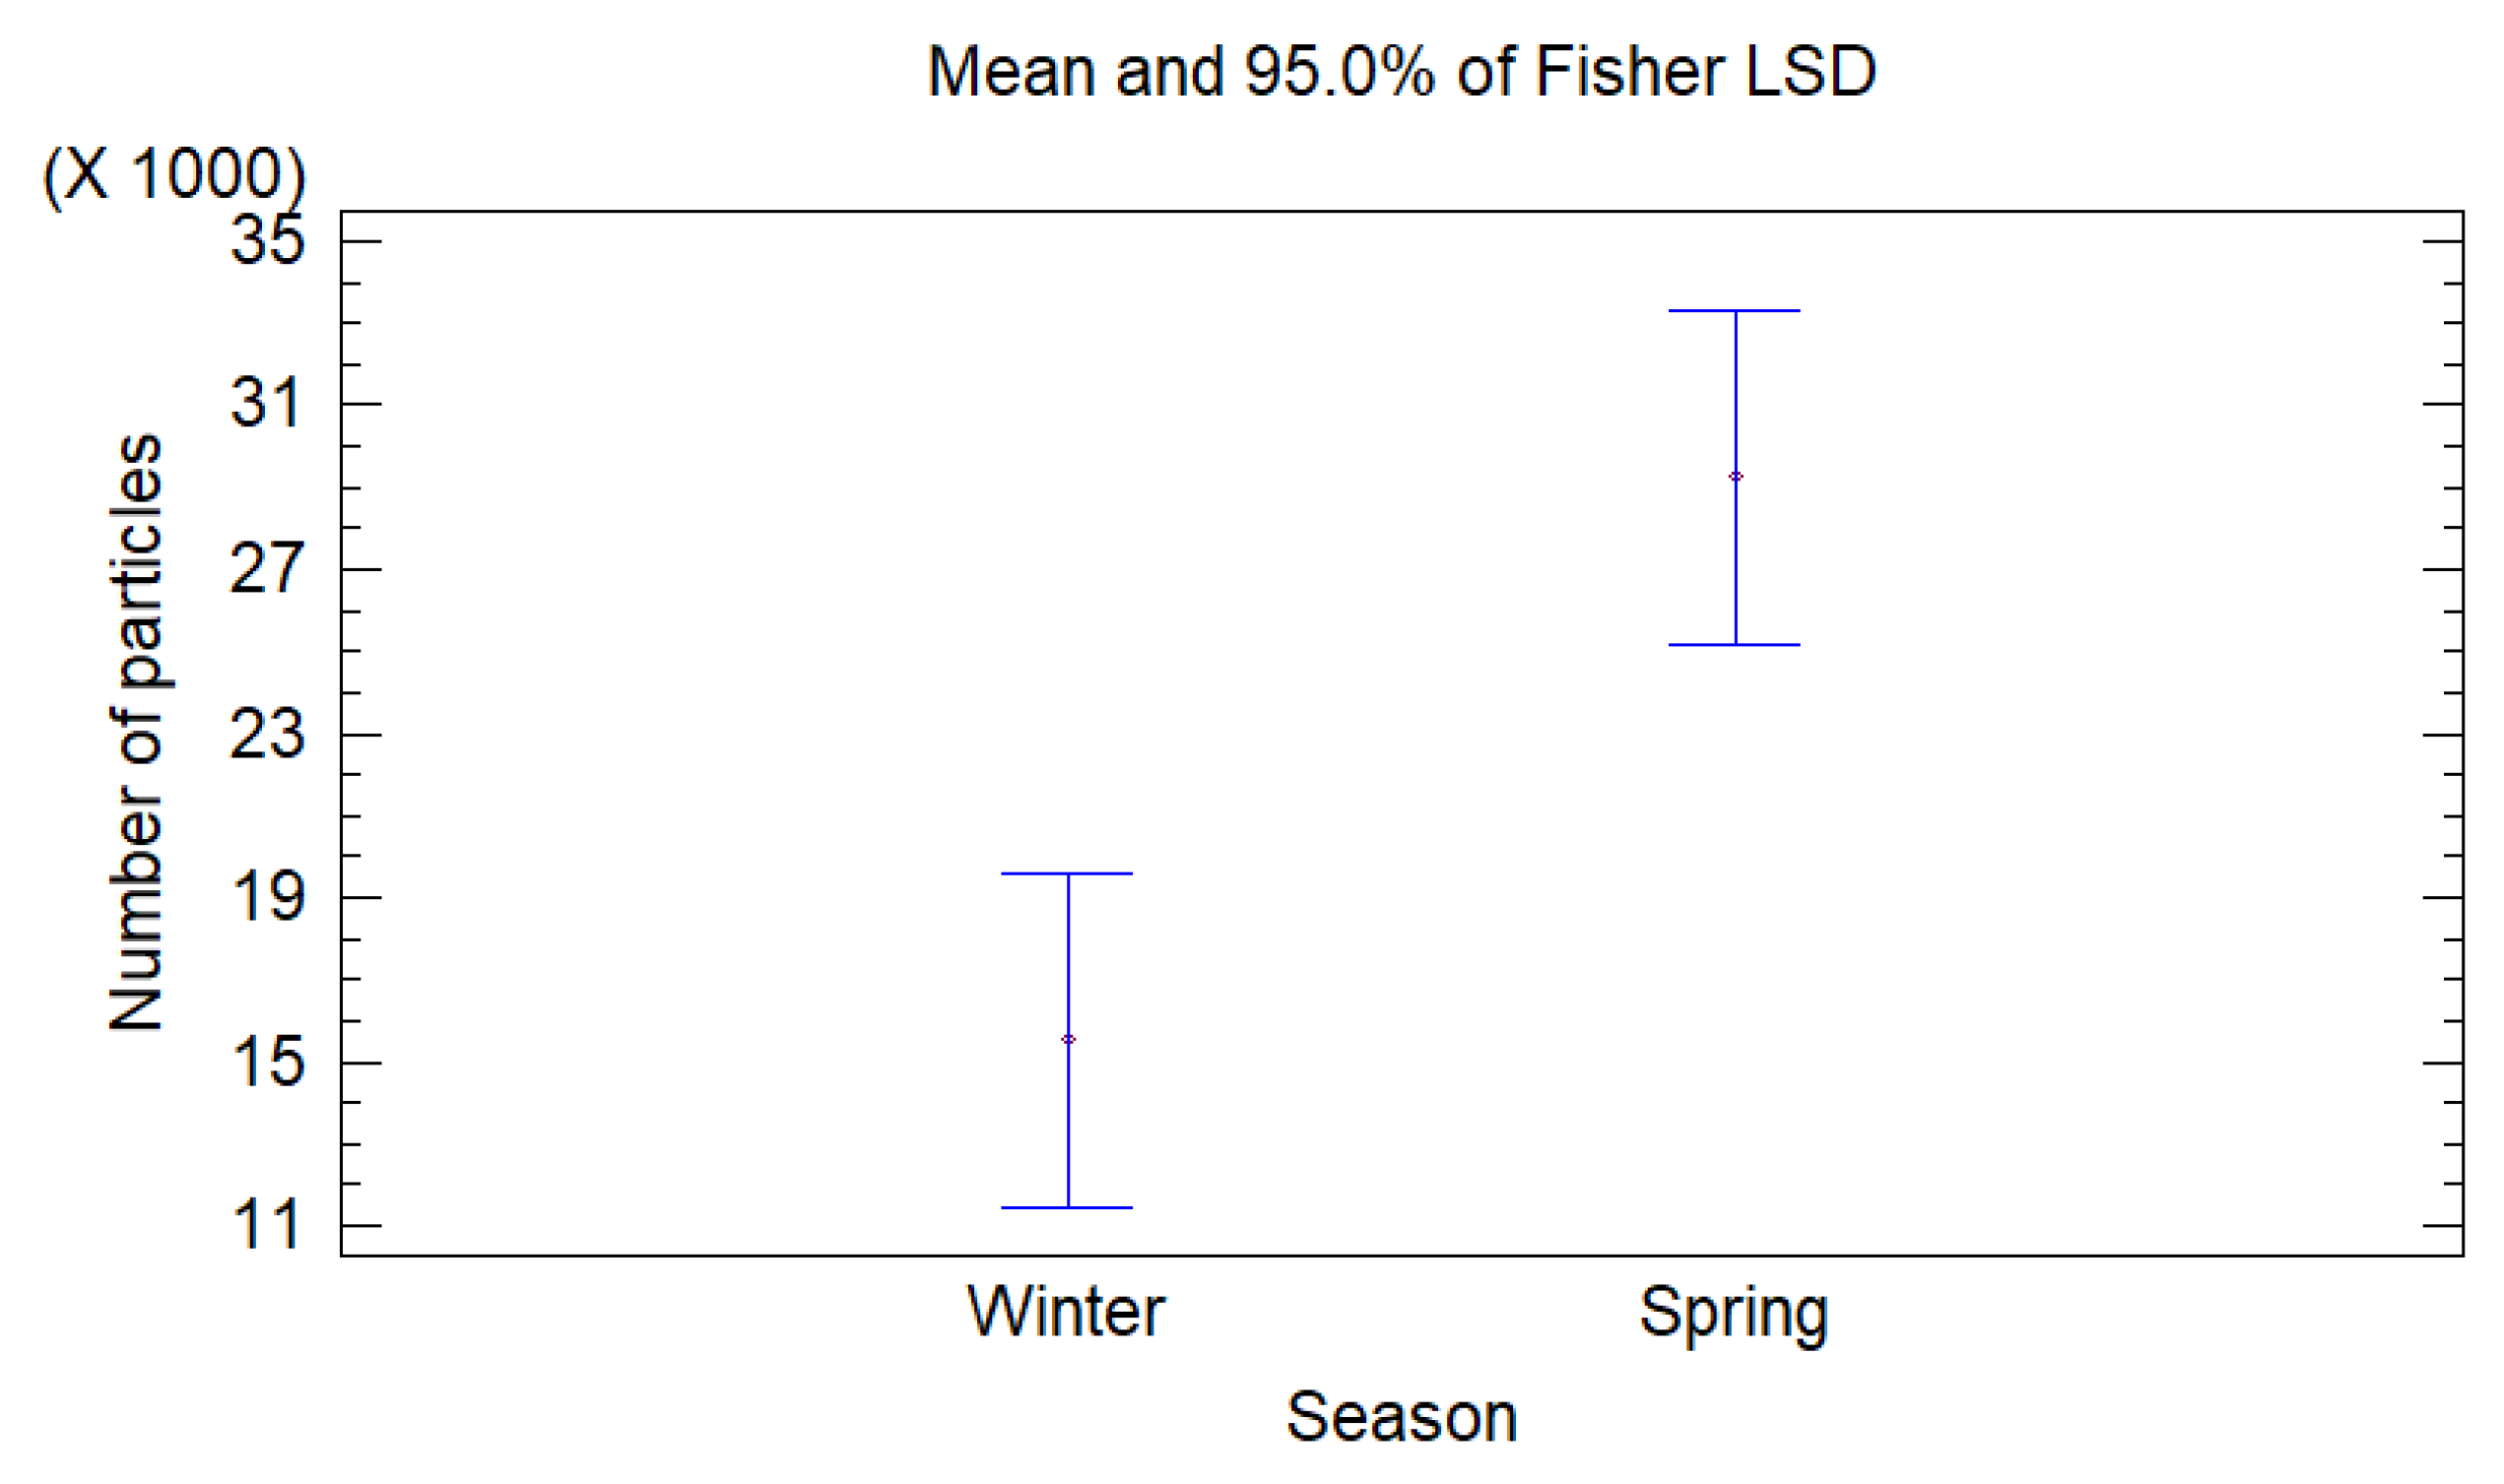
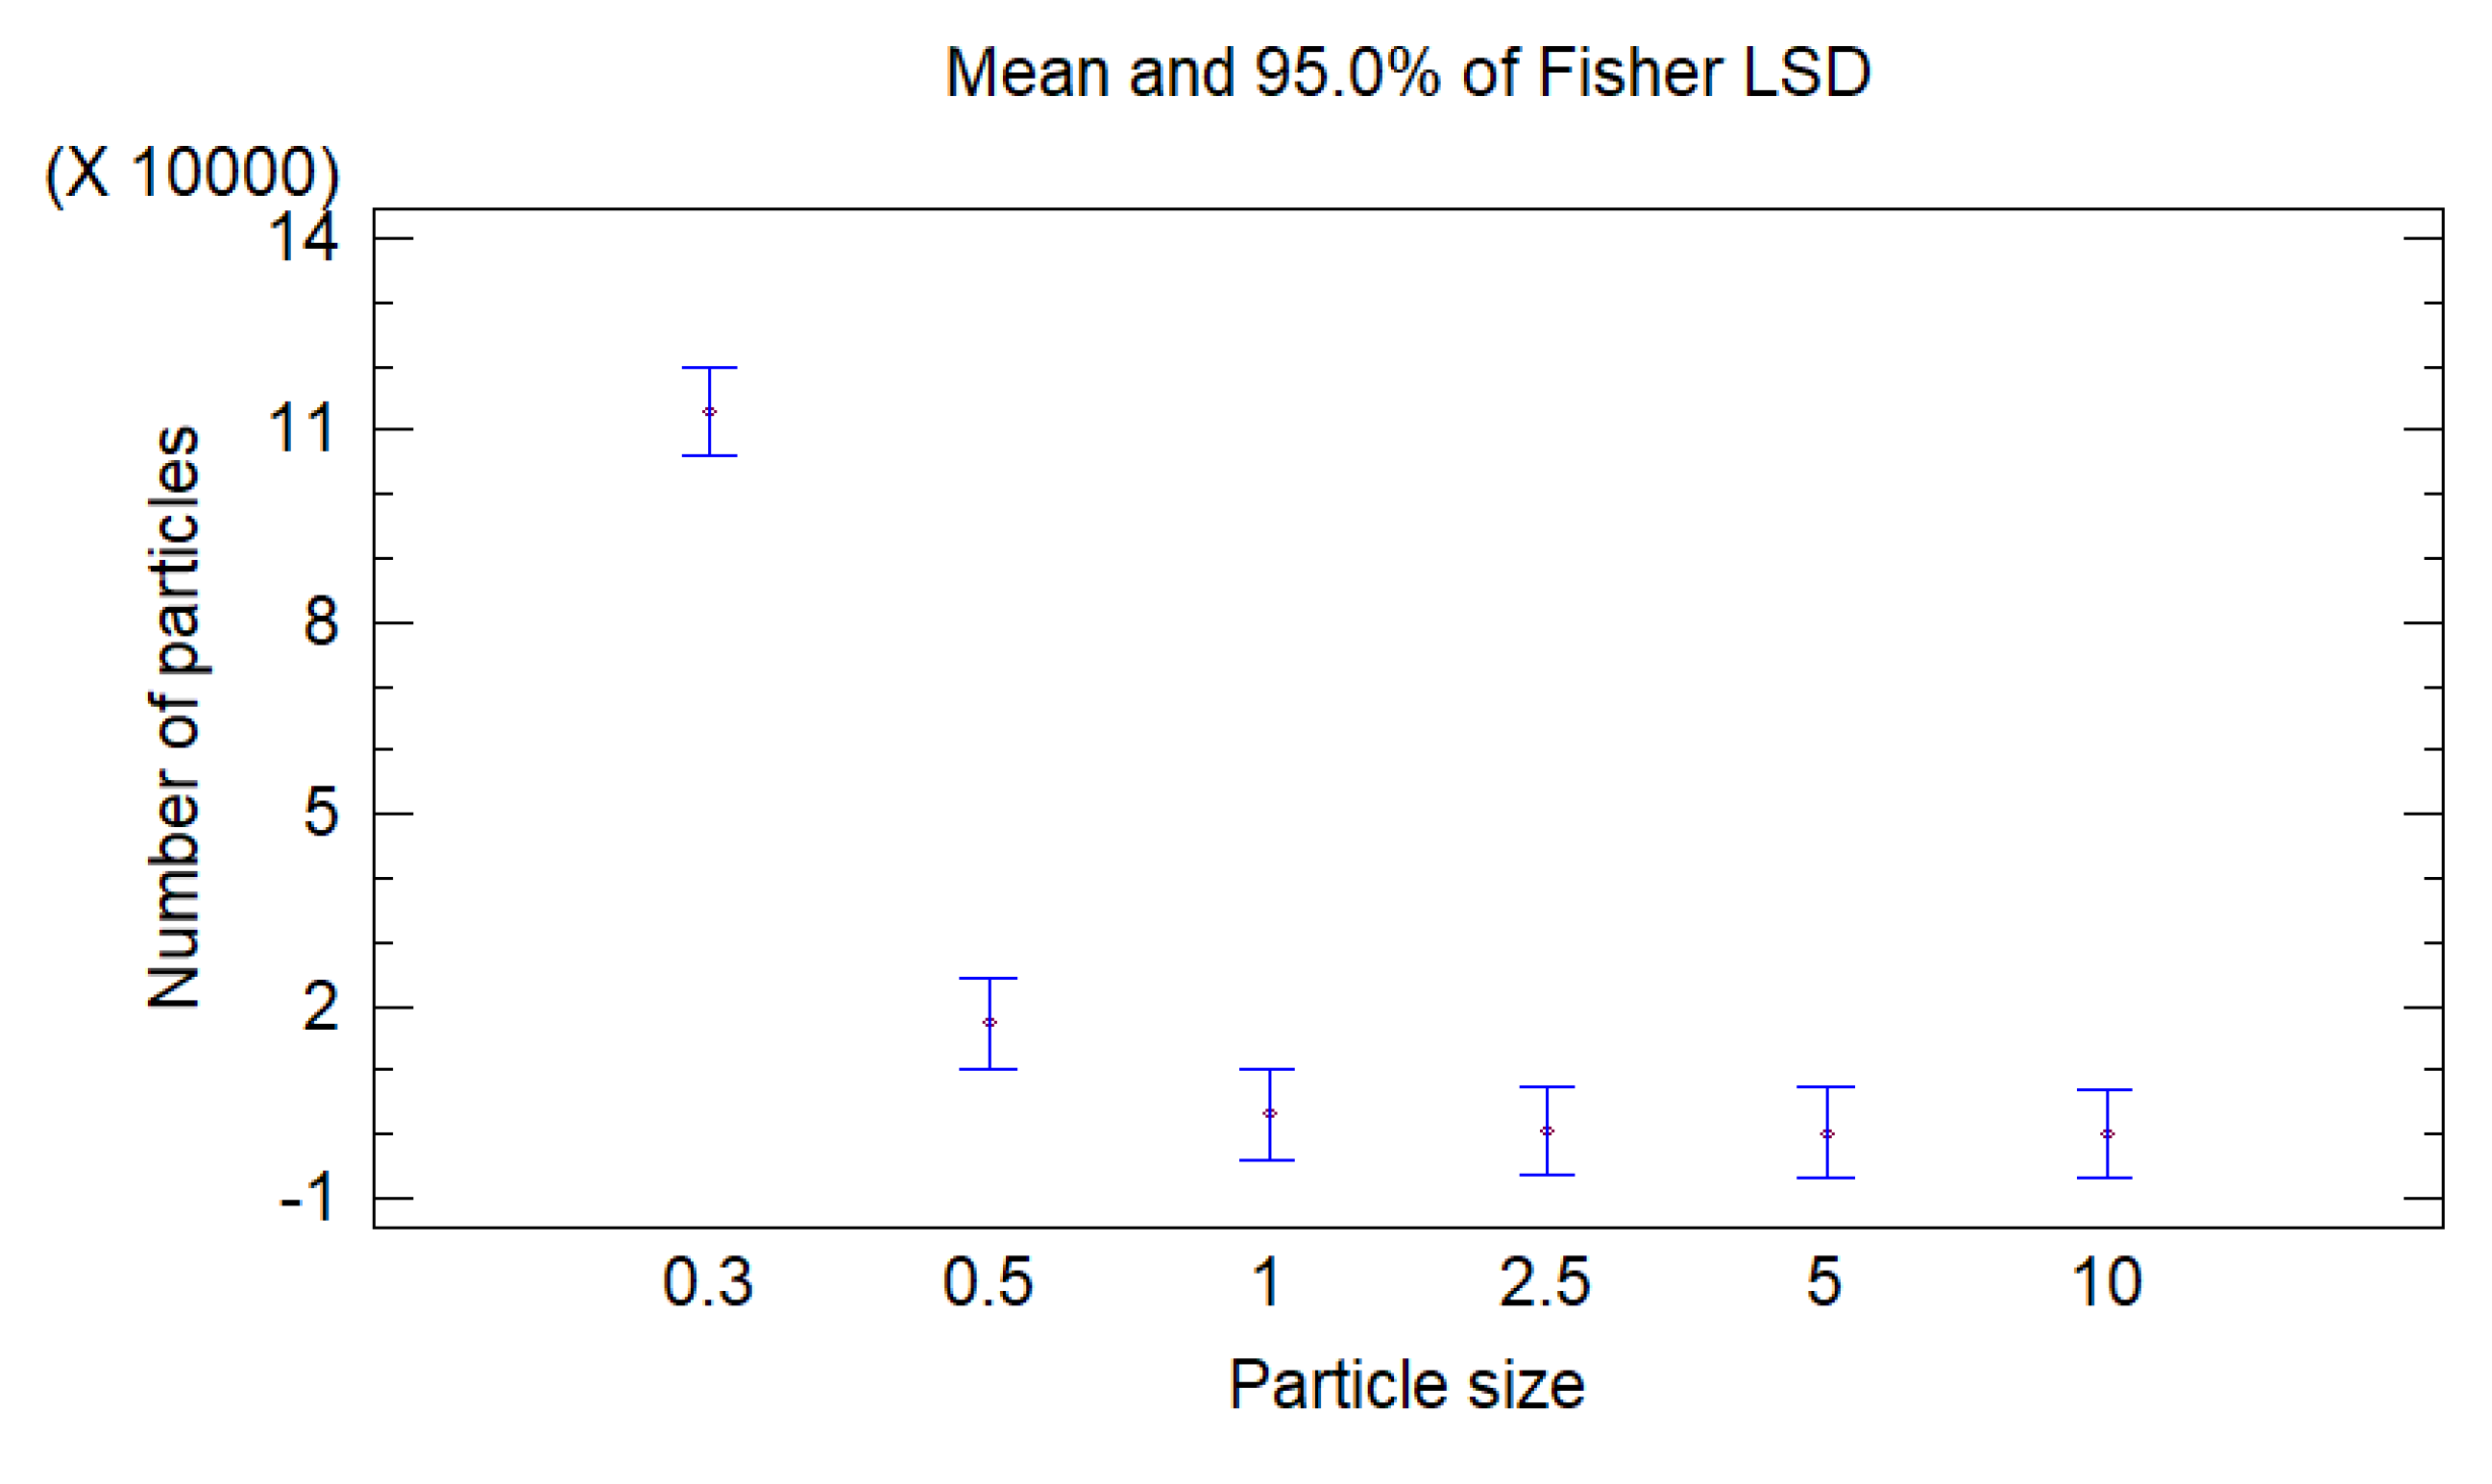
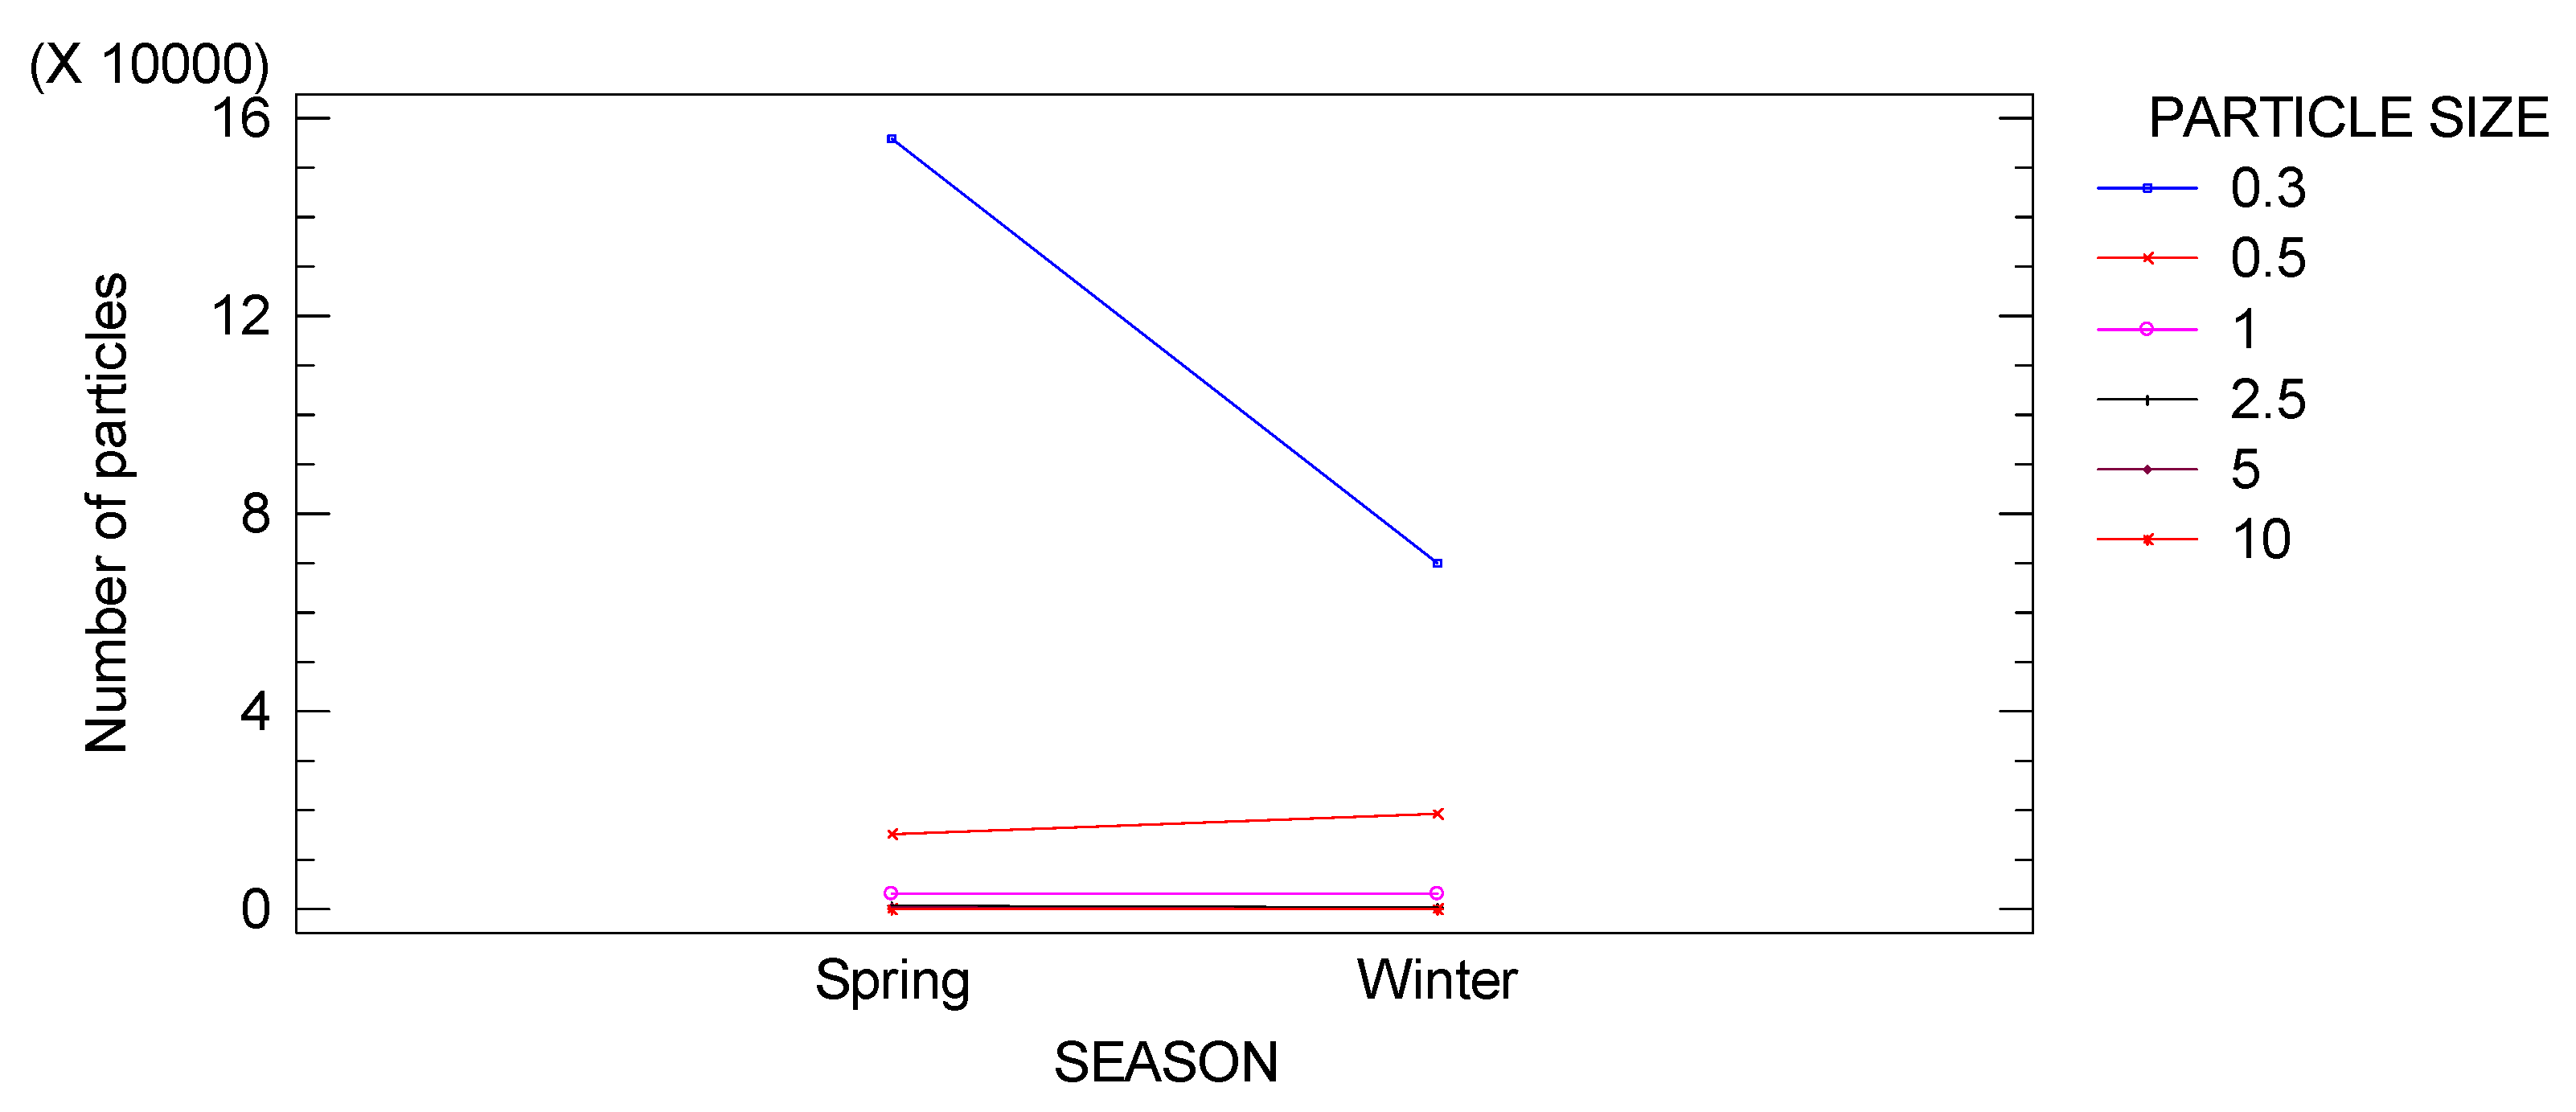
Concerning air quality, fine particles in the range of 0.3–0.5 µm were higher during the spring sampling than in the winter. Particle matter varies significantly on time and space, due to the dynamics of meteorological conditions, the heterogeneous properties of the earth’s surface, the uneven distribution of emission sources, geographic features, and human activities [
20,
55]. In a global scale, it is the most prominent pollutant affecting air quality in urban areas especially in developing countries [
56].
Depending on their size, the particles are categorized as coarse, which include particles with a diameter between 2.5 to 10 µm. These particles that generally rise from the ground hardly penetrate into the pulmonary alveoli, since for the most part, they are retained by the mucosa and cilia of the upper part of the respiratory system. In contrast, particles from forest fires and agricultural burns, as well as those generated by motor vehicles, are mostly fine (<2.5 µm) and have the capacity to penetrate the lung alveoli. In addition, particles can have toxic effects due to their inherent physical or chemical characteristics, or they can indirectly affect humans both by interfering with mechanisms of the respiratory system and by acting as a vehicle for transportation of toxic substance coated on its surface, that might be distributed into the body systems [
57].
Particles represent a serious health problem in cities and have been associated with increased mortality due to heart and respiratory diseases as well as cancer and strokes. Mortality rates depend on type of exposure and the length of time, as well as particle size. Fine particles have the power to trespass alveoli membranes to enter the bloodstream and then get distributed systematically to the heart, kidneys, bladder, and another important organ where they can exert toxic effects [
58,
59,
60,
61,
62].
The area in which the park is located is one of the busiest in Guadalajara, Av. de los Normalistas. It is possible that the greatest number of fine particles registered was due to gas emission from the combustion of motor vehicles. The greater number of fine particles in the spring sampling season can be explained in terms of favorable weather condition that invite families to spend leisure time in the park. Furthermore, it is a cultural custom in Mexican families to have barbecues in picnic areas of the park. Barbecue fumes are fine particles [
63,
64]. In addition, regional atmospheric circulation carries the smoke to the city, resulting from agricultural burning of land preparation before the rain season. It is well documented that fumes from this practice can travel hundreds of kilometers towards urban areas when the winds are favorable. It is important to comment that agricultural burning is a traditional activity of Mexican farmers in early spring as it is the cheapest procedure to get rid of products that remain in the field after harvest. [
65,
66,
67]. It is also true that in spring, temperature rises significantly, as Romero and Sarricolea, in 2006, found a linear relationship between atmospheric temperatures and particulate matter, in addition to a strong correlation among soil use and cover on temperature elevation, which can exacerbate health effects of chronic diseases like cardiovascular and respiratory illnesses [
68,
69]. It is worth mentioning that the track where athletes run is not paved completely and it is a risk since both fine and coarse particles can be suspended in the air by wind currents that then enter the athlete’s respiratory system.
Carbon dioxide (CO
2) is produced through the natural metabolism of organisms and combustion processes. For the analysis of CO
2, several authors have suggested different reference limits for its measurement; in indoor environments, CO
2 levels vary between 400 and 2000 ppm, while CO
2 levels outdoors are 350 at 450 ppm [
40]. The health hazard information sheet proposed by the United States Department of Agriculture (USDA) and Environmental Safety and Health Group (ESHG) indicates that CO
2 levels in outdoor air range from 300 and 400 ppm as normal limits, but can be as high as 600 to 900 ppm in metropolitan areas [
70]. CO
2 emissions from the energy and transport sector together with the waste management sector are responsible for the generation of greenhouse gases. Industrialized countries contribute approximately 80% of the total load, therefore special attention should be given by governments [
71].
Regarding CO
2, one possibility that we can delve into is the estimation of carbon dioxide stored in trees that has important variations depending on the species, growth patterns, and age of tree [
72]. When people are exposed to CO
2 levels between 800 to 1200 ppm, they experience discomfort and symptoms related to headaches, tiredness, breathing problems, drowsiness, difficulty concentrating, dizziness, and eye irritation. Such health signs are usually aggravated in children and the elderly [
73]. The Institute of Security and Hygiene of Work from Spain recommends that CO
2 levels should be reduced to less than 600ppm to eliminate discomfort [
74].
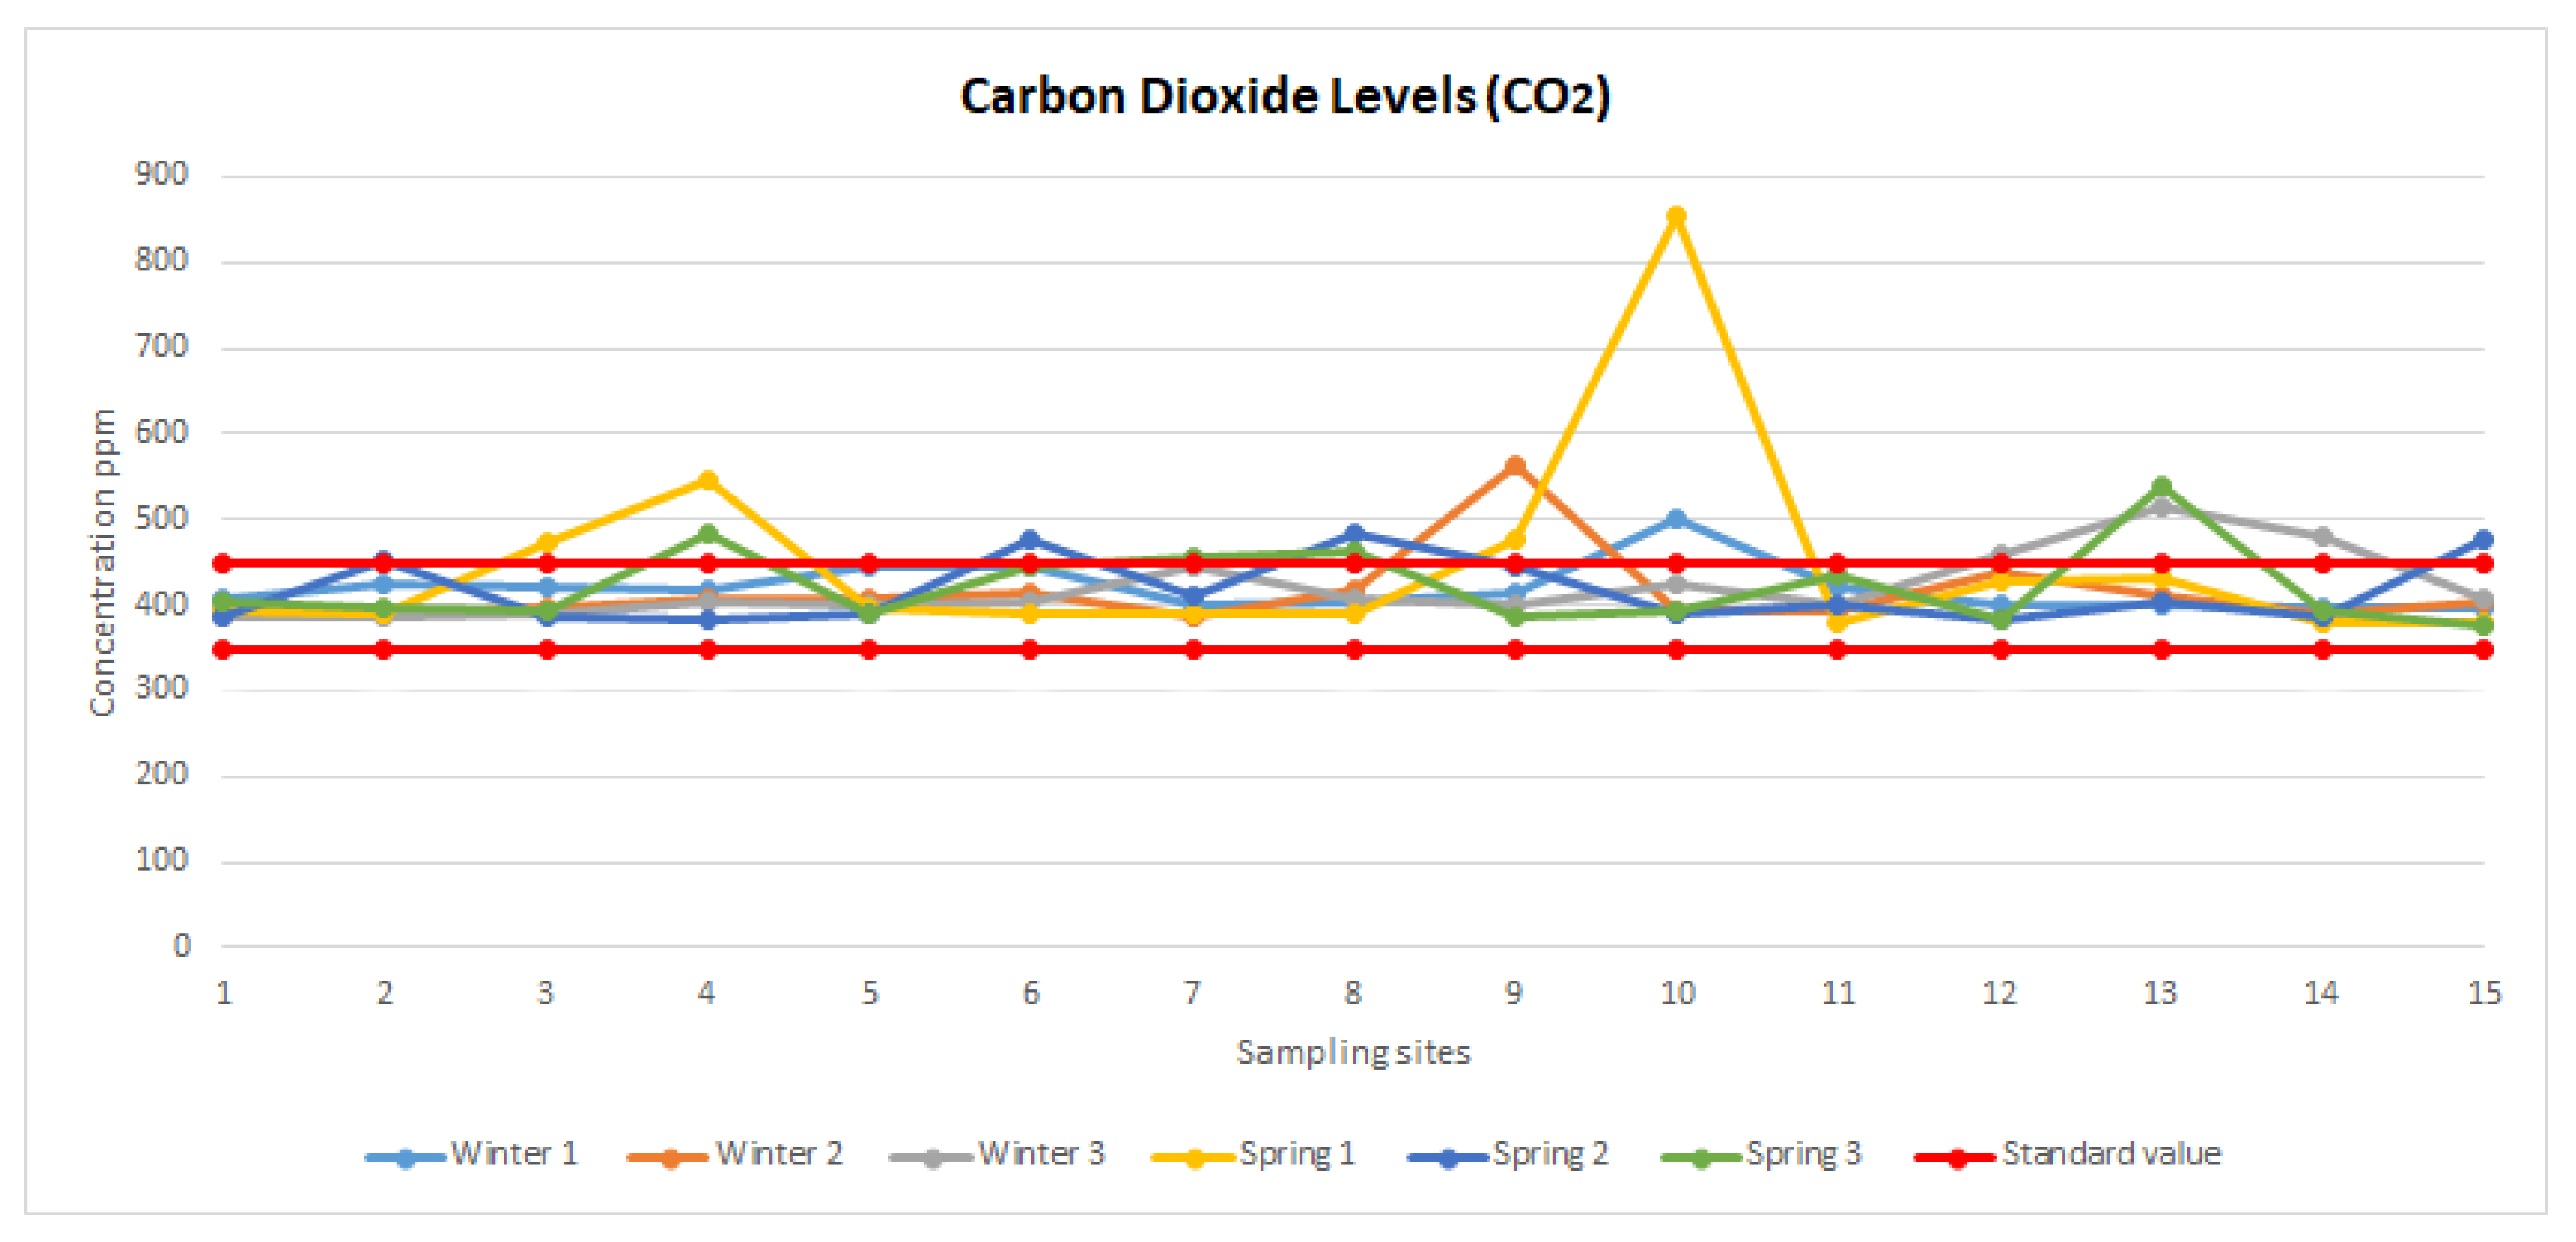
CO
2 concentrations in this study did not show statistical differences due to season and sites. The peak registered at site 10 in
Figure 7 exceeded Halgamuge permissible limits [
42] and can be explained by a barbecue event at the time of sampling, since grill infrastructures are nearby this sampling site, and coal combustion is CO
2 reach. However, it is difficult to say that the registered level was solely due to the mentioned event since in terms of air pollution, local and regional patterns of atmospheric circulation also play a role.
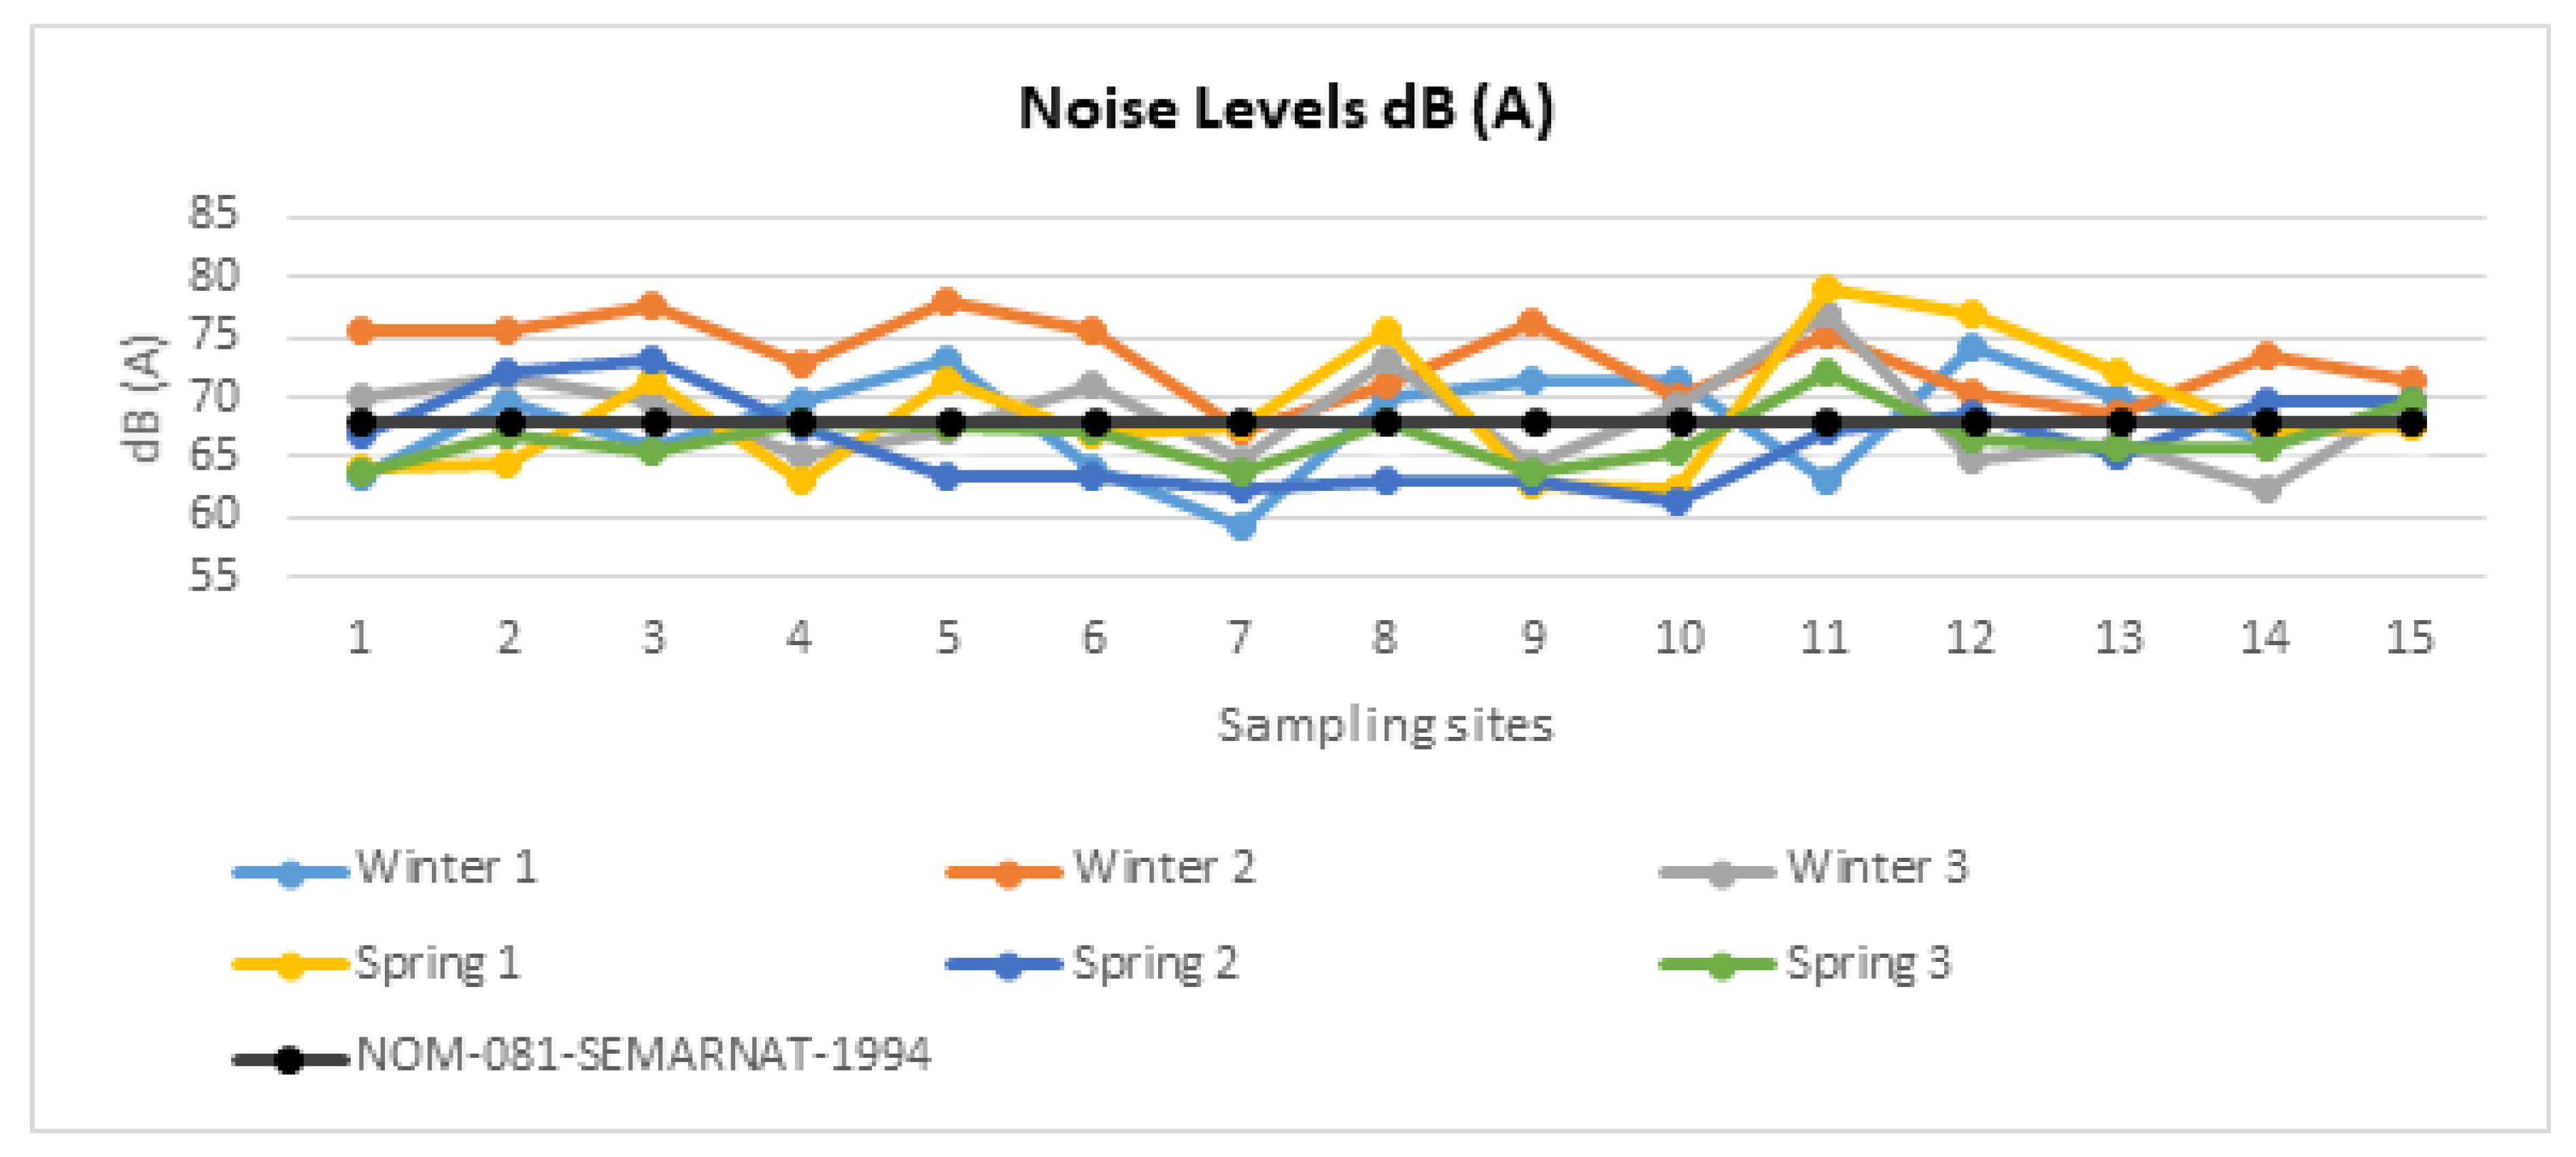
Regarding noise levels, it was found that they were much higher than WHO [
75] and EPA [
76] recommendations of 70 dB (A) for traffic areas. Noise pollution has a significant contribution to the health and wellbeing of city dwellers. It has been related to cardiovascular, gastrointestinal and nervous diseases, tachycardia, decreased appetite, insomnia, irritability, stress, affects communication, and represents difficulties in focusing and the performance of academic tasks, in addition to the most common effect, which is hearing impairment [
77,
78].
Martínez and Moreno in 2013 stated that noise studies in parks are scarce in the scientific literature. In the study, they present results from five parks in the City of Madrid in Spain where they found average levels from 63.9 to 68.9 dB (A) and minimum levels around 54 to 62 dB (A) [
79]. Alfie and Salinas, in 2017, reported the benefits of parks as they observed a noise decrease of about 5 dB (A) in pedestrian walkways in Mexico City [
80]. A study performed in Santiago de Chile by Pltazer et. al 2007 described levels of around 58.6 dB (A), which were significantly lower than 110 dB (A) in bars and the underground public transport where they recorded 87.1 dB (A) [
81]. Another study in public spaces in Hong Kong, China indicated average levels above 65dB (A) [
82]. Brambila and Maffei, in 2006, studied noise in Naples parks where they evaluated responses to noise, and 57% mentioned valuing sounds as the most important features in the parks [
83].
In Mexico, there is an official standard NOM-081-SEMARNAT-1994 [
54] in which the maximum permissible limits of noise, as well as specific hours to meet them, are established. Maximum allowed limits are 68 dB (A) and 65 dB (A) from 6:00 to 22:00 hours and 22:00 to 6:00 hours, respectively. The presence of natural sounds in parks is a treasure that must be value. Kogan et al., in 2014, describe the benefits of renewal of cognitive and emotional health that eventually promote healthy psychological and physiological processes, hence the importance of keeping urban parks in good condition [
84].
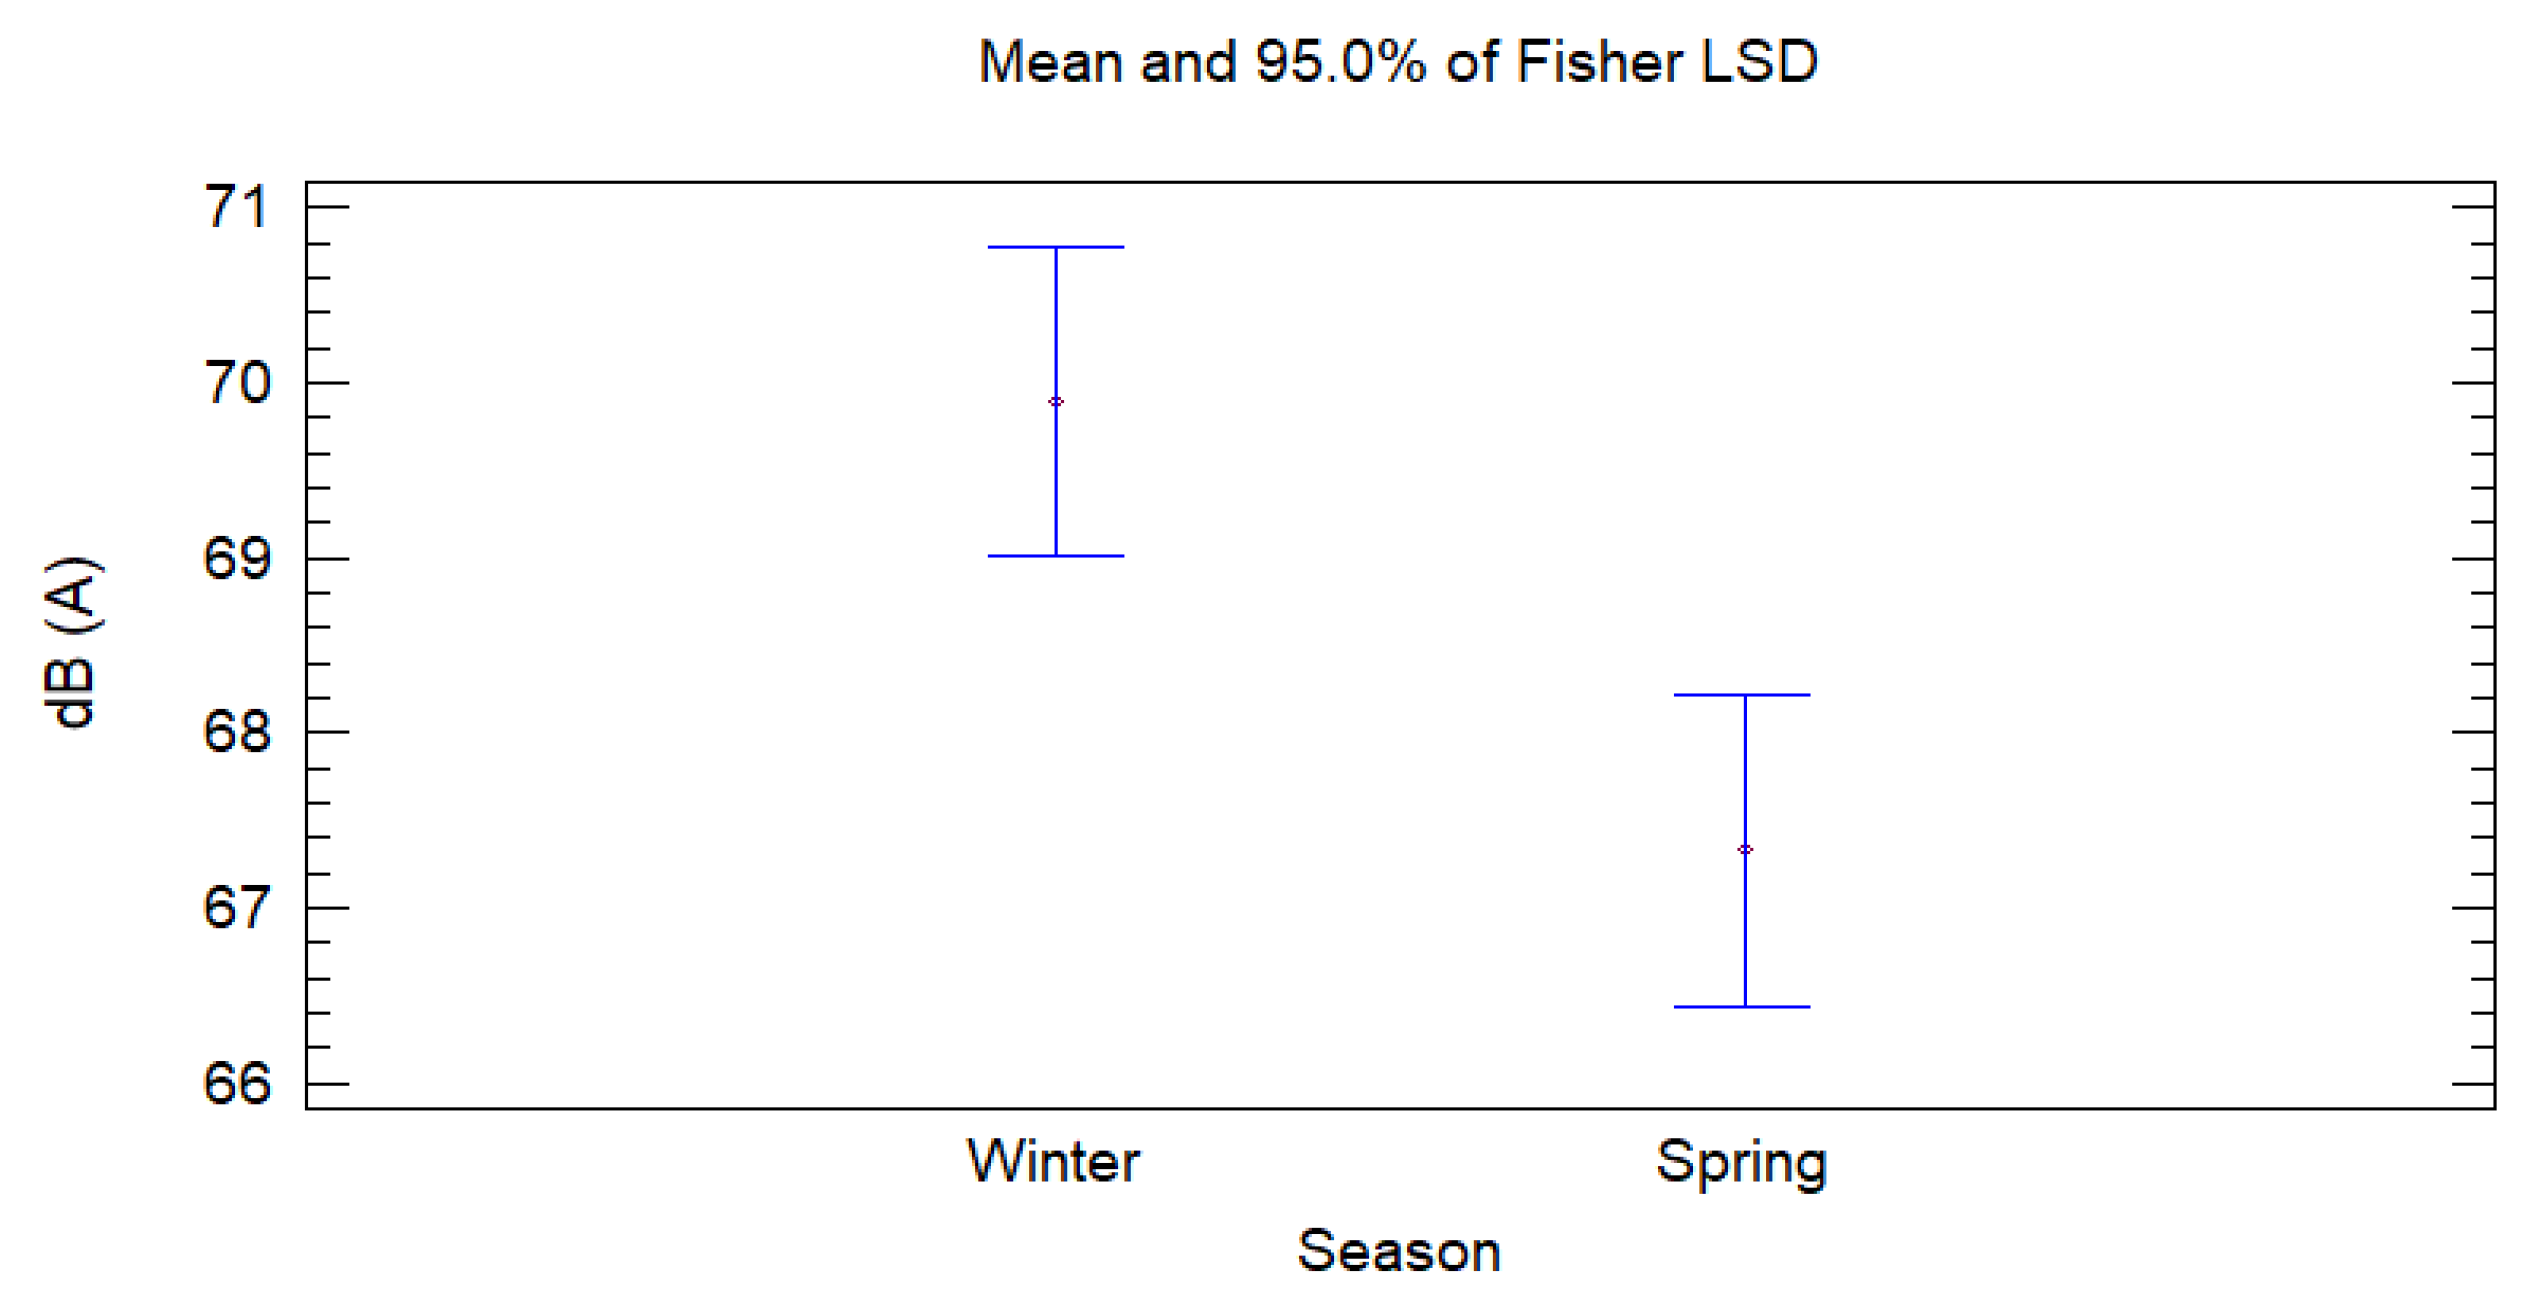
Maximum levels of up to 79 dB (A) were recorded at point 11 during the spring season, therefore the area is considered to be slightly critical, but still has the potential to cause damage to exposed individuals. The main effects relate to the failure of concentration and communication, alteration of the auditory system, among many other health problems related to noise exposition [
16]. However, the statistical analysis by site indicated no significant differences. The analysis of variance by season highlighted significant differences between winter and spring, with the former having a higher mean effect on noise levels. Such a difference might be due to the fact that during the samplings there were more events with music, child birthday parties, and the pruning of gardens.
Water pollutants were of interest in this study because of their importance to health risks due to the presence of microorganisms that can develop contaminated water vector diseases such as gastrointestinal illnesses, and they were evaluated according to national standards. Sources of water contamination are diverse and might come from domestic and industrial waste waters that alter physicochemical properties and bacteria load or add toxic substances such as acids and heavy metals that, in high concentrations, will limit development of aquatic life [
85,
86].
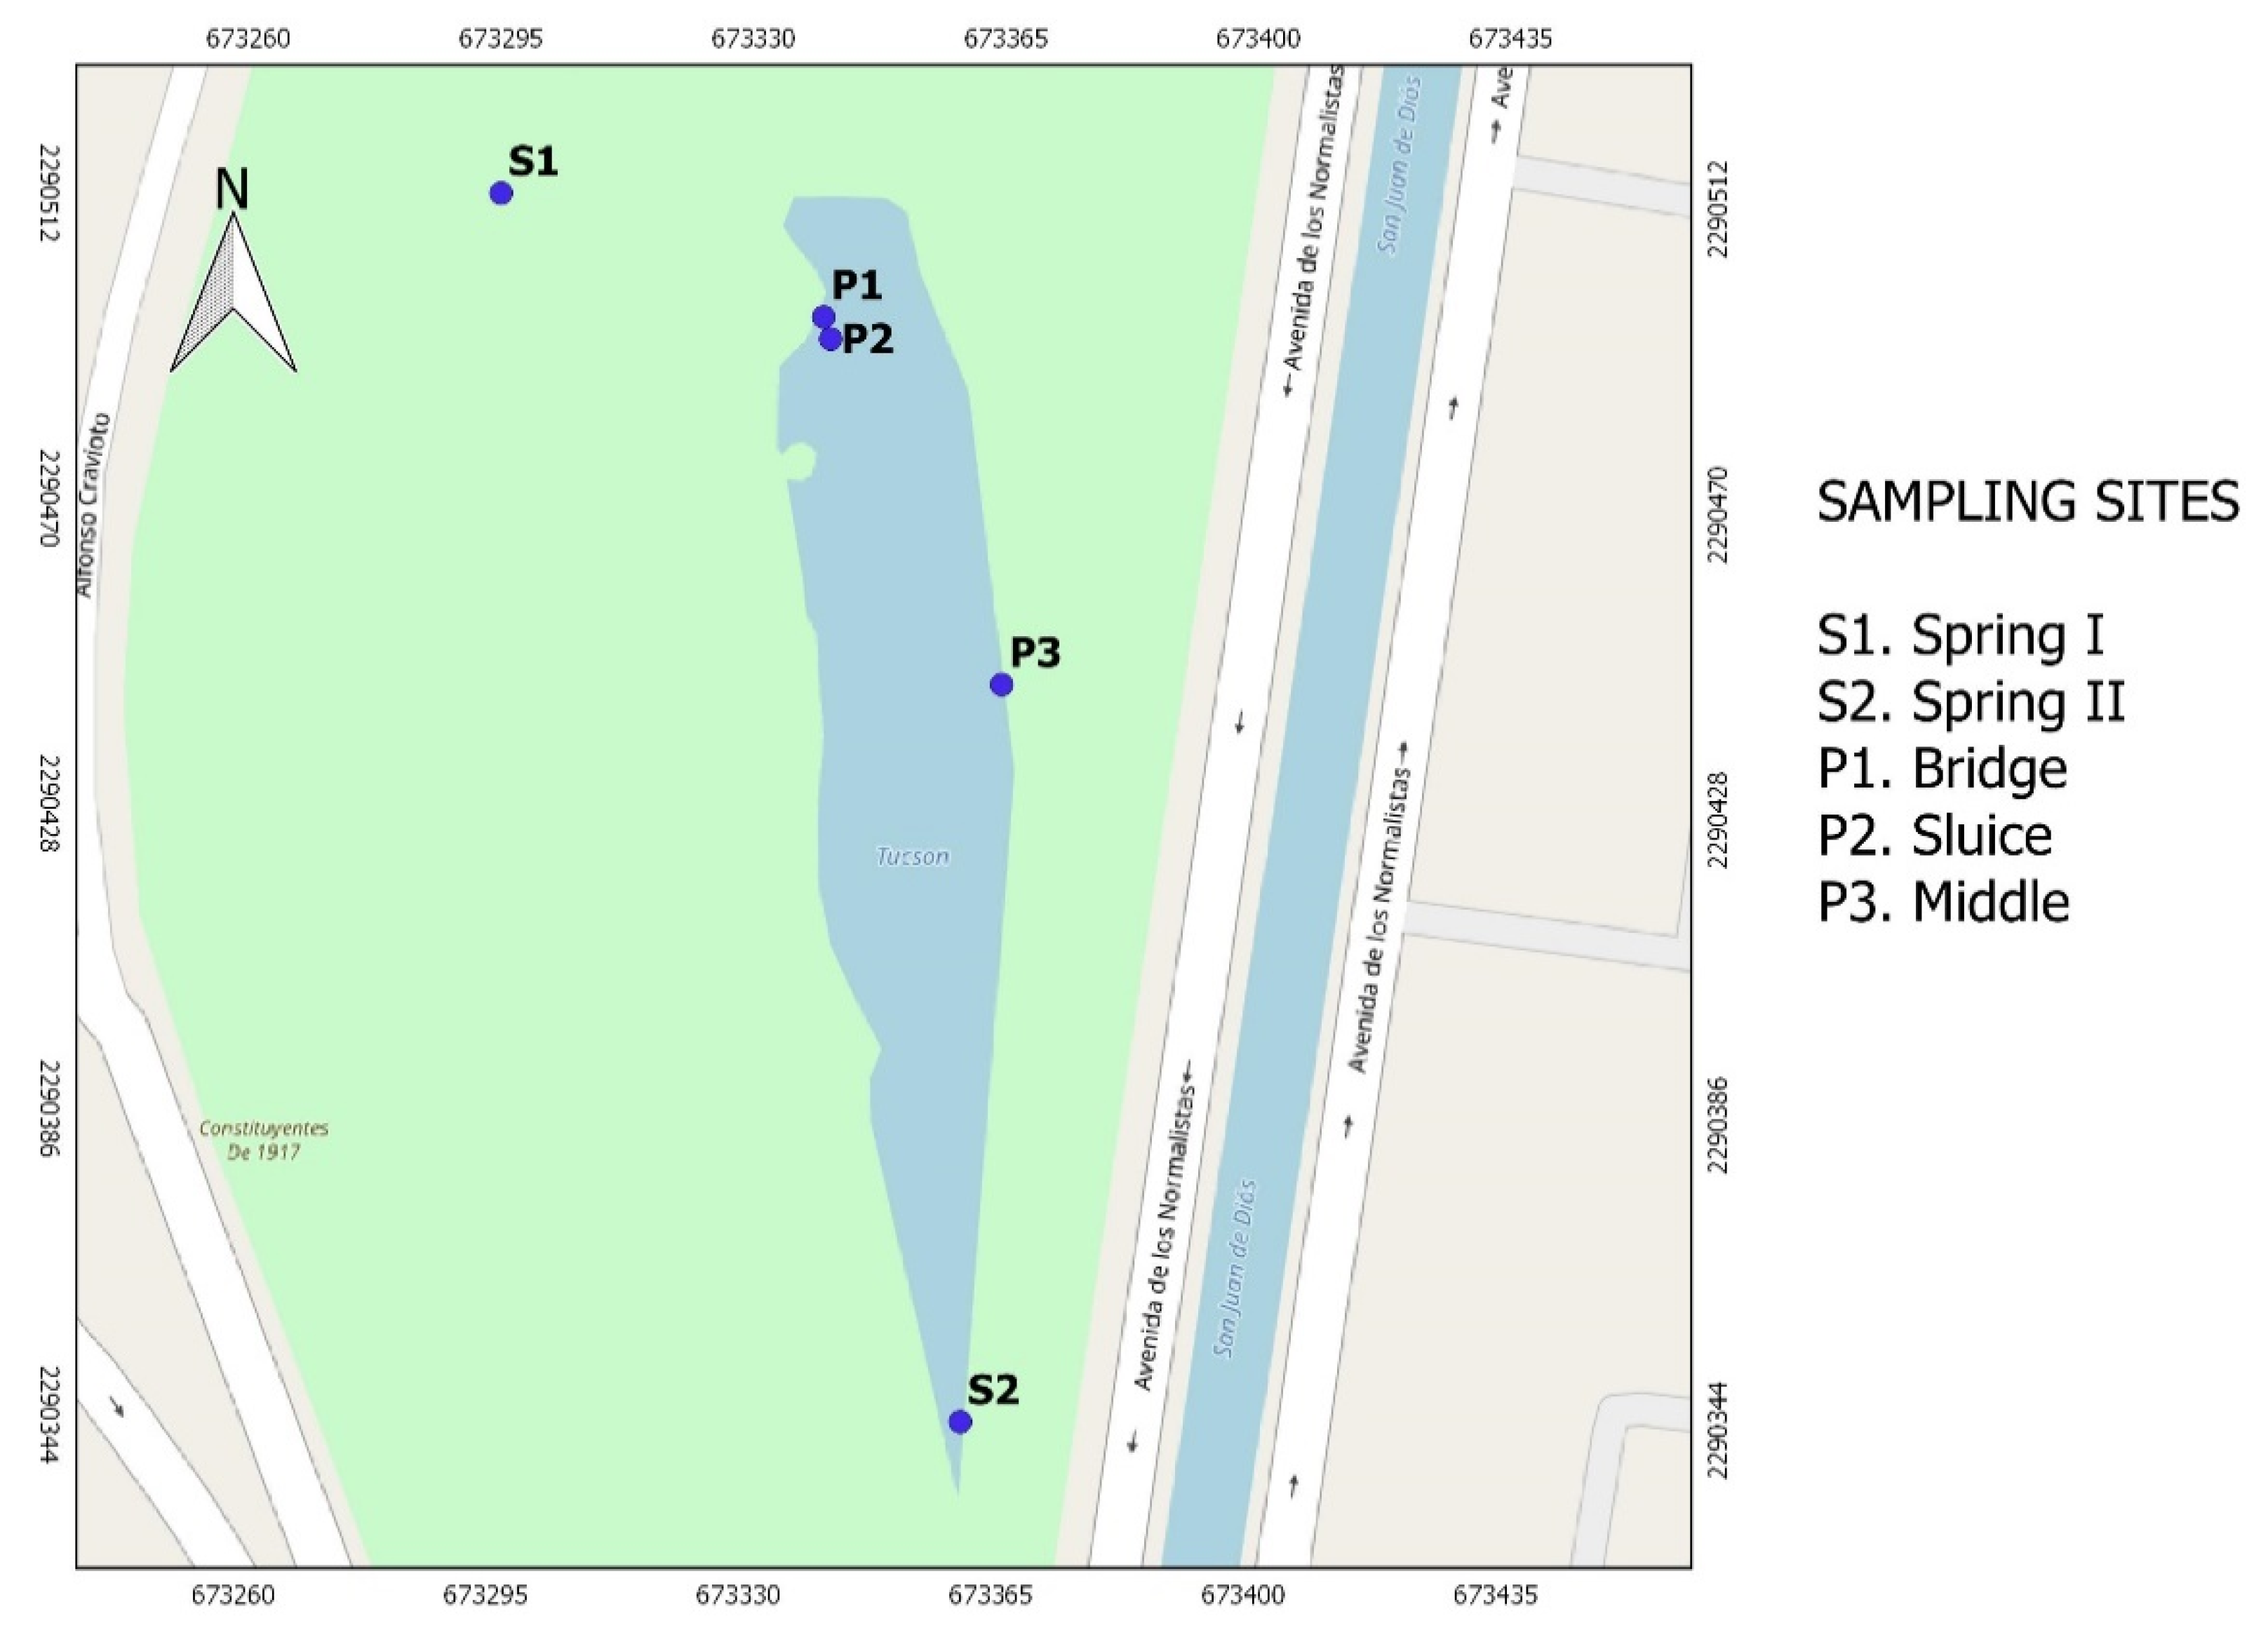
The state of water sources in the park were evaluated through a computed WQI that provided an easily understandable scale to qualify water quality. The products to develop the index are physicochemical and bacteriological parameters that must be grouped together to come up with a representative scale indicative of the level of contamination [
87].
Points located in the pond (P1, P2, and P3) recorded lower WQI due to stagnant conditions of water at this point. Moreover, there is a great abundance of fish and ducks in the pond and might be the explanation of the high amounts of coliforms. Adding factors to these values might be pollution sources due to residues of aquatic fauna, bad behavior of some park visitors throwing garbage into the pond, and improper feeding of aquatic fauna.
Spring points S1 and S2 showed the higher WQI. Although its water is not suitable for use and human consumption, as WQI categories stated a “Greater need for treatment”, ignoring these results will result in a significant increase in gastrointestinal diseases. This result is relevant since visitors used to drink water from this site. Untreated domestic waters and storm runoff from agricultural and urban areas usually contain high concentrations of nitrogen and phosphorus, and these nutrients are essential for the growth and development of phytoplanktonic organisms such as green algae, cyanobacteria, or diatomic algae. However, excessive input of nutrients into the water can trigger the growth of phytoplankton. When phytoplankton dies, it is broken down by heterotrophic bacteria that, in the process, consume oxygen. When the amount of dead phytoplankton is very abundant, the bacterial activity increases remarkably, reducing the oxygen level in the water. This produces, among other effects, bad odors and the death of aquatic species that need well-oxygenated waters to survive, thus unbalancing the natural drainage of water [
88].
The supportive criteria to evaluate water quality by the presence of certain macroinvertebrate families in the water was through the BMWP index, which is widely used in various countries due to its validity. It can generate information regarding the characteristics of ecosystems with their respective hydrological and ecological adaptations to particular environments. The reliability of index makes it an excellent tool for monitoring and managing watersheds, as well as for research studies, which are especially useful when there are no regulations in this regard [
48,
89].
Macroinvertebrate findings labeled the pond´s water as “slightly polluted” due to the presence of Pleuroceridae, Chironomidae, and Cyclopinidae families that can be found in not very pure waters. Matching of this result to WQI was close since the corresponding category was “Acceptable but not recommendable” for performing recreational activities on the pond, as it is the case of boat riding. It is worth mentioning that the use of macroinvertebrates as bioindicators of water quality in the Mexican and even the Latin-American contexts are scarce, therefore results of the present study will make a relevant contribution in this region and will add knowledge to the global context [
90].
The health of wooded areas is considered to be of great importance in parks since healthy trees are strong trees that promote photosynthesis, contribute in a better way to the uptake of pollutants and the generation of oxygen, they are not at risk of falling, and therefore its ecosystem and health role is most effective in parks. The benefits of green areas for the population are duly documented in terms of physical and mental health [
91,
92,
93]
Evaluation of wooded areas confirmed similar results concerning chronic damage that has been reported by Gallegos (2013) where it was pointed out that not all observed were due to ozone exposure, but rather ensuring a relationship between different atmospheric pollutants with the presence of pathogens or pests, which seriously affects the health of the tree. In our study, the majority of trees (90%) suffered from diseases and pests that put their presence in the park at risk. The problem is widely distributed among wooded area, i.e., within the premises and on the periphery of the site, assuming that, due to their proximity and lack of space, any diseased tree represents a potential source of infection and easy spreading of disease [
94].
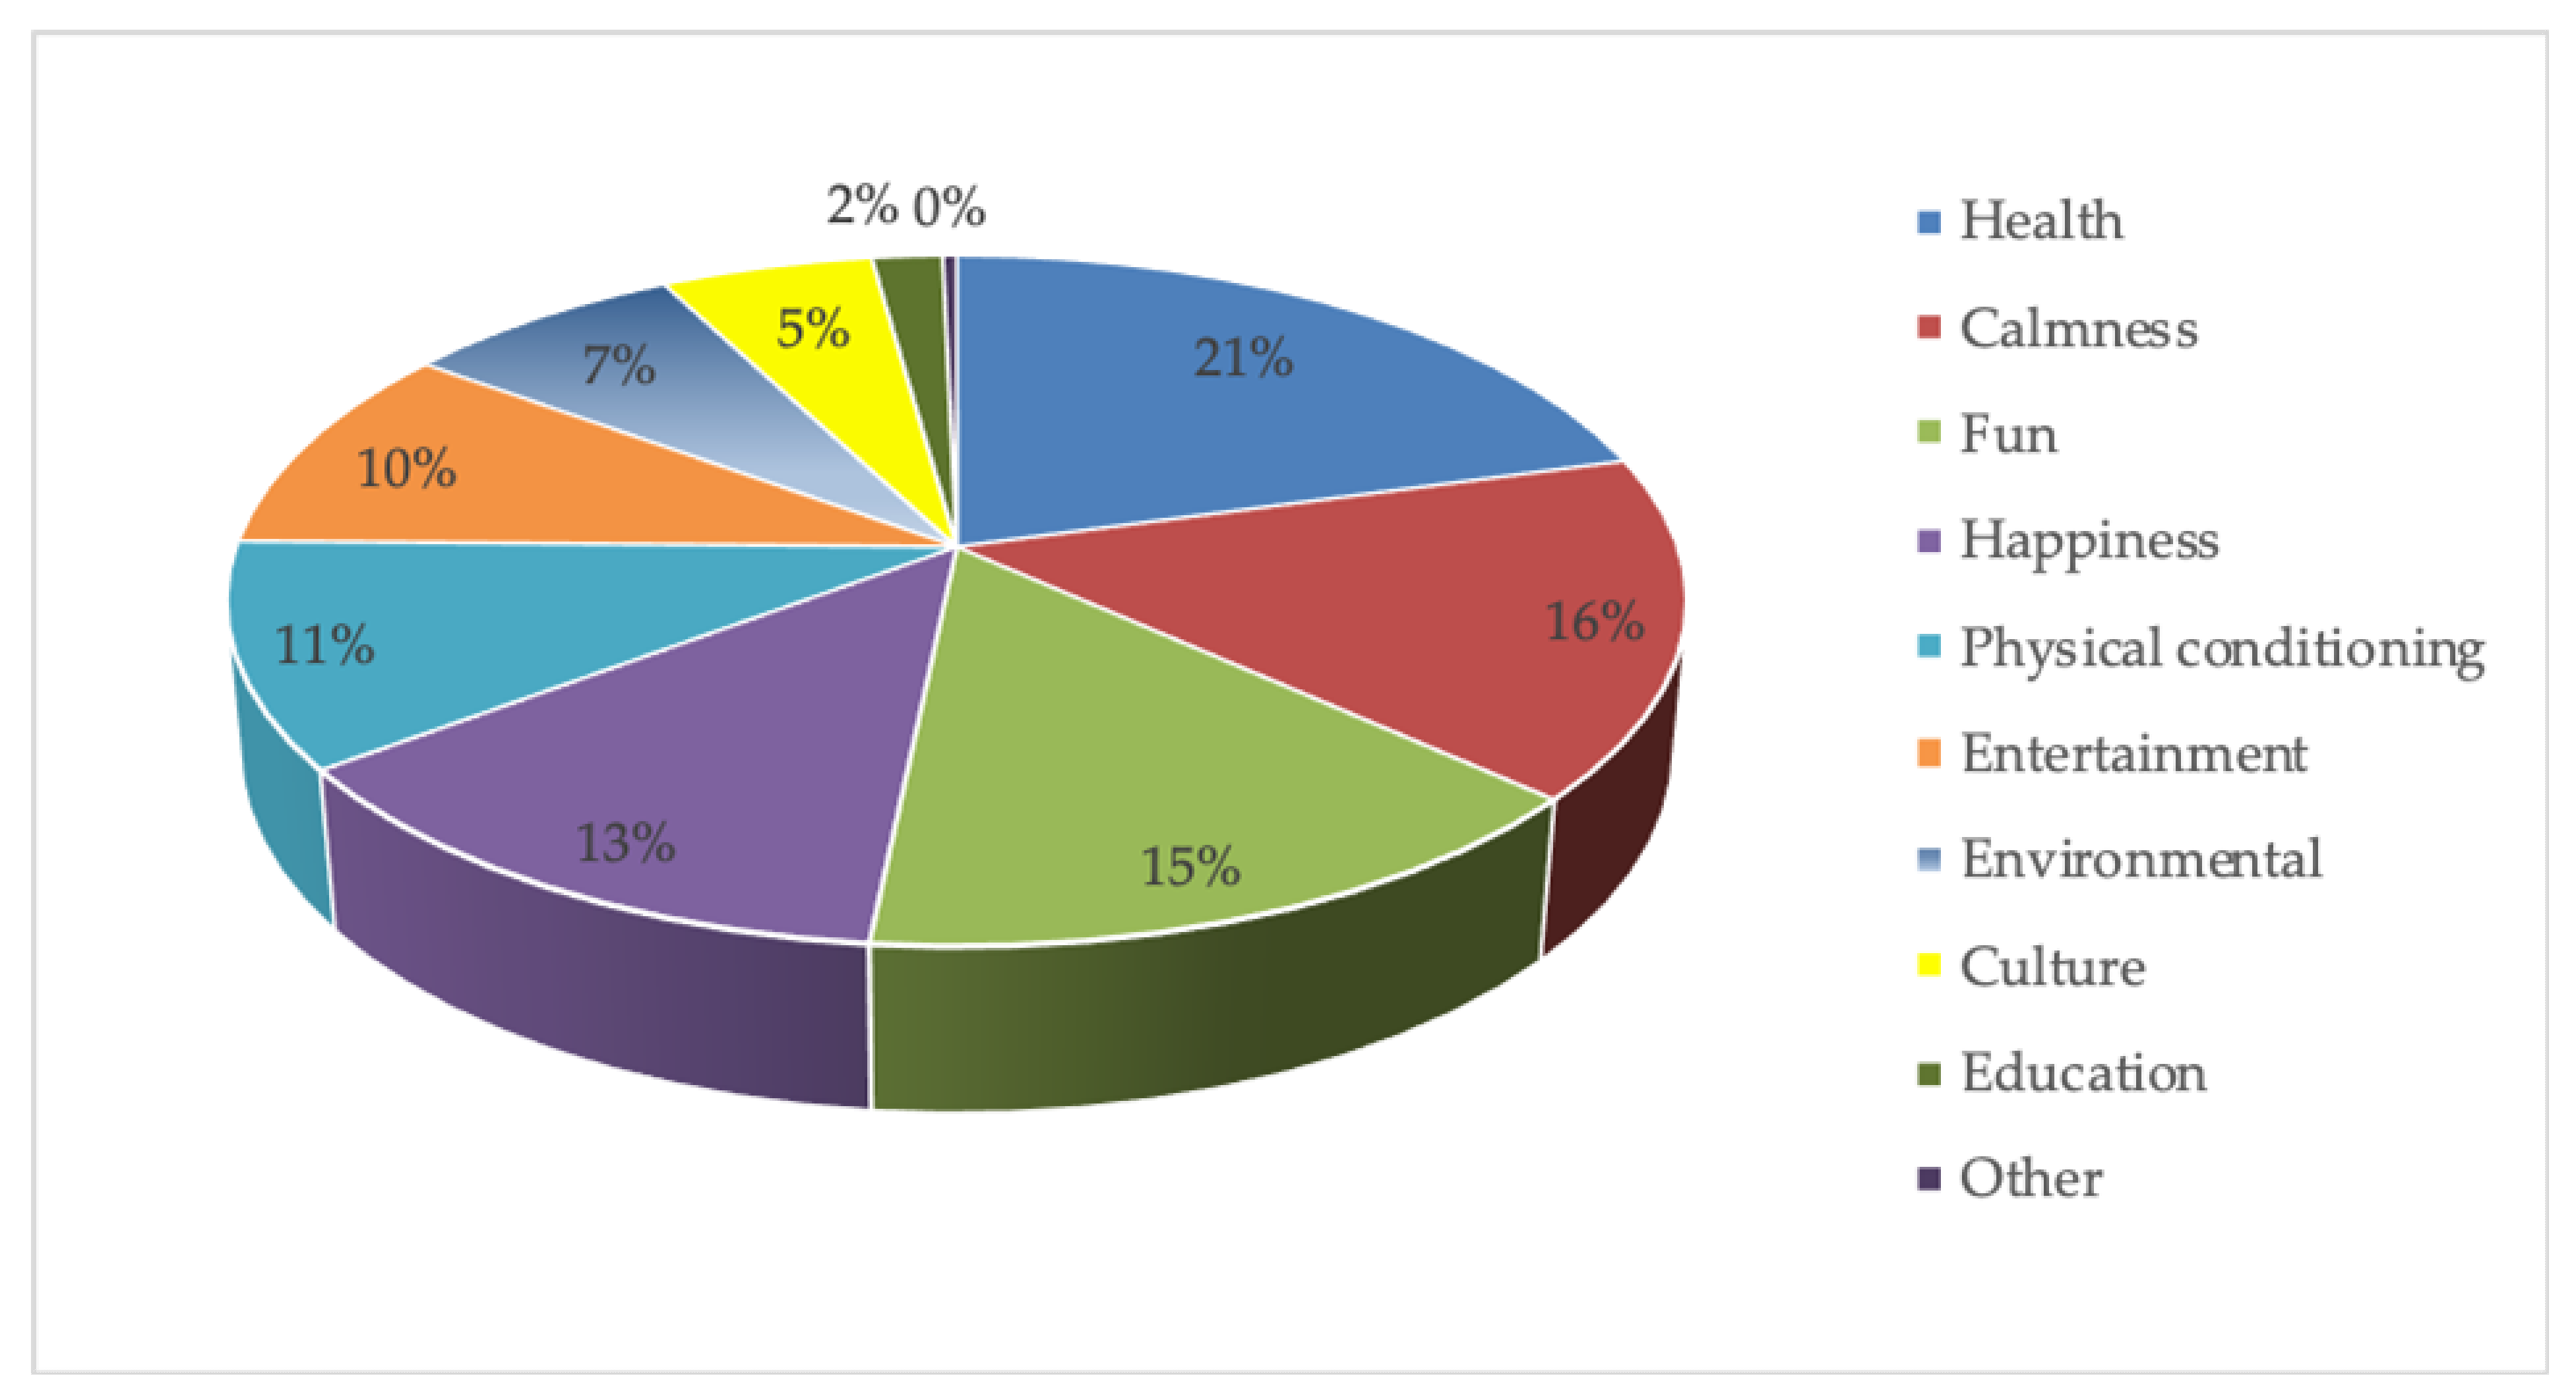
Environmental perception surveys are a very useful instrument since they can be used to identify the inconvenience and complaints of the population regarding exposure to adverse environmental conditions, insecurity, or problems in general that limit their wellbeing, and also support the implementation of programs, projects, and actions that can be undertaken to improve the operation of public places, such as parks in this case [
95,
96].
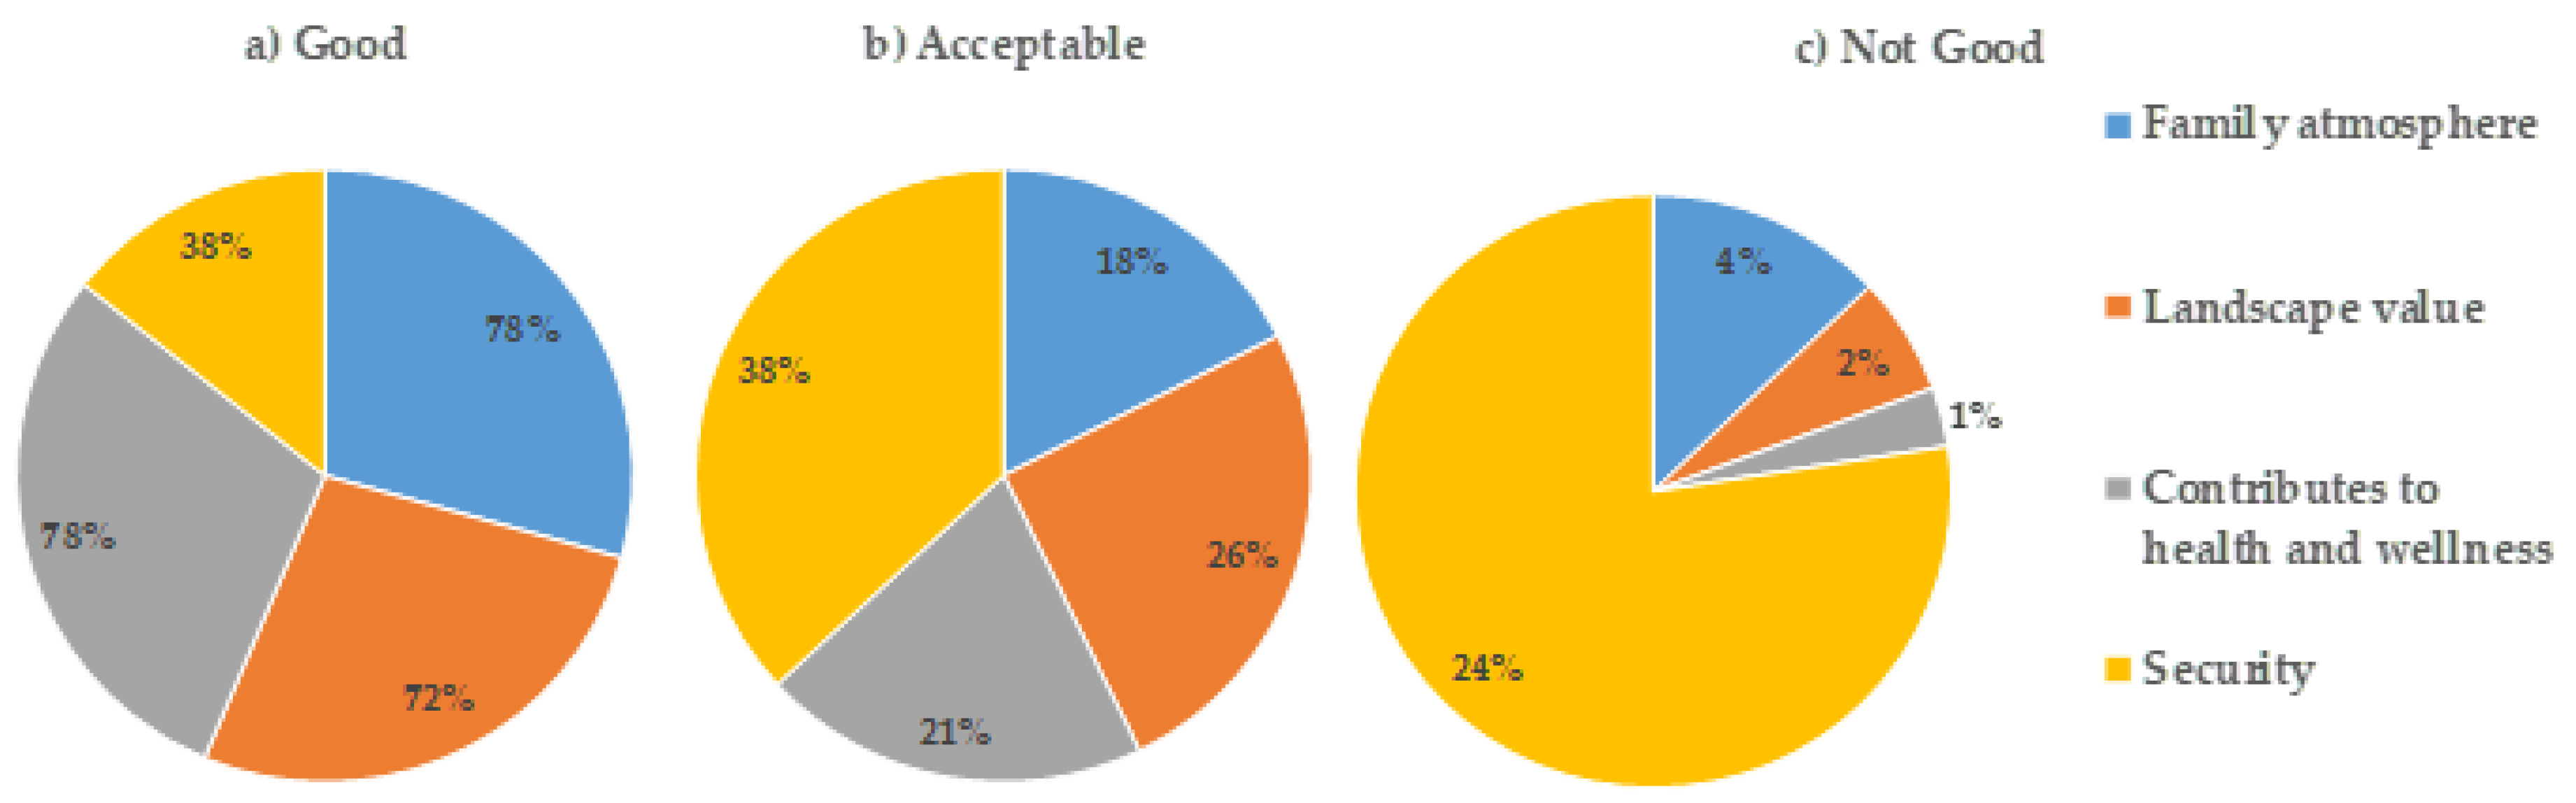
Answers from the environmental perception survey emphasized that park users were not totally aware of the main pollution problems in the park, since they were only able to identify the pond´s contamination by the bad smell and particular color of water. This puts forward the intensive work that must be done in society to awake people´s consciousness about the relationship between the state of the environment and self-welfare as it is one of the principles of sustainability. In a general context, people evaluate pollution problems based on visible features and fail to visualize the problem in an integrated socio-environmental approach as they lack the skills to do it. In this context, survey participants mentioned that the park is in good condition, thus referring to infrastructure and amenities. Their suggestions were focused on infrastructure remodeling of playground areas and the running track due to its evident weathering. Special request was also put in for solving the alarming situation of insecurity and lack of public lighting. In addition, they requested better dissemination of the activities carried out in the park, since they do not know the services offered by the Municipal Sports Council.

 ,
, 


