Financial Diversity and the Development Process: Case study of Rural Communes of Eastern Poland in 2009–2018


1
Department of Economics and Finance, Jan Kochanowski University in Kielce, Uniwersytecka 15 str., 25-406 Kielce, Poland
2
Laboratory of Economics and Counseling in Agribusiness, Department of Agronomy, Faculty of Agriculture and Biotechnology, UTP University of Science and Technology in Bydgoszcz, Fordońska 430 str., 85-790 Bydgoszcz, Poland
*
Author to whom correspondence should be addressed.
Sustainability 2020, 12(16), 6446; https://0-doi-org.brum.beds.ac.uk/10.3390/su12166446
Submission received: 6 July 2020
/
Revised: 27 July 2020
/
Accepted: 7 August 2020
/
Published: 10 August 2020
(This article belongs to the Collection Sustainable Development of Rural Areas and Agriculture)
Abstract
:In the modern state, the role and importance of communes is growing. They can carry out their tasks when equipped with stable and efficient sources of income. Financial resources are the basis for the operation and implementation of current and development tasks. Their analysis makes it possible to assess the budget structure and provides information on the state of the local economy or endogenous growth potentials. The aim of the article is to assess the diversity of the financial situation of rural communes using a synthetic measure. In addition, using the econometric models, the impact of socio-economic factors on the diversity of the measure of synthetic financial situation was examined. In order to build synthetic measures, the Technique for Order Preference by Similarity to an Ideal Solution method and based on distance in real space with Euclidean metrics were used. The aggregated value of the synthetic variable facilitates the comparison of objects in multidimensional spaces, but also makes it possible to order them due to the examined phenomenon. Empirical data were collected in spatial terms of 484 rural communes in the Eastern Poland region. In the case of municipalities, the choice of variables was largely determined by the availability of secondary data collected in a municipal system at the Local Data Bank of the Central Statistical Office for 2009–2018. The analysis showed that the rural communes of eastern Poland are characterized by significant disproportions in terms of financial standing. Rural communes with the best financial condition were characterized by a higher share of own revenues in total revenues, a higher level of income from local taxes and obtained from the share in the tax on natural and legal persons. It seems that the main reason for the relatively small impact of financial conditions on economic and social development is their strong dependence on transfer revenues transferred from the state budget and the amount of current expenditure. The above circumstances stiffen and stabilize the financial economy, making it relatively less susceptible to the influence of other factors. The obtained results may constitute for the local authorities an important source of information on the disproportions occurring between units on setting out potential directions for optimizing the structure of local finances.
1. Introduction
The decentralization of competences in the public sector means that we can talk about the growing endogenization of development processes, i.e., the increase in the significance of local tangible and intangible resources. Their diversity regarding both value and quality results in different conditions for conducting business activity and, as a consequence, different levels and living conditions of inhabitants [1]. The scale of these differences may determine the acceleration of development processes or their slowdown or inhibition, especially in the case of peripheral regions. This results in paying attention to the advantage and greater efficiency in new conditions of endogenous development understood as local development based on maximizing local resources (including financial resources) [2].
Geographic conditions and the effect of heterogeneous socio-economic factors mean that individual municipalities are characterized by a different level of development. This translates directly into living conditions and the well-being of residents. The reasons for this state of affairs, in addition to the historical conditions of individual municipalities, can be traced, among others in the implementation of new investments, creation of new jobs, inflow (outflow) of capital, increase in the income of the population [3] and services rendered, etc. [4].
Development is a multidimensional process of qualitative and quantitative changes. It should be based on the use of local resources. It is a special process of interrelated changes (economic, social, political or cultural) taking place in the local socio-territorial system [5]. Therefore, it is conditioned by a number of entities that can affect the commune (economic entities, households and economic system) to varying degrees and with varying strength. They form a network of interrelationships (multidimensional space of functioning), and because acting for the benefit of a given community, they are interdependent and should be considered together.
The commune in general is a community created by residents and a limited area. In a broader sense, it is a socio-economic system, in which, apart from the area and inhabitants, there are commune bodies and organizational units [6]. The commune as the basic local government unit is responsible for all matters of local scope [7]. Commune self-governments carry out various tasks related to the current needs of residents, such as access to services in the field of health protection, social care or education, but they should also take care of creating conditions conducive to the development of entrepreneurship and increasing the region’s competitiveness. The Act on commune self-government assumes that the commune satisfies the community’s collective needs by implementing its own tasks in the field of commune technical infrastructure, social infrastructure, public order infrastructure and public security. Its development depends on the ability to manage resources and how the municipality will use its opportunities. The growing role of communes in the economy is associated with the need to make a multidimensional assessment of its operation in the context of demographic, economic, infrastructure and financial variables. A comprehensive approach to the commune’s assessment should include a combined assessment of purposefulness, rationality and efficiency. One of the tools that can be used for this purpose is the synthetic measure. It requires, under the conditions of dynamic change and their impact on economic relations in the local socio-economic space, a lot of information. One should look for regularities explaining the spatial diversity of communes’ development, but also its structures and local conditions.
The economic potential is therefore reflected by the accumulated capital in a given area, structural features of its economy, as well as the degree of entrepreneurship of the population. The development of the individual depends on the human, innovative, ecological, infrastructural, financial and institutional potential. Intangible assets such as knowledge, research, new qualifications and skills as well as leadership skills and local initiatives occupy a special place in local development policy. Endogenous potential (of communes), resulting from a combination of local conditions, determines its possibilities and development directions. As D. Milczarek points out, the region’s endogen is the sum of geographical, demographic, economic, social elements, etc. [8]. I. Kiniorska distinguishes three types: demographic, economic and infrastructural [9]. The analyzes carried out by P. Churski [10] and his co-authors and M. Stanny [11] or P. Dziekański [12,13] show that financial potential is an important endogenous element affecting development opportunities. In the study, the authors point out the issue of local government revenues and investment expenditure, emphasizing their importance from the point of view of the potential financing of development-oriented tasks of local governments.
The financial situation is complex and refers to the general economic development of the commune and the individual’s abilities, including to accumulate sufficient financial resources, to provide public services and to manage debt. It indicates the commune’s ability to meet its own administrative and investment needs, which means maintaining and developing its own assets in line with current and future demand for public services [14,15]. The financial situation is a relative assessment of the commune’s finances, i.e., the possibilities to ensure financial security. This security includes the ability to perform tasks and credibility regarding the ability to pay both current and future obligations [16]. The financial situation cannot be described with one indicator based, for example, on the financial statements or the budget. Knowledge of the current state of finances allows local authorities to make comparisons with other entities and helps make financial decisions.
J.J. Parysek indicates that a certain group of factors is common, while others may occur and interact only in certain places and at certain times. Development is directly related to meeting the growing needs of society. The diversified economic structure of the individual creates a peculiar climate of development in which the conditions for taking up business activity by new entities and conditions for cooperation with other entities are created [17].
The aim of the article is to assess the diversity of the financial situation of rural communes using a synthetic measure and taking into account financial, economic and social variables. Due to the role played by municipalities in the process of regional development, it seems important to change the system of local finance to stimulate endogenous growth potentials. In order to build synthetic measures, the Technique for Order Preference by Similarity to an Ideal Solution (TOPSIS) method was used, as well as based on distance in real space with Euclidean metrics (OE). The aggregated value of the synthetic variable facilitates the comparison of objects in multidimensional spaces but also allows their arrangement due to the phenomenon studied. Empirical data were collected in spatial terms of 484 rural communes of the Eastern Poland region (Lubelskie, Podlaskie, Podkarpackie, Świętokrzyskie and Warmińsko-Mazurskie Voivodeships). In the case of municipalities, the choice of variables was largely determined by the availability of secondary data collected in a municipal system at the Local Data Bank of the Central Statistical Office (BDL GUS) for the years 2009–2018.
The answers to the following research questions will bring the authors closer to achieving the main aim. The basic research question was: Is the level of the financial situation of rural communes dependent on the level of variables characterizing the development process (endogenous socio-economic variables)? The following questions were assessed in turn: What is the spatial distribution of the financial situation of rural communes in eastern Poland? Which variables of endogenic potentials of communes shape the level of their financial situation? To what extent do transfers from the state budget affect the level of the financial situation?
2. Materials and Methods
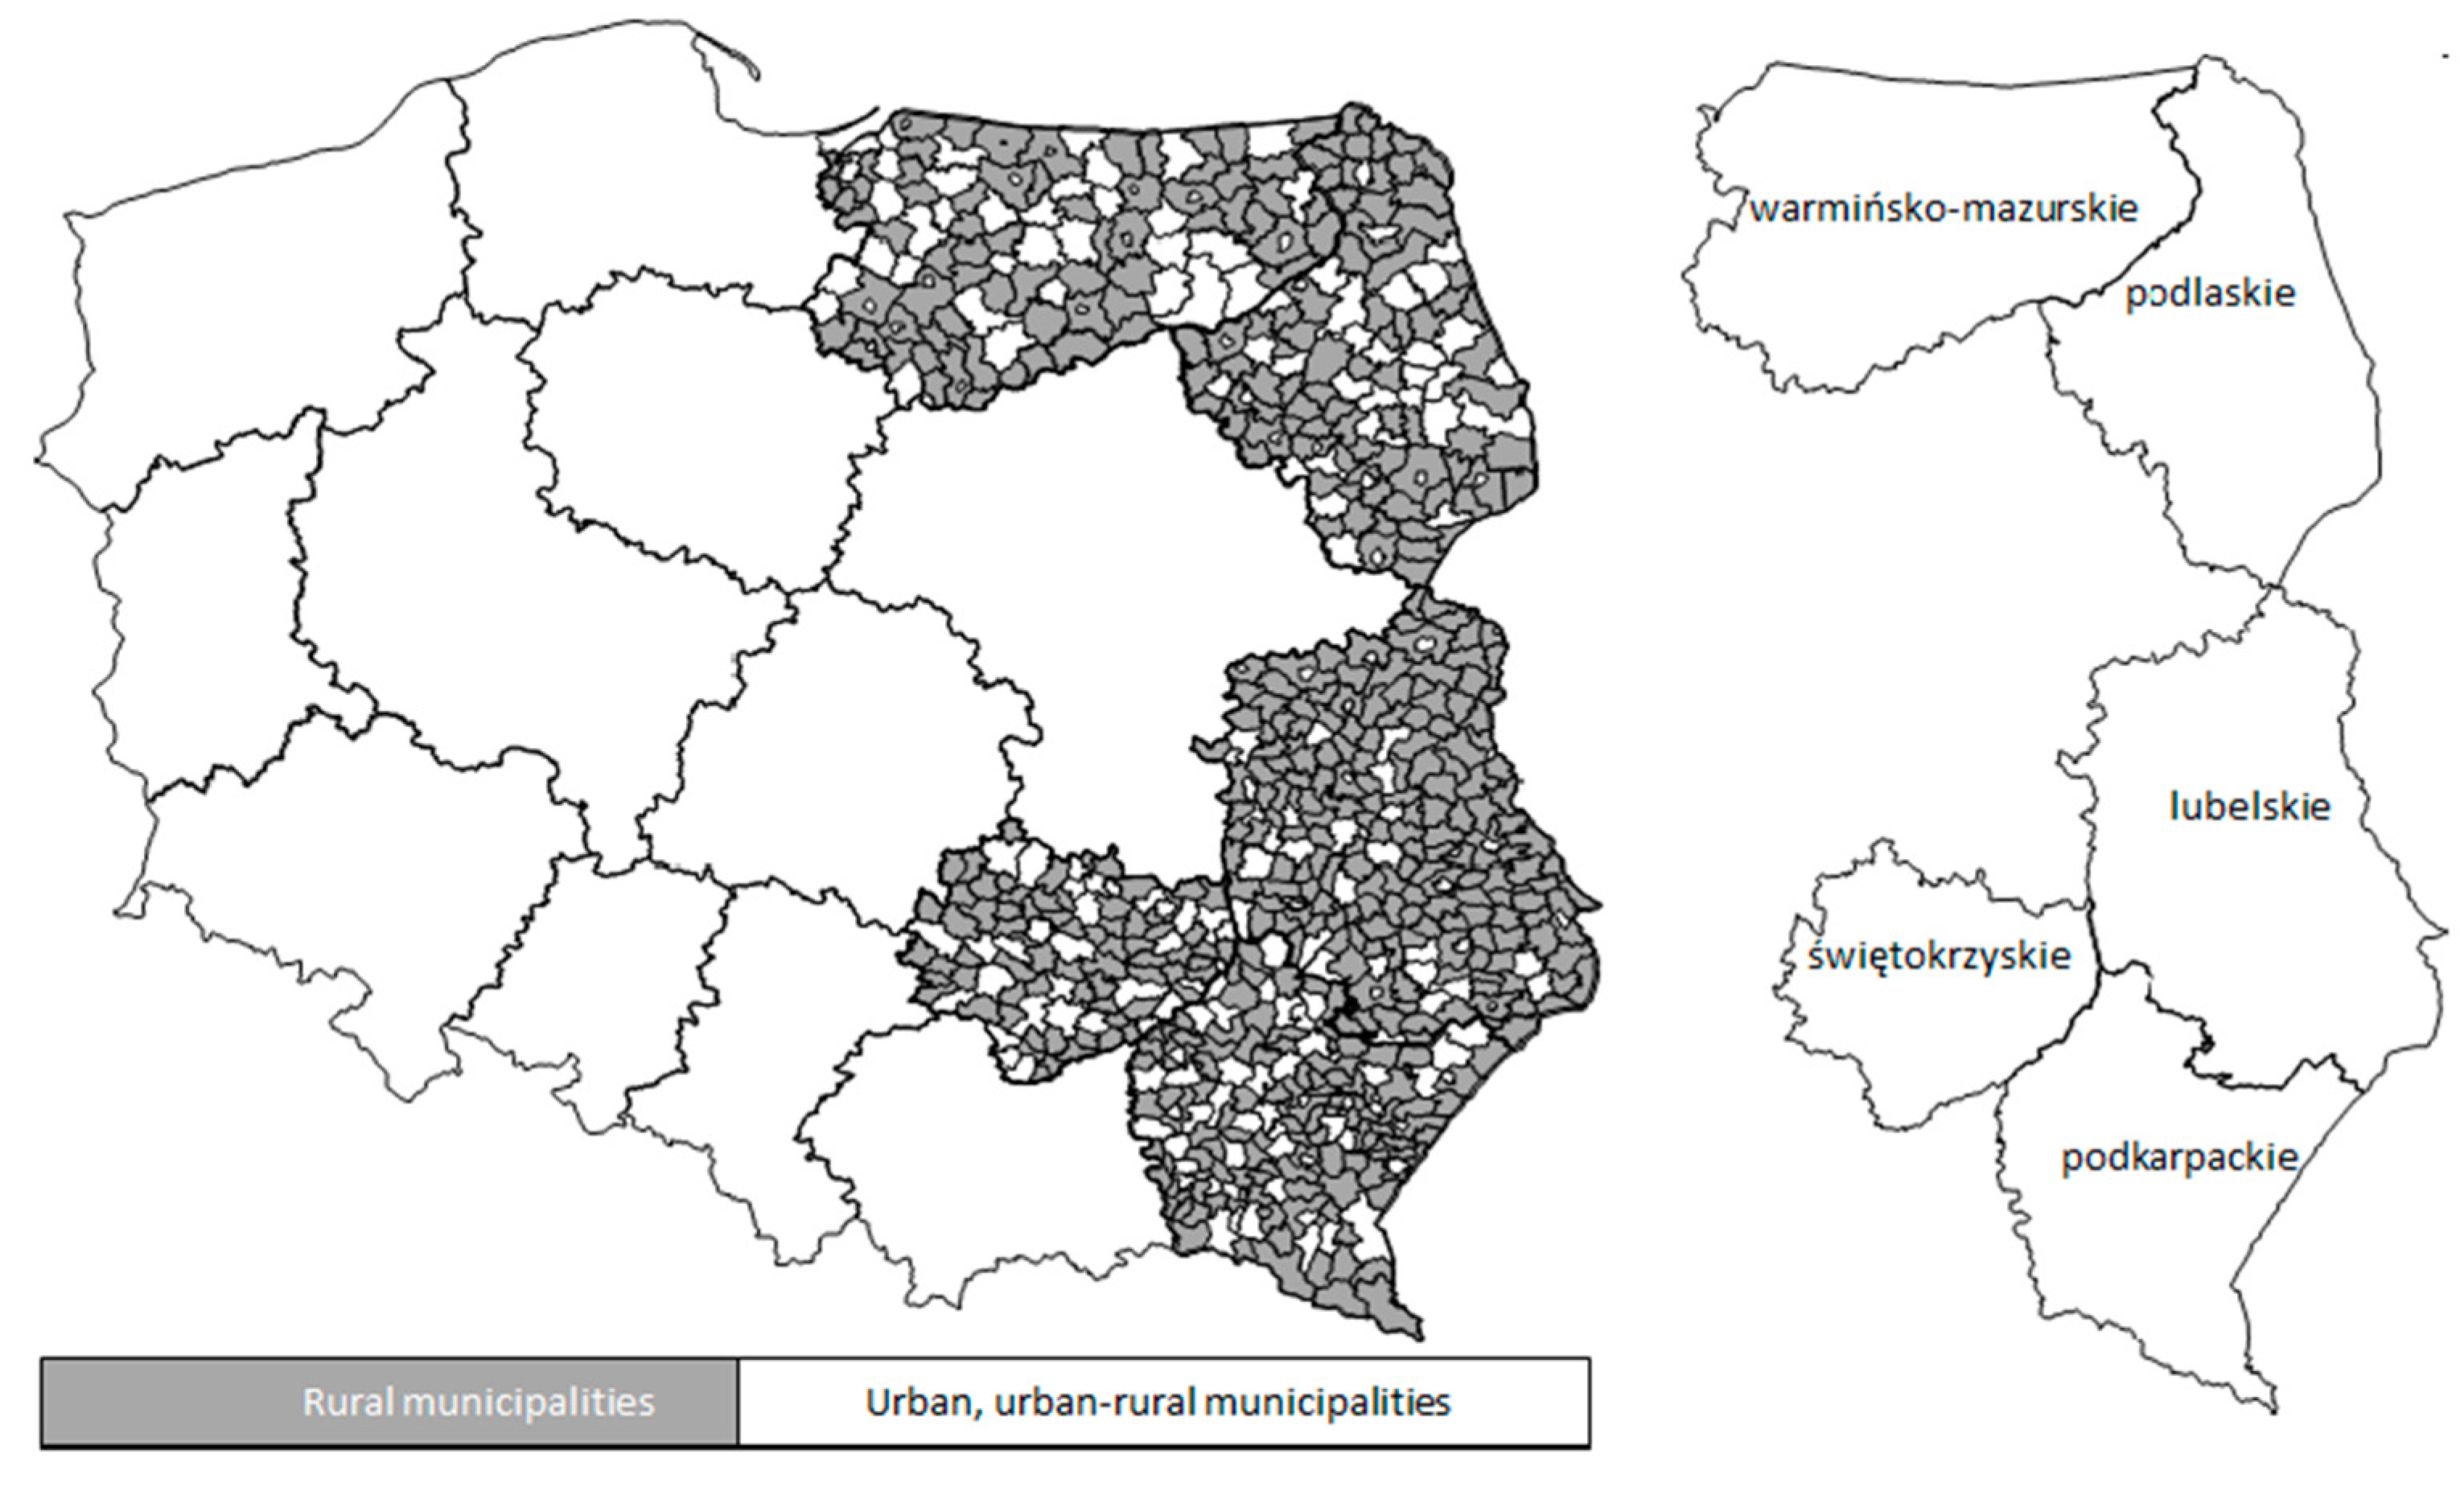
Eastern Poland covers the following voivodships: Lubelskie, Podlaskie, Podkarpackie, Świętokrzyskie and Warmińsko-Mazurskie. This macroregion is a compact area with the lowest level of economic development in Poland and one of the weakest in the European Union (Figure 1). The nature of the problems adversely affecting the socio-economic situation and development prospects of this area largely have a structural dimension, which is a consequence of historical conditions. From the point of view of the macroregion’s development potential, an unfavorable condition is a low efficiency of the economy’s structure and the labor market, the constant outflow of its inhabitants to other regions or a low level of innovation [18].
The determinants of municipalities are interactive. They are a set of interrelated factors that create a multidimensional space. They should be seen as a set of interdependent elements that occur at the same time and space horizon. The study identified the following categories characterizing the financial situation, potential: entrepreneurship, infrastructural demographic and labor market and the environment.
The financial situation (including budget payability, financial independence, state interference, the degree of financing services) determines the possibility of timely fulfillment of financial obligations and ensuring continuity in the provision of services. Finances allow you to make a comprehensive assessment of the municipality’s operation and its development possibilities or the implementation of public tasks. There is feedback between socioeconomic and financial variables.
High economic potential increases living standards, increases production, better social situation and greater public security. The economic potential is built by, among others occupational activity of residents, local labor market and entrepreneurship. The number of economic entities indicates the level of entrepreneurship in the region. This is one of the indicators showing the economic situation of the region. Unemployment is a social phenomenon in which a part of the population able to work and declaring work are not employed.
Local authorities should ensure the condition of infrastructure, which will increase the attractiveness of the area and attract new entrepreneurs, create new jobs and improve the quality of life of residents. The more extensive the infrastructure, the better the municipality should be perceived by potential customers. Infrastructure contributes to the economic activation of the region and the increase in the openness of regions and to the inflow of competitive products from other areas. It is the basic factor conditioning the development of a given area.
Knowledge of social potential and the labor market at the commune level and its changes is of great importance for identifying the determinants of development policy. Human capital is one of the key elements of development [19,20,21,22]. Human capital is made up of predispositions, knowledge, skills, social relations, civil engagement, trust and social norms, along with competences that allow them to be used in specific actions [23,24,25,26]. Migrations are a factor causing significant changes in the population level, spatial distribution and various population structures. The factors shaping migration included the level of entrepreneurship, the situation on the local labor market, the wealth of the commune and housing resources.
The natural environment is an important component of the wealth of municipalities, as well as an important element of quality of life. For economic reasons, it is, inter alia, a source of obtaining raw materials and energy, provides geographical space, field of economic activity, place of living or recreation.
The development process or financial situation are determined both by economic factors as well as by environmental, infrastructure and social factors [27,28,29]. They form a network of mutual and interdependent connections, a multidimensional space for functioning. Because they act interdependently on behalf of the community, they should be considered together. Due to the breadth of the concept of sustainable development and the multitude of individual determinants, it is difficult to refer to all factors in one study [30,31].
In the case of communes, the choice of variables was largely determined by the availability of statistical data collected in the commune system. Part of the data under BDL CSO was incomplete, the data did not cover all municipalities. Therefore, in this article, the authors focused on selected variables described in Table 1.
Within the defined categories, synthetic measures were designated. Then, the average value of the synthetic measure was determined, indicating the development potential of the commune. The value of the arithmetic average is the quotient of the sum of the sums of all tested communes’ potentials and their number. We can calculate it from the formula
where —arithmetic average, as the value of the synthetic measure of development, —synthetic value of the potential category (according to the determined method, specific potential), n—number of tested categories (potentials).
This made it possible to eliminate the problem of the verifiability of variables within the examined categories of variables.
The research was carried out in several successive stages [32,33]. At the beginning, a selection of variables describing the studied phenomenon was made. The description of the set can be presented in the form of an observation matrix of the form
where —denotes the values of the j-th feature for the i-th object, i—the object number (i = 1, 2,..., n), j—the number of the variable (j = 1, 2,..., m).
After selecting the variables, the nature of each of them was examined, i.e., whether a given variable is a stimulant or a destimulant. A stimulant is understood as such an economic variable whose high level entails the desired state of the studied phenomenon. In contrast, the destimulant is such a variable, whose high level implies the undesirable state of the studied phenomenon. Most variables are obvious—their determination is intuitive (resulting from substantive experimentation of the researcher and analysis of literature), and in doubtful cases, it is worth using the Grabiński procedure (1985) which uses the fact that stimulants should be positively correlated, as well as destimulants, and negatively with destimulants [34].
To ensure the representativeness of variables, variables were introduced into the final set that in a given category are characterized by greater discriminatory ability (higher coefficient of variation in the examined time interval, assuming the limit value of the coefficient of variation as 0.10) and are not very strongly correlated with others in this category (according to the inverted matrix method, the diagonal element significantly exceeding 10 was removed).
A. Malina notes that a large value of the correlation coefficient results in the duplication of information about the analyzed phenomenon and may lead to incorrect conclusions [35]. Two features are strongly correlated with carriers of similar information, so one of them is unnecessary. Overly correlated features (diagonal elements correspond to them) in the inverse matrix with values greater than 10 are eliminated from the set of variables. The procedure is repeated until the stability of the R-1 matrix is achieved, the appearance of diagonal elements whose values do not significantly exceed 10 [36].
The relationship analysis based on the inverse matrix and the correlation coefficient between the variable values leads to the conclusion that the individual output data are slightly correlated with the others. All variables selected for analysis are sufficiently discriminatory. It should be noted that the analyzed indicators can be associated with three dimensions of cohesion, which is the EU objective of the activities of public authorities under the implementation of the regional policy: X1–X20, X30–X31 with economic cohesion, X21–X29 with social cohesion, and X32–X40 with territorial cohesion.
The use of some other variables was abandoned because their higher values did not necessarily indicate the level of socio-economic development. This was the case with data on water consumption per capita, population per library facility. Many other factors can affect the level of socio-economic development of individuals, including road network and good communication solutions, well-functioning public transport system, availability and diversity of service base, educational and cultural facilities, farm area, legally protected areas, dust and gas pollution, etc. In their case there is a lack of data on the level of municipalities collected under the BDL CSO.
The value of the coefficient of variation of the used variables ranged from about −3.13 to 2.05. The largest differences were recorded in variables characterizing the financial situation (health expenditure 2.05; municipal management 1.66) and infrastructure potential (% of the population using the gas network —1.46). The smallest occurred in the case of the variable describing the financial situation (evidence from transfers from the state budget 0.15) as well as the demographic potential and the labor market (birth rate −1.71 and miracle trace −3.13, Table 2). It should also be noted that almost all variables are characterized by positive asymmetry (only three present subtle asymmetry), which in the case of a stimulant is not a favorable situation, as it means that a larger number of communes have values of these variables lower than their average value.
The reliability of the final results and the accuracy of decisions based on them depend on the quality of the set of variables [37]. The set of diagnostic variables should be defined in such a way as to fully characterize the phenomenon under study [38]. A good set of variables are variables that are strictly defined, unambiguous, represent phenomena and processes within the scope of the study as accurately as possible have a large informational content and are uncorrelated [39].
Subsequently, the destimulants were replaced with the stimulant according to the formula [40]:
The selected variables were subjected to the procedure of zero unitarization using the following formula:
where S—stimulant, —denotes the values of the j-th feature for the i-th object, max{}—the maximum value of the j-th variable, min{}—the minimum value of the j-th variable. The value belongs to the range [0, 1]. The value of 1 means that the variable obtained the maximum value among all tested objects in the whole tested time period. A value of 0 means that the object had a minimum value [41,42,43]. As a result of the transformations, a matrix of uniformized variable values, , was obtained:
where —denotes the unified value of the j-th feature for the i-th object.
In the analysis of the spatial diversity of the financial situation and economic development of rural communes of Eastern Poland, synthetic measures were used: based on the Technique for Order Preference by Similarity to an Ideal Solution (TOPSIS) method and on the distance in real space with Euclidean metrics (OE) [44].
TOPSIS is a reference method in which the reference point of objects in multidimensional space is the pattern and anti-pattern [45]. As part of the adopted method, a synthetic measure separately for each commune, taking into account the distance of the unit from the standard (=1) and anti-template (=0). They were determined according to formulas [46]:
Then, the Euclidean distances of individual objects from the pattern and anti-pattern were calculated according to the following formulas:
where n—is the number of variables forming the pattern or anti-pattern, —means the unified value of the j-th feature for the tested unit, —means the object of the pattern or anti-pattern [47].
The basis of linear ordering is a synthetic variable, whose values are estimated based on observations of diagnostic variables describing the examined objects. The values of the synthetic variable are estimated using aggregate functions, whose analytical form can be different. The synthetic measure for individual objects was determined based on the formula:
where ∈ [0, 1]—the value of synthetic measure; —means the distance of the object from the anti-template (from 0); means the distance of the object from the pattern (from 1). A higher value of the measure indicates a better situation of the individual in the studied area [48,49].
The TOPSIS method enables the assessment to be carried out using an unlimited number of criteria, the readability of the results obtained is high, and the results can be presented in numerical form. Presenting the level of the complex phenomenon in the form of one synthetic indicator allows for a linear ordering of objects, i.e., building a ranking of units in spatial terms. An important advantage of the classic TOPSIS method is its simplicity of calculation, the indication of a positive and negative pattern, a large number of possible alternative criteria to be used in the assessment process, global ordering of objects [50,51,52].
The second measure determined synthetic measure was determined according to the method based on distance in real space with Euclidean metric (OE) according to the formula:
where OE—synthetic measure value, i—object number (i = 1, 2,..., n), j—variable number (j = 1, 2,..., m), p—is the number of variables forming the make up the synthetic measure, —means the value of the unified j-th feature for the examined unit, max—maximum value of the j-th feature, min—minimum value of the j-th feature [53]. When the indicator value is equal to 0, the given commune is characterized by the maximum value of each of the examined variables. The higher the value of this indicator, the worse the situation of the commune [54]. The Euclidean distance indicator allows you to analyze independent variables as absolute values [55]. It was used to compare the results obtained with the TOPSIS method.
In the last stage of research, the division into typological groups was used to interpret the obtained measures. The first, second and third quartiles were used as threshold values. The size of the synthetic measure in the first group means a better unit, in subsequent groups—the weaker units. Outliers were identified and the correlation coefficient (Pearson) was assessed. If it is close to ± 1, it means that the quantities are well correlated and there is a functional relationship between them. Statistical measures of diagnostic variables of rural communes of eastern Poland, scatter plot with fit line and linear regression analysis were also presented [56,57].
Isolation of outliers (observations) was carried out using the quartile method. As D. Hawkins defines [58], the outlier observation is such an observation that deviates so much from other observations that it leads to the supposition that it arose as a result of another mechanism, i.e., that it comes from a different distribution than the other observations in data set. Its value stands out significantly from the others.
The classic method used to identify outliers in a time series uses quartiles for analysis (used in the construction of box charts introduced by JW Tukey [59]). The interval is given by the formula:
where Q1, Q3—first and third quartiles respectively, xi—area of the analyzed statistical variable, IQR—quarter range.
IQR (interquartile range) = Q3{xi} − Q1{xi}
The value of a single variable is considered outlier if it is outside the range [60]:
< Q1 − 1,5IQR; Q3 + 1,5IQR >
Regression analysis deals with the relationship between variables of interest to us, aimed at constructing a model that reflects this relationship well. It allows to describe relationships between explanatory (Y) and explained (X) variables, between which there are more or less expressive linear relationships. Analysis of linear regression is aimed at enumerating such regression coefficients (coefficients in the linear model) that will allow the model to best predict the value of the dependent variable so that the error estimate is as small as possible. The linear regression model is described by the following formula:
where yi—explained variable (dependent), xi—explanatory variable (independent), b—directional coefficient, regression coefficient y relative to x (as long as the value of the variable y changes, if the value of the variable x increases by one unit), a—free word.
yi = b xi + a, I = 1,2,…,n
In the case of multiple regression model, when we have more predictors, we use the following formula for the regression line:
yi = b1 x1 + b2 x2 +...+ bi xi + a, i = 1,2,…,n
Regression analysis allows, on the one hand, to check whether the built model allows to predict significantly the value of the explained variable, and on the other, to determine which predictors allow to predict it significantly. In the process of building a regression model, autocorrelation of variables should be excluded. Therefore, first, check the fit of the model by analyzing variance. If it turns out to be statistically significant, we proceed to reading the beta standardized coefficients and their level of significance. Next, specify the percentage of variance explained by reading the statistics (preferably corrected R2. The coefficient of determination determines the degree to which the estimated regression function explains the variability of the variable y. It takes values between 0 and 1. The closer to 1, the better the fit of the regression function to empirical data [61,62,63]. The least squares method to determine the regression line for the collected data is used to estimate both linear and non-linear relationships. The least squares method is not resistant to outliers in the data set [64,65,66].
3. Results
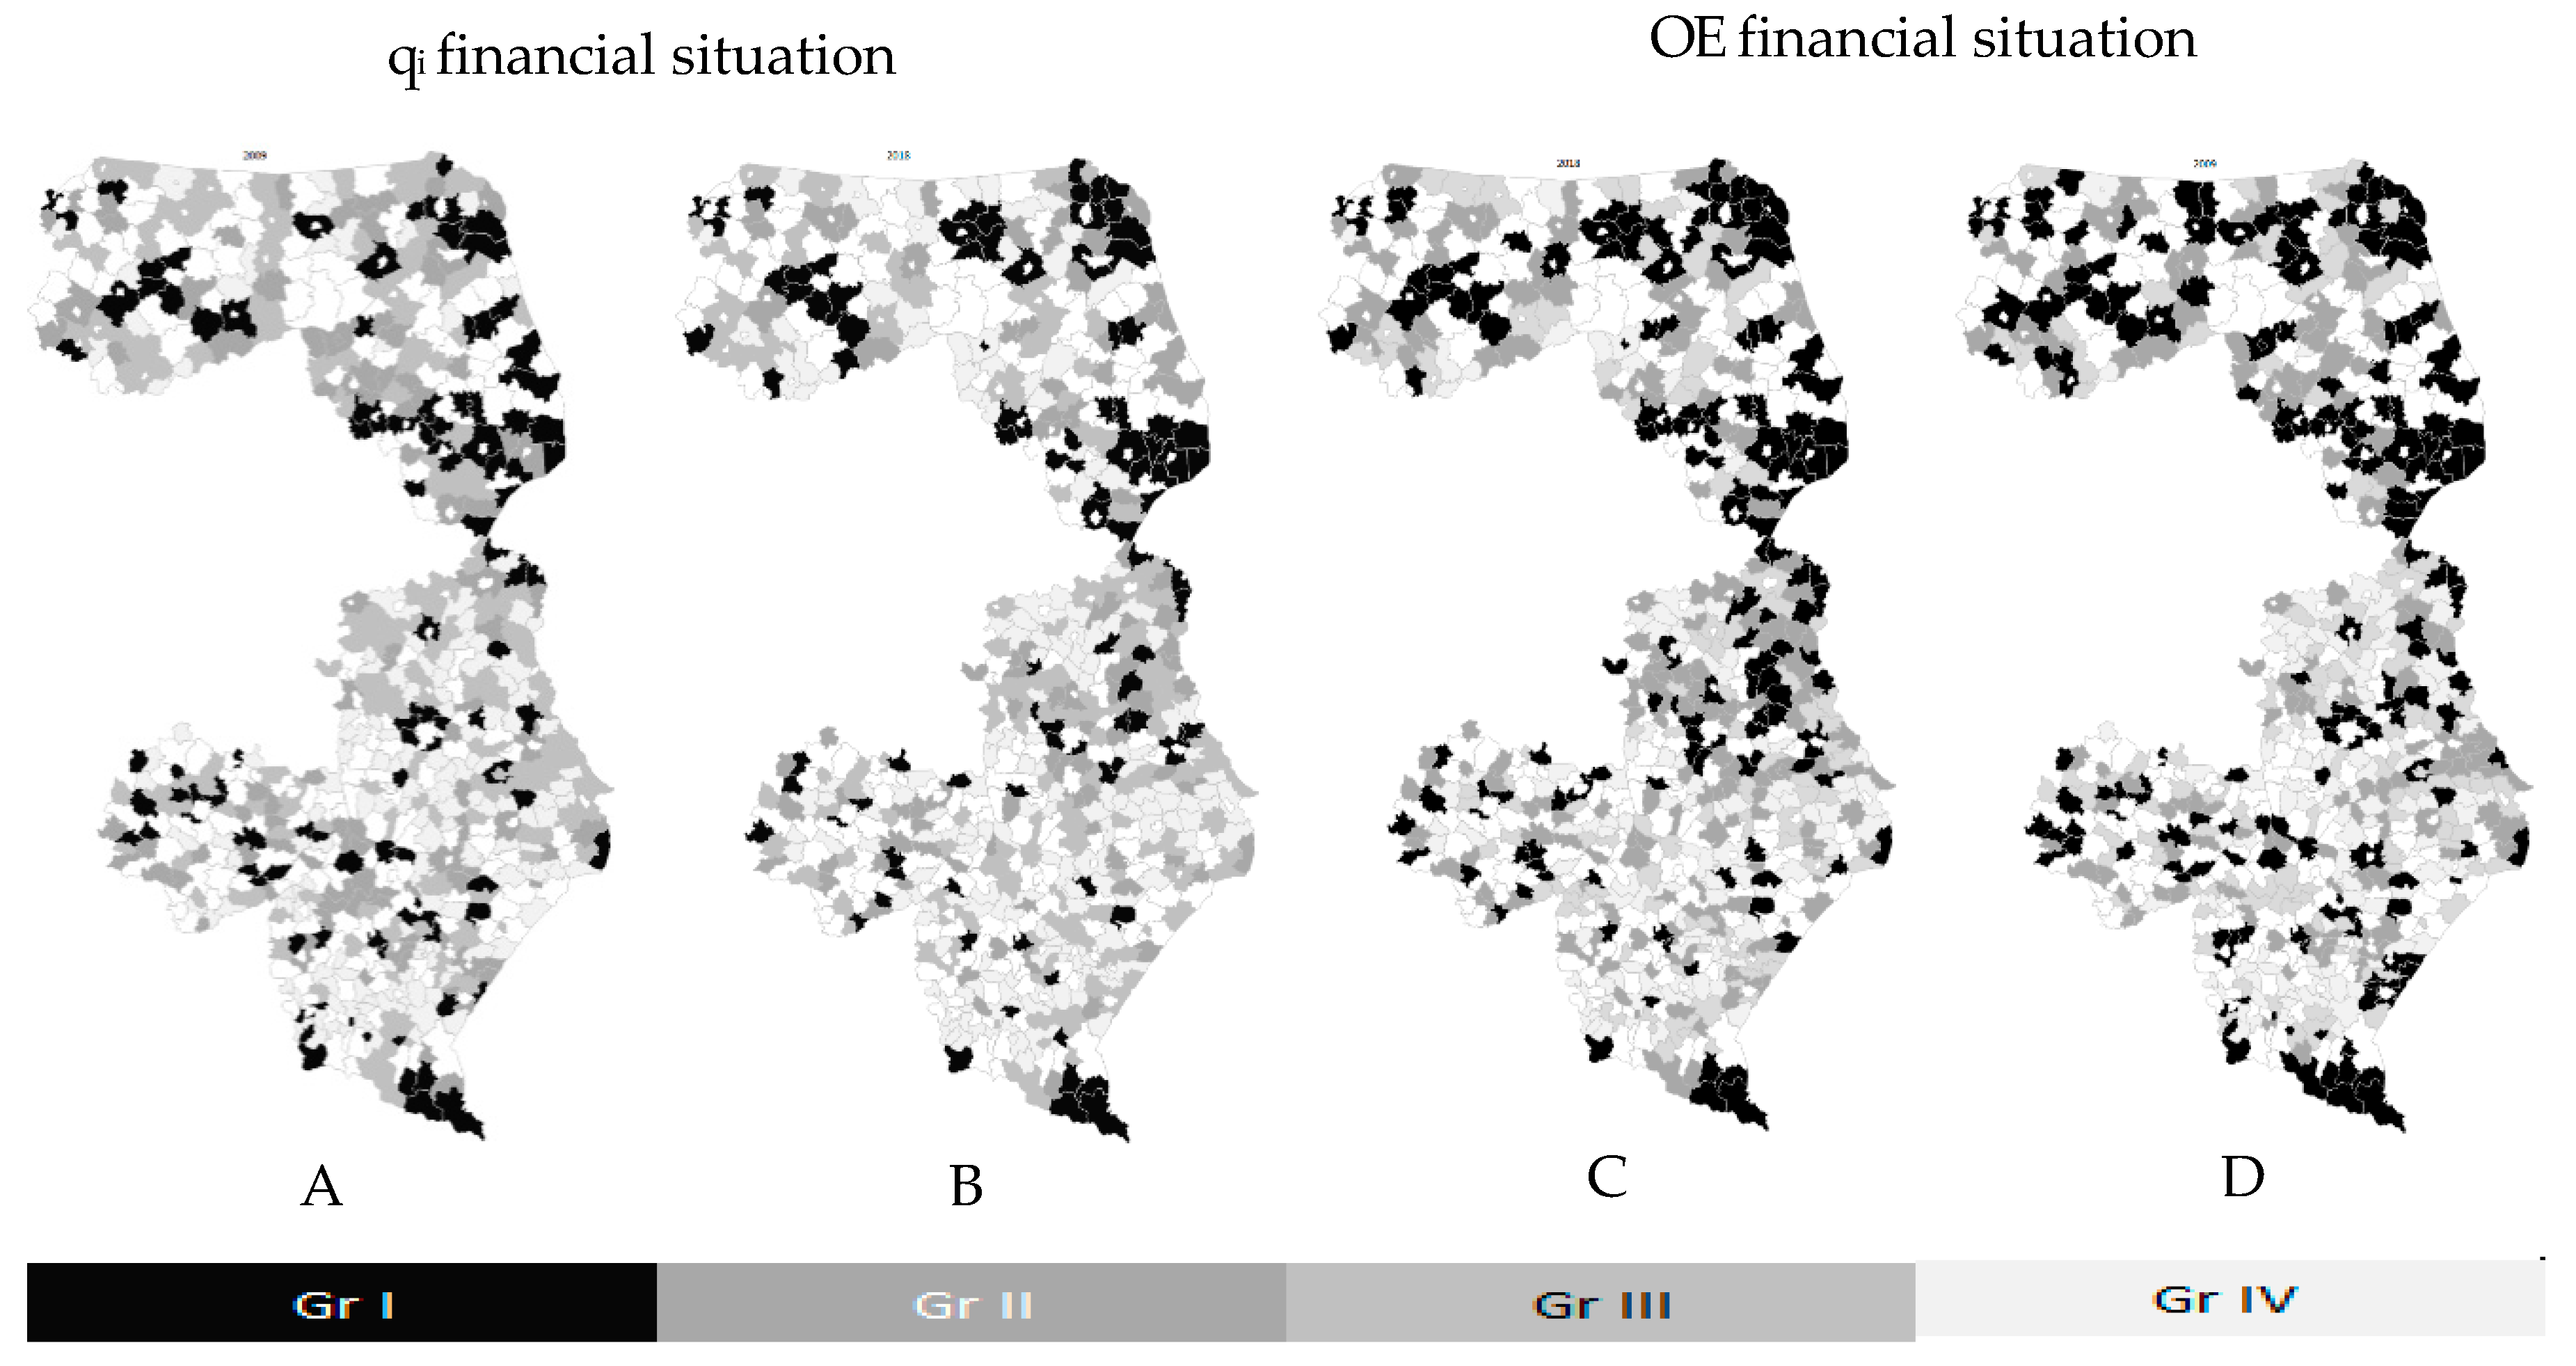
Figure 2 illustrates the classification of rural communes in Eastern Poland due to the financial situation (white is the urban and urban-rural communes not covered by the study, black is the best unit, the lighter the weaker). Classification of communes was based on quartiles, which constituted threshold values for subsequent groups.
The synthetic measure qi of the financial situation ranged from 0.14 to 0.51 in 2018 and from 0.09 to 0.39 in 2009. An increase in the range measure (from 0.30 to 0.37) indicates an increase diversification of units in the aspect of the financial situation. In 2018, the synthetic measure of OE’s financial situation ranged from 0.60 to 0.92, while in 2009 from 0.73 to 0.94. The range value in 2018 was higher (0.32) than in 2009 (0.21), which indicates an increase in the diversity of units in the studied area.
As it results from the conducted research, the first group with the highest level of financial standing according to the qi measure included 126 units (the most from the Lubelskie 40 and Podlaskie 40 voivodships), according to the OE of 138 units (among others from Lubelskie 40, Podlaskie 43, these are two voivodships in which the most common rural communes in eastern Poland), group II found, respectively, 123 and 153 units, in III 142 and 94 units, in the weakest group IV 94 and 99 units.
The first group also included the majority of outliers, i.e., those in which the role of the industrial and tourist function increases significantly at the expense of the agricultural function (its importance is limited, e.g., the commune of Sitkówka-Nowiny in the Świętokrzyskie voivodships). In the analyzed period of 2009–2018, group I is characterized by the greatest differentiation. Units of this group present a measure above average (0.17–0.19 qi; 0.90–0.85 OE), and it includes outliers (for which can be seen as an industrial function, multifunctional development of the area; Table 3).
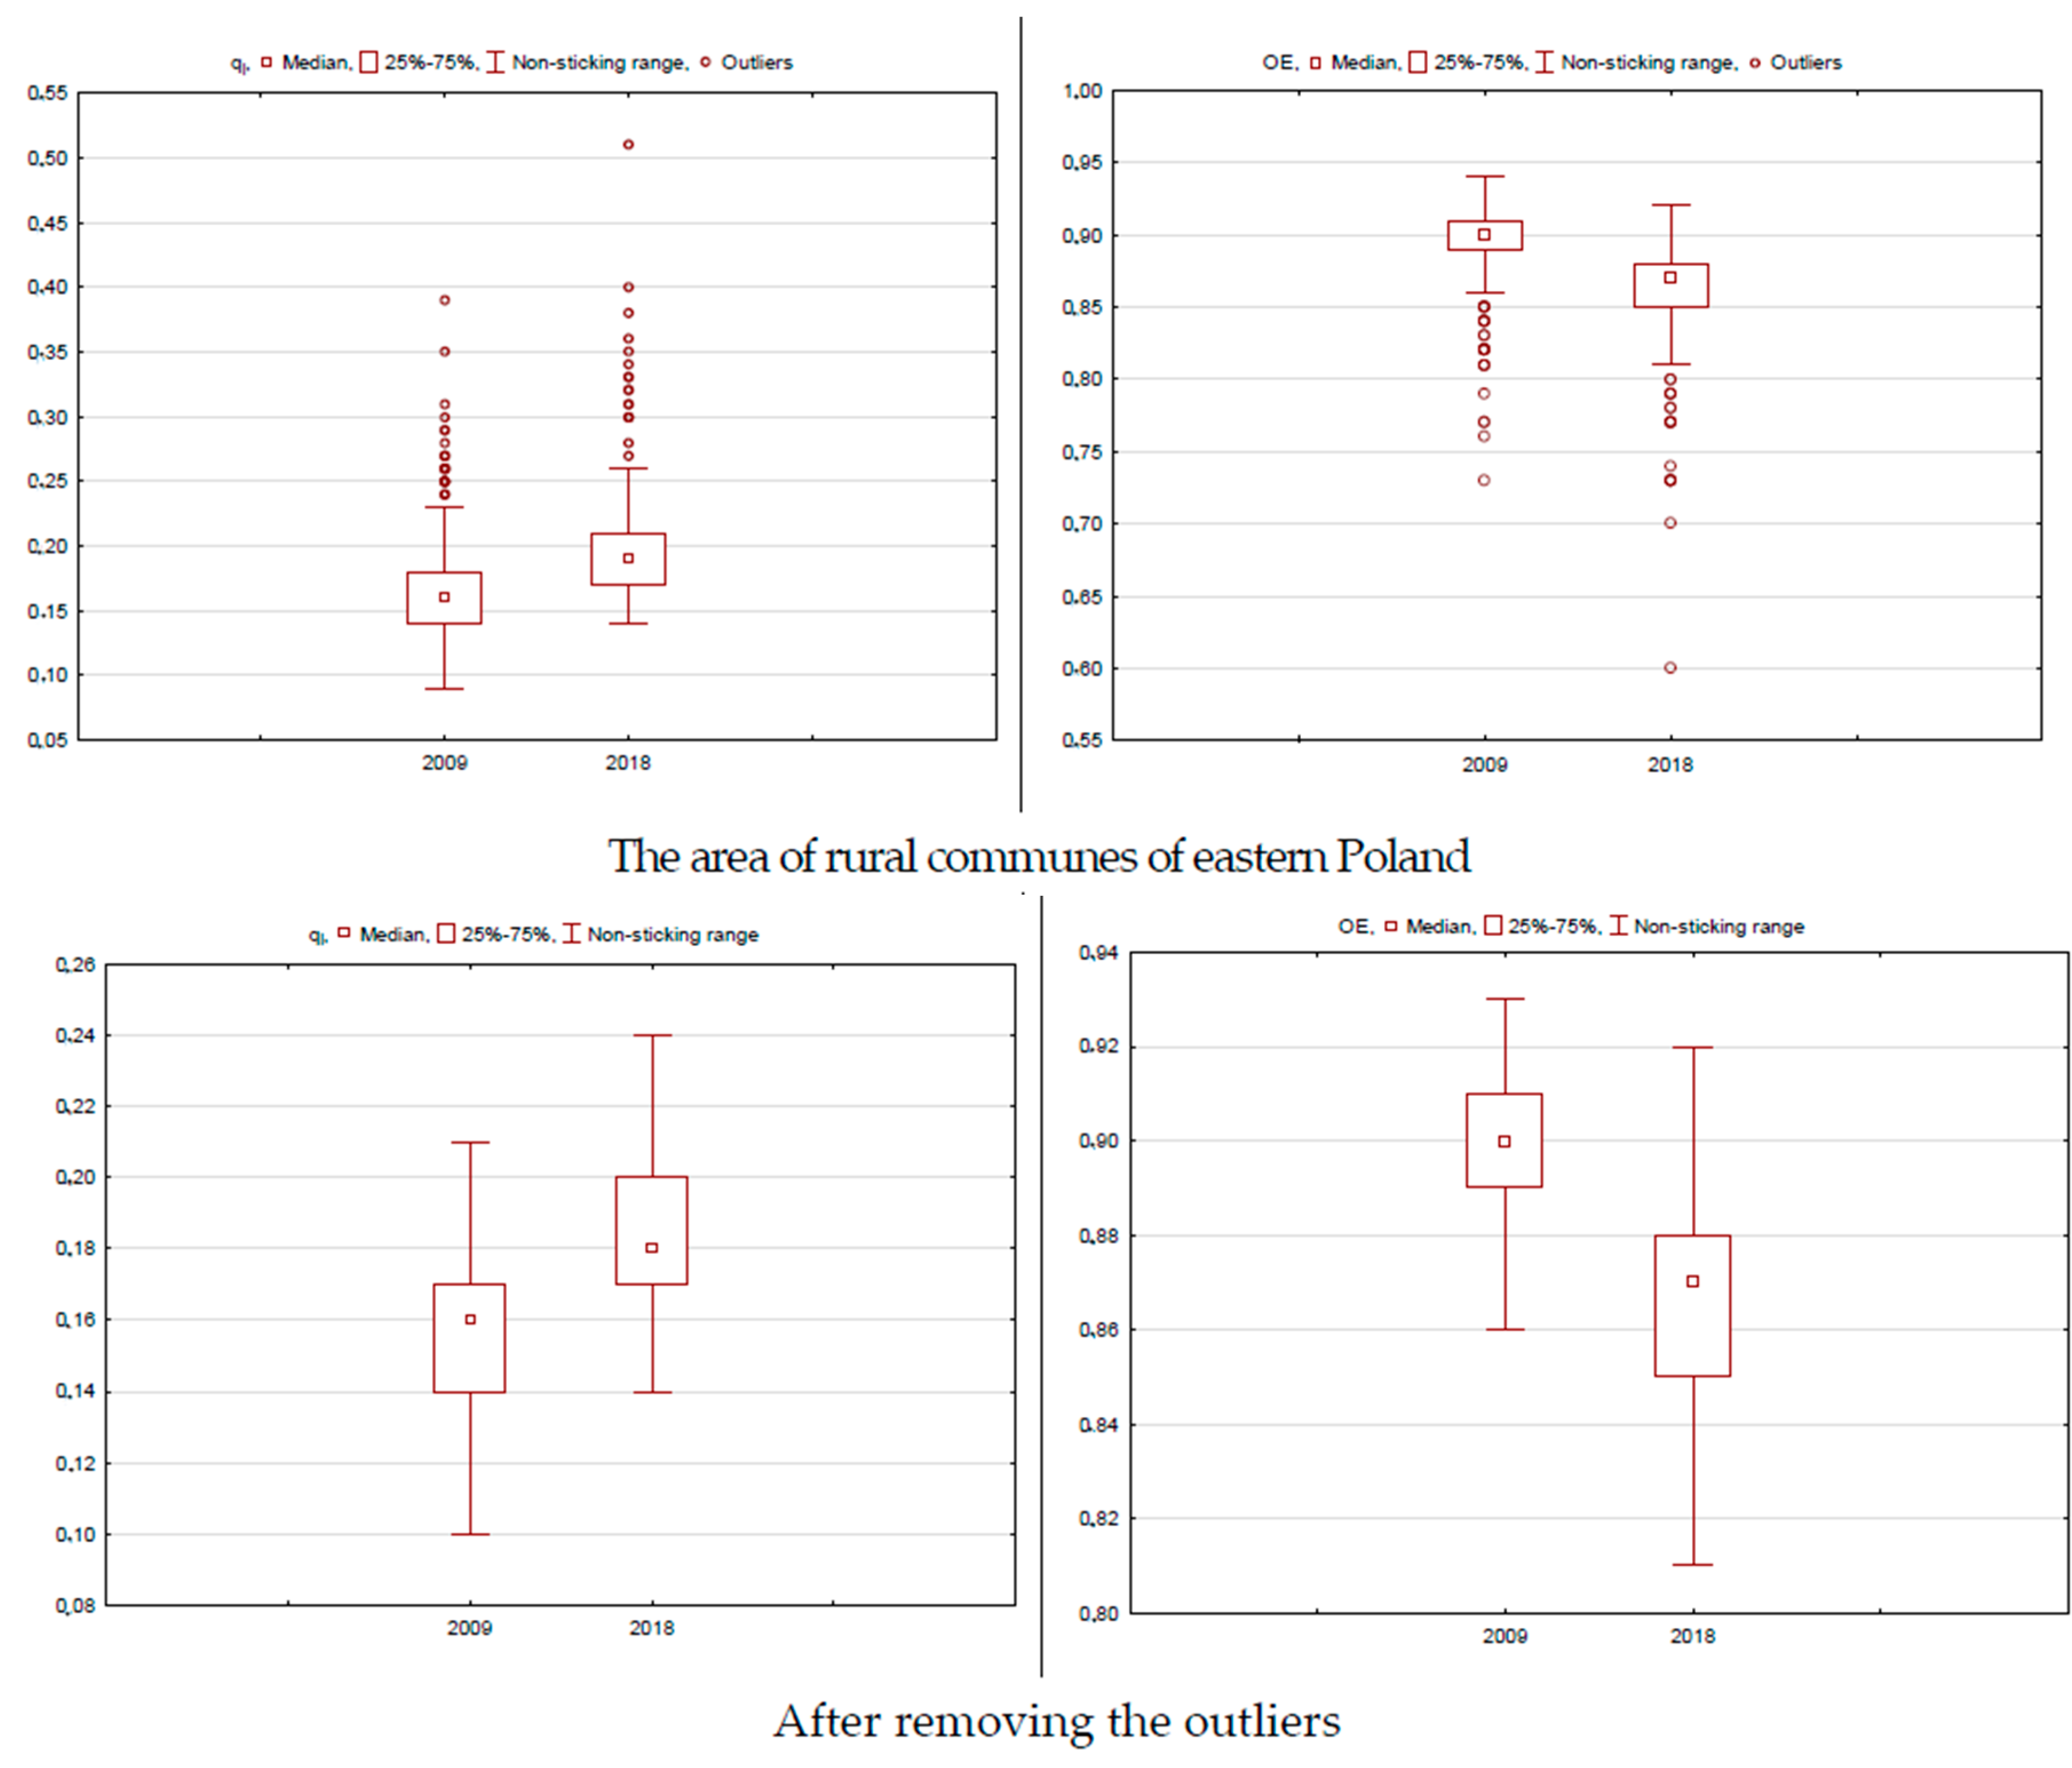
The dispersion analysis (Figure 3) of the measure of the synthetic financial situation of rural communes in eastern Poland in 2009 and 2018 indicates a decrease in diversity. Outliers are characterized by the lowest or highest value of a variable, they make it difficult to carry out a correct analysis, their values are distant from other variables. After removing outliers from the survey, we also observe a decrease in the diversity of rural communes in Eastern Poland voivodships in the studied area.
In the case of qi measure, 18 outliers were separated in 2018 (30 in 2009), in terms of OE measurement 39 and 38 units, respectively. Most of outliers were in the Podkarpackie and Podlaskie voivodships, the least in Świętokrzyskie. Outliers units, regardless of the method of calculating the synthetic measure potential, were usually characterized by a better situation in terms of financial situation, entrepreneurship, infrastructure, demography and the labor market as well as natural environment and development.
Statistical characteristics of the measure of the synthetic financial situation of rural communes in eastern Poland in 2018 compared to 2009 show the stability of the studied phenomenon. The standard deviation was 0.04–0.04 for a qi and 0.03–0.03 for OE. It indicates a small diversity of units in the aspect of financial situation. The classic coefficient of variation (0.21–0.20 qi; 0.03–0.04 OE) shows slight disparities. The range (0.30–0.37 qi; 0.21–0.32 OE) indicates how large the spread between the smallest and the largest value of the variable in the studied area is (Table 4). It indicates small changes in the area under study. After removing outliers from the survey, the measures of differentiation indicate the relative stability of rural communes in voivodships of Eastern Poland.
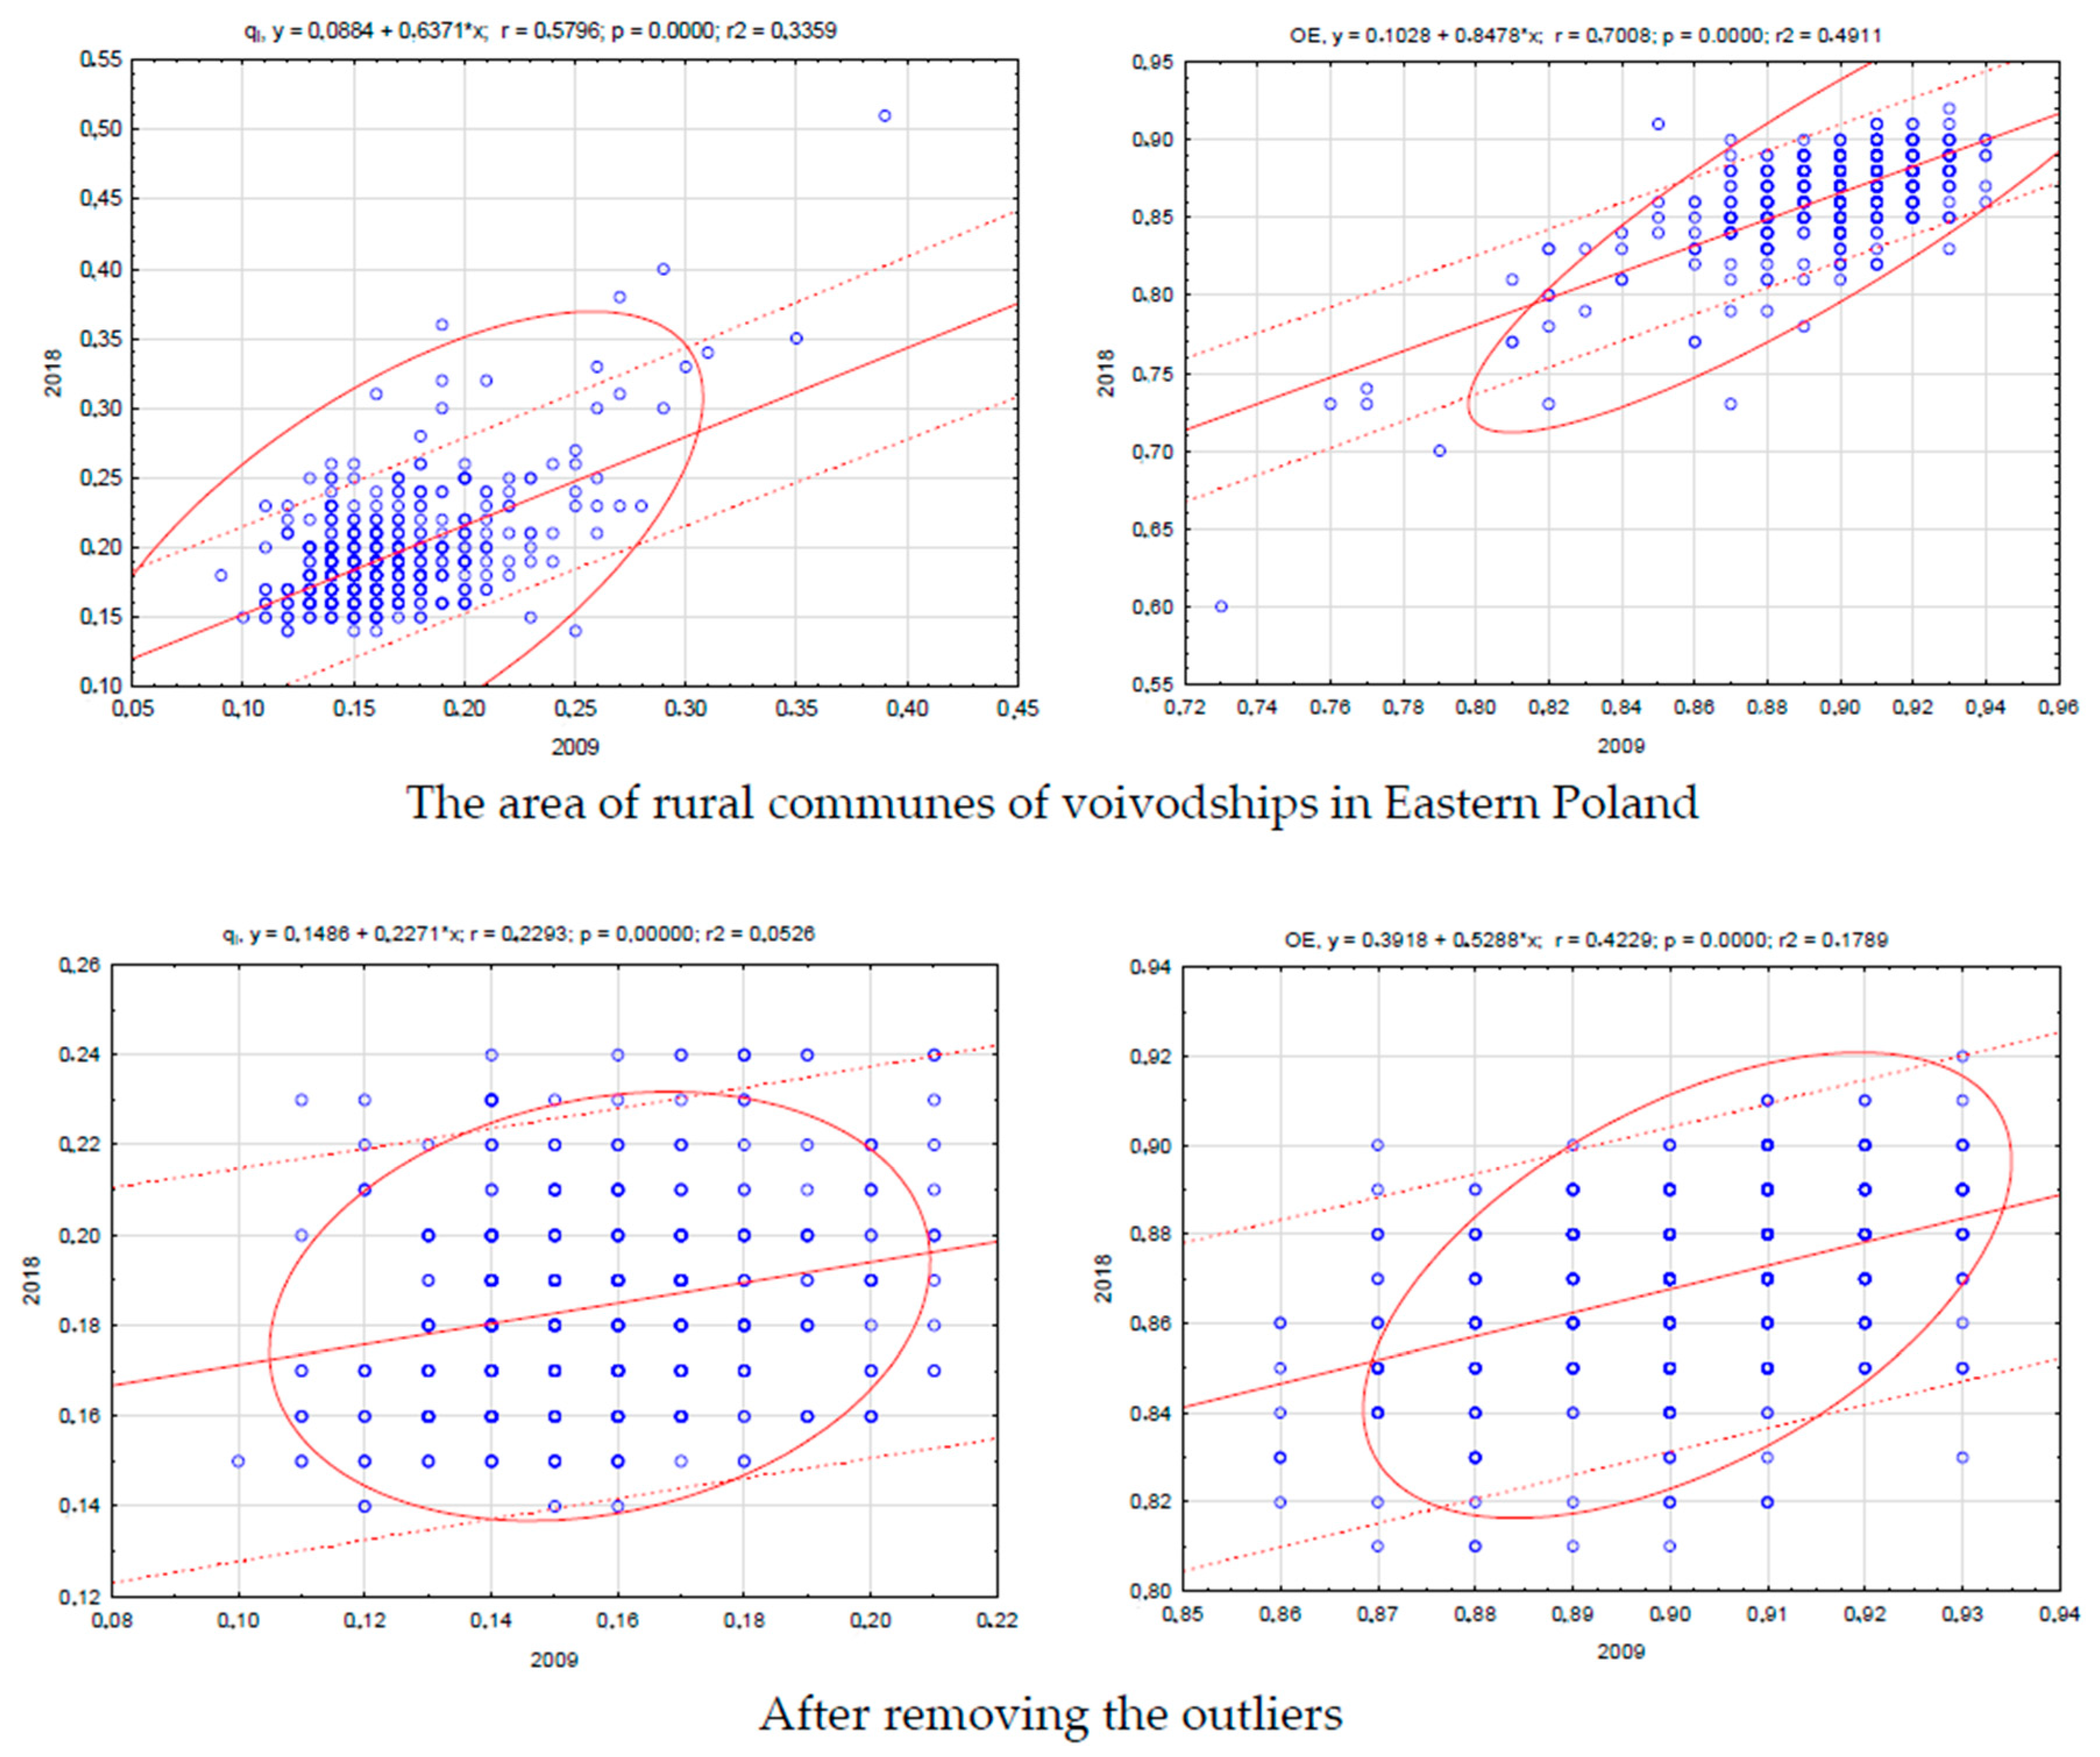
The Pearson correlation coefficient between the value of synthetic measure in 2018 in relation to 2009 according to qi was 0.579 (and 0.229 after removal of outliers from the study), according to OE—0.700 (and 0.422). It can be assumed that the spatial diversity of the studied area was quite stable, and the units reacted similarly to changes in the economy. Outliers were characterized by an industrial function or location in the area of the city’s impact (voivodship’s development center) (Figure 4).
The economic potential of the commune is built, among others, by occupational activity of residents, the local labor market, entrepreneurship, infrastructure, and the state of the natural environment. High economic potential increases living standards, increases production, better social situation, and greater public security. The commune’s potential, resulting from a combination of local conditions, determines its possibilities and development directions.
The financial situation of rural communes in eastern Poland was correlated with own revenues, share in taxes constituting state budget revenues, revenues from local taxes and transfer revenues (from subsidies and subsidies) and expenditure on public administration (which are rigid expenditure). The coefficients inform about the possibility of generating income from own sources. This can be an indicator of sustainable development and allows for more flexible spending, including for investment purposes [67]. The high correlation value with the share in taxes constituting the state budget revenues may indicate that the communes depend on the revenues from the state budget.
The financial situation is also correlated with entities entered into the National Economy Register (REGON), natural persons conducting business activity and working in communes. The economy cannot develop without adequate human potential [68,69]. Rural communes of eastern Poland are characterized by a low correlation measure with natural increase and migration balance. Migrations are a factor causing significant changes in the population level, spatial distribution and in various population structures [70]. The number of economic entities indicates the level of entrepreneurship in the region. This is one of the indicators showing the economic situation of the region. The more entities, the more positive entrepreneurial development impulses affect the economy. There is a clear disproportion between the density of distribution of business entities in the urban center in relation to rural communes (Table 5).
To assess the impact of endogenous potentials of rural communes of Eastern Poland voivodeships on the spatial diversity of the measure of the synthetic financial situation (taking into account the values of correlation measures), a regression model describing the dependence of variables has been estimated taking the form:
where P—Entities entered in the REGON register, F—Foundations, associations and social organizations, L—Population for a public pharmacy, Z—Housing stock, Pn—Population Growth, B—Unemployed persons registered in communes, Pr—Employed in municipalities.
F (financial situation) = ∑ (P, F, L, Z, Pn, B, Pr)
The regression analysis of the measure of the synthetic financial situation and the endogenous potentials of communes allows explaining 0.380469 (qi) 0.438602 (OE) of variable variations. The model indicates the important role of business entities entered into REGON, foundations and associations, population of a generally accessible pharmacy, housing resources and birth rate, as well as the unemployed and those who are racing in the commune. Statistics values F (423,9207 qi; 539.2979 OE) and the corresponding probability level p mean that all parameters are statistically significant. Further increasing the multidimensionality of the model would cause a slight increase in R2 (0.379571 qi; 0.437789 OE), and statistically insignificant variables could enter the model (Table 6 and Table 7).
The significance of economic and social factors for the fiscal situation of the rural communes surveyed is definitely smaller than it results from the subject of research described so far in the literature covering the experience of other regions in this field. The main problem in them is the lack of endogenous factors that is a barrier to self-initiation of development. Labor and endo-ethnic capital resources in this region are shrinking due to wash-out effects. It is important that this process does not damage the absorption capacity necessary for the implementation of sustained development processes.
4. Discussion
A commune is a basic territorial unit whose purpose is to meet the basic needs of local communities and to provide appropriate conditions for the operation and development of economic entities operating on its territory or for socio-economic development [71,72,73,74]. Adequate financial resources at the disposal of the commune are necessary to implement the development and needs of local communities [75,76]. It is pointed out that this development should be based on local resources, including local development factors [77,78]. The commune is forced to constantly adapt to changing environmental conditions, seek competitive advantage in the development process in all aspects of its activity [79]. A. Klasik defines the region’s development as a conjunction of sustainable growth of economic potential, its competitive strength as well as the level and quality of life of its inhabitants. In this sense, development is the resultant (triple helix) of the growth of potential and competitiveness of the economy and the increase in the standard of living and its quality, including the satisfaction of material and non-material needs [80]. W. Dziemianowicz defines regional development as changes in regional productivity measured by population size, employment, income and value of added production [81]. J. Szlachta defines regional development as a systematic improvement in the competitiveness of enterprises and the standard of living of inhabitants, as well as an increase in the region’s economic potential [82]. Sustainability of growth is also emphasized by T. Kudłacz, at the same time pointing to the economic potential of a territorial unit as a source of regional development [83].
Regional development is seen as an economic process involving the transformation of external and internal factors and regional resources into goods and services [84]. It ensures a permanent increase in the standard of living of the inhabitants and economic potential in the scale of a large territorial unit and includes, among others: economic potential and structure, natural environment, spatial and infrastructural development [85]. The factors of local development are changeable in time; therefore, they should be subject to continuous and ongoing analysis.
Sustainable development is understood as building a sustainable and competitive economy that effectively uses its resources, whose goal is to draw on innovative processes and technologies [86,87]. Sustainable development consists in such use and conservation of natural resources and in such orientation of technologies and institutions as to achieve and maintain the satisfaction of human needs of present and future generations [88]. In the definition of sustainable development, H. Komiyama and K. Takeuchi emphasize, along with the elimination of growth barriers, environmental protection and the possibility of renewing resources, which is particularly important in new global conditions [89]. It includes the creation of a socio-economic system that will provide support for the following objectives: increase in real income, increase in education, improvement of population health and quality of life [90,91]. Sustainable development is a process integrating human activity reduced to three dimensions: economic, social and environmental [92,93]. The economic aspect means meeting today’s needs and securing the resources necessary to meet the needs of future generations. The ecological aspect means establishing the boundaries of the natural system for human activities and not exceeding them. The social aspect is identified with education and obtaining the ability to solve major social problems as well as participation in the development processes of the entire system [93].
Development is a multidimensional process of qualitative and quantitative changes, based on the rational use of local resources. The multidimensionality of the development process is demonstrated by the directions of municipalities as a local multidimensional system of interdependent and related economic, social, infrastructural and natural factors. These activities are usually focused on goals, among which should be distinguished long-term development, increase in income of residents and the budget, development of entrepreneurship. Therefore, development is associated with two priorities: optimal use of endogenous resources and building social, economic and territorial cohesion.
Municipalities should have the ability to settle liabilities, raise revenues and spend their funds effectively. Financial resources are the basis for the operation of local government units, conditioning the implementation of their current and development tasks. Their analysis allows us not only to assess the structure of the budget itself, but also indirectly provides information on the state of the local economy. Financial resources are an element necessary for the effective implementation of the units’ objectives in terms of current or development tasks. Feedback occurs between socio-economic and financial variables [94,95]. Finances allow for a comprehensive assessment of the operation of a local government unit and its development opportunities.
JW Douglas and RK Gaddie refer the financial situation to the possibility of timely fulfillment of financial obligations and ensuring continuity in the provision of services [96]. The financial situation of local government, as JL Perry and RK Christensen point out, can be defined as the certainty of repayment of liabilities towards, among others clients and employees by the authorities [97]. The financial situation of a commune can be defined as the state of its finances, which is the result of the authorities’ activities aimed at generating sufficient funds to settle obligations within a specified period of time [98].
RI Berne and R. Schramm include the main conditions of the financial situation, among others including the needs of the local community, supply sizes and directions of distribution of local public goods and services, labor costs, capital and other factors of production, wealth of the society and way of conducting financial policy [99]. HF Ladd emphasizes the impact of demographic conditions on the condition of local government finances, arguing, among others, that higher population density leads to an increase in local government expenditure. Excessive population growth leads to a weakening of the financial situation in local government units and a reduction in the scope of public services they offer [100]. MP Rodríguez Bolívar and co-authors identified as the main factors shaping the financial situation, among others, are status and changes in the population size, local labor market conditions, increase in local government expenditure and public finance management [101]. X. Wang, L. Dennis and Y. Sen believe that the socio-economic environment is only one of the factors that should be taken into account when analyzing the financial situation [102,103].
The financial situation is complex and influenced by many factors. Despite the difficulties posed by its measurement, having knowledge about the current state of finances of local government units is undoubtedly necessary. This knowledge allows local authorities to make comparisons with other entities and is helpful in making financial decisions. The financial situation cannot be described by one indicator, based, for example, on the financial statements, budget [14]. Assessment of the financial situation of municipalities allows to determine not only the efficiency of these units, i.e., the ability to meet their obligations, but also the possibility of raising the quality standard of services they provide to local communities. For the analysis of the financial situation, among others, level of income, financial independence, amount of investment expenditure, financial result achieved by the commune [16].
A. Standard [95] assessed the relationship between the financial situation and the geographic location of communes, their type and technical infrastructure. The article indicated that the communes located directly next to a large city are in the best financial situation, while the peripheral location is associated primarily with a lower income potential. It also reduces investment opportunities. Taking into account the equipment with technical infrastructure, it has been shown that those units with the highest level of development are also characterized by the most favorable financial situation.
The analyzes carried out by R. Głowicka-Wołoszyn and F. Wysocki [104] showed that there are significant differences in the level and structure of communes’ income. Rural communes with a good financial situation were characterized by a higher share of own income in total income, a higher level of income from property taxes and income from the share in the tax on natural persons. The greatest role in providing financial support to the budgets of communes with the best financial standing was played by their own revenues, which ensured local self-governments’ decision-making independence in the area of spending. A disadvantageous phenomenon in the case of rural communes was the low efficiency of agricultural tax as a source of communes’ income.
M. Stanny and W. Strzelczyk [16] presented a number of empirical indicators (i.e., fiscal and liability solvency, financial independence, dependence on transfers from the state budget and the degree of financing of public services) used in the assessment of the financial situation. Using in the analyses the achievements of spatial economy (J. Friedmann’s theory of polarized development, the concept of the core and periphery concept), the authors explained the asymmetric relations in favor of central areas with a high development potential (financial situation) compared to other areas located peripherally to the core. It has been proved that municipalities with a relatively high level of financial situation are concentrated mainly in the suburban zones of large voivodeship centers (on the center-periphery line). It was also indicated that the level of socio-economic development and financial condition showed interdependence.
Financial determinants, as indicated by J. Zawora [105,106]), related to the budgetary situation of municipalities play an important role among the factors influencing the stimulation of local development. The occurrence of regional development disproportions affects the spatial differentiation of the financial situation, also the relationship between the state of socio-economic development in a given area and the income situation of the commune, and their lower scope of financial independence.
5. Conclusions
As a result of the study, it was found that the group of rural communes with the best financial situation (group I) constituted 26.03% of all units surveyed in the case of the qi measure; 28.51% for the OE measure. In group (IV) of the weakest units there were 19.41%—qi and 20.45%—OE. Diversification in the analytical aspect seems to be internally shaped by urban centers (Kielce, Rzeszów, Lublin, Białystok, Olsztyn and Elbląg), which may significantly overstate the statistics. It is also influenced by geographical location, implemented function (i.e., agricultural, industrial and/or tourist), local economic potential. Undertaken actions in this respect should focus on achieving social, economic and spatial cohesion. It is also important to indicate the development profile of the commune (e.g., promotion of specialized tourism instead of agriculture), which should become a significant asset of the commune.
The obtained results of the analyses indicate a positive correlation between the measure of financial situation and the level of socio-economic development. They also indicate that a higher level of financial situation and socio-economic development is associated with a lower share of transfers of public funds or higher levels of own income. Local authorities should primarily improve the economic potential, which will increase the attractiveness of the land and attract new entrepreneurs, create new jobs and improve the quality of life of residents. It should also contribute to the improvement of the income structure and strengthening of financial independence.
Neighboring rural communes with strong centers have a weaker financial situation, which may be related to the wash-out effects. Modern residents of communes use the technical and social infrastructure of neighboring communes. This is important in the context of the polarization and diffusion model of regional policy implementation. It should lead to reducing developmental differences (strengthening territorial cohesion). High municipalities’ potential increases the standard of living, better social situation and better public safety. The main problem in them is the lack of endogenous factors that is a barrier to self-initiation of development. Labor and endo-ethnic capital resources in this region are shrinking due to wash-out effects. It is important that this process must not damage the absorption capacity necessary for the implementation of sustained development processes.
The low ratio of the share of own revenues in total revenues results from the small possibilities of shaping rural communes of this size. The low rate of the share of investment expenditure in total expenditure may result from rigid expenditure, e.g., related to social policy, expenditure on administration. A significant share of revenues from subsidies (transfers from the state budget) in the total revenues of rural communes weakens their independence. It seems that the main reason for the relatively small impact of financial conditions on economic and social development is their strong dependence on transfer revenues transferred from the state budget and the amount of current expenditure. The above circumstances stiffen and stabilize the financial economy, making it relatively less susceptible to the influence of other factors. Low independence can therefore constitute a significant barrier to future local development.
The method used showed significant disproportions between the financial situation of the examined rural communes of eastern Poland. The obtained results confirmed the usefulness of synthetic measures to assess complex phenomena. The obtained results may constitute for the local authorities an important source of information on the disproportions occurring between units on setting out potential directions for optimizing the structure of local finances.
The results indicate the directions of new studies, which include, among others, comparison of the results of ordering based on a larger number of variables describing the state of the financial situation, comparison of the results of linear ordering with another method, e.g., cluster analysis, the local statistics of I Moran, conducting analysis in terms of dynamic over a specific extended period of time to learn about change trends. The results also indicate the need to analyze outliers and determine their impact on the financial situation of rural communes.
Author Contributions
Conceptualization, P.D. and P.P.; methodology, P.D. and P.P.; software, P.D. and P.P.; validation, P.D. and P.P.; formal analysis, P.D. and P.P.; investigation, P.D. and P.P.; resources, P.D. and P.P.; data curation, P.D. and P.P.; writing—original draft preparation, P.D. and P.P.; writing—review and editing, P.D. and P.P.; visualization, P.D. and P.P.; supervision, P.D. and P.P.; project administration, P.D. and P.P.; funding acquisition, P.D. and P.P. All authors have read and agreed to the published version of the manuscript.
Funding
The APC was funded by UTP University of Science and Technology in Bydgoszcz, Poland, grant number BN 39/2019.
Conflicts of Interest
The authors declare no conflict of interest.
References
- Churski, P.; Kołsut, B. Potencjał rozwojowy gminy Powidz w okresie postępującej endogenizacji procesów rozwoju. Rozw. Reg. I Polityka Reg. 2017, 40, 35–52. [Google Scholar]
- Pichierri, A. Concertation and Local Deavelopment. Int. J. Reg. Res. 2002, 26, 689–706. [Google Scholar]
- Maitah, M.; Toth, D.; Smutka, L.; Maitah, K.; Jarolínová, V. Income Differentiation as a Factor of Unsustainability in Forestry. Sustainability 2020, 12, 4749. [Google Scholar] [CrossRef]
- Malina, A. Analiza przestrzennego zróżnicowania poziomu rozwoju społeczno-gospodarczego województw Polski w latach 2005–2017. Nierówności Społeczne Wzrost Gospod. 2020, 61, 138–155. [Google Scholar] [CrossRef]
- Szewczuk, A.; Kogut-Jaworska, M.; Zioło, M. Rozwój lokalny i regionalny—główne determinanty. In Rozwój Lokalny I Regionalny, Teoria I Praktyka; Wydawnictwo CH Beck: Warszawa, Poland, 2011. [Google Scholar]
- Jastrzębska, M. Zarządzanie Finansami Gmin: Aspekty teoretyczne; Uniwersytet Gdański: Gdańsk, Poland, 1999. [Google Scholar]
- SEJM. Ustawa z dnia 8 marca 1990 r. o samorządzie gminnym. Diennik Ustaw J. Laws 1990, 16, 95. [Google Scholar]
- Milczarek, D. Potencjał Unii Europejskiej w stosunkach międzynarodowych (część 1). Studia Eur. 2005, 1, 9–18. [Google Scholar]
- Kamińska, W.; Hoffner, K. Potencjał rozwojowy obszarów wiejskich woj. świętokrzyskiego a polityka spójności. In Polityka Spójności a Rozwój Obszarów Wiejskich, Stare problemy I Nowe Wyzwania; Kiniorska, I., Ed.; Polska Akademia Nauk Komitet Przestrzennego Zagospodarowania Kraju, t. CLVI: Warszawa, Poland, 2014; pp. 358–378. [Google Scholar]
- Churski, P.; Borowczak, A.; Dolata, M.; Dominik, J.; Hauke, J.; Perdał, R.; Konecka-Szydłowska, B. Czynniki rozwoju obszarów wzrostu i obszarów stagnacji gospodarczej w Polsce; Uniwersytet im: Poznań, Poland, 2013. [Google Scholar]
- Stanny, M.; Strzelczyk, W. Zróżnicowanie przestrzenne sytuacji dochodowej gmin a rozwój społeczno-gospodarczy obszarów wiejskich w Polsce. Rocz. Nauk. Stowarzyszenia Ekon. Rol. I Agrobiz. 2015, 17, 301–307. [Google Scholar]
- Dziekański, P.; Pawlik, A. Intraregional diversification of the level of the financial situation of the poviats of Eastern Poland in relation to the development potential. Balt. J. Econ. Stud. 2019, 5. [Google Scholar] [CrossRef] [Green Version]
- Dziekański, P. Diversification Synthetic Indicator for Evaluating the Financial Capacity of Local Government the Case of Polish Voivodeships. Acta Univ. Agric. Et Silvic. Mendel. Brun. 2017, 65, 611–619. [Google Scholar] [CrossRef] [Green Version]
- Hendrick, R. Assessing and measuring the fiscal health of local government: Focus on Chicago suburban municipalities. Urban Aff. Rev. 2004, 40, 78–114. [Google Scholar] [CrossRef]
- Aleksandrova-Zlatanska, S.K. Ocena czynników stabilności fiskalnej gmin wiejskich: Przypadek Bułgarii, Problems of Agricultural Economics. Zagadnienia Ekon. Rolnej 2019, 3, 156–170. [Google Scholar] [CrossRef]
- Stanny, M.; Strzelczyk, W. Kondycja Finansowa Samorządów Lokalnych a Rozwój Społeczno-Gospodarczy Obszarów Wiejskich, Ujęcie Przestrzenne; Wydawnictwo Naukowe Scholar: Warszawa, Poland, 2018. [Google Scholar]
- Parysek, J.J. Podstawy Gospodarki Lokalnej; Wyd Nauk UAM: Poznań, Poland, 1997. [Google Scholar]
- Polska Wschodnia Program Operacyjny, Polska Wschodnia 2014–2020. Available online: https://www.polskawschodnia.gov.pl/media/1278/Program_Polska_Wschodnia_2014_2020.pdf (accessed on 2 February 2020).
- Quaranta, G.; Citro, E.; Salvia, R. Economic and Social Sustainable Synergies to Promote Innovations in Rural Tourism and Local Development. Sustainability 2016, 8, 668. [Google Scholar] [CrossRef] [Green Version]
- Jutengren, G.; Jaldestad, E.; Dellve, L.; Eriksson, A. The Potential Importance of Social Capital and Job Crafting for Work Engagement and Job Satisfaction among Health-Care Employees. Int. J. Environ. Res. Public Health 2020, 17, 4272. [Google Scholar] [CrossRef] [PubMed]
- Chai, C.-L.; Ueland, K.; Phiri, T. The Use of Human Capital and Limitations of Social Capital in Advancing Economic Security among Immigrant Women Living in Central Alberta, Canada. Soc. Sci. 2018, 7, 220. [Google Scholar] [CrossRef] [Green Version]
- Yaméogo, T.B.; Fonta, W.M.; Wünscher, T. Can Social Capital influence Smallholder Farmers’ Climate-Change Adaptation Decisions? Evidence from Three Semi-Arid Communities in Burkina Faso, West Africa. Soc. Sci. 2018, 7, 33. [Google Scholar] [CrossRef] [Green Version]
- Falk, I.; Kilpatrick, S. What is social capital? A study of interaction in a rural community. Sociol. Rural. 2000, 40, 87–110. [Google Scholar] [CrossRef] [Green Version]
- Bhandari, H.; Yasunobu, K. What is social capital? A comprehensive review of the concept. Asian J. Soc. Sci. 2009, 37, 480–510. [Google Scholar] [CrossRef]
- Woolcock, M.; Narayan, D. Social capital: Implications for development theory, research, and policy. World Bank Res. Obs. 2000, 15, 225–249. [Google Scholar] [CrossRef] [Green Version]
- Fukuyama, M.F. Social capital and civil society. Int. Monet. Fund Working Paper, Working Paper 00/74. 2000. Available online: https://www.imf.org/en/Publications/WP/Issues/2016/12/30/Social-Capital-and-Civil-Society-3547 (accessed on 1 March 2000).
- Fang, X.; Zhou, B.; Tu, X.; Ma, Q.; Wu, J. “What Kind of a Science is Sustainability Science?” An Evidence-Based Reexamination. Sustainability 2018, 10, 1478. [Google Scholar] [CrossRef] [Green Version]
- Baumgartner, R.J. Sustainable Development Goals and the Forest Sector—A Complex Relationship. Forests 2019, 10, 152. [Google Scholar] [CrossRef] [Green Version]
- Meschede, C.; Mainka, A. Including Citizen Participation Formats for Drafting and Implementing Local Sustainable Development Strategies. Urban Sci. 2020, 4, 13. [Google Scholar] [CrossRef] [Green Version]
- Ngo Dang, T.; Tran Thuy, C.; Tran Van, Y.; Nguyen Thanh, T. Sets of Sustainable Development Indicators in Vietnam: Status and Solutions. Economies 2018, 6, 1. [Google Scholar] [CrossRef] [Green Version]
- Tang, L.; Wang, D. Optimization of County-Level Land Resource Allocation through the Improvement of Allocation Efficiency from the Perspective of Sustainable Development. Int. J. Environ. Res. Public Health 2018, 15, 2638. [Google Scholar] [CrossRef] [PubMed] [Green Version]
- Hellwig, Z. Zastosowanie metody taksonomicznej do typologicznego podziału krajów ze względu na poziom rozwoju oraz zasoby i strukturę wykwalifikowanych kadr. Przegląd Stat. 1968, 4, 307–327. [Google Scholar]
- Dziekański, P. Spatial Differentiation of the Financial Condition of the Świętokrzyskie Voivodship Counties. Barom. Reg. 2016, 14, 79–91. [Google Scholar]
- Grabiński, T. Metody określania charakteru zmiennych w wielowymiarowej analizie porównawczej. Zesz. Nauk. Akad. Ekon. W Krakowie 1985, 213, 35–63. [Google Scholar]
- Malina, A.; Zieliaś, A. Taksonomiczna analiza przestrzennego zróżnicowania jakości życia ludności w Polsce w 1994 r. Ekonometryczne Modelowanie Danych Finansowo-Księgowych; Nowak, E., Urbaniak, M., Eds.; UMCS: Lublin, Poland, 1996; pp. 85–89. [Google Scholar]
- Malina, A. Wielowymiarowa Analiza Przestrzennego Zróżnicowania Struktury Gospodarki Polski Według Województw; Wyd Akademii Ekonomicznej w Krakowie: Kraków, Poland, 2004; pp. 96–97. [Google Scholar]
- Walesiak, M. Problemy selekcji i ważenia zmiennych w zagadnieniu klasyfikacji. Pr. Nauk. Akad. Ekon. We Wrocławiu 2005, 1076, 106–118. [Google Scholar]
- Podolec, B.; Zając, K. Ekonometryczne Metody Ustalania Rejonów Konsumpcyjnych; PWE: Warszawa, Poland, 1978; p. 20. [Google Scholar]
- Gorzelak, G. Dobór zmiennych w statystycznej analizie porównawczej–metody (I). Wiadomości Stat. 1979, 3, 17–21. [Google Scholar]
- Kolenda, M. Zamiana cechy na stymulantę, Prace Naukowe Akademii Ekonomicznej we Wrocławiu. Ekonometria 2003, 11, 110–127. [Google Scholar]
- Wysocki, F.; Lira, J. Statystyka Opisowa; Wyd AR: Poznań, Poland, 2005. [Google Scholar]
- Młodak, A. Analiza Taksonomiczna W Statystyce Regionalnej; Centrum Doradztwa i Informacji Difin: Warszawa, Poland, 2006. [Google Scholar]
- Kukuła, K. Metoda Unitaryzacji Zerowanej; PWN: Warszawa, Poland, 2000. [Google Scholar]
- Wójcik-Leń, J.; Leń, P.; Mika, M.; Kryszk, H.; Kotlarz, P. Studies regarding correct selection of statistical methods for the needs of increasing the efficiency of identification of land for consolidation—A case study in Poland. Land Use Policy 2000, 87. [Google Scholar] [CrossRef]
- Andrzej, B.Ą.K. Zastosowanie metod wielowymiarowej analizy porównawczej do oceny stanu środowiska w województwie dolnośląskim. Wiad. Stat. 2018, 1, 7–20. [Google Scholar]
- Behzadian, M.; Khanmohammadi Otaghsara, S.; Yazdani, M.; Ignatius, J. A state-of the-art survey of TOPSIS applications. Expert Syst. Appl. 2012, 39, 13051–13069. [Google Scholar] [CrossRef]
- Zalewski, W. Zastosowanie metody TOPSIS do oceny kondycji finansowej spółek dystrybucyjnych energii elektrycznej. Ekon. I Zarządzanie 2012, 4, 137–145. [Google Scholar]
- Bieniasz, A.; Gołaś, Z.; Łuczak, A. Zróżnicowanie kondycji finansowej gospodarstw rolnych wyspecjalizowanych w chowie owiec i kóz w krajach Unii Europejskiej. Rocz. Ekon. Rol. I Rozw. Obsz. Wiej. 2013, 100, 168–181. [Google Scholar]
- Pietrzak, M.B. The problem of the inclusion of spatial dependence within the TOPSIS Method. Montenegrin J. Econ. 2016, 12, 69–86. [Google Scholar] [CrossRef] [PubMed]
- Jahanshahloo, G.R.; Lotfi, F.H.; Izadikhah, M. An Algorithmic Method to Extend {TOPSIS} for Decision-Making Problems with Interval Data. Appl. Math. Comput. 2006, 2, 1375–1384. [Google Scholar] [CrossRef]
- Velasquez, M.; Hester, P.T. An Analysis of Multi-Criteria Decision Making Methods. Int. J. Oper. Res. 2013, 2, 56–66. [Google Scholar]
- Zavadskas, E.K.; Zakarevicius, A.; Antucheviciene, J. Evaluation of ranking accuracy in multi-criteria decisions. Informatica 2006, 17, 601–618. [Google Scholar] [CrossRef]
- Wysocki, F. Metody statystycznej analizy wielowymiarowej w rozpoznawaniu typów struktury przestrzennej rolnictwa. Rocz. AR W Pozn. Ser. Rozpr. Nauk. 1996, 266, 1–176. [Google Scholar]
- Trojak, M.; Tokarski, T. Statystyczna Analiza Przestrzennego Zróżnicowania Rozwoju Ekonomicznego I Społecznego Polski; Wyd UJ: Kraków, Poland, 2013. [Google Scholar]
- Tokarski, T.; Jabłoński, Ł. Taksonomiczne wskaźniki przestrzennego zróżnicowania rozwoju powiatów. Studia Prawno Ekon. 2010, 81, 261–289. [Google Scholar]
- Nowak, E. Metody Taksonomiczne W Klasyfikacji Obiektów Społeczno-Gospodarczych; PWE: Warszawa, Poland, 1990; p. 190. [Google Scholar]
- Zeliaś, A.; Malina, A. O budowie taksonomicznej miary jakości życia. Syntetyczna miara rozwoju jest narzędziem statystycznej analizy porównawczej. Taksonomia 1997, 4, 238–262. [Google Scholar]
- Hawkins, D. Identification of Outliers; Chapman and Hall: London, UK, 1980. [Google Scholar]
- Tukey, J.W. Exploratory Data Analysis; Addison-Wesley: Boston, MA, USA, 1977. [Google Scholar]
- Chromiński, K.; Tkacz, M. Comparisonof outlier detection methods in biometrical date. J. Med. Inform. Technol. 2010, 16, 89–94. [Google Scholar]
- Maddala, G.S. Ekonometria; PWN: Warszawa, Poland, 2007. [Google Scholar]
- Górecki, T. Podstawy Statystyki z przykładami w R.; Wydanictwo BTC: Legionowo, Poland, 2011. [Google Scholar]
- Welfe, A. Ekonometria. Metody I Ich Zastosowanie; PWE: Warszawa, Poland, 2009. [Google Scholar]
- Gigerenzer, G. Mindless statistics. J. Socio Econ. 2004, 35, 587–606. [Google Scholar] [CrossRef]
- Conover, W.J.; Ronald, L. Iman, Rank Transformations as a Bridge Between Parametric and Nonparametric Statistics. Am. Stat. 1981, 35, 124–129. [Google Scholar] [CrossRef]
- Gruszczyński, M.; Książek, M.; Bazyl, M. Mikroekonometria. Modele i metody Analizy Danych Indywidualnych; Oficyna a Wolters Kluwer business: Warszawa, Poland, 2010. [Google Scholar]
- Satoła, Ł. Municipal infrastructure and the Level of Fiscalism in Local Taxes. In Proceedings of the International Scientific Conference “Economic Sciences for Agribusiness and Rural Economy”, Warsaw, Poland, 7–8 June 2018; pp. 370–375. [Google Scholar] [CrossRef] [Green Version]
- Kudłacz, T. Rozwój społeczno-gospodarczy Polski południowo-wschodniej w układzie jednostek nowego podziału terytorialnego kraju. Zesz. Nauk. Akad. Ekon. W Krakowie 2000, 545, 15–30. [Google Scholar]
- Prus, P.; Domagalska, E. Rozwój przedsiębiorczości w sektorze małych i średnich przedsiębiorstw na przykładzie gminy Żnin. Rocz. Nauk. SERiA 2010, 5, 174–178. [Google Scholar]
- Okólski, M. Demografia. Podstawowe Pojęcia, Procesy I Teorie W Encyklopedycznym Zarysie; Wydawnictwo Naukowe Scholae: Warszawa, Poland, 2005. [Google Scholar]
- Springer, A.; Walkowiak, K.; Bernaciak, A. Leadership Styles of Rural Leaders in the Context of Sustainable Development Requirements: A Case Study of Commune Mayors in the Greater Poland Province, Poland. Sustainability 2020, 12, 2676. [Google Scholar] [CrossRef] [Green Version]
- Szostak, D. Local Development Planning as a Local Government Tool for Shaping the Service Function of the Moryń Commune (Poland). Stud. Ind. Geogr. Comm. Pol. Geogr. Soc. 2019, 33, 95–110. [Google Scholar]
- Kaliszczak, L. Enterpreneurship of a Local Government Unit in Creating the Touristic Function of Communes at an Initial Stage. In Proceedings of the International Scientific Conference on Hradec Economical Days 2010-Economic Development and Management of the Region, Hradec Kralove, Czech Republic, 2–3 February 2010; pp. 163–166. [Google Scholar]
- Pasieczny, J. The Regularity of Creating Profiles of Communes. In Proceedings of the 12th International Conference on Hradec Economic Days (HED 2014): Economic Development and Management of Regions. Univ Hradec Kralove Dept Econ, Hradec Kralove, Czech Republic, 4–5 February 2014; pp. 378–386. [Google Scholar]
- Pawlik, A.; Karpinska, U. The Financial Situation as a Stimulant of the Competitive Position of Rural Communes in the Świętokrzyskie Voivodeship. Balt. J. Econ. Stud. 2020, 5, 1–8. [Google Scholar] [CrossRef] [Green Version]
- Prus, P.; Dziekanski, P. Spatial diversification of the level of development and the financial situation of rural communes in the Swietokrzyskie voivodeship. Ann. Polish Assoc. Agric. Agrobusiness Econ. 2019, 21, 74–82. [Google Scholar] [CrossRef]
- Korenik, S. Dysproporcje W Rozwoju Regionów POlski-Wybrane Aspekty; Wyd AE im O Langego we Wrocławiu: Wrocław, Poland, 2003. [Google Scholar]
- Brol, R. Rozwój Lokalny–Nowa Logika Rozwoju Gospodarczego, Gospodarka Lokalna W Teorii I Praktyce; Prace Naukowe AE we Wrocławiu: Wrocław, Poland, 1998. [Google Scholar]
- Ryńca, R. Zrównoważona Karta Działania Jako Metoda Pomiaru Rfektywności Procesów I Działań; Oficyna Wyd Politechniki Wrocławskiej: Wrocław, Poland, 2009; p. 5. [Google Scholar]
- Klasik, A. Strategia Konkurencyjna Regionu. In Zarządzanie Strategiczne Rozwojem Lokalnym I Regionalnym; Klasik, A., Kużnik, F., Eds.; Wyd AE: Katowice, Poland, 2001. [Google Scholar]
- Dziemianowicz, W. Kapitał Zagraniczny a Rozwój Regionalny I Lokalny W Polsce, Studia Regionalne I Lokalne; UW i Euroreg: Warszawa, Poland, 1997; Volume 21, p. 29. [Google Scholar]
- Szlachta, J. Główne problemy polityki rozwoju regionalnego Polski na przełomie XX i XXI wieku. In Strategiczne Wyzwania Dla Polityki rozwoju Regionalnego Polski; Wydaniwctwo Friedrich Ebert Stiftung, Przedstawicielstwo W Polsce: Warszawa, Poland, 1996. [Google Scholar]
- Kudłacz, T. Programowanie Rozwoju Regionalnego; PWN: Warszawa, Poland, 1999. [Google Scholar]
- Kosiedowski, W. Teoretyczne problemy rozwoju regionalnego. In Zarządzanie Rozwojem Regionalnym I Lokalnym, Problemy Teorii I Praktyki; TNOiK: Toruń, Poland, 2001; p. 29. [Google Scholar]
- Hołuj, A.; Korecki, D. Uwarunkowania rozwoju regionalnego w Polsce. Zesz. Nauk. Wyższej Szkoły Ekon. W Bochni 2008, 7, 23. [Google Scholar]
- Jules, P.; Toulmin, C.; Williams, S. Sustainable intensification in African agriculture. Int. J. Agric. Sustain. 2011, 1, 5–24. [Google Scholar]
- Stoate, C.; Boatman, N.D.; Borralho, R.J.; Carvalho, C.R.; de Snoo, G.R.; Eden, P. Ecological impacts of arable intensification in Europe. J. Environ. Manag. 2001, 63, 337–365. [Google Scholar] [CrossRef] [PubMed]
- Smędzik-Ambroży, K.; Guth, M.; Stępień, S.; Brelik, A. The Influence of the European Union’s Common, Agricultural Policy on the Socio-Economic Sustainability of Farms (the Case of Poland). Sustainability 2019, 11, 7173. [Google Scholar] [CrossRef] [Green Version]
- Komiyama, H.; Takeuchi, K. Sustanability Science: Buildind a new discipline. Sustanaibility Sci. 2006, 1, 1–6. [Google Scholar] [CrossRef]
- Goodland, R.; Ledec, G. Neoclassical economics and principles of sustainable development. Ecol. Model. 1987, 38, 1–2. [Google Scholar] [CrossRef]
- Pearce, D.; Markandya, A.; Barbier, E. Blueprint for a Green Economy. Economics 1989. [Google Scholar] [CrossRef]
- Phiri, J.; Malec, K.; Majune, S.K.; Appiah-Kubi, S.N.K.; Gebeltová, Z.; Maitah, M.; Maitah, K.; Abdullahi, K.T. Agriculture as a Determinant of Zambian Economic Sustainability. Sustainability 2020, 12, 4559. [Google Scholar] [CrossRef]
- Stanny, M.; Czarnecki, A. Zrównoważony Rozwój Obszarów Wiejskich Zielonych Płuc Polski. Próba Analizy Empirycznej; Wyd IRWiR PAN: Warszawa, Poland, 2011. [Google Scholar]
- Dennis, L. Determinants of Financial Condition: A Study of US Cities; University of Central Florida: Orlando, FL, USA, 2004; pp. 43–45. [Google Scholar]
- Standar, A. Ocena kondycji finansowej gmin oraz jej wybranych uwarunkowań na przykładzie województwa wielkopolskiego przy wykorzystaniu metody TOPSIS. Wieś I Rol. 2017, 2, 69–92. [Google Scholar]
- Douglas, J.W.; Gaddie, R.K. State rainy day funds and fiscal crises: Rainy day funds and the 1990–1991 recession revisited. Public Budg. Financ. 2002, 22, 19–30. [Google Scholar] [CrossRef]
- Perry, J.L.; Christensen, R.K. Handbook of Public Administration; Jossey-Bass: San Francisco, CA, USA, 2015. [Google Scholar]
- Groves, S.M. An introduction to Evaluating Financial Condition. In Practical Financial Management. New Techniques for local Government; Matzer, J., Ed.; ICMA: Washington, DC, USA, 1984. [Google Scholar]
- Berne, R.I.; Schramm, R. The Financial Analysis of Governments; Prentice Hall: Englewood Cliffs, NJ, USA, 1986. [Google Scholar]
- Ladd, H.F. Population growth, density and the costs of providing public services. Urban Stud. 1992, 29, 273–295. [Google Scholar] [CrossRef]
- Rodríguez Bolívar, M.P.; Navarro Galera, A.; Alcaide Muñoz, L.; López Subirés, M.D. Risk Factors and Drivers of Financial Sustainability in Local Government: An Empirical Study. Local Gov. Stud. 2016, 42, 29–51. [Google Scholar] [CrossRef]
- Wang, X.; Dennis, L.; Sen, Y. Measuring Financial Condition: A Study of U.S. States. Public Budg. Financ. 2007, 1–22. [Google Scholar] [CrossRef]
- Cabaleiro-Casal, R.; Buch-Gómez, E.J.; Vaamonde Liste, A. Developing a Method to Assessing the Municipial Financial Health. Am. Rev. Public Adm. 2013, 43. [Google Scholar] [CrossRef]
- Głowicka-Wołoszyn, R.; Wysocki, F. Kondycja finansowa gmin wiejskich a źródła ich dochodów w województwie wielkopolskim. Rocz. Nauk. Stowarzyszenia Ekon. Rol. I Agrobiz. 2016, 1, 51–58. [Google Scholar]
- Zawora, J. Potencjał dochodowy a wydatki inwestycyjne gmin Polski Wschodniej. Nierówności Społeczne Wzrost Gospod. 2018, 56. [Google Scholar] [CrossRef]
- Zawora, J. Ocena sytuacji finansowej gmin Polski Wschodniej na tle kraju. Finans. Komunal. 2019, 5, 7–21. [Google Scholar]
Figure 1.
Eastern Poland—Lubelskie, Podlaskie, Podkarpackie, Świętokrzyskie and Warmińsko-Mazurskie Voivodships (research area, 484 rural communes). Source: own research.
Figure 1.
Eastern Poland—Lubelskie, Podlaskie, Podkarpackie, Świętokrzyskie and Warmińsko-Mazurskie Voivodships (research area, 484 rural communes). Source: own research.

Figure 2.
Quartile groups measure of the synthetic financial situation of rural communes in eastern Poland in 2009 and 2018. A: qi financial situation 2009, B: qi financial situation 2018, C: OE financial situation 2018, D: OE financial situation 2009. Source: own development based on the data from the Local Data Bank of Statistics Poland and Central Statistical Office.

Figure 3.
A synthetic measure of the financial situation of rural communes in eastern Poland in 2009 and 2018. Source: own study based on BDL CSO data using the Statistica program.
Figure 3.
A synthetic measure of the financial situation of rural communes in eastern Poland in 2009 and 2018. Source: own study based on BDL CSO data using the Statistica program.

Figure 4.
Dispersion of a measure of the synthetic financial situation of rural communes in eastern Poland in 2009 and 2018. Source: own study based on BDL CSO data using the Statistica program.
Figure 4.
Dispersion of a measure of the synthetic financial situation of rural communes in eastern Poland in 2009 and 2018. Source: own study based on BDL CSO data using the Statistica program.


Table 1.
List of variables describing the financial situation and economic and social development of communes.
Table 1.
List of variables describing the financial situation and economic and social development of communes.
| Variables | Unit | S/D * | |
|---|---|---|---|
| Financial Potential | |||
| X1 | Operating surplus/total revenues (budget solvency ratio) | % | S |
| X2 | Own income/total income (financial independence indicator) | % | S |
| X3 | Share in taxes constituting state budget revenues **/number of inhabitants (index of fiscal wealth per capita) | PLN | S |
| X4 | Income from local taxes/population (fiscal wealth indicator) | PLN | S |
| X5 | Local tax revenue/current income (tax autonomy indicator) | % | S |
| X6 | Investment expenditure/total expenditure (investment attractiveness index) | % | S |
| X7 | Transfer income/total income (indicator of financial interference by the state) | % | D |
| X8 | Expenditures on education and upbringing/number of inhabitants | PLN | S |
| X9 | Expenditures on housing/population | PLN | S |
| X10 | Health care expenditure/population | PLN | S |
| X11 | Expenditure on municipal economy and environmental protection/population | PLN | S |
| X12 | Public safety and fire protection expenditure/population | PLN | S |
| X13 | Public administration expenditure/number of inhabitants | PLN | D |
| X14 | Expenditure on agriculture and hunting/population | PLN | S |
| X15 | Interest/own income (debt service ratio) | % | D |
| Entrepreneurial Potential | |||
| X16 | Entities entered in the REGON register per 1000 population | pcs. | S |
| X17 | Units newly registered in the REGON register per 1000 population | pcs. | S |
| X18 | Units removed from the REGON register per 1000 population | pcs. | D |
| X19 | Natural persons conducting economic activity per 1000 population | pcs. | S |
| X20 | Foundations, associations and social organizations per 1000 population | pcs. | S |
| Infrastructural Potential | |||
| X21 | Population per 1 library (person) | person | S |
| X22 | Population for a public pharmacy | person | S |
| X23 | % Population using the sewage network | % | S |
| X24 | % Population using the water supply network | % | S |
| X25 | % Population using the gas network | % | |
| X26 | Apartments per 1000 population | pcs. | S |
| Demographic Potential and the Labor Market | |||
| X27 | Demographic dependency ratio for the elderly | person | D |
| X28 | Population Growth per 1000 population | person | S |
| X29 | Migration rate per 1000 population | person | S |
| X30 | Unemployed persons registered in communes per 1000 population | person | D |
| X31 | Employed persons per 1000 population | person | S |
| Environmental Potential | |||
| X32 | Total forest area | ha/person | S |
| X33 | Area of farms in the total area | % | S |
| X34 | Areas legally protected in total area | % | S |
| X35 | Total water consumption in households water from waterworks per capita | m3/person | D |
| X36 | Mixed waste collected during the year in total per capita | kg/person | D |
| X37 | Wastewater treated during the year treated together | dam3 | S |
| X38 | Emission of dust pollutants | t/r | D |
| X39 | Emissions of gaseous pollutants | t/a | D |
| X40 | % Of population using sewage treatment plants | % | S |
* S stimulant/D destimulant/operating surplus = total income—property income—current expenses, REGON (National Economy Register), National Official Register of National Economy Entities—register kept by the President of the Central Statistical Office. The term REGON is also understood as the REGON identification number, i.e., the nine-digit identifier assigned to the entity in this register. ** Municipalities have a share in the personal income tax (PIT) and the corporate tax (CIT), PLN the basic monetary unit in Poland. Source: study based on BDL CSO data and [13].
Table 2.
Statistical characteristics of diagnostic variables of entrance communes in eastern Poland.
Table 2.
Statistical characteristics of diagnostic variables of entrance communes in eastern Poland.
| Variable | Range | Average | Deviation | Variability | Asymmetry |
|---|---|---|---|---|---|
| Financial Potential | |||||
| X1 | 0.31 | 0.08 | 0.04 | 0.48 | 0.75 |
| X2 | 0.59 | 0.28 | 0.10 | 0.34 | 1.55 |
| X3 | 0.42 | 0.09 | 0.05 | 0.54 | 2.62 |
| X4 | 2.11 | 0.10 | 0.14 | 1.36 | 8.14 |
| X5 | 0.62 | 0.11 | 0.06 | 0.56 | 2.89 |
| X6 | 0.47 | 0.21 | 0.09 | 0.45 | 0.42 |
| X7 | 0.64 | 0.64 | 0.10 | 0.15 | −1.05 |
| X8 | 3301.95 | 1368.67 | 304.66 | 0.22 | 2.53 |
| X9 | 933.04 | 65.77 | 108.86 | 1.66 | 4.04 |
| X10 | 569.52 | 16.80 | 34.44 | 2.05 | 10.49 |
| X11 | 3712.70 | 431.05 | 391.39 | 0.91 | 2.95 |
| X12 | 684.28 | 60.87 | 51.40 | 0.84 | 5.27 |
| X13 | 961.19 | 481.96 | 145.77 | 0.30 | 1.78 |
| X14 | 2611.15 | 251.89 | 292.99 | 1.16 | 3.10 |
| X15 | 0.09 | 0.02 | 0.02 | 0.79 | 1.16 |
| Entrepreneurial Potential | |||||
| X16 | 158.0 | 60.93 | 17.54 | 0.29 | 2.35 |
| X17 | 19.30 | 7.20 | 2.32 | 0.32 | 1.26 |
| X18 | 15.0 | 4.0 | 1.65 | 0.38 | 1.49 |
| X19 | 135.00 | 47.97 | 15.77 | 0.33 | 2.08 |
| X20 | 9.85 | 3.49 | 1.23 | 0.35 | 1.45 |
| Infrastructural Potential | |||||
| X22 | 16357.0 | 3306.96 | 2998.27 | 0.91 | 1.02 |
| X23 | 98.50 | 34.16 | 25.36 | 0.74 | 0.58 |
| X24 | 100.0 | 80.60 | 21.23 | 0.26 | −1.93 |
| X25 | 95.30 | 18.36 | 26.73 | 1.46 | 1.27 |
| X26 | 471.50 | 329.70 | 66.45 | 0.20 | 2.14 |
| Demographic Potential and the Labor Market | |||||
| X27 | 53.3 | 25.23 | 6.13 | 0.24 | 2.27 |
| X28 | 38.78 | −2.58 | 4.42 | −1.71 | −1.31 |
| X29 | 93.60 | −2.14 | 6.70 | −3.13 | 3.72 |
| X30 | 106 | 39 | 16.61 | 0.43 | 0.82 |
| X31 | 1229.0 | 84.30 | 71.94 | 0.85 | 9.14 |
| Natural Environmental Potential | |||||
| X32 | 1.31 | 0.10 | 0.12 | 1.17 | 4.00 |
| X36 | 324.1 | 103.2 | 53.43 | 0.52 | 1.28 |
| X37 | 1217.0 | 88.70 | 128.89 | 1.45 | 4.00 |
| X40 | 1.0 | 0.38 | 0.29 | 0.74 | 0.50 |
Source: own elaboration based on data from Local Data Bank (2018).
Table 3.
Classification according to the value of the measure of the synthetic financial situation of rural communes of eastern Poland in 2009 and 2018.
Table 3.
Classification according to the value of the measure of the synthetic financial situation of rural communes of eastern Poland in 2009 and 2018.
| qi Financial Situation | OE Financial Situation | ||||||||||||||||
|---|---|---|---|---|---|---|---|---|---|---|---|---|---|---|---|---|---|
| 2009 | 2018 | 2009 | 2018 | ||||||||||||||
| I | II | III | IV | I | II | III | IV | I | II | III | IV | I | II | III | IV | ||
| Lubelskie | 165 | 25 | 44 | 72 | 24 | 31 | 50 | 45 | 39 | 29 | 38 | 43 | 55 | 40 | 58 | 29 | 38 |
| Podkarpackie | 108 | 32 | 23 | 22 | 31 | 17 | 19 | 42 | 30 | 30 | 19 | 26 | 33 | 13 | 31 | 30 | 35 |
| Podlaskie | 78 | 40 | 23 | 13 | 2 | 40 | 18 | 15 | 5 | 45 | 23 | 8 | 2 | 43 | 19 | 9 | 6 |
| Świętokrzyskie | 66 | 26 | 13 | 26 | 1 | 16 | 20 | 16 | 14 | 16 | 19 | 18 | 6 | 18 | 22 | 12 | 14 |
| Warmińsko-mazurskie | 67 | 14 | 26 | 22 | 5 | 21 | 16 | 24 | 6 | 32 | 18 | 15 | 2 | 21 | 23 | 14 | 6 |
| Number of units | 484 | 137 | 129 | 155 | 63 | 125 | 123 | 142 | 94 | 159 | 117 | 110 | 98 | 138 | 153 | 94 | 99 |
| Max | 0.39 | 0.17 | 0.15 | 0.13 | 0.51 | 0.20 | 0.18 | 0.16 | 0.89 | 0.90 | 0.91 | 0.94 | 0.85 | 0.87 | 0.88 | 0.92 | |
| Min | 0.18 | 0.16 | 0.14 | 0.09 | 0.21 | 0.19 | 0.17 | 0.14 | 0.73 | 0.90 | 0.91 | 0.92 | 0.60 | 0.86 | 0.88 | 0.89 | |
| Range | 0.21 | 0.01 | 0.01 | 0.04 | 0.3 | 0.01 | 0.01 | 0.02 | 0.16 | 0.00 | 0.00 | 0.02 | 0.25 | 0.01 | 0.00 | 0.03 | |
Source: own development based on the data from the Local Data Bank of Statistics Poland and Central Statistical Office.
Table 4.
Statistical characteristics of the measure of the synthetic financial situation of rural communes of eastern Poland in 2009 and 2018.
Table 4.
Statistical characteristics of the measure of the synthetic financial situation of rural communes of eastern Poland in 2009 and 2018.
| The Area of Rural Communes of the Province | After Removing the Outliers | |||||||
|---|---|---|---|---|---|---|---|---|
| qi Financial Situation | OE Financial Situation | qi Financial Situation | OE Financial Situation | |||||
| 2009 | 2018 | 2009 | 2018 | 2009 | 2018 | 2009 | 2018 | |
| min | 0.09 | 0.14 | 0.73 | 0.60 | 0.10 | 0.14 | 0.86 | 0.81 |
| max | 0.39 | 0.51 | 0.94 | 0.92 | 0.21 | 0.24 | 0.93 | 0.92 |
| range | 0.30 | 0.37 | 0.21 | 0.32 | 0.11 | 0.10 | 0.07 | 0.11 |
| average | 0.17 | 0.19 | 0.90 | 0.86 | 0.16 | 0.19 | 0.90 | 0.87 |
| median | 0.16 | 0.19 | 0.90 | 0.87 | 0.16 | 0.18 | 0.90 | 0.87 |
| standard deviation | 0.04 | 0.04 | 0.03 | 0.03 | 0.02 | 0.02 | 0.02 | 0.02 |
| quartile deviation | 0.02 | 0.02 | 0.01 | 0.02 | 0.02 | 0.02 | 0.01 | 0.02 |
| coefficient of variation | 0.21 | 0.20 | 0.03 | 0.04 | 0.15 | 0.13 | 0.02 | 0.02 |
| positional coefficient of variation | 0.12 | 0.10 | 0.01 | 0.02 | 0.09 | 0.08 | 0.01 | 0.02 |
| quartile range | 0.04 | 0.04 | 0.02 | 0.03 | 0.03 | 0.03 | 0.02 | 0.03 |
| quartile 1 | 0.14 | 0.17 | 0.89 | 0.85 | 0.14 | 0.17 | 0.89 | 0.85 |
| quartile 2 | 0.16 | 0.19 | 0.90 | 0.87 | 0.16 | 0.18 | 0.90 | 0.87 |
| quartile 3 | 0.18 | 0.21 | 0.91 | 0.88 | 0.17 | 0.20 | 0.91 | 0.88 |
| skewness (asymmetry) | 1.85 | 2.64 | −2.20 | −2.73 | 0.29 | 0.45 | −0.42 | −0.51 |
| kurtosis (measure of concentration) | 6.08 | 12.56 | 8.12 | 14.39 | −0.35 | −0.41 | −0.27 | 0.02 |
Source: study based on BDL CSO data using the Statistica program.
Table 5.
Correlation between measures of financial situation, development and socio-economic variables in rural communes of eastern Poland (co. Pearson).
Table 5.
Correlation between measures of financial situation, development and socio-economic variables in rural communes of eastern Poland (co. Pearson).
| qi Financial Situation | OE Financial Situation | |
|---|---|---|
| OE financial situation | −0.9524 | 1 |
| qi financial situation | 1 | −0.9524 |
| Development potential (synthetic measure) | 0.3866 | 0.4251 |
| Entrepreneurial potential (synthetic measure) | 0.4127 | 0.4155 |
| Share of own revenues in total revenues | 0.7187 | −0.7147 |
| Share in taxes constituting state budget revenues/number of inhabitants | 0.5847 | −0.6594 |
| Revenue from local taxes/population | 0.6513 | −0.7054 |
| Investment expenses/total expenses | 0.4805 | −0.4117 |
| Transfer income/total income | 0.8165 | −0.8064 |
| Public administration expenditure/number of inhabitants | 0.5337 | −0.5984 |
| Entities entered into REGON register | 0.4151 | −0.4127 |
| Self-employed persons | 0.3492 | −0.3298 |
| Foundations, associations and social organizations | 0.2764 | −0.3461 |
| Population for a public pharmacy | −0.1464 | 0.186 |
| Housing stock | 0.316 | −0.368 |
| Population Growth | −0.0675 | 0.1081 |
| Net migration rate | 0.2202 | −0.1729 |
| Unemployed persons registered in communes | 0.1513 | −0.1568 |
| Employed persons in communes | 0.3917 | −0.4058 |
Linear correlation coefficients for observations from sample 1–4840; Critical value (at a 5% bilateral critical area) = 0.0282 for n = 4840. Source: Own calculations using the Statistica program.
Table 6.
The results of the regression analysis between the financial situation (qi) and the development variables of rural communes in eastern Poland.
Table 6.
The results of the regression analysis between the financial situation (qi) and the development variables of rural communes in eastern Poland.
| Coefficient | Standard Error | t-Student’s | p-Value | |
|---|---|---|---|---|
| const | 0.852797 | 0.00114722 | 743.4 | <0.0001 |
| Entities entered in REGON | 0.000730086 | 3.10799 × 10⁻⁵ | 23.49 | <0.0001 |
| Foundations, associations | 0.00167217 | 0.000405716 | 4.122 | <0.0001 |
| Population per library | −1.67820 × 10⁻⁶ | 1.48986 × 10⁻⁷ | −11.26 | <0.0001 |
| Housing stock | 0.000195335 | 1.06959 × 10⁻⁵ | 18.26 | <0.0001 |
| Population growth | 0.000616589 | 0.000153279 | 4.023 | <0.0001 |
| Unemployed in the commune | 0.299805 | 0.0414190 | 7.238 | <0.0001 |
| Employed | 0.000159914 | 6.56278 × 10⁻⁶ | 24.37 | <0.0001 |
| Arithmetic mean of the dependent variable | 0.175550 | Standard deviation of dependent variable | 0.039078 | |
| Sum of squares residuals | 4.578174 | Residual standard error | 0.030781 | |
| Coefficient of determination R-square | 0.380469 | Adjusted R-square | 0.379571 | |
| F (7, 4832) | 423.9207 | p-values for F-test | 0.000000 | |
| Logarithm of credibility | 9983.692 | Inrom. Crit. Akaike’a | −19,951.38 | |
| Crit. Bayes. Schwarza | −19,899.51 | Crit. Hannana-Quinna | −19,933.17 | |
Observations used 1–4840; Dependent variable Y—qi financial situation. Source: Own calculations using the Gretl program.
Table 7.
Regression analysis between the financial situation (OE) and development variables of rural communes in eastern Poland.
Table 7.
Regression analysis between the financial situation (OE) and development variables of rural communes in eastern Poland.
| Coefficient | Standard Error | t-Student’s | p-Value | |
|---|---|---|---|---|
| const | 0.852797 | 0.00114722 | 743.4 | <0.0001 |
| Entities entered in REGON | −0.000537068 | 2.33900 × 10⁻⁵ | −22.96 | <0.0001 |
| Foundations, associations | −0.00292843 | 0.000305332 | −9.591 | <0.0001 |
| Population per library | 1.54341 × 10⁻⁶ | 1.12123 × 10⁻⁷ | 13.77 | <0.0001 |
| Housing stock | −0.000167025 | 8.04947 × 10⁻⁶ | −20.75 | <0.0001 |
| Population growth | −0.000463699 | 0.000115354 | −4.020 | <0.0001 |
| Unemployed in the commune | −0.233259 | 0.0311709 | −7.483 | <0.0001 |
| Employed | −0.000133191 | 4.93898 × 10⁻⁶ | −26.97 | <0.0001 |
| Arithmetic mean of the dependent variable | 0.882742 | Standard deviation of dependent variable | 0.030895 | |
| Sum of squares residuals | 2.592938 | Residual standard error | 0.023165 | |
| Coefficient of determination R-square | 0.438602 | Adjusted R-square | 0.437789 | |
| F (7, 4832) | 539.2979 | p-values for F-test | 0.000000 | |
| Logarithm of credibility | 11,359.48 | Inrom. Crit. Akaike’a | −22,702.97 | |
| Crit. Bayes. Schwarza | −22,651.09 | Crit. Hannana-Quinna | −22,684.75 | |
Observations used 1–4840; dependent variable Y—OE financial situation. Source: Own calculations using the Gretl program.
© 2020 by the authors. Licensee MDPI, Basel, Switzerland. This article is an open access article distributed under the terms and conditions of the Creative Commons Attribution (CC BY) license (http://creativecommons.org/licenses/by/4.0/).
Share and Cite
MDPI and ACS Style
Dziekański, P.; Prus, P. Financial Diversity and the Development Process: Case study of Rural Communes of Eastern Poland in 2009–2018. Sustainability 2020, 12, 6446. https://0-doi-org.brum.beds.ac.uk/10.3390/su12166446
AMA Style
Dziekański P, Prus P. Financial Diversity and the Development Process: Case study of Rural Communes of Eastern Poland in 2009–2018. Sustainability. 2020; 12(16):6446. https://0-doi-org.brum.beds.ac.uk/10.3390/su12166446
Chicago/Turabian StyleDziekański, Paweł, and Piotr Prus. 2020. "Financial Diversity and the Development Process: Case study of Rural Communes of Eastern Poland in 2009–2018" Sustainability 12, no. 16: 6446. https://0-doi-org.brum.beds.ac.uk/10.3390/su12166446
Note that from the first issue of 2016, this journal uses article numbers instead of page numbers. See further details here.