Classification of Sustainable Activities: EU Taxonomy and Scientific Literature


Department of Management, Università Politecnica Delle Marche, Piazzale R. Martelli 8, 60121 Ancona, Italy
*
Author to whom correspondence should be addressed.
Sustainability 2020, 12(16), 6460; https://0-doi-org.brum.beds.ac.uk/10.3390/su12166460
Submission received: 16 July 2020
/
Revised: 6 August 2020
/
Accepted: 7 August 2020
/
Published: 11 August 2020
(This article belongs to the Special Issue New Economic and Financial Challenges for Social and Environmental Sustainability)
Abstract
:In March 2020, the European Commission published the EU Taxonomy, a classification system of economic activities that can be considered environmentally sustainable. Motivated by this policy initiative, we propose a bibliometric analysis, based on the Web of Science database for the period January 1990–March 2020, regarding the extant scientific production related to the EU Taxonomy environmental objectives and macro-sectors. We find that a considerable number of scientific works—161,595 publications—have investigated Taxonomy-related areas, showing that the EU Taxonomy defined a working method, based on the cooperation among regulators, academics, and industry, representing a valuable example of evidence-based policy making. Furthermore, topic modelling analysis shows that extracted papers focused on improvements in production processes, innovation, and environmental performance. Thus, exploiting time and geographic patterns of the scientific publications, we perform a multivariate analysis to investigate its relationship with subsequent levels of pollution. Our evidence shows that, for the past, a higher level of EU Taxonomy-related publications is associated with a lower level of CO2 emissions, supporting the view that scientific production has a societal impact in terms of environmental sustainability. Accordingly, now that EU Taxonomy-related topics have been incorporated into policy measures, further positive environmental effects are expected from here on out.
1. Introduction
The Paris Agreement, signed in December 2015 by 189 Nations and entered into force in November 2016, represents a turning point in recognizing global warming and the need to steer the economy towards low-carbon activities. Specifically, the main aim is, “holding the increase in the global average temperature to well below 2 °C above pre-industrial levels and pursuing efforts to limit the temperature increase to 1.5 °C above pre-industrial levels, recognizing that this would significantly reduce the risks and impacts of climate change”. In regard to the general goal of the Paris Agreement, a dominant issue is the channeling of financial flows towards a green, low-carbon, and climate-resilient economy. The reasonable assumption is that finance should follow an allocative efficiency principle able to quantify to what extent a company is environmentally sustainable. Coherently, several institutional initiatives pursued worldwide have begun to cope with this problem and its related issues, such as the classification of a business as ‘green’ and its certification, the public disclosure of this quality, the metrics to measure the sustainable attributes of economic activities, and so on.
In Europe, a vivid debate on global warming, with a focus on the link between economic activities and climate change, generated expectations for decisive actions and policy interventions to address these concerns. Thus, environmental issues have been placed at the top of the European Commission’s policy agenda over the last few years. The EU institutions have promoted, among the other concurrent activities, the development of an EU classification system to determine to what extent a company can be defined environmentally sustainable. In March 2020, an EU classification system—the so-called EU Taxonomy—was publicly presented. Its purpose is to determine whether the different economic activities that a company carries out are environmentally sustainable and to what extent the company business itself is sustainable, given the individual contribution of each activity to the entire company performance. Although other supranational initiatives share the broader commitment of the European Commission towards a low-carbon economy, the EU Taxonomy appears as a more specific action that provides concrete guidance for financial market participants, investors, large companies, and national regulators. In short, this guide states the specific requirements are expected to be fulfilled by companies, differently set by economic sectors, in order to reach six environmental objectives: Climate change mitigation, climate change adaptation, sustainable use and protection of water and marine resources, transition to a circular economy, pollution prevention and control, and protection and restoration of biodiversity and ecosystems.
The theoretical background of this paper, which brings arguments to support its whole empirical set, consists of the assumption that scientific production represents the primary place where innovations and significant advancements in knowledge are publicly disclosed; this concept is supported by the long-standing literature on the link between research and innovation among others [1,2,3]. The link Science-Technology-Innovation (i.e., STI, as in the 9.5 goal of the 2030 UN agenda) has also been recognized as one of the main drivers behind productivity increases and a key long-term lever for economic growth and prosperity, and vital for environmental sustainability [4].
Nevertheless, the literature on evidence-based policy making identifies barriers in several specific environmental policy areas, in terms of academic-practitioner exchange. This literature underscores the tendency of academics to miss the chance to influence policymakers with their findings, and for policymakers to rely on personal experience or ad hoc links with experts rather than the state-of-the-art in scientific research [5]. More specifically, according to some authors, scientific works should be repackaged according to the needs of their ‘end user’—such as by providing pragmatic recommendations or information that help policy-makers to predict events and plan ahead [5,6,7,8,9,10]. Other authors maintain that policymakers will often not respond to an alleged policy problem if there is not an obvious solution [11]. “As already pointed out, STI policies are fundamental to take economies and societies onto a sustainable path. Given the expected high costs of transition, policies need to be carefully designed, using available scientific evidence. The use of evidence for policy making is often taken for granted, but the practice is often far from this principle” [4] (p. 27). Generally speaking, most of the authors involved in this debate agree that in order to adapt to complex policymaking systems, scientists need to engage in collaborative/participatory government rather than merely transfer evidence [11,12,13]; that is precisely the guiding philosophy of the technical experts groups (TEG), responsible for producing the EU Taxonomy.
Therefore, we have exploited the opportunity offered by the very recent (March 2020) EU Taxonomy, by opening the paper with a first question: Is there any link between the policy guidelines included in the 2020 EU Taxonomy and the scientific production on the Taxonomy-related areas sedimented over the previous 30 years? We initiated our research by performing a bibliometric analysis on the existent scientific production screened through the environmental objectives and economic sectors proposed by the EU Taxonomy. Then, in order to detect a literature in line with the environmental objectives and economic activities identified in it, we created a list of 432 combined keywords obtained as pairwise text unions among the six environmental objectives, on the one hand, and the 72 economic sectors included in the EU Taxonomy, on the other hand. We used these keywords as extraction queries to download from the Web of Science (WoS) database the whole set of metadata regarding the Taxonomy-related scientific production, including abstracts, names of authors, their affiliations, and years of publication, from January 1990 to March 2020. Thus, we constructed a unique dataset that represents a comprehensive map of the research papers that have been written on the environmental objectives specified by sectoral definitions identified in the EU Taxonomy.
As a first straightforward result, we found a significant body of pre-existing scientific production in line with the environmental objectives by economic sectors identified by the European Commission. In fact, among the 432 queries, only 27.5% (119 extractions) returned a null response. Further, on the opposite side, 72.5% of queries combining the EU environmental goals with specific economic sectors revealed the presence of scientific literature that is largely described in this paper by development over time and by geographical areas.
At this point, since the data obtained from the WoS core collection were retrieved using keywords, we performed a further analysis to exploit, in addition to quantity, the content of the research papers on EU-taxonomy related areas, by making use of the Latent Dirichlet Allocation. The topic model analysis highlights the prevalence of papers related to business innovation, with an emphasis on process improvements, which are definitively expected to improve the environment. These findings are in line with a recent stream of literature which suggests that low-carbon technology innovations, when combined with traditional policy tools, such as carbon trading and carbon taxes, might be largely effective in shaping firms’ environmental sustainability performance [14,15,16,17,18]. Thus, supported by our evidence and the related literature, we then exploited time series and geographical information of our collected dataset to develop and estimate an econometric setting that investigates the relationship between the EU Taxonomy-related scientific production (which is here considered a driver for innovation towards sustainability) and pollution levels. This analysis is also motivated and reinforced by the expected societal impact of environmental studies suggested by a flourishing business literature among the others, see [19,20,21,22,23,24,25].
To approximate pollution levels, we considered carbon emissions, recognized as the main source of global warming [26], and largely used in the literature see, e.g., [27,28]. From our estimations we found a negative relationship between the EU Taxonomy-related literature and pollution levels, suggesting that a higher production of scientific literature on topics related to the EU Taxonomy promotes lower levels of pollution, over time. Importantly, this result also holds true when considering the scientific production for each environmental objective and macro-sector of the Taxonomy. These findings are robust when controlling for international events related to pollution issues, potential confounding factors, including economic development, generic scientific production, and with country and year fixed effects. This implies that the identified relationship is not simply driven by countries with a higher investment in research and innovation, or other domestic factors that affect scientific research, but that it depends on the specific research outcomes in areas and on topics related to the environment.
Although for the time being it is still premature to quantify the impact on companies and investors that will be generated by the EU Taxonomy, it is reasonable to expect deep changes in economic activities and financial flows. The empirical results of this paper are supportive of a possible relevant role of the EU Taxonomy: The negative association of the Taxonomy-related scientific production with the pollution levels that emerged from our empirical analyses, lead us to argue that, in the future, as the Taxonomy is implemented in business and finance, emissions could be further reduced.
This paper makes an important contribution to several strands of research. First, to the best of our knowledge, it represents the first attempt to use the EU Taxonomy in the context of scientific literature, providing an example of its usability and some empirical evidence about the diffusion of taxonomy concepts in the scientific domain. Second, it expands the empirical findings on the “societal impact” of scientific research. Finally, our findings are relevant for policy makers and regulators in other parts of the world, as well. As the EU Taxonomy could be effective for tackling global warming, at the international level, other non-EU countries may decide to adhere to it, or to adopt similar classification systems, to identify sustainable economic activities.
The remainder of the paper is structured as follows. Section 2 offers the background of the paper, with a mention of the institutional setting that leads to the development of the EU Taxonomy. Section 3 presents the methodology adopted to construct the dataset of scientific papers related to the EU Taxonomy and the analysis conducted with topic modelling. Section 4 reports the main empirical results, and Section 5 concludes with a discussion of the main findings.
2. Institutional Background of the EU Taxonomy
In July 2018, the European Commission set up a Technical Expert Group on sustainable finance (TEG) including a heterogeneous group of participants from academia, business, and the finance sector, on the one hand, and members and observers from EU and international public bodies, on the other hand. In this context, one of the four mandates of the TEG was specifically to develop a unified, clear, and detailed EU classification system for sustainable economic activities. Given the complexity of the task, the TEG activities were extended until 2020 and, after the first release in June 2019, the final version of the Taxonomy Technical Report was released in March 2020 [29,30] with the publication of the so-called EU Taxonomy. The six environmental objectives pursued in the EU Taxonomy are: (1) Climate change mitigation, (2) climate change adaptation, (3) sustainable use and protection of water and marine resources, (4) transition to a circular economy, (5) pollution prevention and control, and (6) protection and restoration of biodiversity and ecosystems. Taking these environmental objectives as the rational target, the TEG applies the EU Taxonomy as the framework that guarantees a unified classification system for determining when economic activities can be considered environmentally sustainable. Based on the NACE (French: Nomenclature statistique des Activités économiques dans la Communauté Européenne) classification, the official industry classification used in the European Union, the TEG selected a list of macro-economic sectors considered relevant in terms of GHG emissions in the EU (roughly 93.5% of Europe’s emissions), and covering a significant proportion of GDP and total employment at the EU 28 level. For each macro-sector, the TEG identified a list of eligible activities and, then, determined the “detailed technical screening criteria” necessary to validate whether economic activities meet the relevant substantial contribution to the environmental objectives. Note that eligibility under the EU Taxonomy is assessed on an activity basis rather than by entity (i.e., company). Nevertheless, a key part of the EU Taxonomy assessment includes defining what part of a corporate’s performance can be assessed as sustainable. To this end, determining to what degree a company can be considered environmentally sustainable depends on the individual contribution of each eligible economic activity to the company performance, in terms of turnover, or revenues when appropriate, but also in terms of capital or operational expenditure [30].
As a general rule guiding the performance criteria, an economic activity is qualified as environmentally sustainable when (i) it contributes substantially to at least one of the six environmental objectives; (ii) it follows the principle of “Do No Significant Harm” to any other environmental objectives; and, (iii) it complies with minimal social safeguards. Indeed, when an economic activity meets the EU Taxonomy performance thresholds it is then certified as “EU Taxonomy-aligned”. In practice, a company that is fully or partially involved in eligible economic activities (e.g., reforestation, electricity generation, public transport) and meets the EU-Taxonomy technical screening criteria, it is allowed to classify a corresponding percentage of its performance (turnover, capital expenditure, or operational expenditure) as environmentally sustainable. Consequently, a financial intermediary investing in that company may compute its proportional share of Taxonomy-aligned investment. In this way, the intermediary (e.g., investment and mutual funds, private and occupational pensions) will disclose the nature and the extent to which its financial products are EU Taxonomy-aligned. This represents a powerful edge for investment firms, as companies will have to disclose their EU Taxonomy-aligned turnover and capital expenditure in their annual reports, as required in the Non-Financial Reporting Directive. Otherwise, the financial intermediary will have to declare that a product does not align.
The EU Taxonomy will be converted into a Regulation by the end of 2020. The criteria will be laid down in delegated acts, following recommendations from key stakeholders (i.e., expert groups—the TEG at first, followed by the ‘Platform on sustainable finance’—and public consultation) and Member States. Consequently, market actors will have to start complying with the Taxonomy Regulation requirements as of December 2021.
3. Materials and Methods
Our main data source was Web of Science, a Clarivate Analytics’ product, used to identify publications related to the EU Taxonomy. We created a list of 432 combined keywords obtained as a text union between words representing the six environmental objectives and terms describing each economic activity included in the EU Taxonomy. As anticipated, the EU Taxonomy adopts the NACE -Revision 2 for industrial classification. The selected NACE Macro-Sectors are: Agriculture, Forestry and Fishing; Mining and Quarrying; Manufacturing; Electricity, Gas, Steam, and Air Conditioning Supply; Water Supply and Waste Management; Construction; Information and Communication. Within each NACE Macro-Sector, 72 economic activities are identified as eligible (see Table A1 in the Appendix A). Keywords describing each activity and the environmental objectives (keywords come from the TEG report [29]) were inserted in order to run extraction queries from the WoS database’s search engine. Then, we downloaded the full record for each query. The data included various types of information about research contributions, such as title, abstract, keywords, publication type, publisher name, publication date, authors’ names and their affiliations, and other details.
Following this procedure, we constructed a unique dataset of metadata about the EU Taxonomy in the scientific literature. Our choice to rely on the WoS core collection database is consistent with previous literature, which supports using it as a tool in bibliometric studies on climate-related research [31]. In addition, it is commonly suggested that science–technology interactions be measured by (but obviously, not limited to) citations of documents in the WoS. For example, [32] it has been shown that 50 to 55% of non-patent references in patents documents are journal references covered by the WoS. Moreover, it is considered one of the most reliable data sources for some of the research areas related to the Taxonomy, such as Natural Sciences and Engineering [33,34], and it also contains the most relevant and influential journals in its record, so it has been widely used to study scientific production and citations [35,36]. However, WoS over-represents English-language journals (in our sample, roughly 97% of the papers are in English), but this is a common bias to other databases, e.g., Scopus.
4. Results and Discussion
4.1. EU Taxonomy in the Scientific Literature: Descriptive Results
The first step of the analysis presented in this paper involved an investigation of the state of the art of the previous scientific literature filtered by the environmental objectives and economic activities proposed in the EU taxonomy framework. Analysis of scientific production in the environmental issue is not new, with contributions addressing different topics and using different approaches. Some of these works look at concepts related to various environmental aspects [35] or sustainability topics, such as green, circular, and bio economy [37,38,39]. Other papers explore scientific productivity by analyzing growth over time and the cross-country patterns [40,41]. The present paper adds to this literature by providing a new perspective, where the existing scientific production on environmental issues is selected using the objectives and criteria proposed by the TEG in the EU Taxonomy.
Following the methodology described in Section 3, we identify 161,595 publications related to the EU Taxonomy for the period January 1990–March 2020. Thus, this evidence provides a response to our first research question, because scientific papers about the environmental objectives and the macro-sectors of the EU Taxonomy are a non-negligible part of the overall WoS publications. Among the 432 queries, only 27.5% (119 extractions) yielded a null response. Specifically, empty repository of scientific production mainly refers to the goals of Climate change adaptation (30 cases), Circular economy (29 cases), Climate change mitigation (21 cases), and Biodiversity/Ecosystems (19); 14 unproductive extractions refer to the environmental goal of Pollution and only 6 are related to Water and Marine resources.
Turning to the cases of productive extractions, Table 1, below, provides a detailed overview of the distribution of the scientific production, divided by environmental objectives and NACE Macro-Sectors.
As far as the objectives are concerned, Water and Marine resources is the most populated topic in the sampled literature, followed by Biodiversity/Ecosystem and Pollution, suggesting that these three are the most well-established research fields. All together they account for 94% of our sample. For the other objectives we find a more limited number of publications. Climate change adaptation and Climate change mitigation, together, account for less than 10,000 papers, while for Circular economy we find fewer than 1000 publications. Based on the NACE Macro-Sector, our evidences indicate that the majority of the papers refers to Water, Electricity, and Agriculture (roughly 89% of the sample), followed by Manufacturing and Transportation (8%). Papers dealing with Buildings and ICT are quite scarce.
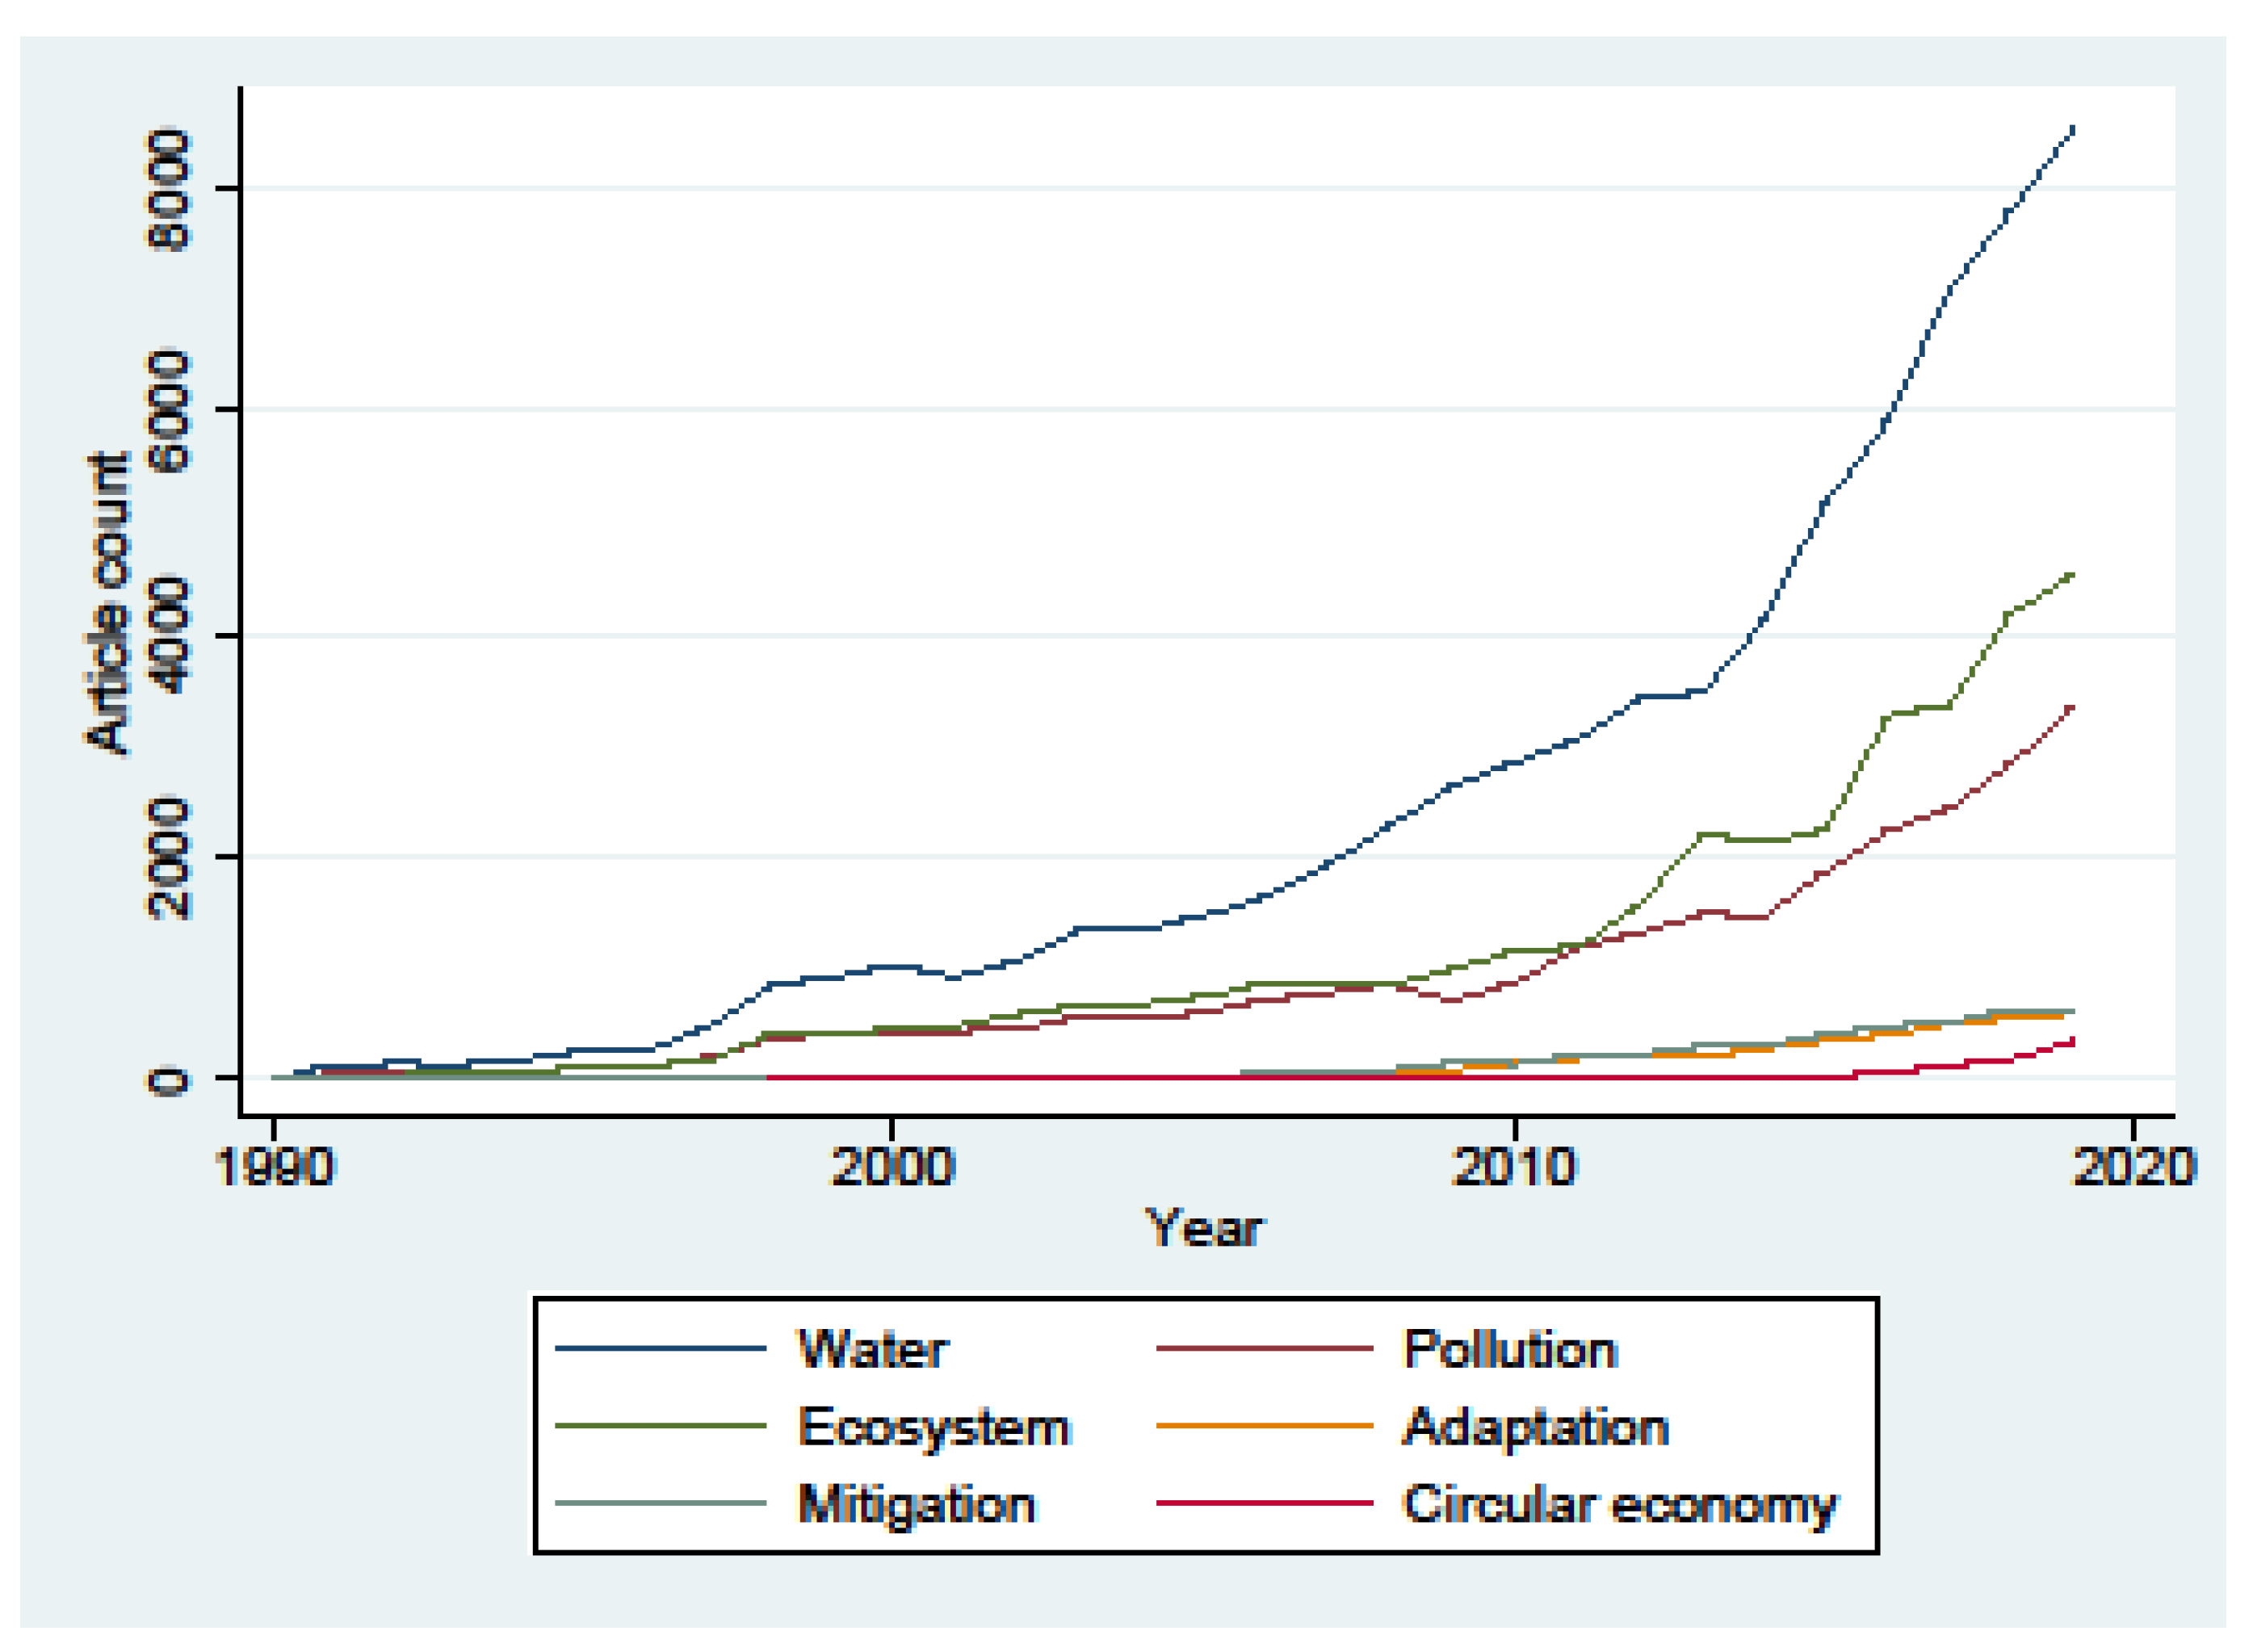
Figure 1 depicts the number of publications related to the EU Taxonomy, by environmental objectives, over time. Water and Marine resources have always accounted for the largest share of publications, with a marked increase since 2015. Climate change mitigation and Climate change adaptation are amply represented in the sample (more than 100 papers each), but only starting from 2010; nevertheless, by the end of 2019 that number increased exponentially. This might reflect the growing efforts that regulators and policymakers put into developing climate change mitigation and adaptation strategies, which, in turn, may have influenced the academic community. Papers about Circular economy were mainly published in the last three years, possibly showing that although it is not new as a research field, the interest that its applications has raised in the scientific community is more recent. This evidence is in line with [37] who, conducting a bibliometric review on the concepts of Circular Economy, Green Economy, and Bioeconomy, suggest that these different concepts are currently being mainstreamed as development and sustainability avenues. Our data also cover the first quarter of 2020 (omitted in Figure 1 for representation purposes) and it essentially confirms the described trends for the most recent years.
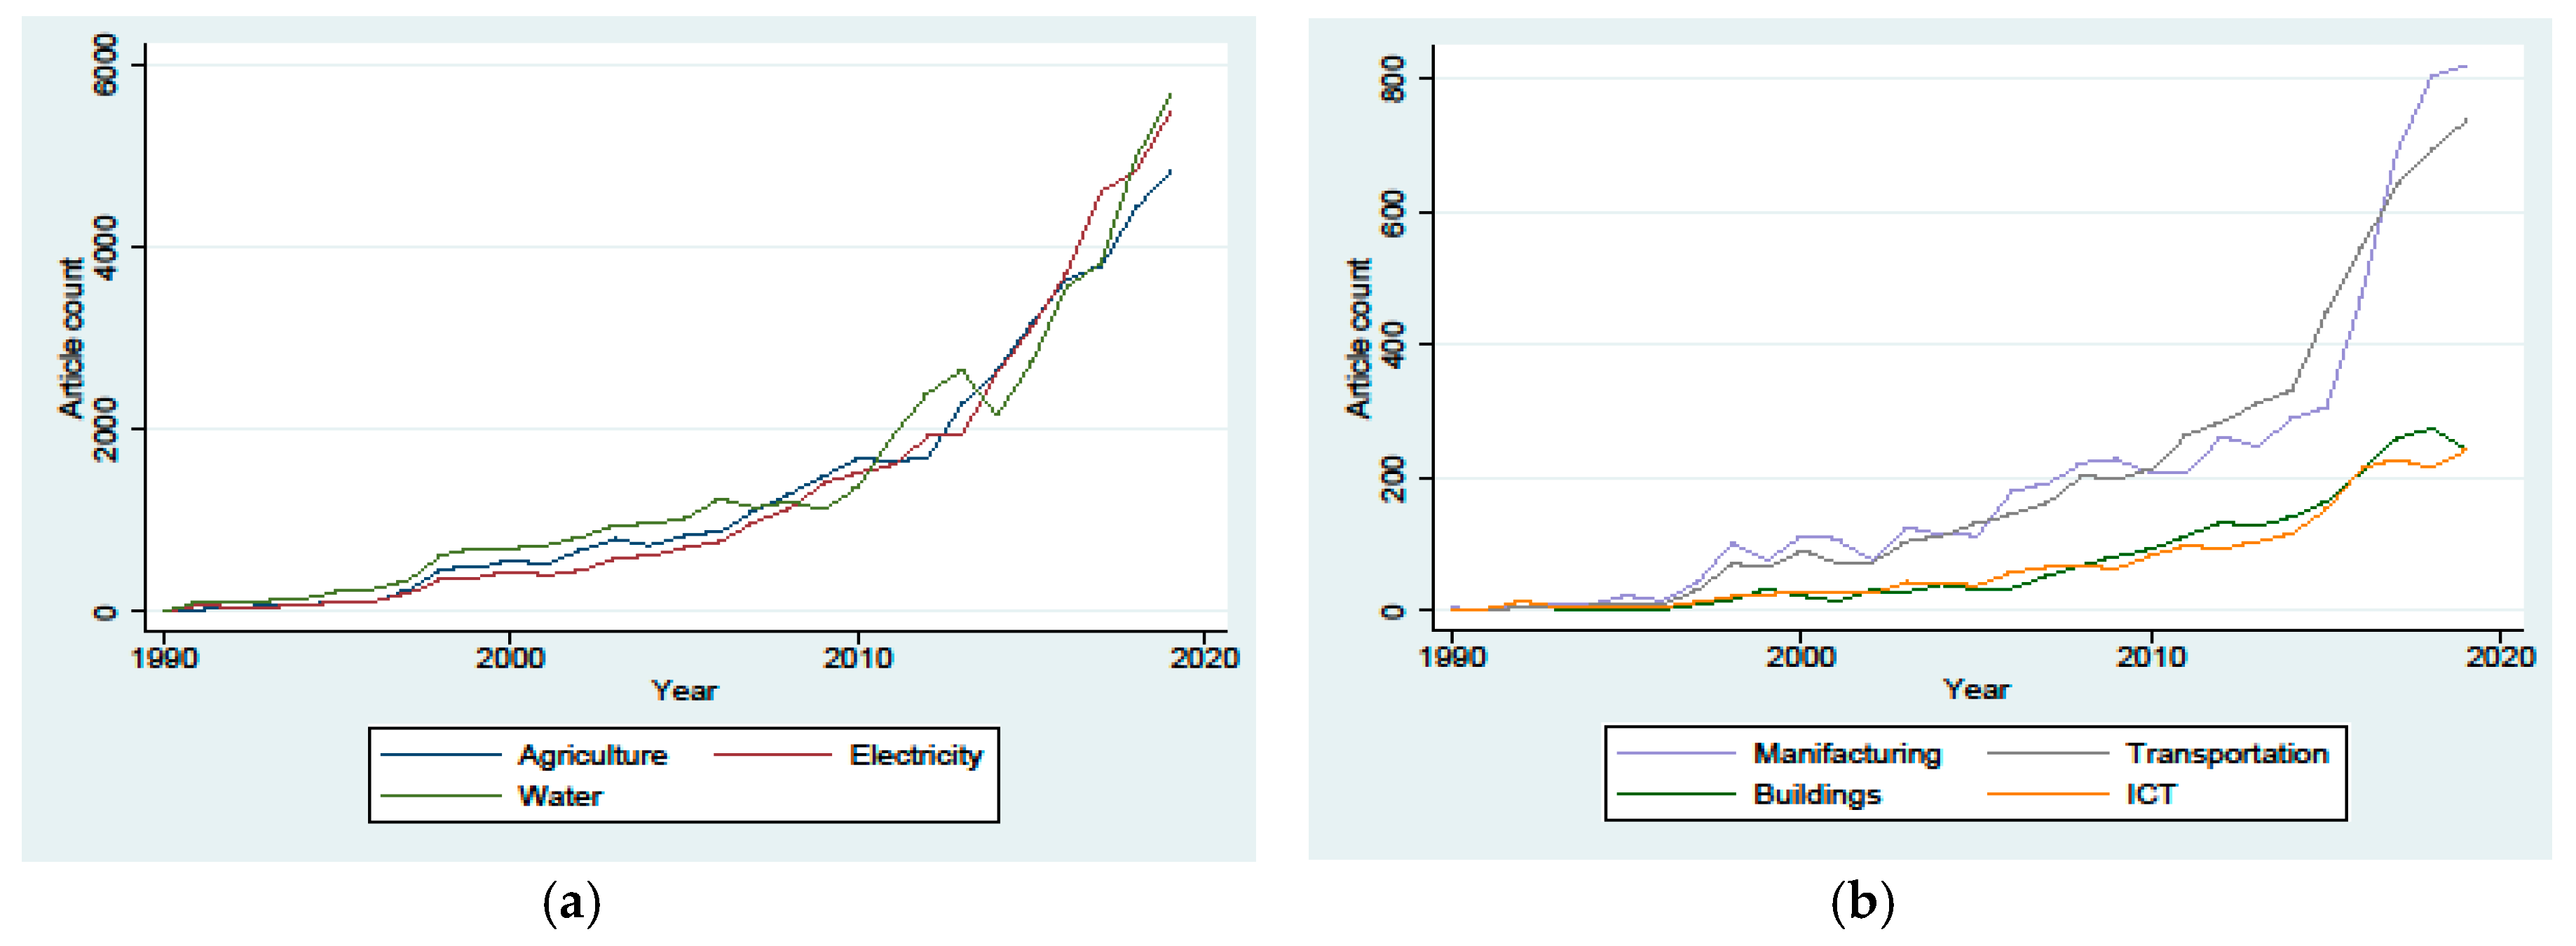
Figure 2 illustrates that all macro-sectors showed a growth trend over time, with a substantial increase in the last five years, as a result of the research community’s increased attention towards climate change topics, also for more applied fields. Compared to 2014, the number of publications about Water, Electricity, and Agriculture are almost doubled at the end of 2019, while for Manufacturing and Transportation they tripled.
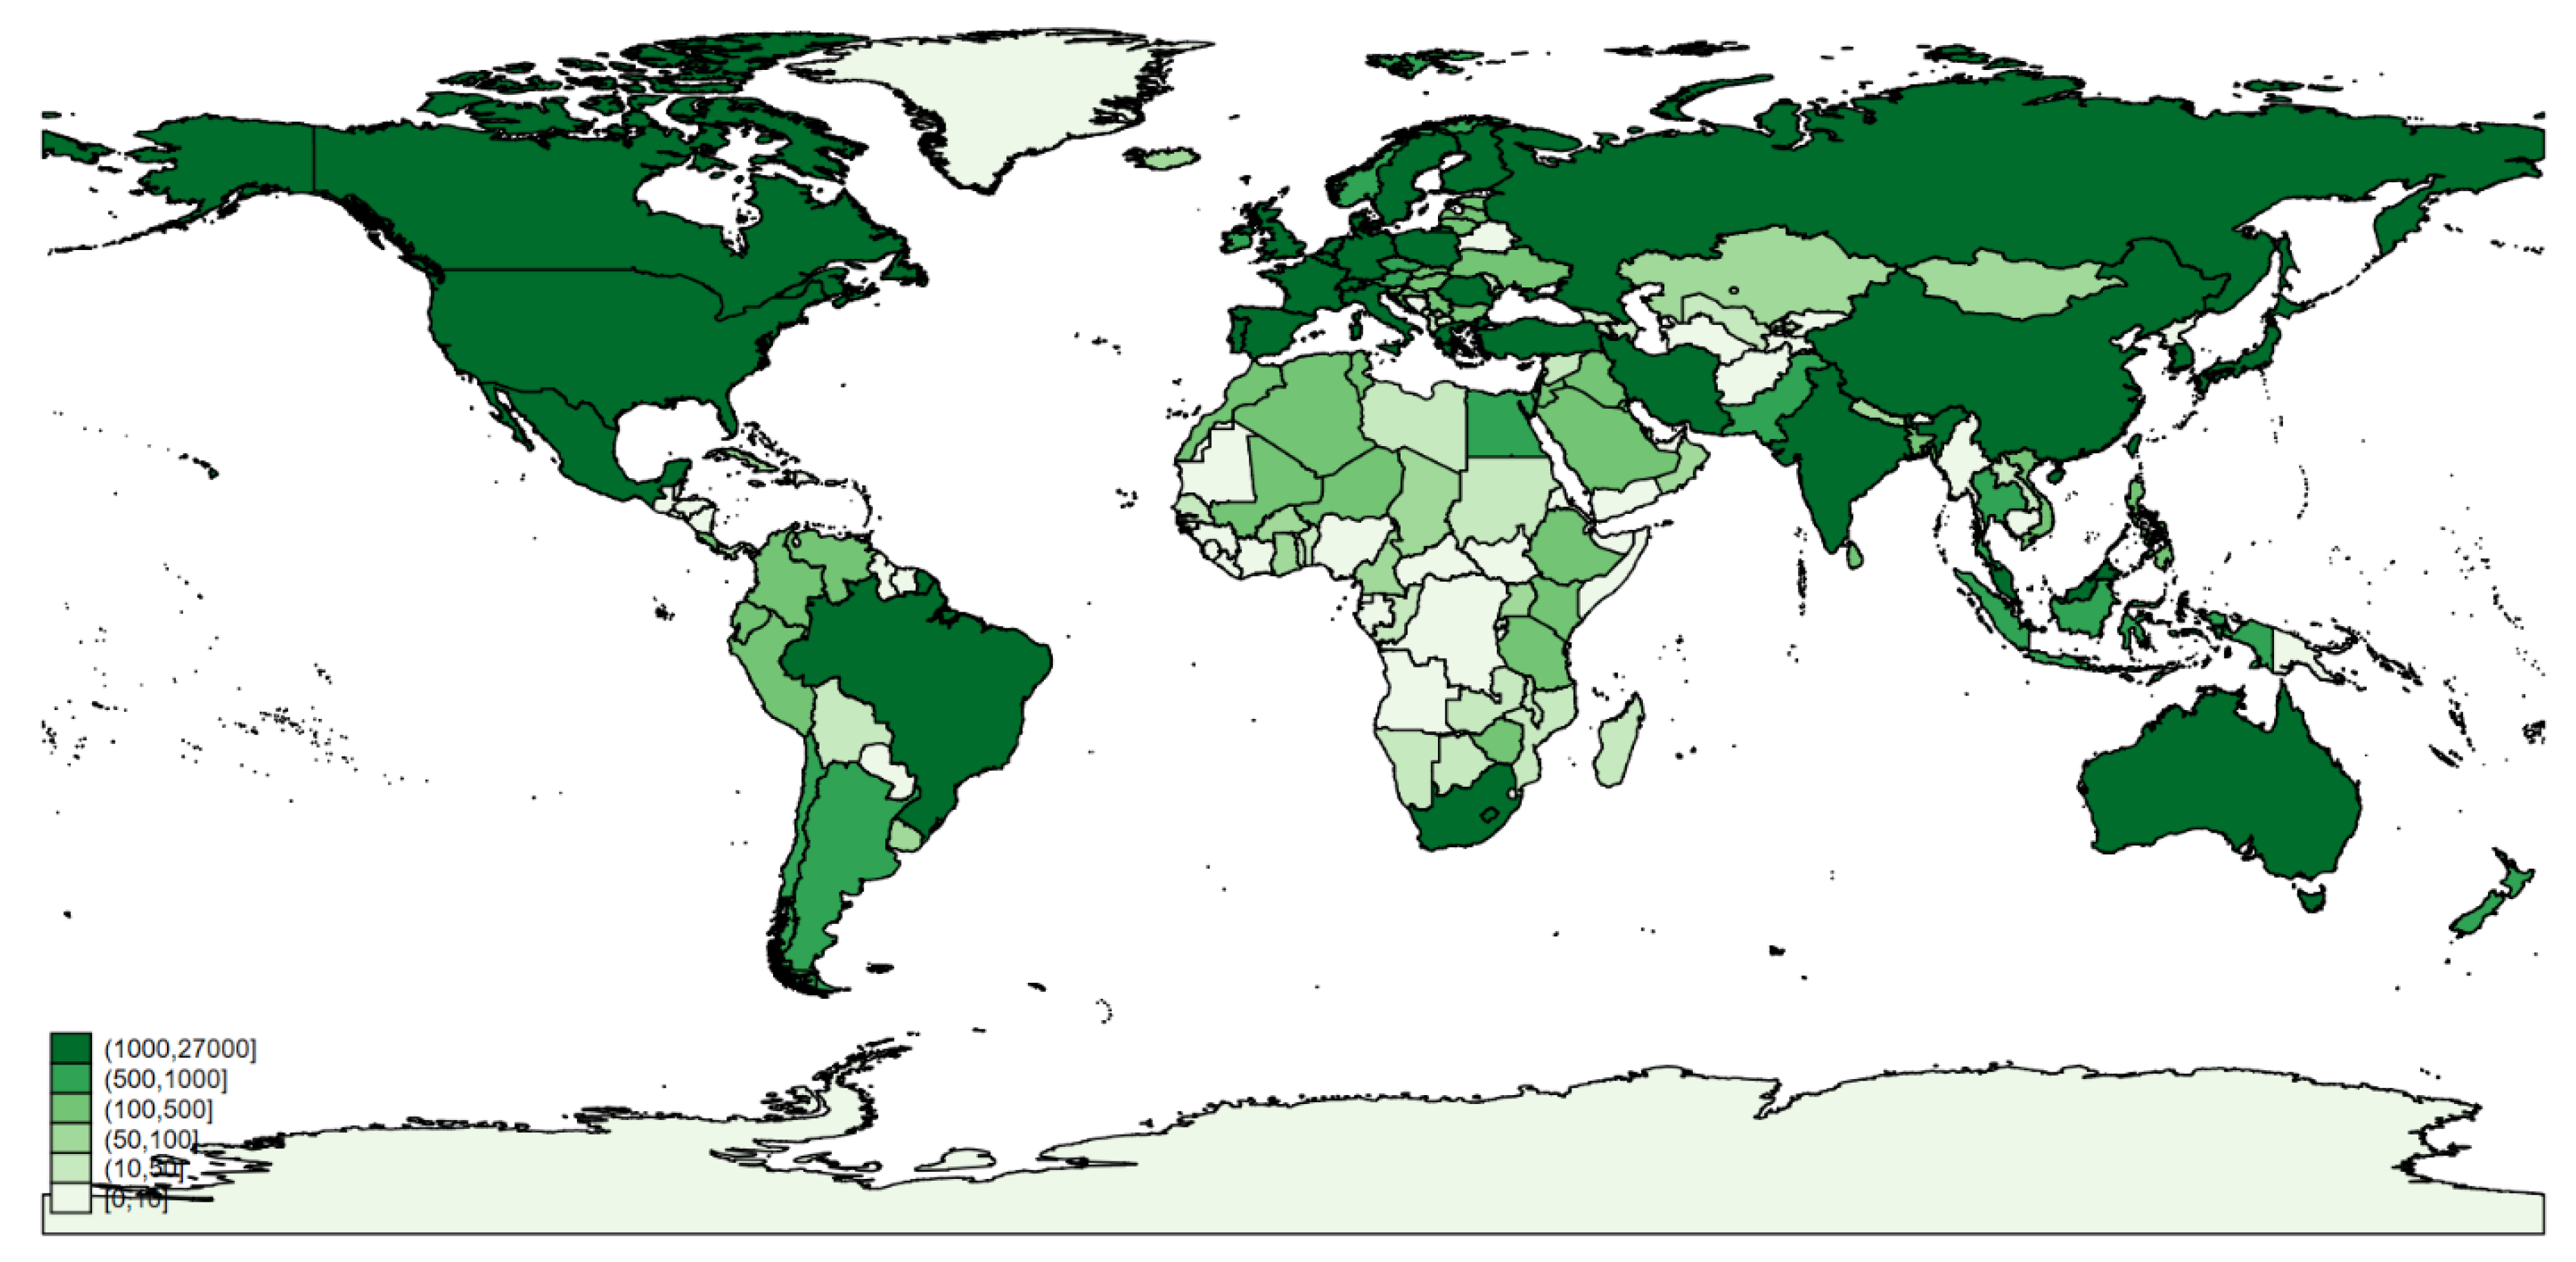
In Figure 3, we show the geographical distribution of scientific papers by the nationality of authors’ university affiliation; the darker green color indicates a higher number of papers published. Notably, EU Taxonomy-related publications are widespread at the global level, including developing countries. As expected, the United States, China, and Great Britain show a larger number of publications, but EU Member States are well represented, as well. In line with the findings of [37], we found notable sources of literature for sustainability issues in Australia, Brazil, Canada, Russia, and South Africa.
4.2. EU Taxonomy in the Scientific Literature: Topic Modelling Analysis
Since the abovementioned data obtained from the WoS core collection were extracted using keywords, we performed a further analysis to provide a thematic landscape of research papers in the EU Taxonomy-related areas, by making use of the latent Dirichlet allocation (LDA). The LDA is an unsupervised Bayesian machine-learning approach developed by [42] that identifies latent topics in a corpus of documents. The basic assumption of LDA is that each document exhibits a mixture of latent topics and, using the probability of words co-occurring within documents, it allows the identification of sets of topics. In recent years, the LDA model has become the most widely used approach for topic modelling. Following [37], we applied the LDA to the abstracts of scientific literature related to the Taxonomy for each corpus (i.e., six bodies of literature). The publications are aggregated by environmental objective and, as a result, we obtained a list of salient key terms associated with the overall corpus as well as a maximum of four topics, with a list of associated topic-specific key-terms.
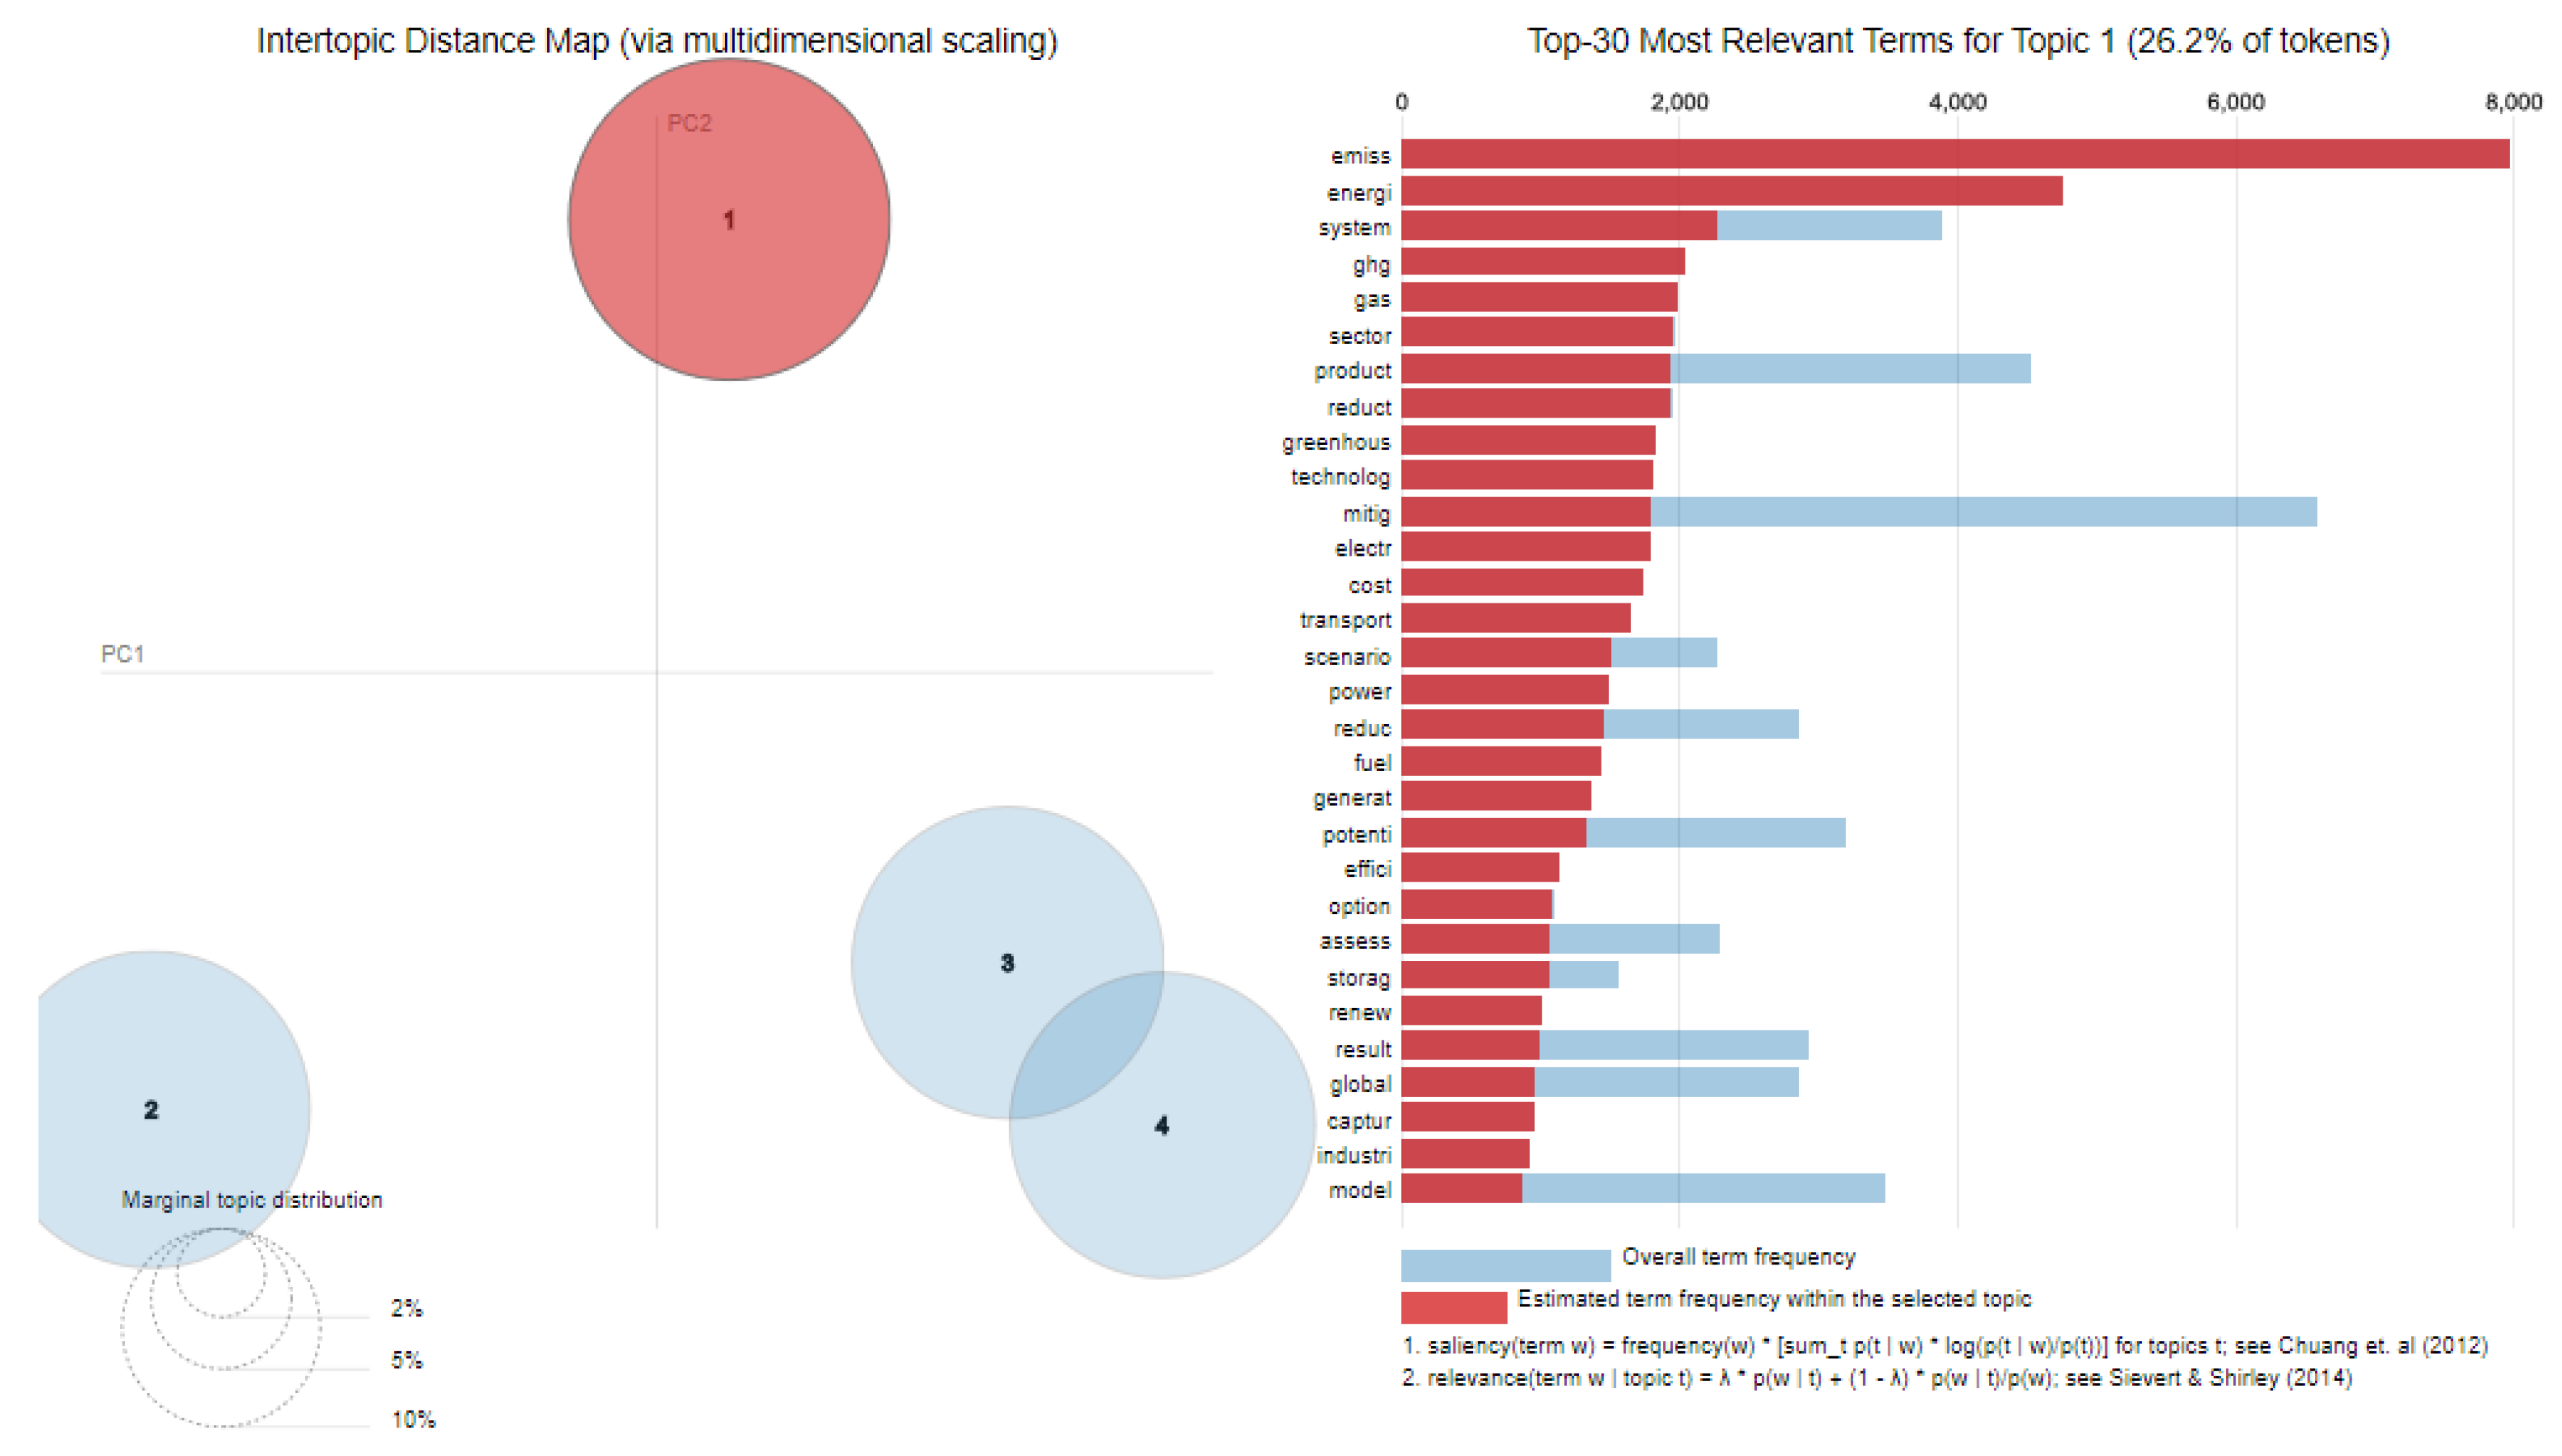
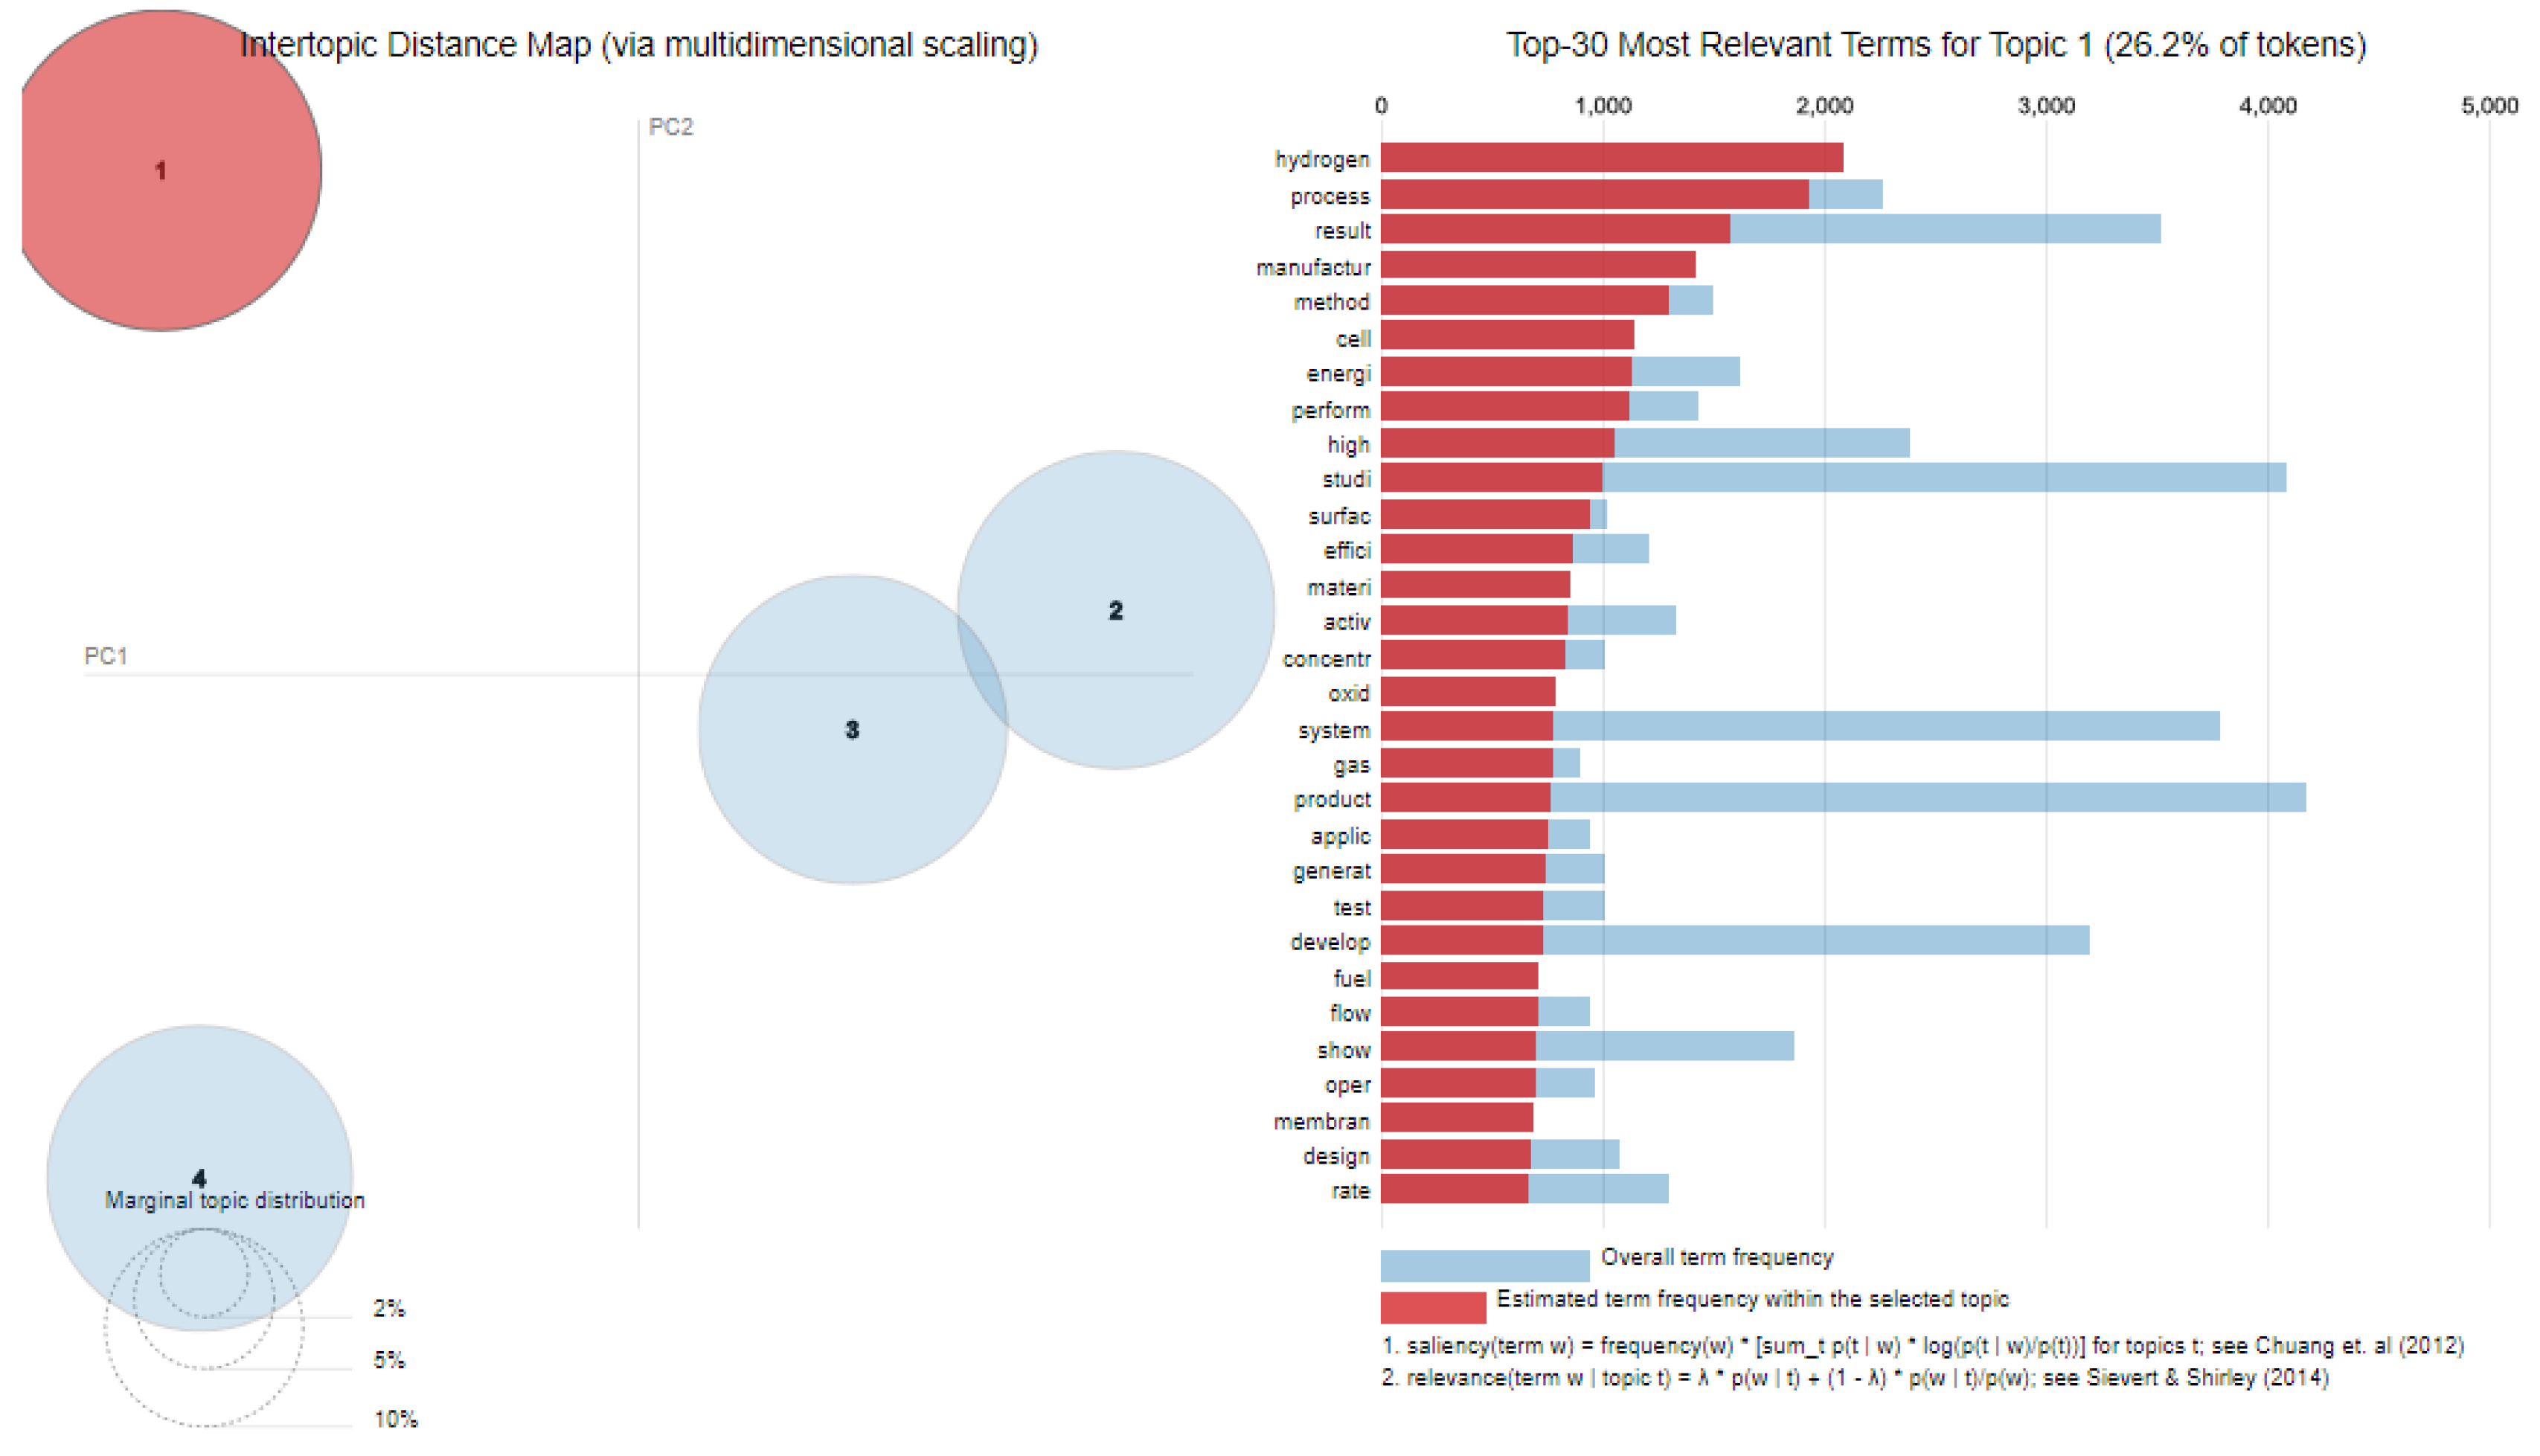
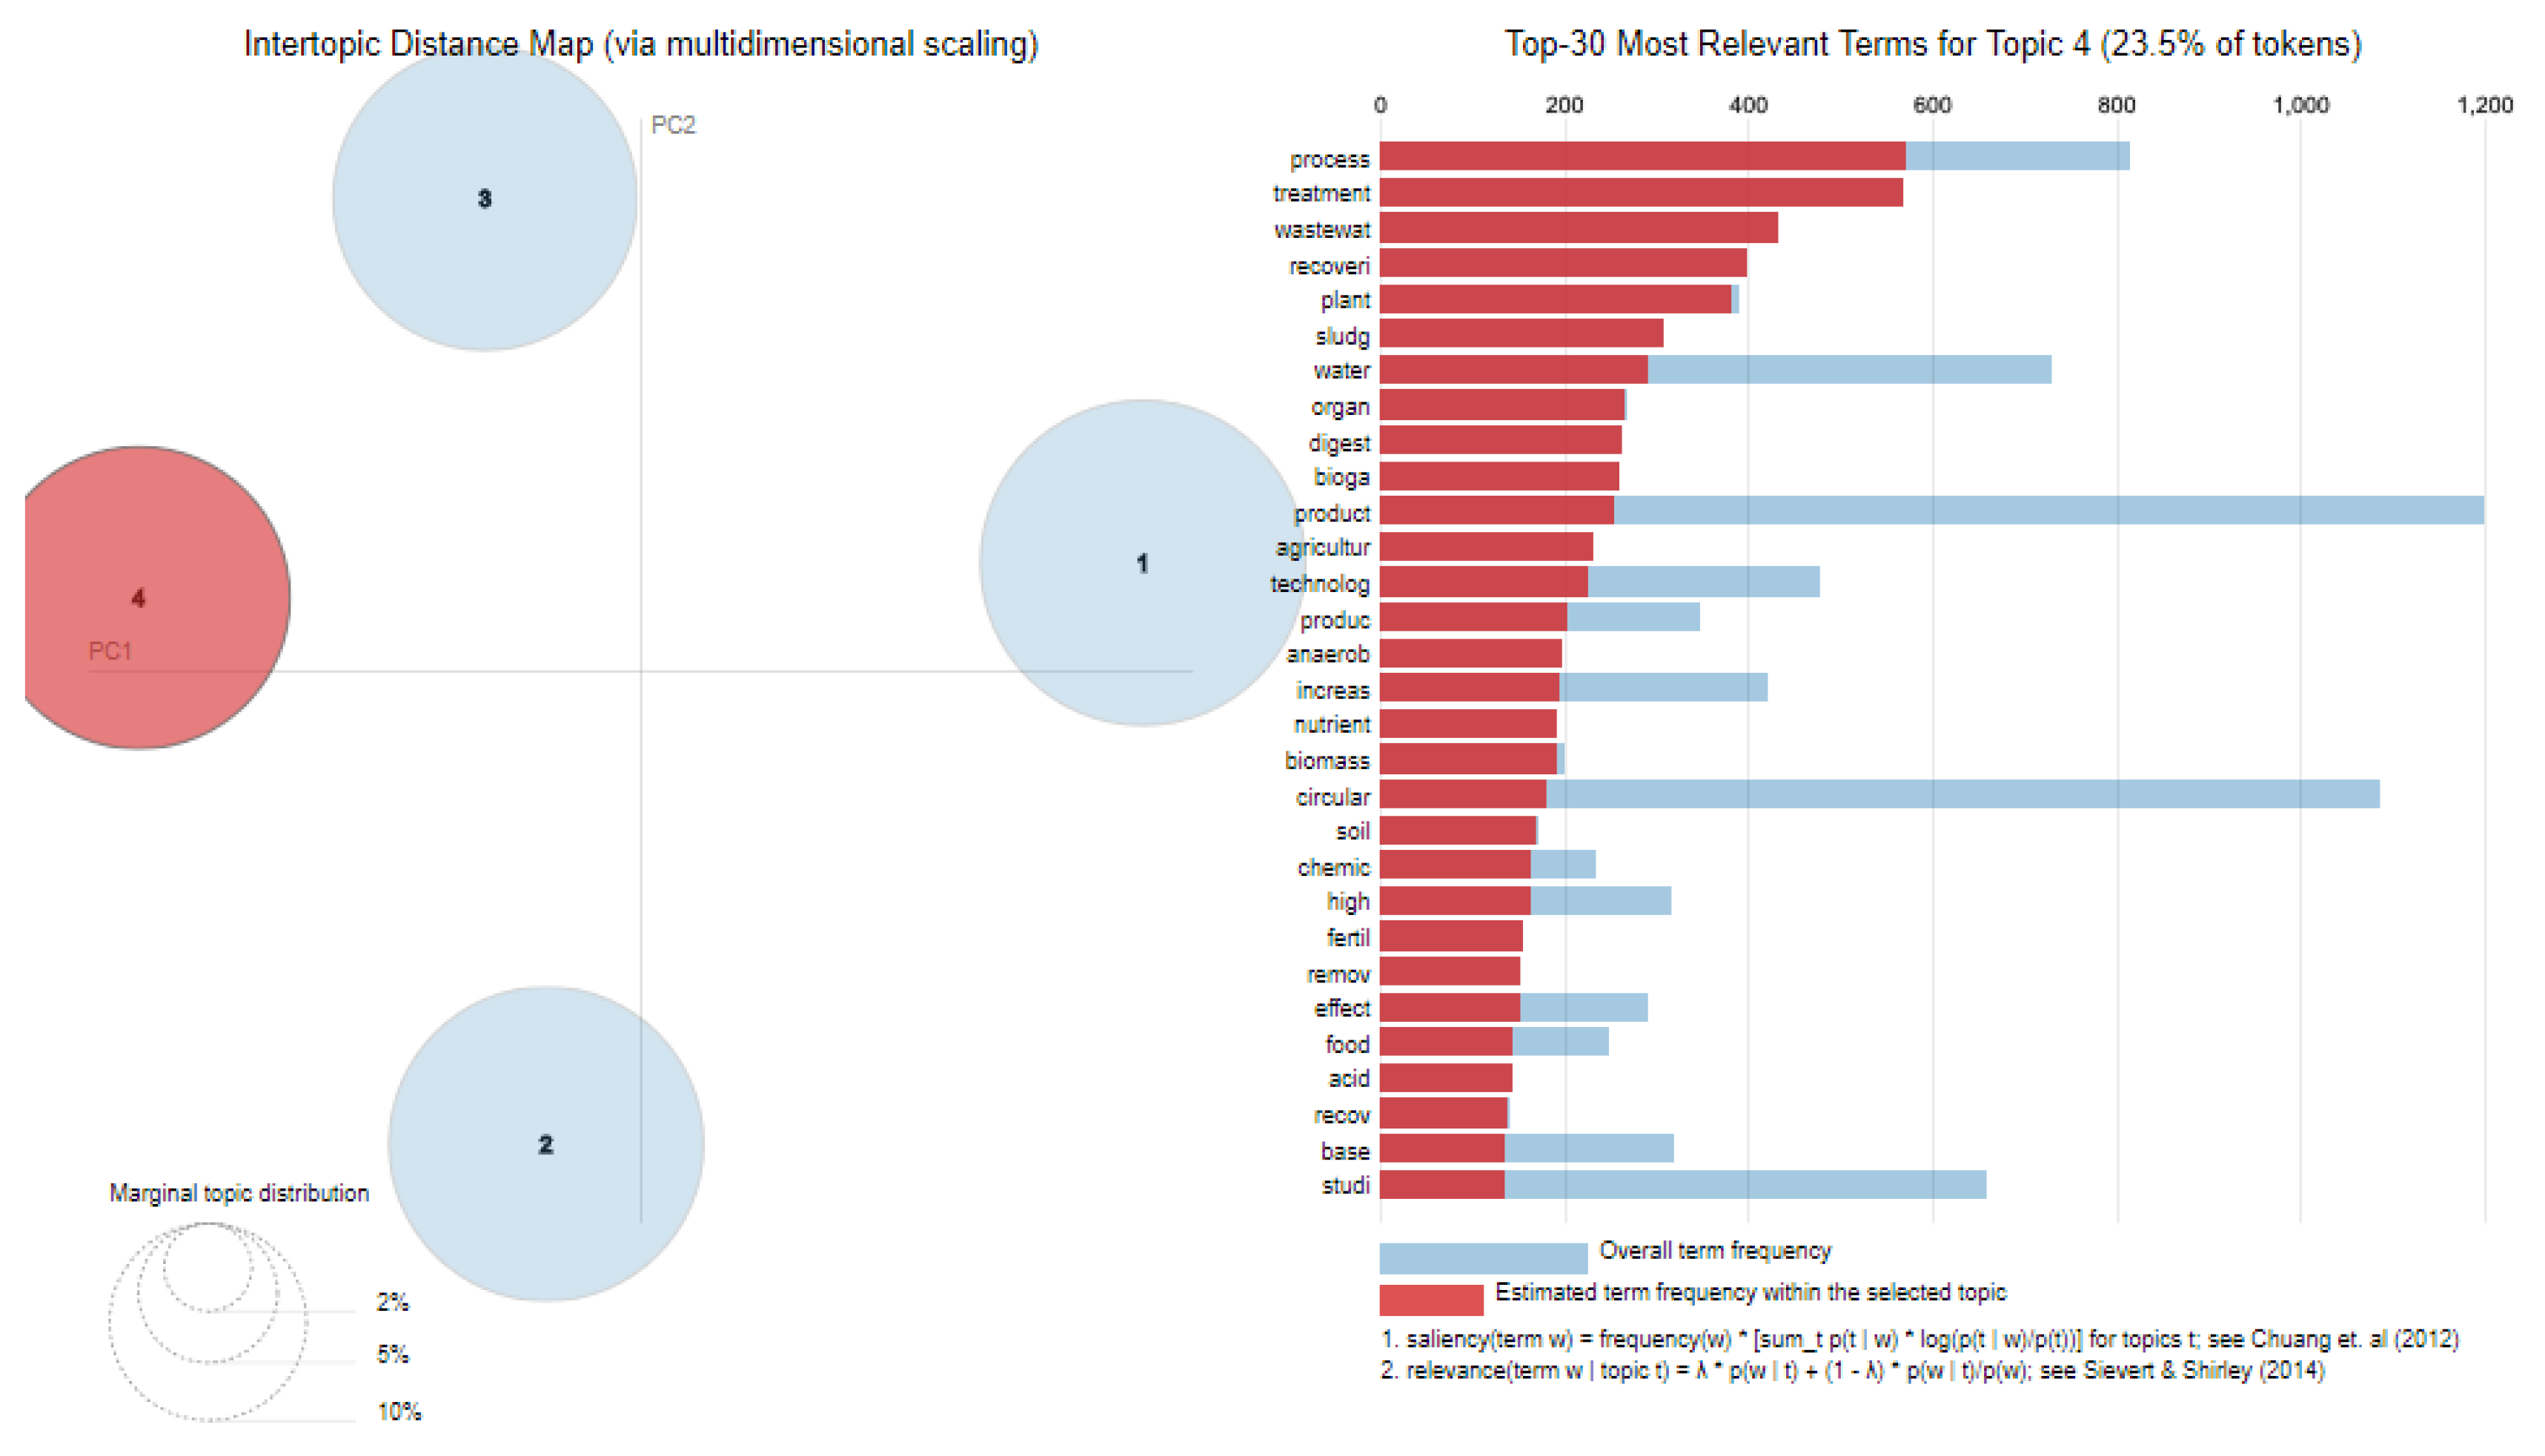
For a selection of three research-relevant objectives (namely, the ‘Climate change mitigation’, ‘Climate change adaptation’, and ‘Circular Economy’), we programmed the model to highlight four topics and identify the key-terms associated with the topics. The model also calculates the distance between topics on a two-dimensional plan. This scatterplot, based on multi-dimensional scaling (MDS), enables the visualization of semantic relationships between topics, such that topics (circle areas) that appear distant in the graph, are the ones semantically distant. As a matter of fact, like factor analysis, MDS allows the level of semantic similarity or distance between topic to be visualized [37]. Figure 4, Figure 5 and Figure 6 represent the visualized application of the LDA utilized to perform the topic generation of the analyzed abstracts in order to explore hidden semantic structures. In the left panel of Figure 4, Figure 5 and Figure 6, we plot in the scatterplot the topics as circles. The right panel depicts a horizontal bar chart whose bars represent the most salient key-terms, useful for interpreting the selected topic on the left (highlighted in red). A pair of overlaid bars represent both the overall term frequency (in blue) as well as the topic-specific frequency of the term (in red). We encode each topic’s overall prevalence using the areas of the circles, where we sort the topics in decreasing order of prevalence. In Figure 4 and Figure 5, we provide a snapshot of the results from the LDA analysis for the objectives ’Climate change mitigation’ and ‘Climate change adaptation’, which were the object of greater emphasis by the TEG. Topics that emerge most frequently in the analyzed literature are related to environmental performances and climate-related issues (see e.g., Topic 1 in Figure 4). This evidence suggests that although the sample has been constructed using just keywords, the extracted scientific literature deals with issues that are fully compliant with the aims of the EU Taxonomy.
In addition, another topic that emerges frequently in the corpuses analyzed is related to production processes and their optimization. Salient words such as, among others, plant, processes, efficiency, material, methods, and technology can be associated with the research area of production efficiency (see Topic 1 in Figure 5).
Similar considerations can be made for the literature on Circular Economy which revolves around resource-efficiency, recycling and, more generally, increasing resource productivity (see Topic 4 in Figure 6).
In line with [37], we find that salient key-terms relating to Circular economy are associated with environmental sustainability such as waste, energy, and recycling. The analysis of the co-occurrence of words shows that the words ‘agriculture’ and ‘water’ recur in every examined corpus.
Up to this point, the topic model analysis highlights the prevalence of papers related to business innovation, with an emphasis on process improvements, which are ultimately expected to improve the environment. The rise of renewable energy, as well as the reduction and measurement of pollution levels, with an increasing green awareness, have configured economically, renewably, and socially sustainable business approaches harnessed by technologies [43]. Such evidence is in line with the literature claiming innovation to be an important tool for achieving sustainability [44,45,46,47,48,49,50]. Some studies posit a significant and positive relationship between innovation and sustainability, supporting the argument that companies need to innovate, develop new products, redesign existing products, and invest in research and development for construction, sustainability, and innovation. In addition to this, the pressure from interested parties, in a broad way, is a motivator for companies to undertake an innovation process that leads towards sustainability [51,52,53]. To the extent that business sustainability is understood as an effective contribution to sustainable development, then innovations will have greater impacts on the development of more sustainable production cycles, products, and services, and even, on new business management models [54,55].
4.3. EU Taxonomy Publications and Pollution
4.3.1. Regression Analysis
Supported by the abovementioned findings and also by the most recent literature—suggesting that low-carbon technology innovations, especially when complemented by traditional policy tools such as carbon trading and carbon taxes, might be effective in shaping firms’ environmental sustainability performance [14,15,16,17,18]—we exploit time series and geographical information of our collected dataset to develop and estimate an econometric setting that investigates the relationship between the Taxonomy-related scientific production, as a condition for innovation towards sustainability, and the sustainability goal related to the reduction of CO2 emissions. Such research is also grounded on the literature dealing with the societal impact of scientific research [56], given that scientists are increasingly under pressure to communicate their research better, to interact with the public, and to prove the “societal” impact of their work [57]. In particular, the latter is a hot topic in the environmental arena where the benefits coming from research are those that benefit the natural capital of a nation, by reducing waste and pollution, and by increasing nature preserves or biodiversity [56]. In this sense, we add to the previous literature in that we investigate: To what extent does the scientific production in EU Taxonomy-related areas have a societal impact in terms of pollution reduction? To address this research question, we hypothesize a relationship between the knowledge accumulated thanks to scientific research, on a global scale—and disseminated through WoS publications—and subsequent pollution levels. Here, and as is widely used in the literature see, e.g., [27,28], pollution is measured by CO2 emissions. Thus, we estimate the following equation:
The dependent variable is the total per capita emissions of carbon dioxide in country c at time t, as this proxy of pollution allows a cross country comparison of the pollution levels without reflecting a mere size effect. Taxonomy is our main variable of interest, which is defined as the cumulative sum over the previous three years (from t-1 to t-3) of the number of scientific papers related to EU Taxonomy issues, per capita published by authors in country c. We use the cumulative sum of scientific production over three years. Such a lag identification [58] is used here to alleviate threats to causal identification and to take into account that scientific achievements need time to be applied and implemented into production technologies. Following the previous literature see, e.g., [27,28], we control for a number of time-varying country-specific variables that may explain the different levels of emissions [59,60]. We include the real per capita GDP and the squared per capita GDP. We define the dummy variable recession that is equal to one for negative GDP growth and population is the country population in millions. These independent variables are lagged one year. By doing so, we also contribute the literature investigating the relation between economic growth and pollution [27,28]. In fact, in the early stages of economic growth, an increase in per capita income is associated with higher levels of pollution, but beyond a certain level of income per capita, the environmental impact indicators improve. This relationship has come to be known as the environmental Kuznets curve; however, contrasting results are quite frequent in empirical papers because the signs of the coefficients depend on the specific set of countries under consideration [59,60,61,62]. While the relationship between pollution and economic outcome is a topic of great interest, it is out of the scope of the present paper. Additional factors have contributed to explaining carbon emissions patterns, such as regulation, international trade, liberalization, and market mechanisms see [63,64] for a review of the literature. Rather, we have focused on the relationship between research, and specifically, that related to the environmental objectives and macro-sectors as identified in the EU taxonomy, and CO2 emissions. We also exploited additional information about the scientific works related to the EU Taxonomy regarding the year of publication and the country of origin of the authors.
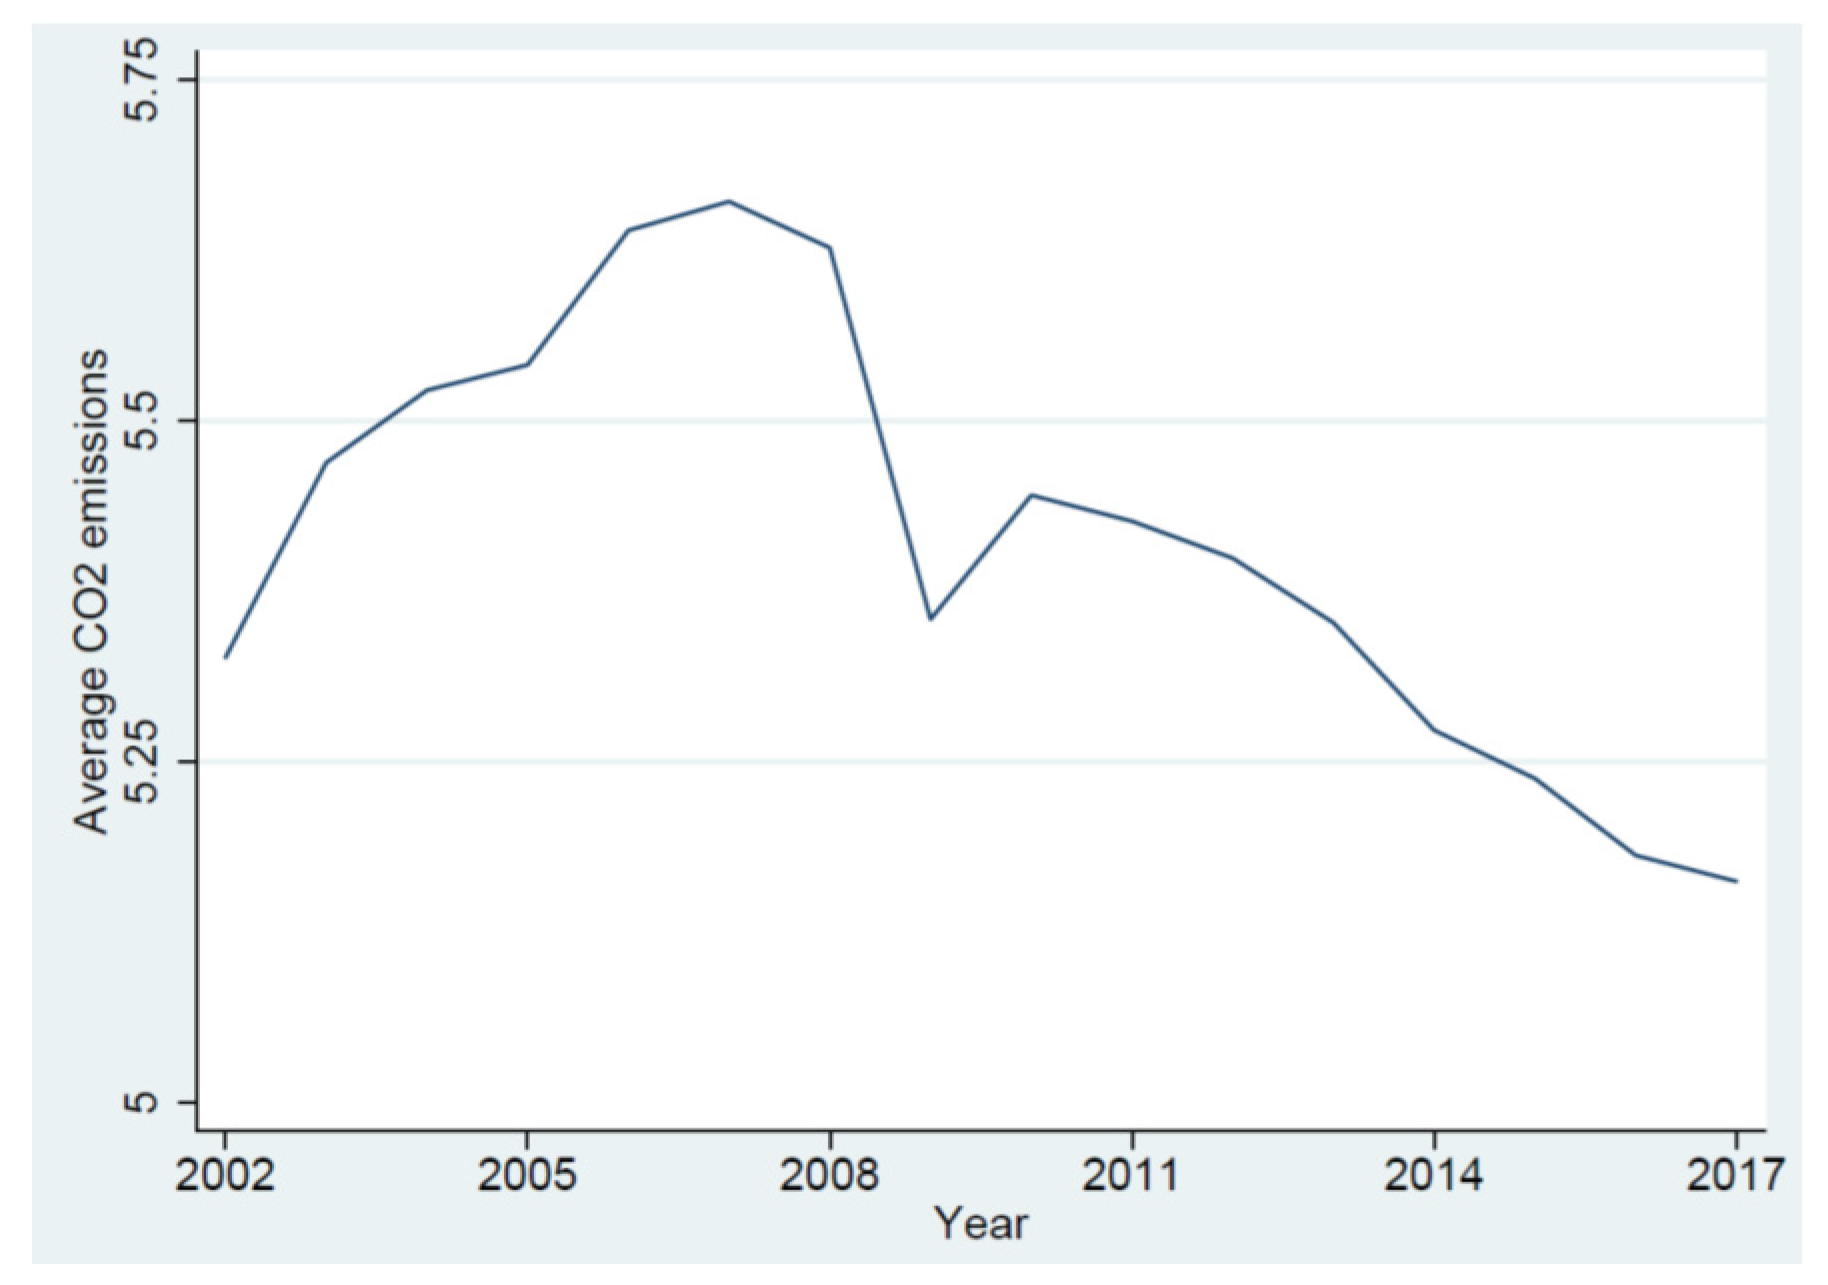
Importantly, we controlled for different levels of scientific research with the logarithm of the number of scientific publications computed, consistently with Taxonomy, as the cumulative sum over the previous three years. In addition, we saturated the empirical specification with country and time fixed effects. This controls for the possibility that our results were driven by omitted country specific variables and eliminates time-varying factors that are common to all countries. In the regressions, standard errors are clustered at country level. All variables are winsorized at 1 and 99 levels. As documented in the previous section, EU Taxonomy papers are authored by scientists from all over the world. Thus, to exploit the cross-country dimension as much as possible, CO2 emissions data were downloaded from the International Energy Agency (IEA). All additional control variables were retrieved from the World Bank. The final dataset was assembled based on the country-year variables. In the Appendix A, we report detailed definitions of all variables (Table A2), as well as the summary statistics (Table A3). Because data on carbon emissions and country controls are not available for each country-year, the number of observations is reduced to, at most, 2006 and the regression analysis covers the period 2002–2017. Figure 7 shows the average trend over time of the CO2 emissions per capita. We can notice a quite substantial increase in the years 2002–2006, but afterwards, the average pattern displays a small but constant decrease. The aggregate trend nonetheless hides a significant heterogeneity existing among countries that was then exploited in our econometric approach.
4.3.2. Findings of Model Estimations
The results shown in Table 2 model (1) respond to our second research question regarding the effect of the EU Taxonomy-related scientific production on the CO2 emissions: Higher level of research in the EU Taxonomy areas is associated with lower per capita carbon emissions. Moreover, a one (1.0) standard deviation increase in Taxonomy is associated with a decrease of carbon emissions per capita by 0.79, suggesting that the effect is slightly less than proportional.
Looking at the control variables, we highlight the non-linear relationship with the logarithm of the GDP, and the negative and statistically significant relationship between recession and CO2 emissions, suggesting the inherent difficulties of keeping economic growth paired with low levels of pollution [61,64,65]. The coefficient of Scientific productivity is positive but not statistically significant. In models (2) to (7), we consider the variable Taxonomy computed along with each of the six environmental objectives. We find that the scientific papers related to the EU Taxonomy objectives are all negatively associated with pollution levels. The point estimates are significant at the 1-percent statistical level in all models, except Taxonomy-Circular economy that is significant at the 5-percent statistical level. Taxonomy-Water and Marine resources is the objective with the highest economic impact among the six, followed by Pollution and Biodiversity/Ecosystem.
Next, we exploited the sectoral dimension of the EU Taxonomy, summing up the numbers of scientific papers along each activity. The results, presented in Table 3, below, show that scientific research on all the macro-sectors listed in the EU Taxonomy is negatively associated with levels of pollution and, with the exception of Taxonomy-Manufacturing, all coefficients are highly statistically significant. Electricity, followed by Agriculture, and Water, are the EU Taxonomy macro-sectors with the largest environmental impact. The results of Table 2 and Table 3 suggest a good level of science–technology interaction in the area of environmental issues; this trend is evident throughout the EU Taxonomy-related scientific literature, regarding both general environmental objectives and more applied fields.
In Table 4, we report additional results. In models (1) and (2), we run separate regressions for the sample of OECD and non-OECD countries. Worthy of note in our findings, the effect of Taxonomy is more pronounced for non-OECD countries. This implies that less economically developed countries benefit more from scientific research oriented to address environmental aspects in terms of the reduction of CO2 emissions. For OECD countries, the coefficient of Taxonomy is negative but not statistically significant. This does not mean that scientific research devoted to addressing climate-related issues is not valuable in developed countries. Rather, it suggests that for those countries with production systems based on advanced technologies, the marginal benefit in terms of lower carbon emissions is low and difficult to capture with an aggregation at country level. Given that the EU Taxonomy was developed by the European Commission, in Table 4, models (3) and (4), we investigated whether European countries have gained a greater advantage than non-EU countries from EU taxonomy-related scientific research. Consistent with the results shown in models (1) and (2) of Table 4, below, we found that this is not the case. In other words, the marginal benefit in terms of lower carbon emissions is more easily detected in non-EU countries, where environmental issues are more recent and still part of a mindset change.
Furthermore, seeing as scientific research in the WoS is clearly English language-biased, one possible concern is that our results were driven only by those countries in which English, or a language close to English, is the main language. To address this point, we split the sample based on the English proficiency of each country. Notably, models (5) and (6) in Table 4 show that our main results are confirmed for both subsamples, suggesting that language skills are not an issue in the environmental science-technology effect. In order to add an additional investigative step on the effects of the EU Taxonomy-related scientific production that would capture the quality of the research, we looked at the number of citations, as a main determinant of the CO2 emissions, leaving the set of control variables unchanged. Model (7) in Table 4, shows that the total number of citations is negative and statistically significant, while the standard deviation is positive. This suggests that the quality of research related to taxonomy matters, but just a few often-cited publications are not enough to have an impact on reducing carbon emissions.
Our findings are robust to a series of robustness checks. Firstly, since our analysis covers a time span in which significant international events related to pollution issues happened, including the Kyoto Protocol that marked a turning point, in Table A4 in the Appendix A, we split our sample into three sub-periods to test whether the relationship between taxonomy related scientific production and CO2 emissions has changed. The Kyoto Protocol setting binding emission reduction targets not only contributed to the reduction of the CO2 emissions in some countries, but it also has influenced the scientific research related to environmental topics and stimulated patenting activities [66]. Adopted on 11 December 1997, the Kyoto Protocol underwent a complex ratification process and entered into force on 16 February 2005; then, it was further modified with the Doha Amendment on 8 December 2012. We find that the Taxonomy coefficients in model (1) and (2) are very similar, while it is reduced to 0.13 in the period 2013–2017 (model (3)). Importantly, the parameters of interest are statistically significant in all three subperiods. Thus, despite a lower importance in the years 2013–2017, the negative impact of Taxonomy-related research on pollution is confirmed.
Secondly, in Table A5 in the Appendix A, we include additional control variables that approximate different levels of investment in scientific research across countries (models (1) to (3)). Specifically, we consider R&D expenditures as a share of GDP; the related coefficient suggests that a high level of R&D is associated with higher levels of pollution. Our results are robust to control for different levels of government expenses in education. We also control for natural differences across countries, which may lead to different carbon emissions with variables for oil rent, energy use, and energy production from renewables (models (4) to (6)). The inclusion of these variables does not affect our main findings. Finally, our results are also confirmed when considering a longer time span to compute Taxonomy, i.e., a cumulative sum over four or five years.
While the documented effect of the EU Taxonomy scientific literature on pollution cannot be interpreted as causal, being possible that carbon intensity and environmental research are affected by a common factor, our findings suggest a notable interrelation between scientific production and the improvement of environmental sustainability. The link between research and innovation is well-known [1,2,3], and, indeed, the scientific literature in EU Taxonomy-related areas evidently fosters innovation towards sustainability, allowing for a benefit to the natural capital of countries, by reducing CO2 emissions and other forms of pollution [56]. The use of EU Taxonomy-filtered scientific production also proves the evidence-based policy making approach adopted by the European Commission; it is thanks, in no small part, to the role played by the TEG in particular, which was instrumental in narrowing the gap in the science–policy interaction. Last but not least, marginal benefit in terms of lower carbon emissions is more easily detected in non-EU countries. This suggests that somehow, for years, scientific production in the EU context has had a role in shaping environmental policies and has therefore contributed to the mindset change on environmental issues, worldwide.
5. Conclusions
Drawing inspiration from the European Commission’s recent publication the EU Taxonomy and addressing the issue of evidence-based policy making, the main aim of this paper is to investigate the link between the policy guidelines included in the 2020 EU Taxonomy and the 30 years’ worth of scientific production in EU Taxonomy-related areas. Moreover, supported by the long-standing relationship between research and innovations introduced by firms, the present paper explores the societal impact produced by the EU Taxonomy-related scientific literature, in terms of its relationship with pollution, here proxied by CO2 emissions.
The key findings we document are: (i) The EU Taxonomy takes advantage of the extensive scientific literature of the last 30 years, in terms of environmental objectives and economic activities; (ii) the scientific production related to the EU Taxonomy is negatively associated with the subsequent level of carbon emissions, particularly for developing and emerging countries.
The association of the EU Taxonomy-related scientific production with a reduction of pollution levels, all other drivers remaining unchanged, lead us to argue that innovations that come from research do have an impact on the environment. Even more importantly, EU Taxonomy-related topics have been now incorporated into policy measures (the EU Taxonomy itself and the other regulations that are going to refer to the Taxonomy) and this reinforces expectations for positive impactful environmental effects, from here on out.
In a broader perspective, our findings show that supporting environment-related research can contribute to a reduction of carbon emissions. Indirectly, this suggests that supporting research and development, innovation, and applied knowledge with specific environmental objectives may contribute to the pursuit of sustainable growth strategies. Given that the normative process for the implementation of the EU Taxonomy remains ongoing, a further and future mandate emerges for the scientific research community, that is, to document how market operators will use this classification system in order to aim for the ultimate success of the Taxonomy initiative and, indeed, the achievement of its long-term environmental goals.
We are aware that this analysis of the EU Taxonomy in the context of the scientific literature represents only the initial step toward a more comprehensive assessment of this classification system. Further research is needed in various areas, and should be oriented toward verifying the specific efficacy of EU Taxonomy enforcement of its main goal, i.e., the channeling of financial flows towards sustainable economic activities; this research should include analyzing companies’ strategic choices as well as the disclosure system in the financial marketplace.
In fact, on the side of large companies in need of being financed, enforcement of the Taxonomy could not only influence firms’ strategic decisions, but could also be a powerful incentive to invest in activities aligned with environmentally sustainable growth, in an expected pattern of business model innovations to fill existing technological gaps. It is worth pointing out that the EU Taxonomy offers detailed criteria for determining, in a non-ambiguous way, whether an economic activity is environmentally sustainable, or not. Therefore, further research should be targeted to measuring the reactions of companies in terms of both reshaping their business models and strengthening their disclosure of environmentally sustainable activities. Subsequent research could also entail analyzing the effect of Taxonomy enforcement on reducing miss-classifications or manipulations of information, hidden behind the well-known phenomenon of greenwashing.
On the side of financial market participants offering financial products, the Taxonomy alignment appears to constitute a crucial step toward reducing transaction costs and information asymmetries. When the relevant market actors start to comply with the regulations, avenues for future research lead to empirically testing these points and to fully evaluate the effectiveness of this classification system. In fact, existing studies, and mainly actors in the financial marketplace, rely on environmental, social, and corporate governance (ESG) indicators, as they focus on the environmental factor, in particular see, e.g., [67]. A growing demand for ESG themes has led to a proliferation in rating offerings; however, their reliability and comparability are questionable, as agencies adopt different methodologies [68]. While our paper applies the EU Taxonomy to the scientific literature, we believe that a similar procedure, using text analysis, could be applied to companies’ balance sheets and reports in the future. This qualitative data could complement the quantitative data and be used to measure the percentage disclosed by the company of the Taxonomy-aligned turnover (or capital expenditure). The outcome could help in better identifying Taxonomy-aligned companies, offering a more objective and comparable source of information to build ratings or scores, thus enriching the scientific debate in economics and finance.
Nevertheless, some limitations of this paper must be recognized. Firstly, it relies only on the literature obtained from the WoS core collection, which might not cover all the available literature on the scientific domain. Hence, our results could be biased by the fact that we apply a classification system—identified by European regulators mainly for European companies—to a worldwide scenario. Other geographical areas or countries may have different environmental objectives and priorities that nonetheless may lead to an environmentally sustainable growth. For those countries, our sample may underestimate the impact of scientific productivity. It is true that the EU Taxonomy is expected to exert a significant influence both for reporting standards and setting green criteria at the international level and not exclusively in Europe. However, whether or not this will actually happen is far from obvious. Secondly, a revision of the technical criteria of the EU Taxonomy, and of the transition activities, is foreseen at least every three years. Thus, the framework proposed in this analysis, could be refitted according to revisions that might be made over time, and this represents an implication in terms of opportunity for future research, as well.
In any case, regardless of the specific classification to be followed, the case of the EU Taxonomy has defined the working method and provided a valuable example of evidence-based policy making, based on the commitment and coordinated efforts of companies, financial market operators, research, and political communities, which are essential for environmentally sustainable growth.
Author Contributions
The work is the result of all the authors’ synergistic contribution. However, each author has dealt with some paragraphs more than others: Conceptualization, C.L.; methodology, S.S.; formal analysis, M.R.; investigation, M.R.; data curation, S.S.; validation, C.M.; writing—original draft preparation, C.M.; writing—review and editing, C.L., C.M., M.R., and S.S.; visualization, M.R.; supervision, C.L.; project administration, C.L. All authors have read and agreed to the published version of the manuscript.
Funding
This research received no external funding.
Acknowledgments
We thank Lorenzo Versaci for outstanding research assistance in the data collection process.
Conflicts of Interest
The authors declare no conflict of interest.
Appendix A

Table A1.
List of 72 economic activities by NACE Macro-Sectors.
| Economic Activities | |||
|---|---|---|---|
| Afforestation (1) | Production of Electricity from Solar PV (3) | Storage of Electricity (5) | Water collection, treatment and supply (6) |
| Rehabilitation, Reforestation (1) | Production of Electricity from Concentrated Solar Power PV (3) | Storage of Thermal Energy (5) | Centralized wastewater treatment (6) |
| Reforestation (1) | Production of Electricity from Wind Power PV (3) | Storage of Hydrogen (5) | Anaerobic Digestion of Sewage sludge (6) |
| Existing forest management (1) | Production of Electricity from Ocean Energy PV (3) | Manufacture of Biogas or Biofuels (5) | Separate collection and transport of non-hazardous waste in source segregated fractions (6) |
| Conservation forest (1) | Production of Electricity from Hydropower PV (3) | Retrofit of Gas Transmission and Distribution Networks (5) | Anaerobic digestion of bio-waste (6) |
| Growing of perennial crops (1) | Production of Electricity from Geothermal PV (3) | District Heating/Cooling Distribution (5) | Composting of bio-waste (6) |
| Growing of non-perennial crops (1) | Production of Electricity from Gas PV (3) | Installation and operation of Electric Heat Pumps (5) | Material recovery from non-hazardous waste (6) |
| Livestock production (1) | Production of Electricity from Bioenergy (Biomass, Biogas and Biofuels) PV (3) | Cogeneration of Heat/cool and Power from Concentrated Solar Power (5) | Landfill gas capture and utilization (6) |
| Manufacture of low carbon technologies (2) | Cogeneration of Heat/Cool and Power from Geothermal Energy (5) | Direct Air Capture of CO2 (6) | |
| Manufacture of cement (2) | Passenger Rail Transport PV (4) | Cogeneration of Heat/Cool and Power from Gas (5) | Capture of anthropogenic emissions |
| Manufacture of aluminium (2) | Freight Rail Transport (4) | Cogeneration of Heat/Cool and Power from Bioenergy (Biomass, Biogas, Biofuels) (5) | Transport of CO2 (6) |
| Manufacture of iron and steel (2) | Public transport (4) | Production of Heat/cool from Concentrated Solar Power (5) | Permanent Sequestration of captured CO2 (6) |
| Manufacture of hydrogen (2) | Infrastructure for low carbon transport (land transport) (4) | Production of Heat/cool from Geothermal (5) | Construction of new buildings (7) |
| Manufacture of other inorganic basic chemicals-Manufacture of carbon black (2) | Passenger cars and commercial vehicles (4) | Production of Heat/Cool from Gas (5) | Building renovation (7) |
| Manufacture of other inorganic basic chemicals-Manufacture of disodium carbonate (2) | Freight transport services by road (4) | Production of Heat/cool from Bioenergy (Biomass, Biogas, Biofuels) (5) | Individual renovation measures, installation of renewables on-site and professional, scientific and technical activities (7) |
| Manufacture of other inorganic basic chemicals-Manufacture of chlorine (2) | Interurban scheduled road transport (4) | Production of Heat/cool using Waste Heat (5) | Acquisition and ownership of buildings (7) |
| Manufacture of other organic basic chemicals (2) | Inland passenger water transport (4) | Data processing, hosting and related activities (8) | |
| Manufacture of fertilizers and nitrogen compounds (2) | Inland freight water transport (4) | Data-driven climate change monitoring solutions (8) | |
| Manufacture of plastics in primary form (2) | Infrastructure for low carbon transport (water transport) (4) | ||
Note: This Table reports economic activities of the EU Taxonomy, with indication of the relative NACE Macro-sector: (1) Agriculture and Forestry; (2) Manufacturing; (3) Electricity, gas, steam and air conditioning supply; (4) Transportation and storage; (5) Electricity, gas, steam and air conditioning supply; (6) Water, sewerage, waste and remediation; (7) Buildings; (8) ICT.
Table A2.
Variable definitions.
| Variable | Definition | Source |
|---|---|---|
| Dependent variable | ||
| CO2 emissions | Total per capita emissions of carbon dioxide | IEA |
| Independent variables | ||
| Taxonomy | Total scientific papers related to taxonomy per capita from t-1 to t-3 | WoS |
| Taxonomy-‘objective’ | Scientific papers related to taxonomy ‘objective’ per capita from t-1 to t-3. | WoS |
| Taxonomy-‘sector’ | Scientific papers related to taxonomy ‘sector’ per capita from t-1 to t-3. | WoS |
| Log GDP per capita | Logarithm of per capita GDP | WB |
| Log GDP per capita squared | Squared of the logarithm of per capita GDP | WB |
| Recession | Dummy variable that takes value 1 when the GDP growth is negative, 0 otherwise | WB |
| Population | Population in millions | WB |
| Scientific productivity | Logarithm of scientific publications (scientific and technical journal articles) from t-1 to t-3 | WB |
| English proficiency | English proficiency of each country language. The variable takes values from 1 to 6, with higher values indicating greater English proficiency | EF English Proficiency Index |
| Taxonomy citation | Total citations of scientific papers related to taxonomy per capita from t-1 to t-3 | WoS |
| Taxonomy citation (mean sd) | Mean from t-1 to t-3 of the standard deviation of the citations of scientific papers related to taxonomy per capita | WoS |
| R&D | R&D is the research and development expenditure as percentage of the GDP | WB |
| Exp. tertiary education | Government expenditure on tertiary education as percentage of the government expenditure on education | WB |
| Tot. exp. education | Government expenditure on education as percentage of the government expenditure | WB |
| Oil rent | Oil rents as percentage of GDP | WB |
| Energy use | Energy use as percentage of GDP | WB |
| Electricity from renewables | Electricity production from renewable sources (excluding hydroelectric) as percentage of total energy | WB |
Note: This Table reports the definitions of the main variables used in the regression analysis. All independent variables are lagged 1 year, unless otherwise specified.
Table A3.
Summary statistics.
| Variable | N | Mean | St. Dev. | Median | P.le 5 | P.le 95 |
|---|---|---|---|---|---|---|
| CO2 emissions | 2006 | 5.2079 | 5.7242 | 3.5680 | 0.1810 | 16.7620 |
| Taxonomy | 2006 | 1.4058 | 2.3744 | 0.2402 | 0.0000 | 6.6126 |
| Taxonomy-Mitigation | 2006 | 0.0366 | 0.1105 | 0.0000 | 0.0000 | 0.2481 |
| Taxonomy-Adaptation | 2006 | 0.0379 | 0.0929 | 0.0000 | 0.0000 | 0.2437 |
| Taxonomy-Water and Marine resources | 2006 | 0.7229 | 1.2545 | 0.0997 | 0.0000 | 3.6490 |
| Taxonomy-Circular Economy | 2006 | 0.0008 | 0.0055 | 0.0000 | 0.0000 | 0.0000 |
| Taxonomy-Pollution | 2006 | 0.2662 | 0.4227 | 0.0411 | 0.0000 | 1.2558 |
| Taxonomy-Biodiversity/Ecosystem | 2006 | 0.3134 | 0.6194 | 0.0371 | 0.0000 | 1.6817 |
| Taxonomy-Agriculture | 2006 | 0.3955 | 0.7411 | 0.0609 | 0.0000 | 2.0443 |
| Taxonomy-Manufacturing | 2006 | 0.0475 | 0.0903 | 0.0000 | 0.0000 | 0.2498 |
| Taxonomy-Electricity | 2006 | 0.3935 | 0.7477 | 0.0262 | 0.0000 | 2.0264 |
| Taxonomy-Water | 2006 | 0.4159 | 0.6920 | 0.0638 | 0.0000 | 1.9716 |
| Taxonomy-Transportation | 2006 | 0.0670 | 0.1432 | 0.0000 | 0.0000 | 0.4170 |
| Taxonomy-Building | 2006 | 0.0269 | 0.0675 | 0.0000 | 0.0000 | 0.1763 |
| Taxonomy-ICT | 2006 | 0.0161 | 0.0385 | 0.0000 | 0.0000 | 0.1173 |
| Log GDP per capita | 2006 | 8.7667 | 1.4150 | 8.7311 | 6.5085 | 10.8746 |
| Log GDP per capita squared | 2006 | 78.8566 | 24.7909 | 76.2323 | 42.3609 | 118.2569 |
| Recession | 2006 | 0.1047 | 0.3062 | 0.0000 | 0.0000 | 1.0000 |
| Population | 2006 | 48.2945 | 158.4715 | 10.4765 | 1.0227 | 152.7647 |
| Scientific productivity | 2006 | 7.8169 | 2.6088 | 7.5617 | 3.8552 | 12.1023 |
| Taxonomy citation | 2006 | 42.5405 | 84.9910 | 3.3975 | 0.0000 | 259.0962 |
| Taxonomy citation (mean sd) | 2006 | 19.7308 | 26.1375 | 7.5400 | 0.0000 | 87.3591 |
| R&D | 1239 | 0.9972 | 0.9585 | 0.6349 | 0.0610 | 3.1552 |
| Exp. tertiary education | 1034 | 20.8572 | 7.1067 | 20.5399 | 9.7437 | 33.2994 |
| Tot. exp. education | 1226 | 14.8872 | 4.7005 | 14.1466 | 8.2708 | 23.4300 |
| Oil rent | 2003 | 4.9456 | 10.5806 | 0.1275 | 0.0000 | 33.4677 |
| Energy use | 1754 | 145.3056 | 91.4281 | 119.0943 | 67.9168 | 358.9851 |
Note: This Table summarizes the data used in the regression analysis.
Table A4.
Taxonomy and pollution in Kyoto Protocol subsamples [t-1, t-3]: robustness.
| Before Kyoto Protocol Implementation (before 2006) | Kyoto Protocol (2006–2012) | After Doha Amendment to the Kyoto Protocol (after 2013) | |
|---|---|---|---|
| (1) | (2) | (3) | |
| Taxonomy | −0.2505** | −0.2403 *** | −0.1282 ** |
| (0.103) | (0.072) | (0.059) | |
| Log GDP per capita | −5.3834 ** | −6.7338 ** | 0.2958 |
| (2.410) | (2.762) | (2.602) | |
| Log GDP per capita squared | 0.3705 ** | 0.5585 *** | 0.1147 |
| (0.154) | (0.168) | (0.165) | |
| Recession | 0.0154 | −0.2696 *** | −0.1970 ** |
| (0.074) | (0.074) | (0.090) | |
| Population | 0.0118 | 0.0064 | −0.0017 |
| (0.011) | (0.005) | (0.004) | |
| Scientific productivity | 0.2689 | 0.0288 | 0.1675 |
| (0.340) | (0.059) | (0.201) | |
| Constant | 21.1023 ** | 20.1070 * | −7.8407 |
| (9.583) | (11.894) | (9.747) | |
| Observations | 266 | 1,072 | 667 |
| R−squared | 0.9992 | 0.9912 | 0.9966 |
| Country FE | Yes | Yes | Yes |
| Year FE | Yes | Yes | Yes |
| Adjusted R−squared | 0.998 | 0.990 | 0.996 |
Note: This Table reports the results of the baseline model for different subsamples based on the Kyoto Protocol. Model (1) refers to the years before the implementation of the Kyoto Protocol; Model (2) refers to the years in which the Kyoto Protocol was fully in place; Model (3) refers to years after the Doha Amendment to the Kyoto Protocol. All regressions include country and time fixed effects. Robust standard errors clustered at country level are included in parentheses, where ***, ** and * indicate significance at the 1, 5 and 10 percent statistical level, respectively.
Table A5.
Taxonomy and pollution [t-1, t-3]: robustness.
| (1) | (2) | (3) | (4) | (5) | (6) | |
|---|---|---|---|---|---|---|
| Taxonomy | −0.2868 *** | −0.2453 *** | −0.2327 *** | −0.3306 *** | −0.2911 *** | −0.2799 *** |
| (0.062) | (0.048) | (0.052) | (0.051) | (0.051) | (0.047) | |
| Log GDP per capita | −4.7727 | −2.0055 | −0.1829 | −5.9494 *** | −2.0815 | −6.5127 *** |
| (3.326) | (2.152) | (2.295) | (2.038) | (2.776) | (2.372) | |
| Log GDP per capita squared | 0.5008 ** | 0.2590 ** | 0.1585 | 0.5151 *** | 0.3594 ** | 0.5450 *** |
| (0.191) | (0.117) | (0.117) | (0.132) | (0.164) | (0.148) | |
| Recession | −0.3026 *** | −0.3991 *** | −0.3056 *** | −0.2525 *** | −0.2314 *** | −0.2475 *** |
| (0.069) | (0.080) | (0.088) | (0.075) | (0.070) | (0.068) | |
| Population | 0.0025 | 0.0028 | 0.0043 | 0.0036 | 0.0015 | 0.0047 |
| (0.005) | (0.003) | (0.004) | (0.003) | (0.004) | (0.003) | |
| Scientific productivity | 0.0688 | 0.6367 *** | 0.1905 | 0.0527 | −0.0022 | 0.0165 |
| (0.098) | (0.149) | (0.330) | (0.080) | (0.068) | (0.078) | |
| R&D | 0.6600 ** | |||||
| (0.326) | ||||||
| Exp. tertiary education | −0.0018 | |||||
| (0.008) | ||||||
| Tot. exp. education | −0.0148 | |||||
| (0.013) | ||||||
| Oil rent | −0.0013 | |||||
| (0.014) | ||||||
| Energy use | 0.0092 *** | |||||
| (0.003) | ||||||
| Electricity from renewables | −0.0483 ** | |||||
| (0.020) | ||||||
| Constant | 5.8742 | −3.4517 | −7.2426 | 16.6518 ** | −5.8337 | 19.5868 ** |
| (14.943) | (10.681) | (10.235) | (8.146) | (12.251) | (9.730) | |
| Observations | 1233 | 1025 | 1221 | 2003 | 1754 | 1872 |
| R−squared | 0.9844 | 0.9878 | 0.9875 | 0.9857 | 0.9871 | 0.9864 |
| Country FE | Yes | Yes | Yes | Yes | Yes | Yes |
| Year FE | Yes | Yes | Yes | Yes | Yes | Yes |
| Adjusted R−squared | 0.983 | 0.986 | 0.986 | 0.984 | 0.986 | 0.985 |
Note: This Table reports the results of the baseline model augmented with additional controls. R&D is the research and development over GDP; Exp. tertiary education is the government expenditure on tertiary education over government expenditure on education; Tot. exp. education is the government expenditure on education over government expenditure; Oil rent is the oil rents over GDP; Energy use is the energy use over GDP; Electricity from renewables is the electricity production from renewable sources over total energy. All regressions include country and time fixed effects. Robust standard errors clustered at country level are included in parentheses, where ***, **, and * indicate significance at the 1, 5, and 10 percent statistical level, respectively.
References
- Mansfield, E. Academic Research and Industrial Innovation. Res. Policy 1991, 20, 1–12. [Google Scholar] [CrossRef]
- Fudickar, R.; Hottenrott, H. Public Research and the Innovation Performance of New Technology Based Firms. J. Technol. Transf. 2019, 44, 326–358. [Google Scholar] [CrossRef]
- García-Vega, M.; Vicente-Chirivella, Ó. Do University Technology Transfers Increase Firms’ Innovation? Eur. Econ. Rev. 2020, 123, 103388. [Google Scholar] [CrossRef]
- Giovannini, E.; Niestroy, I.; Nilsson, M.; Roure, F.; Spanos, M. The Role of Science, Technology and Innovation Policies to Foster the Implementation of the Sustainable Development Goals. In Report of the Expert Group “Follow-up to Rio+20, Notably the SDGs”; Publications Office of the European Union: Luxembourg, Germany, 2015. [Google Scholar]
- Policansky, D. Science and Decision Making for Water Resources. Ecol. Appl. 1998, 8, 610–618. [Google Scholar] [CrossRef]
- Weber, J.R.; Word, C.S. The Communication Process as Evaluative Context: What Do Nonscientists Hear When Scientists Speak? Scientists and Nonscientists Benefit by Recognizing That Attempts at Mutual Influence, Multiple Frames of Reference, and “Objective” Information in Science Communication Are Not Neutral but Evaluated with Other Social Influences. BioScience 2001, 51, 487–495. [Google Scholar]
- Longstaff, P.H.; Yang, S.-U. Communication Management and Trust: Their Role in Building Resilience to “Surprises” Such as Natural Disasters, Pandemic Flu, and Terrorism. Ecol. Soc. 2008, 13, 1. [Google Scholar] [CrossRef]
- Boissière, M.; Locatelli, B.; Sheil, D.; Padmanaba, M.; Sadjudin, E. Local Perceptions of Climate Variability and Change in Tropical Forests of Papua, Indonesia. Ecol. Soc. 2013, 18, 4. [Google Scholar] [CrossRef] [Green Version]
- Cvitanovic, C.; Wilson, S.K.; Fulton, C.J.; Almany, G.R.; Anderson, P.; Babcock, R.C.; Ban, N.C.; Beeden, R.J.; Beger, M.; Cinner, J.; et al. Critical Research Needs for Managing Coral Reef Marine Protected Areas: Perspectives of Academics and Managers. J. Environ. Manag. 2013, 114, 84–91. [Google Scholar] [CrossRef]
- Hamm, J.A.; PytlikZillig, L.M.; Herian, M.N.; Tomkins, A.J.; Dietrich, H.; Michaels, S. Trust and Intention to Comply with a Water Allocation Decision: The Moderating Roles of Knowledge and Consistency. Ecol. Soc. 2013, 18, 4. [Google Scholar] [CrossRef] [Green Version]
- Lalor, B.M.; Hickey, G.M. Strengthening the Role of Science in the Environmental Decision-Making Processes of Executive Government. Organ. Environ. 2014, 27, 161–180. [Google Scholar] [CrossRef]
- Landry, R.; Lamari, M.; Amara, N. The Extent and Determinants of the Utilization of University Research in Government Agencies. Public Adm. Rev. 2003, 63, 192–205. [Google Scholar] [CrossRef]
- Hessels, L.K.; Van Lente, H. Re-Thinking New Knowledge Production: A Literature Review and a Research Agenda. Res. Policy 2008, 37, 740–760. [Google Scholar] [CrossRef]
- Luminita, I. Climate Policies, Carbon Pricing, and Pollution Tax: Do Carbon Taxes Really Lead to a Reduction in Emissions? Geopolit. Hist. Int. Relat. 2019, 11, 92. [Google Scholar] [CrossRef]
- Luminita, I. Towards a Sustainable and Inclusive Low-Carbon Economy: Why Carbon Taxes, and Not Schemes of Emission Trading, Are a Cost-Effective Economic Instrument to Curb Greenhouse Gas Emissions. J. Self-Gov. Manag. Econ. 2019, 7, 35. [Google Scholar] [CrossRef] [Green Version]
- Lafferty, C. Sustainable Internet-of-Things-Based Manufacturing Systems: Industry 4.0 Wireless Networks, Advanced Digitalization, and Big Data-Driven Smart Production. Econ. Manag. Financ. Mark. 2019, 14, 16–22. [Google Scholar]
- Horick, C. Industry 4.0 Production Networks: Cyber-Physical System-Based Smart Factories, Real-Time Big Data Analytics, and Sustainable Product Lifecycle Management. J. Self-Gov. Manag. Econ. 2020, 8, 107–113. [Google Scholar]
- Kuzma, E.; Padilha, L.S.; Sehnem, S.; Julkovski, D.J.; Roman, D.J. The Relationship between Innovation and Sustainability: A Meta-Analytic Study. J. Clean. Prod. 2020, 259, 120745. [Google Scholar] [CrossRef]
- Van Kerkhoff, L.; Lebel, L. Linking Knowledge and Action for Sustainable Development. Annu. Rev. Environ. Resour. 2006, 31, 445–477. [Google Scholar] [CrossRef] [Green Version]
- Dilling, L. Towards Science in Support of Decision Making: Characterizing the Supply of Carbon Cycle Science. Environ. Sci. Policy 2007, 10, 48–61. [Google Scholar] [CrossRef]
- Dilling, L.; Lemos, M.C. Creating Usable Science: Opportunities and Constraints for Climate Knowledge Use and Their Implications for Science Policy. Glob. Environ. Chang. 2011, 21, 680–689. [Google Scholar] [CrossRef]
- Lemos, M.C.; Kirchhoff, C.J.; Ramprasad, V. Narrowing the Climate Information Usability Gap. Nat. Clim. Chang. 2012, 2, 789–794. [Google Scholar] [CrossRef]
- Kirchhoff, C.J.; Carmen Lemos, M.; Dessai, S. Actionable Knowledge for Environmental Decision Making: Broadening the Usability of Climate Science. Annu. Rev. Environ. Resour. 2013, 38, 393–414. [Google Scholar] [CrossRef]
- Russell-Smith, S.V.; Lepech, M.D.; Fruchter, R.; Meyer, Y.B. Sustainable Target Value Design: Integrating Life Cycle Assessment and Target Value Design to Improve Building Energy and Environmental Performance. J. Clean. Prod. 2015, 88, 43–51. [Google Scholar] [CrossRef]
- Rau, H.; Goggins, G.; Fahy, F. From Invisibility to Impact: Recognising the Scientific and Societal Relevance of Interdisciplinary Sustainability Research. Res. Policy 2018, 47, 266–276. [Google Scholar] [CrossRef]
- Pachauri, R.K.; Reisinger, A. Climate Change 2007: Contribution of … to the Fourth Assessment Report of the Intergovernmental Panel on Climate Change. 4: Synthesis Report; IPCC, Ed.; IPCC: Geneva, Switzerland, 2008. [Google Scholar]
- Hettige, H.; Lucas, R.E.; Wheeler, D. The Toxic Intensity of Industrial Production: Global Patterns, Trends, and Trade Policy. Am. Econ. Rev. 1992, 82, 478–481. [Google Scholar]
- Schmalensee, R.; Stoker, T.M.; Judson, R.A. World Carbon Dioxide Emissions: 1950–2050. Rev. Econ. Stat. 1998, 80, 15–27. [Google Scholar] [CrossRef]
- TEG European Commission. Taxonomy: Final Report of the Technical Expert Group on Sustainable Finance; TEG European Commission: Brussels, Belgium, 2020. [Google Scholar]
- TEG European Commission. Taxonomy Report: Technical Annex; TEG European Commission: Brussels, Belgium, 2020. [Google Scholar]
- Bornmann, L.; Haunschild, R.; Marx, W. Policy Documents as Sources for Measuring Societal Impact: How Often Is Climate Change Research Mentioned in Policy-Related Documents? Scientometrics 2016, 109, 1477–1495. [Google Scholar] [CrossRef]
- Callaert, J.; Van Looy, B.; Verbeek, A.; Debackere, K.; Thijs, B. Traces of Prior Art: An Analysis of Non-Patent References Found in Patent Documents. Scientometrics 2006, 69, 3–20. [Google Scholar] [CrossRef]
- Mongeon, P.; Paul-Hus, A. The Journal Coverage of Web of Science and Scopus: A Comparative Analysis. Scientometrics 2016, 106, 213–228. [Google Scholar] [CrossRef]
- Martín-Martín, A.; Orduna-Malea, E.; Thelwall, M.; López-Cózar, E.D. Google Scholar, Web of Science, and Scopus: A Systematic Comparison of Citations in 252 Subject Categories. J. Informetr. 2018, 12, 1160–1177. [Google Scholar] [CrossRef] [Green Version]
- Udara Willhelm Abeydeera, L.H.; Wadu Mesthrige, J.; Samarasinghalage, T.I. Global Research on Carbon Emissions: A Scientometric Review. Sustainability 2019, 11, 3972. [Google Scholar] [CrossRef] [Green Version]
- Olawumi, T.O.; Chan, D.W. A Scientometric Review of Global Research on Sustainability and Sustainable Development. J. Clean. Prod. 2018, 183, 231–250. [Google Scholar] [CrossRef]
- D’Amato, D.; Droste, N.; Allen, B.; Kettunen, M.; Lähtinen, K.; Korhonen, J.; Leskinen, P.; Matthies, B.D.; Toppinen, A. Green, Circular, Bio Economy: A Comparative Analysis of Sustainability Avenues. J. Clean. Prod. 2017, 168, 716–734. [Google Scholar] [CrossRef]
- Merli, R.; Preziosi, M.; Acampora, A. How Do Scholars Approach the Circular Economy? A Systematic Literature Review. J. Clean. Prod. 2018, 178, 703–722. [Google Scholar] [CrossRef]
- Ferreira Gregorio, V.; Pié, L.; Terceño, A. A Systematic Literature Review of Bio, Green and Circular Economy Trends in Publications in the Field of Economics and Business Management. Sustainability 2018, 10, 4232. [Google Scholar] [CrossRef] [Green Version]
- Crespi, G.A.; Geuna, A. An Empirical Study of Scientific Production: A Cross Country Analysis, 1981–2002. Res. Policy 2008, 37, 565–579. [Google Scholar] [CrossRef]
- Auranen, O.; Nieminen, M. University Research Funding and Publication Performance—An International Comparison. Res. Policy 2010, 39, 822–834. [Google Scholar] [CrossRef]
- Blei, D.M.; Ng, A.Y.; Jordan, M.I. Latent Dirichlet Allocation. J. Mach. Learn. Res. 2003, 3, 993–1022. [Google Scholar] [CrossRef]
- Tozanlı, Ö.; Kongar, E.; Gupta, S.M. Evaluation of Waste Electronic Product Trade-in Strategies in Predictive Twin Disassembly Systems in the Era of Blockchain. Sustainability 2020, 12, 5416. [Google Scholar] [CrossRef]
- Adams, R.; Jeanrenaud, S.; Bessant, J.; Denyer, D.; Overy, P. Sustainability-Oriented Innovation: A Systematic Review: Sustainability-Oriented Innovation. Int. J. Manag. Rev. 2016, 18, 180–205. [Google Scholar] [CrossRef]
- Hallenga-Brink, S.C.; Brezet, J.C. The Sustainable Innovation Design Diamond for Micro-Sized Enterprises in Tourism. J. Clean. Prod. 2005, 13, 141–149. [Google Scholar] [CrossRef]
- McLaughlin, P.; Dietz, T. Structure, Agency and Environment: Toward an Integrated Perspective on Vulnerability. Glob. Environ. Chang. 2008, 18, 99–111. [Google Scholar] [CrossRef]
- Nill, J.; Kemp, R. Evolutionary Approaches for Sustainable Innovation Policies: From Niche to Paradigm? Res. Policy 2009, 38, 668–680. [Google Scholar] [CrossRef]
- Nidumolu, R.; Prahalad, C.K.; Rangaswami, M.R. Why Sustainability Is Now the Key Driver of Innovation. Harv. Bus. Rev. 2009, 87, 56–64. [Google Scholar]
- Barbieri, D.F.; Braga, D.; Ceri, S.; Della Valle, E.; Grossniklaus, M. Incremental Reasoning on Streams and Rich Background Knowledge. In The Semantic Web: Research and Applications; Lecture Notes in Computer Science; Springer: Berlin/Heidelberg, Germany, 2010; Volume 6088, pp. 1–15. [Google Scholar] [CrossRef] [Green Version]
- Christensen, H.B.; Hail, L.; Leuz, C. Adoption of CSR and Sustainability Reporting Standards: Economic Analysis and Review; National Bureau of Economic Research: Cambridge, MA, USA, 2019. [Google Scholar]
- Moffat, A.; Auer, A. Corporate Environmental Innovation (CEI): A Government Initiative to Support Corporate Sustainability Leadership. J. Clean. Prod. 2006, 14, 589–600. [Google Scholar] [CrossRef]
- Bos-Brouwers, H.E.J. Corporate Sustainability and Innovation in SMEs: Evidence of Themes and Activities in Practice. Bus. Strategy Environ. 2010, 7, 417–435. [Google Scholar] [CrossRef]
- Islam, M.M.; Shamsuddoha, M. Coastal and Marine Conservation Strategy for Bangladesh in the Context of Achieving Blue Growth and Sustainable Development Goals (SDGs). Environ. Sci. Policy 2018, 87, 45–54. [Google Scholar] [CrossRef]
- Lazaretti, K.; Giotto, O.T.; Sehnem, S.; Bencke, F.F. Building Sustainability and Innovation in Organizations. Benchmarking Int. J. 2019. [Google Scholar] [CrossRef]
- Salas-Zapata, W.A.; Ríos-Osorio, L.A.; Álvarez del Castillo, J. La Ciencia Emergente de La Sustentabilidad: De La Práctica Científica Hacia La Constitución de Una Ciencia. Interciencia 2011, 36, 699–706. [Google Scholar]
- Bornmann, L. Measuring the Societal Impact of Research: Research Is Less and Less Assessed on Scientific Impact Alone—We Should Aim to Quantify the Increasingly Important Contributions of Science to Society. EMBO Rep. 2012, 13, 673–676. [Google Scholar] [CrossRef] [Green Version]
- Cairney, P.; Oliver, K.; Wellstead, A. To Bridge the Divide between Evidence and Policy: Reduce Ambiguity as Much as Uncertainty. Public Adm. Rev. 2016, 76, 399–402. [Google Scholar] [CrossRef] [Green Version]
- Bellemare, M.F.; Masaki, T.; Pepinsky, T.B. Lagged Explanatory Variables and the Estimation of Causal Effect. J. Polit. 2017, 79, 949–963. [Google Scholar] [CrossRef]
- De Hass, R.; Popov, A. Finance and Carbon. Available online: https://www.ecb.europa.eu/pub/pdf/scpwps/ecb.wp2318~44719344e8.en.pdf (accessed on 10 July 2020).
- Tatarici, L.; Dragu, F. The Green Dilemma: Climate Risk, Credit Institutions and Central Banks. Proceedings of Economic Convergence in European Union Conference (ECEU), Bucharest, Romania, 30–31 March 2020. [Google Scholar]
- Grossman, G.M.; Krueger, A.B. Economic Growth and the Environment. Q. J. Econ. 1995, 110, 353–377. [Google Scholar] [CrossRef] [Green Version]
- Stern, D.I. The Rise and Fall of the Environmental Kuznets Curve. World Dev. 2004, 32, 1419–1439. [Google Scholar] [CrossRef]
- Dasgupta, S.; Laplante, B.; Wang, H.; Wheeler, D. Confronting the Environmental Kuznets Curve. J. Econ. Perspect. 2002, 16, 147–168. [Google Scholar] [CrossRef] [Green Version]
- Dinda, S. Environmental Kuznets Curve Hypothesis: A Survey. Ecol. Econ. 2004, 49, 431–455. [Google Scholar] [CrossRef] [Green Version]
- Torras, M.; Boyce, J.K. Income, Inequality, and Pollution: A Reassessment of the Environmental Kuznets Curve. Ecol. Econ. 1998, 25, 147–160. [Google Scholar] [CrossRef]
- Miyamoto, M.; Takeuchi, K. Climate Agreement and Technology Diffusion: Impact of the Kyoto Protocol on International Patent Applications for Renewable Energy Technologies. Energy Policy 2019, 129, 1331–1338. [Google Scholar] [CrossRef] [Green Version]
- Nofsinger, J.; Varma, A. Socially Responsible Funds and Market Crises. J. Bank. Financ. 2014, 48, 180–193. [Google Scholar] [CrossRef]
- Berg, F.; Kölbel, J.F.; Rigobon, R. Aggregate Confusion: The Divergence of ESG Ratings. SSRN Electron. J. 2019. [Google Scholar] [CrossRef]
Figure 1.
Publication trends by environmental objectives. The graph shows the number of articles over time for objectives: Climate change mitigation, Climate change adaptation, Water and Marine resources, Circular economy, Pollution, and Biodiversity/Ecosystem. Sample 1990–2019.
Figure 1.
Publication trends by environmental objectives. The graph shows the number of articles over time for objectives: Climate change mitigation, Climate change adaptation, Water and Marine resources, Circular economy, Pollution, and Biodiversity/Ecosystem. Sample 1990–2019.

Figure 2.
Publication trends by macro-sectors. The graphs show the number of articles over time for macro-sectors: Agriculture, Electricity, Water (a), and Manufacturing, Transportation, Buildings, and ICT (b). Sample 1990–2019.
Figure 2.
Publication trends by macro-sectors. The graphs show the number of articles over time for macro-sectors: Agriculture, Electricity, Water (a), and Manufacturing, Transportation, Buildings, and ICT (b). Sample 1990–2019.

Figure 3.
Geographical provenance of the scientific literature. The color scale refers to the number of articles published. Sample 1990–2019.
Figure 3.
Geographical provenance of the scientific literature. The color scale refers to the number of articles published. Sample 1990–2019.

Figure 4.
Top 30 salient key-terms in the Taxonomy literature environmental objective ‘Climate change mitigation’ and inter-topic distance. The figure shows the results from the latent Dirichlet allocation (LDA) analysis for the scientific literature of the EU Taxonomy environmental objective Climate change mitigation. The left panel identifies topics, visualized as circle areas, based on co-occurrence of words. PC1 and PC2 refer to the two Principal Components used to visualize the distance between topics on a two-dimensional plane. Right panel shows the most salient key-terms found in the abstracts. Some words are truncated because this is how LDA algorithm works. The salient key-terms referring to Topic 1 are highlighted as red circle.

Figure 5.
Top 30 salient key-terms in the Taxonomy literature environmental objective ‘Climate change adaptation’ and inter-topic distance. The figure shows the results from the LDA analysis for the scientific literature of the EU Taxonomy environmental objective Climate change adaptation. The left panel identifies topics, visualized as circle areas, based on co-occurrence of words. PC1 and PC2 refer to the two Principal Components used to visualize the distance between topics on a two-dimensional plane. Right panel shows the most salient key-terms found in the abstracts. Some words are truncated because this is how LDA algorithm works. The salient key-terms referring to Topic 1 are highlighted as red circle.

Figure 6.
Top 30 salient key-terms in the Taxonomy literature environmental objective ‘Circular economy’ and inter-topic distance. The figure shows the results from the LDA analysis for the scientific literature of the EU Taxonomy environmental objective Circular Economy. The left panel identifies topics, visualized as circle areas, based on co-occurrence of words. PC1 and PC2 refer to the two Principal Components used to visualize the distance between topics on a two-dimensional plane. Right panel shows the most salient key-terms found in the abstracts. Some words are truncated because this is how LDA algorithm works. The salient key-terms referring to Topic 4 are highlighted as red circle.

Figure 7.
CO2 emission trends by macro-sectors. The graphs show the average level of CO2 emissions per capita over time. Sample 2002–2017. Source: International Energy Agency (IEA).
Figure 7.
CO2 emission trends by macro-sectors. The graphs show the average level of CO2 emissions per capita over time. Sample 2002–2017. Source: International Energy Agency (IEA).

Table 1.
Distribution of the literature across macro-sectors and environmental objectives.
| Environmental Objective | |||||||
|---|---|---|---|---|---|---|---|
| Macro-Sector | Climate Change Mitigation | Climate Change Adaptation | Water and Marine Resources | Circular Economy | Pollution | Biodiversity/Ecosystems | Total |
| Agriculture | 1787 | 1527 | 18,390 | 59 | 2648 | 20,239 | 44,650 |
| Manufacturing | 74 | 1126 | 4597 | 133 | 957 | 183 | 7070 |
| Electricity | 1087 | 312 | 38,898 | 252 | 3589 | 1381 | 45,519 |
| Water | 1164 | 1685 | 10,881 | 368 | 20,929 | 18,188 | 53,215 |
| Transportation | 257 | 81 | 2823 | 33 | 2830 | 400 | 6424 |
| Buildings | 76 | 62 | 1700 | 67 | 374 | 174 | 2453 |
| ICT | 10 | 19 | 1740 | 2 | 111 | 382 | 2264 |
| Total | 4455 | 4812 | 79,029 | 914 | 31,438 | 40,947 | 161,595 |
Note: Full sample as it was downloaded from WoS.
Table 2.
Taxonomy and pollution.
| All | Environmental Objectives | ||||||
|---|---|---|---|---|---|---|---|
| (1) | (2) | (3) | (4) | (5) | (6) | (7) | |
| Taxonomy | −0.3315 *** | ||||||
| (0.052) | |||||||
| Taxonomy-Mitigation | −2.1809 *** | ||||||
| (0.583) | |||||||
| Taxonomy-Adaptation | −2.6198 *** | ||||||
| (0.760) | |||||||
| Taxonomy-Water and Marine resources | −0.5192 *** | ||||||
| (0.076) | |||||||
| Taxonomy-Circular Economy | −13.4329 ** | ||||||
| (6.022) | |||||||
| Taxonomy-Pollution | −0.8339 *** | ||||||
| (0.220) | |||||||
| Taxonomy-Biodiversity/Ecosystem | −0.8086 *** | ||||||
| (0.258) | |||||||
| Log GDP per capita | −6.0006 *** | −2.1333 | −1.9597 | −4.9851 ** | −0.7818 | −2.2859 | −3.1317 |
| (2.142) | (2.296) | (2.303) | (2.080) | (2.274) | (2.306) | (2.409) | |
| Log GDP per capita squared | 0.5171 *** | 0.3035** | 0.2911** | 0.4609 *** | 0.2316 | 0.3161 ** | 0.3590 ** |
| (0.136) | (0.145) | (0.146) | (0.133) | (0.145) | (0.147) | (0.152) | |
| Recession | −0.2514 *** | −0.1911 *** | −0.2001 *** | −0.2283 *** | −0.1694 ** | −0.1734 ** | −0.2363 *** |
| (0.061) | (0.068) | (0.071) | (0.065) | (0.074) | (0.068) | (0.070) | |
| Population | 0.0037 | 0.0052 | 0.0050 | 0.0043 | 0.0055 | 0.0045 | 0.0046 |
| (0.003) | (0.004) | (0.004) | (0.003) | (0.004) | (0.004) | (0.004) | |
| Scientific productivity | 0.0553 | 0.0153 | 0.0338 | 0.0545 | 0.0356 | 0.0890 | 0.0284 |
| (0.079) | (0.083) | (0.092) | (0.082) | (0.089) | (0.090) | (0.086) | |
| Constant | 16.9159 * | −0.2940 | −0.9546 | 12.3305 | −6.7179 | −0.3490 | 4.1853 |
| (8.597) | (9.281) | (9.277) | (8.360) | (9.107) | (9.155) | (9.724) | |
| Observations | 2006 | 2006 | 2006 | 2006 | 2006 | 2006 | 2006 |
| R-squared | 0.9857 | 0.9840 | 0.9839 | 0.9852 | 0.9834 | 0.9840 | 0.9846 |
| Country FE | Yes | Yes | Yes | Yes | Yes | Yes | Yes |
| Year FE | Yes | Yes | Yes | Yes | Yes | Yes | Yes |
| Adjusted R-squared | 0.984 | 0.983 | 0.983 | 0.984 | 0.982 | 0.983 | 0.983 |
Note: This Table reports the results of the panel model of taxonomy-related scientific production on CO2 emissions per capita. In model (1), Taxonomy is defined as the sum of total scientific papers related to taxonomy per capita from t-1 to t-3. In models (2) to (7), Taxonomy-‘objective’ is defined as the sum of total scientific papers related to that specific taxonomy objective per capita from t-1 to t-3. All regressions include country and time fixed effects. Robust standard errors clustered at country level are included in parentheses, where ***, ** and * indicate significance at the 1, 5 and 10 percent statistical level, respectively.
Table 3.
Taxonomy macro-sector and pollution [t-1, t-3].
| Macro-Sectors | |||||||
|---|---|---|---|---|---|---|---|
| (1) | (2) | (3) | (4) | (5) | (6) | (7) | |
| Taxonomy-Agriculture | −0.6328 *** | ||||||
| (0.154) | |||||||
| Taxonomy-Manufacturing | −0.8453 * | ||||||
| (0.450) | |||||||
| Taxonomy-Electricity | −0.6721 *** | ||||||
| (0.108) | |||||||
| Taxonomy-Water | −0.6126 *** | ||||||
| (0.158) | |||||||
| Taxonomy-Transportation | −2.8597 *** | ||||||
| (0.769) | |||||||
| Taxonomy-Building | −2.6435 *** | ||||||
| (0.776) | |||||||
| Taxonomy-ICT | −4.6596 *** | ||||||
| (1.220) | |||||||
| Log GDP per capita | −3.1657 | −0.7617 | −4.2044 ** | −2.6026 | −1.9724 | −1.5018 | −1.1572 |
| (2.355) | (2.314) | (2.061) | (2.338) | (2.299) | (2.288) | (2.280) | |
| Log GDP per capita squared | 0.3607 ** | 0.2323 | 0.4181 *** | 0.3311 ** | 0.2961 ** | 0.2729* | 0.2486 * |
| (0.147) | (0.147) | (0.133) | (0.149) | (0.145) | (0.146) | (0.146) | |
| Recession | −0.2066 *** | −0.1673 ** | −0.2343 *** | −0.2047 *** | −0.1752 ** | −0.1633 ** | −0.1739 ** |
| (0.071) | (0.075) | (0.067) | (0.064) | (0.071) | (0.071) | (0.074) | |
| Population | 0.0047 | 0.0053 | 0.0045 | 0.0047 | 0.0053 | 0.0047 | 0.0056 |
| (0.004) | (0.004) | (0.004) | (0.004) | (0.004) | (0.004) | (0.004) | |
| Scientific productivity | 0.0227 | 0.0465 | 0.0505 | 0.0662 | 0.0503 | 0.0522 | 0.0353 |
| (0.084) | (0.094) | (0.080) | (0.093) | (0.082) | (0.091) | (0.090) | |
| Constant | 4.3852 | −6.9973 | 8.7713 | 1.4484 | −1.3993 | −3.6872 | −4.6998 |
| (9.600) | (9.254) | (8.223) | (9.312) | (9.272) | (9.161) | (9.111) | |
| Observations | 2,006 | 2,006 | 2,006 | 2,006 | 2,006 | 2,006 | 2,006 |
| R-squared | 0.9843 | 0.9833 | 0.9850 | 0.9842 | 0.9838 | 0.9837 | 0.9836 |
| Country FE | Yes | Yes | Yes | Yes | Yes | Yes | Yes |
| Year FE | Yes | Yes | Yes | Yes | Yes | Yes | Yes |
| Adjusted R-squared | 0.983 | 0.982 | 0.984 | 0.983 | 0.982 | 0.982 | 0.982 |
Note: This Table reports the results of the panel model of taxonomy-related scientific production on CO2 emissions per capita. In models (1) to (7), Taxonomy-‘sector’ is defined as the sum of total scientific papers related to that specific taxonomy sector per capita from t-1 to t-3. All regressions include country and time fixed effects. Robust standard errors clustered at country level are included in parentheses, where ***, **, and * indicate significance at the 1, 5, and 10 percent statistical level, respectively.
Table 4.
Taxonomy and pollution [t-1, t-3]: cross-country differences.
| OECD = 1 | OECD = 0 | EU = 1 | EU = 0 | High English Proficiency | Low English Proficiency | Citations | |
|---|---|---|---|---|---|---|---|
| (1) | (2) | (3) | (4) | (5) | (6) | (7) | |
| Taxonomy | −0.1014 | −0.3237 *** | −0.0980 | −0.2642 *** | −0.3260 *** | −0.2419 *** | |
| (0.109) | (0.063) | (0.098) | (0.045) | (0.057) | (0.072) | ||
| Taxonomy citation | −0.0045 ** | ||||||
| (0.002) | |||||||
| Taxonomy citation (mean sd) | 0.0075 * | ||||||
| (0.004) | |||||||
| Log GDP per capita | 18.4615 | −7.8708 *** | 16.2844 ** | −7.3652 *** | −3.6522 | −6.8136 ** | −1.5256 |
| (15.519) | (2.482) | (7.895) | (2.482) | (2.947) | (3.166) | (2.288) | |
| Log GDP per capita squared | −0.6447 | 0.6080 *** | −0.6269 | 0.5839 *** | 0.4206 ** | 0.5307 *** | 0.2718 * |
| (0.772) | (0.163) | (0.402) | (0.163) | (0.188) | (0.198) | (0.145) | |
| Recession | −0.2411 * | −0.2011 *** | −0.1833 | −0.1786 *** | −0.2538 *** | −0.2032 ** | −0.1677 ** |
| (0.126) | (0.066) | (0.154) | (0.063) | (0.074) | (0.090) | (0.072) | |
| Population | −0.0924 *** | 0.0058 * | −0.1745 | 0.0029 | −0.0230 | 0.0056 | 0.0058 |
| (0.017) | (0.003) | (0.116) | (0.003) | (0.026) | (0.004) | (0.004) | |
| Scientific productivity | −1.1786 | 0.0286 | −1.1936 | 0.0450 | 0.0053 | 0.2406 | 0.0225 |
| (1.394) | (0.065) | (1.064) | (0.079) | (0.057) | (0.391) | (0.086) | |
| Constant | −97.6230 | 26.4141 *** | −78.2180 ** | 23.9619 ** | 4.6380 | 21.2154 * | −3.2472 |
| (68.107) | (9.598) | (37.457) | (9.591) | (11.255) | (11.375) | (9.234) | |
| Observations | 480 | 1526 | 405 | 1601 | 1058 | 948 | 2006 |
| R−squared | 0.9743 | 0.9868 | 0.9649 | 0.9879 | 0.9842 | 0.9869 | 0.9837 |
| Country FE | Yes | Yes | Yes | Yes | Yes | Yes | Yes |
| Year FE | Yes | Yes | Yes | Yes | Yes | Yes | Yes |
| Adjusted R−squared | 0.971 | 0.986 | 0.960 | 0.987 | 0.983 | 0.986 | 0.982 |
Note: Models (1) and (2) report the results of the baseline model for OECD and non-OECD countries. Models (3) and (4) report the results of the baseline model for EU and non-EU countries. Models (5) and (6) report the results of the baseline model for countries with a high level of English proficiency (above 3) and a low level of English proficiency (equal to or below 3). Taxonomy citation is defined as the sum of total citations of scientific papers related to taxonomy per capita from t-1 to t-3. Taxonomy citation (mean sd) is defined as the mean of the standard deviation of total citation of scientific papers related to taxonomy per capita from t-1 to t-3. All regressions include country and time fixed effects. Robust standard errors clustered at country level are included in parentheses, where ***, ** and * indicate significance at the 1, 5 and 10 percent statistical level, respectively.
© 2020 by the authors. Licensee MDPI, Basel, Switzerland. This article is an open access article distributed under the terms and conditions of the Creative Commons Attribution (CC BY) license (http://creativecommons.org/licenses/by/4.0/).
Share and Cite
MDPI and ACS Style
Lucarelli, C.; Mazzoli, C.; Rancan, M.; Severini, S. Classification of Sustainable Activities: EU Taxonomy and Scientific Literature. Sustainability 2020, 12, 6460. https://0-doi-org.brum.beds.ac.uk/10.3390/su12166460
AMA Style
Lucarelli C, Mazzoli C, Rancan M, Severini S. Classification of Sustainable Activities: EU Taxonomy and Scientific Literature. Sustainability. 2020; 12(16):6460. https://0-doi-org.brum.beds.ac.uk/10.3390/su12166460
Chicago/Turabian StyleLucarelli, Caterina, Camilla Mazzoli, Michela Rancan, and Sabrina Severini. 2020. "Classification of Sustainable Activities: EU Taxonomy and Scientific Literature" Sustainability 12, no. 16: 6460. https://0-doi-org.brum.beds.ac.uk/10.3390/su12166460
Note that from the first issue of 2016, this journal uses article numbers instead of page numbers. See further details here.