Carbon Emission Reduction Strategy for Energy Users in China


1
State Key Laboratory of Automotive Safety and Energy, Tsinghua University, Beijing 100084, China
2
Tsinghua Automotive Strategy Research Institute, Tsinghua University, Beijing 100084, China
3
China Automotive Energy Research Center, Tsinghua University, Beijing 100084, China
4
Sloan Automotive Laboratory, Massachusetts Institute of Technology, Cambridge, MA 02139, USA
*
Author to whom correspondence should be addressed.
Sustainability 2020, 12(16), 6498; https://0-doi-org.brum.beds.ac.uk/10.3390/su12166498
Submission received: 29 June 2020
/
Revised: 3 August 2020
/
Accepted: 8 August 2020
/
Published: 12 August 2020
(This article belongs to the Section Environmental Sustainability and Applications)
Abstract
:The Chinese government has made a commitment to control carbon emissions, and the deployment of renewable energy power generation is considered as an effective solution. In recent years, great effort has been exerted to support the development of renewable energy in China. While, due to fiscal pressures and changes in management policies, related subsidies are diminishing now and energy users are asked to pay for the cost. Regulations about carbon cap and renewable energy consumptions are issued to transfer the responsibility of consuming renewable energy and reducing carbon emissions to energy consumers. A national carbon trading system is set up in China and is under its growth stage. Therefore, this study lists the factors that should be considered by the energy users, analyzes the levelized cost of electricity generated by renewable energy in four cities in China, Beijing, Shanghai, Guangzhou, Wuhan, and compares the results with current carbon prices. Based on the research, under the current status, it is still more cost-efficient for enterprises to buy carbon credits than introduce renewable energies, and great differences among cities are shown due to different natural conditions. Besides, with diminishing subsidies and development of the carbon trading market, the carbon price will gradually reflect the actual value and carbon emission reduction costs will become an important part of enterprise expenditure. In the long term, enterprises should link more factors to carbon emissions, like social responsibility and brand image, instead of only the cost.
1. Introduction
The Paris Agreement aims at limiting the temperature increase to 1.5 °C above pre-industrial levels [1]. While, worldwide carbon emissions still maintain a rapid growth trend. Based on the publication from International Energy Agency (IEA), global energy-related carbon emissions had increased from 20.5 Gt CO2 in 1990 to 33.2 Gt CO2 in 2018 [2]. Before the Industrial Revolution, the global average annual concentration of CO2 was only around 280 ppm, and in 2018, it reached 407.4 ppm [3,4]. CO2 emissions in China in 2018 grew by 2.5% to 9.5 Gt, with a 4% fall in CO2 emissions per Gross Domestic Product (GDP) [5]. India is another large contributor to CO2 emissions in the world. The increasing population in India is creating more demand for energy. India’s annual CO2 emissions would reach around 4.2–4.5 Gt in 2030, but per capita emissions will still be much lower than that in China [6]. The good news is greenhouse gas (GHG) emissions from the European Union (EU) are on a clear downward trend for over a decade [7]. Due to the increasing emissions, many countries are trying to improve energy structure and introducing new technologies and policies to control emissions as much as possible.
The European Commission is a pioneer in carbon emissions control. The EU emissions trading system (EU ETS) is the world’s first major carbon market and remains the biggest one [8]. The trading system started to work in 2005, and by 2017, there had been a 22% reduction in emissions, compared with 1990, with 58% growth in economy over the same period [9]. Some studies have paid attention to the impact of the introduction of EU ETS on enterprise development. Martin et al. summarized the impacts of the EU ETS on regulated firms from three broadly defined impacts: CO2 emissions, economic performance and competitiveness and innovation [10]. Based on their study, in economic aspect, compared with non-ETS companies, EU ETS participants reported that they had a slightly higher tendency to scale down their business in order to cope with future carbon pricing. Oestreich et al. analyzed the relationship between carbon emissions and stock returns under the EU ETS [11]. They found that companies with high carbon emissions would face higher carbon risks and showed higher expected returns. Now the program is in Phase 3, from 2013 to 2020. To meet the growing energy demand and keep within the emission cap, the development of renewable energy seems a promising strategy for countries in the EU. Due to different situations among countries, the shares of renewable energy in total energy consumption also fluctuate greatly. The shares of energy from renewable sources in Iceland and Norway were up to over 70% in 2017. In Luxembourg, this share was only 6.38% at the same time. The average level of 28 countries in the EU is 17.51% [12].
In the U.S., in order to reduce carbon emissions, the scale of renewable energy is also expanding. The average level of renewable energy consumption in total primary energy consumption in the U.S. increased from 6.22% in 2005 to 11.38% in 2018 [13]. In 2018, around 18% power generation came from renewable energy, and according to the Energy Information Administration (EIA), this proportion may increase to 31% in 2050 in the Reference case [14]. California is a state with more aggressive environmental policies. In California, an estimated 34% of electricity came from renewable sources in 2018 [15]. In 2017, President Donald Trump decided to withdraw the U.S. from the Paris climate agreement [16]. There will be more uncertainties for the future low-carbon development in the U.S.
In order to fulfill its commitment, the Chinese government has also introduced a series of measures and policies to limit the energy use and carbon emissions. From the energy supply side, national and local subsidies are applied to support the renewable energy development. Renewable energy power plant builders and users can enjoy certain financial support. From the energy demand side, Carbon Emission Trading System, Guarantee Mechanism of Renewable Energy Power Consumption, and other consumption requirements are involved to support the low carbon development. The details will be introduced in the later part.
As mentioned, the introduction of renewables is treated as an important way to reduce carbon emissions, and countries are actively promoting the development of renewable energy. Subsidy measures are usually used to stimulate related industries in the initial stage. In the long term, the goals of national carbon reduction will inevitably be transferred to enterprises for implementation. China’s relevant policies are currently in this transition. With more carbon emission restrictions, energy users in China will face new opportunities and challenges. It is crucial for enterprises (energy users) to know about what factors they need to consider in the carbon emission reduction process and what is the most economical plan in the short term. In this area, previous research about China is mainly divided into two aspects.
- ✓
- One focuses on the development trend of national policies, including the carbon trading system, renewable energy development planning and fiscal support for renewable energy, etc. Weng et al., Lo, Liu et al., Zhang et al., and Zhao et al., reviewed the development of China’s carbon trading market and introduced the status of China’s carbon trading market [17,18,19,20,21,22]. Some of them provided policy recommendations based on analysis and some focused on the policies and planning for renewables. Overall reviews of renewable energy subsidy policies are made by Shen et al., and Zeng et al. [23,24]. Others paid attention to renewable energy incentive policies, and analyzed the opportunities and challenges for energy users [25,26,27,28]. They are all primarily inclined to policy analysis; due to the changeable market, there have been many policy updates.
- ✓
Overall, previous studies are biased towards unilateral research, without considering the risks faced by enterprises comprehensively, or the policies studies are outdated without applying to the latest policies in China. Research should be conducted to provide a comprehensive analysis of the opportunities and challenges faced by enterprises, the factors they should consider and the economy of their choice under different carbon reduction pathways. In this study, we summarize China’s current carbon emissions trading policies and policies related to the development of renewable energy, based on which we analyze the factors and related costs that energy users need to consider to achieve carbon emissions requirements.
China’s latest carbon reduction measures and policy requirements are introduced in the next section. Current and short-term energy structures in China are included in the third part, and the carbon intensity of electricity is calculated. Based on policies and regulations mentioned in previous sectors, the fourth part takes manufacturing enterprises as an example and lists the factors, the risks and challenges to be considered. Four cities in China, Beijing, Shanghai, Guangzhou and Wuhan, are chosen as examples to analyze the differences among different local policies. Finally, conclusions are made to summarize current situations for enterprises and provide some recommendations. The research results can enable energy users to more comprehensively consider the pathway to achieve low-carbon development in China.
2. Policy Review
2.1. Carbon Trading System
A carbon trading system is considered as a popular and efficient way to control carbon emissions from the user side. The EU ETS was launched in 2005 [32]. It is the first, largest and most prominent system for regulating carbon emissions and allocating them across European countries. In Oct 2011, National Development and Reform Commission (NRDC) in China decided to introduce a carbon market into China, and chose seven provinces/cities (hereinafter referred to as provinces) as pilots, including Beijing, Tianjin, Shanghai, Chongqing, Hubei, Guangdong (except Shenzhen) and Shenzhen [33]. Fujian voluntarily joined the carbon market in 2016. However, as shown in Table 1, different provinces have different regulations about covered sectors [34,35,36,37,38,39,40,41]. Some of the provinces take energy consumption or carbon emissions above a certain size as the criterion. While, other cities only monitor and assess carbon emissions from certain industries or set different criteria for different industries, like Shanghai and Guangdong. Over time, carbon markets in those pilot provinces are covering a wider and wider range of industries and the standard emissions values for mandatory assessments are getting lower and lower. Therefore, more enterprises are now becoming involved in the carbon trading market.
The differences in policies lead to different difficulties in meeting the requirements, which makes the carbon prices vary from province to province. Besides, because the carbon trading system in China is still in its growth stage, the price of emission allowance fluctuates. At the end of 2017, the central government announced the setup of the national carbon trading market. The power generation industry was chosen as the pioneer. Power generation companies with annual emissions higher than 26,000 tons CO2,eq or with energy consumption higher than 10,000 tons of standard coal equivalent (tce) will be compulsively involved. After one year for data collection and system construction, and another year for simulated trading, the national market will include more participants.
2.2. Guarantee Mechanism of Renewable Energy Power Consumption
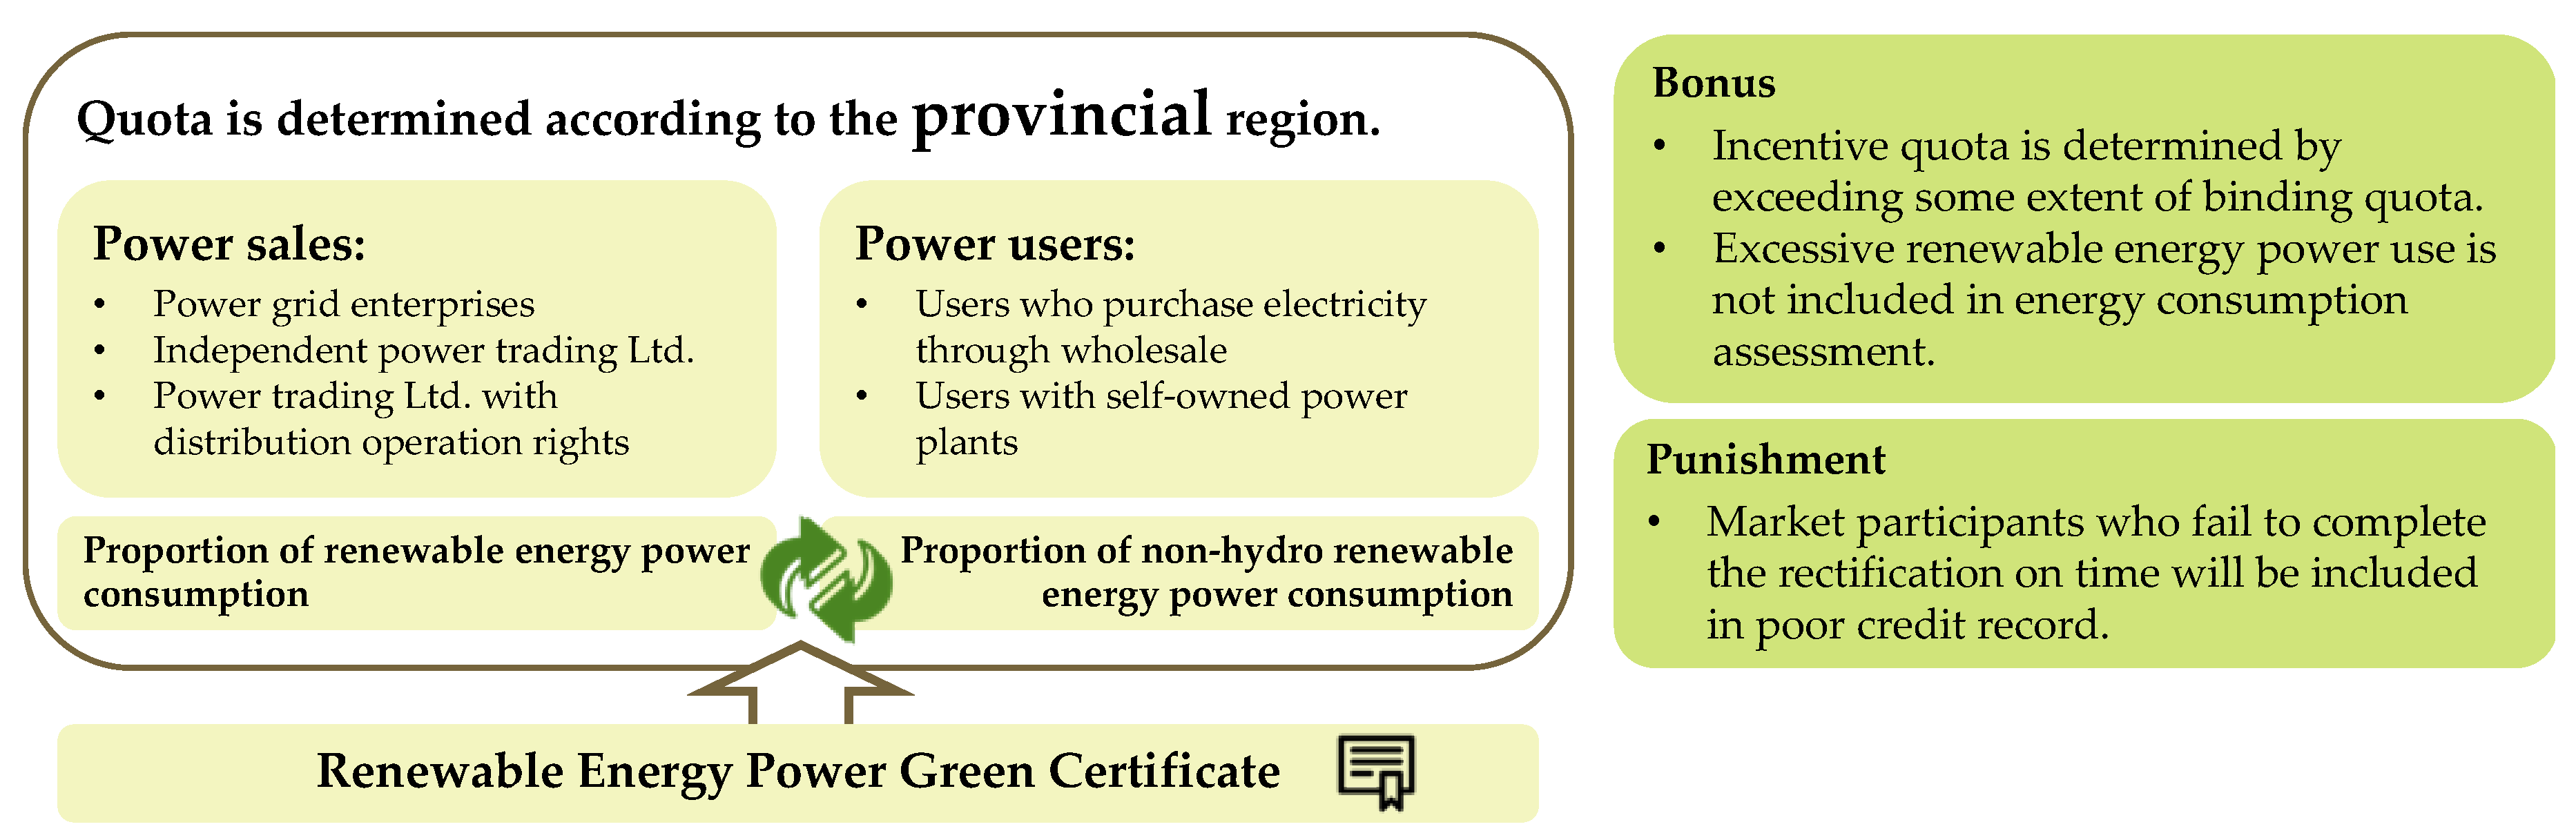
In addition to the carbon trading system, other regulations are also introduced by the government in China to promote the use of renewable energy and restrict the carbon emissions. After three draft versions, the official document of Guarantee Mechanism of Renewable Energy Power Consumption was issued in 2019 by NRDC and National Energy Administration (NEA) [42]. According to the regulation, the test assessment will be carried out on the relevant market participants in 2019. Comprehensive monitoring and formal assessment will begin in 2020. Renewable energy utilization will become a mandatory indicator at the provincial level in China. Details are shown in Figure 1. The proportions of renewable energy and non-hydropower renewable energy consumption in total will be supervised separately. Power sales and power users are asked to achieve the requirement. If the company or province overfulfil the task to the incentive standards, the surplus energy consumption will not be included in energy consumption assessments for the company or province. If they are unable to meet the standards, two possible solutions are provided. The first one is purchasing from other market participants who have extra the annual quota. The other is purchasing equal amount of Renewable Energy Power Green Certificate to compensate the deficiency. If the subjects still cannot achieve the target, they will be punished by the government and listed in the poor credit record.
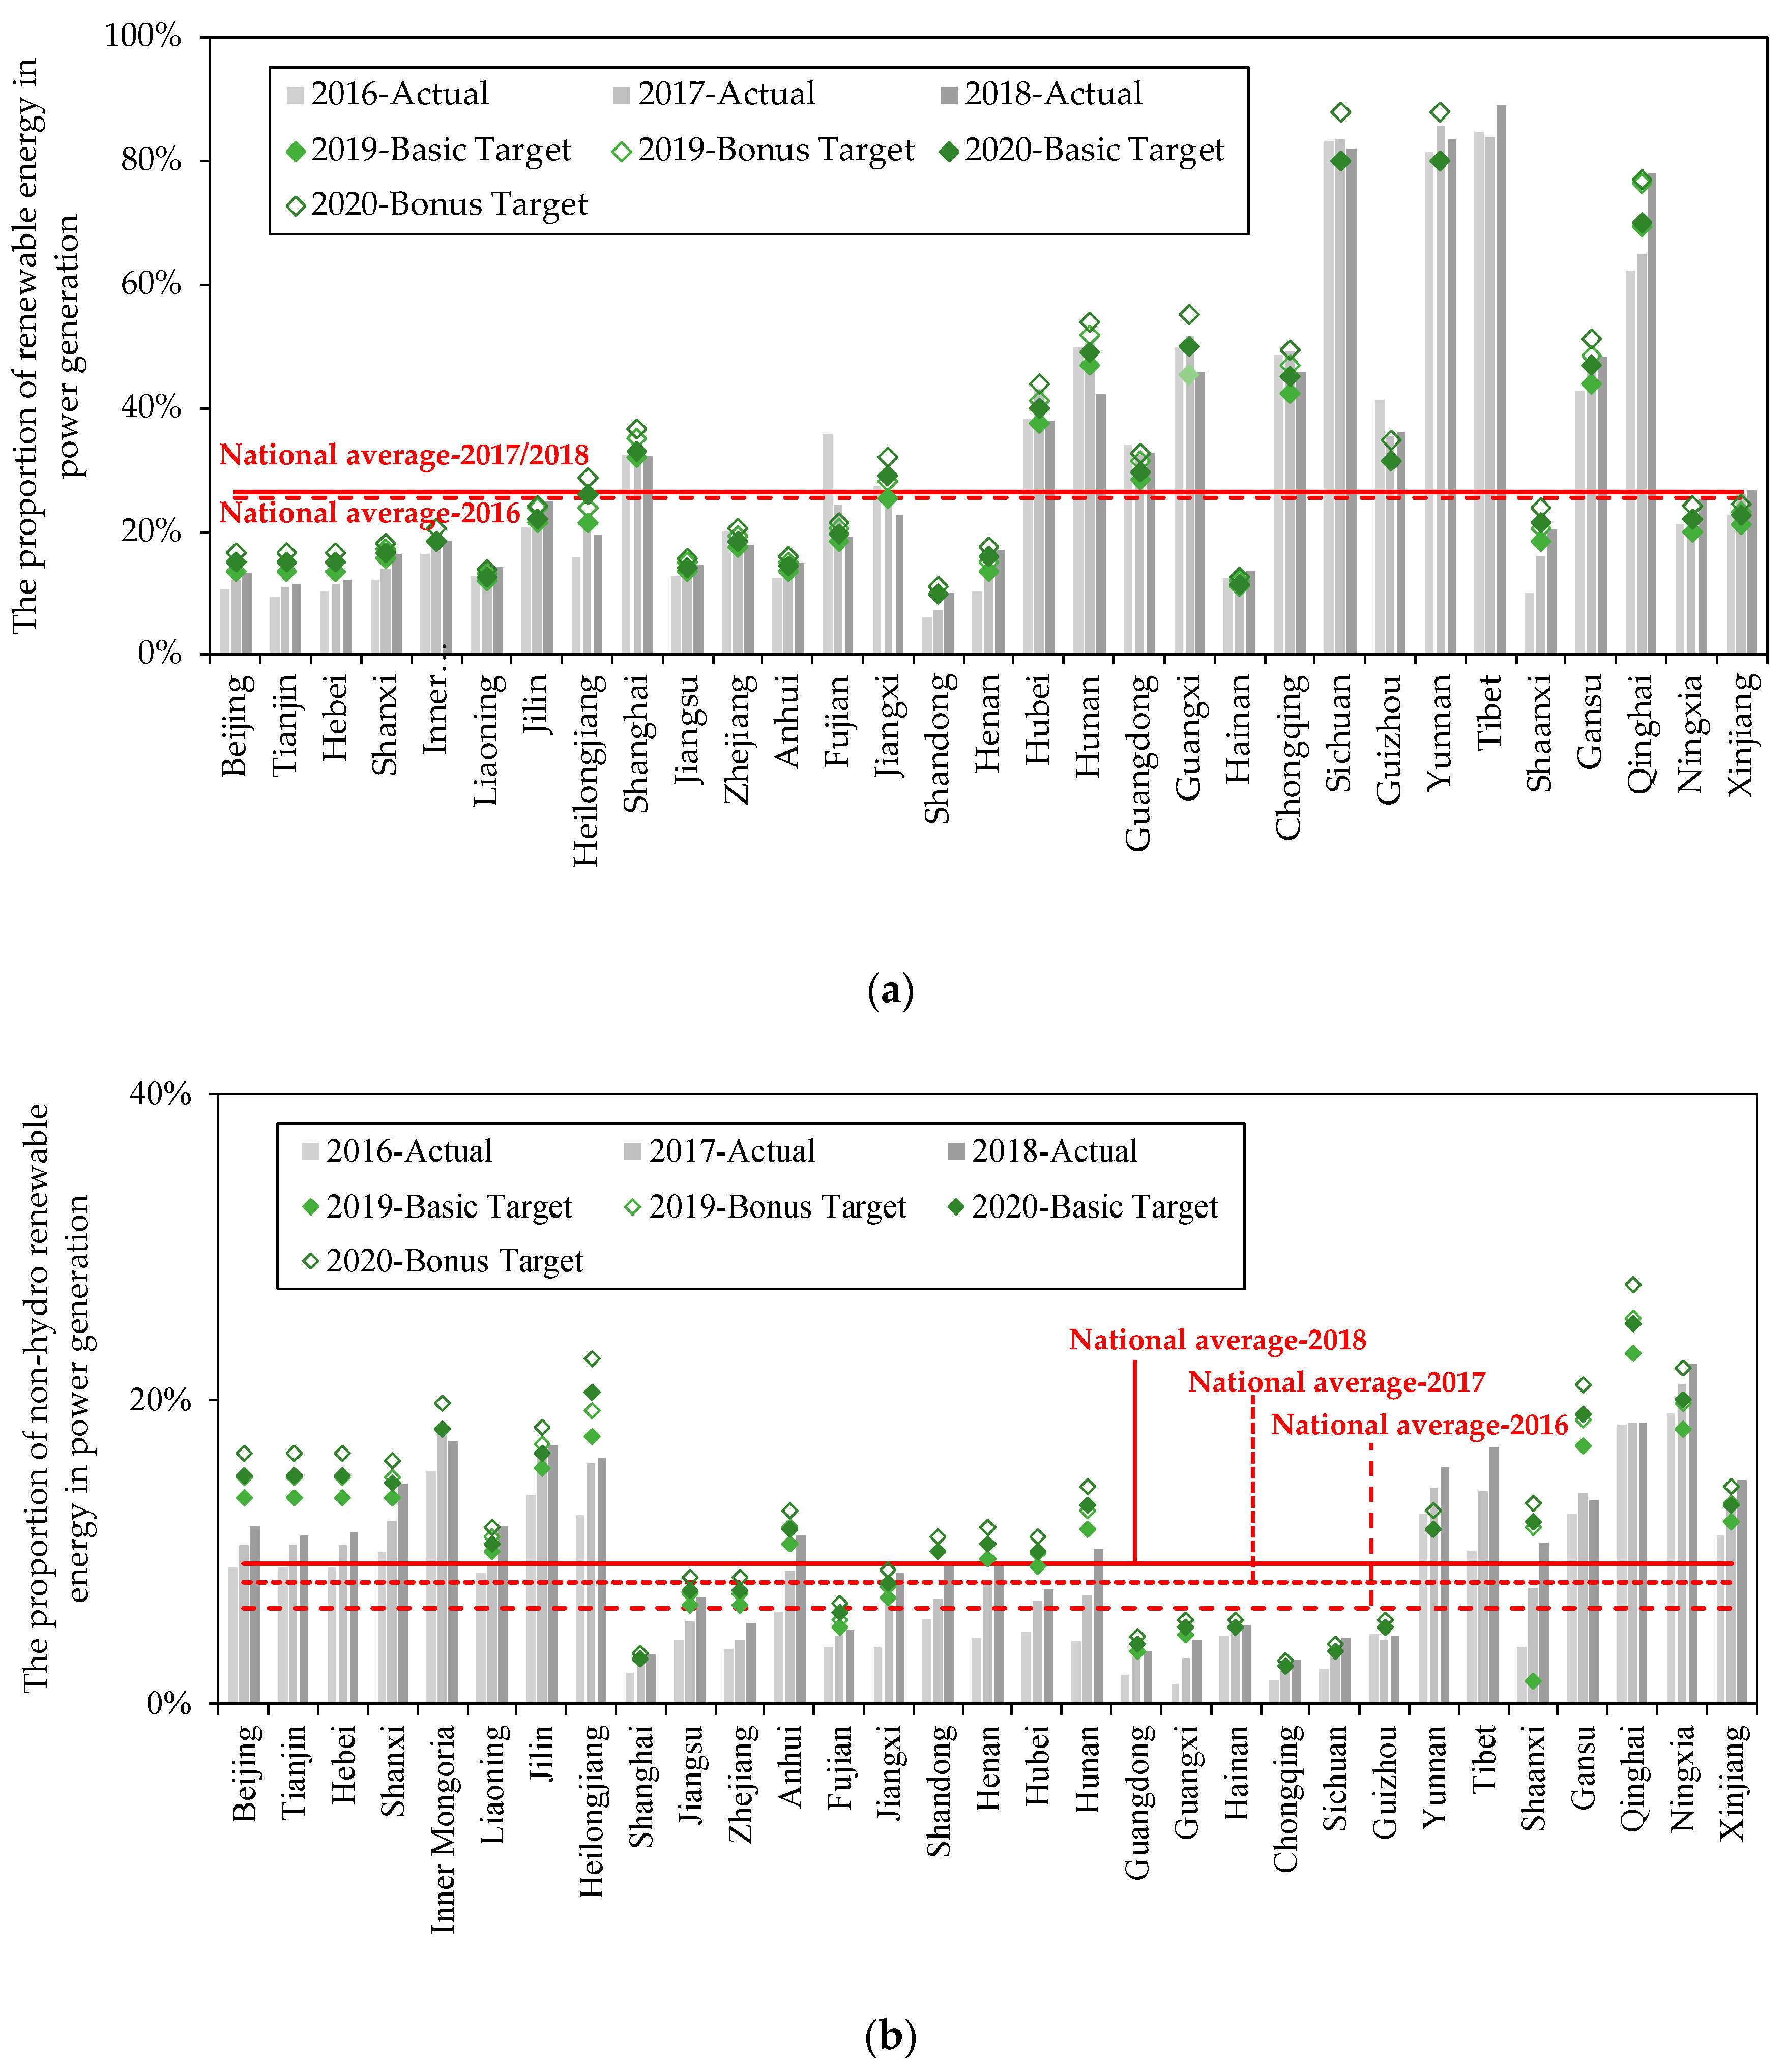
Figure 2 shows the proportions of renewable energy power consumption and non-hydro renewable energy power consumption in total consumption at the provincial level [43,44]. The actual values in the past three years and the targets set by the government in the following two years are included.
- For most of provinces, the ratios of renewable energy power consumption to total power consumption present increasing trend. However, for others, like Heilongjiang, Zhejiang, Hubei, Hunan, etc., due to the rapid growth of energy consumption, the newly added renewable power generation cannot meet the increase in electricity demand. Therefore, the ratio decreases.
- Achieving the goals for 2019 and 2020 is not a big problem for some provinces. In 2018, some provinces have already exceeded the targets for 2019, even for 2020.
- Non-hydro renewable energy consumption shows a totally different situation. Almost for all provinces, the targets for the coming years are higher than the present values. Great efforts should be made in the coming years.
- Though China’s energy demand has surged, and the proportions of (non-hydro) renewable power consumption in total power demand keep growing.
2.3. Financial Support for Renewable Energy
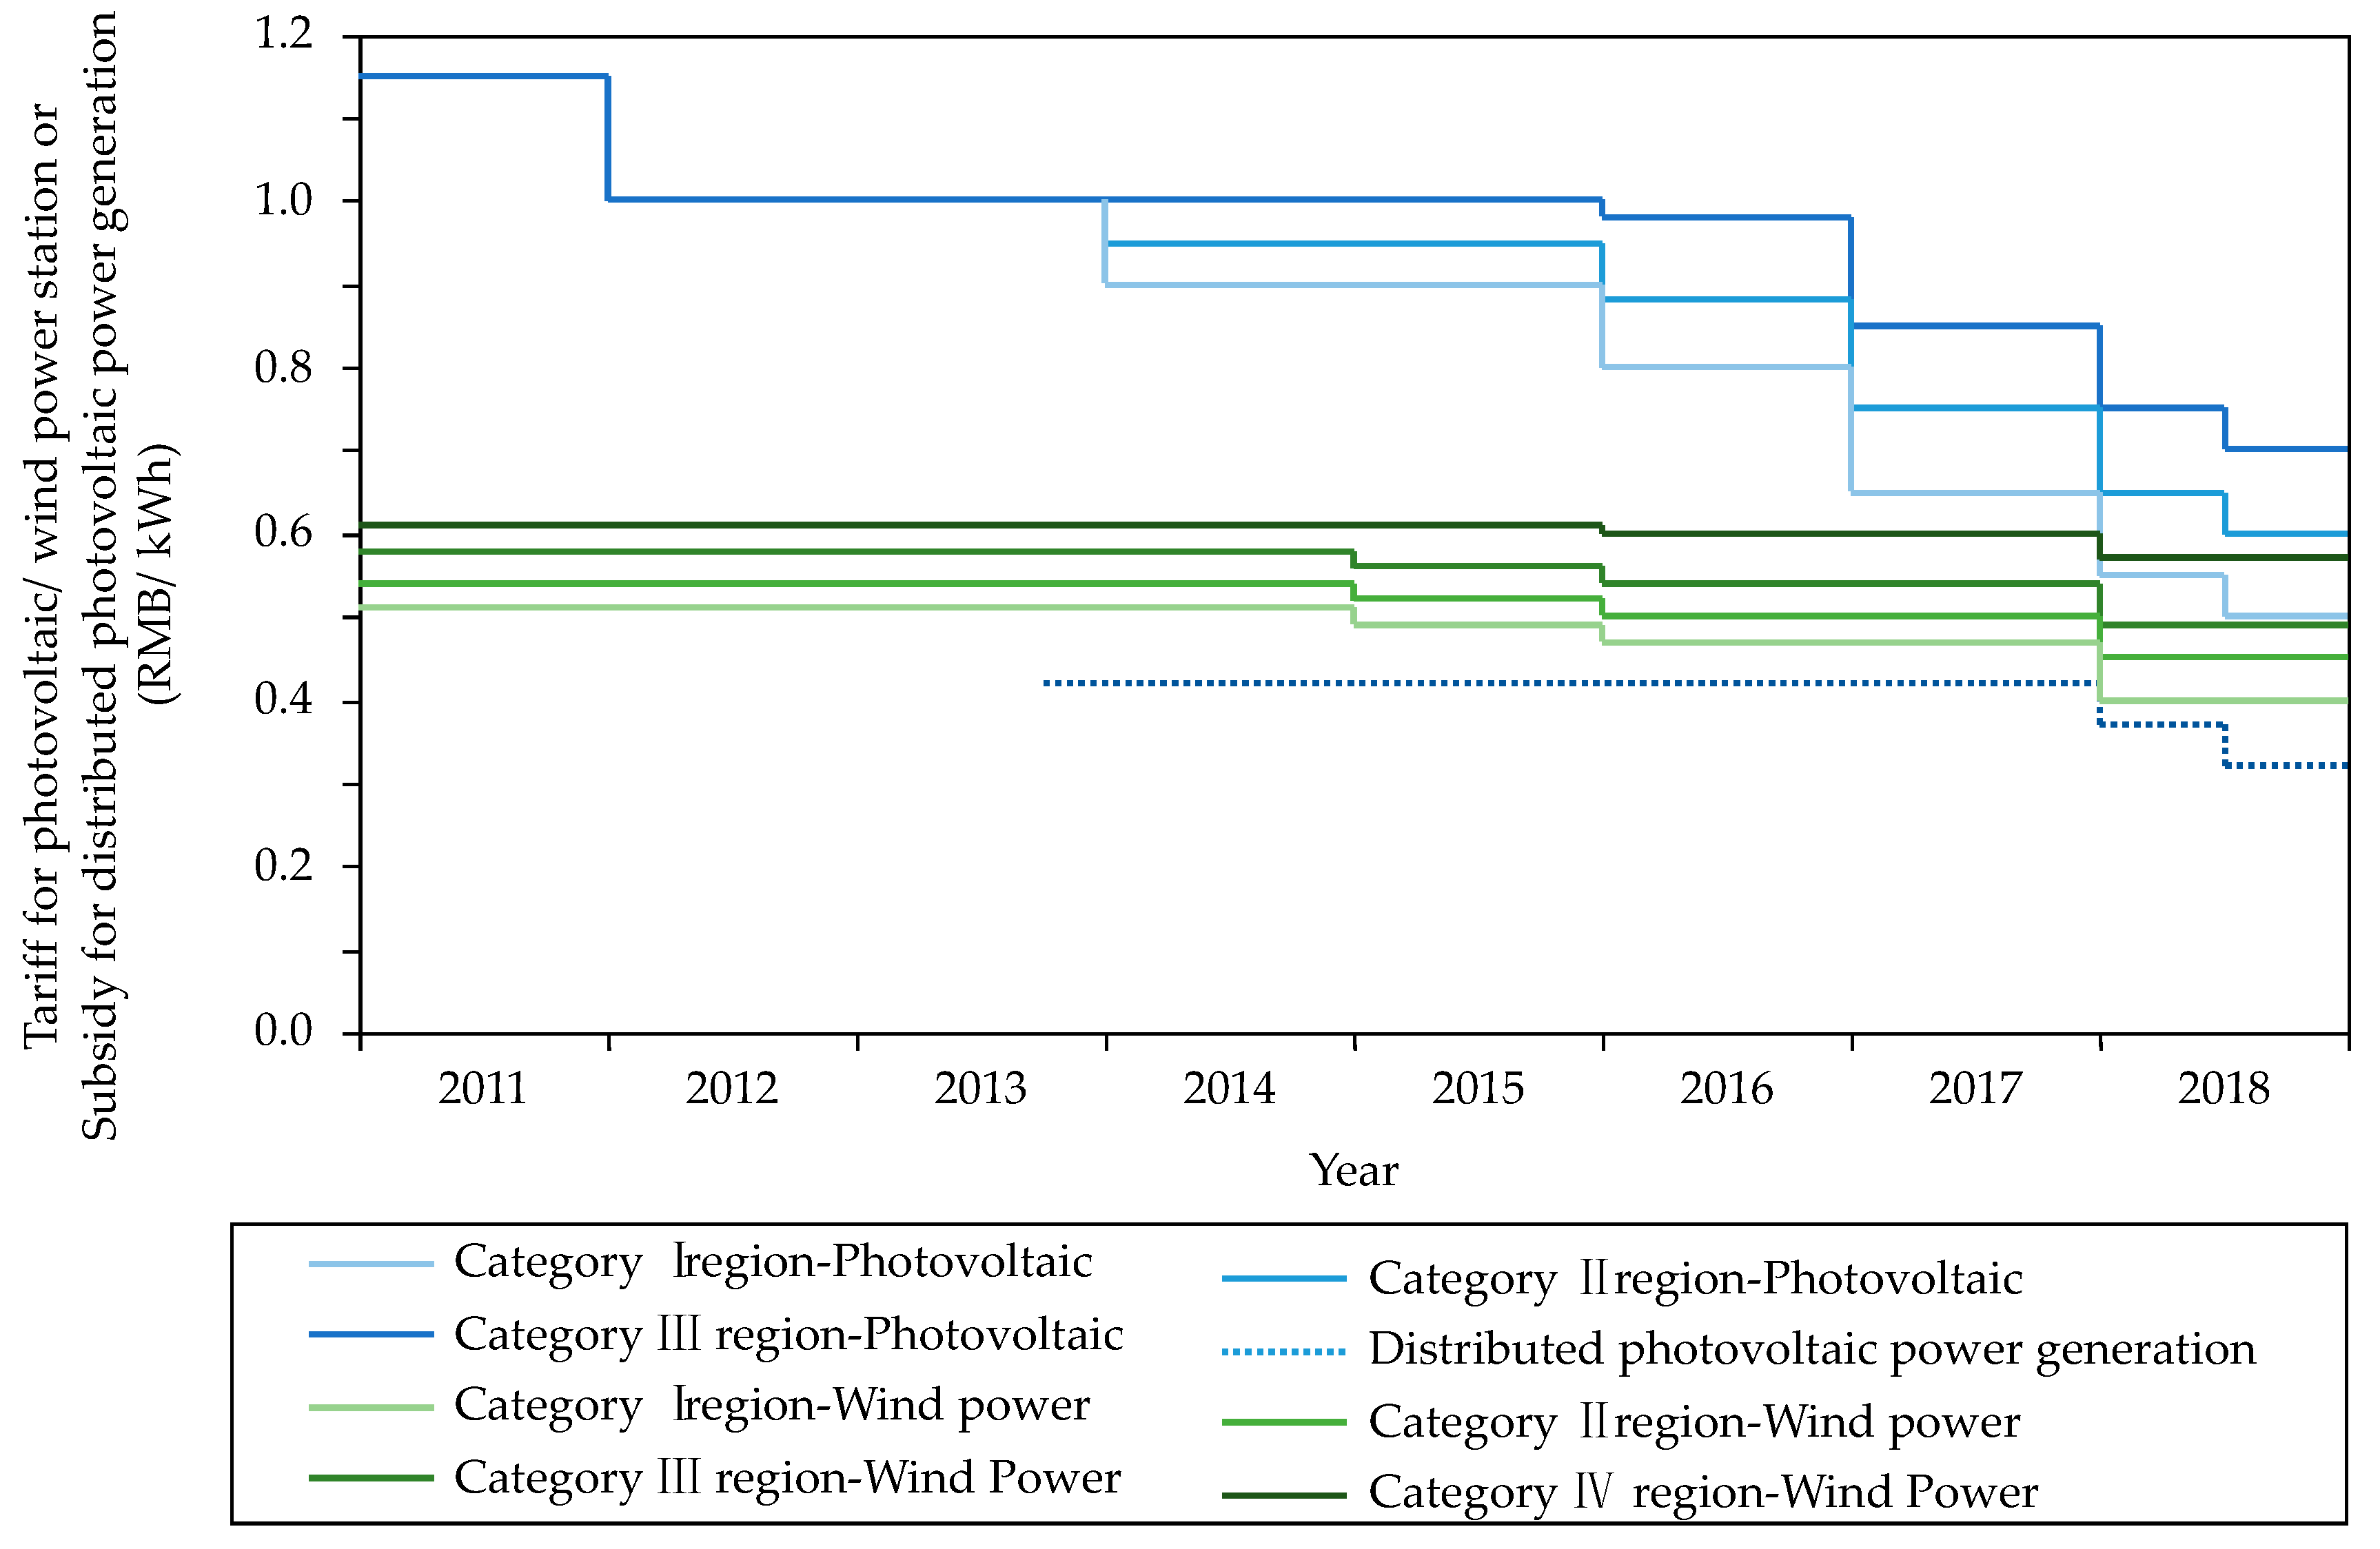
Except for the check-up system, incentive policies are also applied in China to support the relevant industries and technology applications. The first renewable energy subsidy policy was released in 2011. Photovoltaic and wind power are the two most popular objects, and the subsidy amounts are shown in Figure 3 [24,45,46,47]. Because of different natural conditions, different regions enjoy different subsidy policies. Places with worse natural conditions will enjoy higher subsidy amounts. Two pathways are applied to allocate the incentives. The first one is feed-in tariff. The power grid company has to purchase renewable generation at a certain price. The gap between renewable power price and coal-fired power price will be balanced by the government. The other way is by directly providing financial support for power generation. Power plants can receive a certain number of subsidies for every kilowatt-hour of renewable energy produced. The differences in subsidy schemes are mainly due to the fact that part of distributed renewable energy generation is used for self-sufficiency and is not connected to the grid. If the power generation owners are qualified for subsidy, the subsidy will last for 20 years for the program. With the technical progress and financial pressure on the government, subsidies per unit of power generation are falling. Renewable power generation projects with equal price to coal-fired power generation are encouraged. On the promise of ensuring electricity consumption, priority is given to the construction of these projects. As a whole, financial support for renewable generation will disappear soon.
3. Energy Structure in China
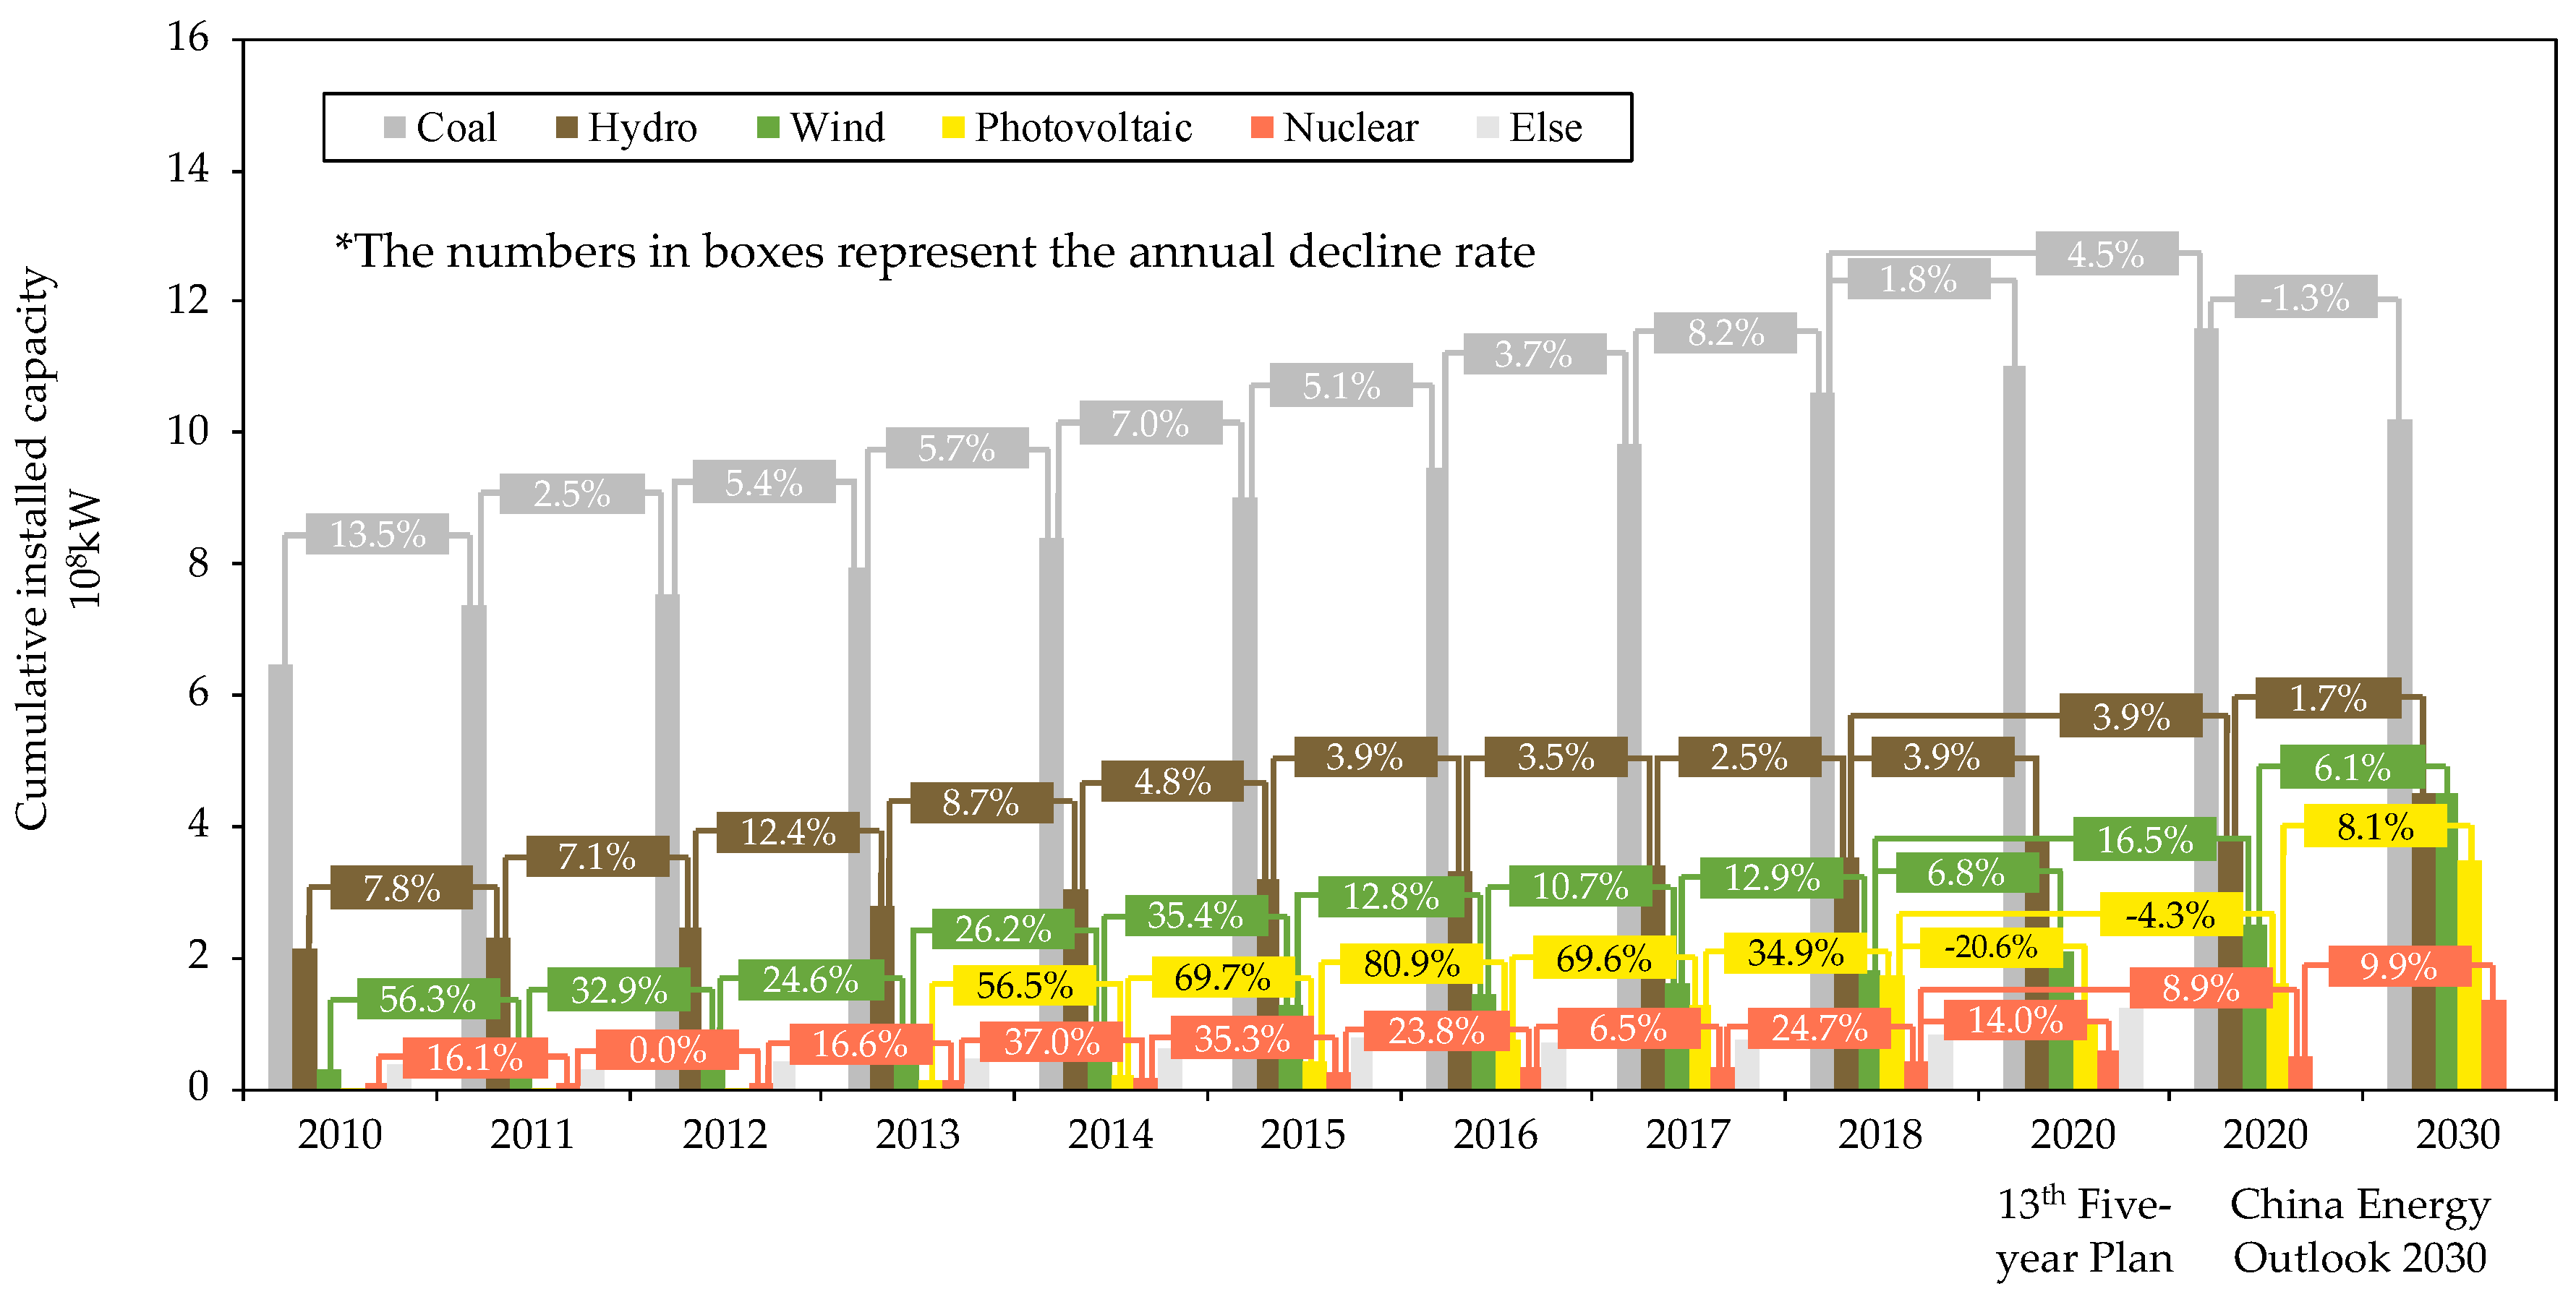
Carbon intensity of the power grid also plays an important role in enterprise-level energy saving and emission reduction. If the electricity from power grid can have lower carbon emission intensity, under the constant power consumption scenario, the pressure from the user side will be reduced. During the past two decades, the cumulative installed capacity of coal-fired power grew at a snail’s pace, and that of renewable energy increased dramatically as shown in Figure 4 [48,49,50,51]. According to the prediction from China Energy Outlook 2030, the installed capacity of coal-fired will even decrease in 2030. In 2030, the power installed capacity of different energy sources will be significantly changed compared with 2010. The carbon intensities of different energy sources of electricity generation in this study are based on a literature review [52,53,54,55,56,57,58,59]. We assume there will be a small drop in carbon emissions produced per unit of coal-fired power generation, from 1230.0 g-CO2/kWh in 2010, to 1136.7 g-CO2/kWh in 2030, and carbon intensities of other electricity generation pathways will remain constant. Based on the 13th Five-Year Plan for Electric Power Development in China, the line loss rate dropped from 6.53% in 2010 to 6.64% in 2015 and will decline to 6.50% in 2020. We assume that it will drop to 6.40% in 2030.
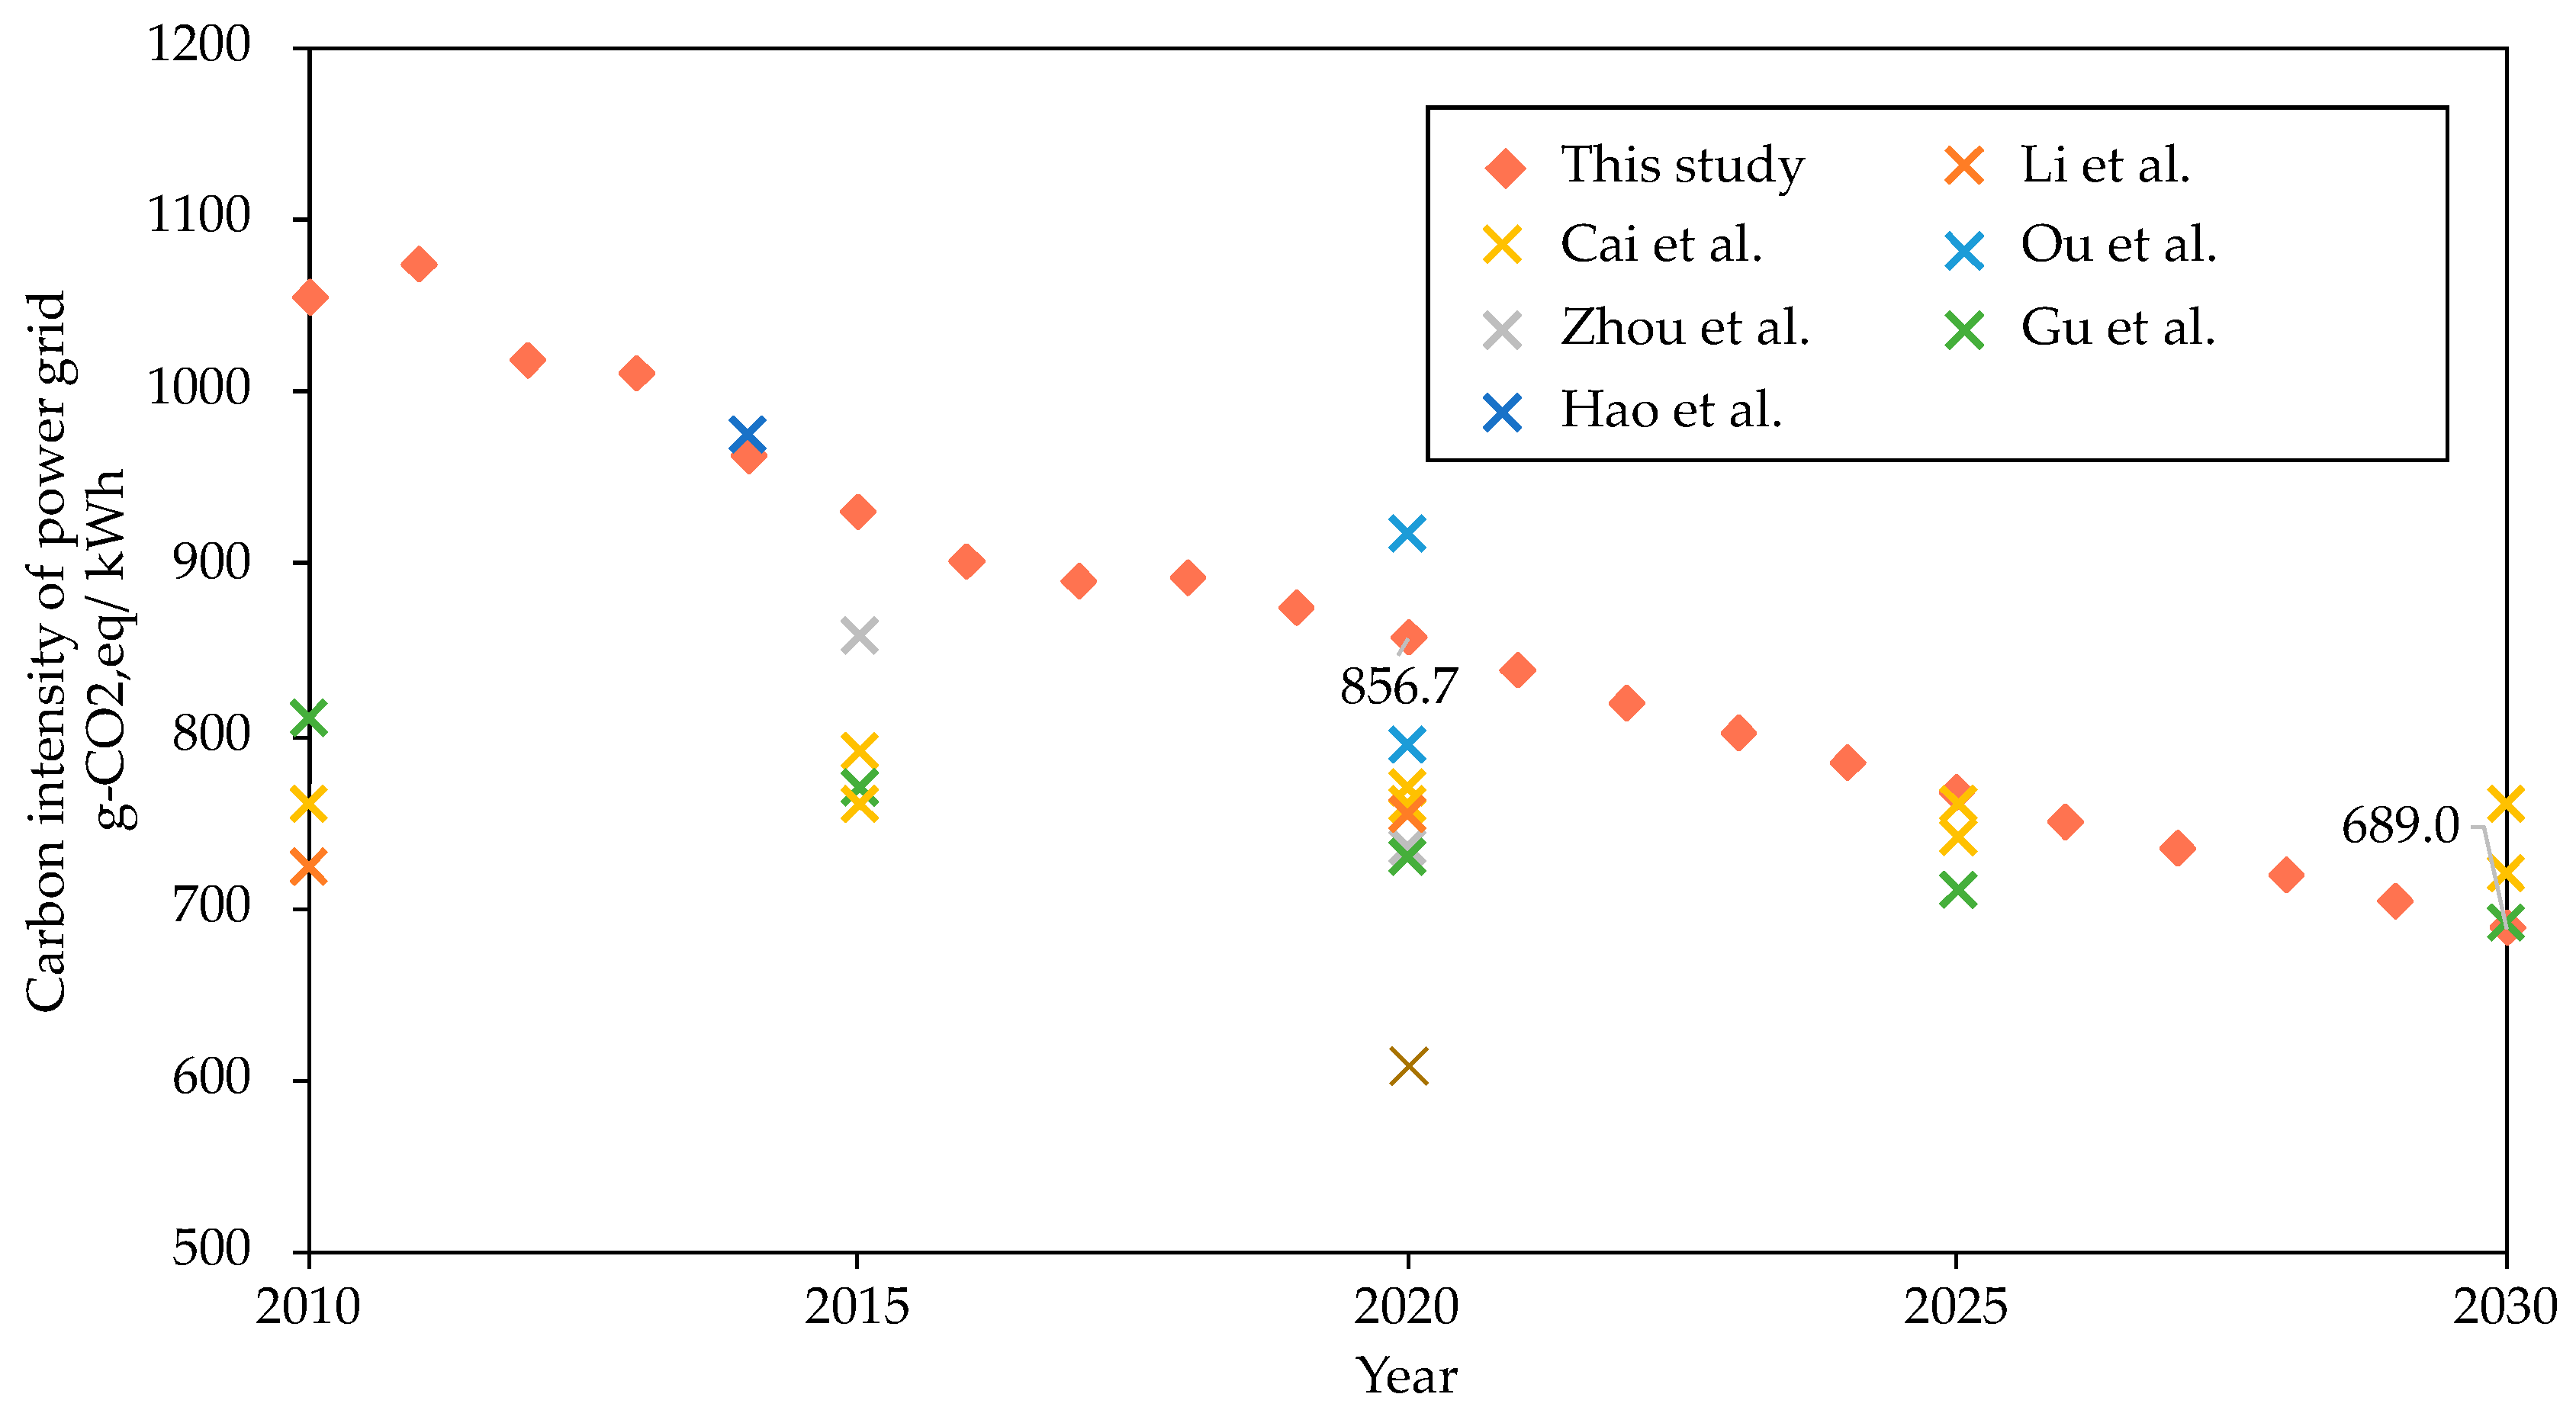
Based on status quo, government planning and a literature review, the final results of carbon intensity of the power grid in China are shown in Figure 5. The reduction in carbon intensity is mainly attributed to the improvement of energy structure brought about by the introduction of more renewable energy sources. Considering the cost of investment, it is impossible for coal-fired power plants to shut down very quickly and on a very large scale. Therefore, the carbon intensity of electric power will not decrease sharply in a short time. Power users still need to take some measures in their own ways if they are asked to realize a higher carbon emissions reduction target. Based on our study, carbon intensity of electricity consumption from power grid will fall to 856.7 g-CO2 in 2020 and 689.0 g-CO2 in 2030, which is only 65% of that in 2010. Compared with previous research, the carbon intensity in this study is a little bit higher [53,54,55,60,61,62]. This is because we consider the carbon intensity of the electricity at the user end which includes the line losses, rather than the power generation end.
4. Case Study
The last two sections summarized policies implemented by China governments to achieve low-carbon development and policies related to China’s power structure. Enterprises, as power users, will gradually assume the responsibility of carbon emission reduction. These policies are the basic information that they need to know. The following section will provide a comprehensive analysis of factors that energy users need to consider in response to policies and the cost comparison of some options.
4.1. What Should be Considered
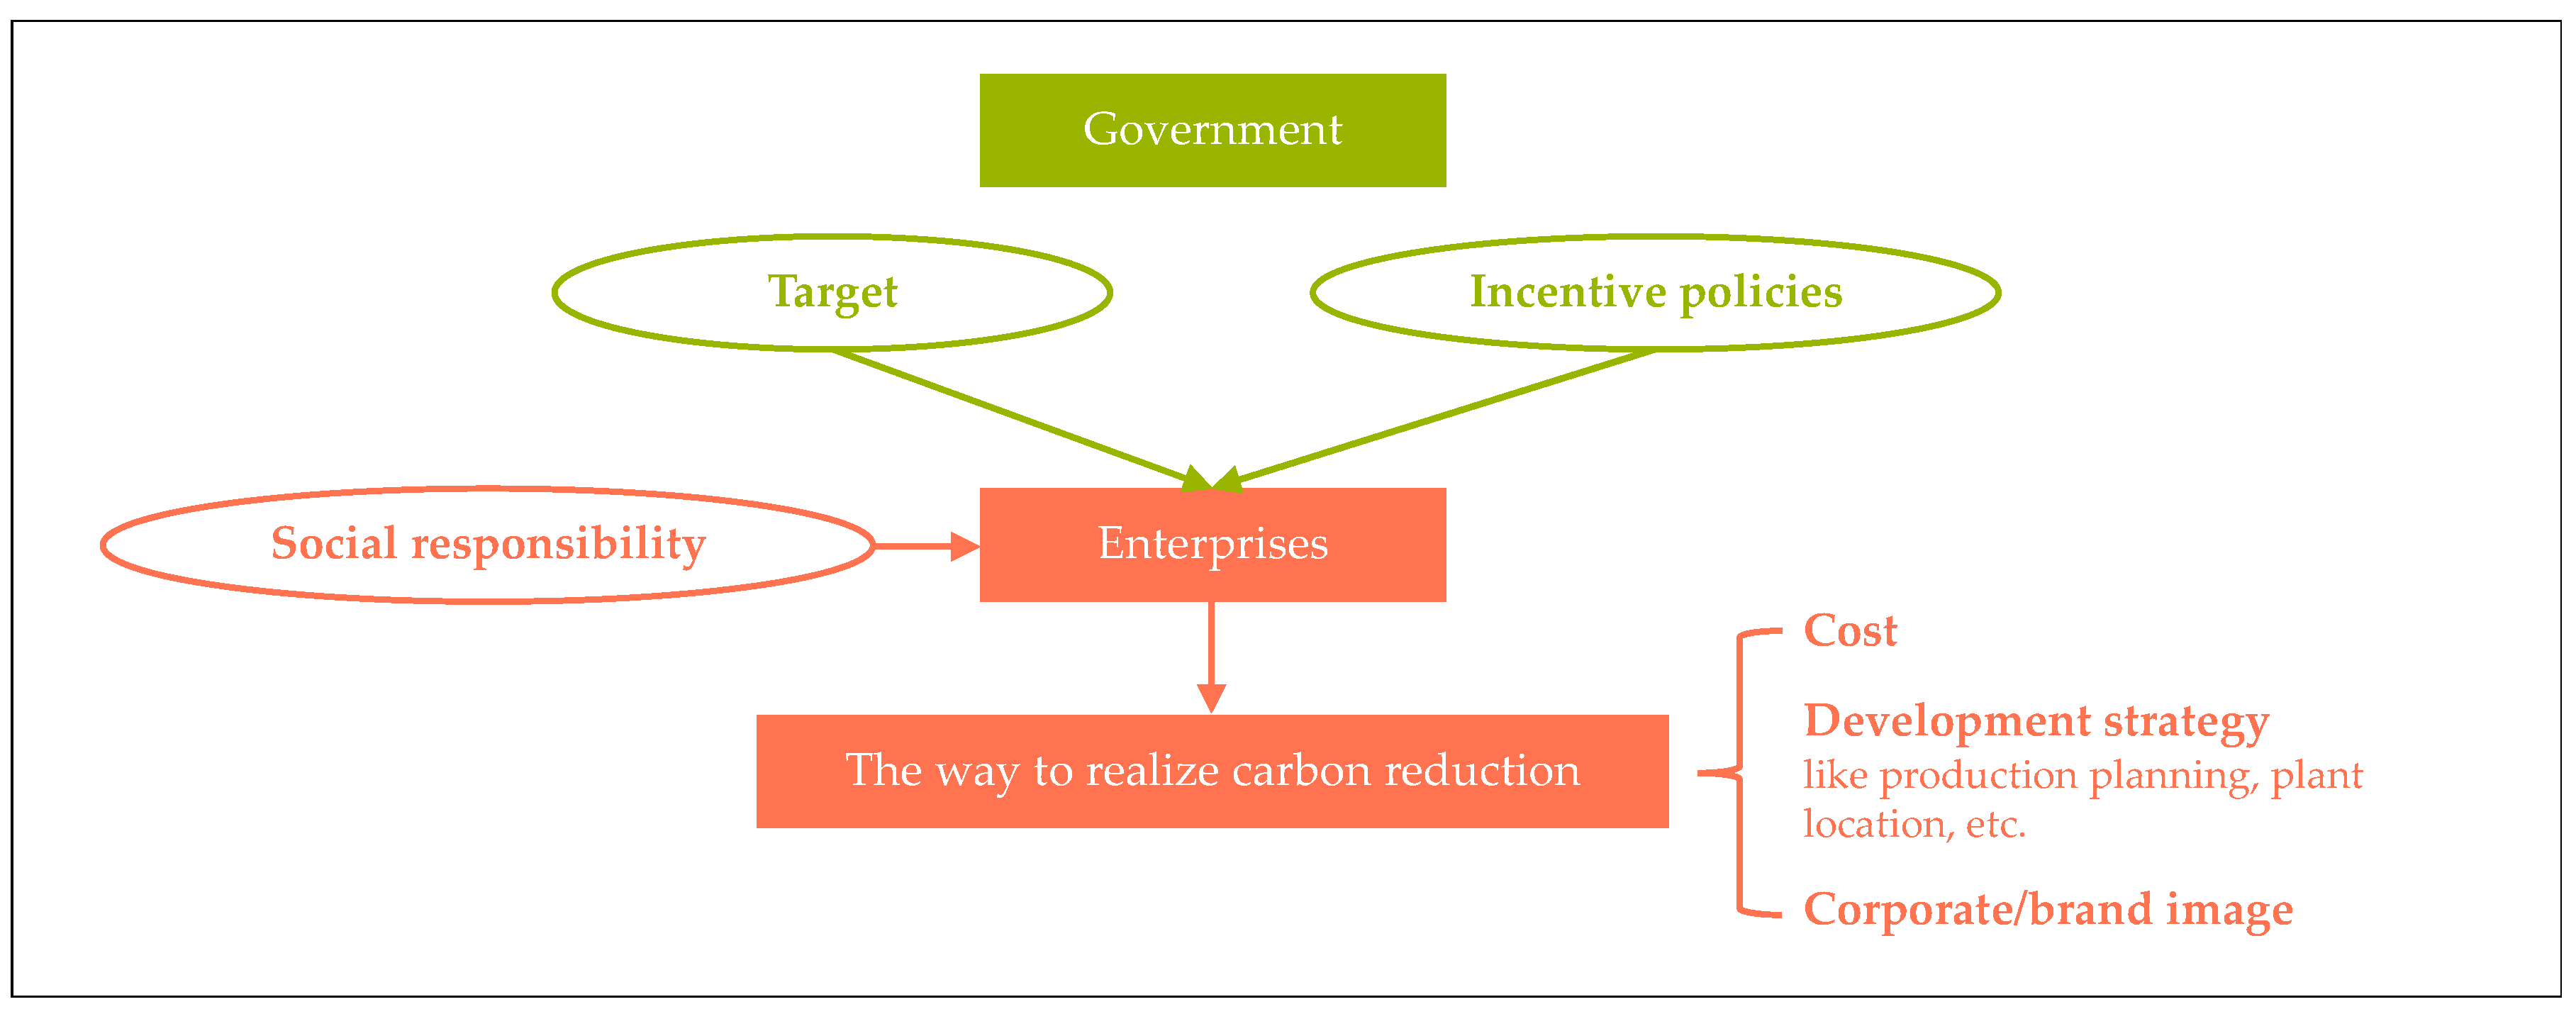
As the ultimate executor of carbon reduction, enterprises need a comprehensive analysis of various factors to make long-term analysis. As shown in Figure 6, the pressure and incentive measures from the government are the basic driving force as mentioned in last section. Besides, social responsibility is another crucial reason for enterprises to control carbon emissions and adopt approaches proactively. It is not a quantitative indicator but indeed the responsibility of the company as part of social development. The enterprises have to consider various factors to make the final decision. Cost is one of the most essential ones. The enterprises need to compare the cost of carbon reduction and the penalty price. The development strategy will also have an influence on the decision. The production planning will determine the energy consumption, and indirectly affect emissions. The available renewable energy resources to enterprises will depend on the location of plants. The social responsibility will also encourage the enterprise to set up a green corporate or brand image. Therefore, there are driving forces from government and society for energy consumers to think about carbon emission reduction. The choice of the energy users will also be a decision that takes into account multiple factors.
4.2. Solutions to Carbon Emissions
As mentioned in the policy review, the carbon emission cap and trading market will provide the simplest solution in response to carbon emissions assessment. In China, not all industries and all provinces are included in the scope of assessment. Therefore, the carbon price is relatively low. While, the ultimate goal of the government is to reduce carbon emissions, not to impose fines. Energy users should also think about other greener behaviors except for paying the penalty.
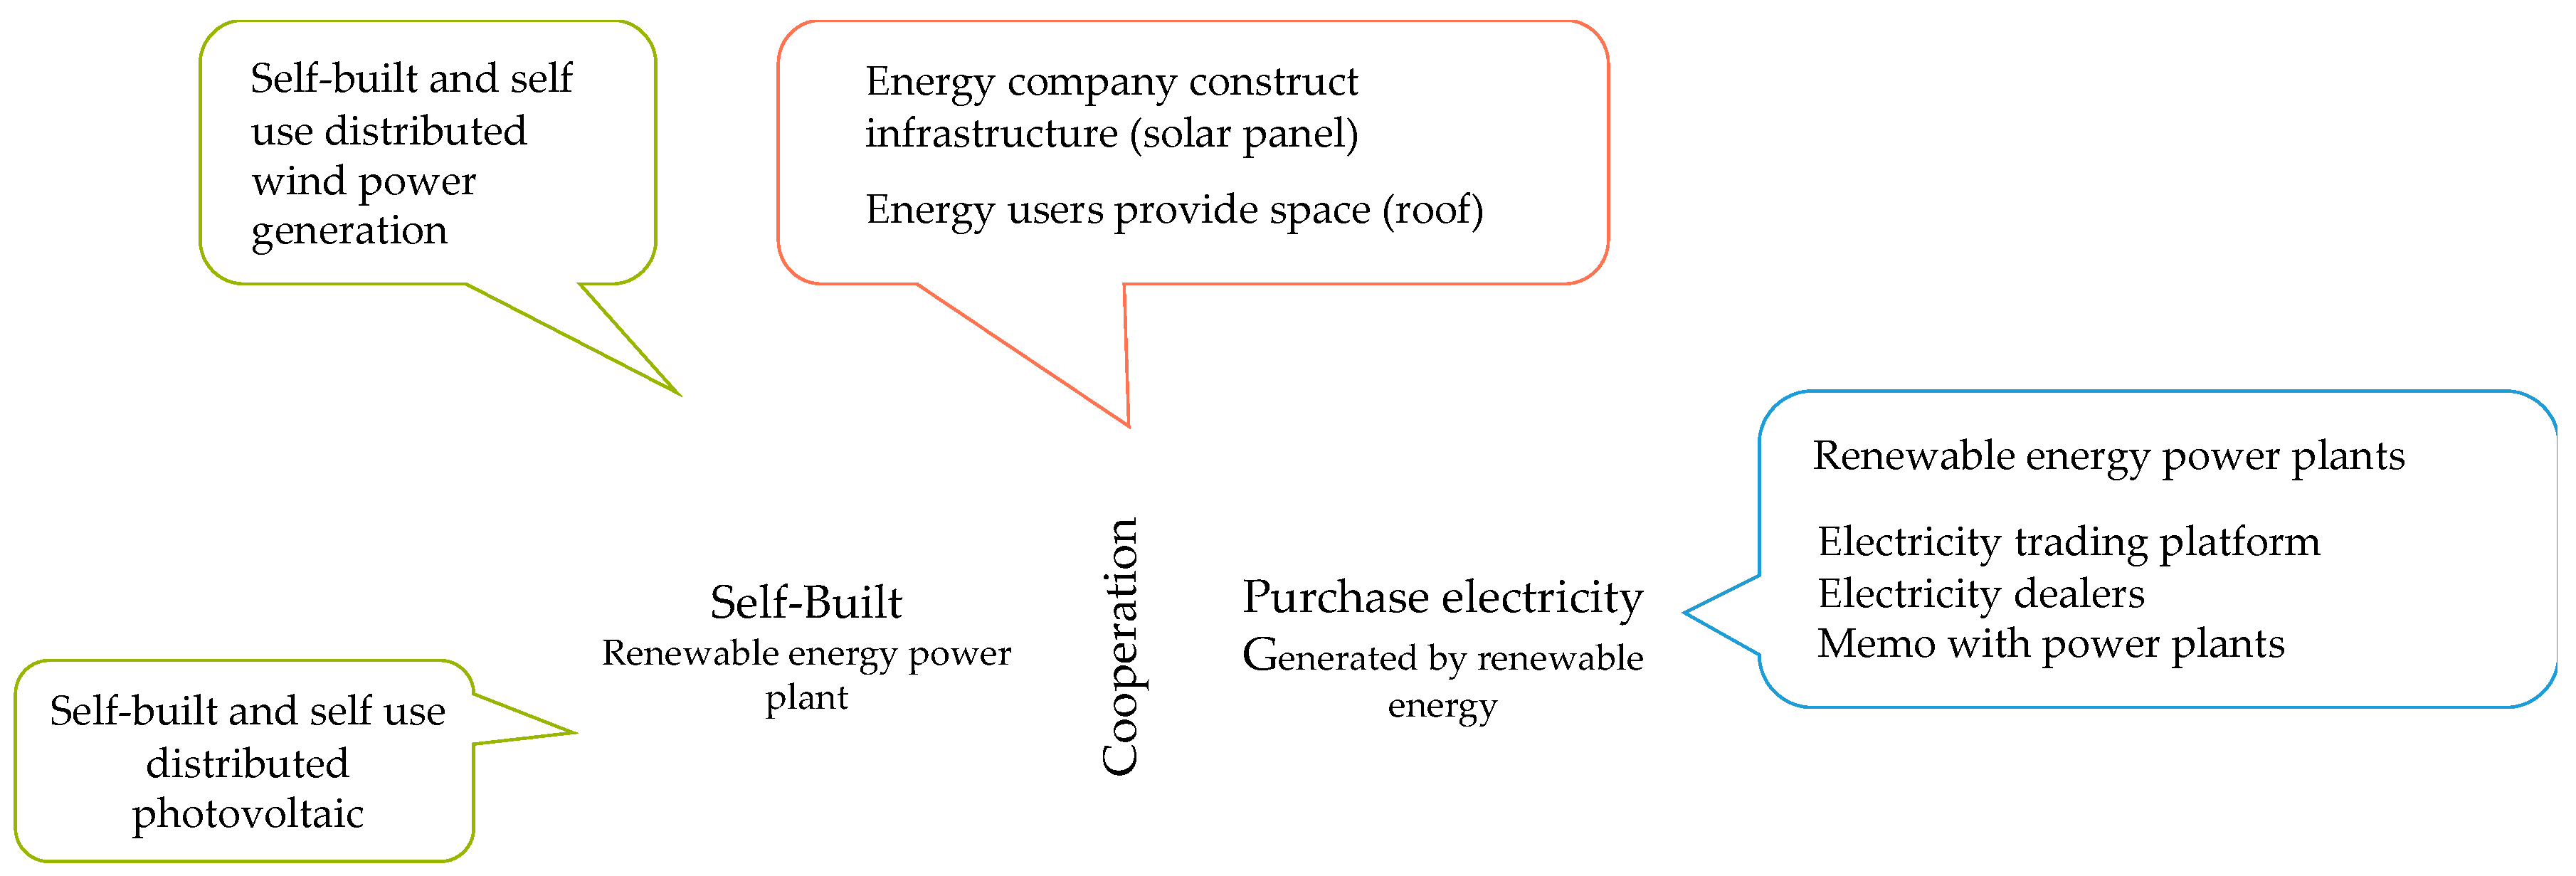
Introducing renewable energy into the production process of enterprises is an effective and currently the most popular solution. Energy users have several options as shown in Figure 7. Some choose to build renewable energy power plants by themselves. Though with a high initial cost, the enterprise can enjoy free green electricity for a long period, around 20 to 25 years. Besides, the national and local subsidies will directly be given to energy users. It is also an excellent way to show off to the public with green factories. Distributed photovoltaic technology is currently the most popular way, and distributed wind power plants are becoming attractive with continuing government financial support; roof rental is another plan. Enterprises usually have plenty of free roof space. The property provides space and the energy company will be responsible for construction. The enterprise will be the first choice for power sales generated from their property. In this way, energy supply can be guaranteed and the price could be relatively stable. Electricity trading platforms and electricity dealers offer the third solution. Energy users can purchase green electricity via these media. They can also sign memos with power plants directly and the technology of long-distance power transmission makes it possible.
In the long term, the energy users could also shift their plants to locations with plenty of renewables, like the western region in China. Factory site selection will play an essential role in carbon emissions of unit energy use. Besides, energy-saving solutions will be another choice, although it is a very complicate case. There are big differences in energy-saving technologies and their potentials in different industries; this is not included in this research.
It is quite difficult to get the prices if energy users choose to purchase electricity from partners. Due to the data availability, we only compare the cost of introducing self-built and self-use distributed photovoltaic technology and carbon prices in the following section. The methods mentioned in this section still should be considered by the energy users as possible solutions to introduce green electricity and reduce carbon emissions.
5. Cost Analysis of Renewable Energy
5.1. Basic Assumption
The economic analysis of renewable energy is a hot topic to evaluate the effectiveness of national targets and supporting policies. It is also an essential part for enterprises to decide which solution should be used to reduce carbon emissions. Many previous studies mentioned that the high cost was the key restriction for renewable energy development [63,64,65]. Currently, only distributed photovoltaic systems can be extensively applied to industry buildings to support self-use. Though dispersed wind power has become an engaging topic, it still will take some time for large-scale promotions to occur. Wind power plant construction has higher site and technical requirements than photovoltaic power generation. Besides, the business mode for dispersed wind power is uncertain. The purchased price of renewable energy from platforms and the contract price with power dealers are difficult to obtain. Therefore, in this study, only the cost estimation of self-used distributed photovoltaic power is determined to evaluate the cost of carbon emissions for enterprises and we compare it to carbon price.
Many studies have been performed to calculate the levelized cost or internal rate of return of photovoltaic electricity [31,63,66,67,68]. Various variables are considered in different researches. Investment cost (including equipment cost, installation cost, etc.), operation and maintenance (O&M) cost, insurance, tax, loan and interest, installed capacity, utilization hours, efficiency of system, lifetime, proportion of internal consumption, subsidy, inverter lifetime, power generation decay rate, discount rate, roof rent and electricity sales price, all can have impacts on the final results [67,69]. Based on the research of He et al., the equipment cost was related to cumulative research investment and cumulative installed capacity, and was more sensitive to the former one [47].
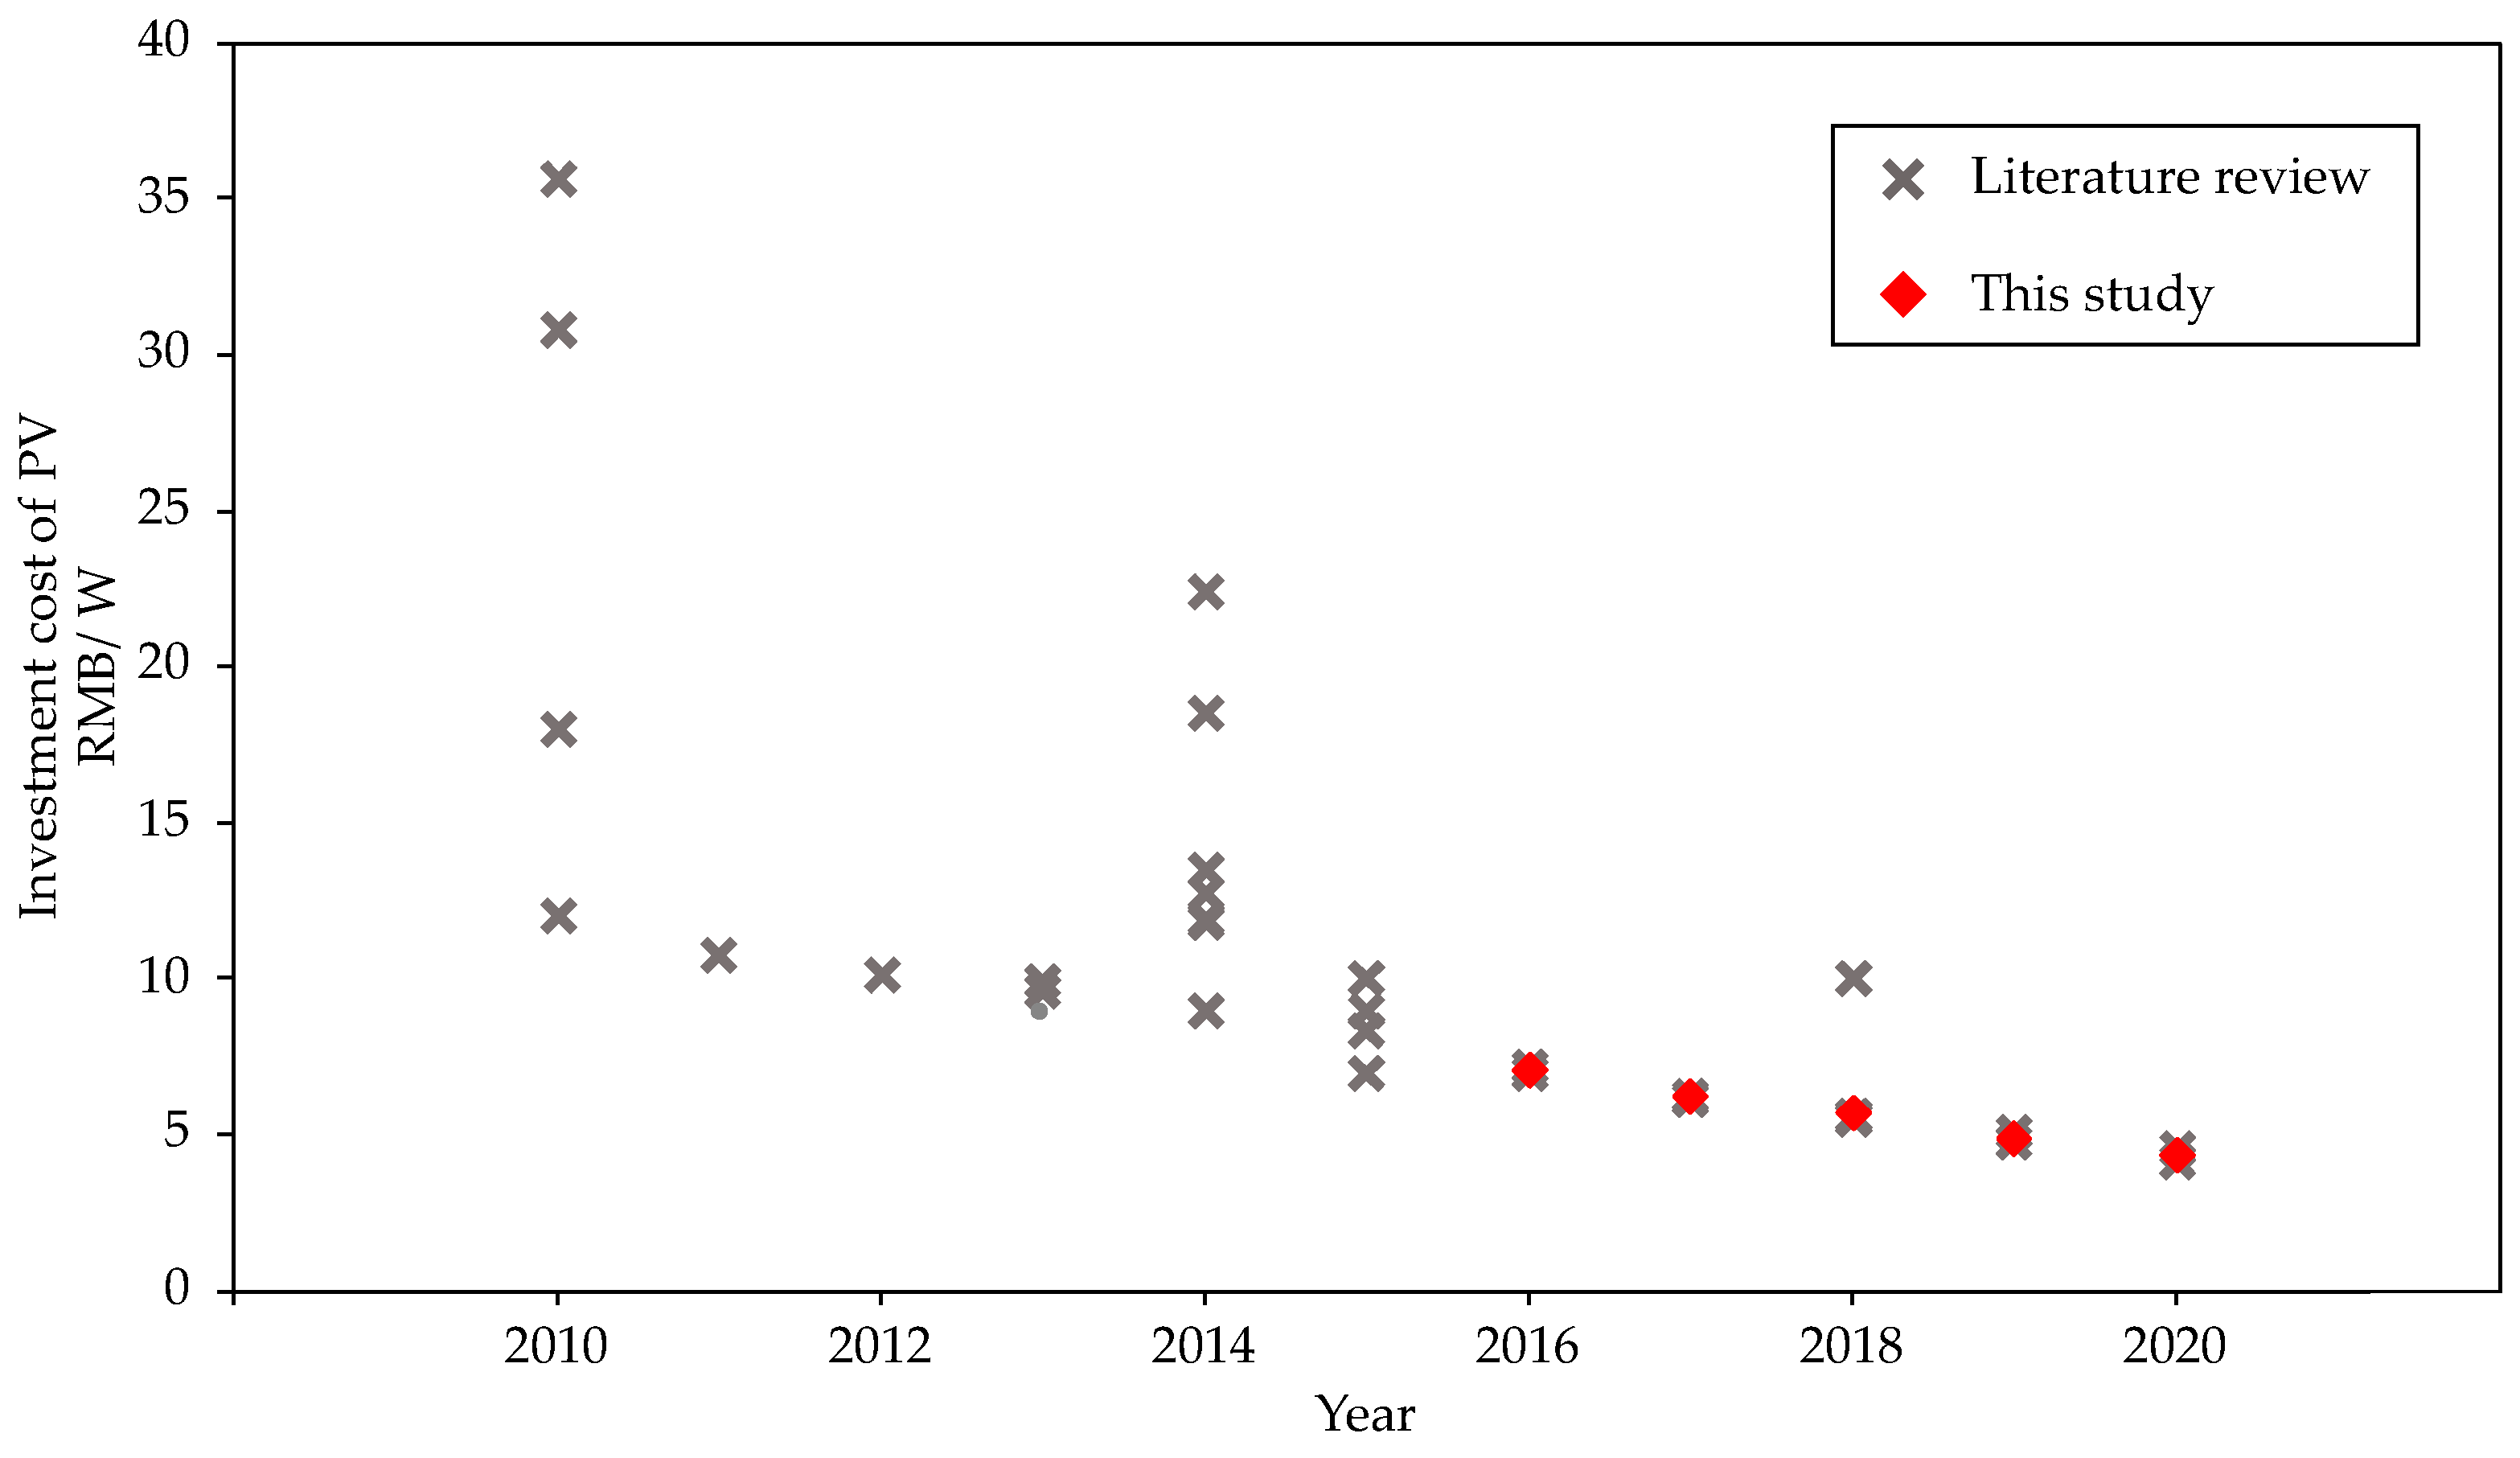
The investment cost includes many details, like module cost, inverter cost, wiring cost, labor cost, design fee, etc. Besides, the lifetime of a photovoltaic system is usually considered as 25 years, but of an inverter is usually 10 years. The investment cost only includes initial cost, the replacement cost of inverters will be contained in operation and maintenance cost. The assumptions of photovoltaic investment cost in this study are shown in Figure 8 [31,47,67,69,70,71,72,73,74,75].
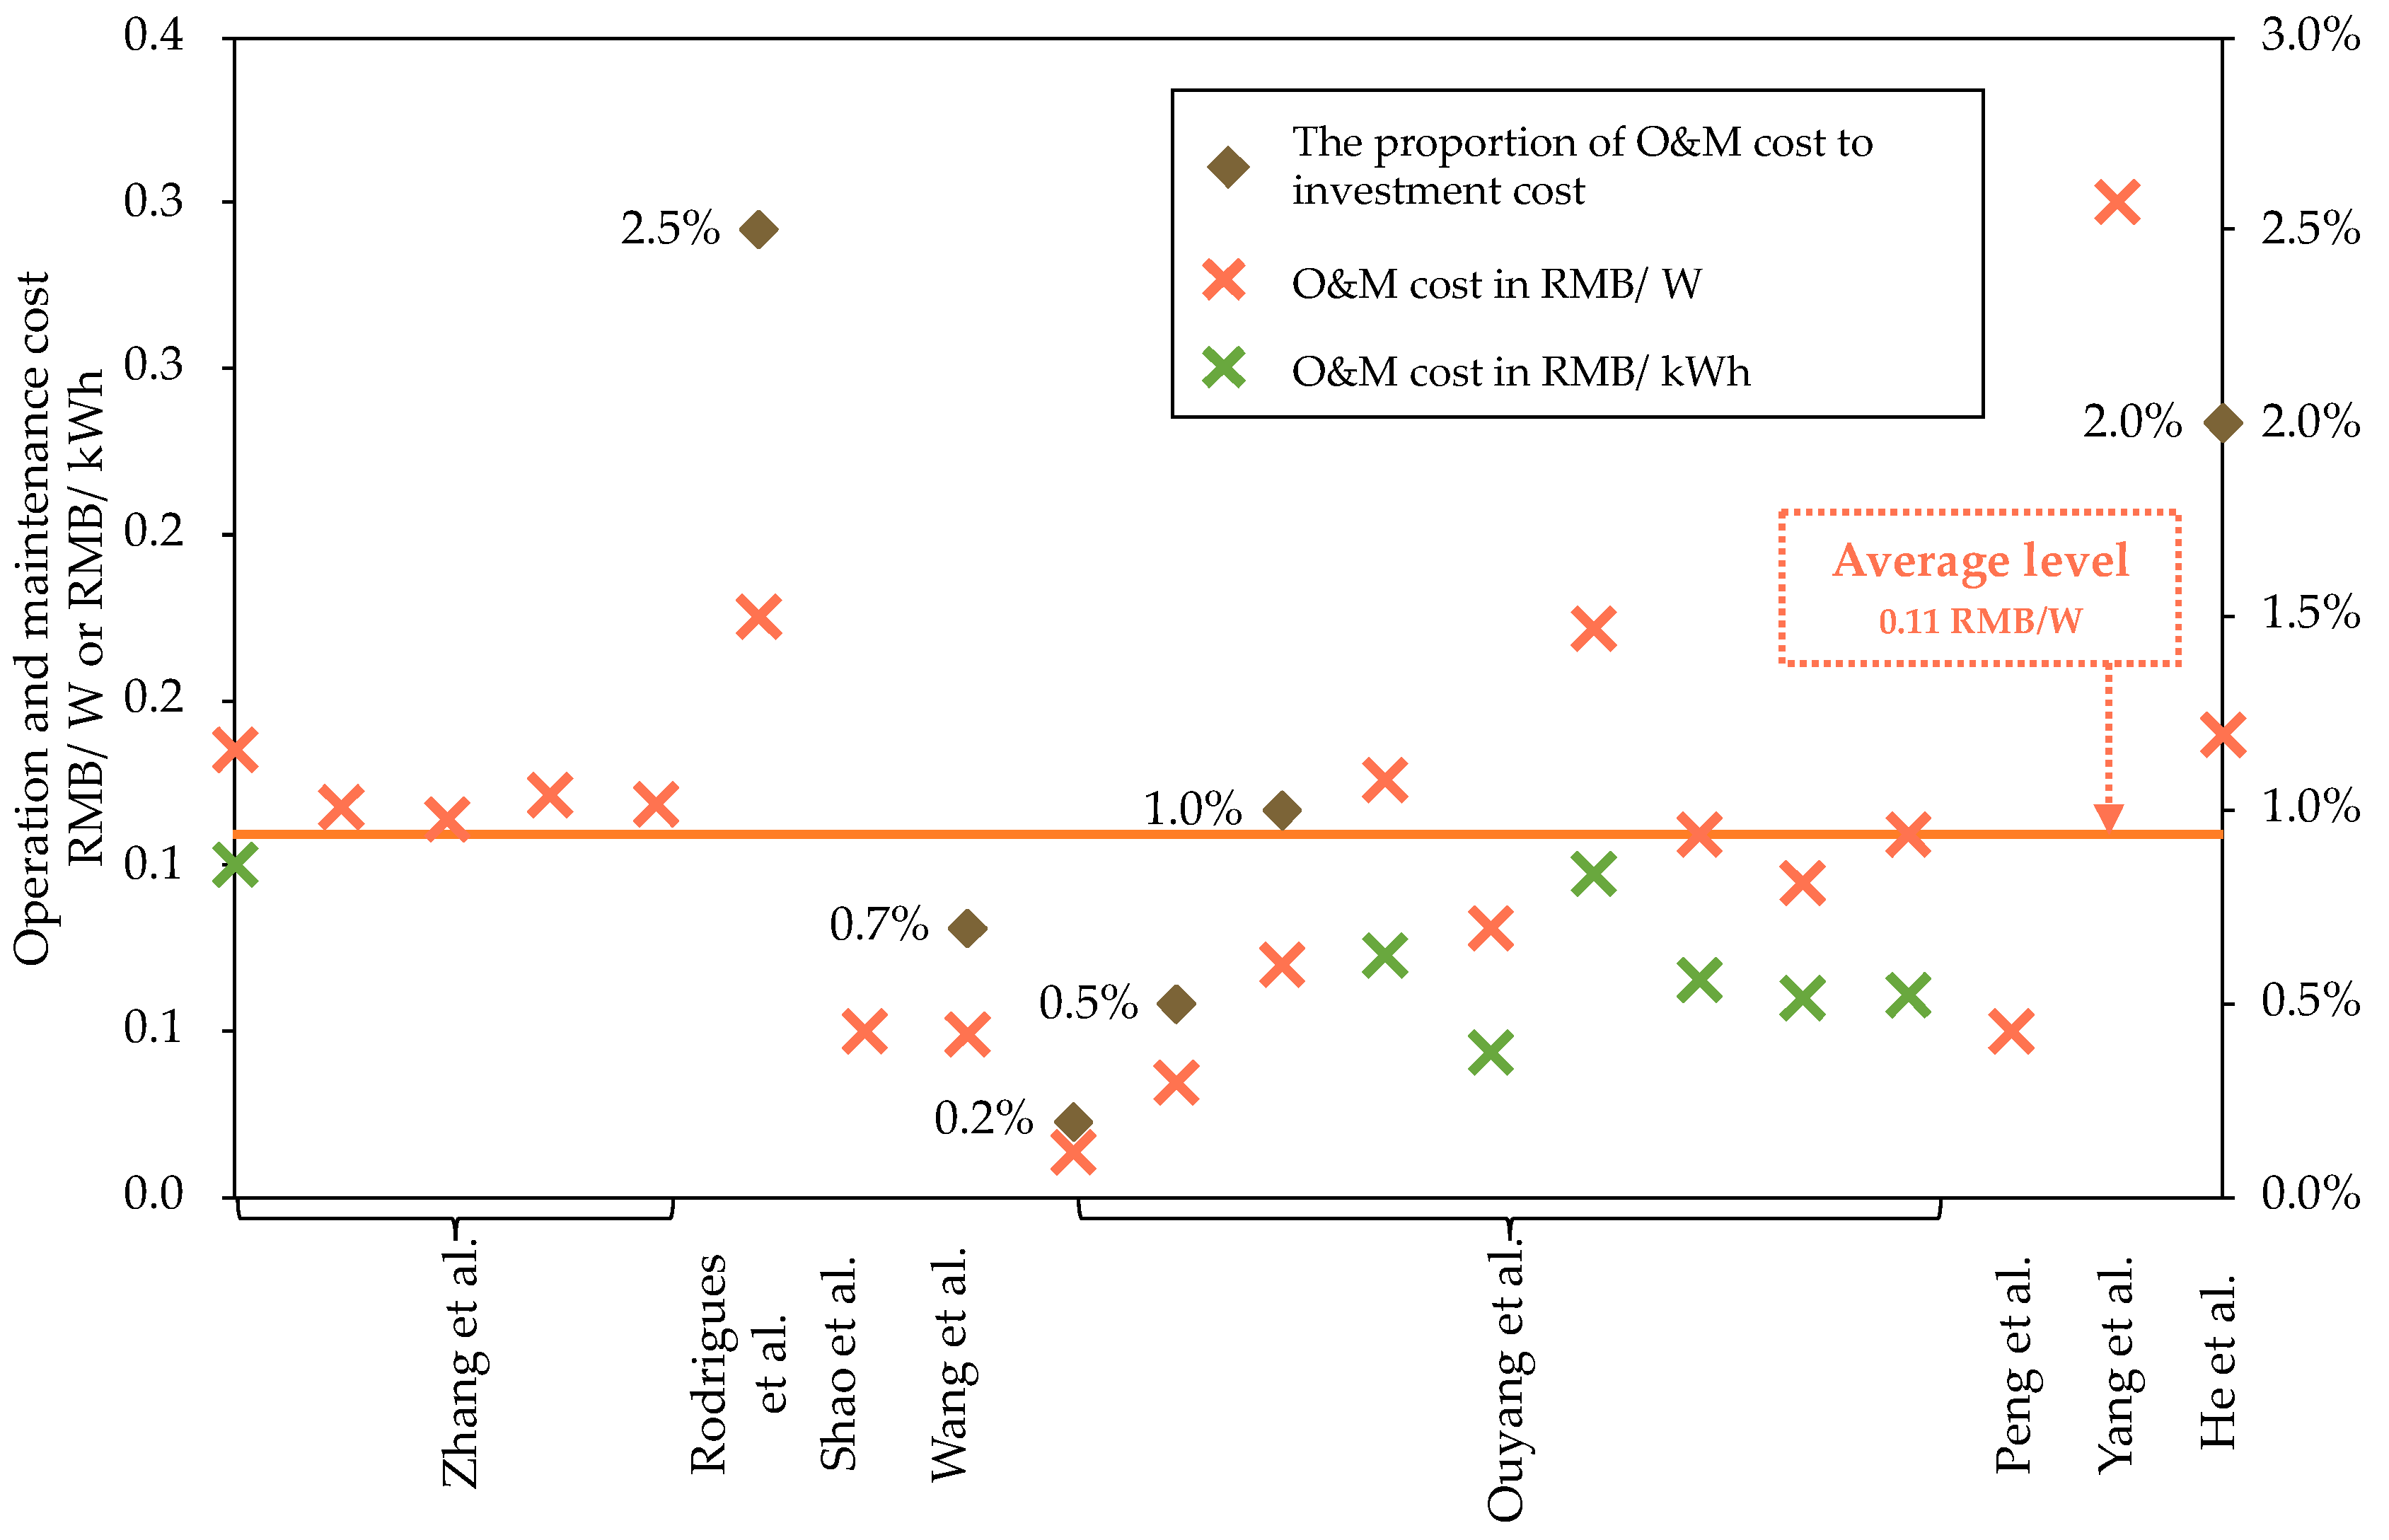
The investment cost of photovoltaic has experienced a significant drop during the past decade, as shown in Figure 8, with the increase in cumulative capacity and research investment [47]. However, various studies show different results. As for 2010, the data changes from 12.0 to 35.7 RMB/W in China. Reviewing different results, the red rhombuses show the forecast in this study from 2016 to 2020. The O&M cost was mainly calculated by three methods: certain cost per capacity, certain cost per power generation, or certain proportion of investment cost. Compared to the investment cost, the O&M costs are relatively stable. Due to the accessibility of data in China, 0.11 RMB/W is used in this study, as shown in Figure 9 [47,66,67,69,70,71,73,74]. The insurance fee is not a common cost mentioned in previous studies; thus, it is not included in this study. As mentioned before, the lifetime of an inverter is 10 years, so updates should be made twice during its life. The prices of inverters vary from 0.5 to 2.8 RMB/W in different research. Considering the cost reduction caused by technological advances, 0.75 RMB/W is used in this study. Loan proportion in initial investment and the interest of loan are other important parts in photovoltaic construction. Based on the research of Yuan et al., 20% is a reasonable proportion. Other basic assumptions used in this article are listed in Table 2. Cost of roof rent is not included in this study. We assume that the property right of the roof and the power user are unified. The price of electricity for industrial use in China is relatively stable, so we assume it keeps constant. The average of peak- and low-hour electricity price is used in this study.
Considering the natural conditions and local fiscal policies, Beijing, Shanghai, Wuhan and Guangzhou are the four cities chosen for case study in this paper.
As mentioned in the previous part, financial support plays a very important role in renewable power generation. However, with technical progress and government financial pressure, the new-built power generation infrastructure could hardly obtain central government subsidy any more. Thus, in the assumption part, a national subsidy for distributed photovoltaic systems is included only for 2016 to 2018. Since 2019, there has been no financial support from central government. Local governments have various subsidy policies. In Beijing, from the beginning of 2015 to the end of 2019, a 5-year bonus will be provided to power generation enterprises or individuals, with 0.3 RMB per kWh [76]. In Shanghai, different projects enjoy different subsidies. An amount of 0.25 RMB per kWh will be given to the enterprises with distributed photovoltaic power plant and the subsidy will last five years [77]. In Guangzhou, in addition to a power generation subsidy of 0.15 RMB/kWh for at most 6 years, there are also installed subsidies. The subsidy standard is 0.2 RMB/W. The maximum subsidy amount for a single project is RMB 2 million. The subsidy time range is from 2016 to 2021 [78]. In Hubei, the subsidy is set as 0.25 RMB per kWh for 5 years, but only for projects began before 2015 [79].
5.2. Analysis Results
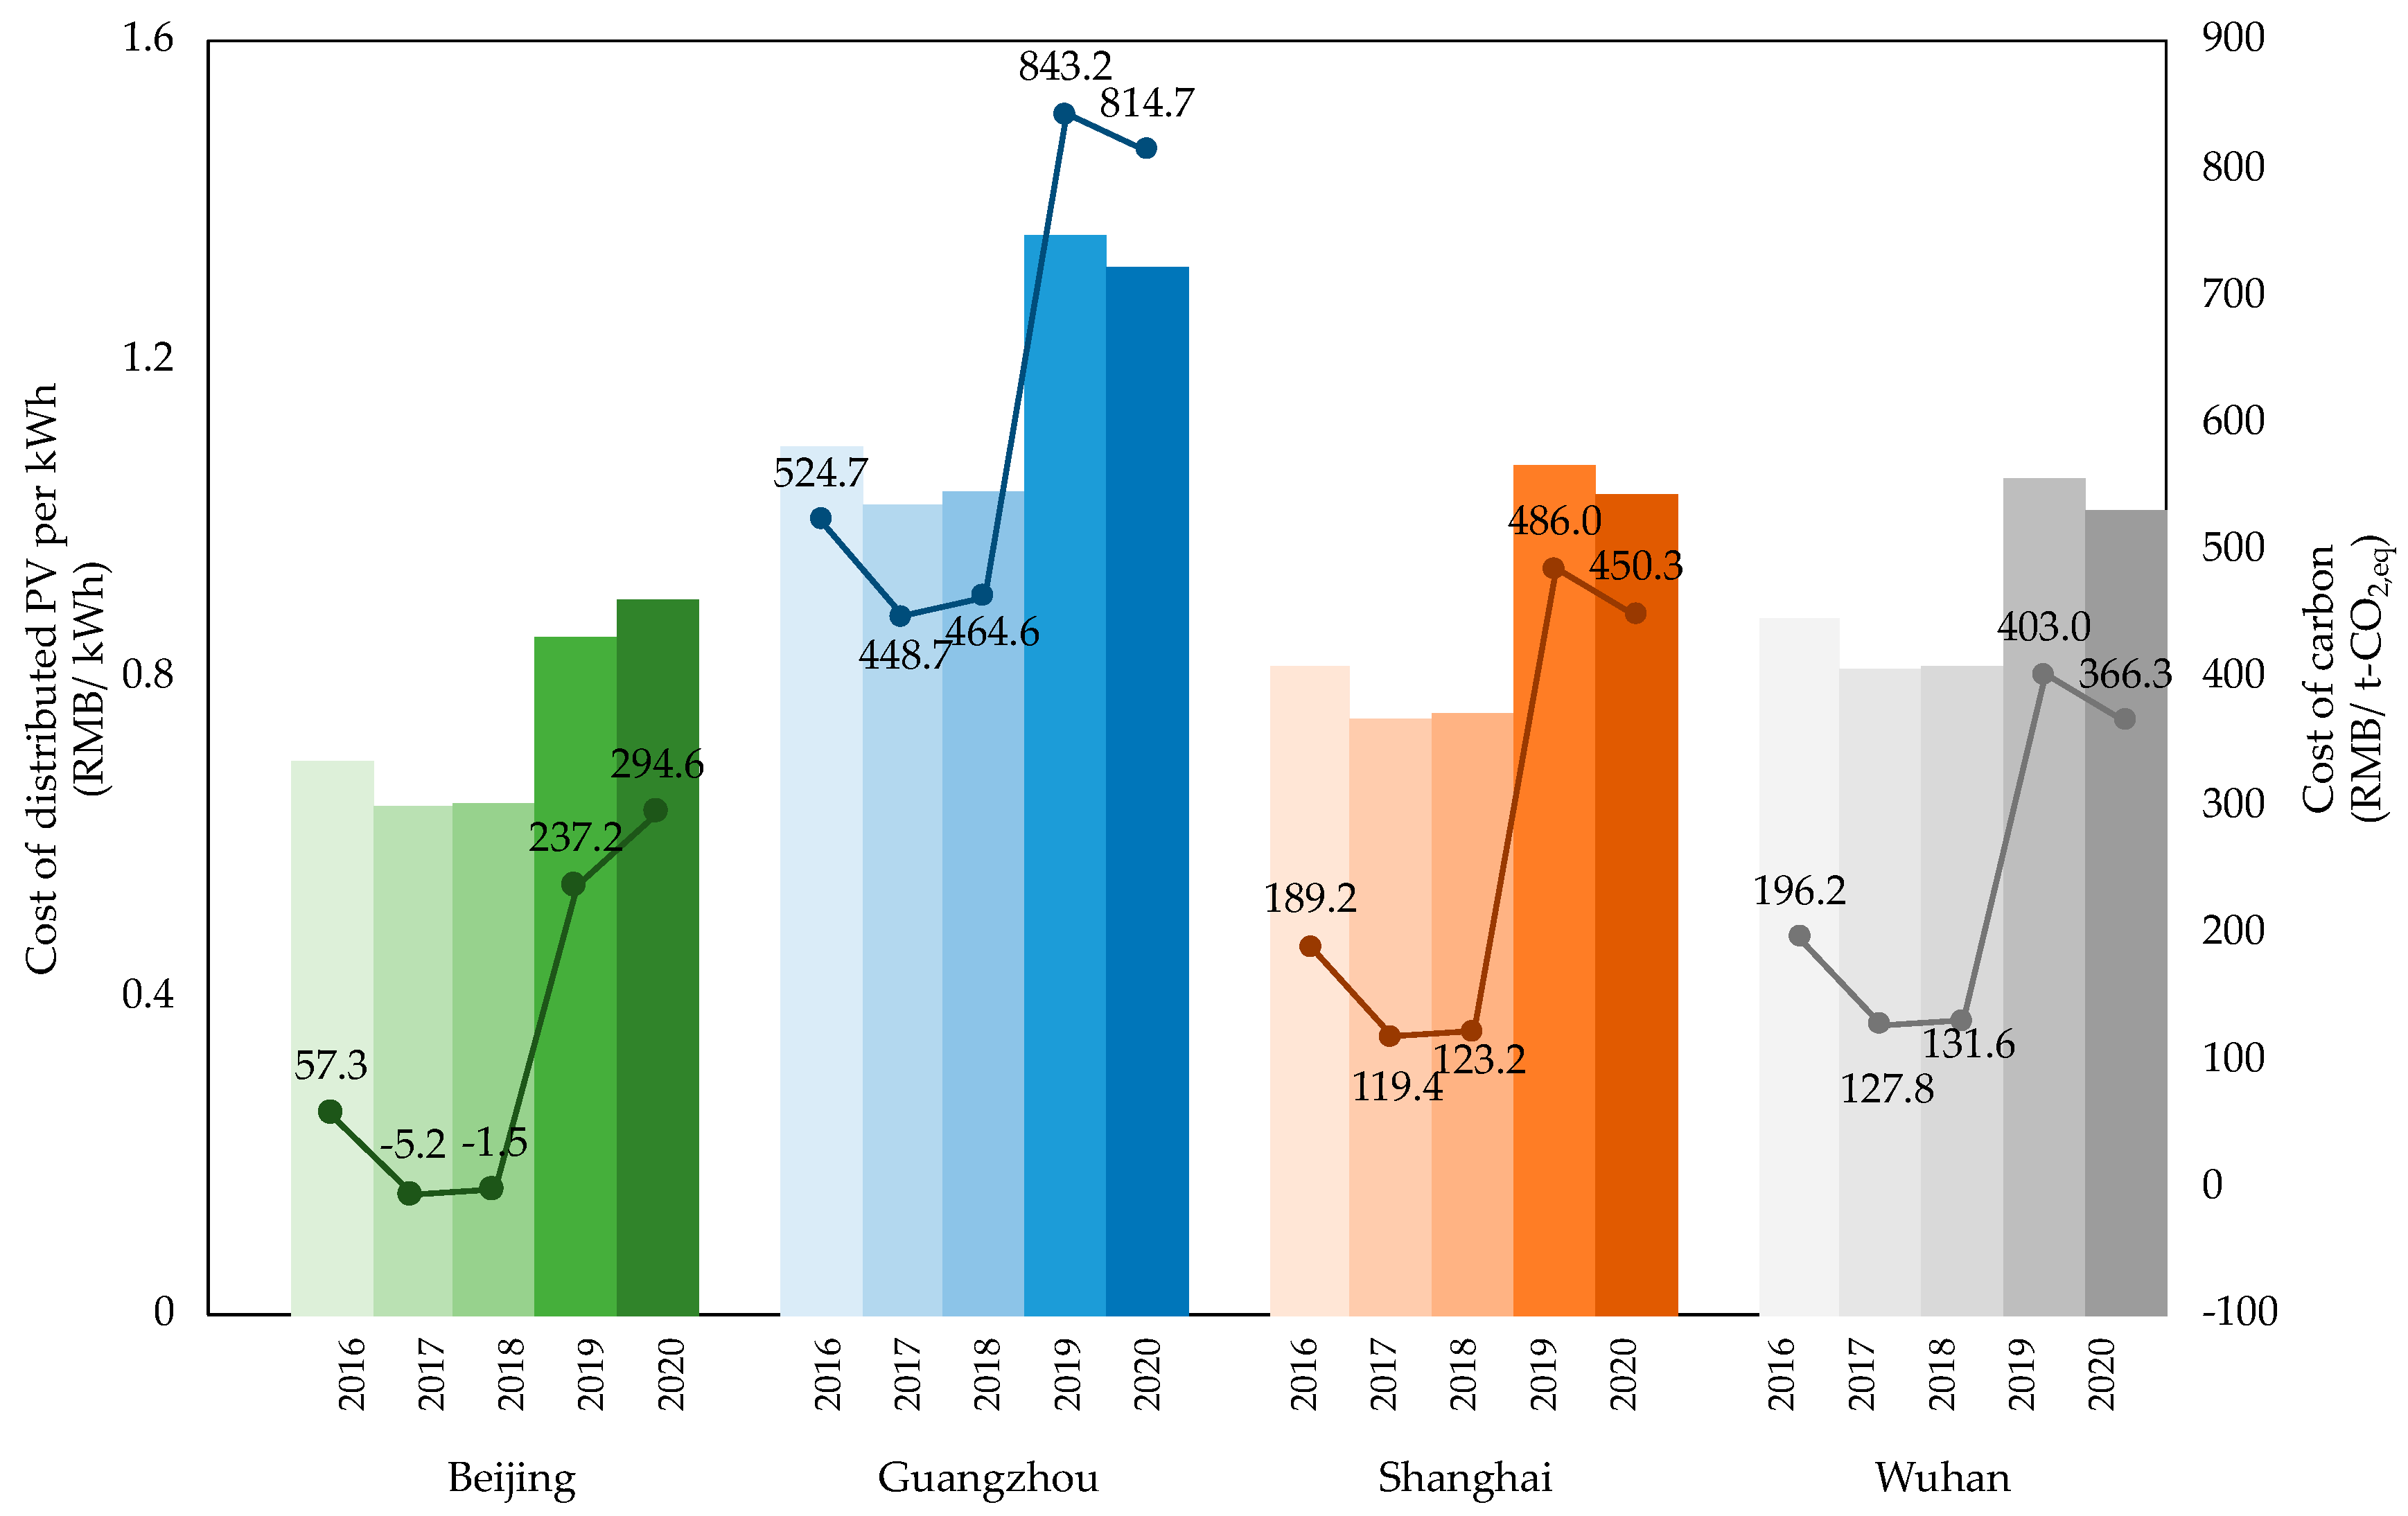
Figure 10 shows the results of levelized cost of electricity (LCOE) generated from distributed photovoltaic in these four cities in China. The great differences among cities are mainly caused by various subsidy policies and natural conditions. Beijing is the city among these four with lowest result. The cost in 2016 is 0.698 RMB/kWh. In 2017 and 2018, it is even more profitable for power users to construct distributed photovoltaic systems, instead of purchase electricity from power grid companies, no matter how much the carbon price is. Because the local government in Beijing only mentioned the subsidy policy would continue to 2019, this study applies no local subsidy in 2020 for the Beijing case. With diminishing national and local subsidy, the LCOE of distributed photovoltaic technology in Beijing will gradually increase to 0.898 RMB/kWh in 2020, though with a decline in initial cost. By contrast, Guangzhou is the worst case. In Guangzhou, the later a project is built, the shorter the period it could get local subsidy. For example, if the project is constructed in 2016, it could get 6 years’ support and if it is constructed in 2020, there is only one year left for local subsidy. The best case of LCOE in Guangzhou is still up at 1.018 RMB/kWh and in 2019, the cost can even reach 1.357 RMB/kWh, much higher than that in other cities. Thus, the cost of carbon-saving is not cost-effective for energy users. Shanghai and Wuhan exhibit similar results. There is no subsidy for distributed photovoltaic projects any more in Wuhan compared with Shanghai, but the lighting condition is better in Wuhan. When projects in Shanghai enjoy monetary support, they have advantages in terms of cost. However, when these two cities are on the same starting line, totally without subsidies, good lighting conditions make the cost of distributed photovoltaic power generation in Wuhan lower than that in Shanghai.
Compared with local electricity price and carbon intensity, the carbon prices for distributed photovoltaic systems in these four cities are obtained and also shown in Figure 10. The trend of the results is very similar to that of the LCOE. Only when the carbon price in the market is higher than the result can the owners benefit from it. Guangzhou is a city with the poorest sunshine conditions among these four cities. Even with local subsidy, it still shows a relatively high cost for carbon saved by power generated from distributed photovoltaic technology. Though with the diminishing of subsidies, the costs surge suddenly. While, in Guangzhou and Shanghai, the cost of using power generated by enterprise itself by distributed photovoltaic projects is still relatively high when compared with actual carbon price (~20 RMB/t in Guangzhou and ~40 RMB/t in Shanghai). Thus, there is no need for enterprises to build or invest in green power generation as for now. However, with the introduction of Guarantee Mechanism of Renewable Energy Power Consumption, the power users are facing new challenges and evaluations. They will be asked to introduce renewable power compulsively. The use of renewable energy will be directly considered as an evaluation index instead of using carbon emissions.
Analyzing the results of LCOE and cost for carbon saving raises some important discussions. First, subsidy plays a very important role in the cost of photovoltaic technology. The year 2018 is the watershed for national subsidy. Without national subsidy, the costs of photovoltaics surge significantly. Though local subsidy might continue, it would only be given for 5 years or even shorter, not long enough for cost compensation. Second, though the impacts caused by local subsidy are not distinct, the disappeared local subsidy will also lift the LCOE. The results of Beijing in 2019 and 2020 are the typical cases. The integration of dropping initial cost and local subsidy leads to a higher LCOE. Then, the decrease in investment cost will cause lower LCOE but cannot compensate for the diminishing subsidy. Without subsidies, the advantages of cities with better sunshine are gradually highlighted. With local subsidy, the LCOE in Shanghai is lower. However, when subsidies are gone, Wuhan shows better results. Last but not least, we find that when there is no subsidy, the cost of reducing carbon emissions by introducing distributed photovoltaic power generation is far lower than the current carbon price (no more than 100 RMB/t).
6. Conclusions
In this part, we summarize the development trend of China’s low-carbon policies in the future and the factors that energy users need to consider as participants in the future. According to China’s carbon emission regulations, the government in China shows great determination in carbon emission reduction. Pilot projects and consultation papers provide ample time for energy users to prepare and make plans. The compulsory control and market means will be combined to achieve the goal of peaking carbon emissions as soon as possible. The proportion of renewable energy consumption in total will become an important assessment target for energy users. As for market, the carbon price in different pilots varies a lot from around 15 RMB to 100 RMB, so the market mechanism needs to be further optimized. The national carbon trading system is set up. Electricity industry has already been included. It is expected that more industries will be included in this assessment, and the follow-up of China’s carbon trading market will continue to accelerate. Finally, due to the financial pressure, it is the general trend for central and local government to reduce subsidies for renewable energy power generation. At the same time, in order to ensure that the energy structure improvement process will not be affected, the mechanism for companies to bear carbon emission reduction costs will be increasingly strengthened, which means users will pay for their own green development. As the most crucial part, power generation companies will take the lead in facing reform. Low carbon intensity of electricity will relieve the stress of energy users.
As for the energy users or carbon emitters, they still will face stricter supervision. Enterprises should have a comprehensive analysis to deal with the requirement of carbon emission reduction.
- Cost is an essential factor. The costs of introducing distributed photovoltaic power generation vary a lot due to the natural conditions. Guangzhou in this case shows an unoptimistic result with poor sunshine. The cost of renewable energy will still be high, especially with diminishing national and local subsidies. The energy users will pay for the cost gap between coal-fired electricity and renewable energy electricity, instead of the government.
- The carbon price in pilots is relatively low and cannot reflect the actual value. It is still more cost-efficient for energy users to buy carbon credits or pay the penalty instead of introducing renewable energy by themselves. Although the current carbon price is low, buying carbon allowances is not a long-term solution. With diminishing subsidization, the users will gradually be responsible for the cost. In the future, with a stricter cap, participants in carbon trading markets may become competitive and the price will reflect the actual value. Therefore, the emitters may face higher purchasing cost to reach the standard. Carbon emission reduction costs will become an important part of enterprise expenditure. Enterprises should prepare in advance about how to cut carbon emissions in the long term and try to find partners.
- The assessment results will be closely related to corporate credit and image. The energy consumers should also think highly of their social responsibility. Enterprises with a lower proportion of renewable energy consumption to total will be included in a poor credit record in the future. Therefore, the carbon reduction is not only related to cost.
- In the long term, even future plant site selection will be related to the distribution of renewable energy. As mentioned in the results part, the natural condition plays a crucial role in the cost. The distribution of renewable energy resources may affect the geographical distribution of enterprises in the future. Regions with plenty of sunshine or wind will have more advantages. The carbon intensity of electricity in these regions will be lower. Therefore, energy consumers have less pressure on renewable energy imports or carbon emissions. Even if the energy consumers cannot meet the requirement, they can introduce more cost-efficient renewable energy into factories to reduce carbon emissions.
Author Contributions
Conceptualization Z.L.; methodology, F.L.; Formal analysis, F.L.; resources, F.L.; data curation, F.L.; writing—original draft preparation, F.L.; writing—review and editing, F.L.; visualization F.L.; supervision, F.Z., H.H., Z.L.; project administration, F.Z., H.H., Z.L.; funding acquisition, F.Z., Z.L. All authors have read and agreed to the published version of the manuscript.
Funding
This research was funded by the National Natural Science Foundation of China (71403142, 71774100, 71690241, U176420042).
Conflicts of Interest
The authors declare no conflict of interest.
References
- President. Adoption of the Paris Agreement FCCC/CP/2015/L.9/Rev.1 (UNFCCC, 2015). Available online: https://undocs.org/FCCC/CP/2015/L.9/Rev.1 (accessed on 1 June 2020).
- International Energy Agency. World Energy Outlook. 2018. Available online: https://webstore.iea.org/download/summary/190?fileName=English-WEO-2018-ES.pdf (accessed on 1 June 2020).
- International Energy Agency. Global Energy & CO2 Status Report: The Latest Trends in Energy and Emissions in 2018. Available online: https://www.iea.org/geco/emissions/ (accessed on 1 June 2020).
- Earth System Research Laboratory. CO2 at NOAA’s Mauna Loa Observatory Reaches New Milestone: TOPS 400 ppm. Available online: https://www.esrl.noaa.gov/gmd/news/7074.html (accessed on 1 June 2020).
- National Bureau of Statistic. Statistical Bulletin of National Economic and Social Development in 2018. Available online: http://www.stats.gov.cn/tjsj/zxfb/201902/t20190228_1651265.html (accessed on 1 June 2020).
- Jackson, R.; Canadell, J.; Quéré, C.; Andrew, R.; Korsbakken, J.; Peters, G.; Nakicenovic, N. Reaching peak emissions. Nat. Clim. Chang. 2015, 6, 7–10. [Google Scholar] [CrossRef] [Green Version]
- European Commission. Available online: https://ec.europa.eu/eurostat/web/climate-change/data/database (accessed on 1 June 2020).
- European Commission. EU Emissions Trading System (EU ETS). Available online: https://ec.europa.eu/clima/policies/ets_en (accessed on 1 June 2020).
- Martin, R.; Muuls, M.; Wagner, U. The impact of the EU ETS on regulated firms: What is the evidence after ten years? Rev. Environ. Econ. Policy 2016, 10, 129–148. [Google Scholar] [CrossRef] [Green Version]
- Oestreich, A.M.; Tsiakas, I. Carbon Emissions and Stock Returns: Evidence from the EU Emissions Trading Scheme. J. Bank. Financ. 2015, 58, 294–308. [Google Scholar] [CrossRef]
- European Commission. EU Emissions Trading System (EU ETS). Available online: https://ec.europa.eu/clima/policies/strategies/progress_en (accessed on 1 June 2020).
- Eurostat. Primary Production of Energy from Renewable Sources, EU-28, 1990–2017. Available online: http://appsso.eurostat.ec.europa.eu/nui/show.do?dataset=nrg_bal_c&lang=en (accessed on 1 June 2020).
- U.S. Energy Information Administration. Annual Energy Review. Available online: https://www.eia.gov/totalenergy/data/annual/ (accessed on 1 June 2020).
- U.S. Energy Information Administration. Annual Energy Outlook. 2019. Available online: https://www.eia.gov/outlooks/aeo/pdf/aeo2019.pdf (accessed on 1 June 2020).
- California Energy Commission. California Electricity Data. Available online: https://www.energy.ca.gov/data-reports/california-power-generation-and-power-sources (accessed on 1 June 2020).
- Tollefson. Trump says no to climate pact. Nature 2017, 8, 198. [Google Scholar]
- Weng, Q.; Xu, H. A review of China’s carbon trading market. Renew. Sustain. Energy Rev. 2018, 91, 613–619. [Google Scholar] [CrossRef]
- Lo, A. Carbon emissions trading in China. Nat. Clim. Chang. 2012, 2, 765–766. [Google Scholar] [CrossRef] [Green Version]
- Liu, L.; Chen, C.; Zhao, Y.; Zhao, E. China’s carbon-emissions trading: Overview, challenges and future. Renew. Sustain. Energy Rev. 2015, 49, 254–266. [Google Scholar] [CrossRef]
- Zhang, D.; Karplus, V.; Cassisa, C.; Zhang, X. Emissions trading in China: Progress and prospects. Energy Policy 2014, 75, 9–16. [Google Scholar] [CrossRef]
- Zhao, X.; Jiang, C.; Nie, D.; Chen, H. How to improve the market efficiency of carbon trading: A perspective of China. Renew. Sustain. Energy Rev. 2016, 59, 1229–1245. [Google Scholar] [CrossRef]
- Zhao, X.; Wu, L.; Li, A. Research on the efficiency of carbon trading market in China. Renew. Sustain. Energy Rev. 2017, 79, 1–8. [Google Scholar] [CrossRef]
- Shen, J.; Luo, C. Overall review of renewable energy subsidy policies in China – contradictions of intentions and effects. Renew. Sustain. Energy Rev. 2015, 41, 1478–1488. [Google Scholar] [CrossRef]
- Zeng, M.; Liu, X.; Li, N.; Xue, S. Overall review of renewable energy tariff policy in China: Evolution, implementation, problems and countermeasures. Renew. Sustain. Energy Rev. 2013, 25, 260–271. [Google Scholar]
- Lo, K. A critical review of China’s rapidly developing renewable energy end energy efficiency policies. Renew. Sustain. Energy Rev. 2014, 29, 508–516. [Google Scholar] [CrossRef]
- Liu, J. China’s renewable energy law and policy: A critical review. Renew. Sustain. Energy Rev. 2019, 99, 212–219. [Google Scholar] [CrossRef]
- Wang, F.; Yin, H.; Li, S. China’s renewable energy policy: Commitments and challenges. Energy Policy 2010, 38, 1872–1878. [Google Scholar] [CrossRef]
- Zhang, M.; Zhou, D.; Zhou, P.; Chen, H. Optimal design of subsidy to stimulate renewable energy investments: The case of China. Renew. Sustain. Energy Rev. 2017, 71, 873–883. [Google Scholar] [CrossRef]
- Lin, B.; Li, J. Analyzing cost of grid-connection of renewable energy development in China. Renew. Sustain. Energy Rev. 2015, 50, 1373–1382. [Google Scholar] [CrossRef]
- Zhao, Z.; Chen, Y.; Thomson, J. Levelized cost of energy modeling for concentrated solar power projects: A China study. Energy 2017, 120, 117–127. [Google Scholar] [CrossRef]
- Yuan, J.; Sun, S.; Zhang, W.; Xiong, M. The economy of distributed PV in China. Energy 2014, 78, 939–949. [Google Scholar] [CrossRef]
- European Commission. Emissions Cap and Allowances. Available online: https://ec.europa.eu/clima/policies/ets/cap_en (accessed on 1 June 2020).
- National Development and Reform Commission. Notice on Carbon Emissions Trading Pilot Work. 2011. Available online: http://www.ndrc.gov.cn/zcfb/zcfbtz/201201/t20120113_456506.html (accessed on 1 June 2020).
- China Beijing Environment Exchange. Annual Report of Beijing Carbon Market 2018. Available online: http://www.cbeex.com.cn/article/xxfw/xz/bjtscndhq/201903/20190300062382.shtml (accessed on 1 June 2020).
- Tianjin Municipal People’s Government. Notice of Interim Measures for the Management of Carbon Emission Trading in Tianjin. Available online: http://www.tj.gov.cn/zw/zfgb/qk/2018/11_3412/201811/t20181108_3635676.html (accessed on 1 June 2020).
- Shanghai Municipal Development & Reform Commission. List of Units Including Carbon Emission Trading in Quota Management in Shanghai (2016 Edition). Available online: http://www.shanghai.gov.cn/nw2/nw2314/nw2319/nw12344/u26aw50256.html (accessed on 1 June 2020).
- Chongqing Development and Reform Commission. Detailed Rules for the Management of Carbon Emission Quotas in Chongqing. Available online: http://fzggw.cq.gov.cn/c/2014-05-29/521437.shtml (accessed on 1 June 2020).
- Hubei Provincial Development and Reform Commission. Carbon Emission Quota Allocation Scheme of Hubei Province in 2017. Available online: http://fgw.hubei.gov.cn/ywcs2016/qhc/tztgqhc/gwqhc/201403/t20140327_76425.shtml (accessed on 1 June 2020).
- Guangdong Development and Reform Commission. Implementation Plan of Carbon Emission Quota Allocation in Guangdong Province in 2018. Available online: http://zwgk.gd.gov.cn/006939756/201807/t20180725_774704.html (accessed on 1 June 2020).
- Shenzhen Government. Interim Measures for the Management of Carbon Emission Trading in Shenzhen. Available online: http://www.sz.gov.cn/zfgb/2014/gb876/201404/t20140402_2335498.htm (accessed on 1 June 2020).
- Fujian Development and Reform Commission. Fujian Carbon Emission Quota Allocation Scheme for 2017. Available online: http://fgw.fujian.gov.cn/xxgk/gsgg/201807/t20180730_3595807.htm (accessed on 1 June 2020).
- National Development and Reform Commission, National Energy Administration. Guarantee Mechanism of Renewable Energy Power Consumption. Available online: http://zfxxgk.nea.gov.cn/auto87/201905/t20190515_3662.htm (accessed on 1 June 2020).
- National Energy Administration. Briefing on 2016 National Monitoring and Evaluation of Renewable Energy Power Development. Available online: http://zfxxgk.nea.gov.cn/auto87/201704/t20170418_2773.htm (accessed on 1 June 2020).
- National Energy Administration. Briefing on 2017 National Monitoring and Evaluation of Renewable Energy Power Development. Available online: http://zfxxgk.nea.gov.cn/auto87/201805/t20180522_3179.htm (accessed on 1 June 2020).
- Zhang, S. Analysis of DSPV (distributed solar PV) power policy in China. Energy 2016, 98, 92–100. [Google Scholar] [CrossRef]
- Yang, C.; Ge, Z. Dynamic feed-in tariff pricing model of distributed photovoltaic generation in China. Energy Procedia 2018, 152, 27–32. [Google Scholar] [CrossRef]
- He, Y.; Pang, Y.; Li, X.; Zhang, M. Dynamic subsidy model of photovoltaic distributed generation in China. Renew. Energy 2018, 118, 555–564. [Google Scholar] [CrossRef]
- China Electricity Council. List of Basic Data of Electricity Statistics 2010–2017. Available online: http://www.cec.org.cn/yaowenkuaidi/2018-06-14/181767.html (accessed on 1 June 2020).
- National Energy Administration. Statistics of China’s electric power industry in 2018. Available online: http://www.nea.gov.cn/2019-01/18/c_137754977.htm (accessed on 1 June 2020).
- National Development and Reform Commission. National Energy Administration. 13th Five-Year Plan for Energy Development. 2016. Available online: http://www.gov.cn/xinwen/2017-01/17/5160588/files/595b9ac5f61d46c4828b99404578eba5.pdf (accessed on 1 June 2020).
- China Energy Research Society. China Energy Outlook 2030; Economy & Management Publishing House: Beijing, China, 2016; pp. 210–211. [Google Scholar]
- Xia, D.; Ren, Y.; Shi, L. Measurement of life-cycle carbon equivalent emissions of coal-energy chain. Stat. Res. 2010, 27, 82–89. [Google Scholar]
- Zhou, G.; Ou, X.; Zhang, X. Development of electric vehicles use in China: A study from the perspective of life-cycle energy consumption and greenhouse gas emissions. Energy Policy 2013, 59, 875–884. [Google Scholar] [CrossRef]
- Cai, W.; Wang, C.; Wang, K.; Zhang, Y.; Chen, J. Scenario analysis on CO2 emissions reduction potential in China’s electricity sector. Energy Policy 2007, 35, 6445–6456. [Google Scholar] [CrossRef]
- Li, X.; Chalvatzis, K.J.; Pappas, D. China’s electricity emission intensity in 2020—An analysis at provincial level. Energy Procedia 2017, 142, 2779–2785. [Google Scholar] [CrossRef]
- Feng, K.; Hubacek, K.; Siu, Y.; Li, X. The energy and water nexus in Chinese electricity production: A hybrid life cycle analysis. Renew. Sustain. Energy Rev. 2014, 39, 342–355. [Google Scholar] [CrossRef] [Green Version]
- Li, X.; Feng, K.; Siu, Y.; Hubacek, K. Energy-water nexus of wind power in China: The balancing act between CO2 emissions and water consumption. Energy Policy 2012, 45, 440–448. [Google Scholar] [CrossRef]
- Wang, Y.; Sun, T. Life cycle assessment of CO2 emissions from wind power plants: Methodology and case studies. Renew. Energy 2012, 43, 30–36. [Google Scholar] [CrossRef]
- Aden, N.; Marty, A.; Muller, M. Comparative Life-Cycle Assessment of Non-Fossil Electricity Generation Technologies: China 2030 Scenario Analysis; CE 268E Civil Systems and the Environment: Berkeley, CA, USA, 2010. [Google Scholar]
- Gu, B.; Tan, X.; Zeng, Y.; Mu, Z. CO2 emission reduction potential in China’s electricity sector: Scenario analysis based on LDMI Decomposition. Energy Procedia 2015, 75, 2436–2447. [Google Scholar] [CrossRef] [Green Version]
- Ou, X.; Yan, X.; Zhang, X. Life-cycle energy consumption and greenhouse gas emissions for electricity generation and supply in China. Appl. Energy 2011, 88, 289–297. [Google Scholar] [CrossRef]
- Hao, H.; Cheng, X.; Liu, Z.; Zhao, F. Electric vehicles for greenhouse gas reduction in China: A cost-effectiveness analysis. Transp. Res. Part D Transp. Environ. 2017, 56, 68–84. [Google Scholar] [CrossRef]
- Branker, K.; Pathak, M.; Pearce, J. A review of solar photovoltaic levelized cost of electricity. Renew. Sustain. Energy Rev. 2011, 15, 4470–4482. [Google Scholar] [CrossRef] [Green Version]
- Zou, H.; Du, H.; Ren, J.; Sovacool, B.; Zhang, Y.; Mao, G. Market dynamics, innovation, and transition in China’s solar photovoltaic (PV) industry: A critical review. Renew. Sustain. Energy Rev. 2017, 69, 197–206. [Google Scholar] [CrossRef] [Green Version]
- Kayser, Dirk. Solar photovoltaic projects in China: High investment risks and the need for institutional response. Appl. Energy 2016, 174, 144–152. [Google Scholar] [CrossRef]
- Rodrigues, S.; Chen, X.; Morgado-Dias, F. Economic analysis of photovoltaic systems for the residential market under China’s new regulation. Energy Policy 2017, 101, 467–472. [Google Scholar] [CrossRef]
- Ouyang, X.; Lin, B. Levelized cost of electricity (LCOE) of renewable energies and required subsidies in China. Energy Policy 2014, 70, 64–73. [Google Scholar] [CrossRef]
- Lai, C.; McCulloch, M. Levelized cost of electricity for solar photovoltaic and electrical energy storage. Appl. Energy 2017, 190, 191–203. [Google Scholar] [CrossRef]
- Wang, Y.; Zhou, S.; Huo, H. Cost and CO2 reductions of solar photovoltaic power generation in China: Perspectives for 2020. Renew. Sustain. Energy Rev. 2014, 39, 370–380. [Google Scholar] [CrossRef]
- Zhang, F.; Deng, H.; Margolis, R.; Su, J. Analysis of distributed-generation photovoltaic deployment, installation time and cost, market barriers, and policies in China. Energy Policy 2015, 81, 43–55. [Google Scholar] [CrossRef] [Green Version]
- Hanqiao, S.; Ji, Z.; Wei, Z. Economy and policy analysis of distributed photovoltaic generation. Electr. Power Constr. 2014, 35, 51–57. [Google Scholar]
- Rigter, J.; Vidican, G. Cost and optimal feed-in tariff for small scale photovoltaic systems in China. Energy Policy 2010, 38, 6989–7000. [Google Scholar] [CrossRef]
- Peng, P.; Shao, L.; Yu, G.; Lou, X.; Shao, Y.; Sun, J. Economic comparison of distributed grid-connected photovoltaic generation with different business models. In Proceedings of the 2016 IEEE International Conference on Power and Renewable Energy (ICPRE), Shanghai, China, 21–23 October 2016; pp. 585–588. [Google Scholar]
- Yang, C.; Yao, R.; Zhou, K. Forecasting of electricity price subsidy based on installed cost of distributed photovoltaic in China. Energy Procedia 2019, 158, 3393–3398. [Google Scholar] [CrossRef]
- National Energy Administration. Available online: http://www.nea.gov.cn/2018-04/13/c_137108373.htm (accessed on 1 June 2020).
- Beijing Municipal Bureau of Finance. Beijing Municipal Commission of Development and Reform. Beijing Distributed Photovoltaic Power Incentive Fund Management Measures. Available online: http://www.beijing.gov.cn/zfxxgk/110011/2015nywdt52/2015-08/26/content_610997.shtml (accessed on 1 June 2020).
- Shanghai Municipal Development & Reform Commission. Shanghai Municipal Finance Bureau. Supporting Measures for Special Funds for Renewable Energy and New Energy Development in Shanghai. Available online: http://www.shanghai.gov.cn/nw2/nw2314/nw2319/nw12344/u26aw15966.html (accessed on 1 June 2020).
- Guangzhou Municipal Development and Reform Commission. Detailed Rules for the Management and Implementation of Solar Photovoltaic Power Generation Projects with Subsidized Funds for the Development of Emerging Industries in Guangzhou. Available online: http://www.gzplan.gov.cn/gzplan/s15710/201706/4579cd1b33cd4fc8aa786f880e73a9ff.shtml (accessed on 1 June 2020).
- Hubei Price Bureau; Hubei Energy Bureau. Circular of Hubei Provincial Price Bureau and Provincial Energy Bureau on Subsidies to Electricity Price for New Energy Power Generation Projects. Available online: http://fgw.hubei.gov.cn/ywcs2016/xnyhkzsnyc/tzgg_1774/gw_1775/201506/t20150623_87300.shtml (accessed on 1 June 2020).
Figure 1.
Renewable energy quota system.

Figure 2.
The development of renewable energy power generation. (a). Proportion of renewable energy power consumption: actual situation in 2016/2017/2018 and target for 2019/2020. (b). Proportion of renewable energy power consumption: actual situation in 2016/2017/2018 and target for 2019/2020.
Figure 2.
The development of renewable energy power generation. (a). Proportion of renewable energy power consumption: actual situation in 2016/2017/2018 and target for 2019/2020. (b). Proportion of renewable energy power consumption: actual situation in 2016/2017/2018 and target for 2019/2020.

Figure 3.
Tariff for photovoltaic or wind power plants.

Figure 4.
Accumulated installed capacity of different energy types in China’s electric power industry.
Figure 4.
Accumulated installed capacity of different energy types in China’s electric power industry.

Figure 5.
Historical accounting and future forecast of power grid carbon intensity.

Figure 6.
Factors which should be considered by the enterprises.

Figure 7.
The ways to introduce clean electricity.


Figure 9.
Operation and maintenance (O&M) cost of photovoltaic assumption [47,66,67,69,70,71,73,74].

Figure 10.
The levelized cost of electricity (LCOE) of distributed photovoltaic in cities in China (unit: RMB/kWh).
Figure 10.
The levelized cost of electricity (LCOE) of distributed photovoltaic in cities in China (unit: RMB/kWh).


Table 1.
The development of carbon trading system in China.
| City/Province (Time) | Covered Sectors |
|---|---|
| Kickoff (2011.10) | National Development and Reform Commission Notice on Carbon Emissions Trading Pilot Work |
| Shenzhen (2013.06) |
|
| Shanghai (2013.11) | 2013–2015 |
| |
| 2013–2015 | |
| |
| Beijing (2013.11) | 2013–2015 |
| |
| 2016–2018 | |
| |
| Tianjin (2013.12) |
|
| Guangdong (2013.12) | 2013–2015 |
| |
| 2016 | |
| |
| 2017–2018 | |
| |
| Hubei (2014.04) | 2013–2015 |
| |
| 2016 | |
| |
| 2017 | |
| |
| Fujian (2014.04) |
|
| Chongqing (2014.06) |
|
| Kickoff (2017.12) | National Development and Reform Commission National Carbon Emission Trading Market Construction Plan (Power Industry) |
| Parameter | Unit | Value | |
|---|---|---|---|
| Lifetime of system | year | 25 | |
| System degradation | per year | 0.5% | |
| O&M cost | RMB/W | 0.75 | |
| Lifetime of inverter | year | 10 | |
| Inverter | RMB/W | 0.75 | |
| Loan proportion | - | 20% | |
| Loan interest | - | 7% | |
| Loan years | year | 5 | |
| Discount rate | Per year | 6.5% | |
 Annual electricity production | Beijing * | kWh/kW/year | 1349 |
| Guangzhou * | kWh/kW/year | 902 | |
| Wuhan * | kWh/kW/year | 1198 | |
| Shanghai * | kWh/kW/year | 1176 | |
| Electricity price (from power grid) | Beijing | RMB/kWh | 0.646 |
| Guangzhou | RMB/kWh | 0.620 | |
| Wuhan | RMB/kWh | 0.645 | |
| Shanghai | RMB/kWh | 0.698 | |
* National Renewable Energy Laboratory (NREL):
| |||
* exhibits the data source and basic assumptions for “annual electricity production” in four specific areas.
© 2020 by the authors. Licensee MDPI, Basel, Switzerland. This article is an open access article distributed under the terms and conditions of the Creative Commons Attribution (CC BY) license (http://creativecommons.org/licenses/by/4.0/).
Share and Cite
MDPI and ACS Style
Zhao, F.; Liu, F.; Hao, H.; Liu, Z. Carbon Emission Reduction Strategy for Energy Users in China. Sustainability 2020, 12, 6498. https://0-doi-org.brum.beds.ac.uk/10.3390/su12166498
AMA Style
Zhao F, Liu F, Hao H, Liu Z. Carbon Emission Reduction Strategy for Energy Users in China. Sustainability. 2020; 12(16):6498. https://0-doi-org.brum.beds.ac.uk/10.3390/su12166498
Chicago/Turabian StyleZhao, Fuquan, Feiqi Liu, Han Hao, and Zongwei Liu. 2020. "Carbon Emission Reduction Strategy for Energy Users in China" Sustainability 12, no. 16: 6498. https://0-doi-org.brum.beds.ac.uk/10.3390/su12166498
Note that from the first issue of 2016, this journal uses article numbers instead of page numbers. See further details here.