A System Dynamics Model of Employees’ Performance


Manufacturing Department, Cranfield University, Bedford MK43 0AL, UK
*
Author to whom correspondence should be addressed.
Sustainability 2020, 12(16), 6511; https://0-doi-org.brum.beds.ac.uk/10.3390/su12166511
Submission received: 15 May 2020
/
Revised: 25 July 2020
/
Accepted: 7 August 2020
/
Published: 12 August 2020
(This article belongs to the Special Issue Sustainability in People Management)
Abstract
:Employee performance is dynamic and can have great impact on the overall performance of any company and its sustainability. A number of factors that can be controlled by the company can affect the employees’ performance. The present paper starts with a thorough literature review for identifying these key driving in order to develop a system dynamics models that will be able to assess different improvement scenarios and initiatives. Based on causal loop diagrams, stock and flow diagrams are developed and solved using system dynamics theory. The model developed can be used for organizations to assess the impact of different improvement initiatives.
1. Introduction
Employee performance is dynamic and can have great impact on the overall performance of any organization and its sustainability. This is understood by companies, and human resource management departments are responsible for measuring the performance of the employees. One of their key objectives is to develop methods and policies for improving their performance constantly. Such practices include training of employees, providing initiatives such as bonuses, and days off.
Employee performance management is critical in human resource management. Through employee performance management, the senior management and leadership attempts to align the organizational objectives with the employees’ agreed key performance indicators (KPIs). Such KPIs include measures, skills, competency requirements, development plans, and the delivery of results. Thus, the focus of this process is the improvement, learning, and development of the employees for them to be able to contribute effectively in the overall business strategy. Initially the management of employee performance was only linked to deciding the salary level that each employee should be paid. However, such an approach does not account for employees who are not motivated only with financial rewards.
A number of studies have been presented addressing employee performance. Indicatively, Waheed defined employee performance as the employee productivity and output because of employee development and related that with the organizational effectiveness [1]. Alefari et al. studied the impact of leadership style on the performance of employees [2]. In the present study, a thorough literature review was undertaken focusing on identifying the factors that contribute to the employee performance as well as how this can be improved. The literature review also highlighted that there has not been a model that can be used for predicting the impact of such initiatives from a systems point of view. Therefore, the aim of the present paper is to develop a System Dynamics-based model that can help companies better handle the dynamic nature of employee performance and aid in the decision-making process for selecting the alternative initiatives to be introduced. Such a model will allow manufacturing organizations to run different improvement scenarios for assessing their potential and draw conclusions. Such a model needs to be generic enough to account for different organizations, but easily tailored to the specifics of the organization by quickly and accurately collecting primary data from within the organization. System dynamics models were developed based on this analysis and collecting data protocols were formulated for collecting information from companies.
The paper starts in the next section with a thorough literature review on the factors that can potentially have an influence on the employee performance. Furthermore, previous studies on modelling the employee performance are briefly discussed. Section 3 then presents the model and how this was developed. The causal loop diagrams developed are presented, as well as the resulting stock and flow diagram. In Section 4, the verification of the models developed is presented. For such verification, the model is used for hypothetical organizations and the predictions of the models are compared to the predictions found in previous studies found from the literature. Finally, for the validation of the model, a case study is presented in Section 5. For collecting data from both the employees and the senior management, a data collection protocol is presented in this section as well as the findings of the case study. The paper closes in Section 6 with the conclusions that include both the key findings as well as the next steps for this work.
2. Literature Review
Employee performance is a complex topic. It is highly affected by human behavior and as such, it has been thoroughly investigated. A number of theories have been developed that attempt to explain the behavior of human beings in their work environment. Indicatively, the most well-known ones include McGregor’s theories X and Y, and their evolution in the form of theory Z. Another aspect of employee performance management that has been thoroughly investigated is the measurement of the employees’ performance. The published research has focused on the frequency of the assessment, the means of assessment, and the importance of key performance indicators in the process of doing so. Through the assessment, gaps of performance can be identified, and initiatives can be adopted for improving. As it is obvious, covering all of these aspects in one paper is practically impossible. The focus of the present literature review is on the modelling attempts of employee performance, as well as in identifying the key factors that have an impact on the performance that could be potentially included in such a model.
2.1. Employee Performance Driving Factors
There is a plethora of factors that can affect the employee performance. A number of publications have been presented highlighting the impact of one or more of the factors, usually based on empirical studies. The literature search on factors affecting the employee performance resulted in a list of 140 relevant papers starting from the 1970s. In Table 1, the outline of the research analysis is shown, where the 17 most frequently arising factors are listed. In the table, only the papers published after 2010 that discuss more than one factor are listed. Figure 1 summarizes the findings from this analysis.
2.1.1. Motivation
The literature review, as shown in Figure 1, revealed that motivation is frequently found in the literature as a factor having an impact on employee performance. Employee engagement is a key element of motivation, which is commonly defined as the factor that makes employees go the extra mile. Campbell highlighted that declarative knowledge (e.g., goals, principles), procedural knowledge and skills (e.g., cognitive skills, physical skills, interpersonal skills), and motivation (choice to perform, level and persistence of effort) are key factors affecting job performance [40]. Boxall and Parcell [41] highlighted motivation as one of the three major factors impacting employee performance.
2.1.2. Employee Wellbeing
Employee wellbeing is a complex issue that most of the companies nowadays are trying to improve, as this will ensure that their employees are happy and stay motivated at work. In the most recent literature publications, wellbeing is related to the environment, the physical state of the employees, the psychological, as well as their social existence.
All businesses strive to be in a healthy state. If their employees are not in a good state of health and wellbeing, this is likely to contribute to successful performance [42]. The concept of employee wellbeing at work promotes advantages to organizations of having a healthy workforce [43]. A number of publications have revealed that employee wellbeing has a direct impact on productivity. Sobhani et al. pointed that failing to include health-related factors when optimizing systems may lead to underestimating the running costs [44].
Employee wellbeing at work can also be considered as the physical and mental health that is characterizing the workforce [45]. It is evident that for increasing the employee wellbeing, employees need work in a stress-free and physically safe environment. Bakke, in a similar train of thought, linked wellbeing to promoting an environment that allows work to be received as rewarding, enjoyable, stimulating, and exciting [46]. He states that employee wellbeing can help with the financial performance of the whole organization. For improving employee wellbeing, it needs to be measured as well. Van Laar et al. developed an assessment process based on six variables that include career satisfaction, home–work interface, working conditions, general wellbeing, stress, and control at work [47].
2.1.3. Human Resource Management Style and Practices
Human resource management style and practices are considered to help improve both the overall business performance and the individual’s performance [48]. There has been growing interest in the notion of “best practice” human resource management sometimes referred to as “high involvement” [49], “high performance work systems” [50], or “high commitment” [51].
HRM is responsible for a number of different tasks within an organization, that can be related to employee performance, such as:
Khoreva and Wechtle examined the associations between the skill-, motivation-, and opportunity-enhancing dimensions of human resource practices and in-role and innovative job performance through structural equation modelling [19]. They concluded that physical and social employee wellbeing have an impact on the association between skill- and opportunity-enhancing HR practices and in-role job performance. On the other hand, psychological employee wellbeing partially mediates the association between motivation-enhancing HR practices and innovative job performance. Saleem et al. highlighted the importance of employee empowerment on employee performance [31].
2.1.4. Training and Learning
Training can be considered from two different perspectives. Either as an initiative for experienced employees to obtain new capabilities and skills [56,57], or as support for employees who are not up to expected level and need support [58]. Such training can be considered as a way to create paths for the employees to enhance their skills and help their self-development [59].
Learning is defined as the acquisition of skills or knowledge through study or experience, and in the present context, this learning is related to abilities that can help employees with their work. As explained in the definition, learning can be sourced to training, either as part of a taught program or as part of “hands-in” practice while performing the job. Further to training, factors such as employee motivation or task complexity need to be considered when evaluating the learning effectiveness of the employees [60].
2.1.5. Job Satisfaction
Job satisfaction is not only related to the employee’s feelings about the work performed, but also entails the whole of the organization [61]. Wood et al. describe job satisfaction in the context of employees’ views of their work and work environment [62]. Motivation, as already mentioned, is closely related to job satisfaction. Messersmith et al., after reviewing data from 22 local authorities in Wales, have also identified job satisfaction as one of the critical factors [63].
2.1.6. Leadership Style
Leadership has a major influence on the performance of organizations, managers, and employees as it has been reported in a plethora of publications [64,65]. The various leadership styles can have an impact on the performance of individuals. A number of studies focus on the impact of different models on the employee performance, such as democratic or autocratic, socially oriented or target oriented, transformational or transactional, etc. In the following sections, the concept of lean leadership is described in more detail. Also, in previous sections, the leadership theories and models have been briefly presented.
The impact of the style of leadership adopted by the management on the performance has been researched a lot. Bass revealed that there is a high correlation between the leader’s transformational style and the organizational performance level [66]. Negative correlation between the transactional leadership style and organizational performance has been revealed in a number of publications [67,68,69,70]. A number of studies carried out in the Arab world suggest that leadership in the Arab cultures fosters consultative and participative tendencies [71]. Bussif claims that the influence of Islamic and tribal values and beliefs on leadership need to be considered, as both Islamic and tribal laws underpin consultation in all aspects of life [72].
2.1.7. Employee and Organizational Commitment and Absenteeism
The concept of employee commitment refers to the employee’s affective reactions to characteristics of his employing organization [73]. Employees commit to an organization as they expect certain rewards, which can be extrinsic (salary) and intrinsic (belonging, job satisfaction). Legge suggests that committed employees show a willingness to exert considerable effort on behalf of the organization, have a strong belief in and acceptance of the organization’s goals and values, and have a strong desire to be part of the organization [74]. However, De Menezes and Kelliher highlighted that the employees’ personality and career plans can greatly alter these factors [10]. They indicated how organizational commitment impacts the employees’ performance.
Absenteeism indicates a low degree of employee’s commitment and dissatisfaction. An individual’s commitment and work attitudes are important antecedents to absenteeism [75]. Rhodes and Steers suggest that employees who are not satisfied with their work or working conditions can be expected to avoid coming to work [76].
2.1.8. Organizational Culture
The culture of an organization characterizes the organization itself and to a great extent drive the behaviors within the organization. The culture of the organization defines the way employees perceive their responsibilities, complete tasks, and interact with each other in an organization. The culture comprises various beliefs, values, rituals, and symbols that govern the operating style of the people within a company. As has been highlighted in the section about leadership style, for the case of Arabic organizations, the practice of Islam greatly influences the culture of the organization. That was further highlighted by Alefari et al. [68], in a recent study.
The employee performance as well as the motivation levels can be impacted by the culture of the organization, but also by the subsets of culture within the various departments. If the culture promotes the integration of the employees, it has been proven that employees tend to consider themselves part of the organization and work harder to achieve the organizational goals. Alignment of the individuals’ goals with these organizational goals, which is the senior leadership’s responsibility, but supported by the culture of the organization, allows further performance improvements.
2.1.9. Employee Engagement
Employee engagement is defined as the level of commitment and involvement an employee has towards the organisation and its values [5]. When an employee is engaged, she/he is aware of her/his responsibility in the business goals and motivates his colleagues alongside, for achieving the organisational goals. The positive attitude of the employee with her/his workplace and its value system is otherwise called as the positive emotional connection of an employee towards her/his work. Engaged employees go beyond the call of duty to perform their role in excellence [5]. Anitha have associated employee engagement with a number of factors, such as leadership style, engaging teamwork, work environment, prospects of career development, the reward system, organizational policies, and workplace wellbeing [5].
2.1.10. Reward System
Rewards have been used for long time to acknowledge the performance of employees. Bonuses and monetary rewards are awarded to employees who exhibit high levels of performance or solve complex issues, generating extra value for the organization. For this to work, however, it is important to highlight the need for clearly defining the role of the employee within the organization [30].
2.1.11. Workplace Conditions
The state of the workplace and the conditions are usually highly regulated. These are requirements, terms of a job, as well as the environmental characteristics that are needed for the employee to be able to perform his work in a satisfactory manner, as this is perceived by him. In many countries, there is a minimum set of working conditions that are required by law and the organizations need to provide to their employees.
2.1.12. Career Development
2.1.13. Social Exchanges
Social exchanges refer to the informal social interactions that the employees establish among themselves, but they might also be promoted by the managers within the organization. The process of social exchange is initiated by organizations once the minimum expectance with regards to the way an organization values employees’ general contributions and cares for their wellbeing is achieved [81]. Once employees’ feel and experience that organizations value and deal equitably with them, they will reciprocate these “good deeds” with positive work attitudes and behaviors [82]. In social exchange, all stakeholders in an organization must somehow persuade the other of their trustworthiness [83].
2.1.14. Wellbeing Programs and Activities
In order for the wellbeing of the employees to be improved and maintained, organizations offer activities to the employees in order to help them sustain an appropriate lifestyle and wellbeing. Such activities can include fitness challenges (for example through sponsoring gym memberships), develop areas for socialization, healthier meal options in the canteen, instituting flexible work hours, and enhanced paternity/maternity leaves, to list few. The papers reviewed in the literature review indicated the positive impact that such activities and programs have in the employee performance.
2.1.15. Work–Life Balance
Work–life balance can be defined as the need to “balance work and leisure/family activities” [84]. This can have a great impact on the performance of the individuals. For example, requesting employees to work long hours can have a huge impact on the personal/family life. It is critical that organizations embrace the concept of work–life balance. If organizations were able to offer a range of different arrangements (i.e., flexible working arrangement as described in the following section) then it is likely that employees will be more motivated and engaged and thus performing better.
2.1.16. Flexible Working Arrangements
Flexible working arrangements refer to working patterns that are different to the existing one. They may include part time work, flexible starting and finishing hours, remote working, or working from home as examples [85]. Usually, such arrangements come with no cost, and in some cases, it might actually reduce the working cost as there will not be any need for desk, electricity, heating, etc.
De Menezes and Kelliher claim that flexible working arrangements can improve the job satisfaction and organizational commitment of their employees in the long term [10].
Flexible working arrangements can be classified as formal or informal ones. Formal flexible working arrangements are established and are acceptable by an organization as they are available within the organization’s policies. Informal flexible working arrangements are informally negotiated and agreed by employees and their line managers.
Formal arrangements have a greater impact on job satisfaction than on organizational commitment. Informal arrangements can have a direct impact on the motivation of the employees, since they create a feeling of “needing to give back”. This feeling is towards the managers that allow the arrangements, rather than the company itself, therefore the impact is on motivation and not on organizational commitment.
2.1.17. External Environment
Issues that are not related to the organization can affect the employees’ motivation or wellbeing, for example their families or personal life [17]. Other externally imposed changes can have an impact on the business, for example business volatility has been proven to have a positive impact on the employee performance [86].
2.2. Modelling and Simulation of Employee Performance
A number of models have been presented for simulating the employee performance. In almost all of them, the key elements include the ability of the employee that is exhibited through her/his skills, the various motivation approaches/incentives that the employer adopts, and the opportunity offered to the individual to participate.
Appelbaum et al. assume that people perform to their best if they come equipped with knowledge, skills, and abilities [50]. As mentioned in the previous paragraph, they also need to be motivated and have the opportunity to participate. The set of knowledge, skills, abilities, motivation, and opportunity form the core of the so-called AMO theory. This theory was established on the assumption that employee’s performance Pi of an individual i is a function of her/his ability Ai to perform, her/his motivation Mi to perform, and the opportunity to perform in the job Oi [41]:
The AMO theory is well established in research since it was first proposed in 2005 [87]. The ability Ai to perform does not focus only on the abilities, but reflects both the employees’ knowledge, their skills, and their abilities.
Purcell et al. developed the so-called “People and Performance Framework” based on two main assumptions [88]. The first one suggests that all employees have the capacity to engage in discretionary behavior and it is the ability of the organization to trigger such useful behavior, beyond meeting basic job requirements, that lead to higher performance. The second one is that line managers are critical for improving the levels of employee job satisfaction and commitment, which will in turn encourage employees to exercise their discretion and act beyond their in-role behaviors. The “People-Performance Framework” is composed of four pillars. Pillar 1 focuses on HEM. Pillars 2 and 3 are considered to be within the “black-box of HRM”. Pillar 2 includes the three elements that was highlighted in the AMO theory previously, namely “Ability”, “Motivation”, and “Opportunity”. Pillar 3 addresses the line manager and the management/leadership style adopted.
Greasley and Owen presented a review study on the modelling of people’s behavior focusing, however, on the discrete-event simulation method [89]. After reviewing a large number of papers, they have identified five different classes of modelling: “modelling people’s decisions”, “modelling people’s availability”, “modelling people’s task performance”, “modelling people’s arrivals”, and “modelling people’s movement”. However, such an approach focuses more on the operation side of a manufacturing system.
Human behavior on the micro-level is determined by nonlinear, complex, and dynamic phenomena; this makes it very difficult for analytic methods to be used for simulation [90]. As Sterman indicates, system dynamics is appropriate for modelling dynamic systems with complex nonlinearities, delays, and feedback processes [91]. The focus of the present study is the modelling of employee performance with system dynamics, and thus the following section will review the models presented on this subject until now.
For identifying relevant literature of present studies that use system dynamics for predicting the employee performance, a set of keywords were used, such as: “Simulat*”, “System Dynamics”, “Model*”, “employee”. A small number of publications was found, which will be presented in the following paragraphs.
One of the first relevant papers is included in one of the first books on the subject authored by Sterman [91], where he attempts to model and simulate the mental aspects of human beings. His example is on workload management and uses causal loop diagrams for establishing a reference model. In the same book, which is full of examples, he models, using system dynamics, how workforce quality and loyalty are influenced by perceived career opportunities and wages.
Akkerman and Kim van Oorschot presented a system dynamics model simulating the way employee’s motivation, satisfaction, and training can influence productivity [92]. They linked the use of a balanced score card with a system dynamics model in order to assess its feasibility for measuring the organization’s performance. For modelling the employee’s experience accumulation, they used stocks of new employees and experienced ones with the flow between the two stocks modelling the assimilation rate.
Gregoriades, in one of the first published attempts, presented a system dynamics model to assess the impact of fatigue, motivation, and stress in human errors in a workplace environment [93]. Jamil and Shaharanee in a similar study focused on how the human errors can be managed in power tool industries [94]. They considered workload, job-related stress, and motivation theory in their study. Kanaganayagam and Ogunlana presented a system dynamics model of workers’ willingness to be employed in the construction industry, taking into account commitment to the organization, necessity of having a job, achievement, and job satisfaction and dissatisfaction [95]. Vancouver et al. used system dynamics to simulate the way new employees try to build up job relevant knowledge in a new organization [96]. Jiang et al. presented a system dynamics model for human performance modelling and training optimization [97]. In their modelling approach, they focused on three of the key five factors that can have an impact on the effectiveness of training, namely Conscientiousness, Extroversion, and Openness. They did not consider Agreeableness and Neuroticism (Emotional Stability).
Shin et al. studied the decision-making process of a worker regarding safe behavior including factors such as optimistic recovery or habituation [98]. Block and Pickl presented a system dynamic model of individual’s performance that is based on the AMO theory [90]. AMO theory is based on the assumption that people perform if they have the knowledge, skills, and abilities as well as motivation and opportunity.
Wu et al. developed a system dynamics model for simulating the employee work-family conflict [99]. They considered factors such as both the support and the pressure that employees experience from within the family, workload, job pressure, support from the organization, and the flexibility in their work environment. The model was validated for the case of the construction sector. The simulation results highlighted that employees in this sector experience work interference with family conflict (WIFC) to a significantly greater degree than family interference with work conflict (FIWC). The model also indicated that improving work flexibility and organizational support can have a positive impact on employee satisfaction and performance from the perspective of work and family domains.
Oleghe and Salonitis [100,101,102,103,104], in a number of publications, have used system dynamics for modelling the impact of lean in manufacturing systems. They have developed models for assessing the level of leanness of manufacturing organizations [100] and the impact of implementing 5S [101] as a couple of examples. In a number of cases, they have used system dynamics in parallel with discrete event simulation, focusing on the former in the organizational aspects of manufacturing companies and the latter for the operations of the processes and systems in the organization [102,103,104]. In a recent study, they focused on the use system dynamics modelling approach as a strategic planning tool for analyzing business models [105].
The literature review highlighted a lack of quantitative models for assessing the impact of various interventions within an organization for the improvement of the employee performance. Although a number of qualitative models exist, none of these can be used for the assessment of different scenarios and their impact on the employee performance.
3. Model Development
Sterman presented the full systematic method for developing system dynamics models [91]. He identified two critical steps at the initial stage of development, setting clear boundaries for the project scope and clearly defining the dynamic hypothesis that will be the basis for the modelling and the data collection.
Based on the literature review and the scope of the models to be developed, the basic dynamic hypothesis of the present study was set as follows:
- Employee performance can be measured as the quality and quantity of work that is delivered;
- High-performing employees generate resources (time and/or money) that the company can reinvest in other initiatives or save for future investments;
- The effect of the initiatives and factors can be quantified as percentages.
Given the human variability in behaviors and responses, there is not an accurate way of modelling the employees’ response to each initiative, as each individual may respond in a different way.
3.1. Conceptual Model
Based on the literature review, and the basic hypothesis set in the previous section, a set of causal loop diagrams were developed for deciding on the form of the stock and flow diagram. For developing the conceptual model, the factors affecting the employee performance were classified into main and secondary factors.
The main factors are selected as these that have a direct impact on employee performance. They are most likely the ones to have more connections with other factors or initiatives than the secondary factors. In the context of the present work, the three main factors identified are:
- Employee wellbeing—as this is affected by almost all of the variables identified in the literature review.
- Motivation—similarly to the employee wellbeing, the literature review highlighted the plethora of factors that affect the motivation of the employees.
- Abilities—as they have a great impact on the employee performance as highlighted by the AMO theory. One metric to assess abilities is for example the attention to details that employees have.
All the rest of the critical factors identified in the literature review can be considered as secondary factors. Their impact on employee performance is usually through one or more of the main factors. However, for some of these, there is also a direct effect on employee performance. These usually are more easily affected by the improvement initiatives and the main factors/performance changes.
The secondary included in the model, and described in the literature review are:
- Adaptability;
- Learning;
- Job Satisfaction;
- Organizational Commitment;
- Competition;
- Flexible working arrangements;
- Absenteeism;
- Equal Effort.
The factor “External Environment” was decided not to be included in the model as it cannot directly be controlled by the organization.
The model developed considers the improvement initiatives as key. For any performance change to be achieved, improvement initiatives and/or policy changes need to be implemented. The investment required by the organization for these to have a chance to be successful in most of the cases is money related. However, such investments have an indirect cost as well, due to the time required by the employees.
The aim of such improvement initiatives is usually one of the factors affecting the employee performance. It can directly focus on a main factor or a secondary factor with a clear and direct impact on one of the main factors or the performance itself.
The time initiatives that were collected from the literature review are:
- Training;
- Change Agent;
- Schedule Pressure;
- Overtime;
- Wellbeing Activities.
Similarly, the monetary initiatives are:
- Reward System;
- Environmental Conditions;
- Career Development;
- Environmental Health;
- Wellbeing Programs.
Basic Causal Loop Diagrams
The basic starting causal loop diagram is quite similar to the ones presented in previous studies (such as [50,90]), however the interpretation and transformation to stock and flow diagram is different. Figure 2 presents the basic causal loop diagram. All causal loop diagrams were developed using Vensim 8.1.0.
The opportunity for an employee to perform is related to the empowerment of the employee. It can be also considered as the opportunity to be involved in the decision-making process. This gives employees the sense of involvement, engagement, and enhances wellbeing. The literature review has already highlighted that this is related to the way the task/work is structured, thus it depends on the job design, the existence and operation of work teams, the feedback system, and the sharing of information between the employees [50]. In Figure 3, the opportunity sub-model is shown.
The motivation sub-model needs to address all the variables that can have either a positive or a negative impact. Furthermore, the impact of some variable might not be observable straight away and can potentially take some time. Keeping in mind Occam’s Razor (the simplest solution is almost always the best), and at the same time trying not to oversimplify and look information, the sub-model developed is shown in Figure 4.
The motivation of the employees depends on a number of variables. The rewards system, i.e., the various incentives and the basic salary of the employee, impact motivation. The rewards system is closely related as well with job satisfaction; the higher the salary, the higher the job satisfaction. Organizational commitment is also critical. This affects the motivation of the employee, but at the same time is affected by a number of factors, such as job satisfaction, the way effort is recognized in the organization, the employee wellbeing, and the leadership style. The possibility of career development in the organization can also have an impact on the commitment of the employee and the motivation.
As can be seen in Figure 4, for some of the relationships there is a delay in their impact. As an example, improving the employee wellbeing will have a positive impact on the commitment that employees feel towards the organization, but this change requires time to be established.
Finally, the “knowledge, skills, abilities” sub-model is illustrated in Figure 5. Knowledge and skills can be acquired through experience and learning. The learning can be either structured, through the participation in training courses or through the on-job practice. The time however spent (or some might say “invested”) in training can increase the workload of the employee that can then reduce her/his ability to complete the task. The available time is central to the sub model. Schedule pressures can result in reduced time for training, can increase the workload, that then can potentially increase the absenteeism, which again increases further the workload for the employees working. These factors thus can have a negative impact on the ability of the employees to perform their work. Though, as Block and Pickl highlight in their paper, knowledge, skills, and abilities do not grow infinitely, but are subject to erosion [90]. In previous studies, the health of employees is considered as well. In the present study, this is considered through the wellbeing of the employees.
These three models do not stand in isolation. They relate to each other, and in some cases the share factors as well. Locke and Latham indicate that Opportunity has a direct impact on Motivation. Furthermore, Motivation indirectly has an impact on knowledge, skills, and abilities as well [106]. Figure 6 presents the complete causal loop diagram. A number of balancing and reinforcement loops can be identified. The complexity of the model is obvious. For the quantification of the model, a stock and flow diagram needs to be developed and will be presented in the next section.
3.2. Stock and Flow Model
Causal loop and stock and flow diagrams are both valuable tools, but they serve fundamentally different purposes. Causal loop diagrams are useful for communicating high-level views of a system. They are easily understandable and can provide a good first step for the systemic analysis of a problem [91]. On the other hand, stock and flow diagrams take the analysis to a higher level of rigor. Such diagrams differentiate between the parts of the system. Stock and flow diagrams distinguish between variables that are stocks and those that are flows. However, starting with a causal loop diagram helps with structuring the problem clearly.
For the needs of the present study, the stock and flow model is developed based on the causal loop diagram shown in Figure 6. The causal loop diagram allows the identification of the key variables and the relationships between them. The key stocks can be then identified and created. Subsequently, the flows are identified and then the remaining variables can be linked to either the stocks or the flows as well as setting up the links between them.
As the goal of this model is for an organization to be able to see the impact that various policies and changes can have on the performance of the employees, it was decided that the main stocks should be the number of low- and high-performing employees. In that case, the flow between the stocks will be defined by the various factors identified in the previous sections. The stock and flow diagrams have been presented in a study of the present authors for a different case before [107].
Figure 7 presents the stock and flow model developed. A number of parameters have been omitted from this graph for clarity purposes, however the causal loops between variables and stocks and flows are clearly shown. All variables have been included in the following detailed figures.
The basic elements of the model are the stock and flows of employees. In Figure 7, smaller stocks and flows at the top and bottom are included that represent the resources (in the form of available time or money), from which the different initiatives are fed. One stock represents the high-performing employees and one the low-performing ones. The flow between the two stocks is determined by the initiatives and the impact they have on the performance.
The number of high-performing employees impacts the inflow of the resources, as the high performers generate some value for the company. The focus of the project is to test the feasibility of maintaining the initiatives only with these resources. Nevertheless, the inflow can also have fixed values or the resources stocks initial savings (both of them being investments made by the company).
The resources are expended depending on the active initiatives. The initiatives are activated by using on them a percentage of the existing resources, determined by the parameters associated with each initiative.
For managing the complexity during the development of the model, a number of “shadow” stocks were introduced, that can help link sub-models with the main model. The sub-models are presented in more detail in following paragraphs.
For assessing the importance of the leadership style, a leadership model has to be adopted. There is a large number of leadership models available. In the present study, Hersey and Blanchard’s situational leadership theory is adopted, as it is based on the assumption that there is no best style of leadership, and its situation required a different style in order to get the optimum results [108]. The situational leadership theory characterizes the leadership style in terms of the amount of task behavior and relationship behavior that the leaders provide to their followers (or in the context of the present work, the employees). The four styles that can be used independently are the telling (or directing), the coaching, the supporting and the delegating one. These four leadership styles are considered in the model through a respective sub-model. As mentioned in the literature review, a style is never adopted independently, and usually the leadership style is a mix of the ones presented in the situational leadership theory. For this reason, each style can be activated or deactivated, and a percentage highlighting qualitatively how prominent the style is adopted is used.
In Figure 8, the sub-model of the time initiatives is shown. The model can accommodate a number of different initiatives; in the figure, a few of them are included such as training, the use of a change agent, the setting of schedule pressure, the use of overtimes, and establishing wellbeing activities. Each of these initiatives has a different impact on the various factors, and its effectiveness can be reported in the data collection phase. Parameters that represent the percentage of current resources used on each initiative are inputted in the model as well. The impact of each initiative in the various factors is calculated based on the length of duration that these initiatives are used. Additionally, the effect of task complexity, the initial values of overtime, or schedule pressure determine the values of the factors. These have a cumulative effect on employee performance.
Figure 9 illustrates the sub model for initiatives that are based in money. A number of initiatives are shown in the figure, such as rewards system in place, investments in improving the environmental conditions in the organization, the impact on the salary that a career development might have, the monetary impact of overtimes, or the money investment in well-being activities. Each initiative is activated through a parameter that also indicates level of investment.
4. Verification the Developed Models
For accepting a model, it needs to be verified and validated. The simulation model is valid only if the model is an accurate representation of the actual system. Validation and verification are both required in any simulation project. The validation is the process of comparing two results. The representation of a conceptual model is compared to the real system. On the other hand, verification is the process of comparing two or more results to ensure its accuracy.
A number of verification and validation techniques are suggested in the literature. Due to complexity of the problem, and the fact that it is very difficult to support some of the relationships with real data, the verification of the models was based on comparing the results, and more specifically the predicted patterns, to the ones found in literature. Thus, the focus was to examine whether the model produces ‘reasonable’ results or not.
All variables and relations have been derived from literature and the surveys conducted. They were checked against literature within the fields of management science, organizational behavior, and industrial psychology. Conceptual validity included a critical reflection of the model boundaries as well. As an example, the four leadership styles were considered in the model as a different variable. Each of them has a parameter to activate or deactivate them, or a combination of them. The parameters are activated with values between 0 and 1 (to represent percentages, 0 = 0%, 0.5 = 50%, 1 = 100%…) and the sum of them has to be 1 (to ensure that leadership is always being used). The effect of each style in the “performance increase flow” can be tailored by considering the specifics of the organization where the model is applied. Additionally, coaching uses the time resource and delegates the money resource (as discussed in the literature review).
For verifying the results, a hypothetical organization that has 200 employees in total, with 100 of them classified as high performers, is considered. Four scenarios were modelled in order to check the predictions of the model. The predictions were compared to what the literature suggests and were also presented to academics at Cranfield University with long industrial background who have served in senior management posts in the past. The simulations were run using Anylogic software.
4.1. Scenario a: Training Sessions for Low Performing Employees Every 12 Months
The organization considered has decided to train the low-performing employees every 12 months. The impact of this decision is shown in Figure 10. Two different cases were considered, that affect the assumptions. The first case is that training is considered superficially by the employees and results in short improvements that however are not sustained. As can be seen in the results, the model predicts that the impact of the training on the employees is sustained for about four to five months and then it wears off, getting to a point where it lingers only to about 10% of the trained employees (10 employees). The other case is that the training is more substantial, and as a result it wears off with a slower pace. More employees retain their skills at the end of the year, indicating that the learning is profound. The second, and subsequent rounds, of training are more effective and the impact is cumulative. This simulation run supports the findings of Jiang et al. [97] about the effectiveness of training in organizations, and suggestions from Block and Pickl [90] about the short-term success when a singular managerial intervention adopts such a training.
4.2. Scenario b: Leadership Style Impact on Employee Performance
For the same hypothetical organization, the impact of changing leadership style was assessed. The initial assumption was that the organization in its current state sustains the number of high-performing employees when its leaders and managers adopt a mix of coaching and supporting leadership style. Four different simulation runs were then performed, where all parameters were kept steady with the exception the ones related to the style of leadership. The impact of these changes in leadership style are shown in Figure 11.
The adoption of the telling leadership style seems to be a short-term success, as the number of high-performing employees increases, but this success is not sustained. Furthermore, this eventually has a negative impact even to the employees who were initially performing.
Coaching leadership style relies on telling people what to do but at the same time teaching them how to do their tasks. It can lead to short-term wins, however it requires a lot of time and energy from the managers that in the long run can have an impact on the performance of the employees as it does not allow them to grow independently. In the case of supporting leadership style, the independence of the employees is critical. This requires some effort from the managers at the beginning, but the model predicts an overall increase in the performance.
Finally, the delegating style requires that managers completely give the task responsibilities to the employees, and managers only review the results. However, it requires highly qualified employees in order for such a style to be adopted. For this reason, the pre-existing knowledge and skills of the employees will define how successful such a style will be. When combined with training opportunities for the employees, it can have a great impact on the both the individuals’ and the organizational performance.
4.3. Scenario c: Using Monetary Incentives for Increasing Employees’ Performance
For the same hypothetical organization, the impact of using monetary incentives, such as bonuses, paid holidays, paid registrations, etc., on the employee performance was assessed. As expected (Figure 12), when setting up such incentives, the performance of the employees increases dramatically, however the impact of such incentives is not sustained unless these are repeated frequently. The model predicted an almost 40% increase in the number of high performers within just five to six months, but the impact of that change disappears after about two and half years. The downside of such an approach is that, once such incentives are used, employees tend to expect them and in the long run can have a negative impact on the overall performance, unless repeated. This was obvious from the predictions of the model, as after five years, the number of high performers drop by about 15% from 100 high performers down to 85. Such behavior is in agreement with previous findings from the literature [109,110].
4.4. Scenario d: Introduction of Well-Being Program and Activities
For the last hypothetical case, the organization’s management decided to introduce wellbeing programs and activities. Such a change has a long-lasting impact as can be seen in Figure 13. There is high rate acceptance during the first year. As the enthusiasm of the new program fades away, the impact is reduced, however there is an overall steady increase in high performers of about 15%.
5. Data Collection Protocol, Case Study and Discussion
In the present chapter, the case study for the validation of the system dynamic model is presented. The chapter starts with defining the way the data are going to be collected from the participating companies, and how these will be used for specifying the variables in the model.
5.1. Data Collection Protocol
Greasley and Owen noted that modelling method strategies can either be data driven to predict human behavior or cognitive architectures to simulate human mental process [89]. The approach in the present study focused on collecting data from employees and managers. They also highlighted as the major challenge when modelling people’s behavior being the extensive data collection requirements and the difficulty of ensuring model validation. In the present subsection, the data collection protocol is presented.
It is accepted among the researchers who work on simulation, that any developed model can be trustworthy and reliable, only if the data that are used are reliable and accurate as well. This can be even more challenging with models that attempt to simulate human behavior. Furthermore, for the system dynamics model to be able to predict the impact of different cases, the current state is important to be replicated as accurately as possible. This requires that any bias is controlled and taken into consideration as well as any specific perceptions need to be addressed in early in the data collection phase. For this reason, it is necessary that the various perceptions of both employees and managers are considered and addressed in the model.
For every case thus, it was decided to collect information from both employees and operators with the use of a questionnaire, and then collect data and rich information from managers by using semi-structured interviews.
5.1.1. Data Collection from Employees—Questionnaire
Employees’ responses to a questionnaire about work can vary a lot, even if some of them have the same background, position, or experience. In order to make sure that the model captures as much as possible of the employees’ perception, a questionnaire was developed and distributed to as many employees as possible in the organization. For the participants to feel comfortable to participate in the survey and answer truthfully, the questionnaire clearly stated the terms with regards to the anonymity of the responses. Gu and Nolan stated that the majority of employees believe that personal relationships can affect their performance appraisal, and this generates a negative mood [111].
The questionnaire developed is based on statements that the respondents need to state whether they agree or disagree and to what extent. Figure 14 presents an abstract of the questionnaire. The statements have been divided into categories according to which part of the model they provide information to.
Likert scale is used and thus each question is scored between 1 and 5. This scoring then allows the calculation of the various parameters included in the model that characterize the initiatives. Each question was thus related to one or more variables in the model. As an example, the response to the question “Being told exactly what I should do helps me perform better”, will define the impact that the “telling” style of leadership will have on the performance of the employees. If an employee responds that she/he strongly agrees with this statement, this implies that adopting the “telling” leadership style will lead to performance improvement. Similarly, for the second question in Figure 14, a strong agreement indicates that that a “coaching” leadership style would lead to increasing performance. In a similar way, the answer to the question “Organisational/Departmental changes help me perform better” is related to the adaptability variable.
5.1.2. Data Collection from Managers—Semi-Structured Interviews
As highlighted in the beginning of this chapter, for a better understanding of the company’s initiatives, priorities, and current state, information is required from the managers as well. This allows for better handling of any bias that might be because of the employees’ perception, but also gives better insight into the way the organization works as well.
For collecting this information, semi-structured interviews with managers from each participating company were set up. The questions have been divided in sections according to which sub model the answers can be related to.
5.2. Case Study
The case study was based on a manufacturing company that is in the construction materials business. The company employees 300 persons, with 60% of them considered as high performers initially. For collecting the information required for quantifying the relationships between the factors, both data collection approaches described in the previous sections were used. Ninety employees from various departments within the company were approached and asked to fill in the questionnaire. Sixty-two responses were collected. The respondents were 70% male, with an average age of 28 years old. None of the responded held any posts of responsibility as for the managers interviews were used. The size of the sample (62/300 = 21%) is big enough to allow for a narrow confidence interval (for 95% confidence level that implies a confidence interval of ±11% for an answer agreed by the 50% of the sample), which is acceptable for drawing conclusions from such analysis. Furthermore, with a sample size that exceeds 30 participants, the central limit theorem is valid, increasing the confidence that the findings from the sample represent that of the population. Finally, five senior managers were interviewed from the five different department within the manufacturing company. All of them were male with an average age of 49 years old.
The company relies on the high-performing employees, as through their work, it can save on cost that then can be invested in various initiatives internally. Their performance also results in higher productivity, thus more time is freed up that then can be invested in other initiatives.
The managers in the company have adopted a mixed leadership style, presenting characteristics of both delegating and supporting styles. The company invests a considerable amount of money and time in training and development programs for the managers employed.
The company invests in developing its employees through training programs. Furthermore, they have currently a number of initiatives set up for wellbeing programs. It also provides the chance for the employees to work overtime. On average, all employees claim overtime that accounts for 10% of their normal hours. As the employees are happy to work overtime, this does not affect their wellbeing. The effectiveness of the training programs is high, resulting in improvements to around 50% of the work tasks. The schedule pressure is almost constant (80% of the time). Attention to detail, however, varies throughout the year and is affected by deadlines. Quality wise, there are no issues reported, thus the initial quality gap is zero.
The company also offers wellbeing activities to the employees through a wellbeing program. Furthermore, the company invests in a number of environmental initiatives. There are policies in place for flexible work. Job satisfaction is high, and the absenteeism level is usually less than 5%. Employees state that they are highly motivated by the reward system, although it is not formal. There is not a fixed career path.
5.2.1. Virtual Experimentation Using the SD Model
In agreement with the management of the organization, three virtual experiments were decided to be run, as shown in Table 2.
5.2.2. Results
The simulation of company’s current practices with regards the improvement of the employees’ performance are shown in Figure 15a. The immediate effect of the initiatives is positive, and the number of high performers increase rapidly. However, as can be seen by the figure, a fading out oscillation is observed with regards to the number of high performers. When the quality of the production drops below a threshold, the quality control system kicks in and the oscillations in performance levels generated are negligible after about two months. There is a 10% increase of performance in the long run, although after about 10 months, the impact of the initiatives starts to fade out. The predictions present a pattern that is confirmed by the company managers as well.
Figure 15b compares the outcome of the simulation of scenarios. The suggested actions in the first experiment (Exp1) seem to work as per the predictions of the model, as the number of high performers is increased drastically, and then it is almost kept at that level throughout the year. The time gained through the savings and the investment of this time for training seems to be working well.
On the other hand, the changes proposed in the second experiment (Exp2) do not produce positive results. The number of high performers initially drops from the initial value. This can be due to the slow effectiveness of the improvement initiatives, i.e., they are not effective enough to counter the performance losses. Nevertheless, this decreases the performance losses and allows the performance level to increase past the initial value, but only slightly.
Finally, the third experiment (Exp3) produces the same results as the current practices of the company, but at the same time this is achieved by using 25 resources.
5.2.3. Key Findings
The key findings from this analysis can be summarized in the following list of bullet points:
- The simulation of the current state indicates that the incentives in place are appropriate for the needs of its employees.
- There are variations in the performance of the employees, but the quality control system in place reduces their impact.
- The higher the number of high employees, the lower the variations of the number.
- The performance improvement is not greatly affected by the volume of resources allocated to the incentives.
- Reducing the resources allocated to the incentives affects even the best-performing systems.
- Performance losses have a greater impact on the final performance level than the performance increases (at overall high levels of performance).
- The incentives are self-sustainable thanks to the initial high levels of performance and the positive responses from the employees to the different incentives.
- While focusing on wellbeing is fundamental, its level should also be controlled to avoid over allocating resources that could be saved.
According to these tests, the key to high levels of performance that the company had since the beginning is the focus on the wellbeing programs (this can be seen in the current situation). The results as in the previous case were presented to the company managers, for their feedback. The managers involved considered the results logical.
5.2.4. Discussion and Limitations
It cannot be claimed that there is a perfect employee performance model. Employees and their responses to different environments and programs are arguably among the hardest business factors to study, measure, and control. Therefore, a model that tries to include both the effects of multiple factors on employees and the benefits that are obtained from them can hardly be a precise representation of reality as it is.
To reduce the inaccuracies, it is highly recommended to adapt the model to the company that will use it. Thoughtful and extensive data gathering is required to develop an appropriate model that could be used to study the actual impact of improvement initiatives. Without it, studying their sustainability will never provide results that truly represent the reality of the business.
Traditionally, most of the research done on employee performance focus their efforts on a specific factor or improvement initiative, and the total effect on performance was considered as simply the sum of the parts. In the literature, it was discussed how not focusing on the bigger picture can miss the interactions between factors at different levels (i.e., personal and organizational), stating the holistic nature of this issue.
On the other hand, considering every possible factor and every causal link between them may as well be as imprecise as the single research. Regardless of how powerful an analysis tool System Dynamics can be, its base is still to set the boundaries of the system and formulate hypotheses to start the development. In the case of employee performance, the multitude of factors, initiatives, and links need to be decisively limited. In doing so, it is necessary to go back to the importance of the information, and the need of a proper data gathering methodology.
The approach presented can be further developed as to address some of the existing limitations.
- Resources: The available resources that can be controlled (such as monetary incentives and available time) can be “invested” to a degree (as a percentage) for increasing employee performance. This is appropriate to keep the desired level of focus on each initiative over time. It also increases or decreases the expenses according to the savings. However, it is more common to have fixed amounts assigned to certain initiatives during fixed periods of time, so implementing this method is a possible future development of the project
- Leadership style: In the case study, the leadership style was fixed, and in some cases, the employees did not respond well to them. Changing the styles is necessary to achieve better performance levels, but this can be taken a step further. The strength of the situational leadership is to have managers able to change their styles as employees develop their skills and gain experience and confidence. With more precise data about how the employees respond to each leadership style in different situations, there is an opportunity to implement a dynamic style selection method to make the most from the employees’ skills.
- Employee wellbeing (EWB): EWB has proven to be the critical factor when implementing performance improvement initiatives. Therefore, it should be controlled accurately. In some cases, the EWB was quickly maxed thanks to the multiple initiatives focused on it, but this also means a waste of resources. A dynamic control of its level that is able to steadily lower the investment on its initiatives once it is maxed out can be the key to avoid waste while keeping the focus on it.
No model is a perfect representation of reality. By setting boundaries and dynamic hypotheses, representing employee performance becomes something feasible, but the results from the SD model will have certain differences compared to the actual effect of the initiatives:
- The turnover of staff will affect the performance changes. Employees leaving or joining the company will affect performance differently depending on which level of performance they were in or they start in.
- Additionally, new employees commonly go through a training period (different from the training initiatives in the model). While they are integrating in the company, the effects of the initiatives on them will vary.
- The external environment was left out of the model because it would have to be individually modelled, but its potential impact on an employee’s performance should not be disregarded. In the case that multiple employees were affected simultaneously by their respective environments, the model’s accuracy would be severely affected.
- The sustainability of the initiatives depends on the extra resources generated by the high performers. However, these will change depending on the general business condition. Again, including the whole business operations accurately in one model is far from possible.
These limitations can be addressed; however, these will increase the complexity of the model, without necessarily adding to the usability of the model, that has been developed for being able to compare different strategy scenarios.
6. Conclusions
System dynamics were used in the present paper for analyzing the interrelations of the factors that have an impact on employee performance. Causal loop diagrams were developed based on a thorough literature review that were then transferred to stock and flow diagrams for the mathematical simulation. As highlighted in the paper, the basic dynamic hypothesis was that employee performance can be assessed through the quality and quantity of the work that is delivered by the employees. The employee performance was related to the resources’ generation. This dynamic hypothesis was tested through four verification experiments and a case study. These experiments confirmed the validity of this dynamic hypothesis.
The data required for quantifying the relationships were captured using surveys and questionnaires. Such an approach allows the comparison of different policies and initiatives for improving the employee performance. The models developed were verified for hypothetical scenarios and compared to findings from the literature. A case study is then presented visualizing how this technique could be used in the decision-making process.
The paper presented a first attempt, to the knowledge of the researchers supported by the thorough literature review that they undertook, of modelling the employee performance in a holistic way, considering such a big number of different impacting factors. The literature review has not highlighted a similar study that is based on system dynamics for modelling such a plethora of factors on the employee performance. Furthermore, no other employee performance model has been presented that considers the differences of perception between the employees and the senior management. Of course, such a modelling approach, given the complexity of the problem that is attempted to be modelled, presents some limitations that were discussed in the previous section, also highlighting the probable future directions for addressing these limitations.
Author Contributions
Conceptualization, M.A. (Mudhafar Alefari) and K.S.; methodology, M.A. (Mudhafar Alefari) and K.S.; validation, M.A. (Mudhafar Alefari) and M.A. (Mohammed Almanei); formal analysis, M.A. (Mudhafar Alefari); investigation, M.A. (Mudhafar Alefari) and M.A. (Mohammed Almanei); visualization, M.A. (Mudhafar Alefari), validation, M.A. (Mudhafar Alefari), M.A. (Mohammed Almanei) and K.S., writing—original draft preparation, M.A. (Mudhafar Alefari) and M.A. (Mohammed Almanei); writing—review and editing, K.S.; supervision, K.S. All authors have read and agreed to the published version of the manuscript.
Funding
This research received no external funding.
Acknowledgments
The authors would like to acknowledge Angel María Fernández Barahona contribution to the paper. Angel as a Cranfield University MSc student supported the present work by running the simulations in Anylogic.
Conflicts of Interest
The authors declare no conflict of interest.
References
- Waheed, A.A. Employee Development and its Effect on Employee Performance A Conceptual Framework. Int. J. Bus. Soc. Sci. 2011, 2, 224–229. [Google Scholar]
- Alefari, M.; Salonitis, K.; Xu, Y. The role of leadership in implementing lean manufacturing. Procedia CIRP 2017, 63, 756–761. [Google Scholar] [CrossRef]
- Al-Dmour, R.; Yassine, O.; Masa’deh, R. A Review of Literature on the Associations among Employee Empowerment, Work Engagement and Employee Performance. Mod. Appl. Sci. 2018, 12, 313–329. [Google Scholar] [CrossRef]
- Almatrooshi, B.; Singh, S.K.; Farouk, S. Determinants of organizational performance: A proposed framework. Int. J. Product. Perform. Manag. 2016, 65, 844–859. [Google Scholar] [CrossRef]
- Anitha, J. Determinants of employee engagement and their impact on employee performance. Int. J. Product. Perform. Manag. 2014, 63, 308–323. [Google Scholar]
- Atatsi, E.A.; Stoffers, J.; Kil, A. Factors affecting employee performance: A systematic Literature review. J. Adv. Manag. Res. 2019, 16, 329–351. [Google Scholar] [CrossRef]
- Austen, S.; Jefferson, T.; Preston, A. Contrasting economic analyses of equal renumeration: The social and community services (SACS) case. J. Ind. Relat. 2013, 55, 60–79. [Google Scholar] [CrossRef] [Green Version]
- Boehm, S.A.; Dwertmann, D.J.; Bruch, H.; Shamir, B. The missing link? Investigating organizational identity strength and transformational leadership climate as mechanisms that connect CEO charisma with firm performance. Leadersh. Q. 2015, 26, 156–171. [Google Scholar] [CrossRef]
- Bruggen, A. An empirical investigation of the relationship between workload and performance. Manag. Decis. 2015, 53, 2377–2389. [Google Scholar] [CrossRef]
- De Menezes, L.M.; Kelliher, C. Flexible Working, Individual Performance and Employee Attitudes: Comparing Formal and Informal Arrangements. Hum. Resour. Manag. 2017, 56, 1051–1070. [Google Scholar] [CrossRef] [Green Version]
- Dhir, S.; Shukla, A. Role of organizational image in employee engagement and performance. Benchmarking Int. J. 2019, 26, 971–989. [Google Scholar] [CrossRef]
- Diamantidis, A.D.; Chatzoglou, P. Factors affecting employee performance: An empirical approach. Int. J. Product. Perform. Manag. 2019, 68, 171–193. [Google Scholar] [CrossRef]
- Gul, A.; Akbar, S.; Jan, Z. Role of capacity development, employee empowerment and promotion on employee retention in the banking sector of Pakistan. Int. J. Acad. Res. Bus. Soc. Sci. 2012, 2, 284–300. [Google Scholar]
- Hador, B.B. How intra-organizational social capital influences employee performance. J. Manag. Dev. 2016, 35, 1119–1133. [Google Scholar] [CrossRef]
- Heffernan, M.; Dundon, T. Cross-level effects of high-performance work systems (HPWS) and employee well-being: The mediating effect of organizational justice. Hum. Resour. Manag. J. 2016, 26, 211–231. [Google Scholar] [CrossRef]
- Hilda. The Factors of Organizational Culture and Rewards on Job Satisfaction and Performance of Nurses in a Wahab Sjahranie Regional Public Hospital of Samarinda. Ph.D. Thesis, Hasanudin University, Makassar, Indonesia, 2011. [Google Scholar]
- Juniper, B. Evaluation of a Novel Approach to Measuring Well-Being in the Workplace. Ph.D. Thesis, Cranfield University, Oxford, MI, USA, 2010. [Google Scholar]
- Karatepe, O.M. The effects of work overload and work-family conflict on job embeddedness and job performance—The mediation of emotional exhaustion. Int. J. Contemp. Hosp. Manag. 2014, 25, 614–634. [Google Scholar] [CrossRef]
- Khoreva, V.; Wechtler, H. HR practices and employee performance: The mediating role of well-being. Empl. Relat. 2018, 40, 227–243. [Google Scholar] [CrossRef] [Green Version]
- Kia, N.; Halvorsen, B.; Bartram, T. Ethical leadership and employee in-role performance—The mediating roles of organisational identification, customer orientation, service climate, and ethical climate. Pers. Rev. 2019, 48, 1716–1733. [Google Scholar] [CrossRef]
- Kim, S.; Yoon, G. An innovation-driven culture in local government: Do senior manager’s transformational leadership and the climate for creativity matter? Public Pers. Manag. 2015, 44, 147–168. [Google Scholar] [CrossRef]
- Kundu, S.C.; Kumar, S.; Gahlawat, N. Empowering leadership and job performance: Mediating role of psychological empowerment. Manag. Res. Rev. 2019, 42, 605–624. [Google Scholar] [CrossRef]
- Lichtenthaler, P.W.; Fischbach, A. Leadership, job crafting, and employee health and performance. Leadersh. Organ. Dev. J. 2018, 39, 620–632. [Google Scholar] [CrossRef]
- Maamari, B.E.; Saheb, A. How organizational culture and leadership style affect employees’ performance of genders. Int. J. Organ. Anal. 2018, 26, 630–651. [Google Scholar] [CrossRef]
- Melián-González, S.; Bulchand-Gidumal, J.; López-Valcárcel, B.G. New evidence of the relationship between employee satisfaction and firm economic performance. Pers. Rev. 2015, 44, 906–929. [Google Scholar] [CrossRef]
- Mensah, J.K. A “coalesced framework” of talent management and employee performance—For further research and practice. Int. J. Product. Perform. Manag. 2015, 64, 544–566. [Google Scholar] [CrossRef]
- Otero-Neira, C.; Varela-Neira, C.; Bande, B. Supervisory servant leadership and employee’s work role performance—A multilevel mediation model. Leadersh. Organ. Dev. J. 2015, 37, 860–881. [Google Scholar] [CrossRef]
- Paschal, A.O.; Nizam, I. Effects of Organisational Culture on Employees Performance: Case of Singapore Telecommunication. Int. J. Account. Bus. Manag. 2016, 4, 19–26. [Google Scholar] [CrossRef]
- Ramli, A.H. Work Environment, Job Satisfaction and Employee Performance in Health Services. Bus. Entrep. Rev. 2019, 19, 29–42. [Google Scholar] [CrossRef]
- Alefari, M.; Salonitis, K. Assessing the Employees’ Performance and the Role of Leadership. In Advances in Manufacturing Technology XXXII, Proceedings of the 16th International Conference on Manufacturing Research, Skövde, Sweden, 11–13 September 2018; IOS Press: Amsterdam, The Netherlands, 2018. [Google Scholar]
- Saleem, A.M.; Bbhutta, Z.M.; Nauman, M.; Zahra, M. Enhancing performance and commitment through leadership and empowerment—An emerging economy perspective. Int. J. Bank Mark. 2019, 37, 303–322. [Google Scholar] [CrossRef]
- Salman, A.; Hassan, Z. Impact of Effective Teamwork on Employee Performance. Int. J. Account. Bus. Manag. 2016, 4, 76–85. [Google Scholar]
- Siddiqui, N.-U.-H.; Hameed, S.; Sattar, R.A.; Eneizan, B. Islamic Work Ethics Impact on Employee Performance. Int. J. Acad. Multidiscip. Res. 2019, 3, 1–7. [Google Scholar]
- Sihombing, S.; Astuti, E.S.; Musadieq, A.; Hamied, D.; Rahardjo, K. The effect of servant leadership on rewards, organizational culture and its implication for employee’s performance. Int. J. Law Manag. 2018, 60, 505–516. [Google Scholar] [CrossRef]
- Soomro, A.A.; Breitenecker, R.J.; Shah, S.A.M. Elation of work-life balance, work-family conflict, and family-work conflict with the employee performance-moderating role of job satisfaction. South Asian J. Bus. Stud. 2018, 7, 129–146. [Google Scholar] [CrossRef]
- Sun, X. Psychological empowerment on job performance: Mediating effect of job satisfaction. Psychology 2016, 7, 584–590. [Google Scholar] [CrossRef] [Green Version]
- Tetik, N. The effects of psychological empowerment on job satisfaction and job performance of tourist guides. Int. J. Acad. Res. Bus. Soc. Sci. 2016, 6, 221–239. [Google Scholar] [CrossRef]
- Ye, Z.; Liu, H.; Gu, J. Relationships between conflicts and employee perceived job performance—Job satisfaction as mediator and collectivism as moderator. Int. J. Confl. Manag. 2019, 30, 706–728. [Google Scholar] [CrossRef]
- Yilmaz, O.D. Revisiting the impact of perceived empowerment on job performance: Results from front-line employees. Turizam 2015, 19, 34–46. [Google Scholar] [CrossRef] [Green Version]
- Campbell, J.P.; McCloy, R.A.; Oppler, S.H.; Sager, C.E. A Theory of Performance. In Personnel Selection in Organizations; Schmitt, N., Borman, W.C., Eds.; Jossey-Bass: San Francisco, CA, USA, 1993; pp. 35–70. [Google Scholar]
- Boxall, P.; Purcell, J. Strategic human resource management: Where have we come from and where should we be going? Int. J. Manag. Rev. 2000, 2, 183–203. [Google Scholar] [CrossRef]
- MacDonald, L.A.C. Wellness at Work: Protecting and Promoting Employee Well-Being; Chartered Institute of Personnel and Development: London, UK, 2005. [Google Scholar]
- Cooper, C.; Robertson, I. Well-Being in Organisations: A Reader for Students and Practitioners; John Wiley & Sons Limited: Chichester, UK, 2001. [Google Scholar]
- Sobhani, A.; Wahab, M.I.M.; Neumann, W.P. Incorporating human factors-related performance variation in optimizing a serial system. Eur. J. Oper. Res. 2017, 257, 69–83. [Google Scholar] [CrossRef]
- Currie, D. Managing Employee Well-Being; Chandos Publishing (Oxford) Limited: Oxford, MI, USA, 2001. [Google Scholar]
- Bakke, D.W. Joy at Work: A Revolutionary Approach to Fun on the Job; Penguin Group (USA) Inc.: New York, NY, USA, 2005. [Google Scholar]
- Van Laar, D.; Edwards, J.A.; Easton, S. The Work-Related Quality of Life scale for healthcare workers. J. Adv. Nurs. 2007, 60, 325–333. [Google Scholar] [CrossRef]
- Guest, D.E. Human resource management-the workers’ verdict. Hum. Resour. Manag. J. 1999, 9, 5–25. [Google Scholar] [CrossRef]
- Wood, S. Human resource management and performance. Int. J. Manag. Rev. 1999, 1, 367–413. [Google Scholar] [CrossRef]
- Appelbaum, E.; Bailey, R.; Berg, P.; Kalleberg, A. A Manufacturing Competitive Advantage: The Effects of High Performance Work Systems on Plant Performance and Company Outcomes; Cornell University Press: New York, NY, USA, 2000. [Google Scholar]
- Guest, D.E. Human resource management and performance: Still searching for some answers. Hum. Resour. Manag. J. 2011, 21, 3–13. [Google Scholar] [CrossRef]
- Pachos, N.; Galanaki, E. Staffing practices and employee performance: The role of age. Evid. Based HRM. 2019, 7, 93–112. [Google Scholar] [CrossRef]
- Liu, F.; Chow, I.H.-S.; Xiao, D.; Huang, M. Cross-level effects of HRM bundle on employee well-being and job performance—The mediating role of psychological ownership. Chin. Manag. Stud. 2017, 11, 520–537. [Google Scholar] [CrossRef]
- Garg, P.; Rastogi, R. New model of job design: Motivating employees’ performance. J. Manag. Dev. 2006, 25, 572–587. [Google Scholar] [CrossRef] [Green Version]
- Sharma, N.P.; Sharma, T.; Agarwal, M.T. Measuring employee perception of performance management system effectiveness—Conceptualization and scale development. Empl. Relat. 2016, 38, 224–247. [Google Scholar] [CrossRef]
- Keeping, L.M.; Levy, P.E. Performance appraisal reactions: Measurement, modeling, and method bias. J. Appl. Psychol. 2000, 85, 708–723. [Google Scholar] [CrossRef]
- Brown, M.; Benson, J. Rated to Exhaustion? Reactions to Performance Appraisal Processes. Ind. Relat. J. 2003, 34, 67–81. [Google Scholar] [CrossRef]
- Erdogan, B. Antecedents and Consequences of Justice Perceptions in Performance Appraisals. Hum. Resour. Manag. Rev. 2002, 12, 555–578. [Google Scholar] [CrossRef]
- Muchinsky, P.M. Psychology Applied to Work, 8th ed.; Thomson Wadsworth: Belmont, CA, USA, 2006. [Google Scholar]
- Sanchez, A.; Mat, S.; Goh, Y.; Case, K. Human variability, task complexity and motivation contribution in manufacturing. In Proceedings of the 11th International Conference on Manufacturing Research (ICMR2013), Cranfield, UK, 19–20 September 2013; pp. 325–330. [Google Scholar]
- Jernigan, I.E., III; Beggs, J.M.; Kohut, G.F. Dimensions of work satisfaction as predictors of commitment type. J. Manag. Psychol. 2002, 17, 564–579. [Google Scholar] [CrossRef]
- Wood, S.; van Veldhoven, M.; Croon, M.; de Menezes, L.M. Enriched job design, high involvement management and organizational performance: The mediating roles of job satisfaction and well-being. Hum. Relat. 2012, 65, 419–446. [Google Scholar] [CrossRef]
- Messersmith, J.G.; Patel, P.C.; Lepak, D.P. Unlocking the Black Box: Exploring the Link between High-Performance Work Systems and Performance. J. Appl. Psychol. 2011, 96, 1105–1118. [Google Scholar] [CrossRef] [PubMed] [Green Version]
- Wang, H.; Law, K.S.; Hackett, R.D.; Wang, D.; Chen, Z.X. Leader-member exchange as a mediator of the relationship between transformational leadership and followers’ performance and organizational citizenship behavior. Acad. Manag. J. 2005, 48, 420–432. [Google Scholar] [CrossRef] [Green Version]
- Vigoda-Gadot, E. Leadership style, organizational politics, and employees’ performance: An empirical examination of two competing models. Pers. Rev. 2007, 36, 661–683. [Google Scholar] [CrossRef]
- Bass, B.M. Leadership and Performance beyond Expectations; Free Press: New York, NY, USA, 1985. [Google Scholar]
- Geyer, A.L.; Steyrer, J.M. Transformational leadership and objective performance in banks. J. Appl. Psychol. 1998, 47, 397–420. [Google Scholar] [CrossRef]
- Alefari, M.; Almanei, M.; Salonitis, K. Lean Manufacturing, leadership and employees: The case of UAE manufacturing companies. Prod. Manuf. Res. 2020, 8, 222–243. [Google Scholar] [CrossRef]
- MacKenzie, S.B.; Podssakoff, P.M.; Rich, G.A. Transformational and transactional leadership and salesperson performance. J. Acad. Mark. Sci. 2001, 2, 115–134. [Google Scholar] [CrossRef]
- Parry, K.W. Leadership, culture and performance: The case of the New Zealand public sector. J. Chang. Manag. 2003, 4, 376–399. [Google Scholar] [CrossRef]
- Alnuaimi, S.S. Effective Leadership in Implementing Change in Arab Culture: The Case of the Abu Dhabi Police. Ph.D. Thesis, Manchester Metropolitan University, Manchester, UK, 2013. [Google Scholar]
- Boussif, D. Decision-making styles of Arab executives: Insights from Tunisia. Commun. IBIMA 2010, 2010, 660955. [Google Scholar] [CrossRef] [Green Version]
- Cook, J.; Wall, T. New work attitude: Measure of trust, organisational commitment and personal need non-fulfilment. J. Occup. Psychol. 1980, 53, 39–52. [Google Scholar] [CrossRef]
- Legge, K. HRM: Rhetoric, reality and hidden agendas. In Human Resource Management: A Critical Text; Storey, J., Ed.; Routledge Publishers: London, UK, 1995; pp. 33–61. [Google Scholar]
- Farrell, D.; Stamm, C. Meta-analysis of the correlates of employee absence. Hum. Relat. 1998, 41, 211–227. [Google Scholar] [CrossRef]
- Rhodes, S.; Steers, R. Managing Employee Absenteeism; Wesley Publishing Company: Reading, MA, USA, 1990. [Google Scholar]
- Cook, J.; Crossman, A. Satisfaction with performance appraisal systems: A study of role perceptions. J. Manag. Psychol. 2004, 19, 526–541. [Google Scholar] [CrossRef]
- Caruth, D.L.; Humphreys, J.H. Performance Appraisal: Essential Characteristics for Strategic Control. Meas. Bus. Excell. 2008, 12, 24–32. [Google Scholar] [CrossRef]
- Prowse, P.; Prowse, J. The Dilemma of Performance Appraisal. J. Meas. Bus. Excell. 2009, 13, 69–77. [Google Scholar] [CrossRef]
- Macey, W.H.; Schneider, B.; Barbera, K.M.; Young, S.A. Employee Engagement: Tools for Analysis, Practice, and Competitive Advantage; Wiley-Blackwell: Malden, WA, USA, 2009. [Google Scholar]
- Eisenberger, R.; Fasolo, P.; Davis-Lamastro, V. Perceived organisational support and employee diligence, commitment and innovation. J. Appl. Psychol. 1990, 75, 51–59. [Google Scholar] [CrossRef]
- Aryee, S.; Budhwar, P.S.; Chen, Z.X. Trust as a mediator of the relationship between organisational justice and work outcomes: Test of a social exchange model. J. Organ. Behav. 2002, 23, 267–852. [Google Scholar] [CrossRef]
- Haas, D.F.; Deseran, F.A. Trust and symbolic exchange. Soc. Psychol. Q. 1981, 44, 3–13. [Google Scholar] [CrossRef]
- Bratton, J.; Gold, J. Human Resource Management: Theory and Practice, 3rd ed.; Palgrave Publishers: Hampshire, UK, 2003. [Google Scholar]
- Houston, D.M. Work-Life Balance in the 21st Century; Palgrave Macmillan: New York, NY, USA, 2005. [Google Scholar]
- Chiang, W.-C.; Sun, L.; Walkup, B.R. Business volatility and employee performance. Am. J. Bus. 2018, 33, 96–119. [Google Scholar] [CrossRef]
- Boselie, P.; Dietz, G.; Boon, C. Commonalities and contradiction in research on human resource management and performance. Hum. Resour. Manag. J. 2005, 15, 67–94. [Google Scholar] [CrossRef] [Green Version]
- Purcell, J.; Kinnie, N.; Hutchinson, S.; Rayton, B.; Swart, J. Understanding the People and Performance Link: Unlocking the Black Box; CIPD: London, UK, 2003. [Google Scholar]
- Greasley, A.; Owen, C. Modelling people’s behaviour using discrete-event simulation: A review. Int. J. Oper. Prod. Manag. 2018, 38, 1228–1244. [Google Scholar] [CrossRef] [Green Version]
- Block, J.; Pickl, S. The mystery of job performance: A system dynamics model of human behavior. In Proceedings of the 32nd International Conference of the System Dynamics Society, Delft, The Netherlands, 2014; Curran Associates, Inc.: Red Hook, NY, USA, 2015. [Google Scholar]
- Sterman, J.D. Business Dynamics—System Thinking and Modeling for Complex World; Scott, I., Jeffrey, J.S., Eds.; McGraw Hill: New York, NY, USA, 2000. [Google Scholar]
- Akkermans, H.A.; van Oorschot, K.E. Relevance assumed: A case study of balanced scorecard development using system dynamics. J. Oper. Res. Soc. 2005, 56, 931–941. [Google Scholar] [CrossRef]
- Gregoriades, A. Human Error assessment in complex Socio-Technical systems—System Dynamics versus Bayesian Belief Network. In Proceedings of the 19th International Conference of the System Dynamics Society, Atlanta, GA, USA, 23–27 July 2001. [Google Scholar]
- Jamil, J.M.; Shaharanee, I.N.M. A system dynamic simulation model for managing the human error in power tools industries. AIP Conf. Proc. 2017, 1891, 020098. [Google Scholar] [CrossRef]
- Kanaganayagam, R.; Ogunlana, S. Making construction employment decent work: Dynamic modelling of workers willingness to be employed in the industry. In CIB W107 Construction in Developing Countries International Symposium Construction in Developing Countries: Procurement, Ethics and Technology; CIB: Port of Spain, Trinidad and Tobago, 2008. [Google Scholar]
- Vancouver, J.B.; Tamanini, K.B.; Yoder, R.J. Using Dynamic Computational Models to Reconnect Theory and Research: Socialization by the Proactive Newcomer as Example. J. Manag. 2010, 36, 764–793. [Google Scholar] [CrossRef]
- Jiang, H.; Karwowski, W.; Ahram, T. Application of System Dynamics Modeling for the Assessment of Training Performance Effectiveness. In Proceedings of the Human Factors and Ergonomics Society 56th Annual Meeting (2012), Boston, MA, USA, 22–26 October 2012. [Google Scholar]
- Shin, M.; Lee, H.-S.; Park, M.; Lee, S. An Analysis of Mental Process within Construction Workforces for Project-level Safety Management. In Proceedings of the 31st International Conference of the System Dynamics Society, Cambridge, MA, USA, 21–25 July 2013. [Google Scholar]
- Wu, G.; Duan, K.; Zuo, J.; Yang, J.; Wen, S. System Dynamics Model and Simulation of Employee Work-Family Conflict in the Construction Industry. Int. J. Environ. Res. Public Health 2016, 13, 1059. [Google Scholar] [CrossRef] [PubMed]
- Omogbai, O.; Salonitis, K. A Lean Assessment Tool Based on Systems Dynamics. Procedia CIRP 2016, 50, 106–111. [Google Scholar] [CrossRef] [Green Version]
- Omogbai, O.; Salonitis, K. The implementation of 5S lean tool using system dynamics approach. Procedia CIRP 2017, 60, 380–385. [Google Scholar] [CrossRef]
- Oleghe, O.; Salonitis, K. Application of hybrid simulation modelling for the implementation of job rotation in a feedmill. In Proceedings of the 2018 Winter Simulation Conference, Gothenburg, Sweden, 9–12 December 2018; pp. 1394–1405. [Google Scholar]
- Oleghe, O.; Salonitis, K. The application of a hybrid simulation modelling framework as a decision-making tool for TPM improvement. J. Qual. Maint. Eng. 2019, 25, 476–498. [Google Scholar] [CrossRef] [Green Version]
- Oleghe, O.; Salonitis, K. Hybrid simulation modelling of the human-production process interface in lean manufacturing systems. Int. J. Lean Six Sigma 2019, 10, 665–690. [Google Scholar] [CrossRef]
- Gomez Segura, M.; Oleghe, O.; Salonitis, K. Analysis of lean manufacturing strategy using system dynamics modelling of a business model. Int. J. Lean Six Sigma 2019. [CrossRef] [Green Version]
- Locke, E.A.; Latham, G.P. A theory of goal setting and task performance. Acad. Manag. Rev. 1991, 16, 480–483. [Google Scholar] [CrossRef]
- Alefari, M.; Barahoha, A.M.F.; Salonitis, K. Modelling manufacturing employees’ performance based on a system dynamics approach. Procedia CIRP 2018, 72, 438–443. [Google Scholar] [CrossRef]
- Hersey, P.; Blanchard, K.H. Life cycle theory of leadership. Train. Dev. J. 1969, 23, 26–34. [Google Scholar]
- Kahn, L.M.; Sherer, P.D. Contingent Pay and Managerial Performance. ILR Rev. 1990, 43, 107–120. [Google Scholar] [CrossRef]
- Anik, L.; Aknin, L.B.; Norton, M.I.; Dunn, E.W.; Quoidbach, J. Prosocial Bonuses Increase Employee Satisfaction and Team Performance. PLoS ONE 2013, 8, e75509. [Google Scholar] [CrossRef] [PubMed]
- Gu, F.; Nolan, J. Performance appraisal in Western and local banks in China: The influence of firm ownership on the perceived importance of guanxi. Int. J. Hum. Resour. Manag. 2017, 28, 1433–1453. [Google Scholar] [CrossRef]
Figure 1.
Frequency of factors appearing in the literature.

Figure 2.
Basic causal loop diagram for the model.

Figure 3.
Opportunity sub-model for the model.

Figure 4.
Motivation sub-model for the model.

Figure 5.
Knowledge, skills, and abilities sub-model for the model.

Figure 6.
Causal loop diagram for the full model.

Figure 7.
System dynamics basic model (similar to the one presented by the authors is [107]).
Figure 7.
System dynamics basic model (similar to the one presented by the authors is [107]).

Figure 8.
System dynamics model time initiatives (similar to the one presented by the authors is [107]).
Figure 8.
System dynamics model time initiatives (similar to the one presented by the authors is [107]).

Figure 9.
System dynamics model money initiatives (similar to the one presented by the authors is [107]).
Figure 9.
System dynamics model money initiatives (similar to the one presented by the authors is [107]).

Figure 10.
Verification scenario A.

Figure 11.
Verification scenario B.

Figure 12.
Verification scenario C.

Figure 13.
Verification scenario D.

Figure 14.
Questionnaire extract.

Figure 15.
(a) Current (as-is) situation model predictions and (b) scenarios comparison.


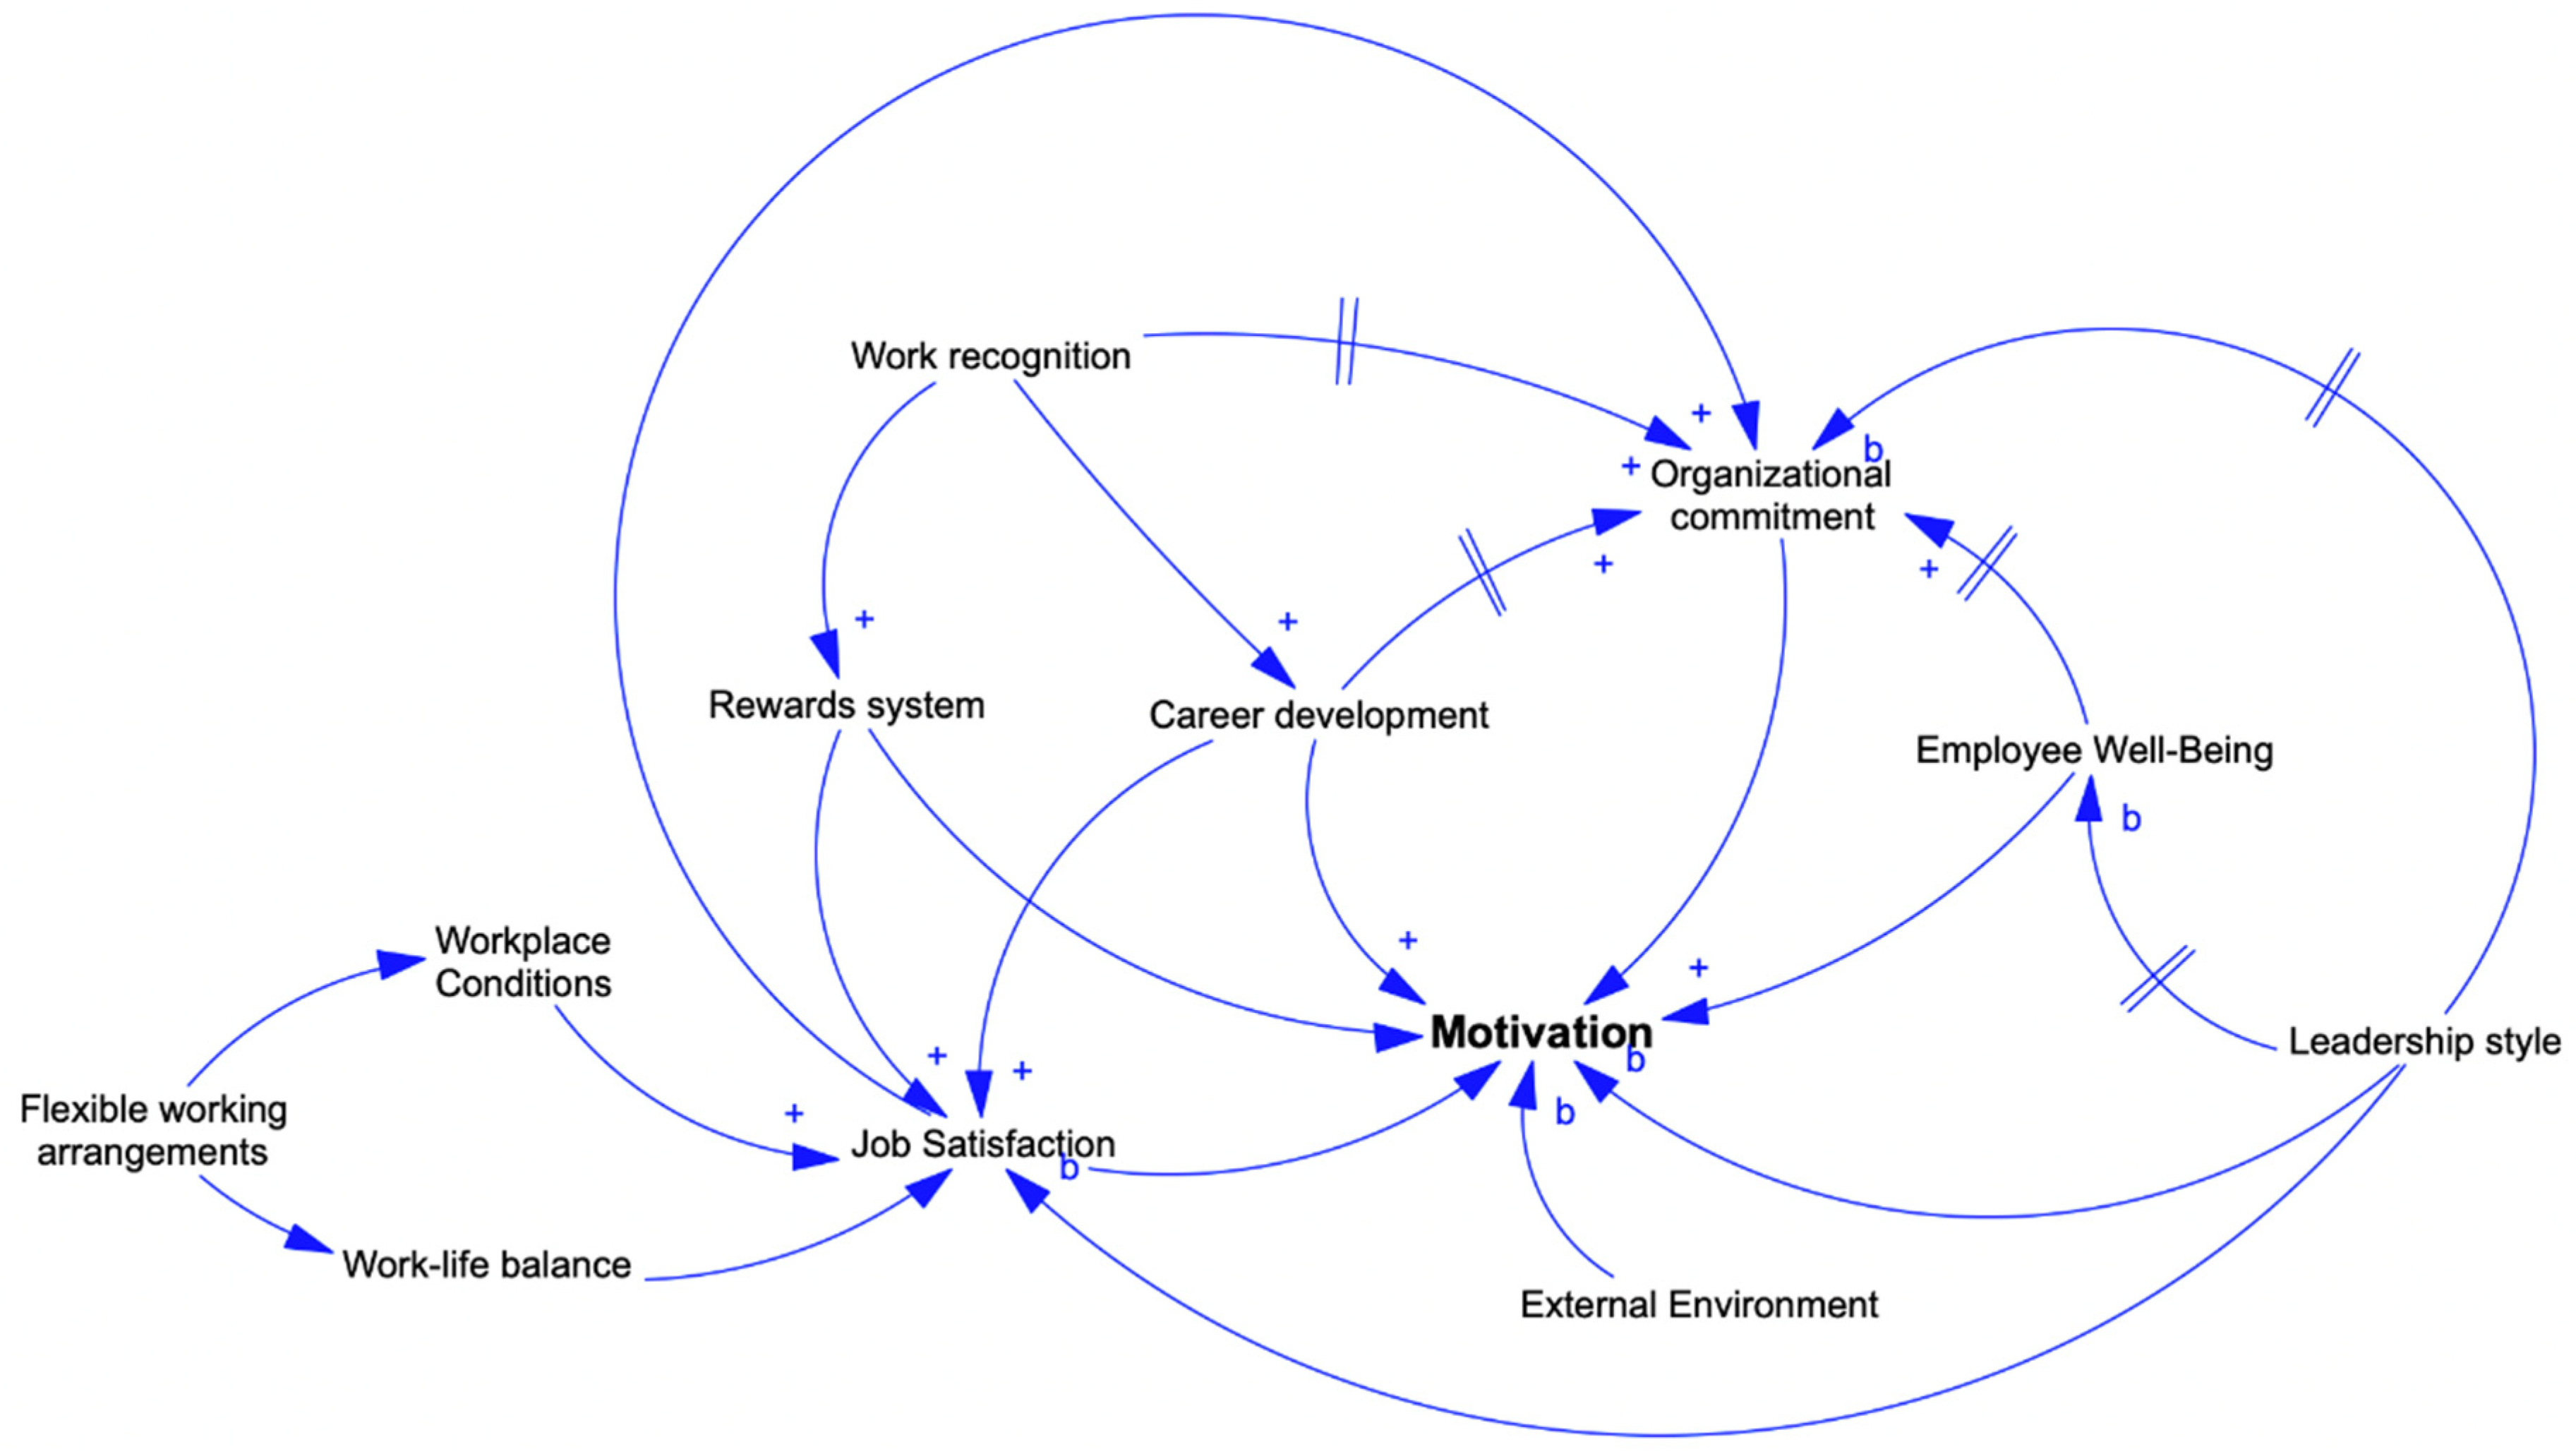
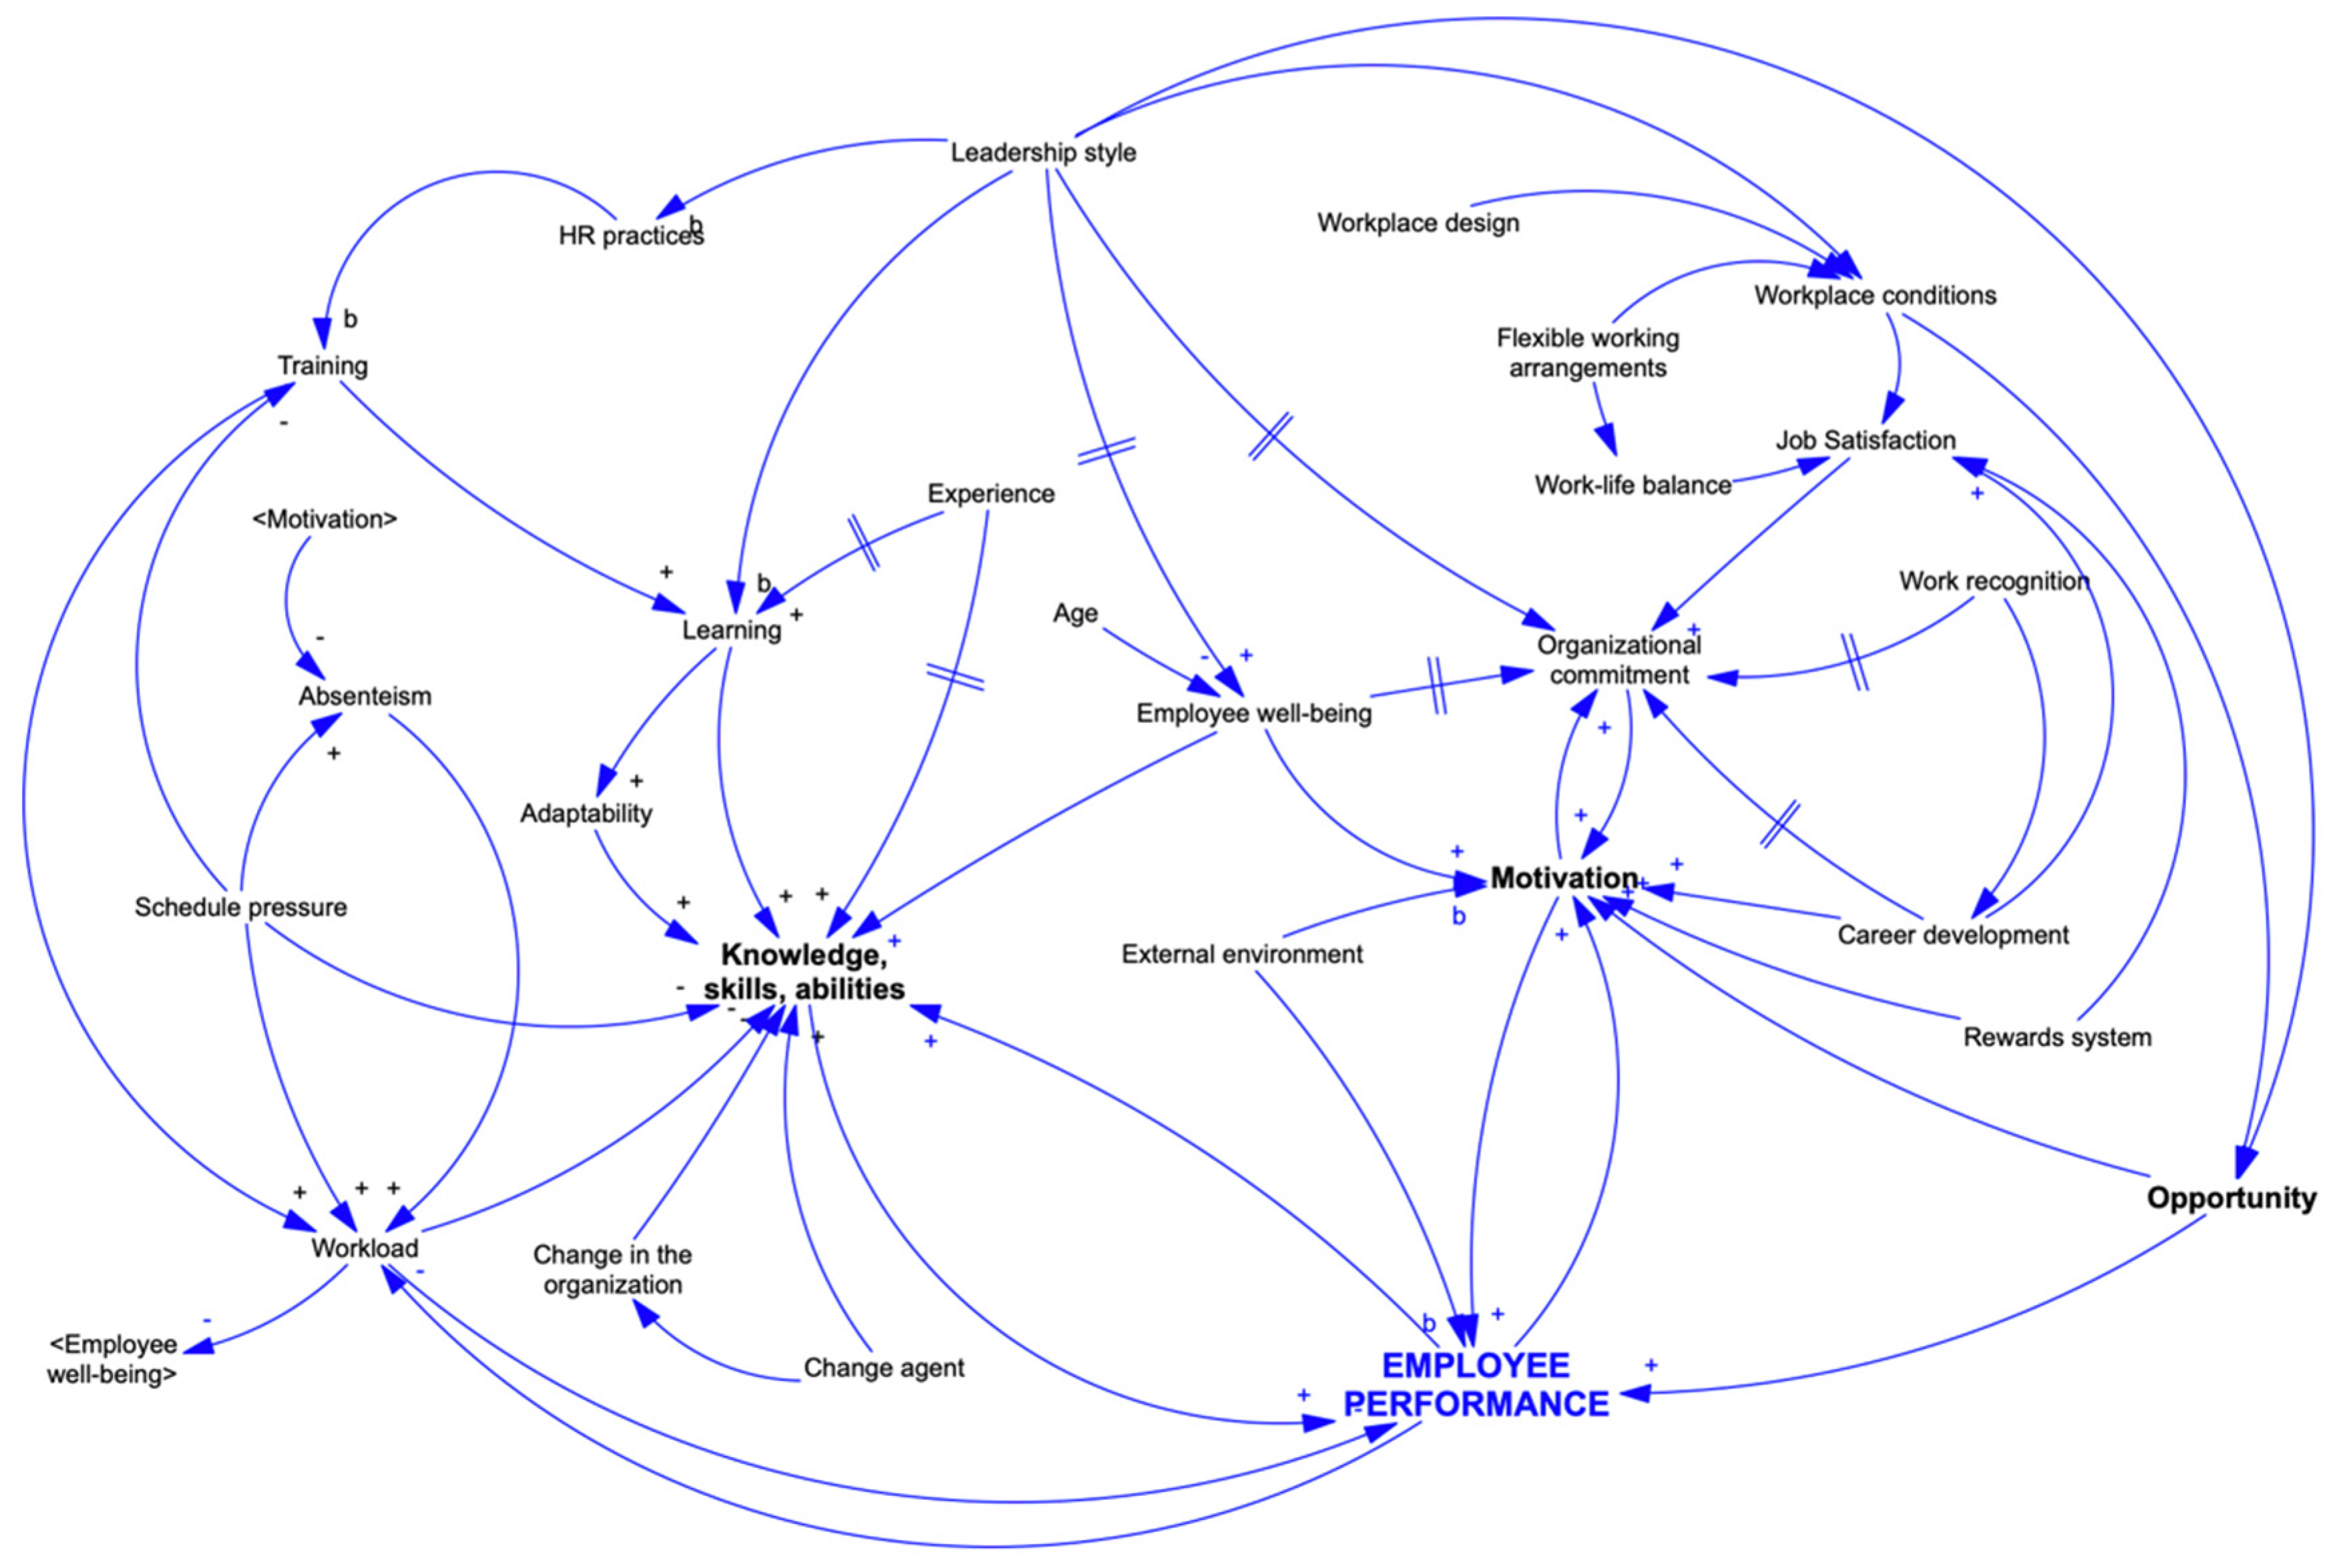
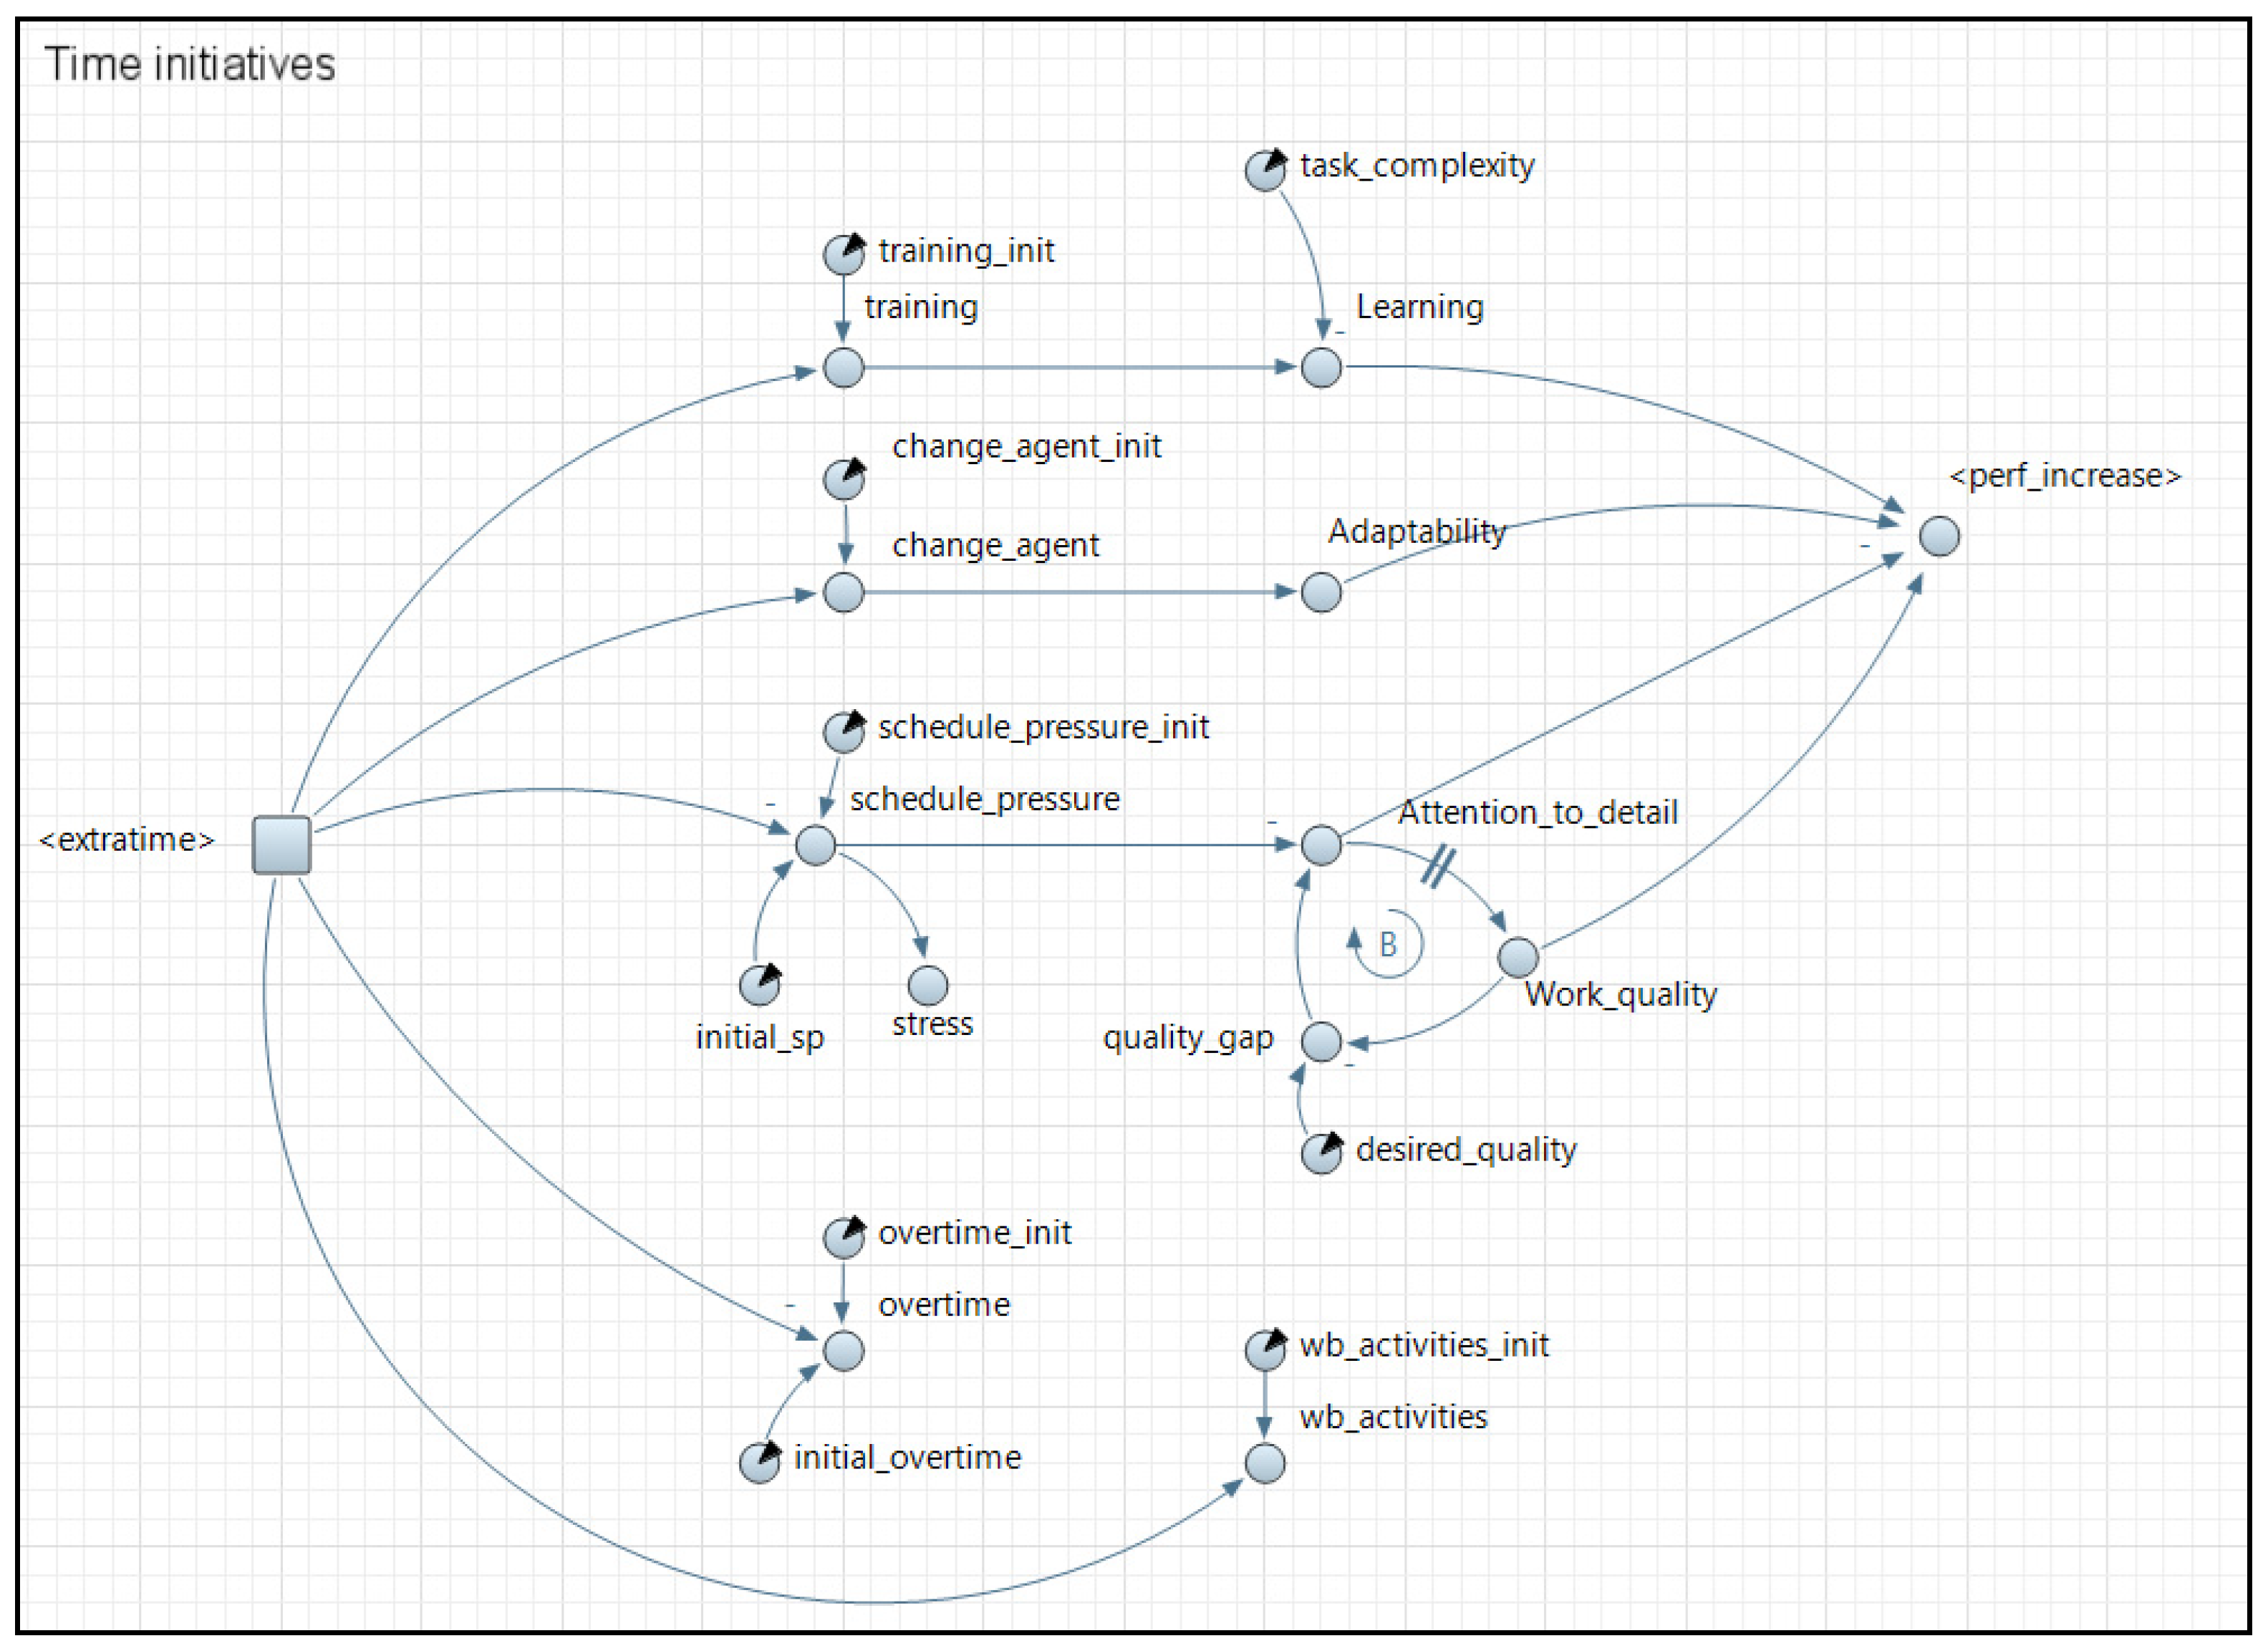
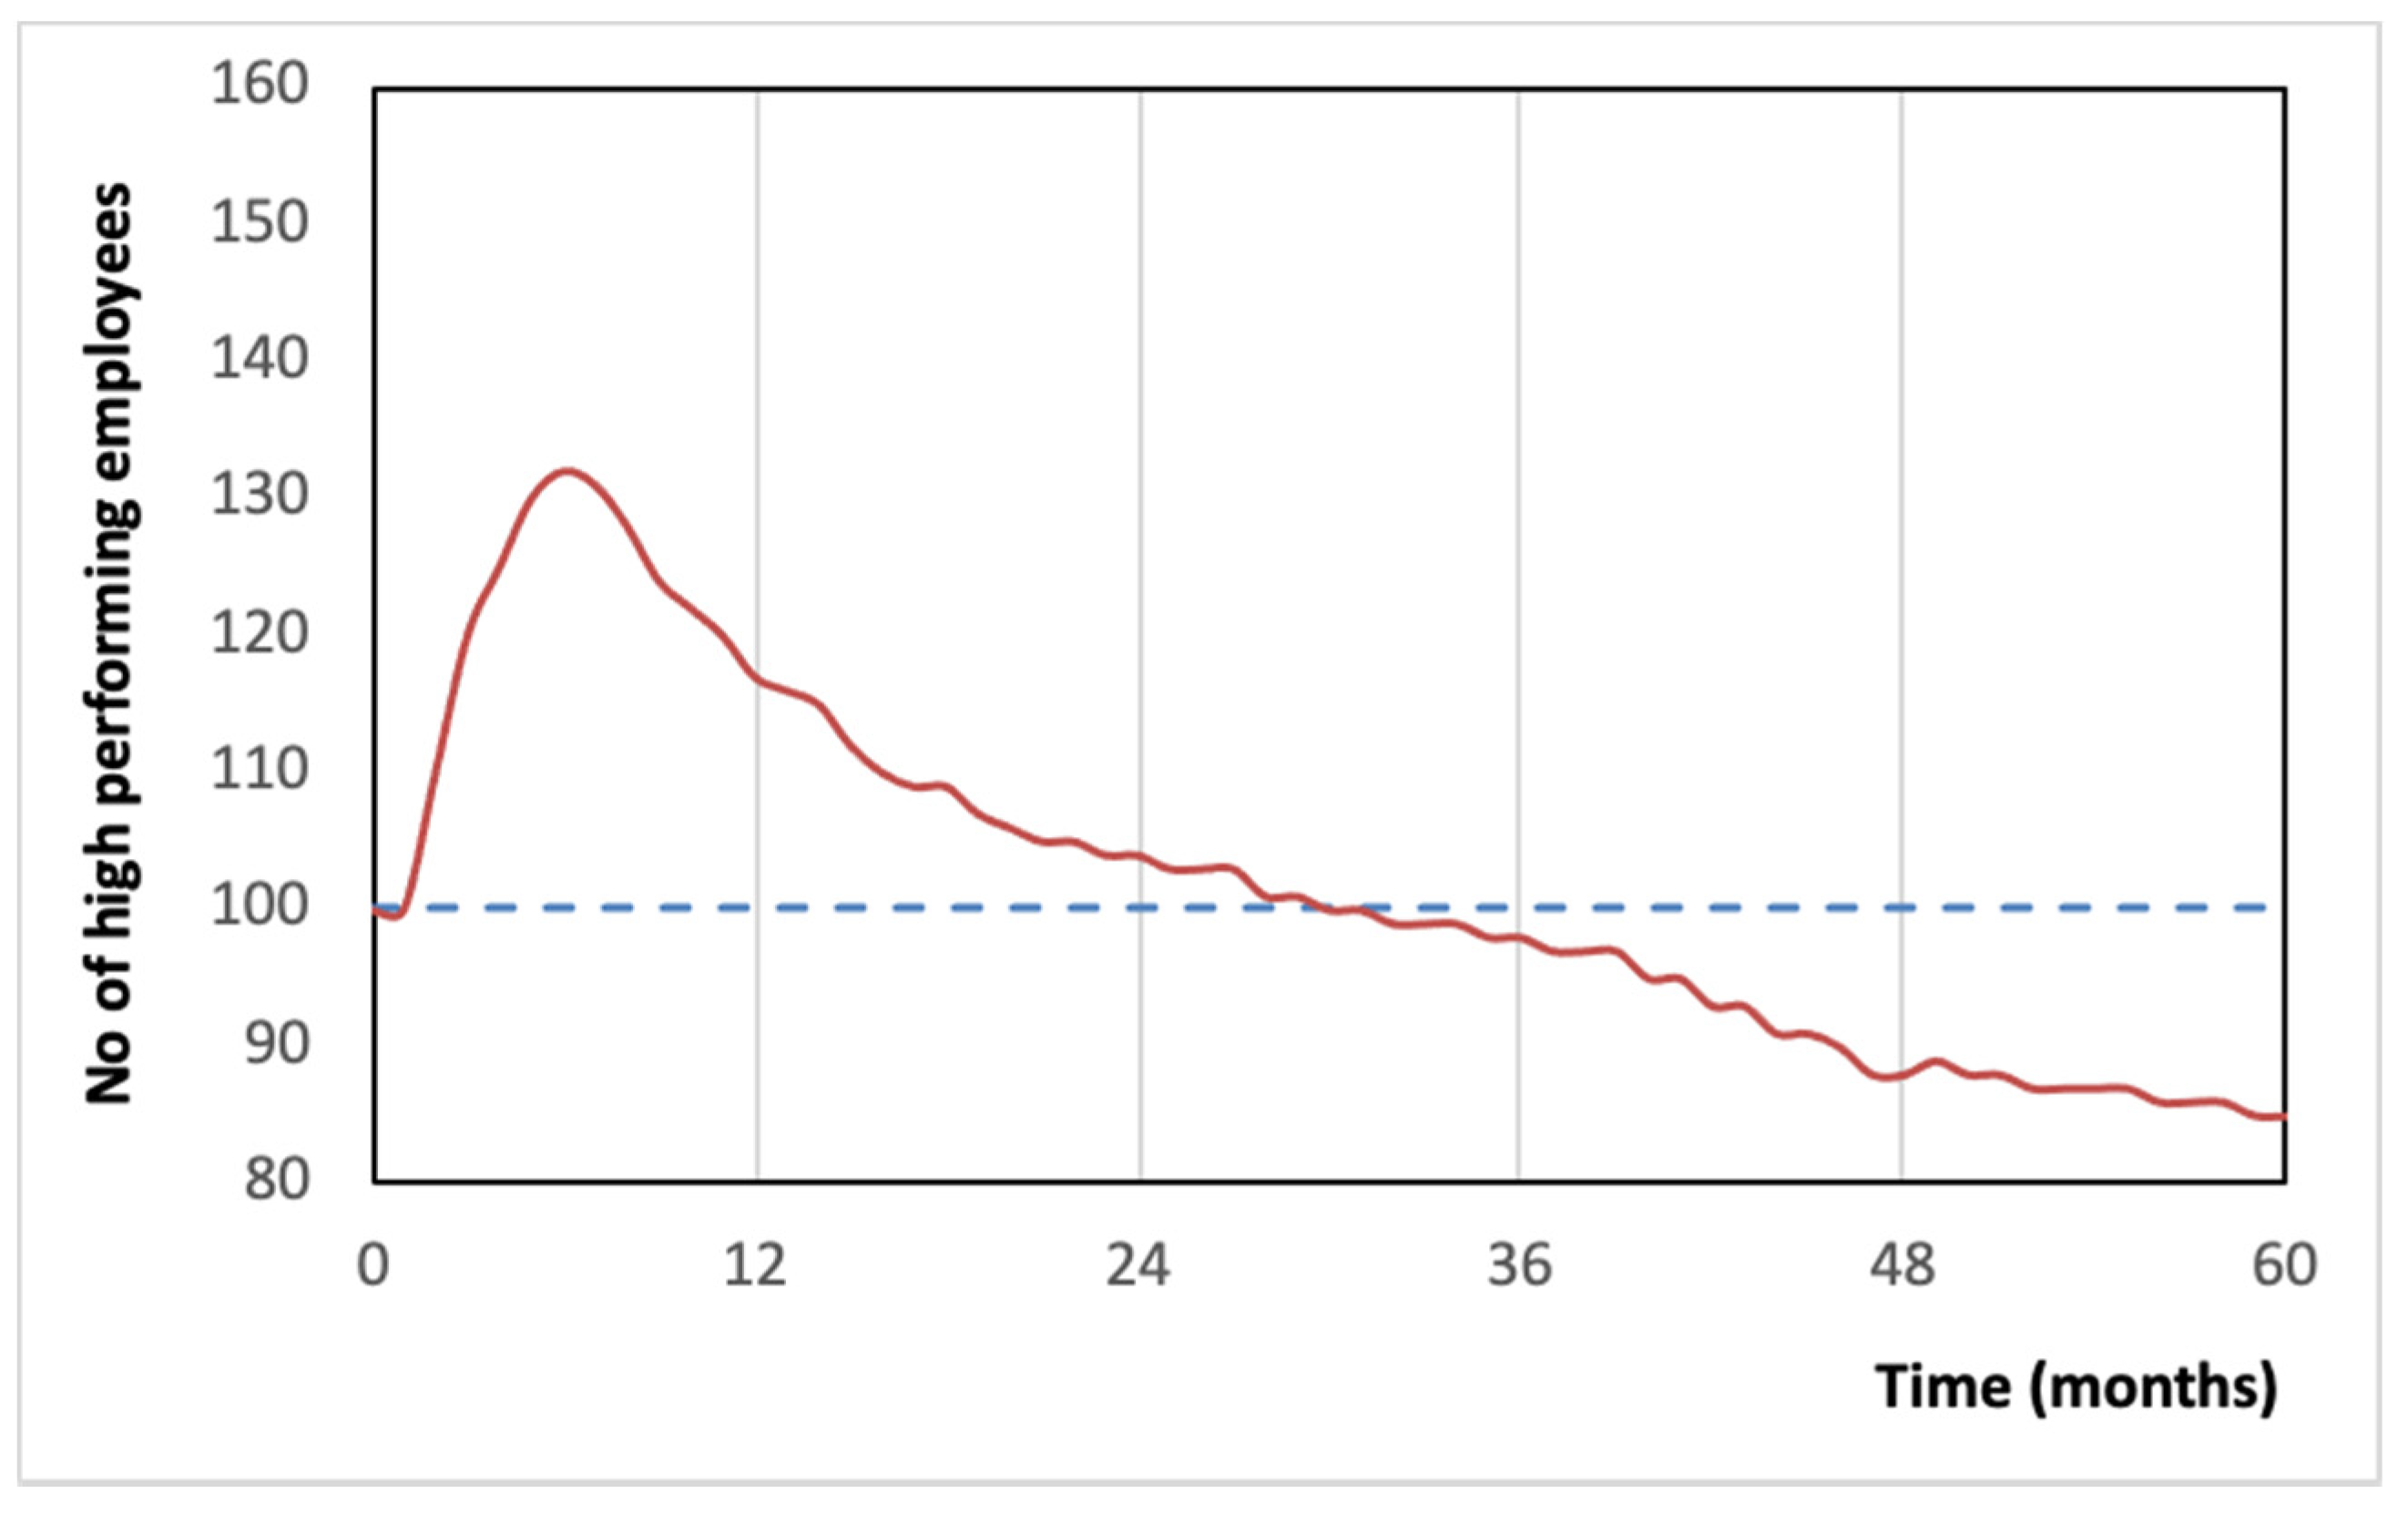
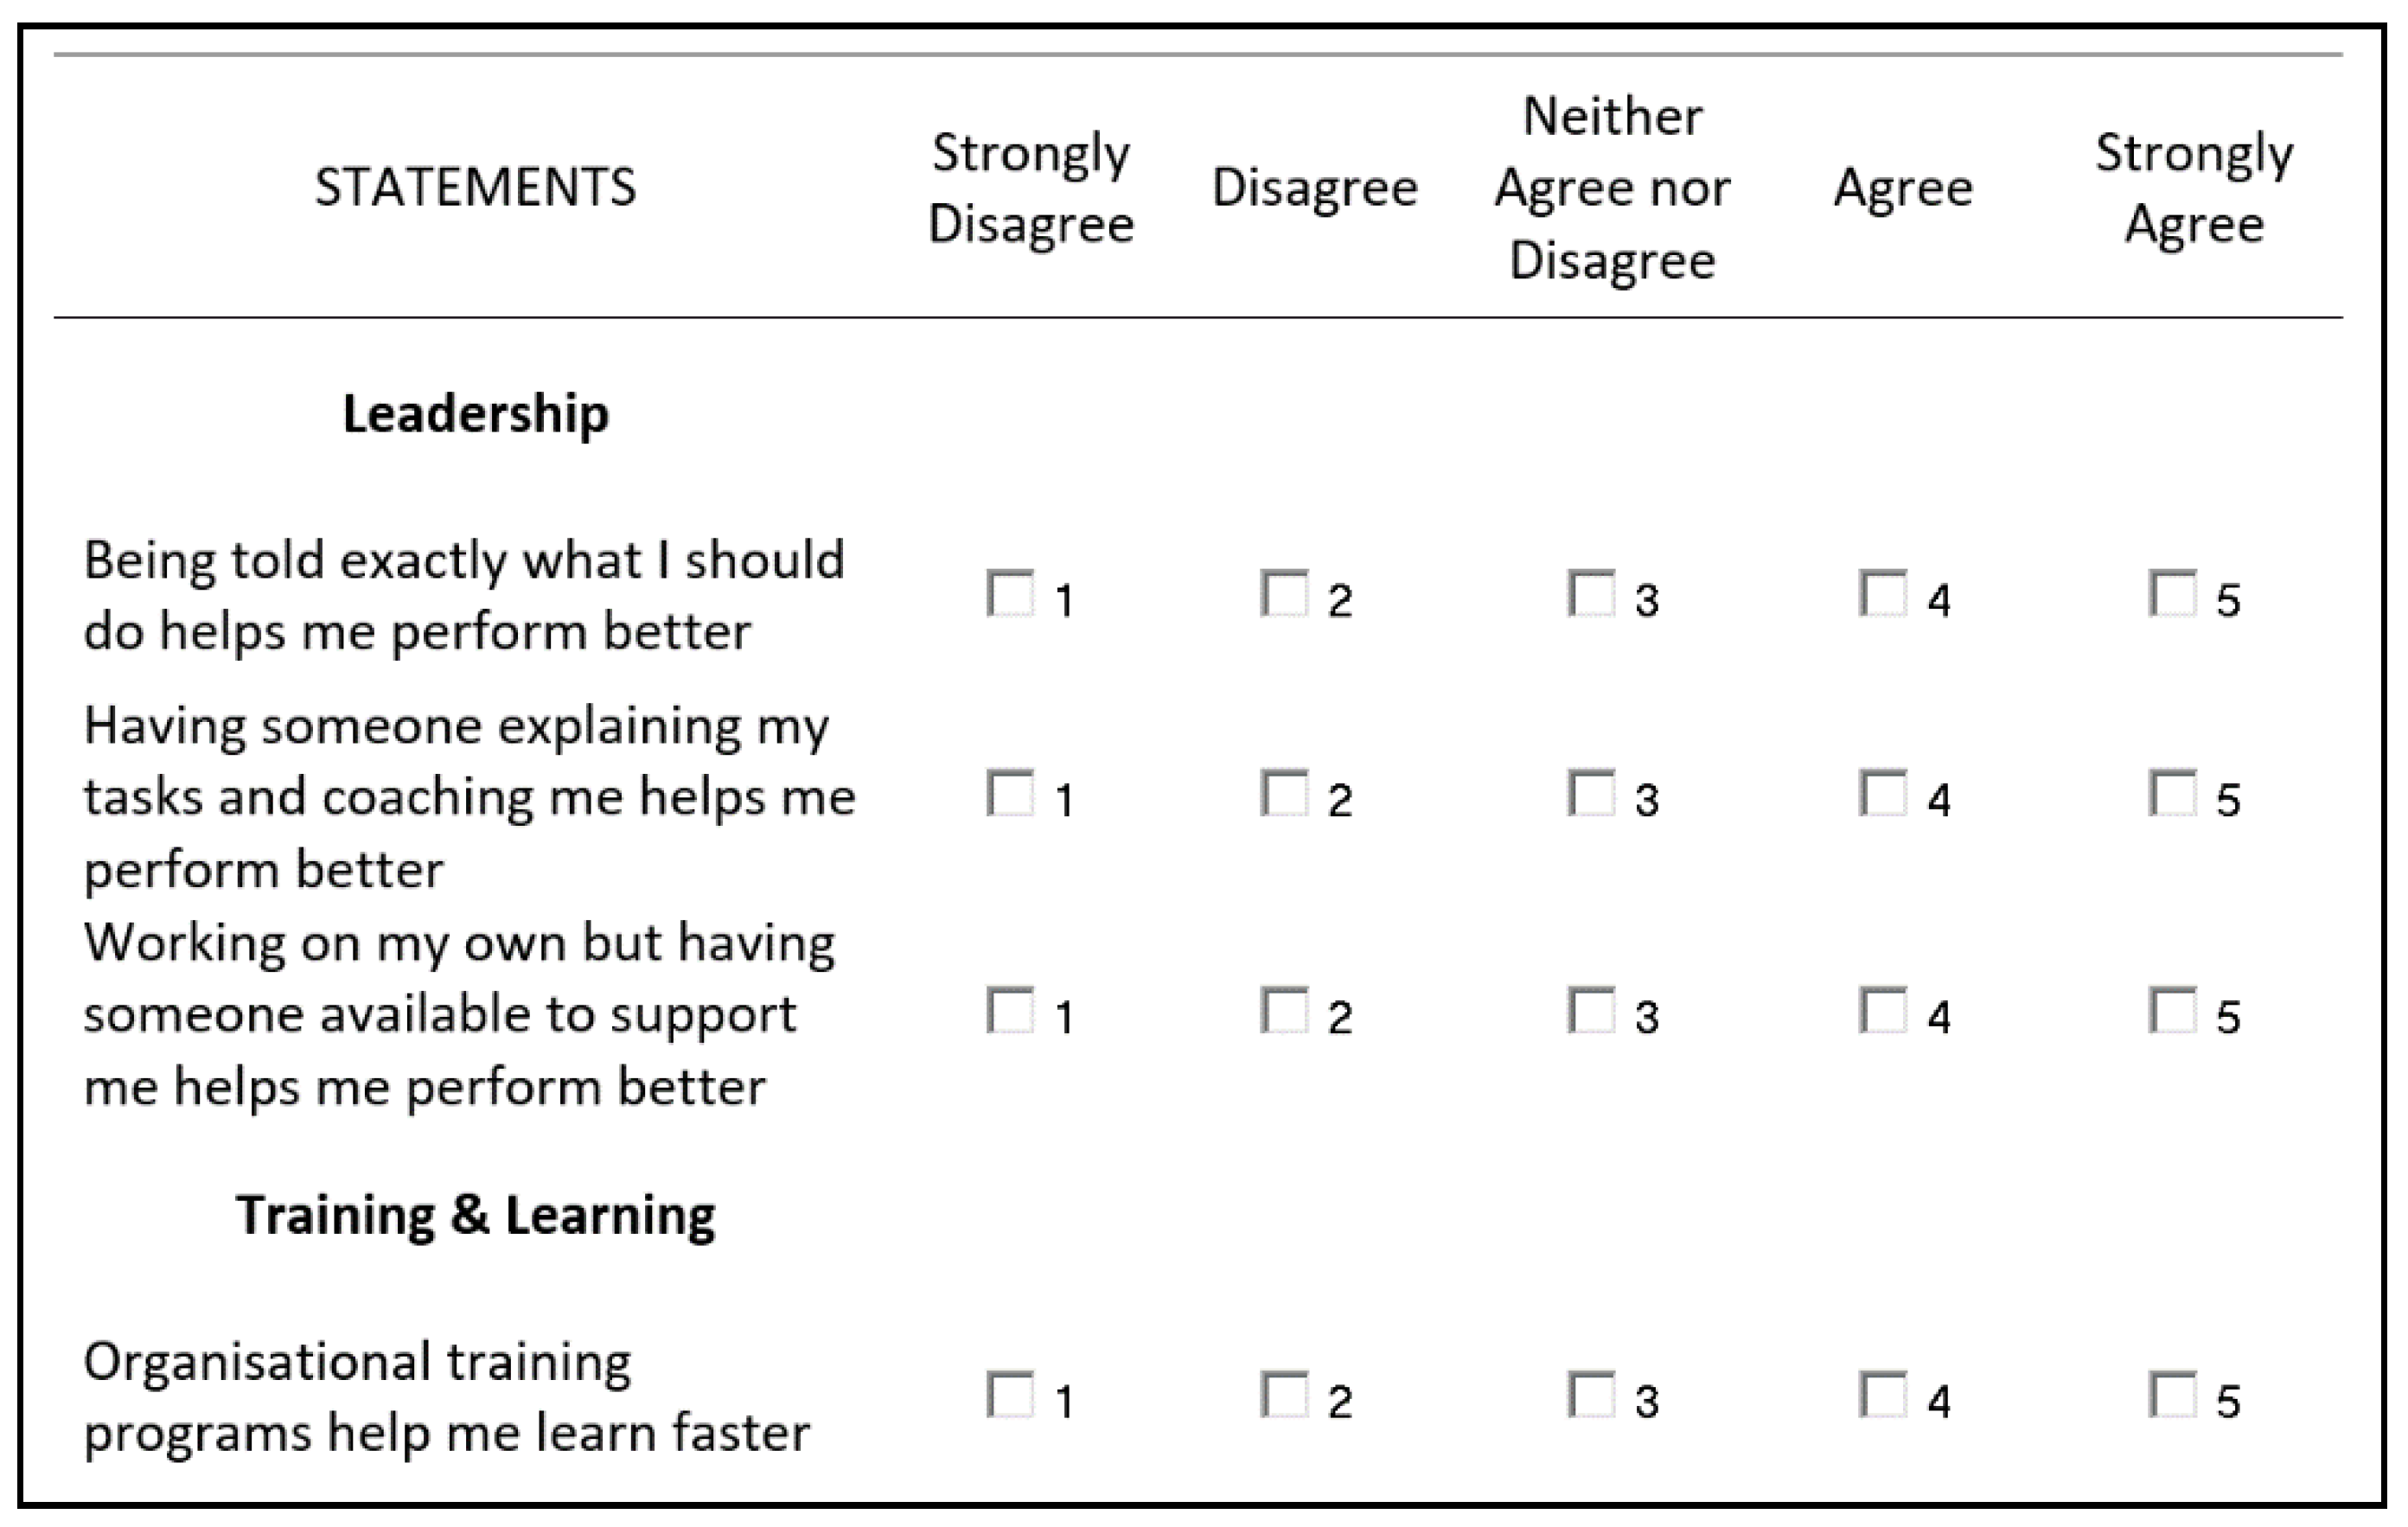
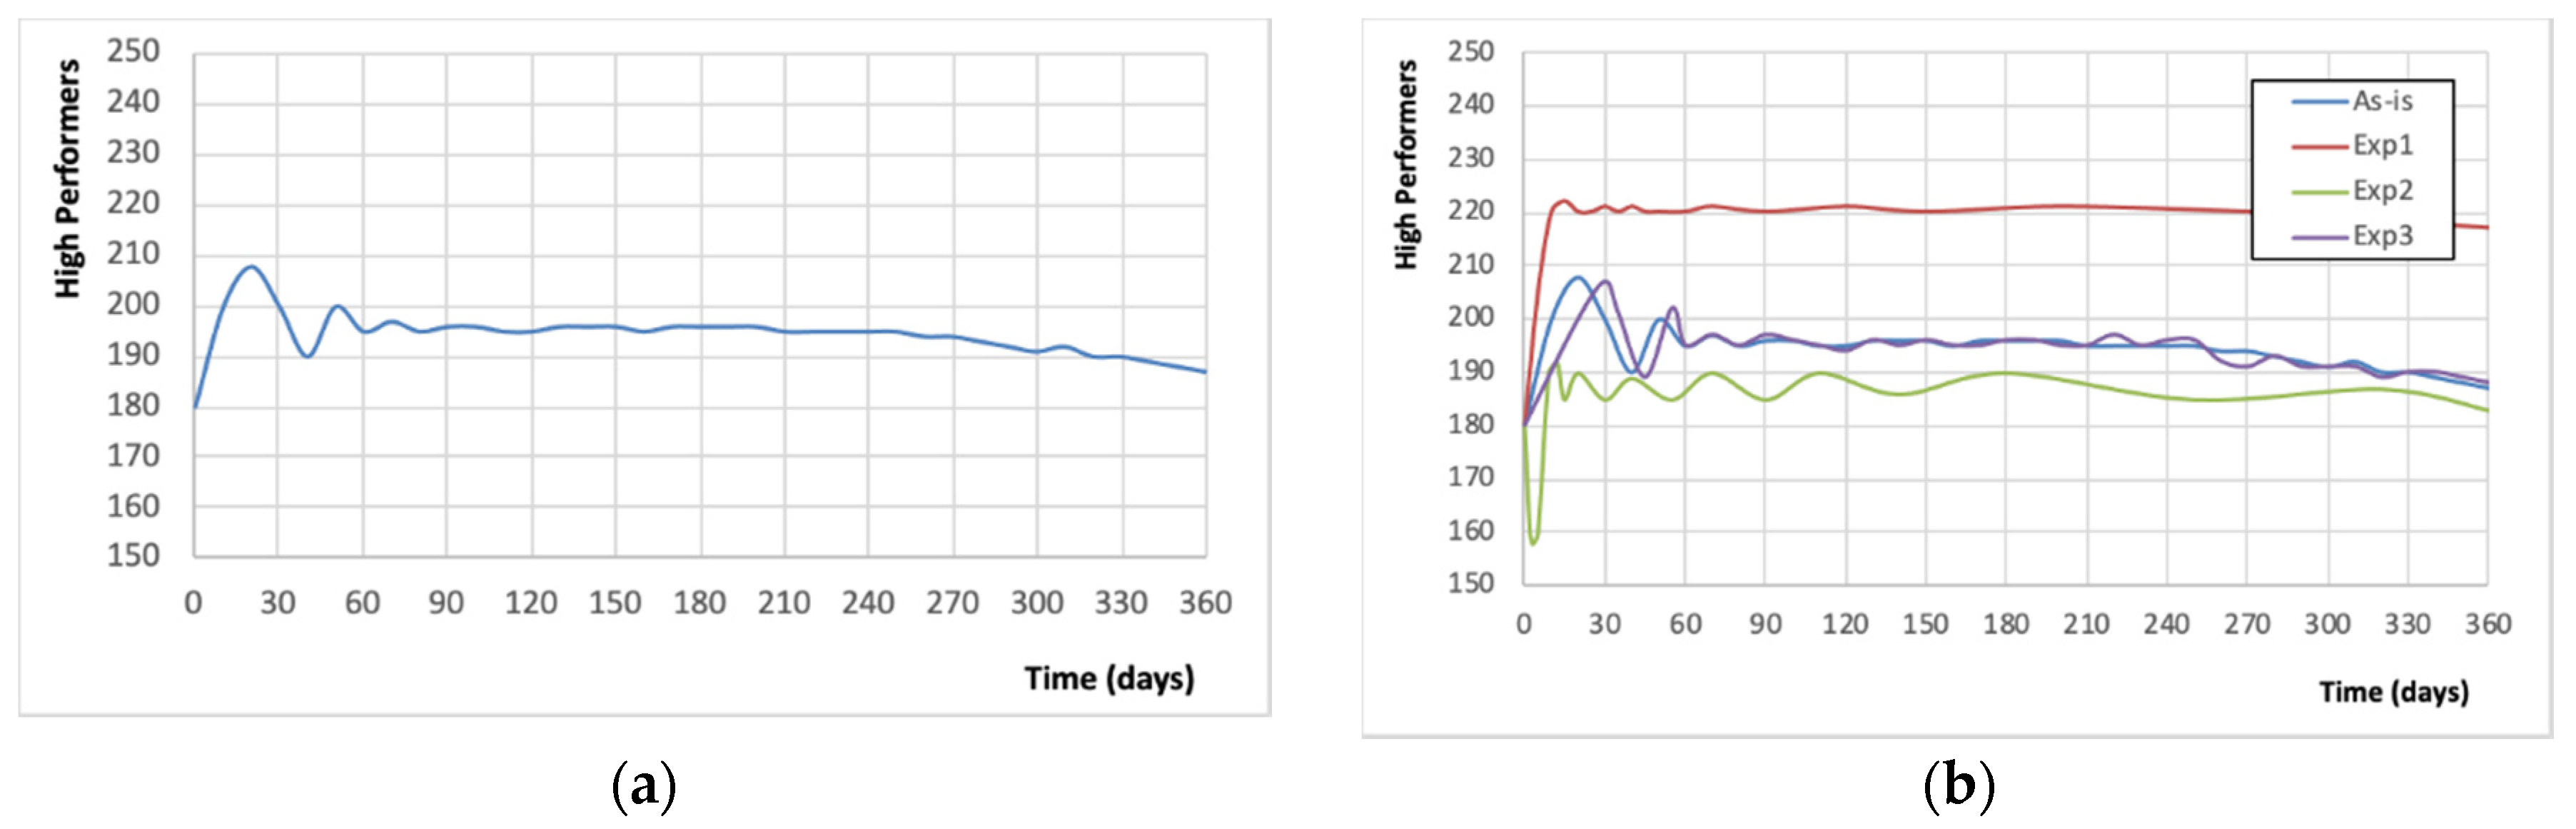
Table 1.
Factors affecting employee performance.
| Motivation | Employee Well-Being | Human Resource Practices | Training and Learning | Job Satisfaction | Leadership Style | Organization Commitment and Absenteeism | Organizational Culture | Employee Engagement | Reward System | Workplace Conditions | Career Development | Social Exchanges | Well-being Programmes | Work—Life Balance | Flexible Working Arrangement | External Environment | |
|---|---|---|---|---|---|---|---|---|---|---|---|---|---|---|---|---|---|
| Al-Dmour et al. (2018) [3] | X | X | X | X | X | ||||||||||||
| Almatrooshi et al. (2016) [4] | X | X | X | ||||||||||||||
| Anitha (2014) [5] | X | X | X | X | X | X | X | ||||||||||
| Atatsi et al. (2019) [6] | X | ||||||||||||||||
| Austen et al. (2013) [7] | X | X | X | ||||||||||||||
| Boehm et al. (2015) [8] | X | X | X | ||||||||||||||
| Brüggen (2015) [9] | X | X | X | X | |||||||||||||
| De Menezes and Kelliher (2016) [10] | X | X | X | ||||||||||||||
| Dhir and Shukla (2019) [11] | X | X | |||||||||||||||
| Diamantidis & Chatzoglou (2019) [12] | X | X | X | X | X | ||||||||||||
| Gul et al. (2012) [13] | X | ||||||||||||||||
| Hador (2016) [14] | X | X | X | X | |||||||||||||
| Heffernan and Dundon (2016) [15] | X | X | |||||||||||||||
| Hilda (2011) [16] | X | X | |||||||||||||||
| Juniper (2010) [17] | X | X | X | ||||||||||||||
| Karatepe (2013) [18] | X | X | |||||||||||||||
| Khoreva and Wechtler (2018) [19] | X | X | X | X | X | ||||||||||||
| Kia et al. (2019) [20] | X | X | X | X | X | X | |||||||||||
| Kim and Yoon (2015) [21] | X | X | X | ||||||||||||||
| Kundu et al. (2019) [22] | X | X | X | X | X | X | |||||||||||
| Lichtenthaler and Fischbach (2018) [23] | X | X | X | ||||||||||||||
| Maamari and Saheb (2018) [24] | X | X | |||||||||||||||
| Melián-González et al. (2015) [25] | X | X | X | X | X | X | |||||||||||
| Mensah (2015) [26] | X | ||||||||||||||||
| Otero-Neira et al. (2016) [27] | X | X | X | X | X | X | |||||||||||
| Paschal and Nizam (2016) [28] | X | X | |||||||||||||||
| Ramli (2019) [29] | X | X | X | X | X | ||||||||||||
| Alefari and Salonitis (2018) [30] | X | X | X | X | |||||||||||||
| Saleem et al. (2019) [31] | X | X | X | ||||||||||||||
| Salman and Hassan (2016) [32] | X | X | X | X | X | X | X | ||||||||||
| Siddiqui et al. (2019) [33] | X | X | |||||||||||||||
| Sihombing et al. (2018) [34] | X | X | X | ||||||||||||||
| Soomro et al. (2018) [35] | X | X | X | X | X | X | |||||||||||
| Sun (2016) [36] | X | X | X | ||||||||||||||
| Tetik (2016) [37] | X | X | X | ||||||||||||||
| Ye et al. (2019) [38] | X | X | X | ||||||||||||||
| Yilmaz (2015) [39] | X | X | X |
Table 2.
Virtual experiments/scenarios for case study.
| Scenario | |
|---|---|
| Exp.1 Modify the incentives in place |
|
| Exp.2 Saving resources |
|
| Exp.3 Saving resources while maintaining employee well-being (EWB) steady |
|
© 2020 by the authors. Licensee MDPI, Basel, Switzerland. This article is an open access article distributed under the terms and conditions of the Creative Commons Attribution (CC BY) license (http://creativecommons.org/licenses/by/4.0/).
Share and Cite
MDPI and ACS Style
Alefari, M.; Almanei, M.; Salonitis, K. A System Dynamics Model of Employees’ Performance. Sustainability 2020, 12, 6511. https://0-doi-org.brum.beds.ac.uk/10.3390/su12166511
AMA Style
Alefari M, Almanei M, Salonitis K. A System Dynamics Model of Employees’ Performance. Sustainability. 2020; 12(16):6511. https://0-doi-org.brum.beds.ac.uk/10.3390/su12166511
Chicago/Turabian StyleAlefari, Mudhafar, Mohammed Almanei, and Konstantinos Salonitis. 2020. "A System Dynamics Model of Employees’ Performance" Sustainability 12, no. 16: 6511. https://0-doi-org.brum.beds.ac.uk/10.3390/su12166511
Note that from the first issue of 2016, this journal uses article numbers instead of page numbers. See further details here.