Article

Spatiotemporal Dynamics and Driving Forces of Ecosystem Changes: A Case Study of the National Barrier Zone, China

1
College of Land Engineering, Chang’an University, Xi’an 710054, China
2
Shaanxi Provincial Key Laboratory of Land Engineering, Xi’an 710054, China
3
College of Earth Science and Resources, Chang’an University, Xi’an 710054, China
4
Research Centre for Eco-Environmental Sciences, Chinese Academy of Sciences, Beijing 100089, China
5
Economic Administration College of Beihua University, Jilin 132013, China
6
International Centre for Bamboo and Rattan, Beijing 100102, China
*
Authors to whom correspondence should be addressed.
Sustainability 2020, 12(16), 6680; https://0-doi-org.brum.beds.ac.uk/10.3390/su12166680
Submission received: 25 May 2020 / Revised: 29 July 2020 / Accepted: 16 August 2020 / Published: 18 August 2020

Abstract

:
It is of great significance to study the spatiotemporal dynamics of the ecosystem and explore the driving forces that affect change in the ecosystem in the National Barrier Zone (NBZ). Based on multi-source remote sensing data, this paper analyzed the change in the ecosystem in the NBZ from 2000 to 2015. Natural and social economic factors were selected as the driving factors, and the change mechanism of the ecological system in the NBZ area was analyzed by means of redundancy analysis and other methods. The results showed the following: (1) Between 2000 and 2015, the ecosystem changes in the NBZ are obvious. It is important to note that the grassland and urban ecosystem increased by 13,952 and 6720 km2, respectively; at the same time, the desert ecosystem significantly decreased by 4544 km2. (2) The human activity represented by gross domestic product (GDP) is the main factor in the change of ecosystem change in the NBZ with a contribution of 75%, especially in the ecological barrier of the Sichuan–Yunnan–Loess plateau with a GDP contribution rate of 83%. (3) The changes in the ecosystems are significantly influenced by multifactorial interactions, such as the joint contribution rate of the drought index (PDSI) and GDP reaching 0.11 in the ecological barrier of Qinghai–Tibet plateau. (4) The ecological protection projects, such as the Green for Grain Project in the NBZ, play a positive role, and the ecological environment is improving. The conclusions of this paper will be used as a basic theory to contribute to subsequent research on ecosystem services, policy making, and other aspects in the NBZ.

1. Introduction

Changes in the ecosystem are regarded as the basis for human survival and sustainable socioeconomic development [1]. Timely and accurate detection of changes in the ecosystem of Earth’s surfaces reflects the spatial distribution and structure relationship of various ecosystems [2] and provides a foundation for a better understanding of human–nature relationships and interactions [3]. Despite changes in the ecosystems having social and economic benefits, this dynamic and complex process usually has an unintentional interlocked multidimensional consequence upon Earth’s essential ecosystem functions and services at both small and large scales [4,5,6]. For instance, changes in the ecosystem have been shown to have negative impacts on the environment and social economy [7]. These consequences are particularly strong in fragile ecosystem areas [8].
In recent years, rapid population growth and extensive economic development have caused significant damage to the ecological environment of China [9]. Although the local ecological environment has improved after treatment and restoration, it is still fragile on the whole [10]. In order to improve the environment and prompt national ecological security, the Chinese government proposed to establish the main function division conceptual framework in 2016 [11]. Most experts and scholars, such as Fu Bojie, have conducted several studies to map out a test area based on the county boundary for specific implementation and experiments, and this area was called “Two ecological barriers and three shelters”, also known as the National Barrier Zone (NBZ) [11,12]. The NBZ is an important part of national ecological security and is composed of different compound ecosystems [13]; therefore, how to improve the ecological environment and adapt it to social and economic development to achieve sustainable development is an urgent problem that need to be solved [14]. Grasping the changes in the ecosystem from a macroscopic point-of-view is of great significance for analyzing the spatial distribution, spatial transformation, change process, and driving forces of the NBZ [8].
To date, the academic community has conducted several studies on the changes in the ecosystem and the driving factors; these studies have included a variety of ecosystems at different scales and a variety of driving forces, but have especially given more attention to socioeconomic factors and human activity [15,16,17,18,19,20,21,22,23,24,25]. In terms of theoretical research, the relationship among the changes in the ecosystem, the ecological security pattern, and ecosystem services has been discussed in detail [7,16,17]. In terms of research content, there are several practices: the changes in the ecosystem and ecosystem services under the influence of natural conditions and human intervention were analyzed [18,19]. Based on the changing state of ecosystem services, the trade-offs were further considered and incorporated into the policy decision-making system [20,21]. By analyzing the ratio of driving factors to the changes in the ecosystem, it was concluded that the main factors affecting the changes of the ecosystem in the Yangtze economic belt are urbanization and ecological protection and restoration [22]. The driving mechanism of the changes in Lugu Lake’s ecosystem was qualitatively analyzed based on landscape metrics, where research showed that the expansion of human settlements and the farmland ecosystem were the main driving factors of changes in the ecosystem [23]. Using the vegetation factor as an index, the quality change and driving force of the ecosystem in the Inner Mongolia Autonomous Region were analyzed via correlation analysis [24]. Research methods include indicator based tools [15], ratio analysis [22], correlation analysis [24], regression analysis [25], and other multisource remote-sensing data models.
However, it is difficult to accurately quantify the driving force when studying changes in the ecosystem. New techniques are continuously developed as powerful tools for improving the ecosystem pattern and driving mechanism results. Compared with other methods, redundancy analysis and variance analysis are sorting methods of regression analysis combined with principal component analysis, and redundancy analysis is also an extension of multiresponse regression analysis. These methods can not only quantify the independent contribution of each factor, but also rank the correlation between each factor [26].
Based on the current status, this paper finds that there are relatively few studies on the spatiotemporal dynamics and driving forces of changes in the ecosystem in the NBZ over a long period of time. To this end, our study takes the NBZ as a case study, adopts the redundancy analysis and variance analysis methods, analyzes the spatiotemporal dynamic and driving forces of the changes in the ecosystem from 2000 to 2015, explores the relationship among natural factors (precipitation, air temperature, vegetation coverage, vegetation net primary productivity, leaf area index, water production, and drought index), the socioeconomic factors (population, GDP) and the changes in the ecosystem. We believe that the conclusions of this paper will be used as a basic theory to enrich the depth of relevant research such as ecosystem services and ecological regionalization and provide some references for the government.

2. Materials and Methods

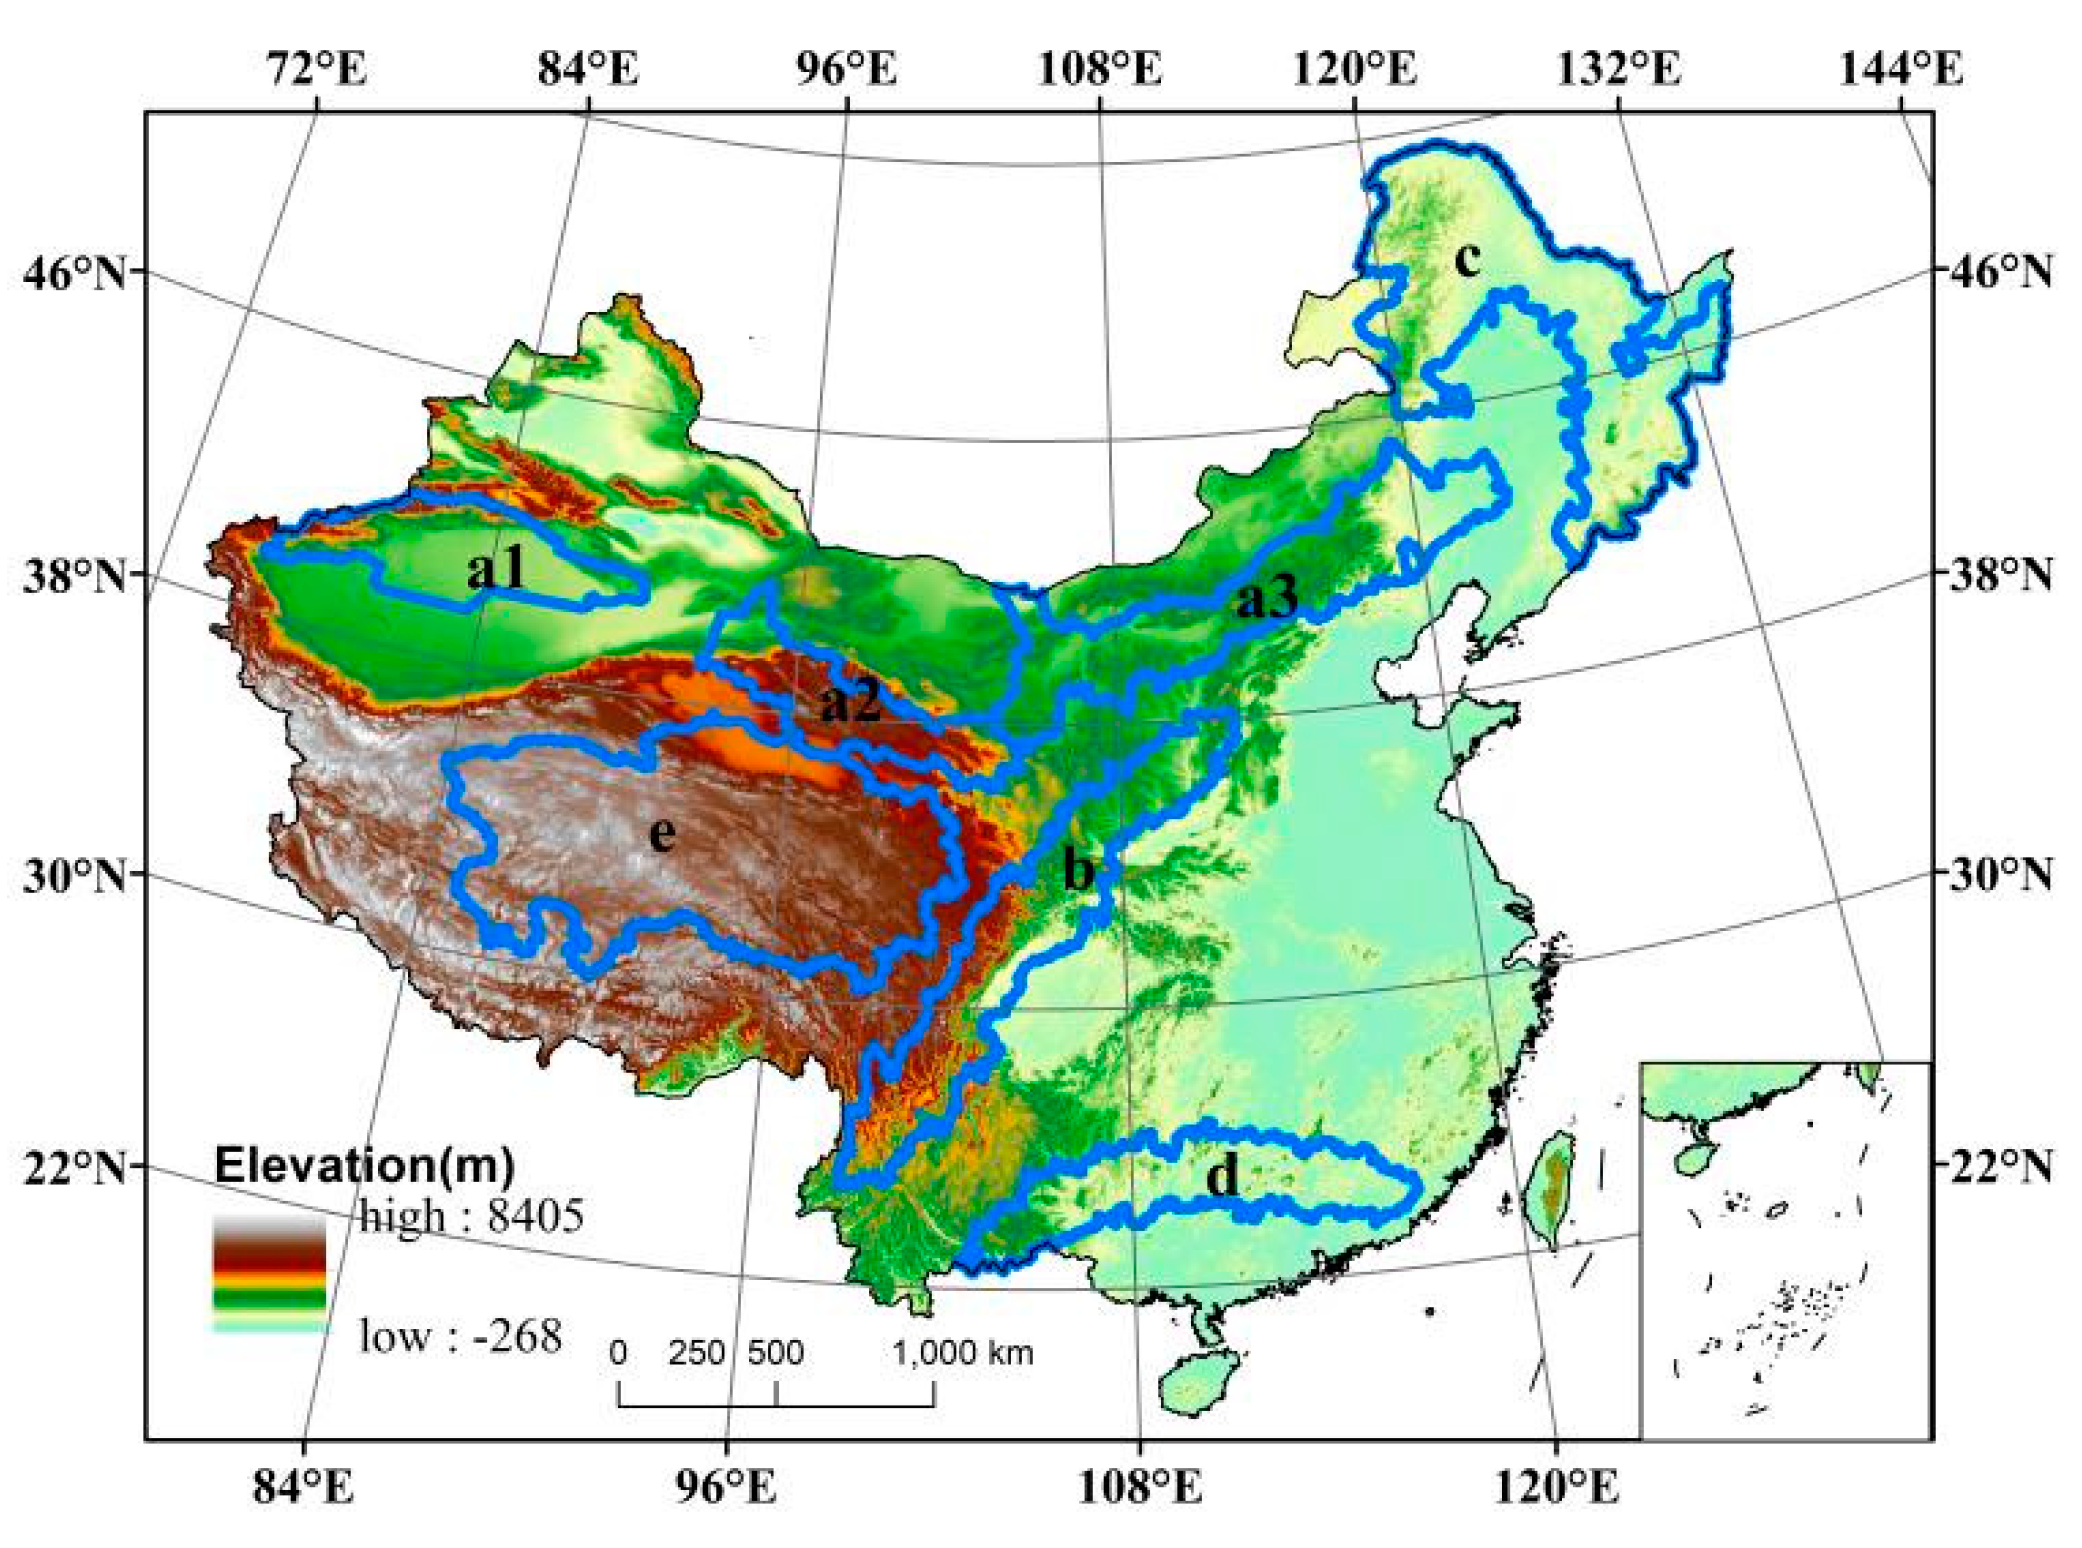
2.1. Study Area Overview

In recent years, the ecological environment of China has been fragile, trending towards overall deterioration and partial improvement [10]. In order to safeguard national security, the Chinese government proposed “Two ecological barriers and three shelters”, also known as the National Barrier Zone (NBZ), consisting of the ecological barrier of the Qinghai–Tibet plateau, the ecological barrier of the Sichuan–Yunnan–Loess plateau, the northern sand-prevention shelter, the northeast forest shelter, and the southern hilly and mountainous shelter (Figure 1).
The Qinghai–Tibet plateau is Asia’s water tower and plays an important role in global climate regulation. The region is also a sensitive area for global climate change response, and faces rapid glacier melting and grassland degradation. The ecological barrier of the Sichuan–Yunnan–Loess plateau is located near the Hu Line, which belongs to the environmentally fragile interlaced area of agriculture and animal husbandry, where the problems of soil erosion and vegetation degradation are very serious. The northern sand-prevention shelter includes three parts: the Tarim sand-prevention belt, the Hexi Corridor sand-prevention belt, and the Inner Mongolia sand-prevention belt, whose main functions are being windproof and providing sand-fixation and grassland protection. As an important forest resource and biodiversity conservation base in China, the northeast forest shelter plays an important role in water conservation and biodiversity conservation. As the watershed and source of the Yangtze River basin and the Pearl River basin, the southern hilly and mountainous shelter ensures the main function of the basin and plays an important role in protecting the ecological security of South China and Southwest China. It is of great significance to study the changes in the NBZ ecosystem and driving mechanism to improve the ecological environment and maintain national security.

2.2. Data Source and Preprocessing

Data on land use, population, and GDP were obtained from the Data Center for Resources and the Environmental Sciences of the Chinese Academy of Sciences (www.resdc.cn/) from 2000 to 2015, with a resolution of 1 km per five-year period. Referring to the third national land survey and land classification, this paper analyzes and determines the types of land use in the national barrier areas and establishes an ecosystem classification system, which is oriented to ecosystem services based on the previous research results of changes in the ecosystem [2,23]. The classification results include six ecosystems: the farmland ecosystem, which includes paddy fields and dry lands; the forest ecosystem consisting of woodland, shrub, and other woodlands; the grassland ecosystem consisting of grassland and desert steppe at various levels; the river ecosystem, consisting of rivers, lakes, permanent glaciers and snow fields, reservoirs, ponds, and beaches; the urban ecosystem, which includes urban land, rural residential areas, and other building sites; and the desert ecosystem, which includes sand, desert, bare soil, and rock. The precipitation and temperature data from 2000 to 2015 were obtained from the daily data set of the China surface climate data from the China Meteorological Data Network V3.0.
This paper adopted the professional meteorological interpolation software ANUSPLIN [27] with batch interpolation of the above national meteorological elements with a resolution of 1 km/d. The leaf area index was derived from the Gevo2 dataset (https://land.copernicus.eu/global/products/lai) and the drought index came from the global drought data set (http://climexp.knmi.nl/selectfield_obs2.cgi?id=someone@somewhere). The normalized vegetation index was derived from the GIMMS NDVI 3gv1.0 dataset (https://ecocast.arc.nasa.gov/data/pub/gimms), and the monthly data maximum was combined into an annual data set through batch processing. Net primary productivity and water production were respectively simulated by the CASA model and InVEST module and have been used to analyze ecosystem service tradeoffs and synergies in the NBZ [9]. Finally, the resolution of each driving factor was unified into 8 km after resampling.

2.3. Research Method

2.3.1. Transfer Matrix

The transfer matrix method is derived from the quantitative description of the system state and the state transfer in the system analysis, which can comprehensively and concretely describe the structural characteristics of regional land use change and the changing direction of each land use type [28]. The specific calculation method is as follows [29]:
C i × j = A i × j k × 10 × A i × j k + 1
In the formula, A i × j k and A i × j k + 1 represent the system types of the two periods, respectively, and C i × j refers to the system change matrix from period k to period k + 1 and represents the change types and spatial distribution of the ecosystem types.

2.3.2. Redundancy Analysis

Redundancy analysis (RDA) is a direct gradient analysis method, that is an extension of multiple linear regression; this method is mainly used to explore the relationship between univariate or multivariate variables and multivariate variables in a statistical way [26] and can independently maintain the contribution rate of each variable [30,31]. RDA is the projection of sample points onto a two-dimensional plane composed of two sorting axes to form a sorting diagram, which reflects the characteristics of variables through the scattered form of the sample points and the distribution in the quadrant [32].
In this paper, redundancy analysis was conducted under the Canoco4.5 software environment [33], and the correlation between the ecosystem and driving factors was calculated and analyzed by using the sequence diagram.

2.3.3. Analysis of Variance (ANOVA)

Various dependent variables and independent variables in complex systems are interrelated and mutually restricted. ANOVA is used to decompose the total variance into the variance of each component after data analysis in order to determine the mutual influence, significance, and optimal value of factors under complex conditions [34,35]. ANOVA is an effective method for analyzing the relationship between various environmental conditions and response variables in ecology [36]. In this study, the Vegan pack in RStudio was used for ANOVA [37] in order to decompose the purpose of decomposing the contribution rate of the redundancy analysis into an independent contribution rate of factors and the interaction between factors, and further quantitatively analyze the influence of driving factors on the changes in the ecosystem pattern.

3. Results

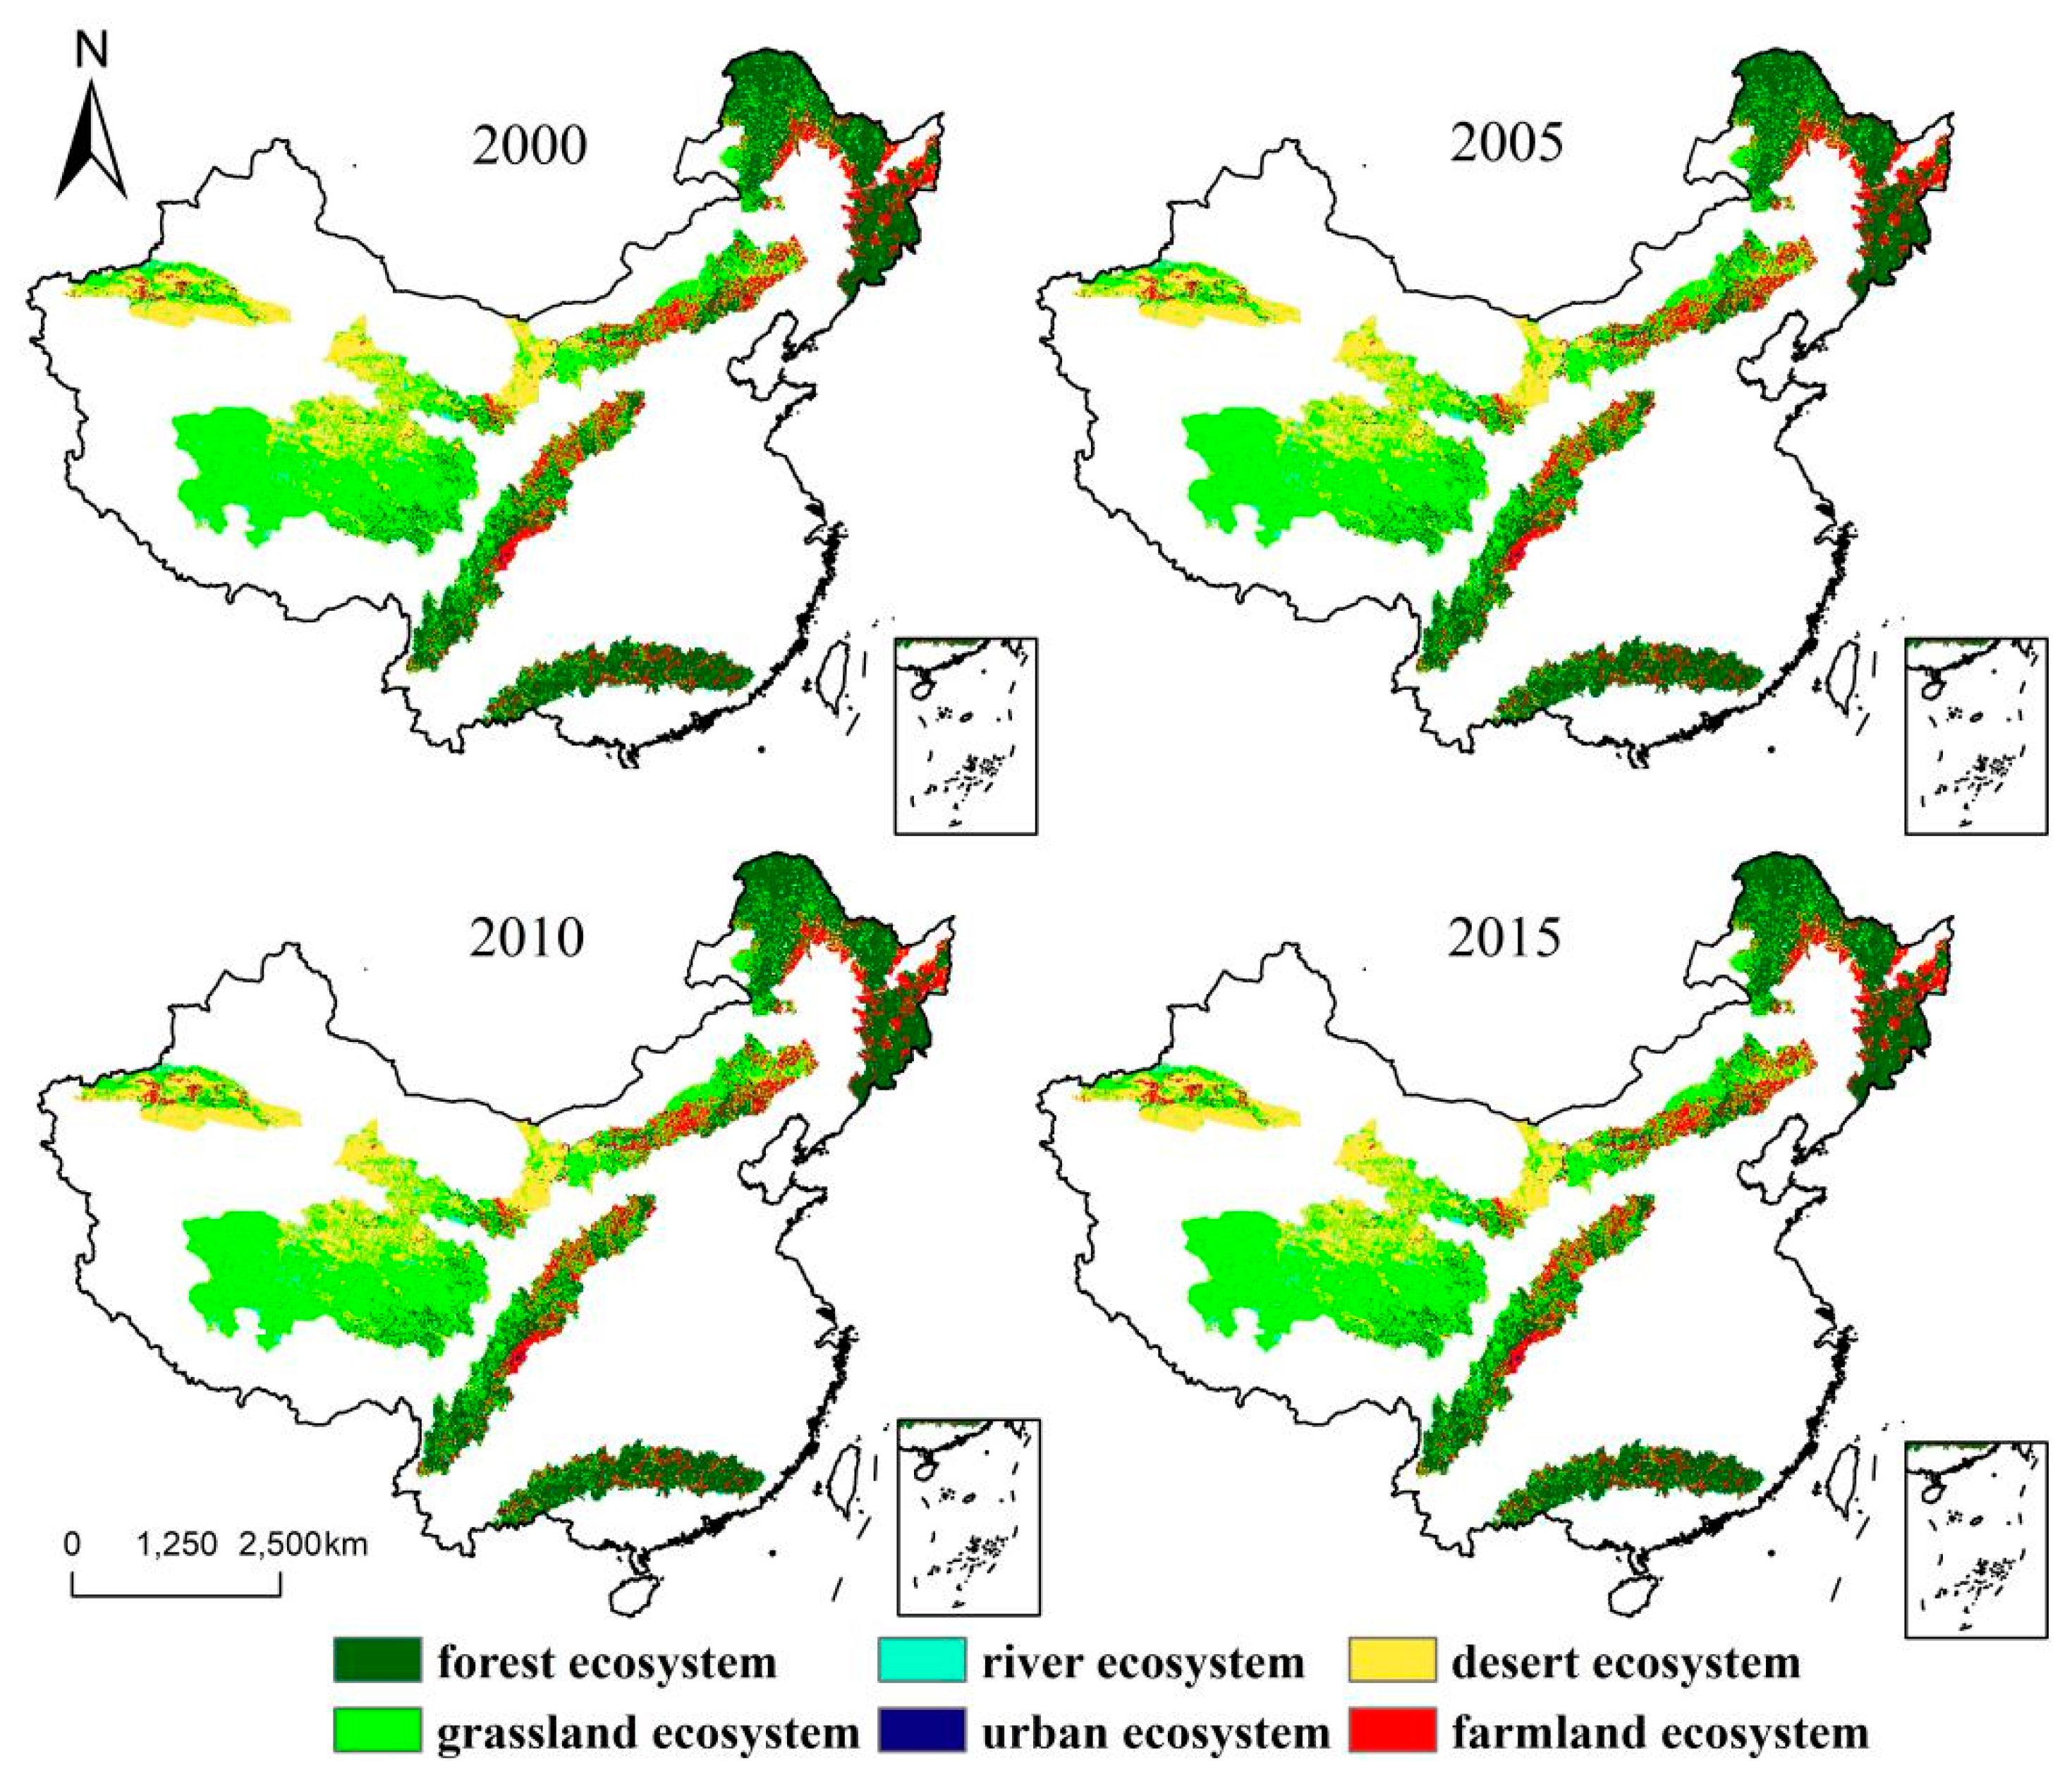
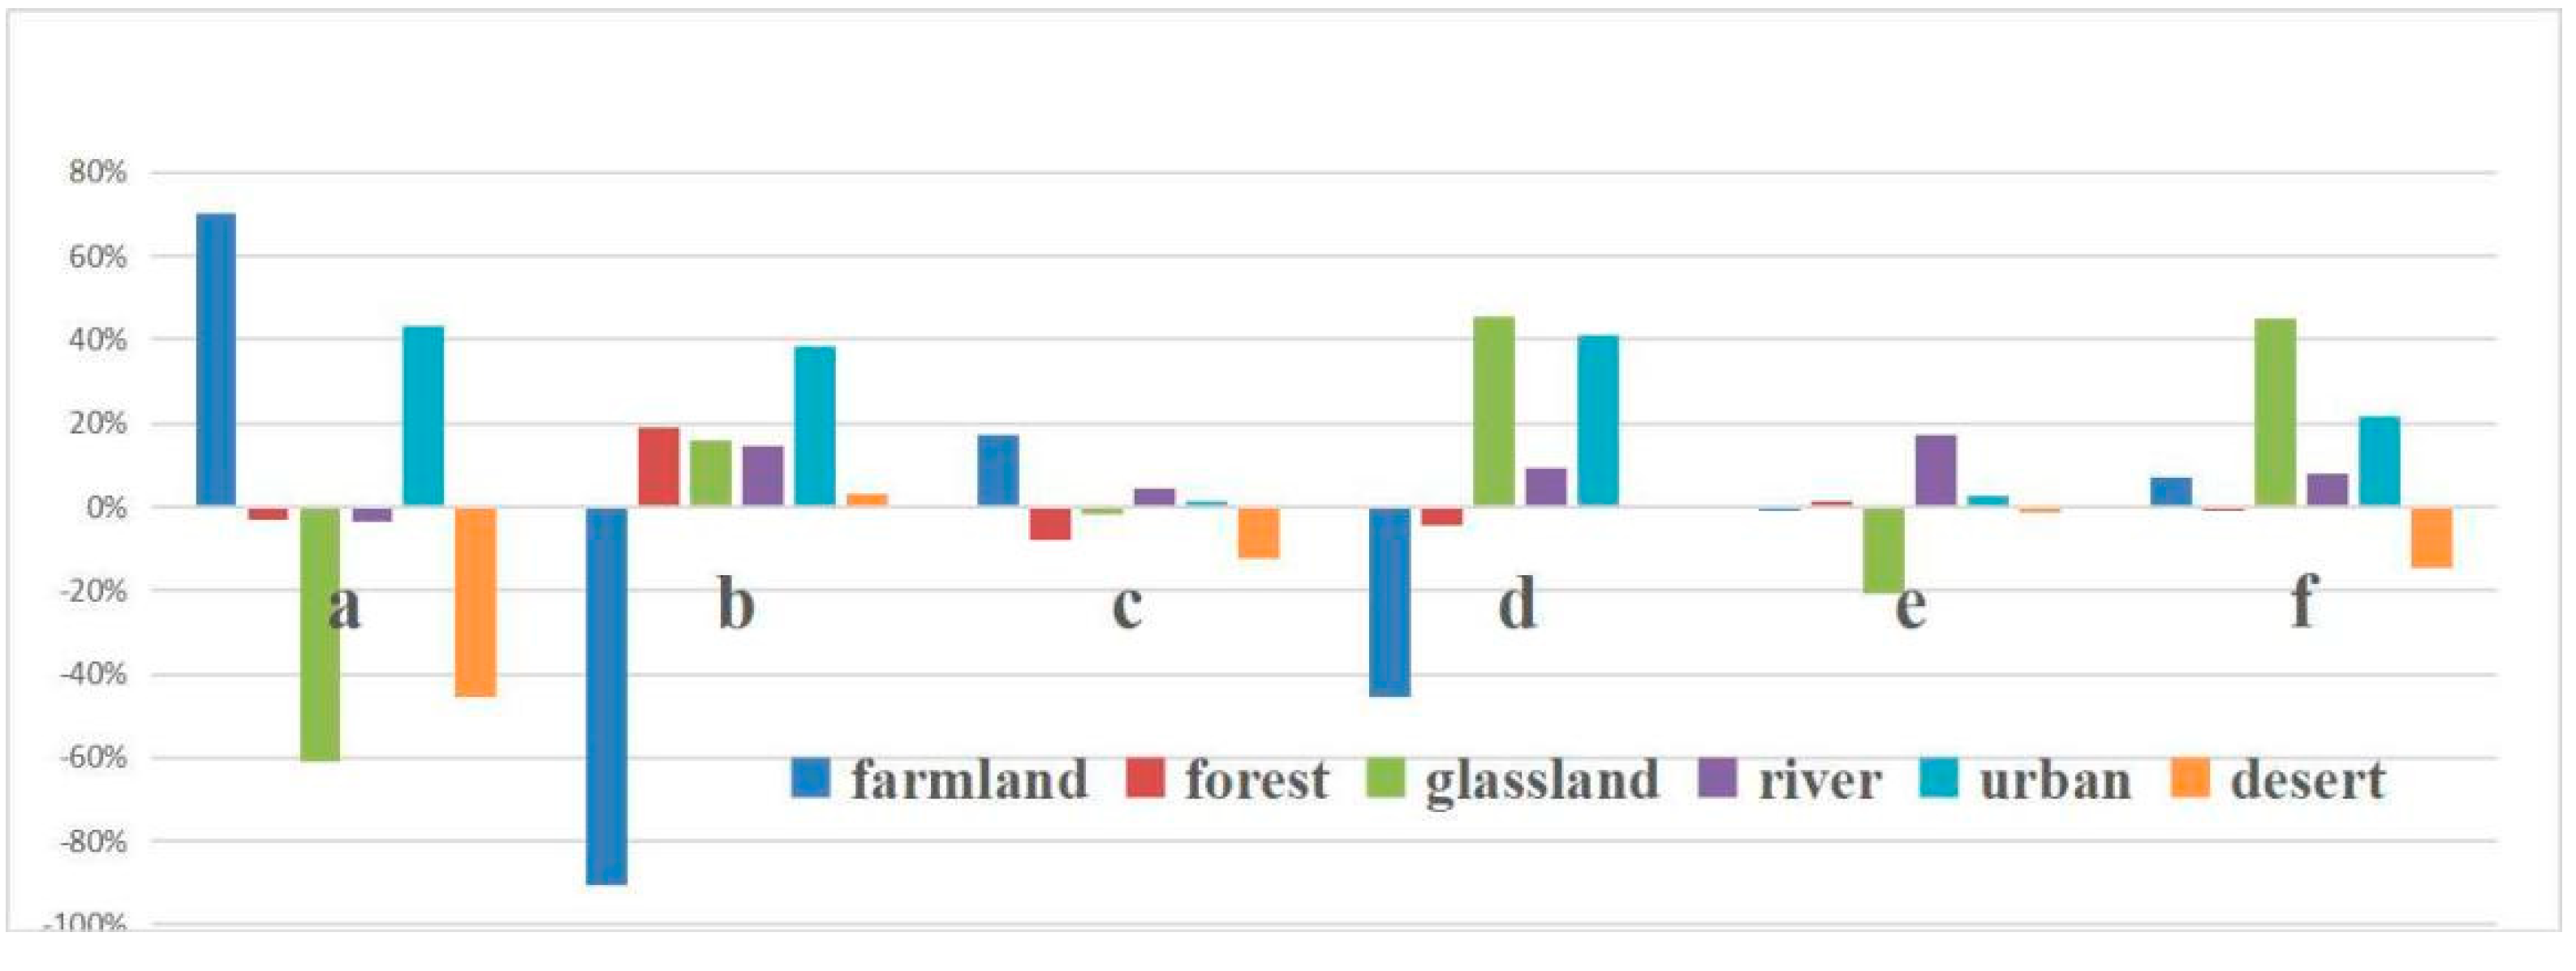
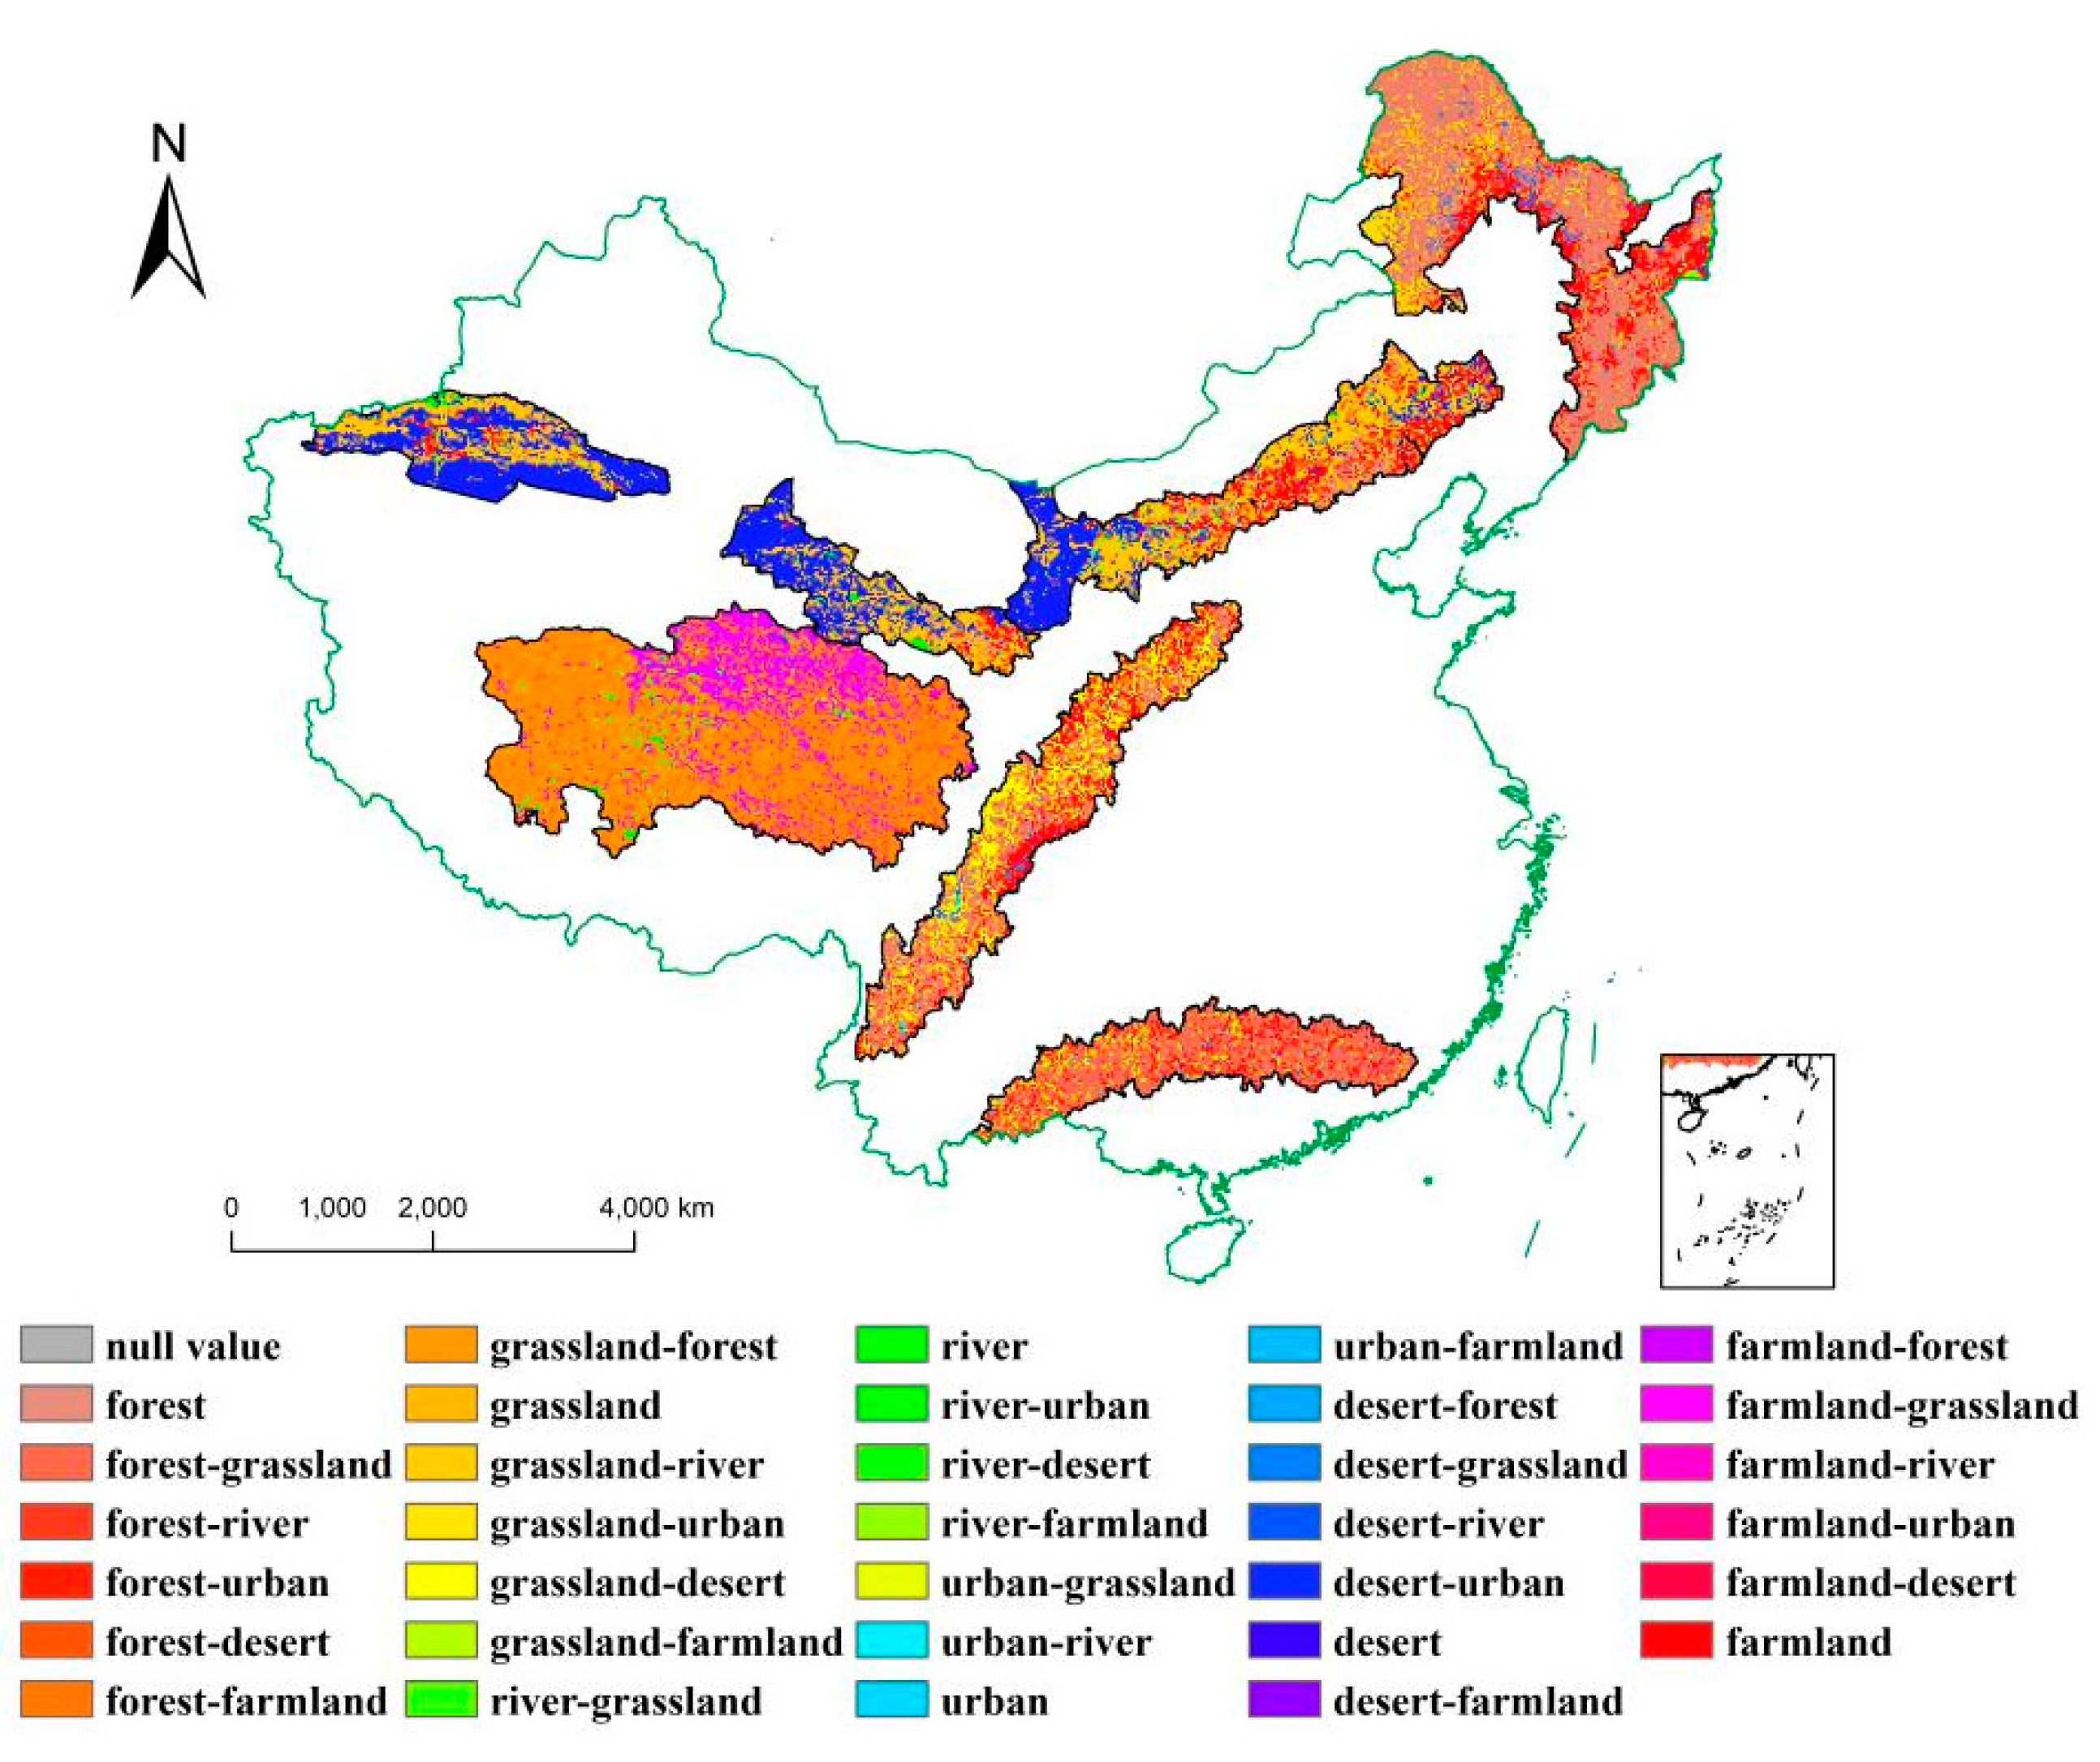
3.1. Changes in the Ecosystem Pattern in the National Barrier Zone

The largest proportion of the ecological system area in the NBZ is the grassland ecosystem and the forest ecosystem, accounting for approximately 39% and 27%, respectively. The grassland ecosystem is mainly distributed in the ecological barrier of the Qinghai–Tibet plateau, covering an area of 647,616 km2 and accounting for 52.79% of the total grassland ecosystem. The forest ecosystem is mainly distributed in the northeast forest shelter and the southern hilly and mountainous shelter, with areas of 388,032 and 191,616 km2, respectively. The river ecosystem is the most widely distributed in the ecological barrier of the Qinghai–Tibet plateau, accounting for 54% of the total river ecosystem. The farmland ecosystems are mainly distributed in the northern sand-prevention shelter and the ecological barrier of the Sichuan–Yunnan–Loess plateau, accounting for 31.2% and 25.4% of the total farmland ecosystem, respectively.
Between 2000 and 2015, the ecosystem of the NBZ changed significantly. The increase of grassland ecosystem is the most obvious, changing from 1,212,928 km2 in 2000 to 1,226,880 km2 in 2015, with an increase of 13,952 km2, accounting for 0.45%. The urban ecosystem increased by 6720 km2, increasing the ratio by 0.21%, so the urbanization process was accelerated. The farmland ecosystem and river ecosystem increased slightly, and the respective proportions of the increased area were 0.068% and 0.076%. The desert ecosystem decreased significantly; the area decreased by 4544 km2, and the area proportion decreased by 0.15%, mainly in the northeast forest shelter. The forest ecosystem remained basically unchanged, with a change range of less than 0.01%.
The NBZ ecosystem distribution from 2000 to 2015 is shown in Figure 2. There are significant differences in the changes in the ecosystem in different areas of the NBZ, as shown in Figure 3. The forest ecosystem increased within the ecological barrier of the Sichuan–Yunnan–Loess plateau, with an area of 768 km2, accounting for 0.19%, while the area within the northeast forest shelter decreased by 576 km2, accounting for 0.08%. The grassland ecosystem increased by 1280 km2 in the southern hilly and mountainous shelter, with an area increase of 0.45%, while the area in the northern sand-prevention shelter decreased by 5248 km2, with an area decrease of 0.6%. The ecological barrier of the Qinghai–Tibet plateau decreased by 1792 km2, with an area decrease of 0.21%. The farmland ecosystem in the ecological barrier of the Sichuan–Yunnan–Loess plateau decreased by 3648 km2, accounting for 0.1%; the area of the southern hilly and mountainous shelter decreased by 1280 km2, accounting for 1.66%. The area of the farmland ecosystem in the northern sand-prevention shelter increased by 6016 km2, accounting for 0.7%. The urban ecosystem in the ecological barrier of the Sichuan–Yunnan–Loess plateau increased by 1536 km2, accounting for 0.38%, mainly in the middle and north of the region. In the northern sand-prevention shelter, the area increased by 3712 km2, accounting for 0.43%. The desert ecosystem decreased by 3904 km2 and 0.45% in the northern sand-prevention shelter, and decreased by 768 km2 and 0.12% in the northeast forest shelter. The change in the river ecosystem was the most obvious in the ecological barrier of the Qinghai–Tibet plateau, where the area increased by 1600 km2, accounting for 0.17%, and in the ecological barrier of the Sichuan–Yunnan–Loess plateau, where the area increased by 576 km2, accounting for 0.14%.
The transition matrix analysis method was used to explore the transition relationship between ecosystems, as shown in Figure 4. The ecological environment in the NBZ was improved, with 1.54% of farmland ecosystems and 0.65% of desert ecosystems transferred to forest and grassland ecosystems, respectively. Thanks to the implementation of the policy of Grain for Green Project policy in this region, 0.66% and 1.32% of the farmland ecosystem in the ecological barrier of the Sichuan–Yunnan–Loess plateau were converted into forest ecosystem and grassland ecosystem, respectively. The encroach phenomenon in the northern sand-prevention shelter is obvious; that is, there is mutual flow between the desert ecosystem and other ecosystems. From 2000 to 2015, 0.81% of desert ecosystems was transferred to grassland ecosystems, while 0.58% and 0.29% of grassland ecosystems and farmland ecosystems were transferred to desert ecosystems, respectively. In addition, 1.17% of the farmland ecosystems was transferred to grassland ecosystems in the northern sand-prevention shelter to prevent and control desertification, which has had a significant effect. However, the desertification problem still cannot be ignored because of arid and semiarid climate conditions and long-term unsustainable land use (e.g., overgrazing, extensive rainfed herbaceous crops, woody crops, irrigated crops linked to groundwater exploitation) [38]. The distribution of river ecosystems in the barrier area is scattered, and what deserves high attention is that 1.32% of river ecosystems was transferred into desert ecosystems, especially in the northern sand-prevention shelter, accounting for 2.25%; therefore, water resources urgently need to be improved. It should also be noted that 1.12% and 1.45% of the farmland ecosystems in the northern sand-prevention shelter and the ecological barrier of the Sichuan–Yunnan–Loess plateau have been separately transferred to urban ecosystems, increasing urbanization and obvious expansion of the building land.

3.2. Driving Mechanism of Changes in the Ecosystem in the National Barrier Zone

The complex driving mechanism of changes in the ecosystem is composed of natural and socioeconomic factors. Among them, natural conditions such as climate and water resources are the constraints and conditions caused by changes in the ecosystem, and human activities are the main reason affecting changes in the ecosystem [39].
In this paper, temperature and precipitation, which are the representative factors of the natural environment, are selected, and the drought index and water yield, calculated by the combining temperature and precipitation models are taken as supplements. The influence of natural factors on the changes in the ecosystem in the NBZ is quantitatively analyzed based on three factors: vegetation coverage, net primary productivity, and the leaf area index. The social and economic factors that affect ecosystem change can be divided into direct factors and indirect factors. The former includes population change, technological development, economic growth, and political and economic policies. The latter includes urbanization degree, land use intensification degree, land ownership, and land input [40]. Due to the special geographical location of the NBZ, the data are difficult to obtain, and the political and economic policy, land ownership, and other indicators are difficult to quantify; therefore, we ultimately selected the population and GDP to quantitatively study the impact of social and economic factors on changes in the ecosystem. Based on the above nine factors, this study explores the driving mechanism of changes in the ecosystem in the NBZ.

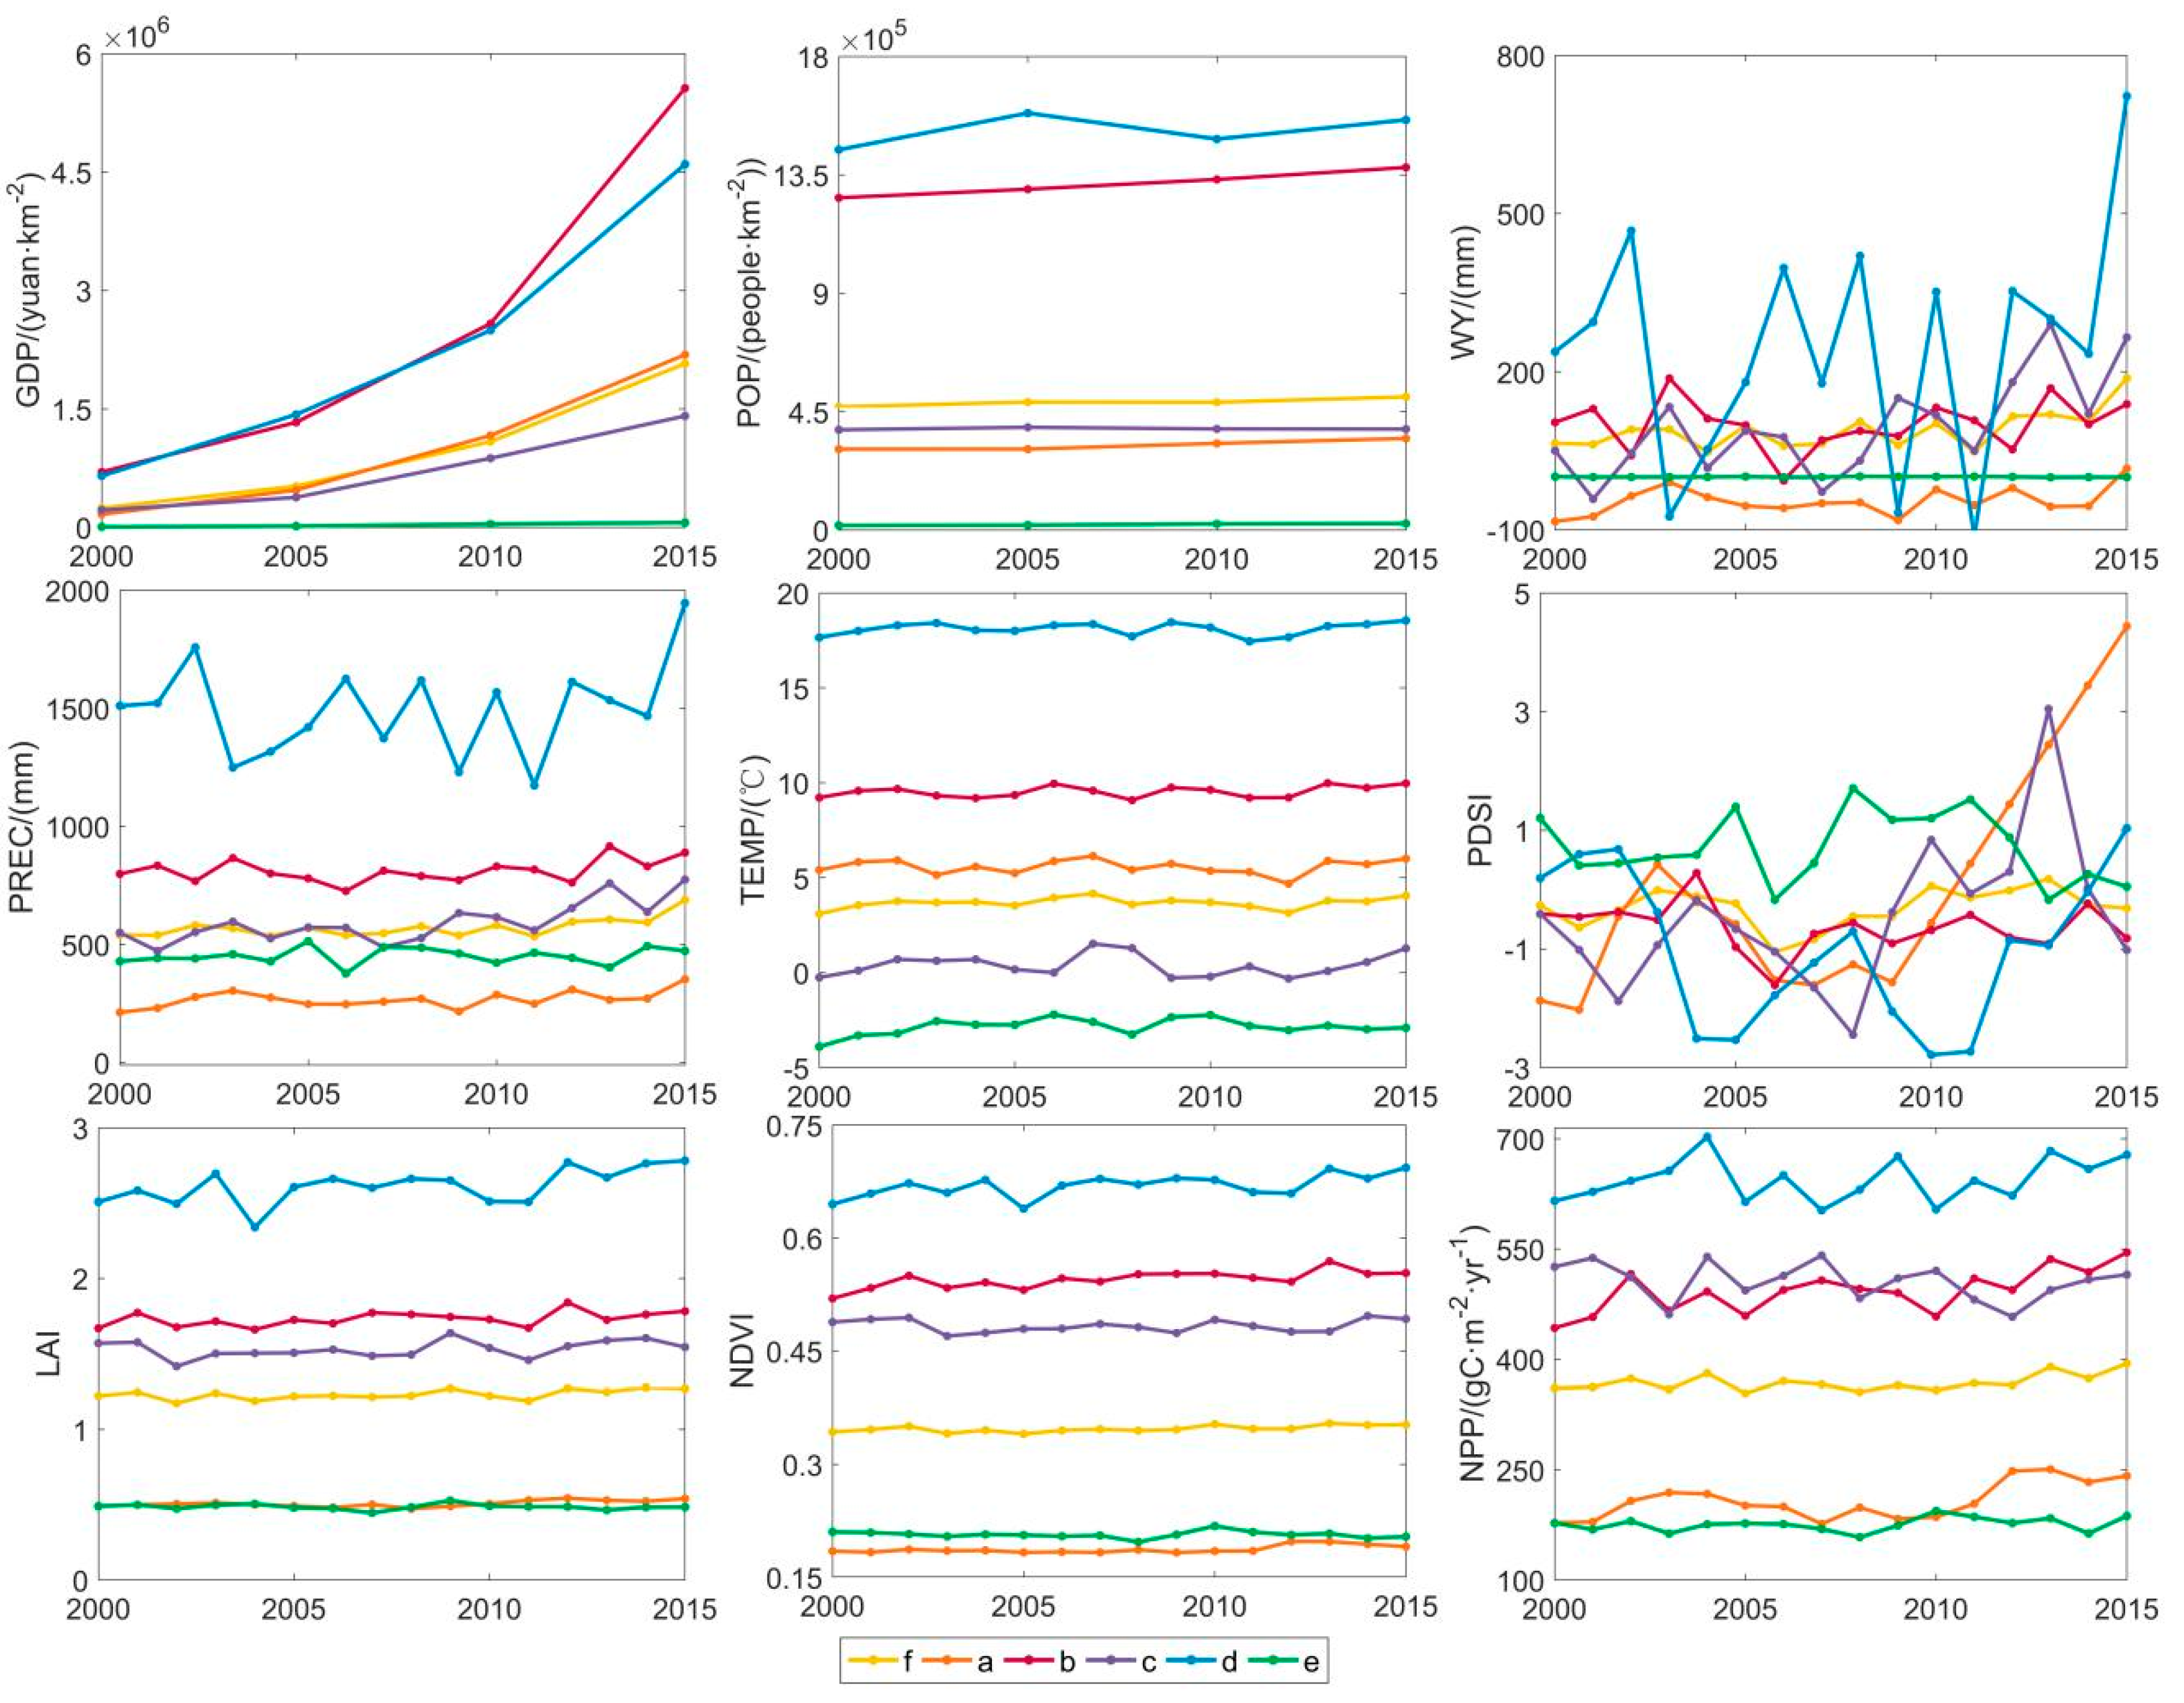
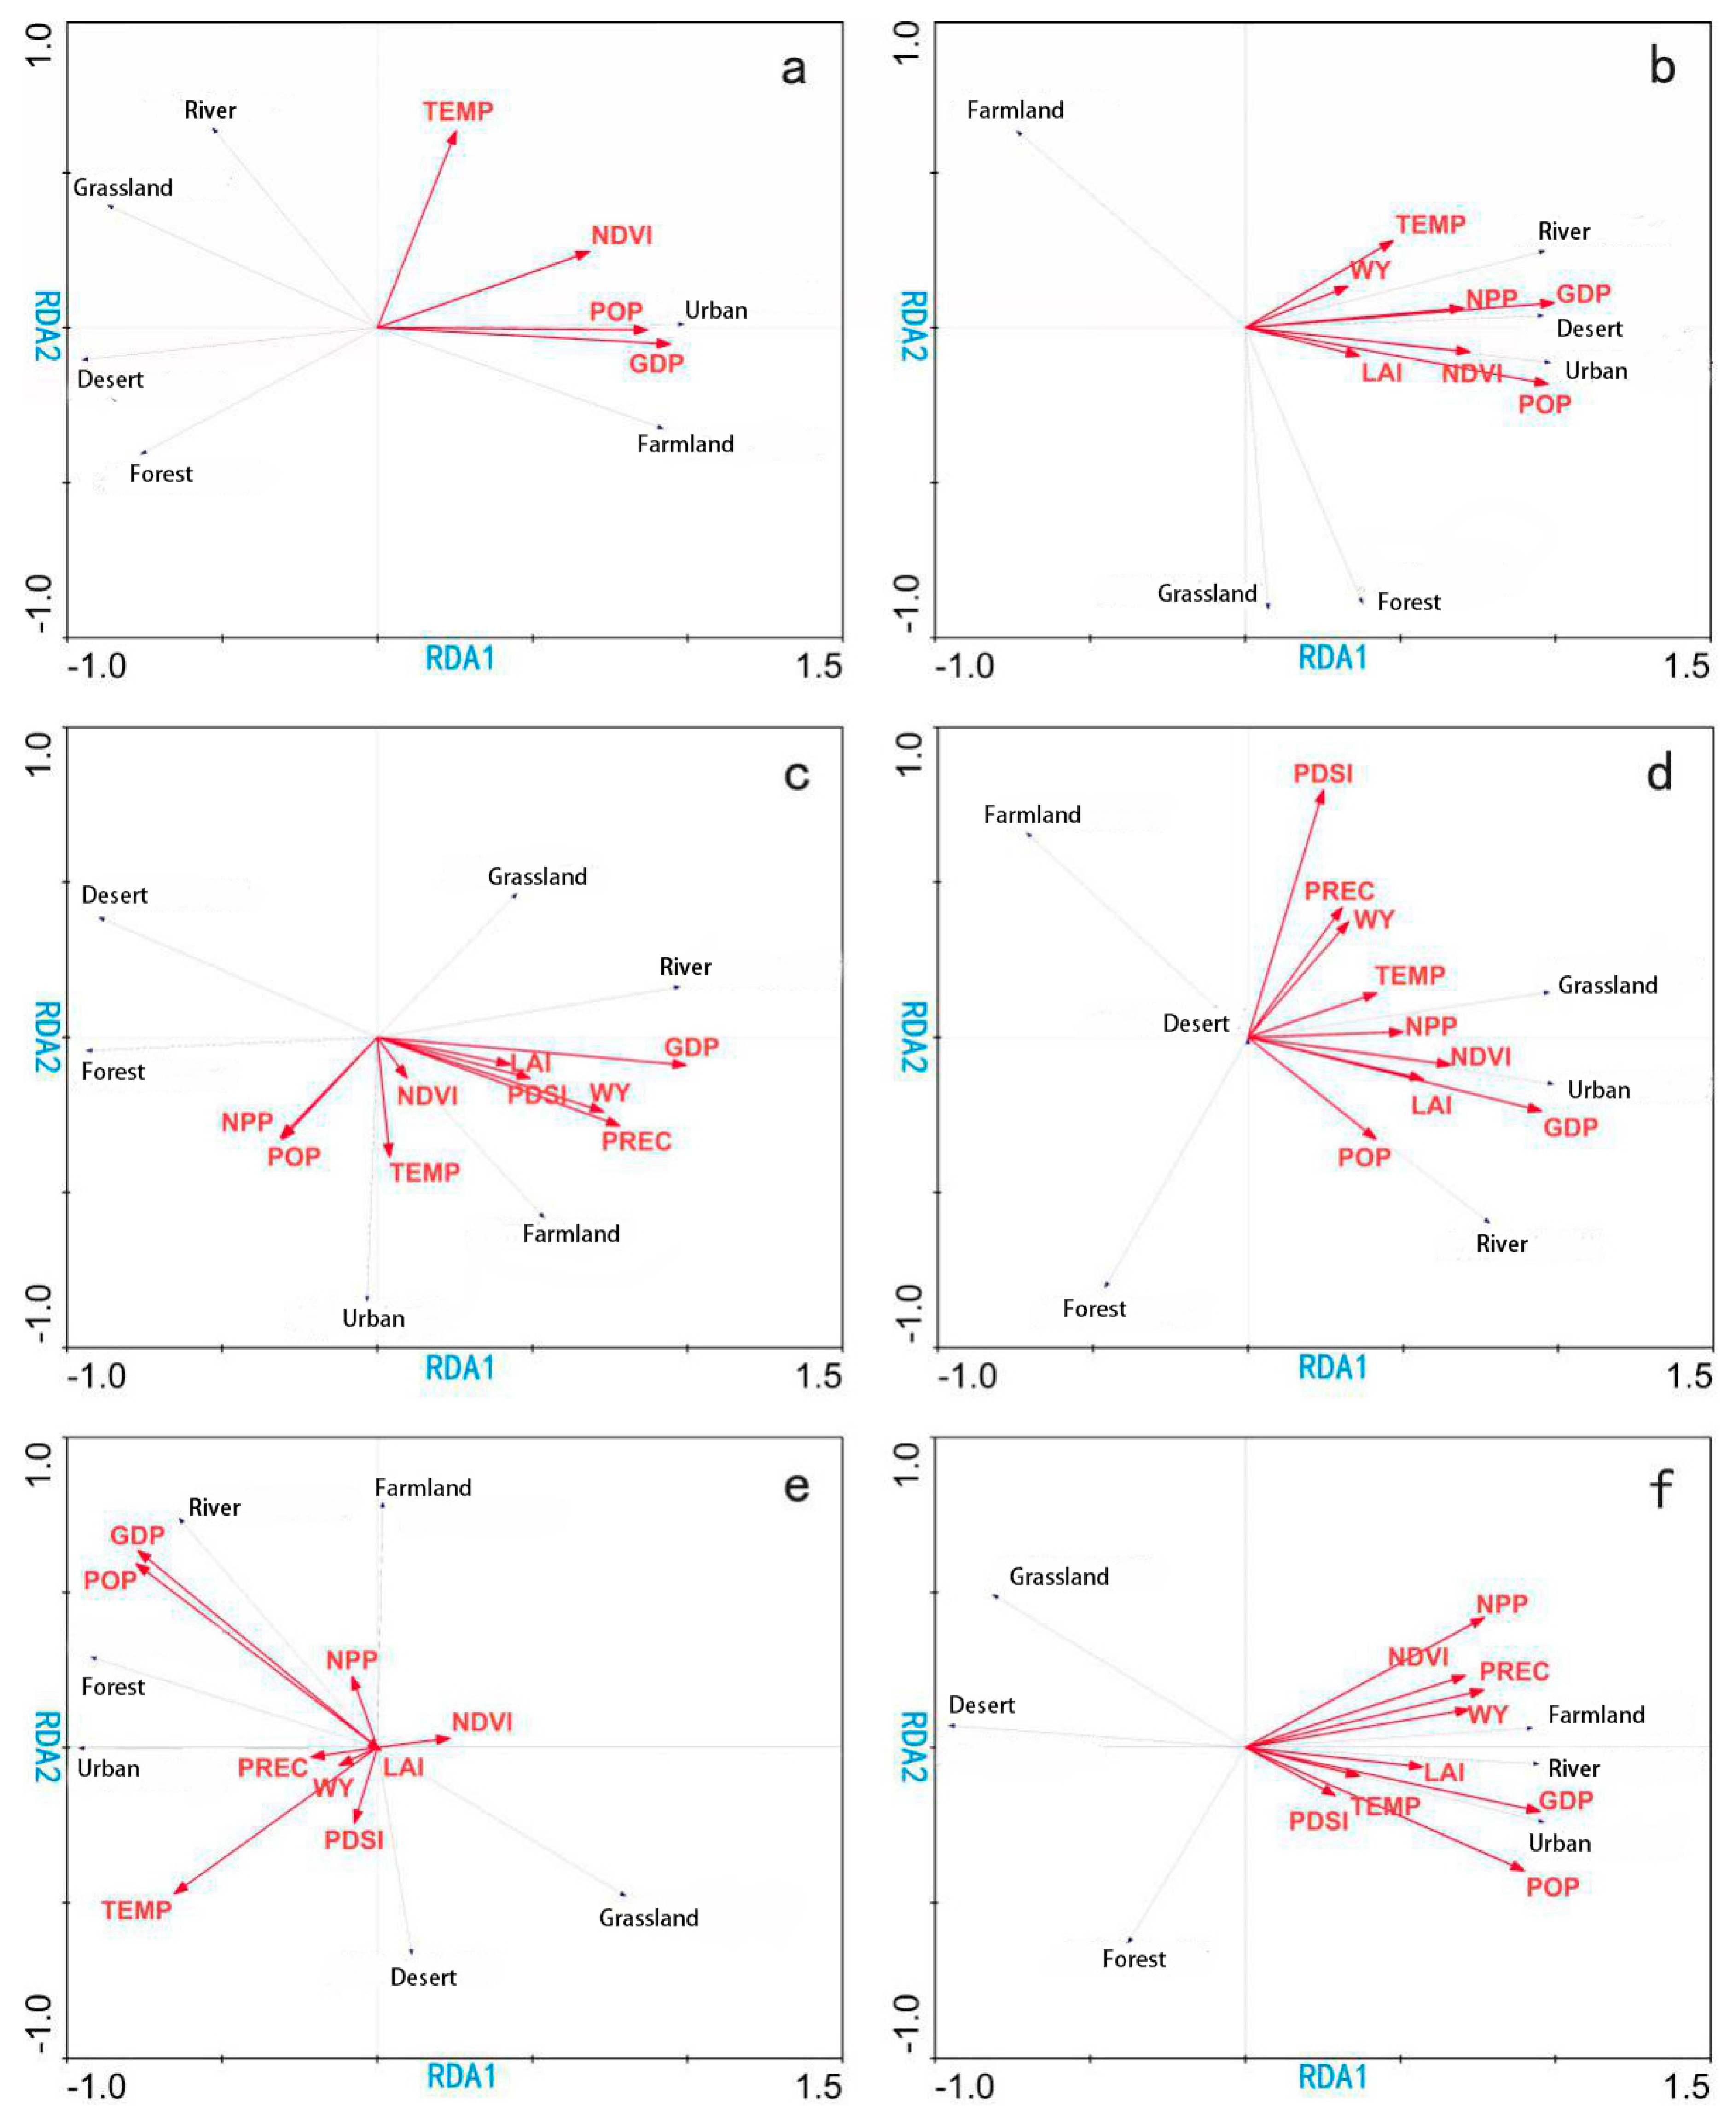
3.2.1. Analysis of Driving Factors of Changes in the Ecosystem in the National Barrier Zone

Analysis of natural factors (Figure 5): There are significant differences between the regions. Between 2000 and 2015, precipitation in the NBZ increased slightly, from 540.13 mm in 2000 to 688.92 mm in 2015, with an annual average precipitation of 570.86 mm in 16 years. The average annual temperature of the NBZ varies little, and the annual average temperature of 16 years is 3.68 °C. The average temperature of 18.1 °C in the southern hilly and mountainous shelter is the highest, and the average temperature of the ecological barrier of the Qinghai-Tibet Plateau is −2.84 °C. In 16 years, the normalized vegetation index (NDVI), vegetation net primary productivity (NPP), and leaf area index (LAI) all showed a fluctuating growth trend: the NDVI increased from 0.343 to 0.352, the NPP increased from 360.74 to 394.03 gmm−2yr−1, and the LAI increased from 1.22 to 1.27. The southern hilly and mountainous shelter has the highest mean value, while the northern sand-prevention shelter has the lowest mean value. The change of drought index is complicated, and the occurrence of drought has some potential relation with the regional temperature and precipitation. The drought index (PDSI) showed an increasing trend in the northern sand-prevention shelter, reaching 4.44 in 2015. The water yield (WY) in the NBZ showed a trend of fluctuating growth, from 64.24 mm in 2000 to 187.5 mm in 2015. The interannual fluctuation is obvious in some regions: the minimum value of the annual water yield in the southern hilly and mountainous shelter was −111.69 mm in 2011, and the maximum value was 722.52 mm in 2015.
Socioeconomic factors (Figure 5): Between 2000 and 2015, the GDP of the NBZ increased significantly, from 243,200 yuan/km2 in 2000 to 2,072,300 yuan/km2 in 2015, with a growth rate of 7.52/a. The population in the NBZ shows an increasing trend, with a growth rate of 0.005/a, and the population distribution in the area is extremely uneven, which affects not only the uneven distribution of the farmland and urban ecosystems but also some driving forces, such as the GDP. The southeastern part of the ecological barrier of the Sichuan–Yunnan–Loess plateau is the most concentrated area with the highest value at 24,926.1 people/km2 and with a value of 0 in the no-man zone.

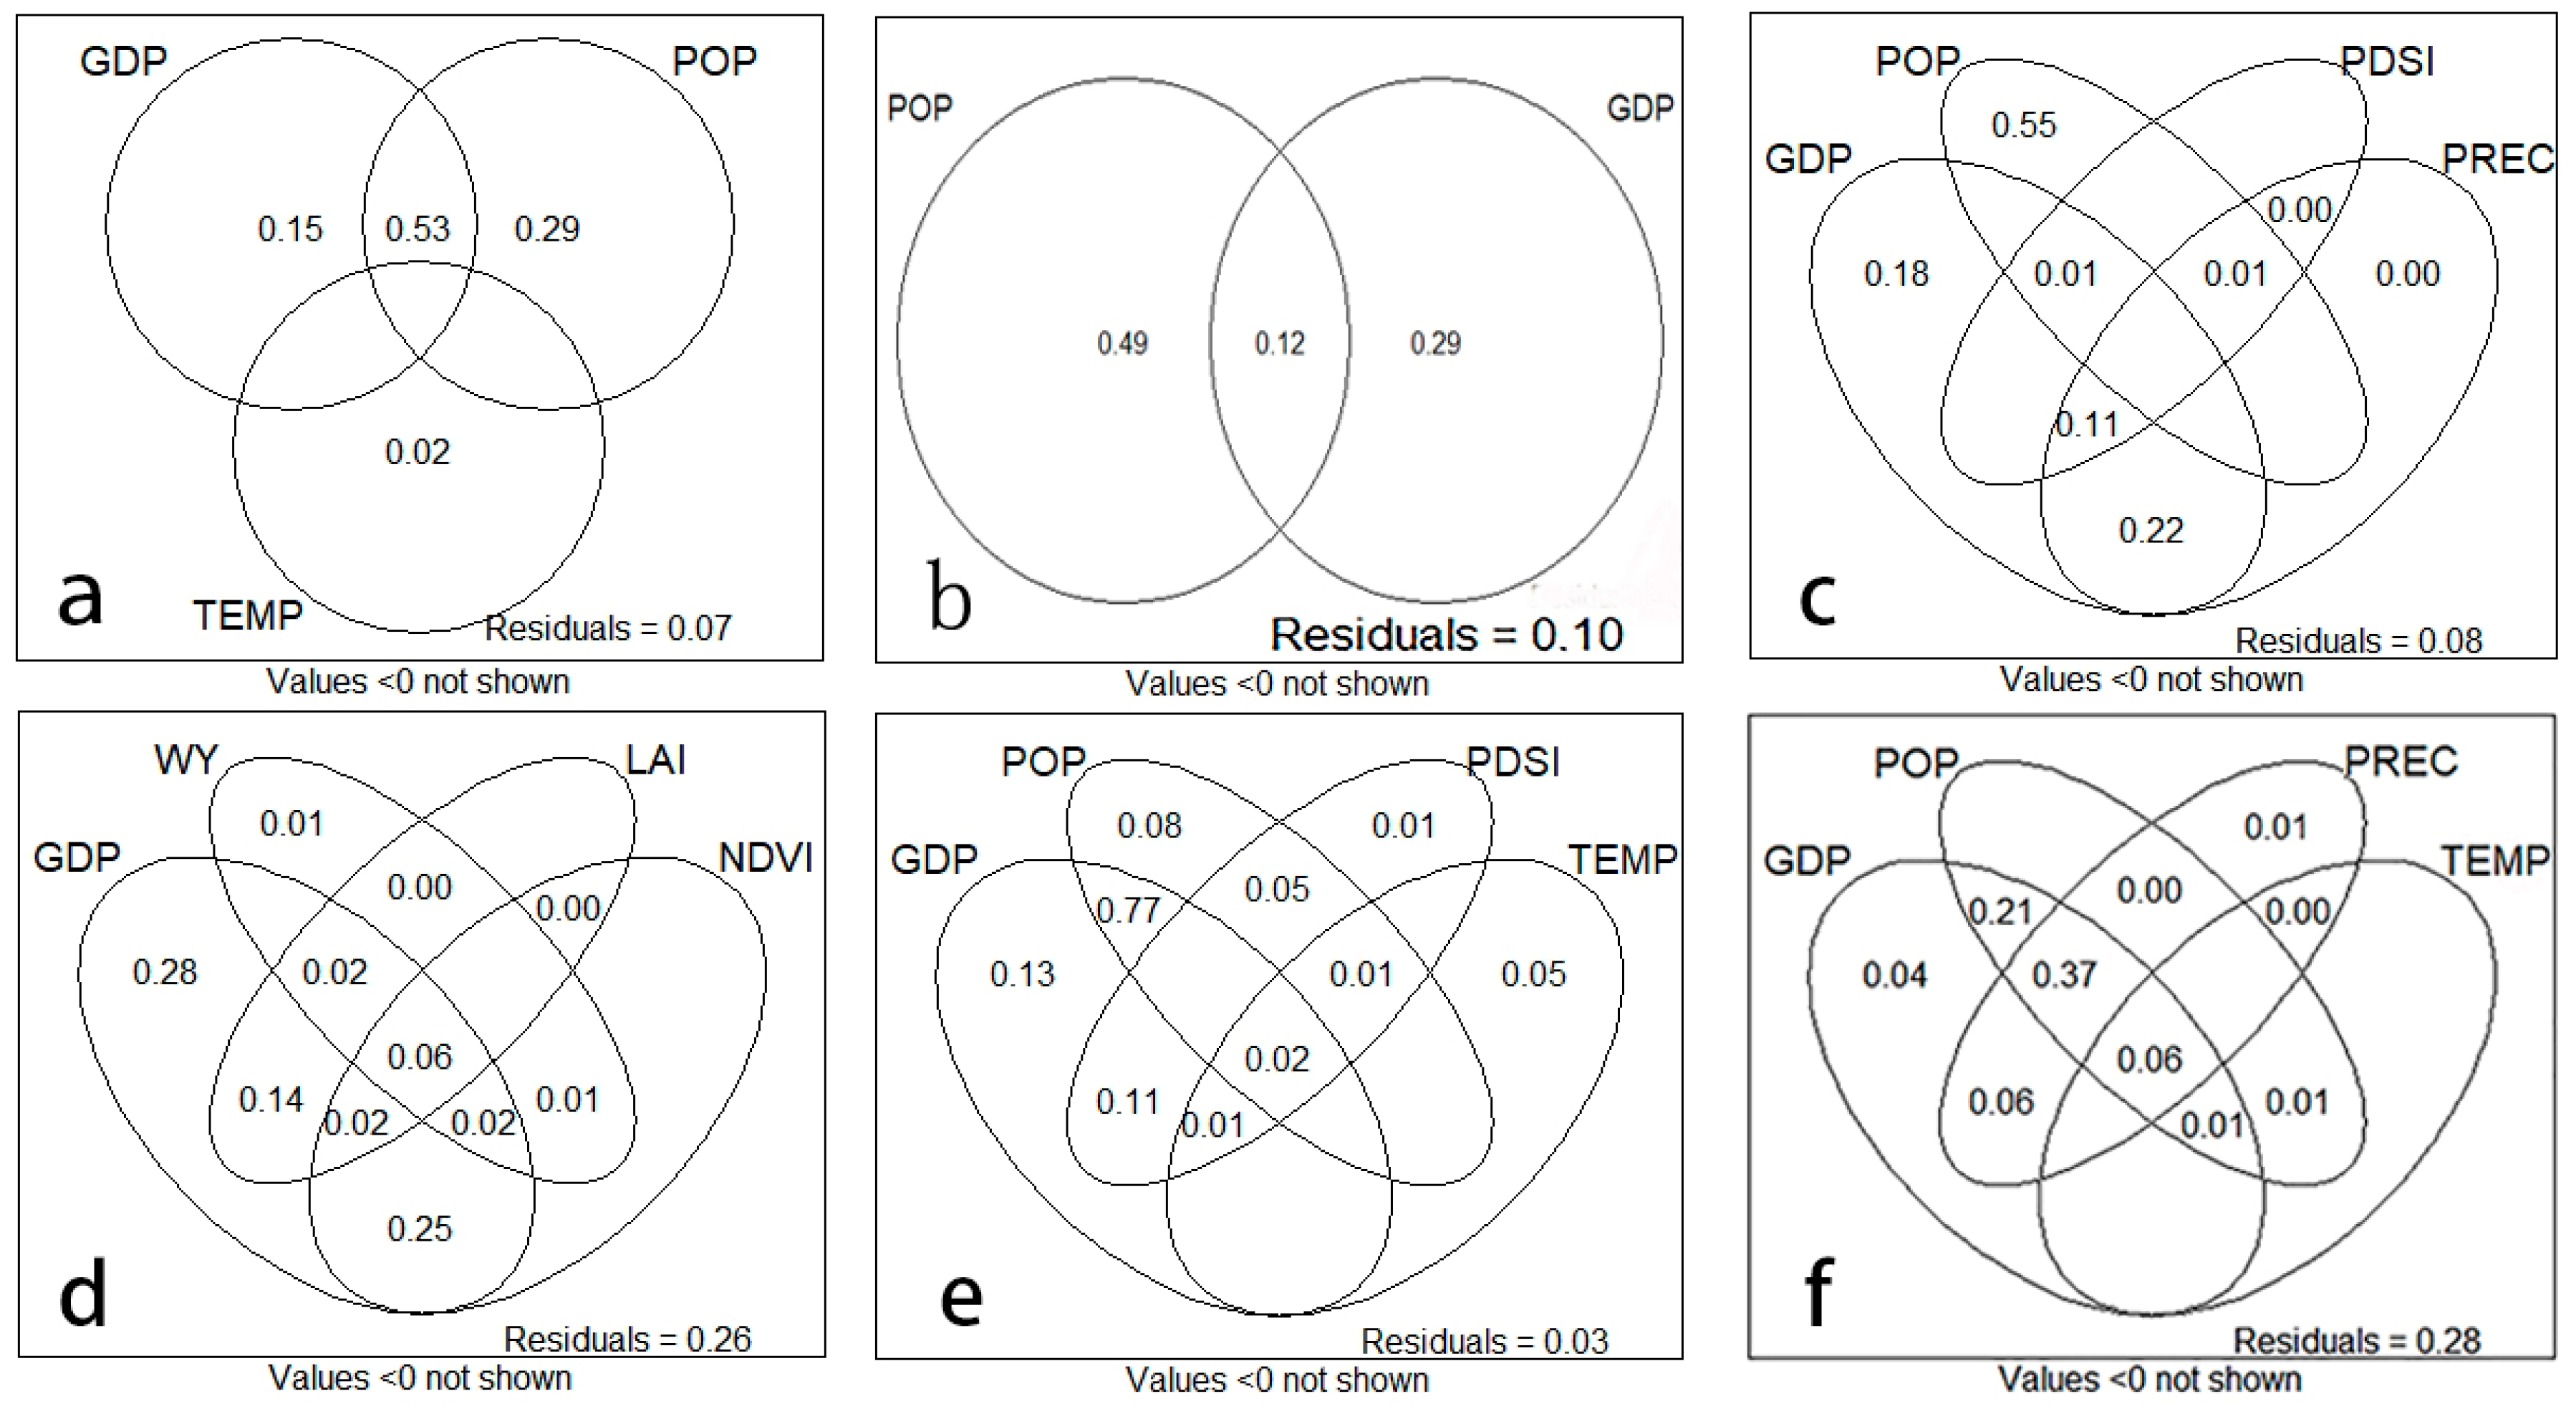
3.2.2. Analysis of the Driving Factor Contribution Rates and Correlations

The contribution rates of the driving factors for changes in the ecosystem in the NBZ based on redundancy analysis are shown in Table 1. Combined with the results of the sequence of driving factors in Figure 6, the comprehensive redundancy analysis shows that from 2000 to 2015, the changes in the ecosystem in the NBZ were mainly driven by social and economic factors, with the contribution rates of the GDP and population (POP) being 0.75 and 0.65, respectively.
With the increase of GDP in the NBZ, the investment in ecological protection projects was further increased. There is a close correlation between the urban ecosystem, river ecosystem, and cultivated land ecosystem and various driving factors of the NBZ. Comparing the ecological barrier of the Qinghai–Tibet plateau, the northeast forest shelter, and the southern hilly and mountainous shelter, the influence intensity of the temperature is higher than the precipitation in north China, while the influence intensity of precipitation is higher than the temperature in south China.
The contributions of driving factors in different regions are also significantly different. The contributions of NDVI, POP, GDP, and temperature (TEMP) in the northern sand-prevention shelter are significant, and the total contribution rate is 99.9%; the contribution rate of the GDP (0.79) is the largest, followed by POP (0.66). The correlation between the GDP and POP and the farmland ecosystem and urban ecosystem is very high, indicating that the driving mechanism of ecosystem changes in this region is relatively simple, climate change is relatively regular, and the influence of human activities on the change of ecosystem pattern in this region is dominant and stabilized. The largest impact on the changes in the ecosystem in the northeast forest belt is GDP (0.48), the smallest is NPP (0.02), and the contribution rate of all driving factors is greater than 0.01, forming a driving mechanism together. The correlation between the farmland ecosystem and urban ecosystem and all driving factors is high in this region, while the correlation between the desert ecosystem and all driving factors is low; the precipitation (PREC) (0.33) has an impact on all driving factors, indicating that precipitation in this region varies greatly and that drought has a serious impact on vegetation growth. The GDP (0.78) still has the greatest impact on the changes in the ecosystem in the southern hilly and mountainous shelter. Additionally, the contribution rates of the NPP, NDVI, and LAI are very high, which is directly related to the large distribution of the forest ecosystem in this region. The grassland ecosystem and urban ecosystem are closely related to all driving factors, and the social and economic factors (POP, GDP) have a high influence on the river ecosystem. It is worth noting that TEMP has an impact on all driving factors in this region, but that PREC has a low impact, which indicates that the precipitation variation range in this region is small and that water can guarantee the growth of vegetation especially under drought conditions. POP (0.63) and NDVI (0.32) contributed the most to changes in the ecosystem of the ecological barrier of the Sichuan–Yunnan–Loess plateau. Due to the implementation of policies, such as the Grain for Green Project, the river ecosystem, grassland ecosystem, and forest ecosystem in the region are highly correlated with the POP, NDVI, and NPP, while the relationship between the farmland ecosystem and each factor is low. The ecological barrier of the Qinghai–Tibet plateau is the region where human activities have the greatest impact on changes in the ecosystem. The respective contribution rates of the GDP and POP are 0.83 and 0.72, and the contribution rates of the PPEC, NPP, and other factors to the driving mechanism in this region are less than 0.05. The influence of socioeconomic factors on the forest ecosystem and river ecosystem is especially large, but it has little effect on the grassland ecosystem.

3.2.3. ANOVA of the Driving Factors Contribution Rate

According to the results in Table 1, it can be seen that the sum of the contribution rates of each driving factor obtained after redundancy analysis is much higher than 1. The reason is that the factor contribution rates of redundancy analysis are not independent and consist of two parts: the independent contribution rates of factors and the interaction between the factors and other factors. Therefore, it is necessary to further use ANOVA to decompose the results of the redundancy analysis, isolate the most prominent factors to make them independent, and further quantitatively analyze the driving mechanism of the changes in the ecosystem in the NBZ.
The significance of the correlation between each driving factor and the distribution of the ecosystem is calculated by using the Vegan pack in the R language, and the driving factor with the highest significance is the typical factor for variance analysis, as shown in Table 2. Only the GDP and POP are typical factors in the ecological barrier of the Sichuan–Yunnan–Loess plateau. The typical factors of the northern sand-prevention shelter are the GDP, POP, and TEMP. The typical factors of the northeast forest shelter are the GDP, POP, PREC, and PDSI. There are many typical factors in the southern hilly and mountainous shelter, including the GDP, WY, LAI, NDVI, NPP, and PDSI, respectively. In the analysis of variance, we chose the four factors with the highest significance, including the GDP, WY, LAI, and NDVI. The typical factors of the ecological barrier of the Qinghai–Tibet plateau are GDP, POP, TEMP, and PDSI. The typical factor of the overall NBZ is only GDP, so we choose the GDP, POP, TEMP, and PREC as the typical factors in this paper.
Figure 7 shows the results of the variance analysis: The POP of the ecological barrier of the Sichuan–Yunnan–Loess plateau is the most typical driving factor, with an independent contribution rate of 0.49. The proportion of GDP and POP in the northern sand-prevention shelter is 0.44, while the proportion of TEMP is only 0.02. The proportion of social and economic factors in the northeast forest shelter is 0.73, and the interaction of PREC and GDP is 0.22. The ratio of GDP in the southern hilly and mountainous shelter is 0.28, and the interaction of GDP and NDVI is 0.25. The impact of socioeconomic factors on the ecological barrier of the Qinghai–Tibet plateau is very obvious, with the combined effect of GDP and POP reaching 0.77. The overall NBZ is relatively balanced, where the influence of social and economic factors is greater than natural factors. At the same time, it can be seen that the contribution rate of each factor as the driving factor is relatively low, such as the PDSI, which did not even exceed 0.01. However, the joint action of each factor after the interaction is important, which obviously changes the ecosystem.

4. Discussion

(1) The ecological environment of the NBZ has improved, but the deterioration in some regions still needs attention. For example, the forest ecosystem of the southern hilly and mountainous shelter decreased by 0.08%, and the grassland ecosystem of the northern sand-prevention shelter decreased by 0.61%. The forest and grassland ecosystems are at risk of degradation. Due to the climate change, societal drivers, soil salinization, and national policies, desertification still exists [41]. The causes of these phenomena deserve further investigation.
(2) The selection of driving factors needs to consider all aspects of human activities and the natural environment, and the selection of driving factors in this paper needs to be further refined, such as the strong impact of the gross product of primary and secondary industry, rather than the total GDP, on the ecosystem. Although social and economic factors dominate changes in the ecosystem at a time when human activities are increasing [42], the complex driving mechanism consists of multiple factors [22]. It is the focus of follow-up research to determine the key driving factors from urbanization, water resources, topography, agricultural land expansion, and other aspects to explore the ecosystem changes, ecosystem service balance, and cooperative relationship.
(3) The prominent contribution of the strong factors should be considered, and the interaction between the strong and weak factors are also important and should not be ignored. For example, the proportion of the NDVI in the southern hilly and mountainous shelter is less than 0.01, but the interaction proportion of the GDP and NDVI is 0.25; therefore, the weak factor has the potential characteristic of butterfly effect.

5. Conclusions

(1) The construction of the NBZ is of great significance for improving the ecological environment and ensuring ecological security. The grassland ecosystem and forest ecosystem account for the largest proportion in the NBZ, accounting for 39% and 27%, respectively. In the past 16 years, the ecosystem has changed significantly, such as the grassland ecosystem increasing by 13,952 km2, the urban ecosystem increasing by 6720 km2, and the desert ecosystem decreasing by 4544 km2. In the NBZ, 1.54% of farmland ecosystems and 0.65% of desert ecosystems were transferred to forest and grassland ecosystems, which improved the ecological environment. This change was even more prominent in the ecological barrier of the Sichuan–Yunnan–Loess plateau, with 0.66% and 1.32% of farmland ecosystems transferred to forest and grassland ecosystems, respectively.
(2) The change trend of the ecosystem both domestically and abroad indicates that the regulation and management of driving factors related to human activities will become the key problem in ecosystem protection, restoration, and management [7]. From 2000 to 2015, changes in the ecosystem in the NBZ were mainly driven by social and economic factors. According to the results of redundancy analysis, the GDP (0.79) and population (0.66) contributed the most. The results of variance analysis showed that the socioeconomic factors were still the largest, and that investments in ecological protection projects increased with the increase of GDP in the NBZ. At the same time, there are significant differences in the driving mechanisms among different regions; for example, the PREC (0.33) plays an important role in the northeast forest shelter, and the NDVI (0.32) is of great significance in the ecological barrier of the Sichuan–Yunnan–Loess plateau.
(3) Due to the different natural conditions and unbalanced social and economic development at different scale areas, the driving mechanism of changes in the ecosystem cannot be generalized and must be adapted to local conditions, showing that the ecosystem change has an obvious scale effect [43]. At the same time, the results of changes in ecosystem in different areas show that the implementation of ecological protection policies, which has resulted in great achievements, such as the Grain for Green Project [44], is a key step to allow the ecological barrier to fully function in protecting the ecological environment in order to achieve the goal of a harmonious and stable sustainable development between man and nature.

Author Contributions

Conceptualization, X.W. and Y.L.; methodology, Y.L.; software, B.C.; validation, X.W., Y.L. and B.C.; investigation, Y.L.; resources, S.L.; writing—original draft preparation, X.W. and Y.L.; writing—review and editing, D.Y. and J.L.; visualization, D.Y.; project administration, S.L.; funding acquisition, X.W. All authors have read and agreed to the published version of the manuscript.

Funding

This research was funded by the National Key Research and Development Program grant No.2018YFC0507300, the Second Tibetan Plateau Scientific Expedition and Research Program grant No.2019QZKK0405, and the Jilin Province Department of Education Social Science Foundation grant No.JJKH20180384SK.

Conflicts of Interest

The authors declare no conflict of interest.

References

  1. Ouyang, Z.Y.; Wang, Q.; Zheng, H. National Ecosystem Survey and Assessment of China (2000–2010). Bull. Chin. Acad. Sci. 2014, 29, 462–466. [Google Scholar]
  2. Xu, X.L.; Liu, J.Y.; Shao, Q.Q. The dynamic changes of ecosystem spatial pattern and structure in the Three-River Headwaters region in Qinghai Province during recent 30 years. Geogr. Res. 2008, 27, 829–838, 974. [Google Scholar]
  3. Tian, Y.C.; Yin, K.; Lu, D.S. Examining Land Use and Land Cover Spatiotemporal Change and Driving Forces in Beijing from 1978 to 2010. Remote Sens. 2014, 6, 10593–10611. [Google Scholar] [CrossRef] [Green Version]
  4. Lambin, E.F.; Geist, H.J.; Lepers, E. Dynamics of Land-use and land-cover change in tropical regions. Annu. Rev. Environ. Resour. 2003, 20, 49205–49241. [Google Scholar]
  5. Turner, B.L.; Lambin, E.F.; Reenberg, A. The emergence of land change science for global environmental change and sustainability. Proc. Natl. Acad. Sci. USA 2007, 104, 20666–20667. [Google Scholar] [CrossRef] [PubMed] [Green Version]
  6. Lambin, E.F.; Meyfroidt, P. Global land use change, economic globalization, and the looming land scarcity. Proc. Natl. Acad. Sci. USA 2011, 108, 3465–3472. [Google Scholar] [CrossRef] [Green Version]
  7. Fu, B.J. Trends and priority areas in ecosystem research of China. Geogr. Res. 2010, 29, 383–396. [Google Scholar]
  8. Ouyang, Z.Y. Problems and countermeasures of China’s ecosystem. China Natl. Cond. Strength 2017, 3, 6–10. [Google Scholar]
  9. Zhao, Q.G.; Huang, G.Q.; Ma, Y.Q. The ecological environment conditions and construction of an ecological civilization in China. Acta Ecol. Sin. 2016, 36, 6328–6335. [Google Scholar]
  10. Sun, D.Q.; Zhang, J.X.; Zhu, C.G. An assessment of China’s ecological environment quality change and its spatial variation. Acta Ecol. Sin. 2012, 67, 1599–1610. [Google Scholar]
  11. Fan, J. Draft of major function oriented zoning of China. Acta Geogr. Sin. 2015, 70, 186–201. [Google Scholar]
  12. Yin, L.C.; Wang, X.F.; Zhang, K. Trade-offs and synergy between ecosystem services in National Barrier Zone. Geogr. Res. 2019, 38, 2162–2172. [Google Scholar]
  13. Wang, X.F.; Yin, L.C.; Zhang, Y. Discussion on some issues of Ecological Barrier. Ecol. Environ. Sci. 2016, 25, 2035–2040. [Google Scholar]
  14. Fu, B.J.; Liu, G.H.; Chen, L.D. Scheme of ecological regionalization in China. Acta Ecol. Sin. 2001, 1, 1–6. [Google Scholar]
  15. Karnauskaitė, D.; Schernewski, G.; Schumacher, J.; Grunert, R.; Povilanskas, R. Assessing coastal management case studies around Europe using an indicator based tool. J. Coast. Conserv. 2018, 22, 549–570. [Google Scholar] [CrossRef] [Green Version]
  16. Fu, B.J.; Zhang, L.W. Land-use change and ecosystem services: Concepts, methods and progress. Progr. Geogr. 2014, 33, 441–446. [Google Scholar]
  17. Li, Y.F.; Luo, Y.C.; Liu, G. Effects of land use change on ecosystem services: A case study in Miyun reservoir watershed. Acta Ecol. Sin. 2013, 33, 726–736. [Google Scholar]
  18. Kang, S.C.; Xu, Y.W.; You, Q.L. Review of climate and cryospheric change in the Tibetan Plateau. Environ. Res. Lett. 2010, 5, 015101. [Google Scholar] [CrossRef]
  19. Wang, X.H.; Zhang, Z.Q. Effect of land-use change on ecosystem services value in Heihe river basin. Ecol. Environ. Sci. 2004, 4, 608–611. [Google Scholar]
  20. Liu, X.D.; Chen, B.D. Climatic warming in the Tibetan Plateau during recent decades. Int. J. Climatol. 2000, 20, 1729–1742. [Google Scholar] [CrossRef]
  21. Pan, T.; Zou, X.T.; Liu, Y.J. Contributions of climatic and non-climatic drivers to grassland variations on the Tibetan Plateau. Ecol. Eng. 2017, 108, 307–317. [Google Scholar] [CrossRef]
  22. Shi, N.N.; Xiao, N.W.; Wang, Q. Spatial Pattern of Ecosystems and the Driving Forces in the Yangtze River Economic Zone. Res. Environ. Sci. 2019, 32, 1779–1789. [Google Scholar]
  23. Ma, H.; Shi, L.Y.; Fu, X. Ecosystem spatial changes and their driving forces in the Lugu Lake Area. Acta Ecol. Sin. 2019, 39, 3507–3516. [Google Scholar]
  24. Xiao, Y.; Ouyang, Z.Y.; Wang, L.Y. Spatial patterns of ecosystem quality in Inner Mongolia and its driving forces analysis. Acta Ecol. Sin. 2016, 36, 6019–6030. [Google Scholar]
  25. Wang, S.D.; Ouyang, Z.Y.; Zhang, C.P. The dynamics of spatial and temporal changes to forested land and key factors driving change on Hainan Island. Acta Ecol. Sin. 2012, 32, 7364–7374. [Google Scholar] [CrossRef] [Green Version]
  26. Farideh, H.A.; Jilt, S.; Roumen, H.P. A quantitative investigation of the effect of Mn segregation on microstructural properties of quenching and partitioning steels. Scr. Mater. 2017, 137, 27–30. [Google Scholar]
  27. Robert, J.H.; Susan, E.C.; Juan, L.P. Very high resolution interpolated climate surfaces for global land areas. Int. J. Climatol. 2005, 25, 1965–1978. [Google Scholar]
  28. Zhu, H.Y.; Li, X.B. Discussion on the Method of regional land use change. Acta Geogr. Sin. 2003, 5, 643–650. [Google Scholar]
  29. Shi, P.J.; Chen, J.; Pan, Y.Z. Landuse Change Mechanism in Shenzhen City. Acta Geogr. Sin. 2000, 2, 151–160. [Google Scholar]
  30. Li, F.; Ye, Y.P.; Song, B.W. Assessing the changes in land use and ecosystem services in Changzhou municipality, Peoples’ Republic of China, 1991–2006. Ecol. Indic. 2014, 42, 95–103. [Google Scholar] [CrossRef]
  31. Wang, F.; Wang, X.; Zhao, Y. Temporal variations of NDVI and correlations between NDVI and hydro-climatological variables at Lake Baiyangdian, China. Int. J. Biometeorol. 2014, 58, 1531–1543. [Google Scholar] [CrossRef] [PubMed]
  32. Yang, J.Q.; Shi, Y.R.; Quan, W.M. Analysis of the relationships between zooplankton and temperature-salinity based on RDA and GAMs model in coastal East China Sea. Haiyang Xuebao 2019, 41, 72–84. [Google Scholar]
  33. Frank, S.; Gilliam, N.; Elizabeth, S. Making more sense of the order: A review of Canoco for Windows 4.5, PC-ORD version 4 and SYN-TAX 2000. J. Veg. Sci. 2003, 14, 297–304. [Google Scholar]
  34. Zhen, L.; Grace, W.; Donald, R.J. Spatial-Temporal Analysis of Temperature Using Smoothing Spline ANOVA. J. Clim. 1998, 11, 18–28. [Google Scholar]
  35. Andrew, G. Analysis of variance. Qual. Control Appl. Stats 2005, 20, 295–300. [Google Scholar]
  36. Ruth, G.S.; Thomas, M. Anova for Unbalanced Data: An Overview. Ecology 1993, 74, 1638. [Google Scholar]
  37. Xiao, F.Y.; Gao, G.Y.; Shen, Q. Spatio-temporal characteristics and driving forces of landscape structure changes in the middle reach of the Heihe River Basin from 1990 to 2015. Landsc. Ecol. 2019, 34. [Google Scholar] [CrossRef]
  38. Zhang, Z.H.; Donald, H. Combating desertification in China: Monitoring, control, management and revegetation. J. Clean. Prod. 2018, 182, 765–775. [Google Scholar] [CrossRef]
  39. Wu, Y.J.; Zhao, X.S.; Xi, Y. Comprehensive evaluation and spatial-temporal changes of eco-environmental quality based on MODIS in Tibet during 2006–2016. Acta Geogr. Sin. 2019, 74, 1438–1449. [Google Scholar]
  40. Li, X.B. A review of the international researches on land use/land cover change. Acta Geogr. Sin. 1996, 6, 553–558. [Google Scholar]
  41. D’Odorico, P.; Bhattachan, A.; Davis, K.F.; Ravi, S.; Runyan, C.W. Global desertification: Drivers and feedbacks. Adv. Water Resour. 2013, 51, 326–344. [Google Scholar] [CrossRef]
  42. Guo, L.Y.; Liu, Y.S.; Ren, Z.Y. Analysis of the Land Landscape Changes and Its Driving Mechanism in Vulnerable Ecological Area: A Case Study of Yulin City. Resour. Sci. 2005, 27, 128–133. [Google Scholar]
  43. Jarvis, P.G. Scaling processes and problems. Plant Cell Environ. 2010, 18, 1079–1089. [Google Scholar] [CrossRef]
  44. Liu, W.C.; Liu, J.Y.; Kuang, W.H. Spatiotemporal patterns of soil protection effect of the Grain for Green Project in northern Shaanxi. Acta Geogr. Sin. 2019, 74, 1835–1852. [Google Scholar]
Figure 1. Research area of the NBZ. (a1) Tarim sand-prevention belt; (a2) Hexi Corridor sand-prevention belt; (a3) Inner Mongolia sand-prevention belt; (b) the ecological barrier of the Sichuan–Yunnan–Loess plateau; (c) the northeast forest shelter; (d) the southern hilly and mountainous shelter; (e) the ecological barrier of the Qinghai–Tibet plateau.
Sustainability 12 06680 g001
Figure 2. Ecological distribution map of the NBZ from 2000 to 2015.
Sustainability 12 06680 g002
Figure 3. Percentage map of ecosystem in NBZ from 2000 to 2015. (a) The northern sand-prevention shelter, (b) the ecological barrier of the Sichuan–Yunnan–Loess plateau, (c) the northeast forest shelter, (d) the southern hilly and mountainous shelter, (e) the ecological barrier of the Qinghai–Tibet plateau, (f) the National Barrier Zone.
Sustainability 12 06680 g003
Figure 4. Ecosystem transformation in the NBZ from 2000 to 2015.
Sustainability 12 06680 g004
Figure 5. Chart of driving factors from 2000 to 2015. (a) The northern sand-prevention shelter, (b) the ecological barrier of the Sichuan–Yunnan–Loess plateau, (c) the northeast forest shelter, (d) the southern hilly and mountainous shelter, (e) the ecological barrier of the Qinghai–Tibet plateau, (f) the National Barrier Zone.
Sustainability 12 06680 g005
Figure 6. Redundancy analysis ranking map. (a) The northern sand-prevention shelter, (b) the ecological barrier of the Sichuan–Yunnan–Loess plateau, (c) the northeast forest shelter, (d) the southern hilly and mountainous shelter, (e) the ecological barrier of the Qinghai–Tibet plateau, (f) the National Barrier Zone.
Sustainability 12 06680 g006
Figure 7. Analysis of variance of typical factors in NBZ and each area. (a) The northern sand-prevention shelter, (b) the ecological barrier of the Sichuan–Yunnan–Loess plateau, (c) the northeast forest shelter, (d) the southern hilly and mountainous shelter, (e) the ecological barrier of the Qinghai–Tibet plateau, (f) the National Barrier Zone.
Sustainability 12 06680 g007
Table 1. Contribution rate of driving factors in the NBZ.
Driving ForcesGDPPOPPRECWYLAINDVINPPPDSITEMP
a0.790.660.220.130.250.350.420.090.02
b0.440.630.080.020.100.320.210.050.04
c0.480.460.330.280.100.110.020.120.06
d0.780.110.130.140.280.380.230.130.17
e0.830.720.010.000.010.050.020.080.06
f0.750.650.520.450.270.450.550.060.11
Notes: (a) The northern sand-prevention shelter, (b) the ecological barrier of the Sichuan–Yunnan–Loess plateau, (c) the northeast forest shelter, (d) the southern hilly and mountainous shelter, (e) the ecological barrier of the Qinghai–Tibet plateau, (f) the National Barrier Zone.
Table 2. Significance test of the correlation between the driving factors and ecosystem in NBZ.
abcdef
GDP0.001 ***0.001 ***0.001 ***0.001 ***0.001 ***0.004 ***
POP0.001 ***0.001 ***0.001 ***0.2550.001 ***0.646
TEMP0.093.0.2920.1660.9960.002 **0.526
PREC0.8460.7650.005 **0.3670.4130.611
WY0.6490.68710.001 ***0.590.678
LAI0.8980.7610.2540.001 ***0.0850.129
NDVI0.7430.3790.6280.001 ***0.610.968
NPP0.1170.7320.069.0.002 **0.9070.494
PDSI0.8290.4570.008 **0.096.0.059.0.779
(a) The northern sand-prevention shelter, (b) the ecological barrier of the Sichuan–Yunnan–Loess plateau, (c) the northeast forest shelter, (d) the southern hilly and mountainous shelter, (e) the ecological barrier of the Qinghai–Tibet plateau, (f) the National Barrier Zone, ‘***’ factors passing the significance test of 0, ‘**’ factors passing the significance test of 0.001, and ‘.’factors passing the significance test of 0.05.

