Influence of Accession of the Visegrad Group Countries to the EU on the Situation in Their Labour Markets


Institute of Economics and Finance, University of Szczecin, 71-101 Szczecin, Poland
*
Author to whom correspondence should be addressed.
Sustainability 2020, 12(16), 6694; https://0-doi-org.brum.beds.ac.uk/10.3390/su12166694
Submission received: 19 July 2020
/
Revised: 13 August 2020
/
Accepted: 18 August 2020
/
Published: 18 August 2020
(This article belongs to the Special Issue Towards More Sustainable Labour Markets: Concepts, Developments, Policies and Impact Evaluations)
Abstract
:In 2004, ten new countries, including the Visegrad Group (V4) ones, accessed the European Union. These countries are ex-communist. They are still in the process of transition from a centrally planned to a free-market economy. It is interesting to check how their economies have changed after their accession to the EU. Reducing inequalities in labour markets is one of the aspects of sustainable development. The goal of this research is an assessment of the situation in the labour markets in the V4 countries with respect to the whole EU. The research was carried out on the data from Eurostat (2002–2019) and was conducted by means of the multidimensional scaling technique. Before joining the EU, the situation in the labour market in the V4 countries (excluding Czechia) was much worse than in most EU-member states. After joining the EU, the situation in these countries gradually improved. In 2019, the situation in the labour market in Czechia was one of the best in the EU and the remaining three V4 countries moved into the EU-average. The joining of the V4 countries to the EU had a positive impact on the situation in their labour markets.
1. Introduction
In research on social policy or political documents on the future of social security over the last 20 years, sustainability has been mainly discussed as fiscal, financial or monetary sustainability [1]. Cahill [2] and Fitzpatrick [3] were among the first to foresee a change in social policy towards environmental sustainability. These issues were later raised by Gough et al. [4], for example, in demonstrating the multiple effects of climate change and other environmental problems. Alarming environmental threats have caused a whole range of “new social risks” for the welfare state [5,6]. To face these new threats, Gough [7] (p. 198) sees that “social policy would need to combine with environmentalism to forge a unified ecosocial policy that can achieve ecologically beneficial and socially just impacts”. In another work, he defines the ecosocial policies as “policies that simultaneously and explicitly pursue both equity/justice and sustainability/sufficiency goals”. [8] (p. 161).
Sustainable economic development occurs on many levels and is integrated with political, social and environmental sustainability. One of its elements is the sustainable development of the labour market. In order for this to be sustainable, improvements must take place in all its aspects. Sustainable development must be considered not only at the level of a single country but also—because of the interconnectedness—at the level of a group of connected countries such as the European Union. Extending it with the new Member States imposes a number of requirements that they have to meet.
In 2004, 10 countries joined the European Union, including the Visegrad Group: Poland, Hungary, Czechia and Slovakia. The deadline for these four countries was established at a meeting in 1991. The aim of this meeting was to establish cooperation for the purpose of joint integration with the European Union and the Atlantic zone. It has been agreed that joint actions will be consulted and coordinated and mutually supported in the international arena. It was important at that time to build parliamentary democracy and to remove the economic and administrative remains of the previous system. These countries had convergent foreign policy objectives and similar possibilities to achieve them, which differed from the other countries of the former communist bloc. The Visegrad countries are now regarded as an example of a successful transition from a centrally planned to a market economy. The modernisation process has increased their competitiveness in the globalised economy. This was related to the implementation of institutional reforms [9], significant technological changes and improvements in the quality of human capital [10] and fiscal stabilisation policy [11]. These changes have affected the situation in the labour markets in these countries [12]. This influence was reciprocal. Effective labour market policies have also supported the development and modernisation of economies. It should be noted that each country has different conditions for economic development. This results in different growth strategies in different Member States. These strategies should address country-specific development conditions and challenges [13]. The labour market policies in countries that belong to the EU must be in accordance with the European Employment Strategy (EES). The EES aims for the promotion of convergence towards higher employment and lower unemployment, provided by soft law instruments [14]. In order to ensure that convergence is durable and sustainable over time, the process is called “sustainable convergence”. Sustainable convergence must occur in many dimensions. We usually distinguish five of them: nominal, real, social, cyclical (influenced by both business and financial cycles) and convergence towards resilient economic structures [15]. Sustainable convergence in the labour market falls into the fifth dimension—resilient economic structures. Assessing the situation in the labour market, we also need to consider it multidimensionally by analysing unemployment, employment and activity rates, demographic structure, or unemployment duration and participation. Values on these indicators depend vastly on the general economic situation in the analysed country.
The labour markets of individual countries do not always react to changes in economic conditions in the same way and as presented in the theoretical studies. These reactions depend mainly on the level of economic development and the economic structure. The subject of the analysis carried out in the article is the countries of the Visegrad Group, which due to macroeconomic, historical and institutional similarities, present a similar level of economic development and are characterised by a similar employment structure. They had to change from a system of planned economies to free-market economies at a similar time, and at the same time, they joined the European Union. This forced fundamental changes in the labour markets; hence, the idea of comparing them with the labour markets of the other Member States. At the same time, there are features that differentiate these countries. These are area, number of inhabitants, geographical location, topography, traditions which have influenced different intensities of development of particular branches of the economy.
The aim of the paper is to assess the situation in the labour market in the European Union with particular emphasis on the Visegrad countries in the years 2002–2019. The reason for the adoption of such a research period is to examine the dynamics of the situation of the Group countries in the context of the entire Union before their accession to the Community (before 2004), after accession, in the financial crisis (2007–2009) to the present day. The study was carried out using a multi-dimensional scaling method, which makes it possible to present a phenomenon described by means of multiple variables (i.e., presented in multiple dimensions) in a smaller number of dimensions (not larger than three), which makes it possible to represent the phenomenon graphically. The research hypothesis is that the accession of the Visegrad Group countries to the European Union has improved their position in the European labour market. The hypothesis results from the theory of sustainable convergence, which is one of the main goals of the existence of the EU in both the economic and social sense. When observing the labour markets in the new member states that joined the EU in 2004, it is visible that the accession had a significant impact on them. The new member states had significant outflows of their labour force (which, in case of the V4 group, was particularly visible in Poland). At the same time, the better-developed, Western-European countries had a significant inflow of labour force. Because the migrants were relatively young, skilled and, in many cases, well-educated, such situation had a negative impact on the economies of the new member states (loss of public resources spent on their education and training) and had a positive impact for Western-European countries. However, despite this situation, it could be observed that labour market indicators for the new member states had been gradually improving and their convergence with the “old” member states continued [16].
The applied approach is a descriptive one, enabling the comparison of countries according to many characteristics describing their labour market situation. Of course, its main limitation is that it can only describe and compare the existing situation, and it is not possible to investigate its causes. The data from Eurostat used in the study are a consequence of many factors determining the labour markets of individual countries. These factors are of different nature—economic, demographic, political, location-related, natural resources and many others. In each country, these factors may determine the labour market to a different extent, but they result in indicators used in the study. When comparing the labour markets of different countries, the same synthetic indicators should be selected.
The paper is organised as follows: the next section provides the literature overview, focused on the labour market in the context of sustainable development. The third section presents a description of applied analytical methods. It is followed by a section that presents the statistical data and analysed variables. It also presents the essential arithmetic operations undertaken on certain variables and applied normalisation method. The next section presents the results of empirical analysis and contains two main parts: the first one consists of the results of the multidimensional scaling and the second one—ranking and grouping of the EU countries with respect to the situation in their labour markets. The sixth section presents the discussion of obtained results and their comparison with similar recent research in this area. The concluding remarks, along with the presentation of future research, concern the last section.
2. Literature Review
With the accession of new countries, including the Visegrad countries, to the EU, an increasing convergence of business cycles can be observed. The synchronisation of the growth cycle is a key issue for economic integration in Europe. This makes the markets of the Visegrad Group more coherent with those of other Member States [17]. Economic convergence has long been a declared objective of the EU and is considered to be a fundamental mechanism for achieving socio-economic cohesion. The recent economic crisis has had an uneven impact across the EU and has hampered economic and social convergence. The sustainability of the convergence process is essential for the smooth functioning of the integrated area. In March 2010, the European Commission launched the “Europe 2020 strategy” to promote smart, sustainable and inclusive growth in the EU. This initiative aimed at strengthening the EU economy and increasing social convergence together with economic convergence. The term “sustainable growth” is defined in the strategy as “promoting a more resource efficient, greener and more competitive economy”. The strategy consists of five EU headline targets. One of them refers directly to the situation in the labour market and states that the employment rate of the population aged 20–64 should increase to at least 75% by 2020 [18]. Some authors point out that it is impossible (or very difficult) to obtain a sustainable development on the labour market with liberal market policies. It can be achieved by introducing labour market regulations, such as effective upgrading of work and skills [19].
In sustainable economic development, it is of the utmost importance to have an appropriate education adapted to the needs of the labour market. In the context of a global and dynamic labour market, graduates’ competences need constant evaluation and flexibility. Numerous studies are being carried out in order to understand the factors that guarantee the balance between education and its usefulness. The results of this research should contribute to the sustainability of the education system, including higher education. A necessary condition for economic development and raising living standards in individual countries is to address employment issues in a way that would contribute, inter alia, to sustainable employment. Research carried out in this field helps to intervene in order to achieve the desired impact on increasing employment and sustainable development of socially excluded people. Serrano, Llamazares and Otamendi [20] analysed the effectiveness and sustainability of the qualifications for undergraduate degrees (Bachelor’s degree) and postgraduate qualifications (Master’s degree) for QF-EHEA. They drew attention to the need for constant monitoring of the education system in order to adapt it to the labour market and its sustainable development. Similar research was conducted for Poland. It was focused on creation of developing sustainability competencies for higher education graduates that were relevant to the labour market needs. They were assigned for various trends that can be observed in economy and labour market [21]. For the Slovak labour market, the research team: Svabova; Durica; Kramarova; Valaskova; Janoskova [22] analysed employment opportunities and its stability among young unemployed jobseekers, participants of the Graduate Practice intervention in 2014–2017. The results obtained indicated the lack or very weak effects of the intervention, especially in terms of long-term employment stability. It follows that the effect of sustainable development was short-term.
The studies conducted by Lafuente, Marco, Monfort, Ordóñez [23] on the convergence of EU countries (2005–2018) in terms of poverty and social exclusion indicate that convergence occurs in clusters of countries not linked by geographical criteria: east-west or south-north. Convergence in each cluster usually takes place through a catching-up process, with eastern countries moving closer to their western counterparts. Different clusters differ in each of the analysed indicators. This shows that there is a large gap in Europe in achieving poverty reduction and strengthening social inclusion. This divergent pattern calls into question the sustainability of the overall convergence process. Among the three indicators analysed by the authors there is the following one: persons living in households with very low work intensity, which was defined as the number of persons living in a household where the members of working age worked less than 20% of their total potential during the previous 12 months. This indicator was below average for Czechia, Poland and Slovakia.
Studies using synthetic development indicators indicate that the level of labour market development in the Visegrad countries after the accession to the European Union in 2004 was low. The high unemployment rate, especially in Poland and Slovakia, in the pre-accession period, was related to the process of political transformation. Many enterprises had to restructure in order to increase their competitiveness. This was often associated with a reduction in the number of employees. During this period, Hungary and the Czech Republic gained more than Poland and Slovakia from foreign direct investment. This factor may explain the poor labour market performance in Poland and Slovakia [24]. Studies on the determinants of foreign direct investment in the Visegrad countries indicate that the corruption behaviour was perceived by investors as the main obstacle in the years 2005–2016, and the main advantage was the large labour force resources with advanced education [25]. For Poland, Czechia and Slovakia the period after the accession to the EU (from 2004 until the moment of the global financial crisis) is a time of continuous improvement in the situation in the labour markets, characterised by a drop in the unemployment rate (Figure 1). In the case of Hungary, the lowest unemployment rate before 2004 and its growth after 2004 is noticeable, which may indicate that the Hungarian labour market has not benefited so much from accession to the EU. The worst situation after 2004 was in Slovakia with the highest unemployment rates and the longest average period of unemployment. In this country, there was the highest ratio of maximum benefit to minimum wage and a very high net replacement rate, i.e., the relationship between the amount of benefit received in the initial period of unemployment and the last salary received [26]. The social security system in Slovakia, but also in all the countries of the Visegrad Group, may have influenced the fact that unemployment, especially the long-term one, is not a structural, but rather a systemic problem. It causes that is not worth working for the unemployed [27].
The economic situation, especially the labour market, is the subject of many studies and comparisons. The situation in the labour market is strongly influenced by the quality of human capital. Labour market research of the Visegrad countries concerning the years 1998–2014 indicates that employment rates are higher in Western Europe than in the Visegrad countries, and they grew more between 1998 and 2014. However, lower employment in the Visegrad Group is balanced by higher average hours and higher human capital among the employed [28].
Part of the analyses is aimed at assessing gender inequalities in the labour market. The relationship between the unemployment rate and changes in the level of inequality was analysed. In a study conducted for the period 2005–2017 among the Visegrad countries in the Czechia and Poland, an increase in unemployment rates has led to a reduction in gender inequality in unemployment. In Hungary, gender inequalities were very low, almost non-existent. In Slovakia, on the other hand, there was no correlation between the unemployment rate and changes in the level of inequality [29].
The analysis of the economic situation in the Visegrad countries in the years 1998–2015 indicates that the high unemployment rate was accompanied by a higher level of entrepreneurship measured by the number of newly created enterprises. The largest number of companies operated in the Czechia, the largest increase in the number of companies was recorded in Hungary, while the largest economic activity in 1998–2015 was in Slovakia, followed by Poland, Hungary and the Czechia [30].
Njegić, Živkov and Damnjanović [31] examined the level of synchronisation of business cycles between eight countries of Central and Eastern Europe (CEEC) and the EU-15. It was based on quarterly data (GDP) from 1995 to 2016. The results obtained suggest that the Czech Republic, Hungary and to some extent Slovakia had a higher level of synchronisation of business cycles with the EU-15, especially during the crisis in the case of short-term and long-term fluctuations. Poland had a lower level of synchronisation of business cycles and higher resistance to their impact. This means that Poland was better able to mitigate external system shocks.
The relationship between minimum wage and unemployment was also analysed. Between 2000 and 2014, in Czechia, Hungary and Poland, the increase in the minimum wage was followed by an increase in unemployment. The only exception was Slovakia, where an increase in the minimum wage from year to year led to an increase in the chances of unemployed people to return to the labour market [32].
Modern economic growth entails structural changes. The share of the broadly understood economy sectors (agriculture, processing industry and services) in added value and employment has been significantly transformed. Productivity growth in all sectors goes hand in hand with a decline in employment in these sectors. After the global financial crisis, the number of jobs in manufacturing industry decreased significantly. The service sector continues to be at the forefront of the contribution to job creation and value added. According to OECD statistics, since the beginning of the global financial crisis, the number of jobs in the European Union has increased on average only in the service sector, while in Hungary, it has increased in all three sectors, and in Poland and the Czech Republic, in the manufacturing sector [33].
Piątkowski (2020) diagnosed the current situation in the labour market and expectations towards employees as a result of the technological revolution and digitisation [34]. He also analysed whether there are groups of countries with similar characteristics describing the labour market in the EU. As a result of cluster analysis using the Ward method, he identified three groups of countries. The Czech Republic was in the cluster of countries with the greatest potential in the area of the analysed characteristics in comparison to other groups. To some extent, these countries can serve as a model for other EU Member States. Hungary and Slovakia are in the second cluster. These are countries with a high percentage of people employed for a fixed period of time and the lowest percentage of employees participating in work-related courses and training. Poland belongs to the third cluster. The employment rate in these countries is close to the EU average, while the number of graduates of technical and science faculties is much higher than the EU average.
After the disturbances resulting from the global financial crisis, the situation in the labour markets of the Visegrad countries began to stabilise [35]. Since 2008, the values of indicators have been growing, with the highest rate of labour market development in Slovakia and the lowest rates in Poland and Hungary [36]. Studies on the impact of the 2007–2009 crisis in the labour markets in the Visegrad countries showed that Poland and Hungary were less flexible and returned to the level of balance more slowly [37]. Hadaś-Dyduch et al. [35] (2016) studied the unemployment rate (1998–2016) using the wavelet analysis. They showed that the labour markets of the four Visegrad countries reacted differently to exogenous factors coming from the world market. Large fluctuations in the unemployment rate indicate that labour markets are highly sensitive to external factors originating from the global economy. Low volatility indicates relatively high stability of labour markets. The investigation revealed significant differences in the functioning of the labour market within the Visegrad group and confirmed that the markets have different stability. The best situation in the labour market was observed in Czechia, which was characterised by a low unemployment rate and relatively high stability of the labour market. Poland and Slovakia had the lowest labour market effectiveness.
In 2007–2012, the labour force participation of the population increased. The economic crisis had a different impact on different groups in the labour market. It has not led to an increase in discrimination against women, but it has made the situation of young people much worse during this period. The impact of labour market policies has had a major impact on changes in the unemployment rate. However, the priorities of this policy were different in the Visegrad countries. In the years 2007–2012, Czechia and Poland spent the most funds on supporting the rehabilitation of disabled people and increasing their employment and professional activation. Hungary spent the most money on direct job creation and start-up incentives, while Slovakia spent the most on employment incentives. Individual countries, along with the change in the situation in the labour market, have introduced changes in their activities. The largest changes in the structure of expenditure on labour market policies were observed in Hungary and the smallest in Czechia [12].
The use of EU funds to conduct effective labour market policies is measured by the effectiveness of the use of these funds. An extensive system of unemployment benefits extends the duration of job search [38,39,40]. Therefore, measures to counteract unemployment should be targeted at people at particular risk and should take into account their participation in various forms of activation. Particularly important is the identification of groups of people at risk of long-term unemployment [41]. The effectiveness of these measures depends on the needs of the labour markets in individual countries and is regionally differentiated [42].
Kwiatkowski [43], analysing the situation in the labour markets in the countries of the Visegrad Group, drew attention to the increase in unemployment rates and the decrease in employment rates during the global crisis in the period 2007–2009. In Poland, both indicators changed slightly, thanks to favourable GDP growth trends and the reduction of real wages and working time. The significant fall in employment in Hungary was due to a decrease in the GDP. It has been somewhat hampered by reductions in working time, real wages and productivity. Large job losses in Slovakia and Czechia were linked to weak GDP growth and strong real wage growth. Reductions in working time and labour productivity have not been able to reverse adverse employment trends.
Similar conclusions can also be drawn from the analysis of the median unemployment time in the years 2001–2017 [44]. For Slovakia, the median was much larger than the median set for other countries and in 2007 it was almost 35 months. Over the next two years, it fell to around 14.5 months, before rising again to 24.5 months in 2013. In the case of Poland, Czechia and Hungary, the average median hours of job search were similar and amounted to 10.1, 10.9 and 10.7 months, respectively. The median values between 2001 and 2017 were the least differentiated for Hungary (standard deviation was equal to 0.7 per month).
3. Description of Methods. Multidimensional Scaling
The study was conducted using multidimensional scaling methods. This is a technique that makes it possible to represent (un)similarity between objects described by multiple characteristics as distances between them in a space with a small number of dimensions (up to 3) in order to allow for graphical representation of the data. The methods of multidimensional scaling are divided into the following subdivisions:
- classic (metric) multidimensional scaling (cMDS), also called main coordinate analysis (PCoA),
- non-metric multidimensional scaling (nMDS),
- generalised multidimensional scaling (GMD).
The starting point in multidimensional scaling is the matrix of distance (similarities) between objects on a m-dimensional scale , where i, k—object number, n—number of objects [45] (p. 522). To determine the matrix a matrix was used, where is the value of the j-th variable in the i-th object (j = 1, 2,..., m). In typical economic studies, variables may be measured on different scales and may have different characteristics. If all the variables in the research are measured on a scale at least interval, then classic multidimensional scaling may be used. If at least one variable is measured on an ordinal scale, then non-metric scaling should be used.
If all the variables in the test are measured at least on a range scale, they can be divided into:
- stimulants (the highest possible value of the variable is desirable),
- destimulants (the lowest value of the variable is desired),
- nominants (a specific variable value is desired, called a nominal value or a value belonging to a certain range).
Before proceeding further, the destimulant and nominants should be transformed into stimulants in order to align the character of all variables. The unification of the character of the variables means that the greatest possible value will be desirable for each of them. Methods of transforming a nominant and a destimulant into stimulants can be found in the work by Walesiak and Dudek [46], and the formulas used in the article will be presented in the empirical part.
The next step in the survey is to normalise the variables in order to eliminate designations and to standardise their orders of magnitude in order to ensure their comparability. The most frequently used methods of normalisation are methods based on linear formula [45] (p. 526):
where: —the normalised value of the j-th variable in the i-th object, —the shift parameter to the conventional zero for the j-th variable, —the scale parameter for the j-th variable.
Relationships between and and i are as follows: , . By substituting different values for shift and scale parameters, 18 normalisation formulas can be obtained [45] (pp. 526–527). These are standardization formulas, unitary formulas and quotient transformations. Applied normalisation method will be discussed in the empirical part.
The next step is to determine the distance matrix between objects. For classic multidimensional scaling, the Euclidean metric is most often used. After determining the distance matrix in the m-dimensional space it is mapped to the matrix in q-dimensional space (q < m) in such a way that in q-dimensional space the distances from m-dimensional space are best preserved. The loss of information when mapping a distance matrix in a m-dimensional space to a distance matrix in a q-dimensional space is measured using a loss function called stress. It is a measure of the lack of matching between the distances from the matrix (in m-dimensional space) with distances determined after reducing the dimensions to q [47]:
where are distances between objects after the space dimension has been reduced from m to q. Multidimensional scaling minimises the stress function, and on this basis, an optimal representation of the distance matrix in the m-dimensional space to the distance matrix in the q-dimensional space is found.
Using two-dimensional multidimensional scaling, it is possible to present objects on a coordinate system, which makes it possible to separate groups of similar objects, or order objects from the best to the worst.
4. Description of Data and Variables
The survey used data from the EUROSTAT database. These data covered all the countries of the European Union from 2002 to 2019. The year 2002 was chosen as the beginning of the period under consideration, as this year the European Union reached an agreement with 10 candidate countries, including the Visegrad countries, on their accession to the Union on 1 May 2004. From this year onwards, Eurostat data in the labour market of all 28 Member States are also available. The end of the survey period shall be 2019, the latest year for which this data is available. The variables were accepted as variables:
- x1—registered unemployment rate (share of the unemployed in the number of professionally active persons—%),
- x2—youth unemployment rate (share of the number of unemployed people aged 15–24 in the number of economically active people in this age group—%),
- x3—long-term unemployment rate (share of the number of people unemployed for a period of at least 12 months in the total number of unemployed people—%),
- x4—median unemployment duration (in months),
- x5—activity rate (share of the number of economically active people aged 15–74 in the total number of people in this age group—%),
- x6—employment rate (share of employed persons aged 15–74 in the total number of persons in this age group—%),
- x7—duration of working life (in years),
- x8—age dependency ratio (ratio of the number of people in pre-working and post-working age to the total population).
Of these variables, x2, x3, x4 and x8 are destimulants (minimum value is desirable), x5, x6 and x7 are stimulants (maximum value is desirable), and x1 is a nominant. It was assumed that the nominal value of the unemployment rate is the natural unemployment rate. Different studies indicate different levels of unemployment, the study assumed a natural unemployment rate of 4.5% [48].
The first thing that is to be done is to convert the destimulants and nominant into stimulants. All variables in the study are measured on a ratio scale. For the variable measured on the ratio scale, the destimulant can be converted into a stimulant by calculating its reversal:
where: —value of the j-th variable being a destimulant in the i-th object. Calculated on the basis of the Formula (3) the stimulant will also be measured on the ratio scale.
The nominal value measured on the ratio scale can be converted into a stimulant using the following formula:
where:—value of the j variable being the nominant in the i-th object, —the nominal level of the j-th variable being the nominant.
Calculated on the basis of the Formula (4) stimulant will be measured on the ratio scale. After applying Formula (3) for variables x2, x3, x4 and x8 and Formula (4) for variable x1, all variables will be stimulants. After converting the destimulant and nominant into stimulants, the maximum and minimum values were selected for each variable. The maximum values of the variables formed a hypothetical country with the best values of the variables characterising the labour market, and the minimum values formed a hypothetical country with the worst values of the variables. The first one will be called the pattern at a later stage of the research, and the second one will be called the anti-pattern. The pattern and the anti-pattern are then added to the set of objects so that it will have 30 observations (28 Member States plus the pattern and the anti-pattern).
The next step is to normalise the variables. Among the available normalisation formulas, the min–max normalisation was selected [45] (p. 526):
The reason for choosing the min–max normalisation is that the normalised variables received with it will be in the range of [0, 1] and will have exactly the same range of 1. The minimum value of the standardized variable will always be 0 and the maximum value—1. Therefore, the values of all variables for the pattern will be 1 and for the anti-pattern—0.
After obtaining a matrix of standardised variables , the next step is to determine the distance matrix between objects (including the pattern and the anti-pattern) using Euclidean metrics and classic multi-dimensional scaling to reduce the number of dimensions from m = 8 to q = 2.
5. Empirical Analysis
After applying multidimensional scaling in each year of the survey (2002 to 2019), all countries and the pattern and anti-pattern were described using coordinates in a two-dimensional coordinate system. After applying the results to the chart, two extreme points were obtained in the form of a pattern and an anti-pattern, as well as points representing individual countries between them. Then the distance between the pattern and the anti-pattern was calculated and marked by da-p and four groups of countries were created depending on their distance from the pattern:
- the first group of countries with a very good situation in the labour market at a distance of no more than 0.25 da-p,
- the second group of countries with a good situation in the labour market at a distance from the pattern within the range (0.25–0.5] da-p,
- the third group of countries with an average situation in the labour market at a distance from the pattern within the range (0.5–0.75] da-p,
- the fourth group of countries with a bad situation in the labour market at a distance from the pattern within the range (0.75–1] da-p.
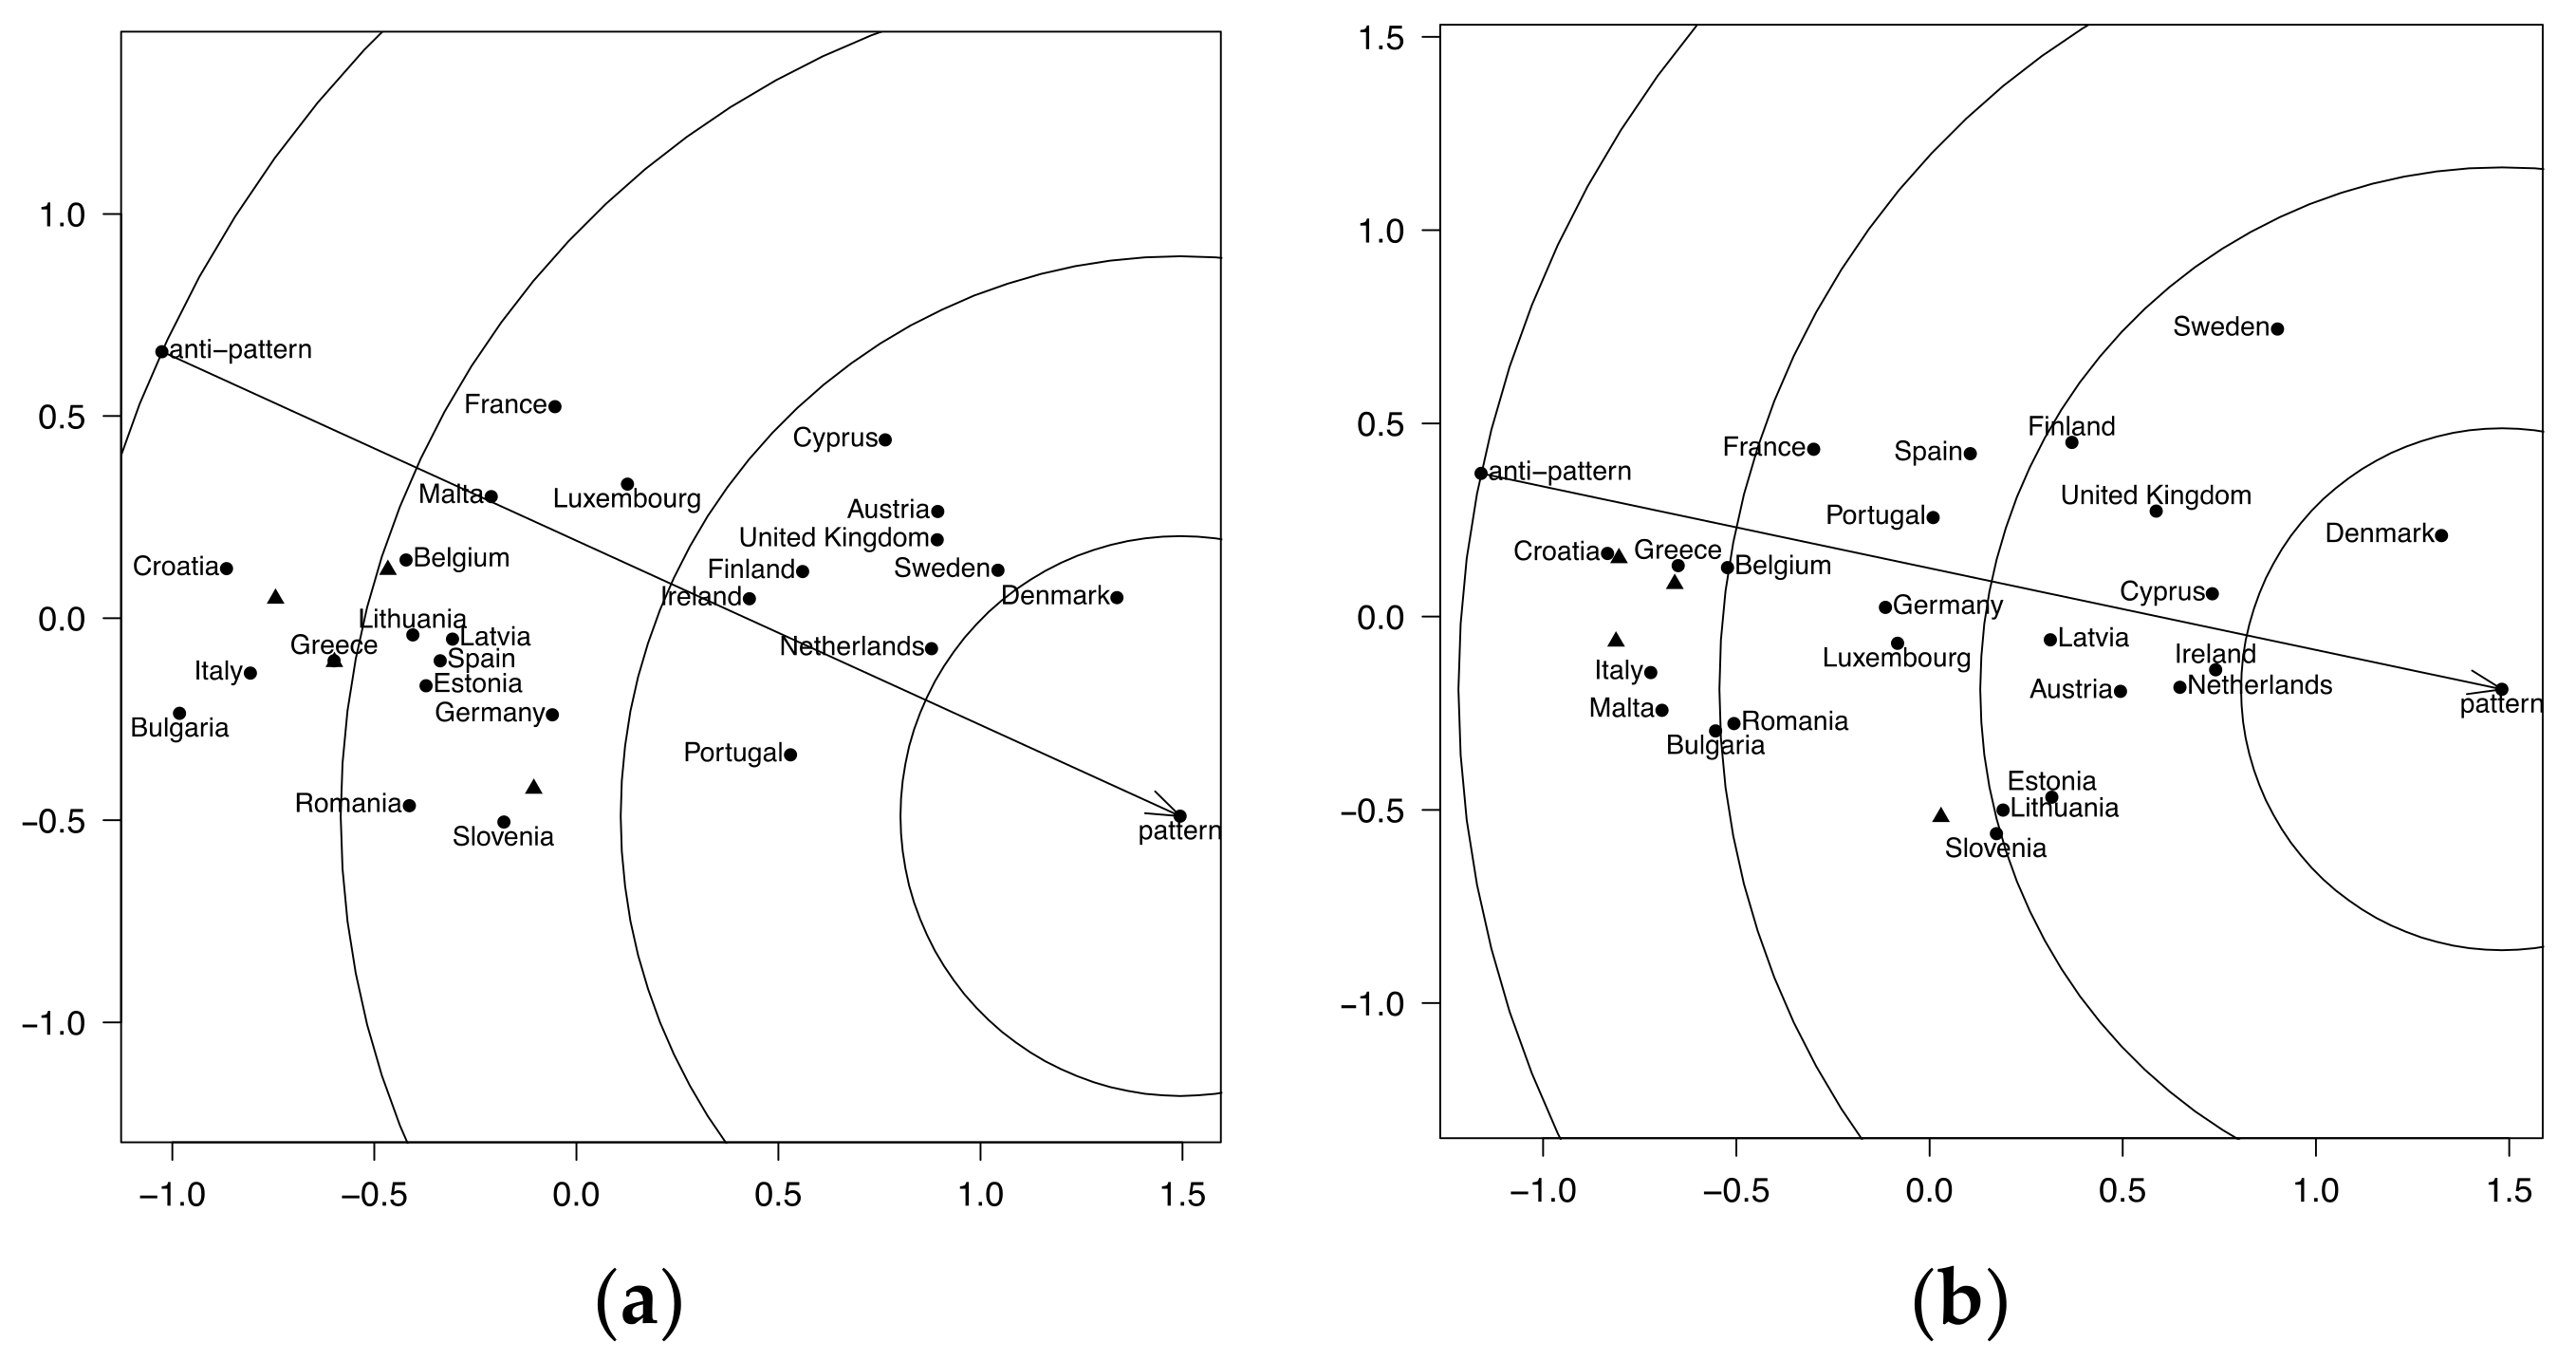
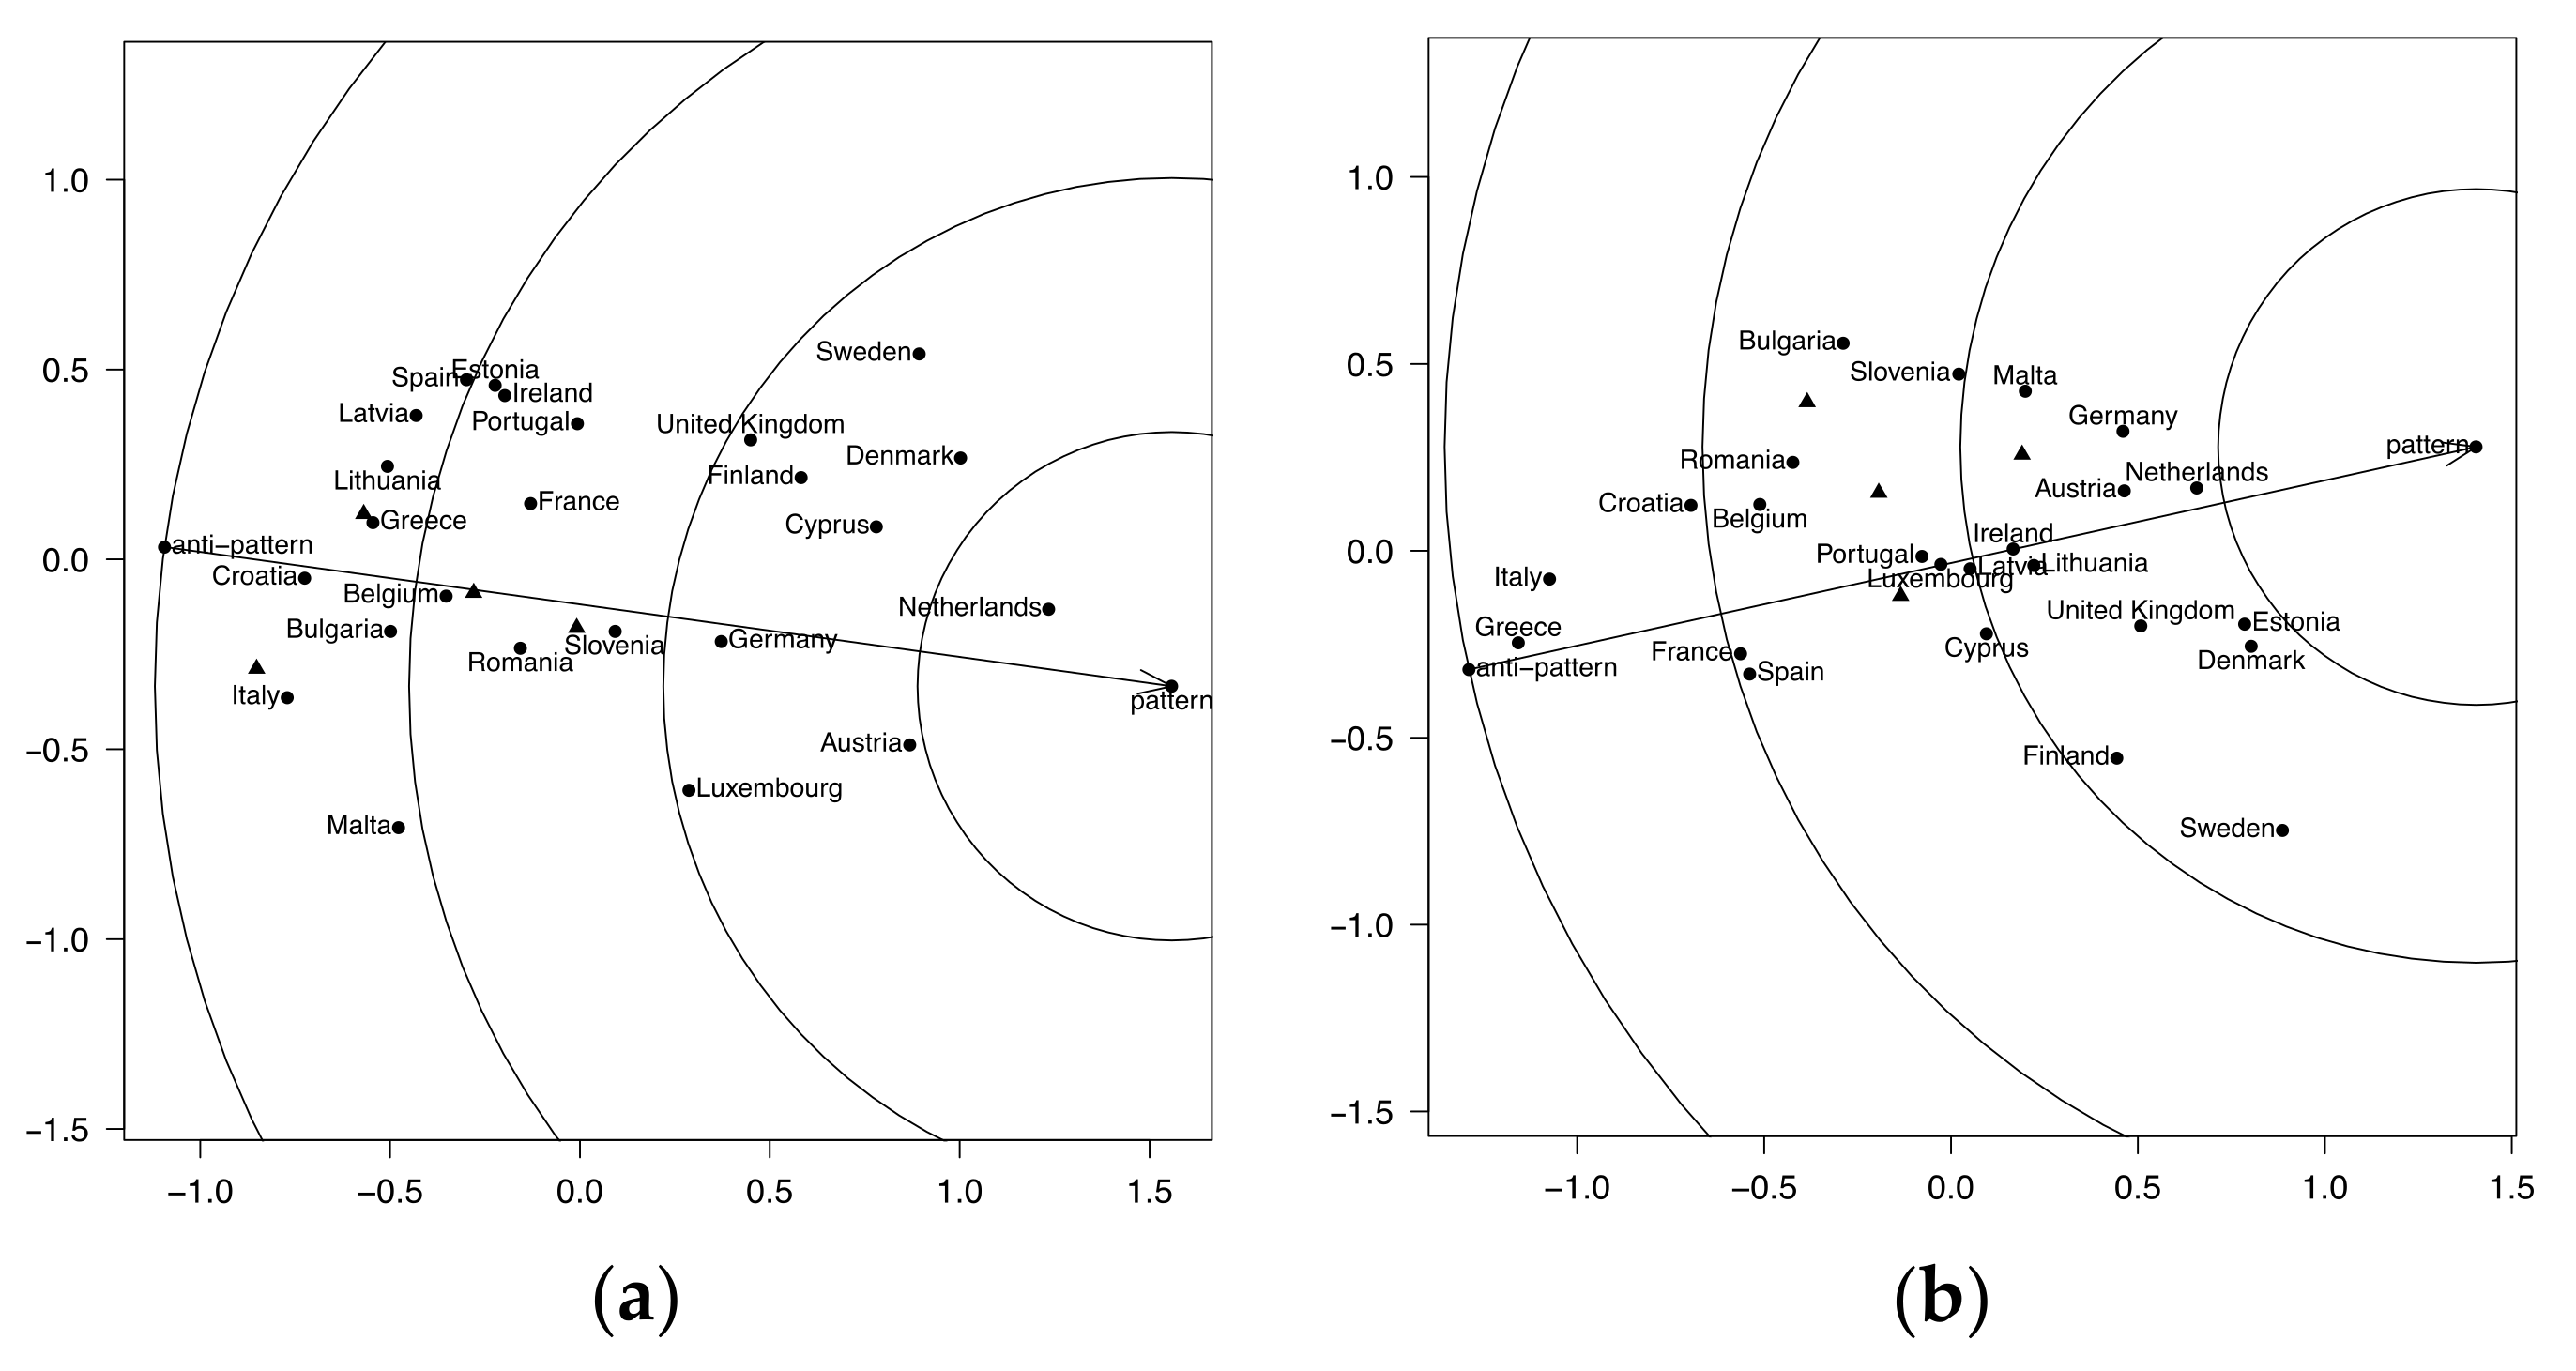
Since the study covers 17 years, there is no room for all charts. We decided to present the graphs for the following years: 2002, 2007, 2010 and 2019. The choice of these four years is due to the fact that the survey aims to highlight the situation of the Visegrad countries in the European labour market. Therefore, the first year (2002) was chosen to present the situation of Czechia, Hungary, Poland and Slovakia before their accession to the European Union. The graph for 2007 is intended to present the situation of the Visegrad Group countries on the eve of the global financial crisis of 2007–2009, the graph for 2010—the situation of these countries after the end of the first, largest wave of the crisis, and the graph for 2019—the situation at present. The results of the multidimensional scaling for the years discussed above are shown in Figure 2 and Figure 3.
In 2002, the countries of the Visegrad Group were among the countries with an average and bad situation in the labour market. Czechia was relatively best in this respect. The situation on the Czech labour market was more or less at the level of the German and Slovenian labour markets (the unemployment rate in Czechia was 7%, unemployment rate among young people at the level of 14%, high employment and professional activity rates). Hungary was also included in the group of countries with average situation in the labour market, although this country was on the verge of a bad situation (although the unemployment rate was one of the lowest and amounted to 5.6%, similarly to the unemployment rate among young people, amounting to 11.4%, while the employment, activity rates and duration of working life were at a low level). Poland and Slovakia were at that time the countries with a bad situation in the labour market. In particular, they were affected by high unemployment rates (around 20%), high youth unemployment rates (around 40%) and high long-term unemployment rates (almost 55% for Poland and 65% for Slovakia).
In 2007, four years after the accession of the Visegrad countries to the European Union, the labour market situation in these countries improved, with the exception of Hungary. In Czechia, the unemployment rate fell to 5.3% and the youth unemployment rate to 10.7%. Employment and participation rates have slightly improved and long-term unemployment has increased slightly. As far as Poland and Slovakia are concerned, the unemployment rate in these countries has significantly decreased as compared to 2002 (in Poland to 9.6%, and in Slovakia to 11.1%). They have also reduced youth and long-term unemployment rates. Employment and activity rates have improved slightly. It is also worth noting that in Slovakia the median unemployment duration increased significantly (from 17.7 to 32.7 months). In Hungary, activity rate and long-term unemployment rates have slightly improved, while unemployment, youth and employment rates have deteriorated. As a result, in 2007 Hungary was among the countries with a bad situation in the labour market, together with Poland and Slovakia, while Czechia was among the countries with an average situation in the labour market.
After the first wave of the global financial crisis in 2010, the situation in the labour markets of Czechia, Hungary and Slovakia deteriorated compared to the pre-crisis period. In each of the three countries, all three types of unemployment rate have increased, employment and activity rates have slightly deteriorated, and the median time spent out of work has been reduced. As far as Poland is concerned, it was the only country in Europe that achieved economic growth during the crisis, which translated into an improvement in the situation in the labour market. Virtually all indicators have improved, with the exception of the registered unemployment rate and youth unemployment rate, which have slightly deteriorated. Poland was in the group of countries (together with Czechia) with an average situation in the labour market, Hungary and Slovakia remained among the countries with a bad situation.
In the last year of the survey, 2019, the labour market situation in all Visegrad countries improved. Czechia has become a country with a good situation in the labour market (now it is amongst the best countries in the whole EU), Poland remained in the group of countries with an average situation. Hungary and Slovakia have also joined this group.
As far as the other EU countries are concerned, it can be noted that each year the group of countries with a very good or good labour market situation included Scandinavian countries, the United Kingdom, the Netherlands and Austria, and in most of the analysed years also Germany and Cyprus. On the other hand, the countries where the situation in the labour market was generally bad were Greece, Italy, Croatia and in most years of the analysed period also Malta and Bulgaria. The countries where labour markets improved most during the period under review were the Baltic States (Lithuania, Latvia and Estonia), although the financial crisis caused quite strong turbulences in their labour markets. In the last year of the survey, Estonia and Lithuania were amongst countries with a good situation in the labour market, while Latvia was very close to this group of countries.
In the second stage of the survey, countries were ranked according to the situation in the labour market. In order to determine the position of each country, the distances of that country from the pattern and the anti-pattern have been used. These distances were used to calculate the synthetic measure used in the TOPSIS (Technique for Order Preference by Similarity to Ideal Solution) method. The synthetic variable is determined as follows [49] (p. 132):
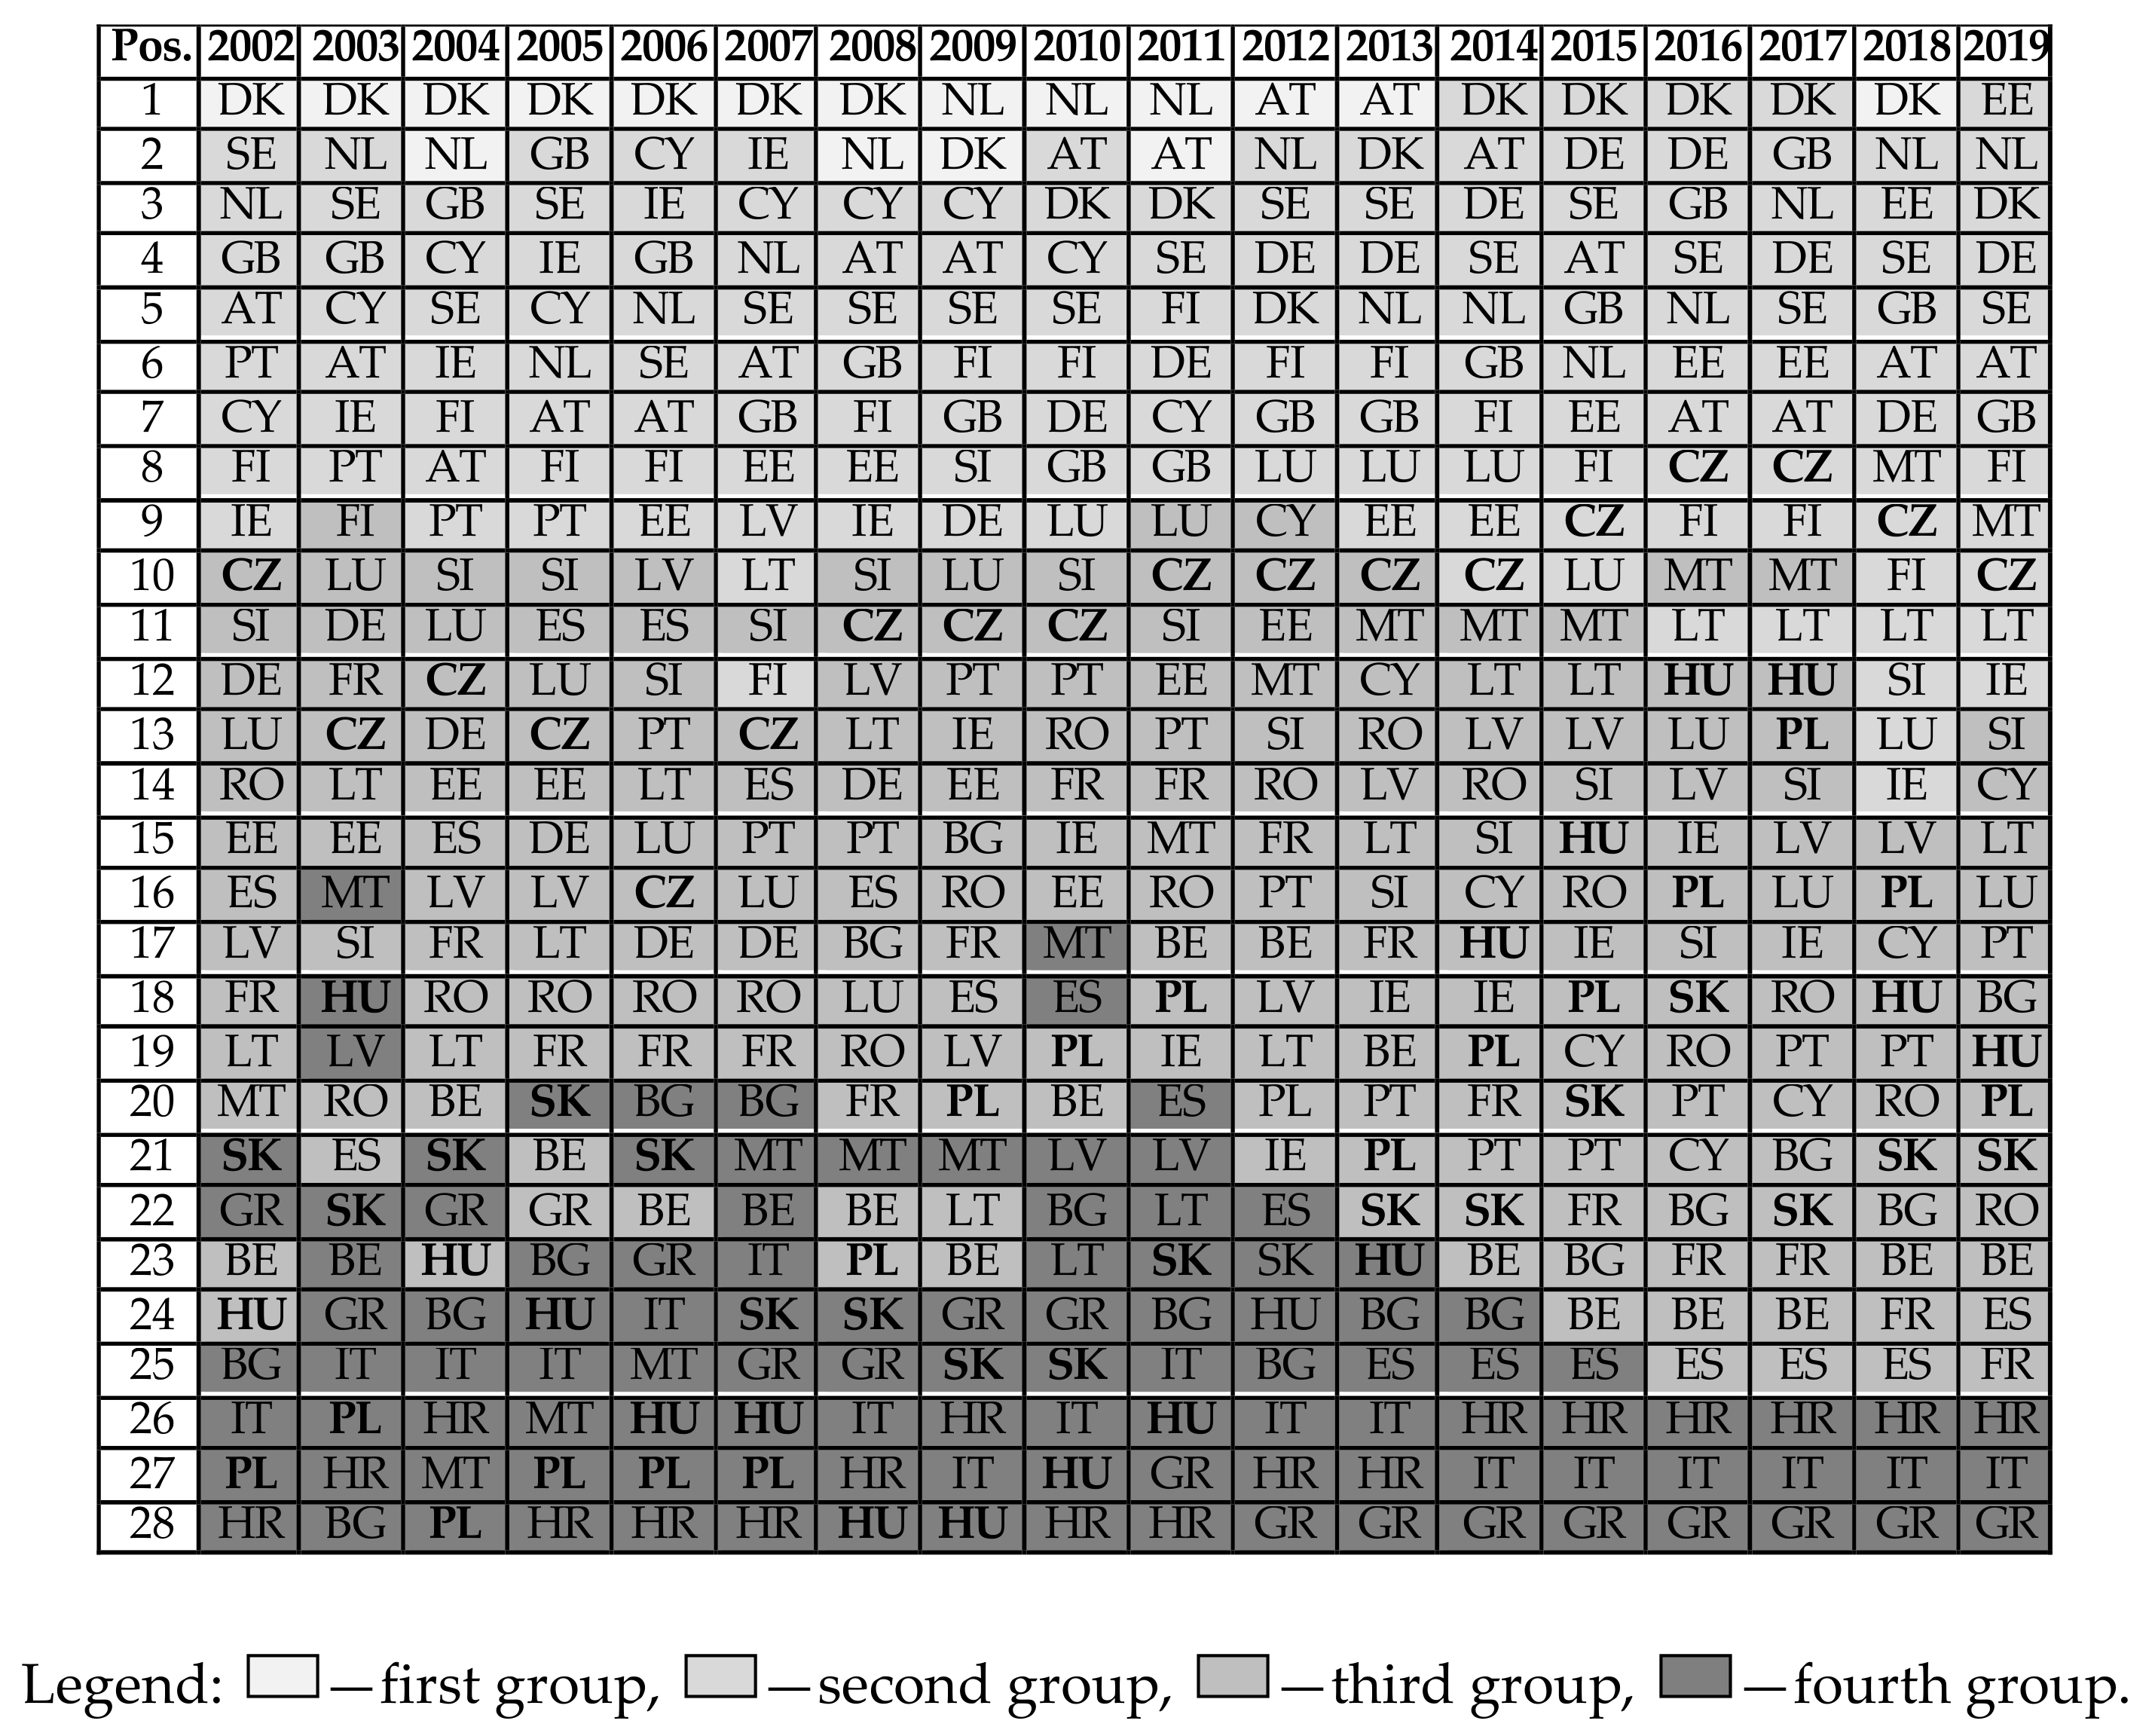
where: —the distance of the i-th country from the anti-pattern, —the distance of the i-th country from the pattern. Variable ci takes values from the range [0, 1]—the closer the value to 1 is, the better. States are sorted by decreasing values of the variable ci. The positions of individual countries according to the situation in the labour market in the years 2002–2019 are presented in Figure 4. In addition, the figure shows four previously defined groups of countries in grayscale.
In each of the years surveyed, Czechia was in the best position in the labour market among the Visegrad countries. The highest position of Czechia in comparison to other EU countries was in 2016 and 2017 and it was the eighth position, the worst position—in 2006—the 16th. Interestingly, the analysis of Hungary’s position is characterised by strong volatility in the period under review, the highest in 2016 and 2017—12th, and the lowest in 2008 and 2009—the last one, or 28th. Position of Slovakia in the period under review oscillated between 18th (in 2016) and 25th (in 2007 and 2008). The position of Poland in the European labour market has improved the most in the analysed period—from the last places in 2002–2007 to 13th in 2017. However, in the last two years of the survey, the position of Poland declined to the 16th in 2018 and 20th in 2019.
Denmark, the Netherlands, Austria, the United Kingdom, Sweden and Cyprus ranked highest in the survey period, while Croatia, Italy and Greece ranked lowest in addition to the Visegrad countries in the survey period, confirming the information presented in Figure 2 and Figure 3. It is worth noting that in the year 2019, Estonia became the country with the best situation in the labour market amongst the EU countries.
6. Discussion
The results of the present research are often concordant with similar, recently performed analyses. Berti, Meyermans [15] clustered the EU countries according to key indicators of the labour market activity rate, employment rate and unemployment rate. The data concerned the population aged 15–64 in 2013. One of the aims of the study was to identify countries similar in terms of the analysed characteristics. They showed that the Visegrad countries were among the countries with the average level of analysed variables together with Belgium, Bulgaria, Estonia, Ireland, France, Italy, Cyprus, Latvia, Lithuania, Luxembourg, Malta, Portugal, Romania, Slovenia, and Finland. The dynamics of the main indicators in the context of the EU labour market indicate that the labour market in the EU as a whole remains tense and varies considerably from country to country.
A deeper analysis of the diversity of the EU labour market was made by Lopes, Quaresma and Moura [50]. The aim of their study was a better understanding of the global EU labour market and capturing its heterogeneity. The authors developed the concept of labour market traction, which consists of a combination of variables from six Eurostat datasets on different topics (i.e., demography, structure of earnings, education and training, living conditions, employment and unemployment and national accounts). Using data mining techniques such as social networks and cluster analysis, they showed that this combined set consistently captured heterogeneity at the national level in the EU, creating well-defined clusters. The authors proved that there was a clear separation between Northern and Western European countries and Eastern European countries. The southern European countries seemed to form a bridge between the two blocks to some extent. Czechia and Slovakia found themselves in a common cluster with a large proportion of adults in the population. Among employed people, people with secondary education prevailed, and the least were those with primary education. Poland was in a cluster with a high percentage of employed older people. On the other hand, the Hungarian cluster was characterised mainly by high poverty rates, low disposable income and low expenditures on higher education.
Other directions of research concentrated on the assessment of the labour market. Research conducted in this field often leads to different results. Rollnik-Sadowska, Dąbrowska [51] clustered European countries in terms of the implementation of labour market policy (LMP) assessed on the basis of input–expenditure on different categories of LMP. Two periods were compared: 2004 and 2014. In 2004, Poland, the Czech Republic, Hungary and Slovakia were among the countries with the lowest public expenditure on LMP. In 2014, after the impact of the crisis on the global economy, the composition of clusters changed, but the Visegrad countries were still among the countries with the lowest expenditures on LMP. The same group included mainly countries of the former Eastern Bloc, but also Luxemburg and the UK. It turned out that countries with the best labour market indicators—the highest employment and the lowest unemployment (e.g., Germany, Denmark, Estonia, Czechia, Luxembourg, the Netherlands, Austria, Sweden and the United Kingdom)—were grouped in different clusters with different levels of spending on LMP. This also contradicts the thesis that countries with higher employment rates are those with higher expenditures on labour market policy, less rigid labour market institutions and product market regulation [52].
It is extremely difficult to compare the situation in different countries according to LMP. The data are not always complete and there are differences in the methods used to collect them. The European Union has not yet developed a common system for evaluating the effectiveness of the LMP.
7. Conclusions
The aim of the article was to examine the situation in the European labour market with particular emphasis on the Visegrad Group countries. It can be noted that the Czech labour market has held a high position throughout the whole period considered and has improved in the last years of the survey. Hungary’s position was characterised by high variability—Hungary was generally in the second half of the European Union ranking, which was mainly due to weaker employment and activity rates and the duration of working life. In the second half of the period under review, Hungary’s position in comparison with other EU countries improved. Slovakia was generally in a weaker position in the labour market, due to high unemployment rates, but as in the case of Hungary, its position improved. In the case of Poland, the improvement in the labour market was most visible. From the group of countries with the worst situation in the labour market in 2002–2007, Poland moved to the countries in the middle of the ranking in 2016–2018, however, its position somewhat deteriorated in the year 2019. In Poland, there was an improvement in every aspect of the functioning of the labour market—from unemployment rates to employment and activity rates. Czechia was characterized by the best situation in the labour market among all the Visegrad Group countries, approaching the most developed ones in this respect. The high level of Czechia’s economic development is also confirmed by other studies. Ivanová and Masárová [53] showed that Czechia had a high level of macroeconomic indicators over the period 2000–2015 and that an economic performance gap for all V4 countries had narrowed.
For the rest of the European Union, Denmark, Austria, the Netherlands, the UK and Cyprus saw the best labour market outcomes throughout the period. During the whole period, the situation of Estonia constantly improved and in 2019 it became the country with the best situation in the labour market in the EU. Generally, Croatia, Italy and Greece occupied the last positions in the ranking of countries with respect to their situation in the labour market.
The study took into account the long-time horizon—from 2002 to the present. Monitoring the situation on the labour market by means of widely used indicators (such as unemployment rates, employment rates, duration of unemployment, or demographic indicators) gives an overview of the current state of the market. This type of analysis may contribute to making better decisions in conducting active LMP. This is particularly important for the new member states, for which the old member states are a natural benchmark. It is not just about static levels of indicators, but about their dynamics over the years, taking into account the turbulence of crises. It is therefore important to observe whether the position of the new member states is approaching the benchmark positions. This can be done, for example, on the basis of the method used in this study.
The study confirmed the research hypothesis that the accession of the Visegrad countries to the European Union has improved the situation in their labour markets and their position in the European labour market, i.e., it is legitimate to state that the labour markets of these countries have benefited from the accession to the European Union. Social policy in the European Union should aim at bridging the gap between the “old” and “new” members. These measures should be part of an overall sustainable development strategy to reduce the clearly visible inequalities in the labour markets of individual countries. Further steps of research would be the assessment of influence the Covid-19 pandemic on the situation in the EU labour markets in both the relative and absolute sense.
Another plane of research into the labour market situation is not a comparative study, but a causal one. In order to perform the latter, it would be necessary to identify the factors that determine this situation for each analysed country, and then to determine their impact on the local labour market by means of econometric modelling. However, in such a situation, the results obtained would have to be applied only to the country concerned and not to comparisons between countries. With this approach, it is possible to try to identify homogeneous groups of countries in terms of factors that significantly affect their labour markets. It may be used for future research in this area.
Author Contributions
Conceptualization, B.B.-S. and K.D.; methodology, B.B.-S. and K.D.; software, B.B.-S. and K.D.; validation, B.B.-S. and K.D.; formal analysis, B.B.-S. and K.D.; investigation, B.B.-S. and K.D.; resources, B.B.-S. and K.D.; data curation, B.B.-S. and K.D.; writing—original draft preparation, B.B.-S. and K.D.; writing—review and editing, B.B.-S. and K.D.; visualization, B.B.-S. and K.D.; supervision, B.B.-S. and K.D.; project administration, B.B.-S. and K.D.; funding acquisition, B.B.-S. and K.D. All authors have read and agreed to the published version of the manuscript.
Funding
This research received no external funding.
Conflicts of Interest
The authors declare no conflict of interest.
References
- Stamm, I.; Matthies, A.L.; Hirvilammi, T.; Närhi, K. Combining labour market and unemployment policies with environmental sustainability? A cross-national study on ecosocial innovations. J. Int. Comp. Soc. Policy 2020, 36, 42–56. [Google Scholar] [CrossRef]
- Cahill, M. The Environment and Social Policy; Routledge: London, UK, 2002. [Google Scholar]
- Fitzpatrick, T. With no strings attached. In Environment and Welfare: Towards a Green Social Policy; Fitzpatrick, T., Cahill, M., Eds.; Palgrave: Basingstoke, UK, 2002; pp. 138–154. [Google Scholar]
- Gough, I.; Meadowcroft, J.; Dryzek, J.; Gerhards, J.; Lengfeld, H.; Markandya, A.; Ortiz, R. JESP symposium: Climate change and social policy. J. Eur. Soc. Policy 2008, 18, 325–344. [Google Scholar] [CrossRef] [Green Version]
- Johansson, H.; Khan, J.; Hildingsson, R. Climate change and the welfare state. Do we see a new generation of social risks emerging. In Sustainability and the Political Economy of Welfare; Koch, M., Mont, O., Eds.; Routledge: New York, NY, USA, 2016; pp. 94–108. [Google Scholar]
- Schaffrin, A. The new social risks and opportunities of climate change. In International Handbook on Social Policy and the Environment; Fitzpatrick, T., Ed.; Edward Elgar: Cheltenham/Northampton, UK, 2014; pp. 3–61. [Google Scholar]
- Gough, I. Climate change, social policy, and global governance. J. Int. Comp. Soc. Policy 2013, 29, 185–203. [Google Scholar] [CrossRef] [Green Version]
- Gough, I. Heat, Greed and Human Need: Climate Change, Capitalism and Sustainable Wellbeing; Edward Elgar: Northampton, UK, 2017. [Google Scholar]
- Balcerzak, A.P.; Pietrzak, M.B. Quality of Institutions for Knowledge-based Economy within New Institutional Economics Framework. Multiple Criteria Decision Analysis for European Countries in the Years 2000–2013. Econ. Sociol. 2016, 9, 66–81. [Google Scholar] [CrossRef] [PubMed]
- Balcerzak, A.P.; Pietrzak, M.B. Structural Equation Modeling in Evaluation of Technological Potential of European Union Countries in the Years 2008–2012. In Proceedings of the 10th Professor Aleksander Zelias International Conference on Modelling and Forecasting of Socio-Economic Phenomena. Conference Proceedings, Zakopane, Poland, 10–13 May 2016; Papież, M., Śmiech, S., Eds.; Foundation of the Cracow University of Economics: Cracow, Poland, 2016; pp. 9–18. [Google Scholar]
- Balcerzak, A.P.; Pietrzak, M.B.; Rogalska, E. Fiscal Contractions in Eurozone in the years 1995–2012: Can Non-Keynesian Effects Be Helpful in Future Deleverage Process? In Business Challenges in the Changing Economic Landscape—Vol. 1. Eurasian Studies in Business and Economics; Bilgin, M.H., Danis, H., Demir, E., Can, U., Eds.; Springer: Cham, Switzerland, 2016; Volume 2/1, pp. 483–496. [Google Scholar]
- Zieliński, M. Unemployment and Labor Market Policy in Visegrad Group Countries. Equilib. Q. J. Econ. Econ. Policy 2015, 10, 185–201. [Google Scholar] [CrossRef]
- Kacprzyk, A.; Doryń, W. Innovation and economic growth in old and new member states of the European Union. Econ. Res. Ekon. Istraživanja 2017, 30, 1724–1742. [Google Scholar] [CrossRef]
- Paetzold, J.; Van Vliet, O. EU Co-Ordination and the Convergence of Domestic Unemployment Protection Schemes. J. Common Mark. Stud. 2014, 52, 1070–1089. [Google Scholar] [CrossRef]
- Berti, K.; Meyermans, E. Sustainable convergence in the euro area: A multidimensional process. Q. Rep. Euro Area Dir. Gen. Econ. Financ. Aff. Eur. Comm. 2018, 16, 3–24. [Google Scholar]
- Demertzis, M.; Sapir, A.; Wolff, G. Promoting Sustainable and Inclusive Growth and Convergence in the European Union; Policy Contribution Issue 7; Bruegel: Bucharest, Romania, 2019. [Google Scholar]
- Hanus, L.; Vácha, L. Growth cycle synchronization of the Visegrad Four and the European Union. Empir. Econ. 2018, 58, 1779–1795. [Google Scholar] [CrossRef]
- EC. Europe 2020. A Strategy for Smart, Sustainable and Inclusive Growth, COM(2010) 2020; European Commission: Brussels, Belgium, 2010. [Google Scholar]
- Kovács, I.; Lopes, M.C. Employment and Sustainable Development: Education, Training and R & D in the Regulation of the Labour Market; SOCIUS Working Papers No 09/2010; SOCIUS-Centro de Investigação em Sociologia Económica e das Organizações: Lisboa, Portugal, 2010. [Google Scholar]
- Serrano, G.; Llamazares, F.; Otamendi, F.J. Measurement and Sustainability of the Qualifications Frameworks in the European Higher Education Area through an Employment Survey on Access to the Labour Market. Sustainability 2015, 7, 13777–13812. [Google Scholar] [CrossRef] [Green Version]
- Jelonek, M.; Urbaniec, M. Development of Sustainability Competencies for the Labour Market: An Exploratory Qualitative Study. Sustainability 2019, 11, 5716. [Google Scholar] [CrossRef]
- Svabova, L.; Durica, M.; Kramarova, K.; Valaskova, K.; Janoskova, K. Employability and Sustainability of Young Graduates in the Slovak Labour Market: Counterfactual Approach. Sustainability 2019, 11, 4462. [Google Scholar] [CrossRef] [Green Version]
- Lafuente, J.A.; Marco, A.; Monfort, M.; Ordóñez, J. Social Exclusion and Convergence in the EU: An Assessment of the Europe 2020 Strategy. Sustainability 2020, 12, 1843. [Google Scholar] [CrossRef] [Green Version]
- Ederveen, S.; Thissen, L. Can labour market institutions explain high unemployment rates in the new EU member states? Empirica 2007, 34, 299–317. [Google Scholar] [CrossRef] [Green Version]
- Su, W.; Zhang, D.; Zhang, C.; Abrhám, J.; Simionescu, M.; Yaroshevich, N.; Guseva, V. Determinants of foreign direct investment in the Visegrad group countries after the EU enlargement. Technol. Econ. Dev. Econ. 2018, 24, 1955–1978. [Google Scholar] [CrossRef] [Green Version]
- Szymańska, A. The labour market in the Visegrad Group countries—Selected aspects. Olszt. Econ. J. 2017, 12, 289–306. [Google Scholar] [CrossRef]
- Tvrdon, M. Unemployment as the Macroeconomic Problem: The Case of Visegrad Group Countries. Int. J. Syst. Appl. Eng. Dev. 2011, 2, 187–197. [Google Scholar]
- Kónya, I. Labor Input and Labor Income. In Economic Growth in Small Open Economies. Lessons from the Visegrad Countries; Kónya, I., Ed.; Palgrave Macmillan: Cham, Switzerland, 2018; pp. 29–45. [Google Scholar]
- Faďoš, M.; Bohdalová, M. Unemployment gender inequality: Evidence from the 27 European Union countries. Eurasian Econ. Rev. 2019, 3, 349–371. [Google Scholar] [CrossRef]
- Dvouletý, O. What is the Relationship between Entrepreneurship and Unemployment in Visegrad Countries? Cent. Eur. Bus. Rev. 2017, 6, 42–53. [Google Scholar] [CrossRef] [Green Version]
- Njegić, J.; Živkov, D.; Damnjanović, J. Business cycles synchronisation between the eu-15 and selected Eastern European Countries—The wavelet coherence approach. Acta Oeconomica 2017, 67, 539–556. [Google Scholar] [CrossRef]
- Kaderábková, B.; Jasová, E. The Relation between Minimum Wage and Unemployment across the Economic Cycle in Countries of the Visegrad Group. Proceedings of 11th Economics and Finance Conference 8910608, Rome, Italy, 27–30 May 2019; Cermakova, K., Mozayeni, S., Hromada, E., Eds.; International Institute of Social and Economic Sciences: Prague, Czechia, 2019; pp. 93–101. [Google Scholar]
- Novák, Z. Structural Change in Central and South Eastern Europe—Does Technological Efficiency Harm the Labour Market? Sustainability 2020, 12, 4704. [Google Scholar] [CrossRef]
- Piątkowski, M.J. Expectations and Challenges in the Labour Market in the Context of Industrial Revolution 4.0. The Agglomeration Method-Based Analysis for Poland and Other EU Member States. Sustainability 2020, 12, 5437. [Google Scholar] [CrossRef]
- Hadaś-Dyduch, M.; Pietrzak, M.B.; Balcerzak, A.P. Wavelet Analysis of Unemployment Rate in Visegrad Countries; Working Papers 37; Institute of Economic Research: Toruń, Poland, 2016. [Google Scholar]
- Szymczak, A.; Gawrycka, M. Labour Share in the Domestic Income Compared to Different Labour Markets. Enterprise in contemporary economy-theory and practice. Res. Enterp. Mod. Econ. Theory Pract. 2013, 4, 65–79. [Google Scholar]
- Furuoka, F. Hysteresis Effect on Unemployment: Evidence from the Visegrad Countries. Ekon. Časopis 2014, 62, 185–198. [Google Scholar]
- Bieszk-Stolorz, B.; Markowicz, I. Influence of Unemployment Benefit on Duration of Registered Unemployment Spells. Equilib. Q. J. Econ. Econ. Policy 2015, 10, 167–183. [Google Scholar] [CrossRef] [Green Version]
- Meyer, B.D. Unemployment Insurance and Unemployment Spells. Econometrica 1990, 58, 757–782. [Google Scholar] [CrossRef] [Green Version]
- Mortensen, D.T. Unemployment Insurance and Job Search Decisions. Ind. Labor Relat. Rev. 1977, 30, 505–517. [Google Scholar] [CrossRef]
- Bieszk-Stolorz, B.; Dmytrów, K. Application of the Survival Trees for Estimation of the Propensity to Accepting a Job and Resignation from the Labour Office Mediation by the Long-Term Unemployed People. In Problems, Methods and Tools in Experimental and Behavioral Economics. Computational Methods in Experimental Economics. CMEE 2017. Springer Proceedings in Business and Economics; Nermend, K., Łatuszyńska, M., Eds.; Springer: Cham, Switzerland, 2018; pp. 141–154. [Google Scholar] [CrossRef]
- Bieszk-Stolorz, B.; Dmytrów, K. Spatial diversity of effectiveness of forms of professional activisation in Poland in years 2008–2014 by poviats. Oeconomia Copernic. 2019, 10, 113–130. [Google Scholar] [CrossRef]
- Kwiatkowski, E. Recent Labour Market Trends in the Visegrad Group Countries. Comp. Econ. Res. 2011, 14, 25–40. [Google Scholar] [CrossRef]
- Dmytrów, K.; Bieszk-Stolorz, B. Mutual relationships between the unemployment rate and the unemployment duration in the Visegrad Group countries in years 2001–2017. Equilib. Q. J. Econ. Econ. Policy 2019, 14, 129–148. [Google Scholar] [CrossRef] [Green Version]
- Walesiak, M.; Dudek, A. Selecting the Optimal Multidimensional Scaling procedure for Metric Data with R Environment. Stat. Transit. New Ser. 2017, 18, 521–540. [Google Scholar] [CrossRef]
- Walesiak, M.; Dudek, A. Finding Groups in Ordinal Data: An Examination of Some Clustering Procedures. In Classification as a Tool for Research. Studies in Classification, Data Analysis, and Knowledge Organization; Locarek-Junge, H., Weihs, C., Eds.; Springer: Berlin/Heidelberg, Germany, 2010; pp. 185–192. [Google Scholar] [CrossRef] [Green Version]
- Buja, A.; Swayne, D.F.; Littman, M.L.; Dean, N.; Hofmann, H.; Chen, L. Data Visualization with Multidimensional Scaling. J. Comput. Graph. Stat. 2008, 17, 444–472. [Google Scholar] [CrossRef]
- Federal Reserve Bank of St. Louis. Natural Rate of Unemployment (Long-Term) [NROU]. Available online: https://fred.stlouisfed.org/series/NROU (accessed on 21 August 2019).
- Hwang, C.L.; Yoon, K. Multiple Attribute Decision Making. Methods and Applications. A State-of-the-Art Survey; Springer: Berlin/Heidelberg, Germany, 1981. [Google Scholar]
- Lopes, J.S.; Quaresma, S.; Moura, M. Labour Market Attractiveness in the EU, 2018 ed.; Statisctical Working Papers; Publications Office of the European Union: Luxembourg, 2018. [Google Scholar]
- Rollnik-Sadowska, E.; Dąbrowska, E. Cluster analysis of effectiveness of labour market policy in the European Union. Oeconomia Copernic. 2018, 9, 143–158. [Google Scholar] [CrossRef]
- Rovelli, R.; Bruno, R. Labor Market Policies, Institutions and Employment Rates in the EU-27. IZA Discuss. Pap. 2008, 3502, 1–42. [Google Scholar]
- Ivanová, E.; Masárová, J. Performance evaluation of the Visegrad Group countries. Econ. Res. Ekon. Istraživanja 2018, 31, 279–289. [Google Scholar] [CrossRef] [Green Version]
Figure 1.
Unemployment rate in the Visegrad Group and European Union (EU) 28 countries in the years 2002–2019. Source: Authors’ elaboration, based on the Eurostat data.
Figure 1.
Unemployment rate in the Visegrad Group and European Union (EU) 28 countries in the years 2002–2019. Source: Authors’ elaboration, based on the Eurostat data.

Figure 2.
Situation in the labour markets of the Visegrad Group countries in comparison with the EU in (a) 2002 and (b) 2007. Source: Authors’ elaboration, based on the Eurostat data.
Figure 2.
Situation in the labour markets of the Visegrad Group countries in comparison with the EU in (a) 2002 and (b) 2007. Source: Authors’ elaboration, based on the Eurostat data.

Figure 3.
Situation in the labour markets of the Visegrad Group countries in comparison with the EU in (a) 2010 and (b) 2019. Source: Authors’ elaboration, based on the Eurostat data.
Figure 3.
Situation in the labour markets of the Visegrad Group countries in comparison with the EU in (a) 2010 and (b) 2019. Source: Authors’ elaboration, based on the Eurostat data.

Figure 4.
Ranking of European Union countries by labour market situation in the years 2002–2019. Source: Authors’ elaboration, based on the Eurostat data.
Figure 4.
Ranking of European Union countries by labour market situation in the years 2002–2019. Source: Authors’ elaboration, based on the Eurostat data.

© 2020 by the authors. Licensee MDPI, Basel, Switzerland. This article is an open access article distributed under the terms and conditions of the Creative Commons Attribution (CC BY) license (http://creativecommons.org/licenses/by/4.0/).
Share and Cite
MDPI and ACS Style
Bieszk-Stolorz, B.; Dmytrów, K. Influence of Accession of the Visegrad Group Countries to the EU on the Situation in Their Labour Markets. Sustainability 2020, 12, 6694. https://0-doi-org.brum.beds.ac.uk/10.3390/su12166694
AMA Style
Bieszk-Stolorz B, Dmytrów K. Influence of Accession of the Visegrad Group Countries to the EU on the Situation in Their Labour Markets. Sustainability. 2020; 12(16):6694. https://0-doi-org.brum.beds.ac.uk/10.3390/su12166694
Chicago/Turabian StyleBieszk-Stolorz, Beata, and Krzysztof Dmytrów. 2020. "Influence of Accession of the Visegrad Group Countries to the EU on the Situation in Their Labour Markets" Sustainability 12, no. 16: 6694. https://0-doi-org.brum.beds.ac.uk/10.3390/su12166694
Note that from the first issue of 2016, this journal uses article numbers instead of page numbers. See further details here.