Interdisciplinary Hazards: Methodological Insights from a Multi-Sectoral Study of Drought in the UK


Centre for Socio-Legal Studies, University of Oxford, Oxford OX1 3UQ, UK
Sustainability 2020, 12(17), 7183; https://0-doi-org.brum.beds.ac.uk/10.3390/su12177183
Submission received: 3 August 2020
/
Revised: 28 August 2020
/
Accepted: 31 August 2020
/
Published: 2 September 2020
Abstract
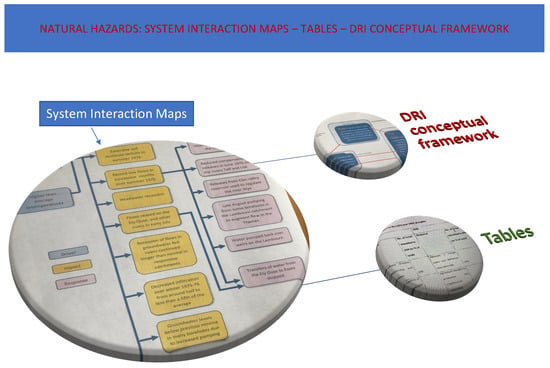
:This article discusses systems-based interdisciplinary research that seeks to understand interactions between natural and social dimensions of hazards. The discussion in this paper is motivated by two objectives. First, to present a novel methodology—Systems-Interactions Maps—for an integrated systems-based assessment of the linked social and natural causes, pathways, and consequences of climate related hazards, such as drought in the UK. Second, the article seeks to contribute to discussion of an under-explored topic: the actual process of developing and applying conceptual frameworks in interdisciplinary research groups, here for the purposes of mapping relationships between successive historical drought episodes. The findings based on data from the 1976 and 1995 droughts in the UK show that identified drivers, responses, and impacts can differ between natural and social science disciplines; that there is a degree of independence of social from natural dimensions of a hazard; and that the relative emphasis on social or natural drivers of a drought is shaped by the institutional and governance structure of the water sector.
1. Introduction: Frameworks for Analyzing Natural Hazards as both a ‘Natural’ and ‘Social’ Phenomenon
Most hazards observed in the natural world—such as droughts, floods, fires, or even earthquakes—have ‘natural’ (ecological) and ‘social’ causes, responses, and impacts. Recognition that hazards can involve interactions between social and natural systems has led to an increasing emphasis on interdisciplinary research in academia and within the policy sphere, including by the European Commission [1], the US National Science Foundation [2], and both natural and social scientific Government Research Councils in the UK (UK Research and Innovation (UKRI)) [3,4] (p. 3).
This article begins by critically reviewing two key systems-based frameworks, often applied for analysing hazards from an interdisciplinary perspective, Ostrom’s Social-Ecological System (SES) and the Drivers, Pressures, States, Impacts and Responses (DPSIR) framework, including recent further developments and applications of these in the context of floods and droughts. These frameworks include tightly coupled, cause-effect models applied to quantitative data as well as non-deterministic conceptualisations of nature-society interactions for interpreting qualitative data [5,6]. Systems-based frameworks are particularly apt for examining links between the ‘natural’ and ‘social’ dimensions of hazards. They relate the various natural and social dimensions of a hazard in structured, patterned, specific, and sometimes path-dependent and therefore ‘systemic’ ways. For instance, during various drought episodes occurring over a number of years, the same link between particular drivers of drought, such as changing rainfall patterns, and distinct responses, such as temporary water use restrictions for domestic householders, may be observed. However, such systemic links can also change and adjust in response to external disturbances [7] (p. 246).
1.1. Elinor Ostrom’s Social-Ecological System (SES) Framework
Ostrom’s [8,9,10] influential SES framework was developed for complex adaptive systems. It is a generalised, multi-tier, nested framework for analysing interactions and outcomes in natural resources, such as fisheries or forests, or in a focused SES, e.g., a specific episode of drought [9] (p. 420). There are four core internal sub-systems in the first tier: resource systems, governance systems, resource units, and actors. The two external sub-systems are, on the one hand, the social, economic, and political context, and, on the other hand, related ecosystems. Outcomes of a SES are the result of the interactions between each of these internal and external sub-systems. Each sub-system comprises a group of multiple second-tier variables, such as property rights systems for governance; or the size or location of the resource system. Hence, Ostrom’s framework enables to understand the dynamic features of a SES by conceptualising these as part of an integrated regime, i.e., a system, without neglecting the agency of people inhabiting a SES [10] (p. 30). The framework can be applied, for instance, when aspects of an SES are shaped dynamically by globalisation [11] (p. 2). The SES framework and its variants are system-based also, because they enable to identify properties of the system as a whole, such as redundancy or diversity. Trade-offs between such characteristics can then be identified, for instance between narrowly focused efficiency in achieving outcomes (e.g., intensive agriculture at the cost of diversity), and robustness of the SES system, e.g., food production and supply as a whole [12] (pp. 517, 528).
A major benefit of Ostrom’s framework is a common classification of features of a hazard which make it possible to examine a single focal SES at different spatial and temporal scales. Moreover, by highlighting interactions between social and natural systems, SES frameworks go beyond an ecology perspective that understands resilience as the return time of an ecosystem, such as the return of a coral reef to equilibrium after bleaching [13] (pp. 256, 7). Hence, the promise of systems-based frameworks is better precautionary planning to mitigate impacts [14] (p. 1536) [15] (p. 11). However, Ostrom’s framework may be best suited to examining intersections between ‘natural’ and ‘social’ dimensions of hazards in small-scale, locally governed settings rather than large, such as regional commons, which are also governed at a national scale. Trust and reciprocity are conditions of the self-governance of commons which is advocated by Ostrom, but these can be more difficult to establish and maintain on the scale of regional and global commons [16] (pp. 16–17). Hence, SES frameworks may not be best suited to analyse a historic drought episode (see e.g., [17]) and to capture its complex interdependencies between different internal and external sub-systems, particularly where the scale is large, such as in the UK. Anderies and Janssens’ [12] approach entails to focus on one particular aspect of SES interactions, such as system wide impacts which can be linked back to public policies, and changes in these. They identify opportunities for experimentation and adaptation, pointing out that making and implementing policies is linked back to slow feedback from the biophysical context [12] (pp. 513–515). A further challenge in applying Ostrom’s SES framework for quantitative analysis and in interdisciplinary research groups is to define and agree some measure of the relative importance of each of the potential variables used for measuring aspects of governance or resource systems, both during a specific drought episode and across different drought episodes. Are each of the variables measuring aspects of an internal and external sub-system equally relevant to a drought? Do some variables have a larger effect than others? Does water storage have the same impact on a drought as a specific distribution of property rights in relation to water and/or land? Ostrom’s framework and its variants enable flexible applications by providing for a whole range of potential variables, such as nine indicators of ‘resource systems’, seven variables for measuring ‘resource units’, eight for operationalising the notion of a governance system, and eight further variables for capturing different dimensions of ‘actors’, with an additional ten indicators of ‘activities and processes’ constituting action situations, and three criteria for assessing ‘outcomes’ of an ‘action situation’ [18] (p. 156). However, SES frameworks do not provide criteria for selecting from these variables. This can lead to inconsistency in the application and measurement of variables, making it more difficult to replicate and compare different case studies [18] (pp. 152, 4, 6). In contrast to this, the other main systems-based and widely applied Drivers, Pressures, States, Impacts, and Responses (DPSIR) framework pares down core concepts for analysing systems interactions. This can be particularly appropriate for the historical analysis of a focal SES that recurs over time, and thus generates many data points.
1.2. The DPSIR Framework
The DPSIR framework adopts a causal approach to examining a hazard by connecting a series of drivers, e.g., of a drought or flood, to pre-existing pressures on the environment, to states of the natural environment, and finally to impacts and responses [19]. However, connecting the elements of the causal chain can be complex. For example, the causes and consequences of hazards such as drought can depend on myriad, non-static factors including the available water resources, the water efficiency of different users (such as industry, farmers, and households) as well as the degree to which they change their water use in response to restrictions.
Like SES, traditional DPSIR frameworks have been considered as not linking closely enough natural and social drivers, responses, and impacts of hazards. Moreover, DPSIR has been criticised for neglecting that drivers, impacts, and responses may vary according to the particular type and scope of spatial scale at which a hazard manifests, such as jurisdictional, geographical, policy, and social community scales [20] (pp. 871–873). However, specifying in interdisciplinary research groups the temporal and spatial scales at which the most important drivers, pressures, states, impacts, and responses of a natural hazard operate is difficult because each disciplinary lens can steer towards a different scale. Hydrological and social data are often collected at different scales [21] (p. 231). In light of this, debate about how best to analyse links between natural and social dimensions of water-related hazards is ongoing, in particular in hydro-sociology and socio-hydrology literature (e.g., [22]).
1.3. Linking Natural and Social Dimensions of Water-Related Hazards
A key link between natural and social dimensions of water-related hazards is the impact of human responses to floods and droughts, including their unintended consequences [23] (p. 2, 5) [24]. One of these is the ‘Peak Water Paradox’. It entails that actions taken to reduce vulnerability to drought can enhance drought effects, because communities come to rely on the extra water made available, e.g., through reservoirs, thereby off-setting initial water-saving behaviours [23] (p. 5). These further developments of systemic frameworks seek to achieve depth in the analysis of linked social and natural worlds through a focus often on only one of the DSPIR elements, such as responses to or impacts of floods and droughts, e.g., [23,25,26,27]. Di Baldassarre et al. [21] focused on two elements. They examined responses, i.e., operating rules that increase the flow of water out of a reservoir during drought, and their non-stationary impact, which was in 2011 to exacerbate floods in Brisbane, Australia. The resilience of communities was lowered because they thought that the reservoirs had made flooding unlikely [21] (p. 227). In a further study, Albertini et al. [28] developed an integration of natural and social dimensions of floods and droughts through a socio-hydrological model that examines links between reservoir management strategies, societal flood risk adaptation, and mitigation strategies, as well as flood impacts. The study found that memories of floods matter since they shape flood risk. Flood impacts decrease if natural flood management is adopted, while they increase in flood plain management systems that rely on infrastructure measures for reducing flood risk which, in turn, are associated with lower levels of flood memory [28] (p. 20).
Similarly, Gonzales and Ajami [29] (p. 10620) have identified a ‘rebound effect’ over the last decades in California. There has been increased water use post drought when there are no water scarcity cues, such as restrictions, and citizens therefore do not perceive water to be in short supply. Similarly, Kam et al.’s [25] research shows in the context of various Californian droughts that social triggers, such as government announcements, generated longer lasting interest of citizens in drought than natural triggers, such as the peak of actual drought severity. Some frameworks make it possible to add a historical perspective to DPSIR, since their modelling recognizes the impact of social memories of previous occurrences of drought in their analysis of responses to it [29] (p.10,626). The Drivers, Responses, and Impacts (DRI) framework, a modification of DPSIR, builds on this in layering analysis of successive drought episodes, and including oral histories as a distinct source of qualitative data about social memories, but how was this DRI framework developed in an interdisciplinary research group, and what more generic methodological lessons did this process generate?
2. Methods
2.1. Steps for Developing Conceptual Frameworks
Published research often goes straight to the presentation of a neat, ready-made, finished model. However, as Di Baldassarre et al. [21] (p. 230) pointed out, there are five steps for developing knowledge about natural hazards: (1) data collection and analysis; (2) examination of these data to determine salient facts that still need a formal explanation; (3) theory development via formulation of models capturing the salient facts; (4) model calibration, validation, and uncertainty analysis; and (5) application of models to support the decision-making process.
This Section 2 focuses on steps 1 to 3 and draws out some implications for step 5. Given the challenges of developing and applying systemic frameworks identified in Section 1 above, this section seeks to provide a transparent account of the genesis of the DRI framework, also in order to facilitate future interdisciplinary research. The DRI framework was developed for an interdisciplinary research project about historic drought episodes in the UK as they manifested in seven sectors: meteorology/hydrology (referred to for the purposes of the System Interaction Maps (SIMs) below as “Groundwater/Surface water”), governance, print and social media, oral history, ecology, agriculture, and water resources (http://historicdroughts.ceh.ac.uk). The project collated historical data in order to capture information about actual responses and impacts that did occur, in contrast to modelling on the basis of assumptions about potential human responses, such as whether farmers would be prepared to pay a higher fee for per acre irrigation [26] (p. 713). The research involved developing a set of concepts and a database in order to collect—independently by researchers from each sector but with reference to a common framework—relevant data on social and ecological systems. Various contextual considerations led to the choice of the DRI, a modified version of the DPSIR framework. These contextual considerations included: the scale of the social and ecological system under examination; how the ecological and social systems are conceptualized (does the ecological system provide utility for humans or is the focus on its own internal functioning?); and the assumed interaction between the social and ecological systems (does the ecological system influence the social system or vice-versa, or is there a two way interaction?) [30]. So, how did the seven sectors—represented by different groups of researchers—then orient their research activities to the common DRI framework?
2.1.1. Agreement on Common Language and Key Concepts
The first step consists of obtaining some agreement across a consortium of researchers on key foundational concepts and terminology used in the project. This can reduce the risk of selectively and too quickly fitting into a model human dimensions of a natural hazard that are amenable to quantitative measuring. Some approaches steer towards quantitative modelling of human features of drought in order to render them compatible with quantitative modelling of the biophysical aspects of a drought. An example of this is reference, e.g., to ‘human systems’ captured through measurable preferences, constraints, and processes, such as market mechanisms for allocating land, water, and other resources [26]. Apart from avoiding a default choice of quantitatively defined concepts, critically reflecting and agreeing on key foundational concepts and terminology can enable effective communication between consortium members with different disciplinary backgrounds [31].
Hence, definitions of drought that avoid rigid sectoral distinctions between hydrological, socio-cultural, regulatory, and agricultural drought are apt for interdisciplinary research groups. Drought can be defined as a linked natural-social phenomenon involving a marked decrease in precipitation over a period of time, coupled with various forms of damage, such as economic losses for communities and harm to natural environments [23] (pp. 1–2) [27] (p. 3429) [32]. Droughts are systemic and, in Ostrom’s terms, polycentric, because “many elements are capable of making mutual adjustments for ordering their relationships with one another within a general system of rules where each element acts with independence of other elements” [7] (p. 255).
2.1.2. Developing Conceptual Frameworks Deductively or Inductively?
Another strategic choice is whether data are collected, classified, and analysed inductively or deductively. For a deductive approach, theoretical propositions, or hypotheses, are developed, and then ‘tested’ using data collected about a specific hazard. Here, data are collected, classified, and analysed in a particular way with reference to a pre-existing conceptual framework. Such an approach is quite structured and systematic because it starts from a set of a priori assumptions about the interactions between social and ecological systems. However, the assumed interactions may be inaccurate, and a wider range of interactions between social and ecological systems may be overlooked, because relevant data have not been collected [23] (p. 12).
In contrast to this, inductively generated frameworks start with data collection and researchers then seek to identify patterns in the data in order to draw out conceptual, more generalized insights about sector interactions. An inductive approach can be particularly relevant for the analysis of historic droughts, because it traces how different social and ecological drivers interact over a sequence of specific drought episodes. A ‘social’ driver of a drought might involve consumer/citizen behaviour with respect to water use or government policy for investment in, or sharing of, water resources. A ‘natural’ driver might be low rainfall or flow characteristics of surface or ground water. Without specific variables for collecting and classifying data about such natural and social dimensions of a hazard it may be difficult to develop insights about interactions between different sectors during a drought. It may be more difficult to identify what sectors in particular cause drought, what sectors generate relevant responses to drought, and in which sectors the main impacts of drought manifest, especially where that analysis is conducted over several decades. As further discussed in Section 3 below, the article therefore suggests to combine inductive and deductive approaches.
2.1.3. Quantitative or Qualitative Analysis?
Different sectors that can feature in an interdisciplinary analysis of natural hazards, such as drought, e.g., meteorology/hydrology, governance, print and social media, oral history, ecology, agriculture, and water resources, place different emphasis on qualitative and quantitative analysis. This makes it more difficult to ‘narrate’ a coherent inter-disciplinary story using the data collected. Too much emphasis on quantitative data about the natural environment overlooks the value of qualitative data in filling gaps that are not covered by more macro-level quantitative analysis. Social actors’ perceptions of natural hazards, which can be analysed with the aid of qualitative interview data, can supplement characterisations on the basis of natural science indicators, such as river levels, precipitation indices, and soil moisture levels in the case of drought [33] (p. 4807). For example, in some UK catchments droughts are experienced by some residents as sunny weather conditions or business opportunities for animal feed retailers [7] (p. 245) [34]. Hence, in an interdisciplinary project it can be important to enable each sector to collect data in the most appropriate form, either quantitative or qualitative or both. Each sector can then classify and analyse that data using common concepts that form part of a standard framework. Agreeing on definitions of key concepts, such as drivers, impacts, and responses, provides some opportunity for comparing both quantitatively and qualitatively, e.g., impacts and responses from various sectors, e.g., the impact of longer term crop change patterns in the agricultural sector, and more short-term responses, such as changes in irrigation times. Section 3 examines further how the DRI framework seeks to facilitate such comparisons.
2.2. Applying the DRI Framework
2.2.1. The Drivers, Responses, and Impacts (DRI) Conceptual Framework
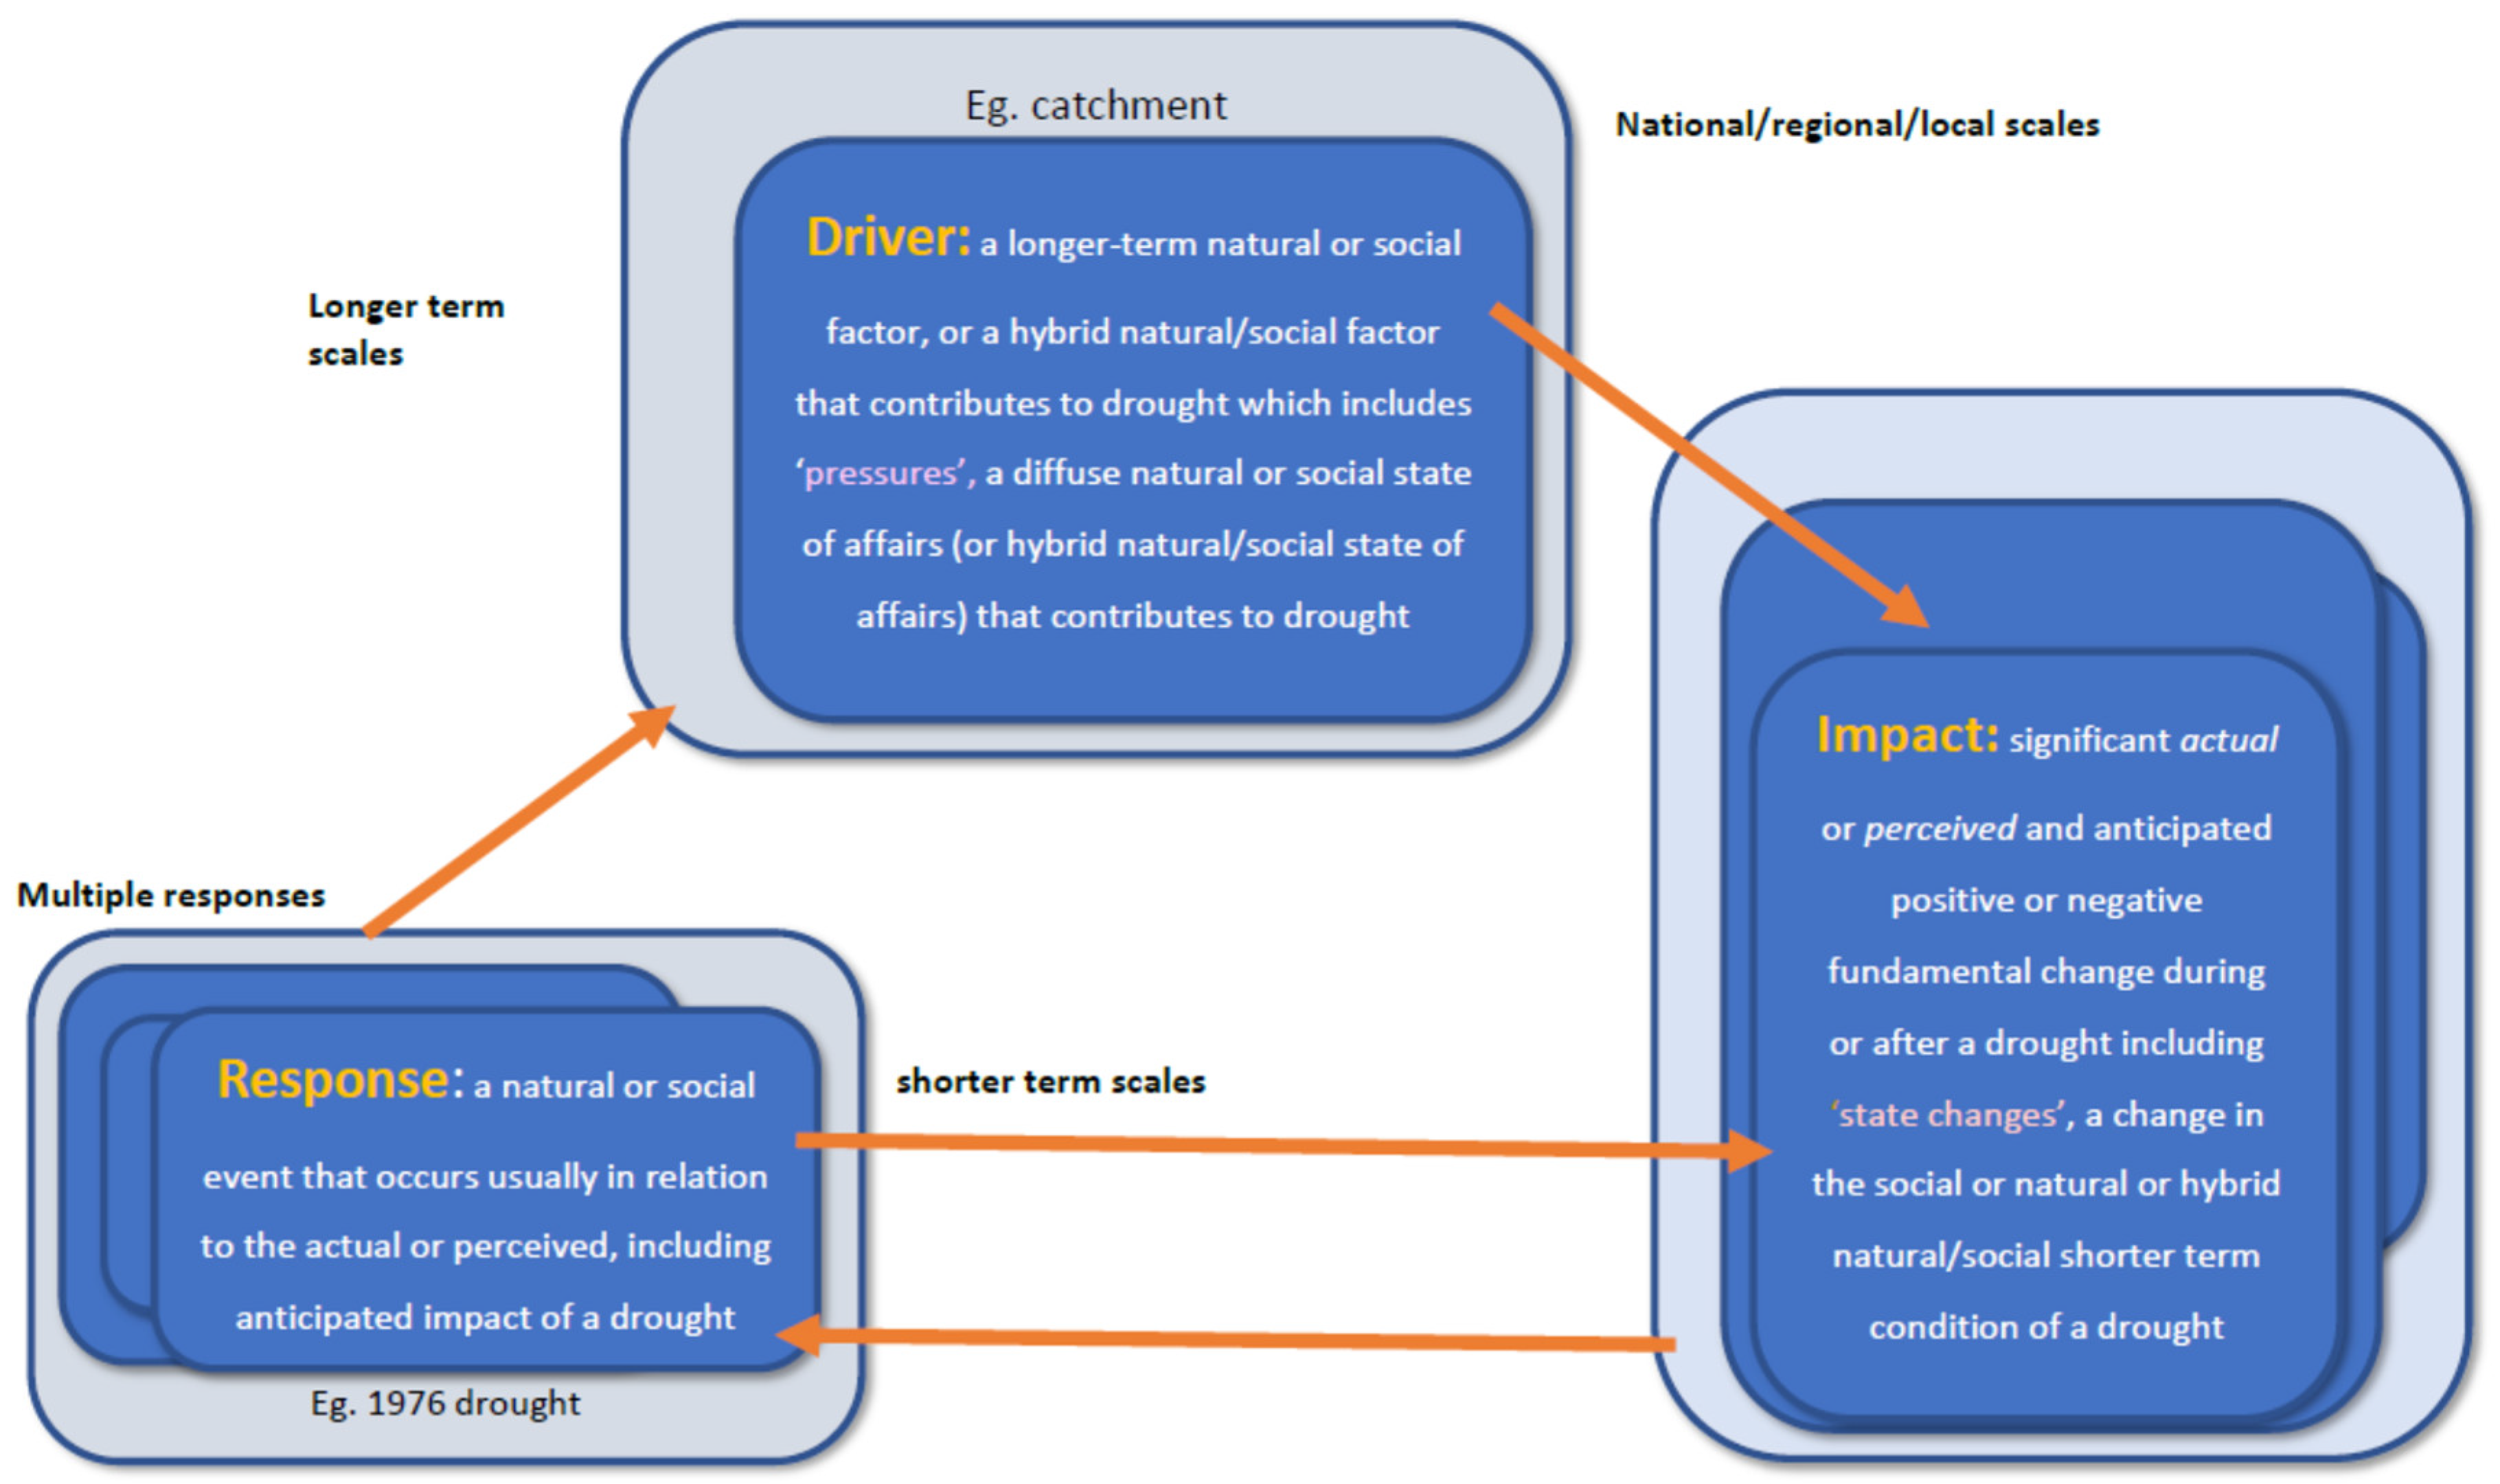
The DRI framework focuses on drivers, responses, and impacts by considering ‘pressures’ as a sub-category of ‘drivers’ and ‘states’ as a sub-category of ‘impacts’. This more parsimonious version of DPSIR is intended to focus data collection on drivers, responses, and impacts, and thereby to keep data sets manageable, given the wide, and in terms of disciplinary perspective, diverse range of sectors in which drought can manifest. The DRI framework defines each of its elements, drivers, responses, and impacts, and the sub-categories of states and pressures as capable of being shaped by linked natural and social hybrid factors. Sometimes only the combination of both natural and social processes contributes to the creation of, e.g., a driver of drought. For example, transport policies that rely on energy sources associated with high levels of greenhouse gas emissions have been associated with a changing climate [35] (p. 8), which, in turn, may lead to rainfall deficiencies that cause a drought. Recognising linked natural and social, thus ‘hybrid’ drivers, or responses, or impacts further promotes an integrated perspective of natural hazards.
In contrast to this, some frameworks discussed in the literature include both natural and social factors shaping a hazard, but natural factors are considered to be distinct from social ones, possessing their own specific characteristics. For instance, existing DPSIR models often see responses and impacts as located mainly in the social world, while states are confined to the natural environment. A further illustration of this is an understanding of drought as manifested in soil moisture deficits that then are further modified by distinct and thus ‘complementary’ human factors, such as a change in crops planted, or altered abstraction patterns [36] (pp. 3631, 3635, 3638).
Similarly, a framework for understanding droughts in the Willamette River Basin (WRB) in the western part of the US state Oregon draws on separate models of the ‘biophysical world’ and ‘human systems’. These models represent discrete natural and social dimensions of drought without specifying the degree of human shaping required to turn a particular system into a human one, distinguishable from a biophysical world [26] (p. 712). For instance, why should we consider agriculture as part of the human systems element of the model, while forests are categorized into the biophysical world? Figure 1 below illustrates the DRI framework and its definitions, and how this framework takes into account hybrid natural-social factors.
How can the purpose that informs the DRI framework, i.e., to identify various types of links between social and natural dimensions of natural hazards, be further operationalised when we try to understand—across various sectors—what causes a natural hazard, what its impacts are and what responses it engenders?
2.2.2. Developing Systems Interactions Maps (SIMs)
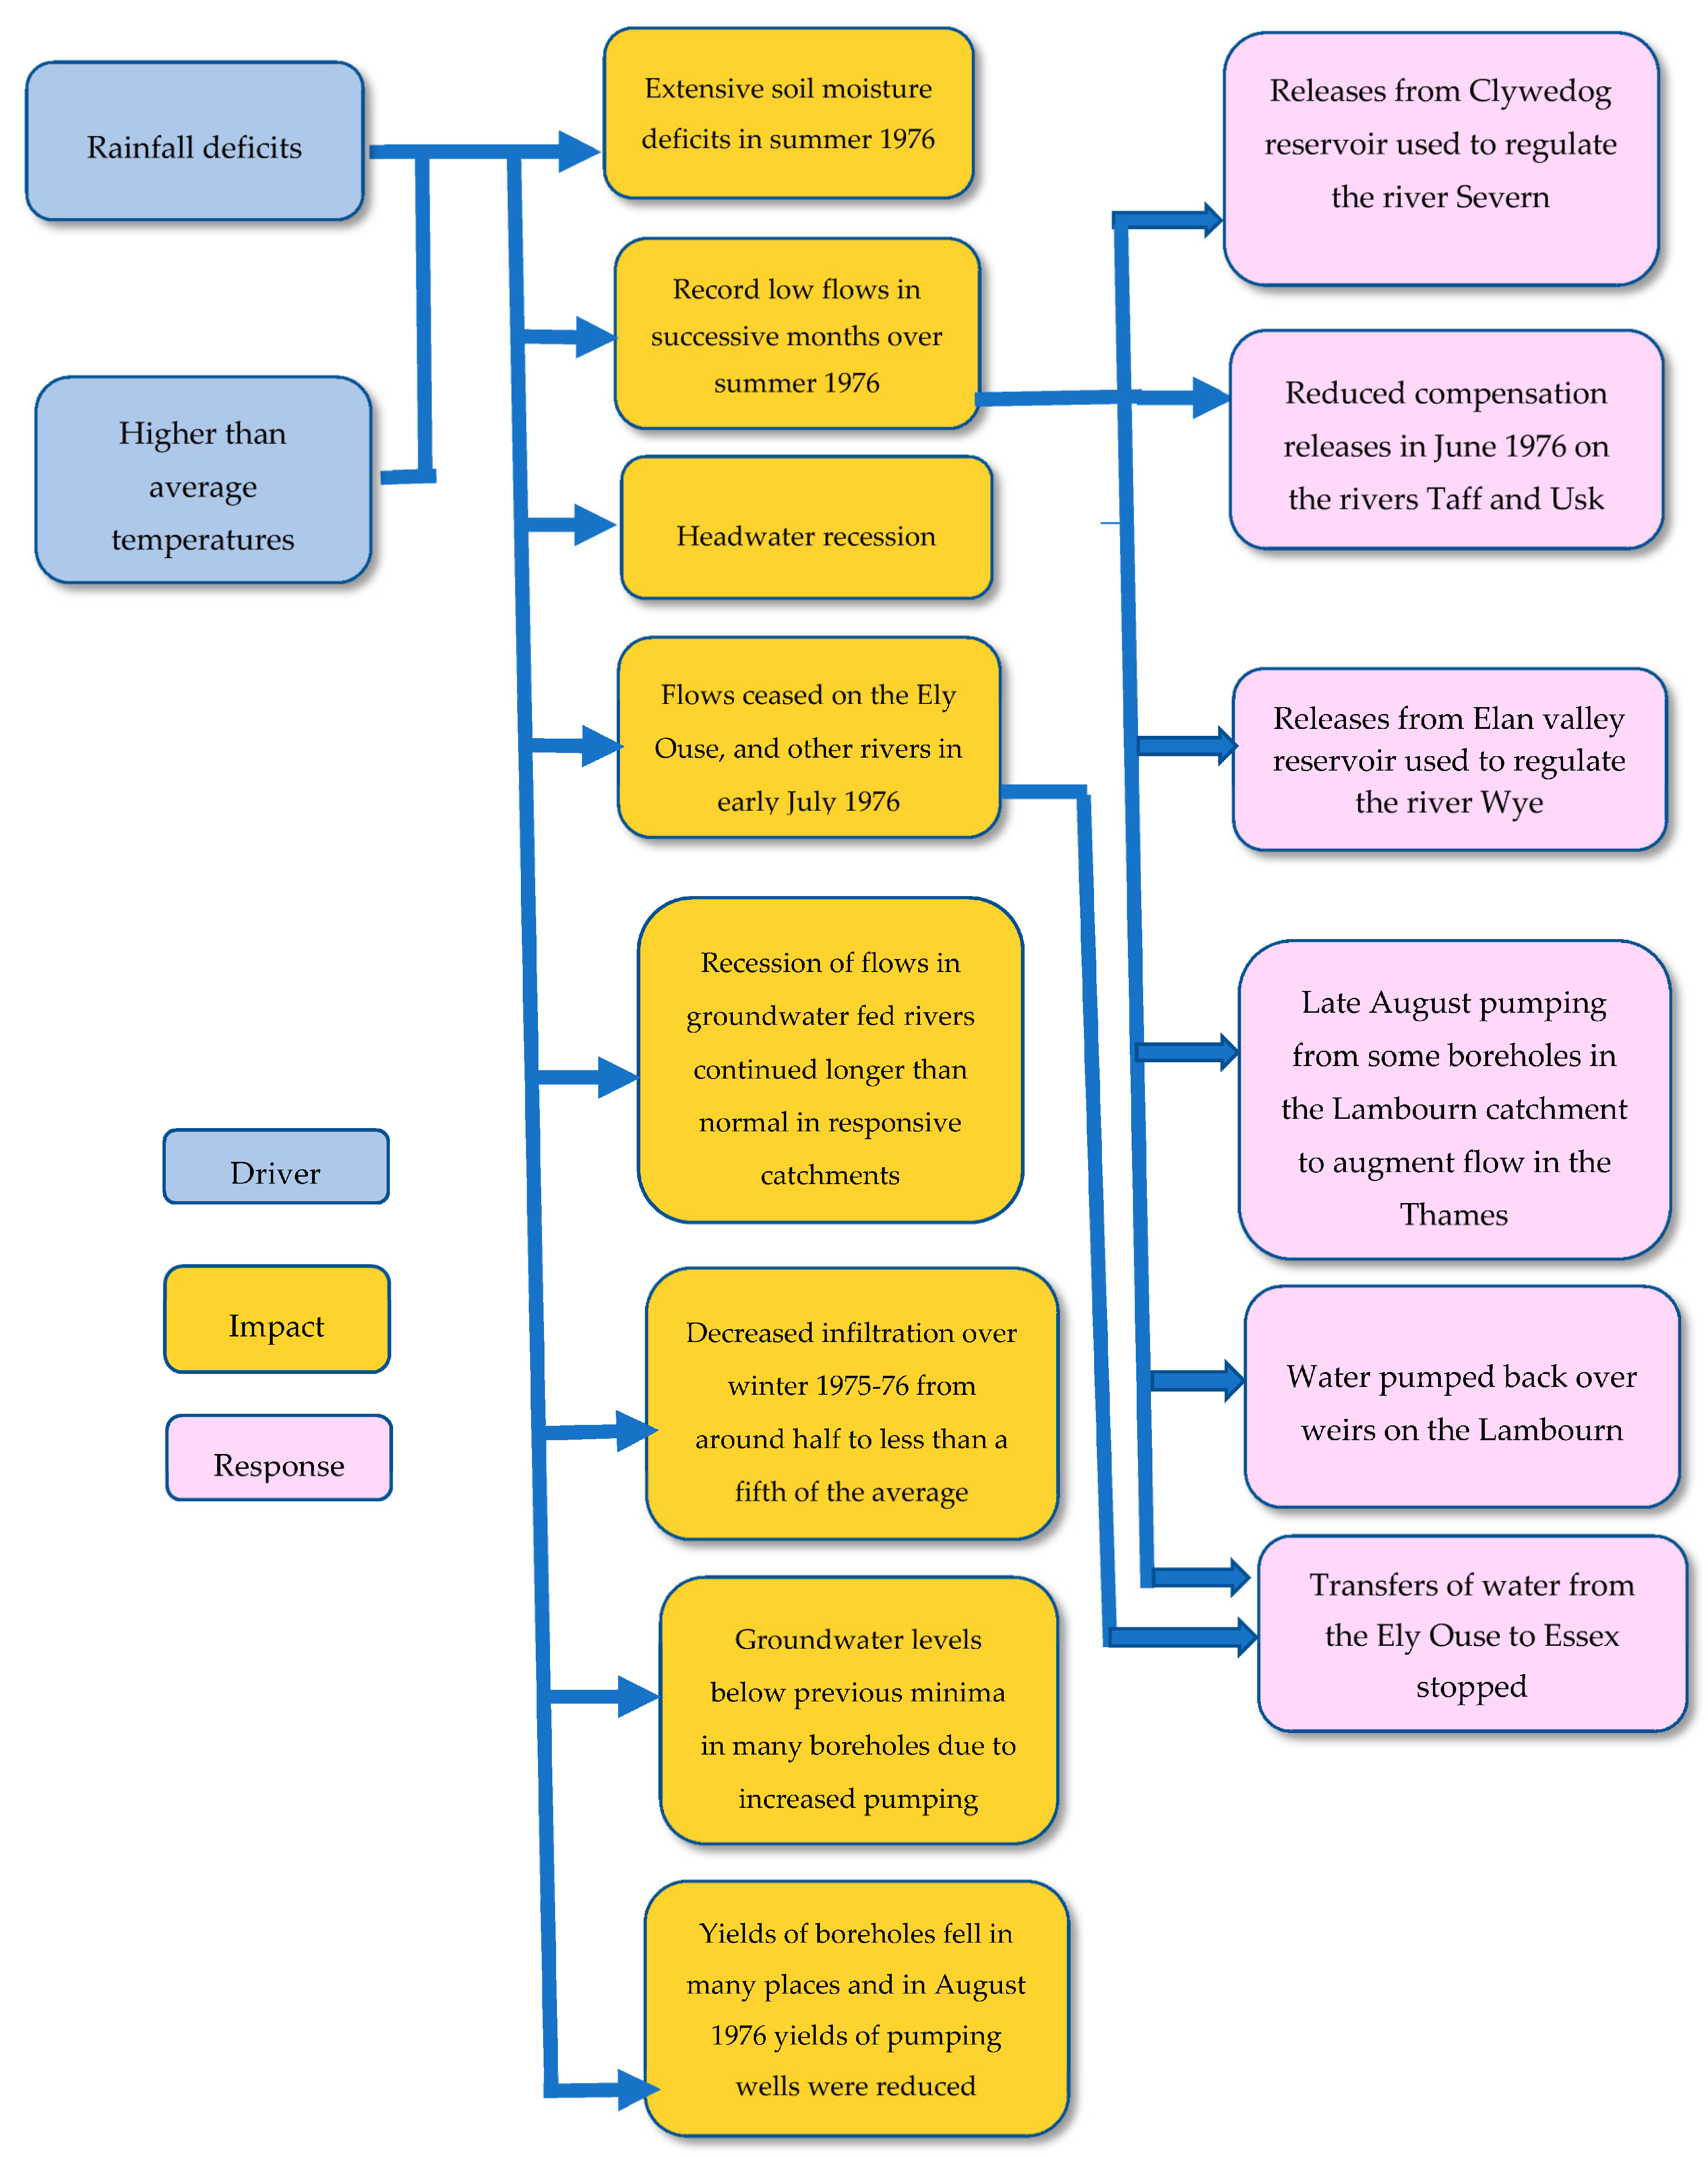
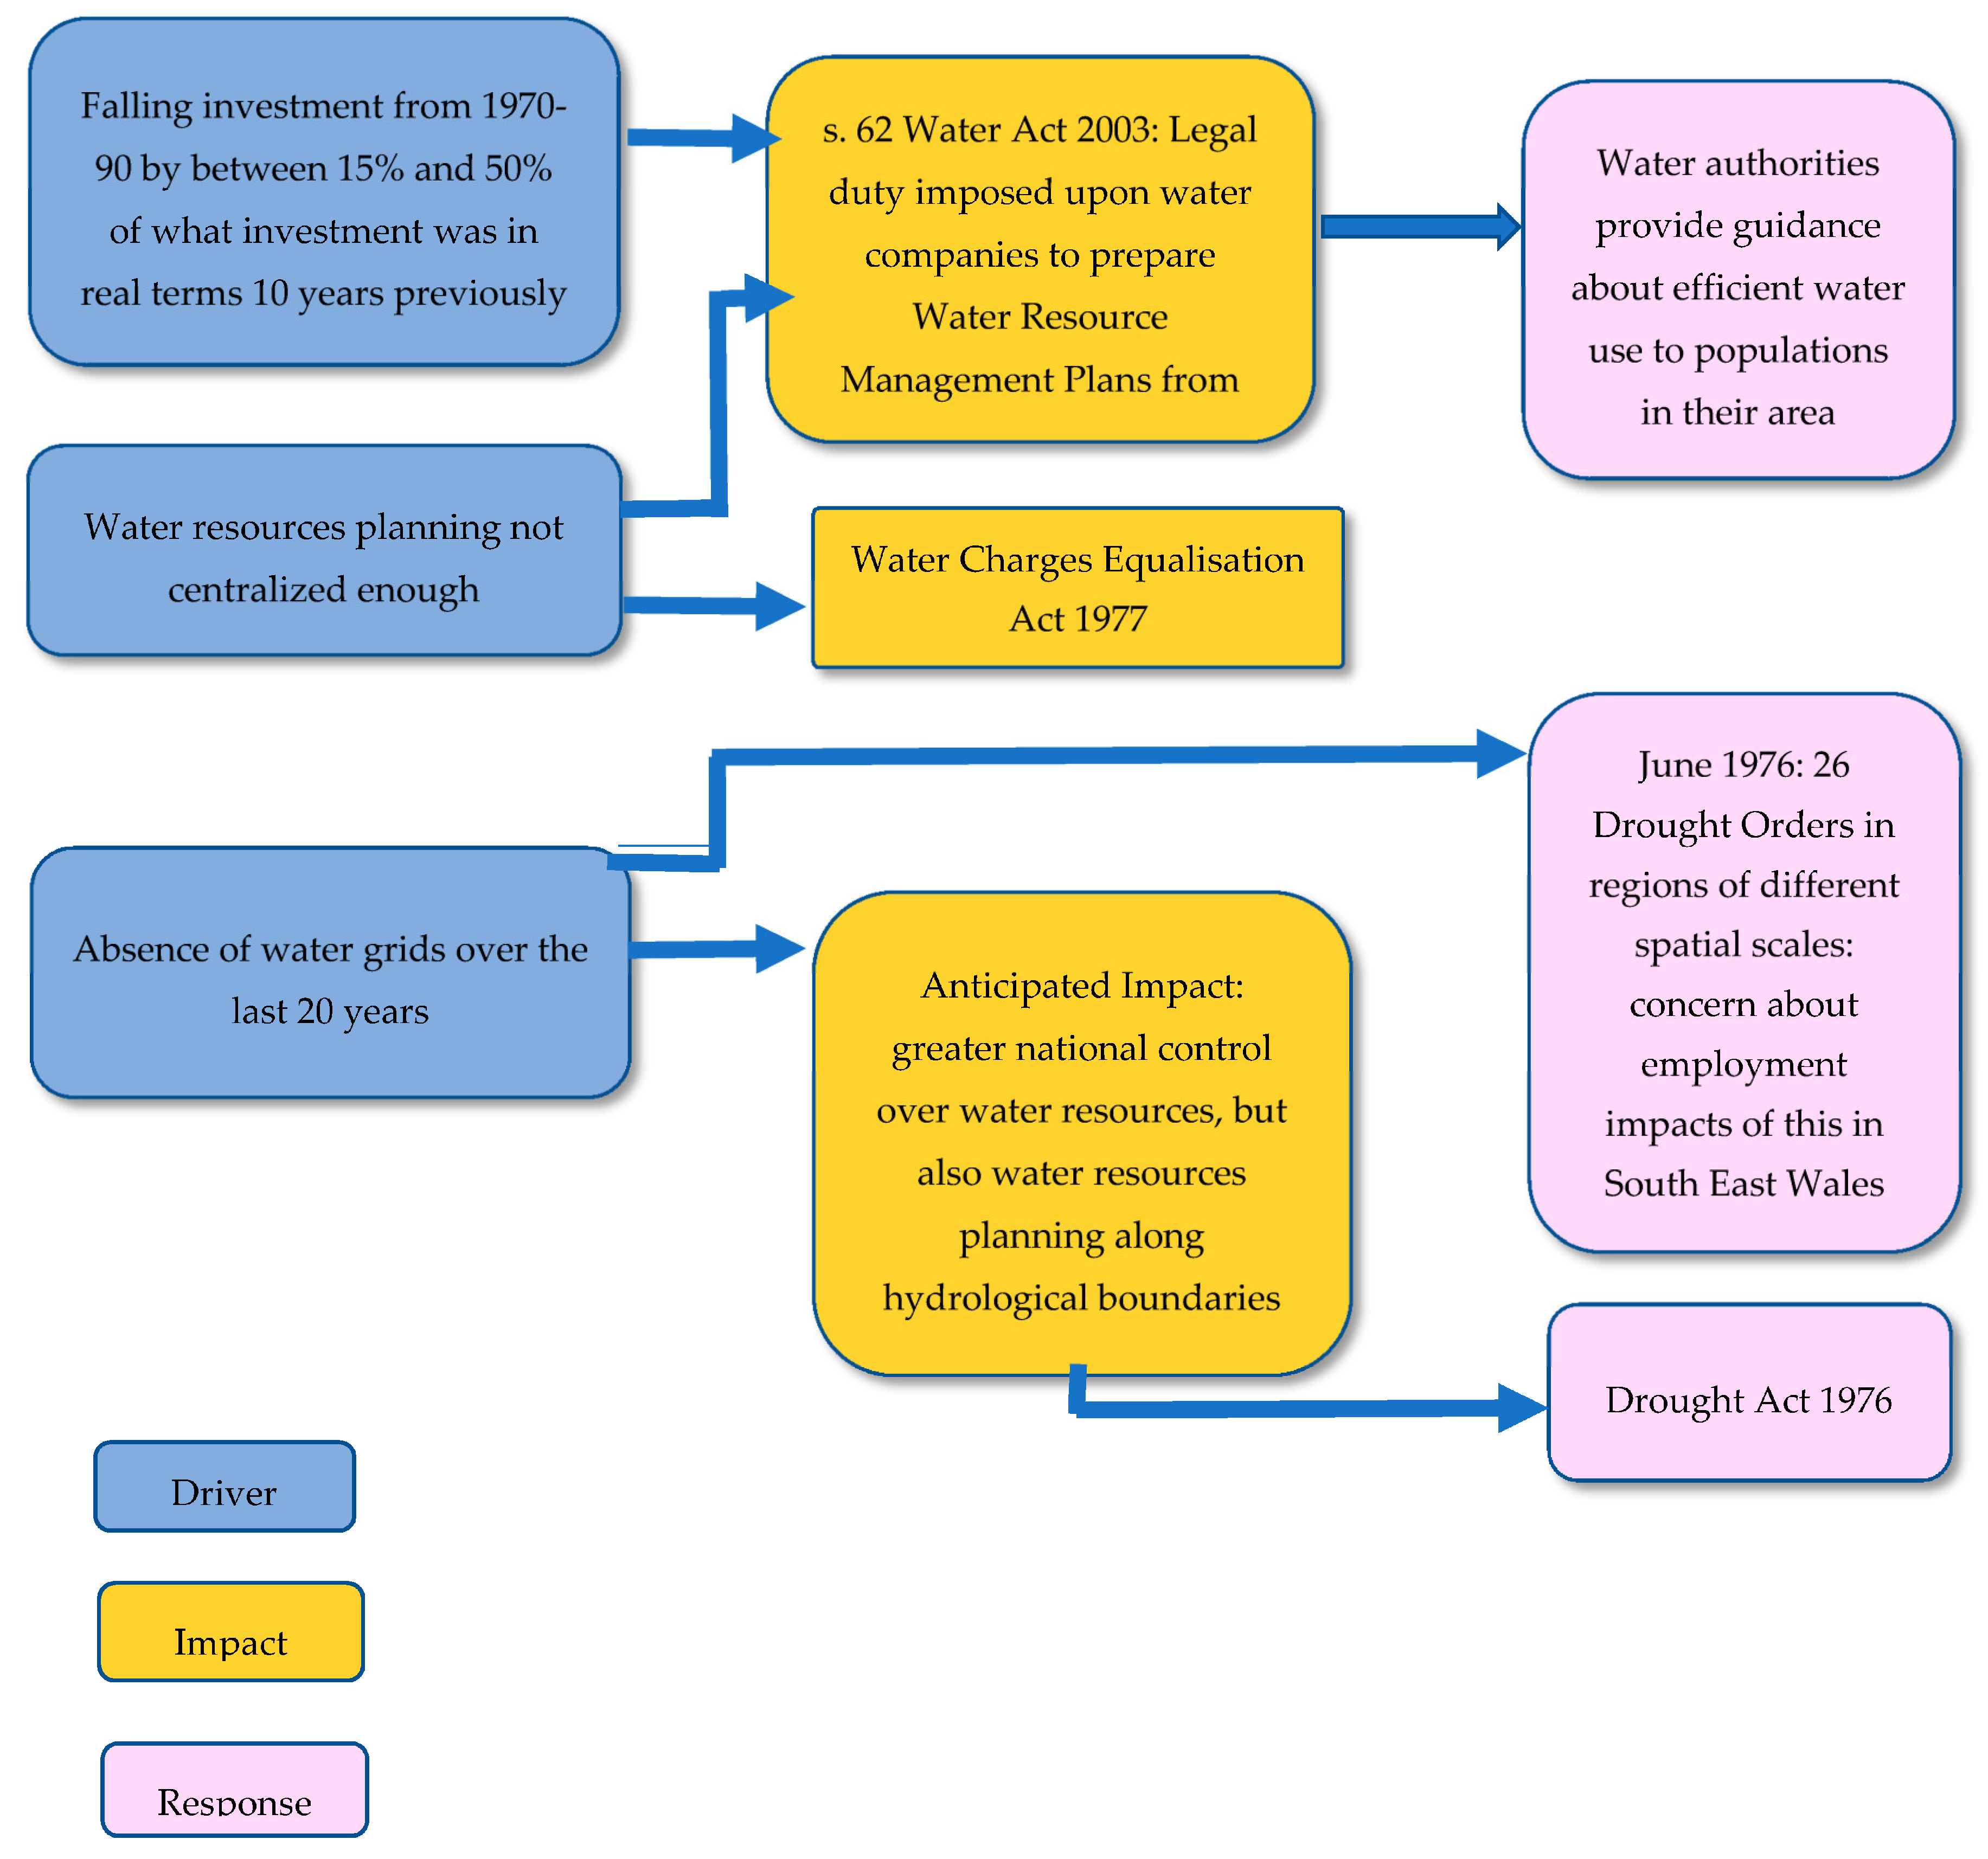
This section discusses how the DRI framework can be applied through the development of innovative Systems Interaction Maps (SIMs) for different sectors and for specific drought episodes, such as the 1976 and 1995 droughts in the UK. The SIMs draw on the core concepts of the DRI framework and visualise its application to different sectors. They are a mapping tool that can be utilised by each sector for selected drought episodes. Data about each historical drought episode can be collated in a common drought inventory [38]. SIMs can be produced by a small group or one researcher associated with each sector, who has in-depth knowledge of the specific sector data. Small groups of researchers who share a disciplinary background can help to settle different views of what should be considered as a key driver, impact, and response to a drought in a particular sector. The SIMs developed for each drought episode can then be collated and compared by a sub-group of project researchers in order to identify key interactions between sectors within a given drought, and where possible, interactions between sectors across different droughts. This comparison of SIMs for each sector enables questions to be addressed, such as whether the impacts of drought on agriculture are a key driver of regulatory responses to drought. Such comparisons should identify how much intersection there is, in practice, between different sectors in drought management. Moreover, comparing SIMs for each sector over time can address questions such as “did the introduction of sustainable leakage targets for water companies in England and Wales in the aftermath of the 1995 drought reduce the need for regulatory responses during the next drought episode of 2003–2006?” Figure 2 and Figure 3 illustrate the SIMs developed for the 1976 drought for the ground/surface water sector and the governance sector using the common DRI conceptual framework.
When identifying interactions between drivers, impacts, and responses during a particular drought episode, or across different drought episodes, there are important questions about causality to be addressed. These are particularly complex when multiple sectors are examined. The qualitative judgement of a researcher immersed in the data of a particular sector can be helpful to address questions such as, “was it governance or cultural changes in relation to water use that lead to a drought episode in comparison to natural/ecological factors, such as low rainfall or low resilience of aquatic flora or fauna?” (see also [5]). There is also the challenge of identifying inter-temporal causality. Given a wide range of variables at play, how can we arrive at firm conclusions about changes introduced in a social system, such as legal reforms as the impact of one drought episode, shaping impacts occurring during a subsequent drought?
Given these significant challenges to identifying and mapping the causal interactions between drivers, impacts, and responses both across sectors and over time, it may be necessary to modify a positivist research approach focused on causality. Hence, SIMs, in particular for those sectors reliant on qualitative interview data, reflect perceptions of actors and thus political, interest based dimensions of drought systems. These matter because it is perceptions of the state of water resources, rather than their actual state which shapes how they are managed before, during, and after a drought [23] (p. 6). Moreover, where the boundaries around a drought system are drawn, and what are considered as key drivers, impacts, and responses is not just a matter of objective facts but also of subjective understandings based on how drought affects various individual and groups of actors. So, how can SIMs contribute to examining interactions between drivers, impacts, and responses within a drought?
3. Results
3.1. Examining System Interactions Within a Drought
How can key systems interactions within a specific drought be examined? This article focuses on the 1976 drought in the UK, which followed the driest 16-month period in the UK for 250 years. It is considered as one of the worst droughts experienced in the country. It offers a rich case study of systems interactions, as it covered a large part of the UK’s geography, and affected many sections of society. It involved standpipes and rota cuts in some parts of the country, changes in ecology, and some companies, such as British Steel, had to reduce production [39].
3.1.1. Developing Questions
An analysis of systems interactions begins with identifying questions regarding the focus and scope of the exercise:
- At what spatial and temporal scale will the analysis be conducted? Should there be a uniform scale for data collection applicable for all sectors, or should the spatial or temporal scale at which data are collected be different and thus responsive to the specific characteristics of particular sectors? For instance, which regions in the UK were most affected by the 1976 is not uniform across all sectors, and different sectors have slightly different time lines for the 1976 drought. For some sectors the drought lasted from 1975 to 1977.
- Among a whole range of drivers, responses, and impacts, which ones should be chosen as the most important ones, on the basis of what criteria? Whose interests, and thus which stakeholders’ views of the importance of a particular driver, response, or impact of a drought should count?
- Should the relative importance of different drivers of drought and water scarcity in various sectors be assessed? For example, what is the significance of regulatory changes in relation to the reduction of leakage by water companies in comparison to hydrological conditions influencing drought risk?
Qualitative specialist judgement by researchers working within each of the sectors represented in an interdisciplinary project can be key to answering the questions raised above. Researchers may thus develop for each sector their own short list of what they consider as the most important drivers, impacts, and responses, e.g., to the 1976 drought.
Once sectors have prepared an SIM, the second step involves combining the individual sectoral SIMs into a single database. The raw entries for each sector, i.e., governance (legal/regulation); groundwater/surface water; oral history; print and social media; and agriculture, can be collated under the common headings of driver, impact, and response. Setting out the data in this way enables the identification of drivers, impacts, and responses of the 1976 drought that are common across sectors. This provides some pointers to the most significant drivers, impacts, and responses, i.e., those most frequently mentioned by a range of, and not just one sector.
The third step involves developing a high-level common classificatory framework to be applied across sectors. For example, in a number of sectors, high temperatures are a key driver of the 1976 drought. A common label of “high temperature” can therefore be applied to these observations. This enables the building up of a more integrated picture of drivers, impacts, and responses. This, in turn, helps to identify claims that specific drivers are associated with particular drought events. These claims can be substantiated, with reference to quantitative science data and statistical analysis of these, e.g., for the meteorology/hydrology sector. For a cross-sectoral analysis qualitative data, e.g., from oral history, print, and social media as well as governance, can be included. This enables to address inter-temporal questions, such as: how much lower was rainfall in 1976 relative to the long-term average? What was the scale of rota cuts introduced in 1976 in comparison to the 1995 drought?
3.1.2. Insights about System Interactions from the 1976 Drought
Results of the analysis of the SIMs for the 1976 UK drought across five sectors are presented in Table 1 and the accompanying text. Table 1 sets out key impacts of the 1976 drought as identified across the five sectors. The most frequently identified impacts of the 1976 drought were low river flows, as well as low water availability across the sectors, including for agriculture.
In sum, the cross-sectoral analysis of the SIMs for the 1976 drought provides some insights about the system interactions during that drought. First, although there are some common responses and impacts across the five sectors, they are not identical. Responses range from the operational, such as water pumping and water use restrictions, to the more structural, such as financial compensation for farmers and changes in agricultural production. Some drought responses, e.g., agricultural crop management, have higher visibility, and thus are referred to in the SIM of more than one sector, in comparison to more technical regulatory measures, such as drought orders which enable to increase some abstractions, e.g., for water utilities or reduce compensation flows from reservoirs into rivers. Second, the range of responses and impacts comprises a mix of social and natural factors. This enables the exploration of questions such as how social factors like financial compensation for farmers may enhance the risk of water scarcity subsequent to a drought. Farmers may continue with existing farming methods rather than change crops in the knowledge that they are compensated for crop losses. Third, seeing the range of impacts of the 1976 drought on the natural environment and on a social sphere enables the examination of how perceptions of the drought are constructed. For instance, what is the relative significance of impacts on the natural environment for shaping citizens’ and regulators’ views of what actually is a drought?
3.1.3. Challenges
Applying the DRI conceptual framework via the intermediate step of SIMs raises a number of challenges. First, in some sectors it can be difficult to draw a dividing line between an impact and a response. Some data may be classified in either category. Providing longer and more detailed definitions of the key concepts, such as impacts, responses, and drivers, illustrated by examples from both the natural and social world may tackle this [37]. A further strategy can be respondent validation, i.e., to invite comments from research participants who provided data, such as water resource managers in utilities, farmers, and regulator scientists. They could confirm or question whether a particular data point should be considered as an impact or a response. Another strategy is to code some of the data by two rather than one researcher, and on the basis of discrepancies in coding practice to further refine and specify the concepts of, e.g., impact and response.
Second, it may not be possible to extract the key, or most significant, driver, response, or impact of the drought from the data collected. Here the challenge consists of too many data points or observations, and the practical difficulties in identifying patterns or trends in that data. This can be particularly an issue for humanities and social science researchers, who often collect large amounts of qualitative unstructured empirical data. This data may not lend itself to quick, pared-down classifications along the lines of “this was the most important driver of the 1976 drought from our sector” perspective. This challenge is not simply a matter of research technique, but reveals that natural hazards can be deeply politically contentious issues. Thus, different social actors seek to take responsibility for or attribute blame to a whole range of stakeholders for having made a drought more or less likely.
3.2. Interactions between Sectors across Drought Episodes
3.2.1. Challenges
Examining interactions between the natural environment and a social sphere in droughts across time raises a number of challenges. First, while drought episodes are in some respects discrete events, their causes and consequences are on-going and build up cumulatively over time. Second, the social and natural/ecological contexts are not static. They, too, evolve over time. Changes in culture, regulation, or industrial processes between drought episodes can affect their contribution to the likelihood and severity of a drought. For instance, new production technologies can reduce the water dependency of certain agricultural or industrial processes, and thereby reduce or eradicate certain impacts of drought. Hence, it may not be possible to identify specific indicators of drivers, pressures, responses, states, and impacts of drought that are the same for two or more drought episodes. A change in the magnitude of these indicators may therefore not be measurable in relation to two or more historic drought episodes. The next section discusses further how systems interactions can be examined for multiple drought episodes.
3.2.2. How to Examine Systems Interactions for Multiple Drought Episodes?
The first step entails considering various questions about the focus and scope of the analysis:
- Which drought episodes should be examined? Should the focus be on sequential droughts to determine if there is any apparent linkage between a response to a prior drought leading to some change, e.g., on the impacts in a subsequent drought?
- How do we account for changes in other factors which can contribute to changes in drivers, responses, and imapcts of droughts over time, such as cultural factors, e.g., enhanced emphasis on water efficiency or changes in agricultural policy?
In order to develop an analysis of systems-interactions across multiple droughts, this article focuses on complementing the SIM work for the 1976 drought with an SIM for the 1995 drought. The 1995 drought is the next most significant drought on record in the UK following the 1976 drought. The year of 1995 is considered to have had the driest summer ever in the UK. Moreover, both the 1976 and 1995 droughts affected large parts of the UK and numerous sectors. The 1995 drought was also the first to occur after the privatisation of the water industry in England and Wales. There is some evidence that the associated changes in the institutional and regulatory structure may have influenced the drivers, impacts, and responses of the 1995 drought [40]. The analysis of various historical drought episodes drew on the raw, primary original empirical data collated in a Historic Droughts Inventory (https://historicdroughts.ceh.ac.uk/content/drought-inventory). Having identified a set of key drivers, impacts, and responses for the 1995 drought for the three sectors, the next step involved comparing the 1995 drought with the 1976 drought to see if any patterns could be observed across the two droughts. For example, are there commonly observed interactions between natural and social systems over time? This may detect unusual links or patterns against the background of more frequently occurring links between, e.g., a particular driver and a specific impact.
3.2.3. Findings from a Comparison of the 1976 and 1995 Droughts
On the basis of available data, this article focuses on the interactions between three sectors in the 1976 and 1995 droughts: governance, oral histories, and agriculture (for this reason the drivers, impacts, and responses shown in Table 2, Table 3 and Table 4 can differ from those shown in Table 1). Table 2 sets out the most frequently occurring drivers of the 1976 and 1995 droughts identified across the three sectors, ranked according to how often they were referred to in the sectoral data sets. Various insights can be gleaned from Table 2 below. First, while two drivers, high temperature and low rainfall, were common to both droughts, the other drivers identified were specific to each drought. In particular, while the drivers of the 1976 drought included poor planning, coordination, and management as well as low levels of investment, the drivers of the 1995 drought included the absence of a water grid and interconnection, poor leakage control, and inadequate storage. Second, while the most frequently recurring drivers of the 1976 drought were high temperatures and low levels of rainfall, in 1995 the most frequently cited driver relates to poor water company management and poor leakage control. This is particularly interesting given that 1995 was also a dry, indeed a hotter year than 1976. Hence, the main focus of the 1995 drought, the first major drought in the post-privatisation period, was not on natural conditions, but rather on the social factors, such as how water companies manage and prepare for drought. This may be due to post-privatisation public policy debate having shifted to inquiring into what could be done through the new and developing regulatory framework for the private water companies to ensure that water supplies were both un-interrupted and affordable for consumers.
Table 3 details the most frequently occurring impacts of the 1976 and 1995 droughts across the three sectors, ranked in the columns according to how frequently the particular impact was referred to in the sectoral data sets. Four of the impacts of the 1995 drought also feature among the five most frequently cited impacts of the 1976 drought. This implies that notwithstanding the differences in the drivers, for these sectors the main types of impact are similar across the two droughts. A related observation is that the three most frequently recurring impacts in both droughts are the same: low water for agricultural activities, low water availability more generally, and changes to law and regulations (this insight may be skewed by the fact that there were only three sectors analysed for the comparison between the 1976 and 1995 droughts (agriculture, oral histories and governance) and each of these impacts can be assumed to be particularly associated with these sectors).
Table 4 below details the most frequently occurring responses to the 1976 and 1995 droughts in the three sectors, ranked in the columns according to how frequently the particular response was referred to in the sectoral data sets. Four responses were identified as common to both the 1976 and 1995 droughts, including changes to agriculture production and composition; the imposition of water restrictions; the use of drought orders; and the publication of new policy and guidance. A key insight from Table 4 is that during the 1995 drought the response focused on efforts to try and change user behaviour, particularly through the use of the media by the private water companies. Interestingly, according to the data collected, this response did not feature as prominently during the 1976 drought. During that drought there was a greater focus on ‘supply-side’ measures, as well as changes in patterns of demand, e.g., by changes to industrial and agricultural crop and livestock production, and through the imposition of water use restrictions.
3.3. Discussion of Challenges
For a number of reasons, examining system interactions across multiple drought episodes is difficult. First, it is challenging to obtain sufficient and homogenous sectoral coverage of multiple drought events. Some sectors do not have data available for all of the drought episodes. In part, this may reflect that droughts are often localized both spatially and temporally, and that some sectors may experience the effects of drought more than others. Second, in many sectors it can be challenging to disaggregate all of the observations into either a driver, impact, and response, with the result that the same data observation can be classified under multiple headings. However, more overarching categorisations can make it even more difficult to compare data across sectors because quite different dimensions of drought may be captured by a broad category of, e.g., ‘consequences’ of drought. This article suggests that it is better to differentiate more short-term responses during a drought from longer-term, fundamental impacts of a drought that have an effect even after a specific drought episode has ended.
4. Conclusions
This article provided a discussion of the steps involved in applying the DRI conceptual framework with the aid of innovative Systems-Interaction Maps (SIMs) in order to examine social-ecological interactions in the context of historic drought episodes in the UK. The article sought to render transparent the methodological challenges encountered in doing so in the context of a large, interdisciplinary research project. Academic literature has pointed out that we do not know enough about how methodologies in practice frame collaborations between natural and social scientists [41].
Two empirical insights of the research emerged. First, the identified drivers, impacts, and responses of a specific drought can differ between the natural and social spheres. Hence, different social actors can place emphasis on certain drivers and impacts that are not identified, or less critical, in the natural sector analysis of drought. There is thus some degree of independence of a social from a natural sphere in the propagation of drought. This nuances literature findings which point to the dominance of social over natural factors because characterisations of the biophysical realm can be limited [18] (p.159). There are various implications of this finding. Qualitative and quantitative empirical studies are particularly apt to shed light on how and why social actors such as water utilities, environmental and economic regulators, politicians, and different groups of citizens vary in their identification of drivers and impacts of drought, and how this may differ from a natural sector analysis of drought. Hence, one aspect of the search for integrated, systemic accounts of hazards is, as a first step, ‘compare and potentially contrast’ accounts of their social and natural dimensions. Such accounts may further inform the selection of variables when building socio-hydrological models that seek to gauge the impact of particular strategies for managing water resources.
The second empirical finding generated by our research is that the institutional and governance structure of the water sector in the UK also shapes whether there is more or less emphasis on social or natural drivers of drought. This points to internal feedback loops, e.g., from understandings of the natural drivers of drought to how they are governed. One implication of this is a need to further examine through comparative studies how the institutional and governance structure of the water sector in other countries, such as those that, e.g., have publicly owned water utilities, may shape whether social or natural drivers of drought are considered as more salient. For policy-makers and those with an interest in the practical reform of water resources management, and drought management in particular, it may be worthwhile to consider that governance reform may have further not usually recognized consequences: institutional and governance structures for the water sector can also shape what we consider as drivers of drought, which, in turn, are intended to be managed by the water sector.
The SIMs can identify further barriers to a more integrated understanding and management of drought. For instance, while in the ground/surface water sector responses to drought are understood to be about the movement of water to places where abstractors or the environment most need it, the governance sector portrays drought management more explicitly as a political, contested issue. A comparative analysis of SIMs for different sectors can help to explain why the political and fairness dimensions of access to water are not recognised by all sectors affected by drought.
A further implication of the research discussed here is that the methodological tools presented here can be taken forward in various directions. For instance, comparing the SIMs for the 1976 drought for governance and groundwater/surface water in Figure 2 and Figure 3 enables to identify further specific questions about systems-interactions: How were assessments of the more local and short-term responses observed in the groundwater/surface water sector, related, if at all, to understandings of drivers of the drought in the governance sector? Were changes in compensation releases from reservoirs and increased groundwater pumping in some areas of the UK related to what was identified as drivers in the governance sector, such as insufficiently centralized water resource planning and a lack of a more integrated water network? Moreover, the SIMs can provide the basis for modelling, where quantitative data are available for specific sectors, with further analysis of model uncertainty as referred to in step 4 of Di Baldassarre’s [21] (p. 230) account discussed above.
Funding
I gratefully acknowledge funding for this project from the UK government Natural Environment Research Council, grant NE/L010356/1.
Acknowledgments
I would like to thank Chris Decker for research assistance for this article and Lucy Barker for Figure 2.
Conflicts of Interest
The author declares no conflict of interest.
References
- European Commission Program on Water Scarcity and Droughts in the European Union. Available online: https://ec.europa.eu/environment/water/quantity/scarcity_en.htm (accessed on 2 August 2020).
- US National Science Foundation. 2014: Interdisciplinary Research in Hazards and Disasters (Hazards SEES), Program Solicitation 14-581. Available online: https://www.nsf.gov/publications/pub_summ.jsp?ods_key=nsf14581&org=ENG (accessed on 2 August 2020).
- UK Natural Environment Research Council Program on Drought and Water Scarcity. Available online: https://nerc.ukri.org/research/funded/programmes/droughts/ (accessed on 2 August 2020).
- A Review of the UK’s Interdisciplinary Research Using A Citation-Based Approach; Elsevier: Amsterdam, The Netherlands, 2015. Available online: https://webarchive.nationalarchives.gov.uk/20170712122715/http://www.hefce.ac.uk/pubs/rereports/Year/2015/interdisc/ (accessed on 28 August 2020).
- Mostert, E. An alternative approach for socio-hydrology: Case study research. Hydrol. Earth Syst. Sci. 2018, 22, 317–329. [Google Scholar] [CrossRef] [Green Version]
- Van Emerick, T.H.M.; Li, Z.; Sivapalan, M.; Pande, S.; Kandasamy, J.; Savenije, H.H.G.; Chanan, A.; Vigneswaran, S. Socio-Hydrologic modeling to understand and mediate the competition for water between agriculture development and environmental health: Murrumbidgee River basin, Australia. Hydrol. Earth Syst. Sci. 2014, 18, 4239–4259. [Google Scholar] [CrossRef] [Green Version]
- Ostrom, E.; Janssen, M. Chapter 13: Multi-level governance and resilience of social-ecological systems. In Globalisation, Poverty and Conflict; Spoor, M., Ed.; Springer: New York, NY, USA, 2004; pp. 239–259. [Google Scholar]
- Ostrom, E. A diagnostic approach for going beyond panaceas. Proc. Natl. Acad. Sci. USA 2007, 104, 15181–15187. [Google Scholar] [CrossRef] [PubMed] [Green Version]
- Ostrom, E. A General Framework for Analyzing Sustainability of Social-Ecological Systems. Science 2009, 325, 419–422. [Google Scholar] [CrossRef] [PubMed]
- McGinnis, M.D.; Ostrom, E. Social-ecological systems framework: Initial changes and continuing challenges. Ecol. Soc. 2014, 19, 30. [Google Scholar] [CrossRef] [Green Version]
- Cole, D.; Epstein, G.; McGinnis, M. Toward a New Institutional Analysis of Social-Ecological Systems (NIASES): Combining Elinor Ostrom’s IAD and SES Frameworks. Indiana Leg. Stud. Res. Pap. 2014, 299. Available online: https://papers.ssrn.com/sol3/papers.cfm?abstract_id=2490999 (accessed on 2 September 2014).
- Anderies, J.; Janssen, M. Robustness of Social-Ecological Systems: Implications for Public Policy. Policy Stud. J. 2013, 41, 513–536. [Google Scholar] [CrossRef] [Green Version]
- Folke, C. Resilience: The emergence of a perspective for social-ecological systems analyses. Glob. Environ. Chang. 2006, 16, 253–267. [Google Scholar] [CrossRef]
- Rey, D.; Holman, I.; Knox, J. Developing drought resilience in irrigated agriculture in the face of increasing water scarcity. Reg. Environ. Chang. 2017, 17, 1527–1540. [Google Scholar] [CrossRef] [Green Version]
- Drought Risk and You (DRY), and Climate Outreach. Communicating Drought Risk in a Changing Climate. Available online: http://dryproject.co.uk/wp-content/uploads/2016/08/Climate-Outreach-DRY-Drought-Risk-and-You-Aug-2016.pdf (accessed on 2 August 2020).
- Araral, E. Ostrom, Hardin and the commons: A critical appreciation and a revisionist view. Environ. Sci. Policy 2014, 36, 11–23. [Google Scholar] [CrossRef]
- Linstädter, A.; Kuhn, A.; Naumann, C.; Rasch, S.; Sandhage-Hofmann, A.; Amelung, W.; Jordaan, J.; Du Preez, C.C.; Bollig, M. Assessing the resilience of areal-world social-ecological system: Lessons from a multidisciplinary evaluation of a South African pastoral system. Ecol. Soc. 2016, 21, 35. [Google Scholar] [CrossRef] [Green Version]
- Thiel, A.; Adamseged, M.E.; Baake, C. Evaluating an instrument for institutional crafting: How Ostrom’s social-ecological systems framework is applied. Environ. Sci. Policy 2015, 53, 152–164. [Google Scholar] [CrossRef]
- Gregory, A.; Atkins, J.; Burdon, D.; Elliott, M. A problem structuring method for ecosystem based management: The DPSIR modelling process. Eur. J. Oper. Res. 2013, 227, 558–569. [Google Scholar] [CrossRef]
- Lange, B. Command and Control Standards and Cross-Jurisdictional Harmonization. In Oxford Handbook in Comparative Environmental Law; Lees, E., Viñuales, J., Eds.; Oxford University Press: Oxford, UK, 2019; pp. 852–875. [Google Scholar]
- Di Baldassarre, G.; Martinez, F.; Kalantari, Z.; Viglione, A. Drought and flood in the Anthropocene: Feedback mechanisms in reservoir operation. Earth Syst. Dyn. 2017, 8, 225–233. [Google Scholar] [CrossRef] [Green Version]
- Sivapalan, M.; Savenije, H.H.G.; Blöschl, G. Socio-hydrology: A new science of people and water. Hydrol. Process. 2012, 26, 1270–1276. [Google Scholar] [CrossRef]
- Wens, M.; Johnson, M.; Zagaria, C.; Veldkamp, T. Integrating human behaviour dynamics into drought risk assessment—A sociohydrologic, agent-based approach. Wiley Interdiscip. Rev. Water 2019, 6, e1345. [Google Scholar] [CrossRef]
- Di Baldassarre, G.; Viglione, A.; Carr, G.; Kuil, L.; Salinas, J.L.; Blöschl, G. Socio-hydrology: Conceptualising human-flood interactions. Hydrol. Earth Syst. Sci. 2013, 17, 3295–3303. [Google Scholar] [CrossRef] [Green Version]
- Kam, J.; Stowers, K.; Kim, S. Monitoring of drought awareness from google trends: A case study of the 2011-17 California drought. Weather Clim. Soc. 2019, 11, 419–429. [Google Scholar] [CrossRef]
- Jaeger, W.; Amos, A.; Conklin, D.; Langpap, C.; Moore, K.; Plantinga, A. Scope and limitations of drought management within complex human-natural systems. Nat. Sustain. 2019, 2, 710–717. [Google Scholar] [CrossRef]
- Kruse, S.; Seidl, I. Social capacities for drought risk management in Switzerland. Nat. Hazards Earth Syst. Sci. 2013, 13, 3429–3441. [Google Scholar] [CrossRef] [Green Version]
- Albertini, C.; Mazzoleni, M.; Totaro, V.; Iacobellis, V.; Di Baldassarre, G. Socio-Hydrological Modelling: The Influence of Reservoir Management and Societal Responses on Flood Impacts. Water 2020, 12, 1384. [Google Scholar] [CrossRef]
- Gonzales, P.; Ajami, N. Social and structural patterns of drought-related water conservation and rebound. Water Resour. Res. 2017, 53, 10619–10634. [Google Scholar] [CrossRef] [Green Version]
- Binder, C.R.; Hinkel, J.; Bots, P.W.; Pahl-Wostl, C. Comparison of frameworks for analyzing social-ecological systems. Ecol. Soc. 2013, 18, 26. [Google Scholar] [CrossRef] [Green Version]
- Brown, R.; Deletic, A.; Wong, T. Interdisciplinarity: How to catalyse collaboration. Nature 2015, 525, 315. [Google Scholar] [CrossRef] [PubMed]
- Freire-González, J.; Decker, C.; Hall, J.W. The economic impacts of droughts: A framework for analysis. Ecol. Econ. 2017, 132, 196–204. [Google Scholar] [CrossRef]
- Troy, J.; Pavao-Zuckerman, M.; Evans, T.P. Debates—Perspectives on socio-hydrology: Socio-hydrologic modelling: Tradeoffs, hypothesis testing, and validation. Water Resour. Res. 2015, 51, 4806–4814. [Google Scholar] [CrossRef]
- Marsh, T. The UK drought of 2003: A hydrological review. Weather 2004, 59, 224–230. [Google Scholar] [CrossRef]
- Umweltbundesamt, Climate Protection in Transport: Need for Action in the Wake of the Paris Climate Agreement. 2017. Available online: File:///C:/Users/socl0184/Documents/History%20of%20Droughts/Revision%20of%20Historic%20Droughts%20Paper/Submission%20to%20Sustainability/2017-11-03_texte_97-2017_climate-protection-transport.pdf (accessed on 28 August 2020).
- Van Loon, A. Drought in a human-modified world: Reframing drought conditions, understanding, and analysis approaches. Hydrol. Earth Syst. Sci. 2016, 20, 3631–3650. [Google Scholar] [CrossRef] [Green Version]
- Lange, B.; Holman, I.; Bloomfield, J.P. A framework for a joint hydro-meteorological-social analysis of drought. Sci. Total Environ. 2017, 578, 297–306. [Google Scholar] [CrossRef] [Green Version]
- The Historic Droughts Inventory. Available online: http://aboutdrought.info/drought-research/data-and-information/#inventory (accessed on 2 August 2020).
- BBC. What the Drought of 1976 Looked Like as This Year’s Heatwave Continues. 21 June 2017. Available online: http://www.bbc.co.uk/newsbeat/article/40358961/what-the-drought-of-1976-looked-like-as-this-years-heatwave-continues (accessed on 2 August 2020).
- Bakker, K. Privatizing water, producing scarcity: The Yorkshire drought of 1995. Econ. Geogr. 2000, 76, 4–27. [Google Scholar] [CrossRef]
- Barthel, R.; Seidl, R. Interdisciplinary Collaboration between Natural and Social Sciences—Status and Trends exemplified in Groundwater Research. PLoS ONE 2017, 12, e0170754. [Google Scholar] [CrossRef] [PubMed]
Figure 1.
The Drivers, Responses, Impacts (DRI) Framework (adapted from Lange et al. [37]).
Figure 1.
The Drivers, Responses, Impacts (DRI) Framework (adapted from Lange et al. [37]).

Figure 2.
Example of 1975-76 SIM: Groundwater/Surface water.

Figure 3.
Example of 1975-76 SIM: governance.


Table 1.
Key impacts of the 1976 drought.
| Impact | Number of Times Identified in SIMs as a Key Impact of the 1976 Drought |
|---|---|
| Low water availability | 4 |
| Low river flows | 4 |
| Low water availability for agriculture | 3 |
| Reductions in groundwater | 2 |
| Changes to laws and regulations, such as the introduction of the Water Charges Equalisation Act 1977 (which sought to reduce large differences between charges levied for water for customers in different parts of England and Wales). | 2 |
| New water use planning requirements | 1 |
| Impact on recreation, i.e., closure of sporting grounds that could not be watered. | 1 |
| Fires | 1 |
| Decreased infiltration rate of water into soil. | 1 |
Table 2.
Key drivers of the 1976 and 1995 droughts *.
| 1976 | 1995 | ||
|---|---|---|---|
| Driver | No. of Times Identified in SIM (as % of Total) | Driver | No. of Times Identified in SIM (as % of Total) |
| Low rainfall | 25% | Poor water company management | 27% |
| Poor planning | 25% | Poor leakage control | 20% |
| High temperature | 13% | Absence of water grid/interconnection | 13% |
| Poor coordination, including absence of water grid and management | 13% | Low rainfall | 13% |
| Low levels of investment | 13% | Lack of storage | 13% |
| Legal/governance framework for the agricultural sector | 13% | High temperature | 7% |
| Limited metering | 7% | ||
* As identified in the three sectors and ranked in the columns according to how frequently the particular driver was referred to in the sectoral data sets.
Table 3.
Key impacts of the 1976 and 1995 droughts.
| 1976 | 1995 | ||
|---|---|---|---|
| Impact | No. of Times Identified in SIM (as % of Total) | Impact | No. of Times Identified in SIM (as % of Total) |
| Low water for agriculture | 33% | Low water for agriculture | 59% |
| Low water availability for domestic and industrial customers | 22% | Low water availability for domestic and industrial customers | 11% |
| Changes to laws and regulations | 22% | Changes to laws and regulations | 6% |
| New planning of water resources and hydrological boundaries | 11% | Delays to sporting events and recreational activities | 3% |
| Fires | 11% | Impacts on water quality | 3% |
| Low storage | 3% | ||
| Fires | 3% | ||
| Limited ability to move water around | 2% | ||
| Tankering | 2% | ||
| Drought order | 2% | ||
| Emergency committees | 1% | ||
| Higher prices | 1% | ||
| New capital expenditure | 1% | ||
Table 4.
Key responses to the 1976 and 1995 droughts.
| 1976 | 1995 | ||
|---|---|---|---|
| Response | No. of Times Identified in SIM (as % of Total) | Response | No. of Times Identified in SIM (as % of Total) |
| Agriculture changes to production and composition | 33% | Attempts to change water user behaviour more generally | 27% |
| Increase in number of fire units deployed day and night | 22% | Agriculture changes to production and crop/livestock composition | 23% |
| Water restrictions (and rota cuts) | 11% | Water restrictions and planning for rota cuts | 28% |
| Legal change, e.g., Drought Act 1976. | 11% | Tankering | 7% |
| New guidance in relation to water efficiency | 11% | Drought orders | 6% |
| Drought orders | 11% | Focus on leakage policy | 5% |
| Changes to policy and guidance | 4% | ||
© 2020 by the author. Licensee MDPI, Basel, Switzerland. This article is an open access article distributed under the terms and conditions of the Creative Commons Attribution (CC BY) license (http://creativecommons.org/licenses/by/4.0/).
Share and Cite
MDPI and ACS Style
Lange, B. Interdisciplinary Hazards: Methodological Insights from a Multi-Sectoral Study of Drought in the UK. Sustainability 2020, 12, 7183. https://0-doi-org.brum.beds.ac.uk/10.3390/su12177183
AMA Style
Lange B. Interdisciplinary Hazards: Methodological Insights from a Multi-Sectoral Study of Drought in the UK. Sustainability. 2020; 12(17):7183. https://0-doi-org.brum.beds.ac.uk/10.3390/su12177183
Chicago/Turabian StyleLange, Bettina. 2020. "Interdisciplinary Hazards: Methodological Insights from a Multi-Sectoral Study of Drought in the UK" Sustainability 12, no. 17: 7183. https://0-doi-org.brum.beds.ac.uk/10.3390/su12177183
Note that from the first issue of 2016, this journal uses article numbers instead of page numbers. See further details here.