Mobile Access Hub Deployment for Urban Parcel Logistics


1
Physical Internet Center, School of Industrial & Systems Engineering, Georgia Institute of Technology, Atlanta, lGA 30332, USA
2
Supply Chain & Logistics Institute, School of Industrial & Systems Engineering, Georgia Institute of Technology, Atlanta, GA 30332, USA
3
Schneider National Chair in Transportation and Logistics, Georgia Institute of Technology, Atlanta, GA 30332, USA
4
Coca-Cola Material Handling & Distribution Chair, Georgia Institute of Technology, Atlanta, GA 30332, USA
*
Author to whom correspondence should be addressed.
Sustainability 2020, 12(17), 7213; https://0-doi-org.brum.beds.ac.uk/10.3390/su12177213
Submission received: 28 July 2020
/
Revised: 26 August 2020
/
Accepted: 1 September 2020
/
Published: 3 September 2020
(This article belongs to the Special Issue Sustainable City Logistics and Innovation)
Abstract
:Last-mile logistics is an essential yet highly expensive component of city logistics responsible for many nuisances in urban areas. Mobile access hubs are flexible consolidation and transshipment points aiming at creating more sustainable city logistics systems by dynamically using urban space as logistics facilities. In this paper, we examine the potential of mobile access hub deployments for urban parcel logistics by identifying the impact of design parameters on economic and environmental performance. We propose a mathematical modeling framework and an integer program to assess the performance of mobile access hub deployments, and study the impact of a set of design parameters through synthetic cases and an illustrative case inspired from a large parcel express carrier’s operations. Results indicate design flexibility relative to the location of hubs and pronounced advantages in highly variable environments. The illustrative case shows significant savings potential in terms of cost and time efficiency as well as environmental sustainability. It emphasizes a trade-off between operational efficiency and environmental sustainability that can be balanced to achieve global sustainability goals while being economically sound.
1. Introduction
Urban parcel logistics play an important role in the development of the economy as it represents an essential enabler for e-commerce, but also creates externalities such as traffic congestion, air pollution, and nuisances to the population. Additionally, last-mile logistics in urban areas represent up to 28% of distribution costs [1] and is considered to be the least efficient transportation leg [2]. Global urbanization, which is predicted to reach 68% by 2050 [3], and the fast growth of e-commerce (20% annually on the 2017–2019 period [4]) contribute to an ever growing demand for urban parcel logistics services, motivating the search for sustainable innovations in city logistics (e.g., [5,6]). These trends have been accelerated due to attempts to mitigate the impacts of the COVID-19 pandemic (e.g., sequestering in place), requiring companies to increase their last-mile delivery capabilities and to deal with the dramatic shift to online channels [7].
In highly populated and dense urban areas, the development of transportation infrastructure can be difficult due to limited availability of suitable locations for logistic activities and costly (e.g., high real estate costs). Additionally, in an effort to promote the mitigation of negative externalities induced by urban transportation, local governments have started implementing several types of restriction policies such as limiting access of certain freight vehicles to city centers [8] to push stakeholders to develop more sustainable solutions. As a result, considerable research efforts have been put towards designing innovative and flexible freight systems to accommodate for various distribution needs and the challenges of sustainable urban development (see [9] for examples of innovations). Several of these initiatives require the use of lightweight commercial vehicles to perform pickup and delivery services, and often result in an increase in number of trips due to decreasing vehicle capacity. As a remedy, a thread of research examines the combination of micro-consolidation and transshipment hubs and light-weight commercial vehicles such as cargo-bikes to perform pickup and delivery services in dense urban areas as a way to design cost effective and sustainable last-mile operations [10]. These hubs can be designed to be mobile to cope with the difficulty of securing real estate and to add network design flexibility by enabling a dynamic use of urban space for logistics purposes. A few experiments regarding the use of mobile hubs for urban parcel logistics can be found in the literature such as the STRAIGHTSOL [11] project.
Mobile access hubs are mobile logistics facilities whichlare components of dynamic capillary logistics networks in the context of Physical Internet enabled hyperconnected urban parcel logistics [12]. Capillary logistics networks enable first-and-last mile logistics and fulfillment activities and customer interfaces with logistics systems by providing, for instance, sites (e.g., mobile facilities) where logistics activities can take place (e.g., transshipment of goods). Mobile access hubs offer consolidation and transshipment points between different types of vehicles at the neighborhood level (see [12] for more details on access hubs). They can materialize in different ways such as modified trailers, commercial vans, or AGV lockers, and are deployed for a short-term period of time in a public or private location. Figure 1 illustrates two examples of mobile access hubs from industry where modified trailers are temporarily located in a reserved parking space in the city center. Without mobile access hubs, a courier performs the following cycle of work several times in a single day: load parcels for delivery at a local hub (e.g., urban consolidation center) located away from the demand zone, drive to the demand zone to perform deliveries and pickups, and return to the local hub. With mobile access hubs, such cycles originate and terminate at a mobile access hub located close to the demand zone, reducing the couriers’ travel and leveraging consolidation opportunities by using larger vehicles to transship goods between the local hub and the mobile access hub.
This paper contributes to the academic literature by expanding the understanding of characteristics influencing the economic and environmental efficiency of mobile access hub deployments. In particular, it proposes a mathematical modeling framework and examines the potential of mobile access hub deployment for urban parcel logistics by identifying the impact of design parameters on economic and environmental performance using synthetic examples and an illustrative case inspired from a large parcel express carrier’s operations. Section 2 summarizes advances in the academic literature regarding the use of mobile hubs in urban logistics. Section 3 describes the problem studied and the modeling framework used to design and assess the performance of mobile access hub deployments. Section 4 reports on a set of experiments and results regarding the deployment of a single mobile access hub, the deployment of a mobile access hub fleet in a synthetic urban area, and the deployment of a mobile access hub fleet in an illustrative urban area inspired from a large parcel express carrier’s operations. Finally, Section 5 highlights key takeaways and managerial insights, and identifies promising research avenues.
2. Literature Review
The impact of city logistics on sustainability and liveability of cities has recently gained a lot of attention from the academic literature (see [15] for a recent literature review on city logistics research). More and more cities are implementing urban traffic restrictions (e.g., time-access restrictions and vehicle restrictions) to fight the negative externalities of logistics activities such as traffic congestion and air pollution and improve social sustainability. However, the positive impact of such restrictions on liveability and attractiveness of city centers often comes at the expense of environmental sustainability as reported in [16]. A thread of research on last-mile logistic systems using micro-consolidation centers and light-weight vehicles such as small electric vehicles and cargo bikes (e.g., [17,18]) has emerged to deal with such restrictions while fostering cost efficient and sustainable logistics operations in dense urban areas. Ref. [10] reports on a set of initiatives implementing smaller and lighter vehicles in urban areas by providing a literature review on sustainable vehicle-based alternatives in last-mile logistics and highlight the need to explore innovative solutions to mitigate the increase of the number of trips and induced negative externalities due to decreasing vehicle capacity.
Access hubs serve as consolidation and transshipment points between first-and-last-mile logistics activities and inbound and outbound activities. Access hubs are typically located at the neighborhood level shaping the capillary part of multi-echelon hyperconnected parcel logistics networks [12]. Multi-echelon networks for urban distribution have received a lot of attention in the academic literature (e.g., [19,20,21,22,23,24]), often using urban consolidation centers (UCC) or urban distribution centers (UDC) to bundle goods outside the boundaries of urban areas. As reported in [25], several micro-consolidation initiatives have been proposed to downscale the consolidation effort by bundling goods at the neighborhood level using capillary networks of hubs located much closer to pickup and delivery points, defined as access hubs in the conceptual framework proposed by [12]. Examples of such initiatives are satellite platforms (e.g., [20]), micro-consolidation centers (e.g., [26]), mobile depots (e.g., [27]), micro-depots (e.g., [28]), and urban transshipment points (e.g., [29]).
Several field studies have been conducted in European cities suggesting significant potential (e.g., 20% travel savings and 54% CO2 equivalent savings [30]) but failed to generalize key learnings and insights, making it a challenge for both private and institutional actors to replicate implementations and making transferability a key issue in the urban freight transport research [25].
While [17] reported clear environmental improvement from the use of micro-depots and electric assisted tricycles in an urban area with access restrictions in Barcelona, the economic aspect was not as potent. The combination of demand dynamics and real estate availability and price in dense urban areas makes the implementation of logistics hubs in certain neighborhoods economically infeasible, without mentioning the potential roadblocks from locals perceiving logistics activities as a potential nuisance.
Mobile hubs as examined by [11,27,31]) appear to be potential solutions with flexibility and robustness as foreseeable benefits [32]. All [11,27,31] examined the use of single mobile hub per region with implementation test cases respectively in Brussels, Gothenburg, and Rio de Janeiro. While [11,31] are reporting on the results of the case study, ref. [27] was able to develop a method to assess the economic and environmental viability of mobile hub setups in different neighborhoods based on their expected delivery loads using Monte Carlo simulation. Ref. [29] also proposed an impact assessment model using routing approximations to evaluate the performance of urban distribution systems combining cargo bikes and access hubs; the authors provided a framework to assess different network combinations to give recommendations on where to locate access hubs limited to a few options, and did not consider the full potential of mobility by allowing hubs to be dynamically located (e.g., daily). This paper extends on the work presented in [27,29] and identifies the impact of both demand and design characteristics on the economic, environmental, and time efficiency of the deployment of a mobile access hub fleet in the context of urban parcel logistics.
3. Problem Description and Modeling
In this section, the examined mobile access hub deployment problem is described along with a mathematical modeling framework developed to assess the economic, time efficiency and environmental performance of deployments. First, we define the problem studied and formulate it as an optimization challenge. Then, we present a set of key performance indicators. Finally, we develop an operations modeling framework and an integer program to provide solutions for the defined problem and assess their performance in terms of the set of key performance indicators.
3.1. Problem Description
A parcel express company provides pickup and delivery services to customers inlan urban territory, here identified as local cell, composed of a set of unit zones. The company is operating a logistics hub located near to the local cell boundary, called a local hub, serving as an urban consolidation center for every unit zone composing the cell. Each unit zone represents a demand area where couriers perform pickup and delivery services These couriers develop expert knowledge of their assigned unit zones, notably in terms of geography and customer base. Parcels can be moved between customer locations and the local hub in two ways: (1) couriers travel back and forth between their respective unit zones where they perform pickup and delivery tours on light-weight vehicles (e.g., cargo motorcycle) and the local hub, or (2) couriers travel back and forth between their respective unit zone and a nearby mobile access hub where parcels are temporarily stored until a rider tranships them between the mobile access hub and the local hub with a larger vehicle (e.g., commercial van). In order to provide timely services, a maximum transit time is to be ensured. The maximum transit time is defined as the maximum in-transit duration of a parcel moving from a local hub to a customer or vice versa. The objective of the company is to minimize operations costs within the local cell by using a number of mobile access hubs, while ensuring a maximum transit time between the local hub and customer locations.
A number of mobile access hubs, say M, is available for deployment every morning at the local hub, and can be located in a set of discrete parking locations throughout the local cell, each location being able to serve one or more nearby unit zones. In the context of this paper, the following assumptions are made:
- Mobile access hub candidate locations are known and can be reserved for a fixed price at the beginning of each day
- Unit zones are to be served by at most one mobile access hub at the time
- Mobile access hubs can be stored nearby their local hub if not deployed
- Mobile access hubs are big enough to hold the load of parcels of their assigned unit zone(s)
- Mobile access hubs are to be replenished by out-and-back rider trips
Finding space to park a trailer-like mobile access hub in a dense city center can be challenging, and requires ground work to identify and secure such candidate location (e.g., reserved commercial parking area). Uncertainty about the availability of such space (e.g., due to competing reservation requests) is not considered in the context of this paper.
Although unit zones could make use of several access hubs at the same time, the choice is made to limit the assignment of a unit zone to a unique mobile access hub. This design choice aims at making routing more straightforward, especially when the location of the one mobile access hub may differ every day. For similar reasons, the choice is made to limit the assignment of unit zones to mobile access hubs to once a day (at the time of deployment).
When mobile access hubs are not deployed to serve unit zones, it is assumed that they can be stored near the local hub. In some cases (e.g., local hub located in a high-density area), mobile access hubs could have to be stored further away from the local cell, which could incur an additional deployment cost not modeled in this paper.
The use of standard mobile access hub technology solutions (e.g., modified trailers like in Figure 1) may provide enough storage capacity to make the problem uncapacitated as long as mobile access hubs are not assigned to too many unit zones (i.e., do not handle too much parcel flow) and have frequent rider and courier visits.
The restriction to out-and-back rider visits limits the routing complexity of dynamic hub locations and is a conservative assumption when evaluating the performance of mobile access hub deployments.
Let Z be a set of unit zones served by local hub l, and A a set of candidate locations where a fleet of M mobile access hubs can be deployed. A mobile access hub deployed in location serves unit zones . A mobile access hub deployment is represented by a vector , where is the binary assignment of a mobile access hub in location a. In each unit zone z, the number of pickup and delivery requests performed (i.e., customer visits) during the day is expressed as a number of stops . The economic optimization challenge can then be formulated as follows:
where X represents the set of feasible deployments, represents the cost of deploying mobile access hubs according to vector x, represents the operations cost of riders moving parcels between the local hub and mobile access hubs locations, and represents the operations cost of couriers performing pickups and deliveries within unit zone z. Operations are planned to serve all the demand and satisfy a maximum transit time between the local hub and customer locations, which is to be reflected in operations costs.
3.2. Sustainability Performance Indicators
In this section, a set of key performance indicators summarized in Table 1 is proposed for the assessment of mobile access hub operations versus traditional operations divided along the economic, time efficiency and environmental assessments.
3.2.1. Economic Assessment
The economic assessment of mobile access hub operations can be done globally, by computing the total system cost (i.e., deployment cost and operations cost) as in optimization challenge (1). That is, by computing the sum of the cost of deploying mobile access hubs and the cost of rider and courier operations (vehicle and driver costs) necessary to perform pickup and delivery services. Additionally, the total system cost can be divided by the number of parcels handled (i.e., pickups and deliveries) to obtain a cost per parcel useful when assessing the economic impact of last-mile logistics on landed costs and compare the economic viability of instances of instances with different demand volumes.
3.2.2. Time Efficiency Assessment
From an operational perspective, the transportation time per parcel gives an indication on time efficiency of workers operating in the system. It is defined as the total vehicle travel time divided by the number of parcels handled. More specifically, courier productivity can be assessed by the average time between customer locations on a courier route (i.e., the ratio of courier operations time by the number of parcels handled). This is particularly important from a managerial perspective as couriers daily activities are significantly modified when using mobile access hubs (e.g., their reference logistics hub may change from one day to another). Getting couriers onboard is critical to the implementation success of mobile access hubs, and productivity gain can be a convincing factor (especially if couriers are partially paid based on the number of parcels picked up or delivered).
3.2.3. Environmental Assessment
The environmental footprint of mobile access hub operations is composed of direct impact (i.e., riders and couriers vehicle operations) and negative externalities (such as induced traffic congestion due to vehicle movement and pickup and delivery stops). A common metric for assessing direct environmental impact is greenhouse gas emissions from vehicle movement computed as the total travel distance times an emissions factor for each type of vehicle. Rider vehicles are typically larger (e.g., package car, delivery van), faster and a bigger source of pollutants than courier vehicles designed to be convenient and respectful in dense city centers (e.g., tricycle, electric motorcycle). While externalities are complex to model and assess, the distance travelled per parcel gives an indication on routing efficiency; a shorter distance travelled per parcel is more likely to limit externalities by reducing the travel footprint of operations in a area (see [33] for more details on assessing negative externalities from transportation metrics).
3.3. Operations Modeling
The mobile access hub deployment problem is a tactical problem from which decisions directly impact urban parcel logistics operations. While explicitly modeling operations is not necessary to inform a tactical decision, this section proposes a set of continuous approximations to assess the economic, environmental, and time efficiency of mobile access hub operations. As indicated in [34], using such continuous approximations is appropriate to address high-level system performance because they are parsimonious, tractable, and yet realistic and are useful to capture operations complexity and take informed decisions (see [35] for a review on the development of such models for logistics and transportation systems).
3.3.1. Pickup and Delivery Routes
With or without the use of mobile access hubs, a set of couriers is to execute pickup and delivery routes visiting customers located in unit zones from either a local hub or a mobile access hub. The starting point of the proposed operations modeling is the approximation of the vehicle routing problem via the route length estimation proposed by [36]. In the case of couriers performing n stops in unit zone z from a hub, say h, the total distance traveled can be expressed as the combination of a stem distance (from the originating hub to the area of service) and an in-tour distance (in the area of service) as follows:
where is the average distance between the originating hub h and unit zone z, is the number of stops to perform in unit zone z, is the length or routes of couriers operating in unit zone z from hub h and the density of customer locations in unit zones z. k is a constant related to the distance metric used that can be computed by simulation [37]. Similarly, the total time required to perform courier routes can be expressed as follows:
where , , and are respectively the couriers’ fixed time for each route (start and end of a route), the stopping time at each customer location and handling time per unit, and are respectively the couriers’ stem and in-tour speed, and the average number of units handled per stop (pickup or delivery). Finally, the induced operations cost can be approximated as follows:
where , , , and are respectively the couriers’ fixed cost per route, variable cost on the stem part of a route, variable cost in-tour, and variable wage per unit of time (e.g., $/h).
3.3.2. Baseline Operations and Transit Time
In the baseline case, couriers are operating from a local hub without mobile access hub transshipment. That is, operations travel, time, and cost can directly be computed with , , and . Moreover, the maximum transit time between local hub l and a customer location in zone z is symmetrical for inbound (from customer to local hub) and outbound (from hub to customer) operations and can be computed as the time a courier takes to move from the local hub to the last stop on its route and can be approximated as follows:
where is the number of stops on a single courier route leaving from local hub l, which can be adjusted as long as it is inferior or equal to a courier’s capacity expressed in number of stops. Therefore, to satisfy , must satisfy:
Note that the minimum feasible value of can be computed with Equation (A1) in Appendix A.1.
3.3.3. Mobile Access Hub Operations and Transit Time
In the case where couriers serving unit zones operate from a mobile access hub a that is visited by riders times, operations are composed of two tiers: parcel movement between the local hub and the mobile access hub, and courier routes serving a unit zone from the mobile access hub location. Parcel movement between a local hub and a mobile access hub is characterized by a number of times that the mobile access hub is replenished (i.e., visited by an out-and-back rider trip from the local hub). The operations travel, time and cost can thus be approximated by respectively , and ; where represents the fixed time of a rider route at the local hub and at an access hub, represents the speed of a rider vehicle, and , and respectively represent fixed cost per tour, variable cost per distance traveled, and hourly wage of a rider. Moreover, the maximum transit time between local hub l and a customer location in zone z is the maximum between the maximum transit time for inbound operations, say , and the maximum transit time for outbound operations, say . The maximum transit time for inbound operations is the time a courier takes to move from the first stop on their route to the mobile access hub, plus the maximum time parcels may wait in the mobile access hub (time between two rider visits), plus the time a rider takes to travel from the mobile access hub to the local hub l and can be approximated as follows:
where is the number of stops on a single courier route leaving from mobile access hub location a, is the total time of operations, and is the inter-arrival time of riders at the mobile access hub.
The maximum transit time for outbound operations is the time a rider takes to travel from the local hub to the mobile access hub, plus at most the time for a courier to finish a complete route, plus the time it takes for a courier to travel from the mobile access hub to the last customer stop on their route, and can be expressed as follows:
The difference between the maximum transit time for inbound operations and the maximum transit time for outbound operations is:
which is the difference between the inter-arrival time of riders visiting the mobile access hub and the length of one courier route operating from the mobile access hub. The assumption is made that multiple courier routes can be performed between two rider visits, which implies . To satisfy the maximum transit time requirement, and can be adjusted as long as is inferior or equal to a courier’s carrying capacity expressed in number of stops. It is decided to prioritize courier productivity (number of stops on a route ) over replenishment frequency as long as . Algorithm A1 in Appendix A sets and to satisfy the transit time constraint when feasible for z unit zones served by mobile access hub a, and to the shortest possible transit time otherwise. It prioritizes courier efficiency by iteratively decreasing the length of courier routes and computing the required rider visit frequency to meet the transit time constraint. Note that the minimum feasible value of can be computed with Equation (A2) in Appendix A.1.
3.4. Mobile Access Hub Deployment Optimization
Coming back to the economic optimization challenge (1), an integer program can be formulated using the cost estimates proposed in Section 3.3 where binary decision variables indicate the deployment of a mobile access hub in candidate location a (i.e., serving unit zones ).
The associated deployment cost can be expressed as the depreciation cost for each of the mobile access hubs in the fleet, plus the transportation cost of a mobile access hub from the local hub to location a and the cost of reserving space in location a for the duration of operations for each deployed mobile access hub. This deployment cost for candidate location a can be expressed as , where is the distance between the local hub and location a, is the variable transportation cost per distance traveled for a mobile access hub, and is the price paid for reserving location a for the duration of operations; That is, , where is the depreciation of a mobile access hub during one operations period.
The operations costs of riders moving parcels between the local hub and access hubs can be expressed as which is accounted for only if a mobile access hub is deployed in location a (i.e., ).
Operations costs of couriers serving unit zones can be expressed as , where is a binary variable equal to 1 if unit zone z is served by a mobile access hub, and 0 otherwise. The relationship between variables and can be expressed by the set of mathematical constraints ensuring that a unit zone is served either from a mobile access hub or from the local hub, and ensuring that unit zone z can be served by at most one mobile access hub at the time.
Due to the structure of the proposed cost functions and the properties of the expected value of random variables, the expected value of operations costs as expressed in optimization challenge (1) is equivalent to operations costs for the average number of stops, say .
Objective function (7) aims at minimizing mobile access hub deployment costs plus the total expected cost of operations as defined by (1). Constraints (8) are linking constraints forcing the model to account for a unit zone’s baseline operations costs if no mobile access hubs is deployed to serve it. Constraints (9) ensures that at most one mobile access hub is serving a specific unit zone. Constraint (10) limits the number of mobile access hub deployments based on the number of mobile access hub available M.
4. Results
In this section, results of a set of numerical experiments are provided to give an understanding of the impact of different design parameters and to assess the potential of mobile access hub deployments in urban parcel logistics. First, operations associated with a single mobile access hub serving a unit zone are examined to observe the impact of a set of design parameters on the economic viability of operations using a mobile access hub. Then, sensitivity analysis results on the deployment of a set of mobile access hubs over a synthetic local cell composed of several unit zones are provided to examine the impact of different factors on the performance of such solution. Finally, sample results from a case inspired by a large parcel express carrier operations are presented to assess the potential of mobile access hub deployments in a real-world context. All experiments were implemented in Python 3.7 using Gurobi 9.0 as the solver and were computed on a laptop with an lIntel Core i5-7200U CPU @ 2.50 GHz (Intel, Santa Clara, CA, USA).
4.1. Assessing Economic Viability of a Mobile Access Hub
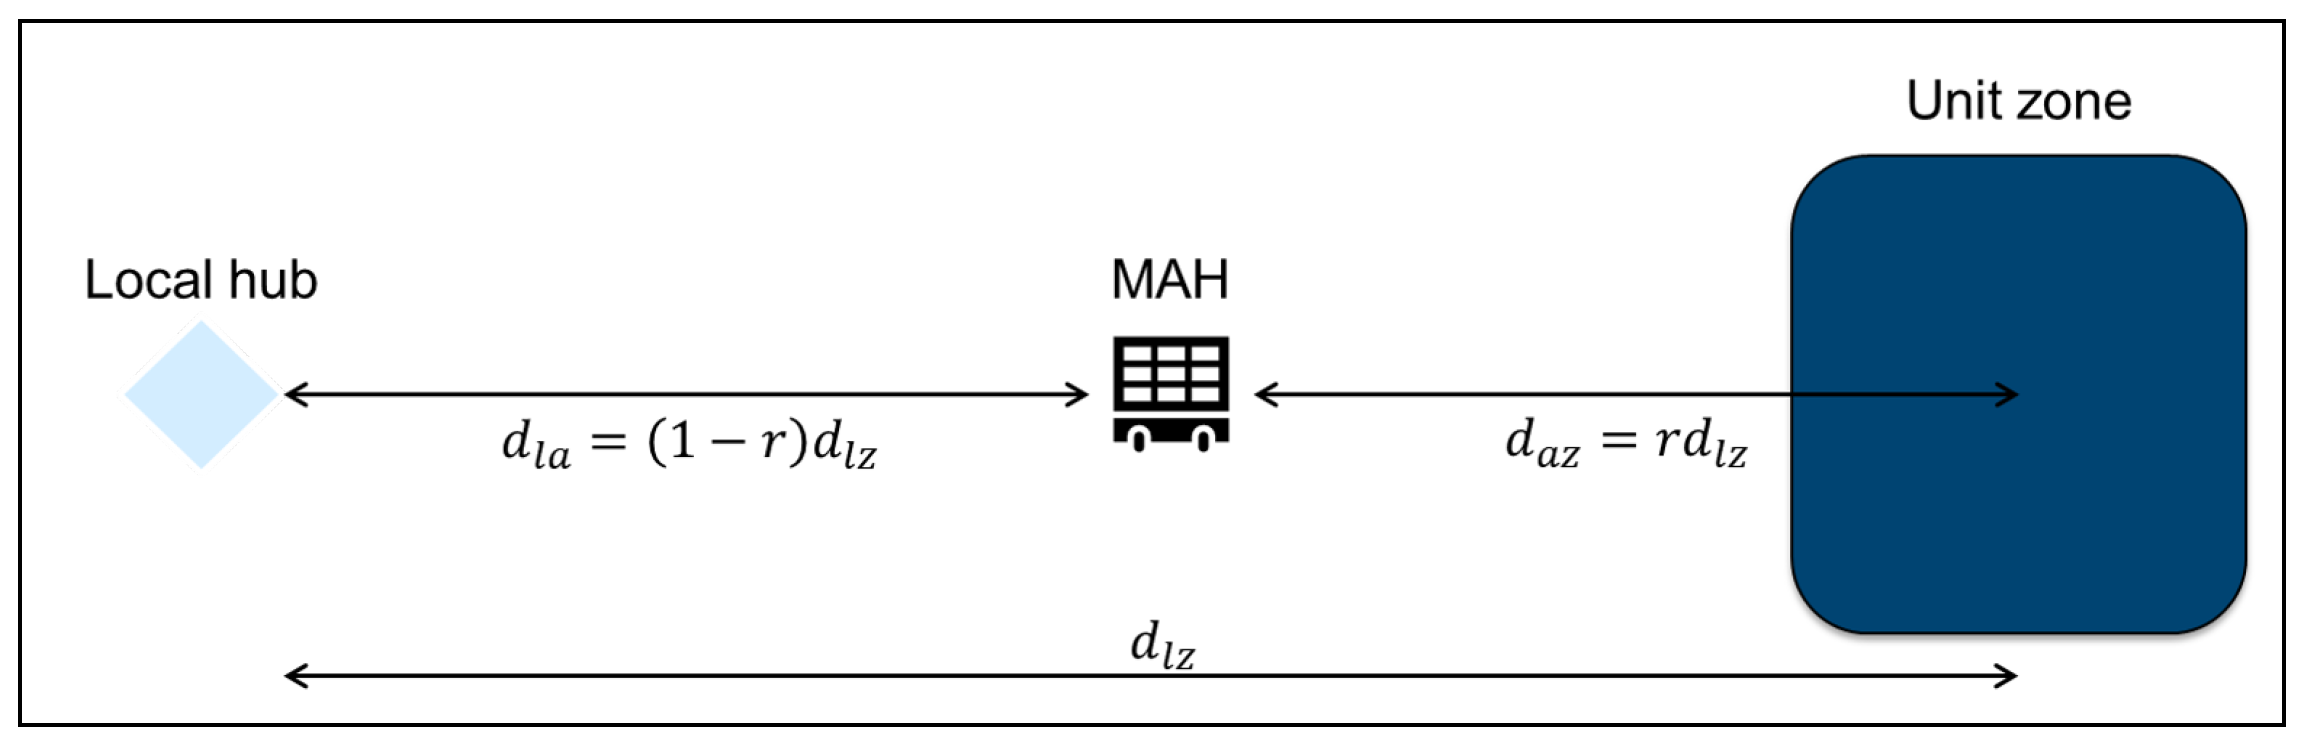
Consider a unit zone z corresponding to a square located away from a local hub (distance between the hub and the average location in the unit zone). Suppose a mobile access hub a can be deployed on a line between the local hub and the unit zone so that , as illustrated in Figure 2. Define a stem distance ratio r such that and .
Let the economic load be the minimum pickup and delivery load in the unit zone that ensures operations using the mobile access hub are cheaper than the baseline (i.e., courier operating from the local hub). The economic load can be computed by solving the following linear equation for n:
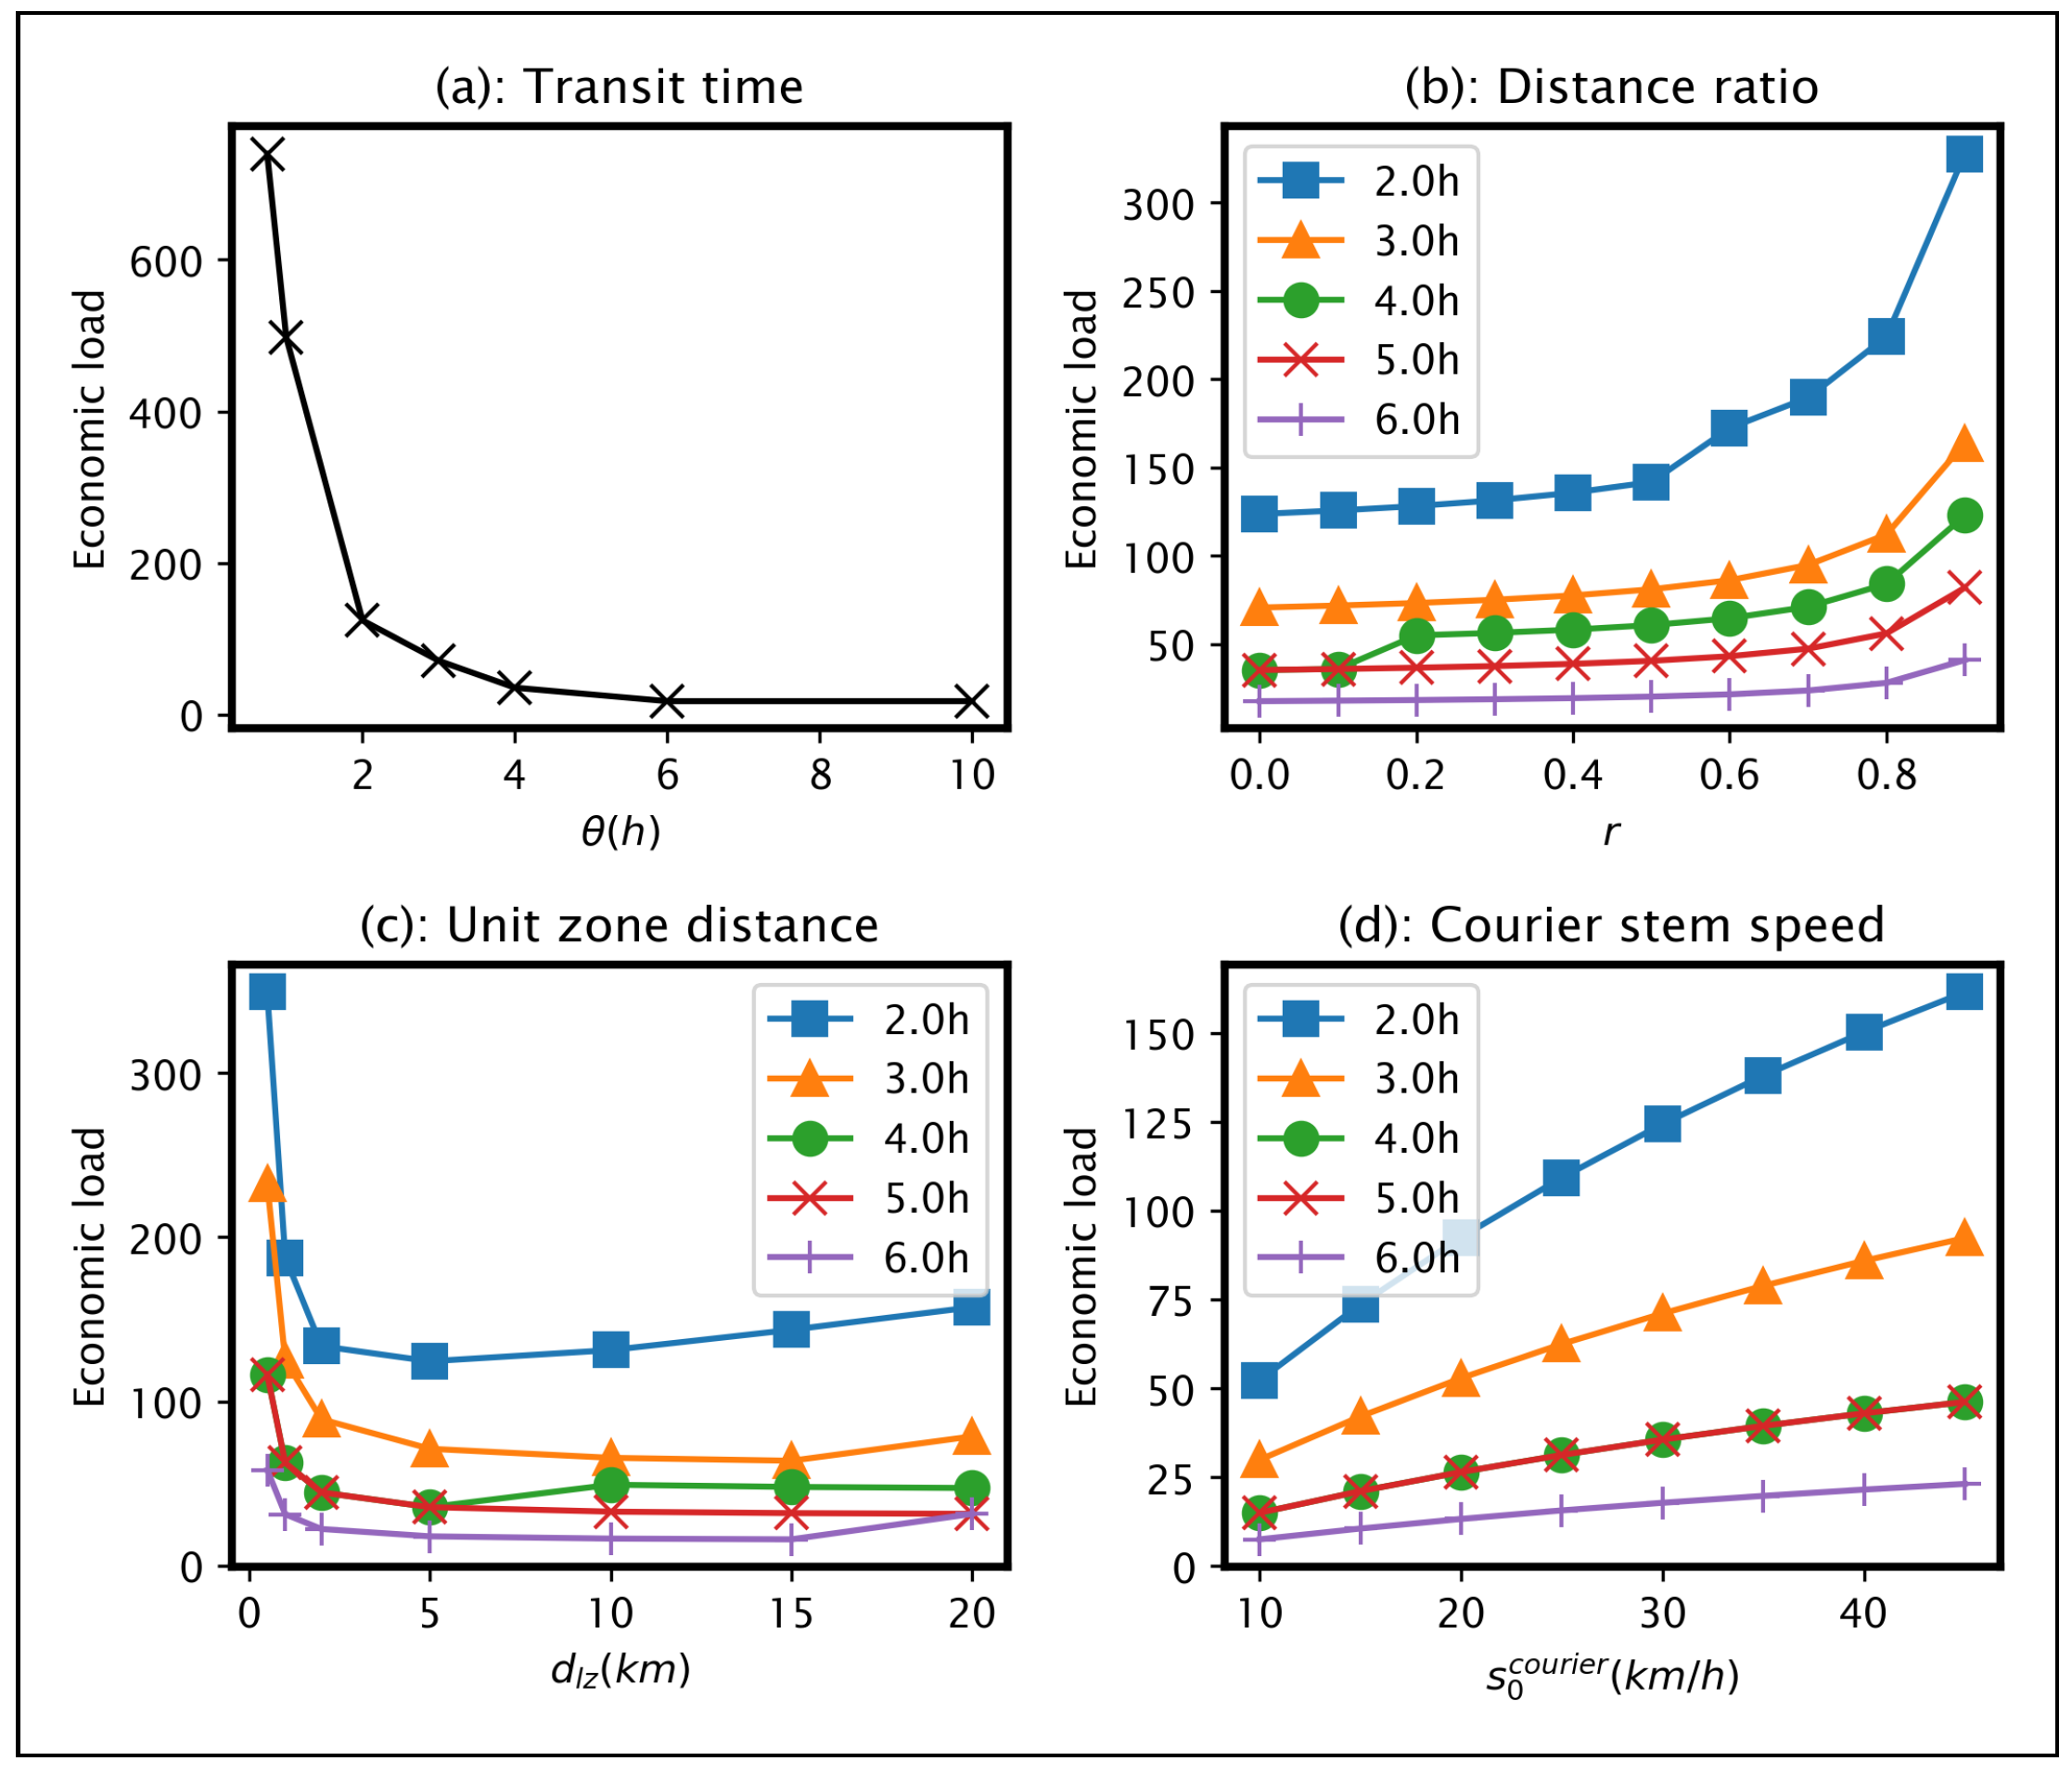
That is, if the pickup and delivery load of the unit zone greater than the economic load, mobile access hub operations are cheaper than the baseline (without accounting for deployment costs). The objective is to study the impact of a set of design parameters on the economic viability of a mobile access hub by examining the behavior of the economic load when varying the parameters’ values. Figure 3 provides sensitivity analysis of the economic load against the stem distance ratio r, the distance between the local hub and the unit zone , the average courier stem speed and the transit time constraint . Default parameter values are listed in Appendix B.1.
The first observation from Figure 3a is that, as the transit time constraints become tighter (i.e., smaller values), economic load values increase. This is due to the fact that the rider visit frequency has to be adjusted to reduce the waiting time in the mobile access hub, and the travel time between the mobile access hub and the local hub.
Secondly, Figure 3b shows that the economic load slowly increases with the stem distance ratio r on the interval , which suggests that mobile access hubs can be located near but not within the unit zone they serve and still enable operations cost savings. This is even more important when considering mobile access hubs serving several unit zones by being located for instance at their intersection.
Thirdly, Figure 3c displays the economic load against the distance between the local hub and the unit zone. When the unit zone is very close to the local hub, a mobile access hub does not seem to make sense as the economic load goes to infinity as the distance tends towards 0. However, the economic load quickly decreases as the unit zone becomes more distant from the local hub, then it re-increases slightly.
Lastly, the constraints on courier vehicles operating in dense urban areas often limit courier’s carrying capacity and average speed. While performing pickup and deliveries in a unit zone, speed may be limited by the stop density and the road infrastructure often limits couriers to operate specific lightweight vehicles. Such vehicles may have limited speed when traveling between the local hub and the unit zone (stem speed, ), which couriers have to do often due to their limited carrying capacity. Also, they are often active vehicles (e.g., cycling) or low-speed scooters, both inducing longer stem times. To illustrate options for courier vehicles that have different stem speed capabilities (e.g., tricycle versus motorcycle), Figure 3d shows the economic load as a function of courier’s stem speed. It shows that the economic load decreases with . That is, it suggests that, when couriers are limited to slower lightweight vehicles, mobile access hubs become more relevant.
4.2. Assessing the Performance of Mobile Access Hub Deployments
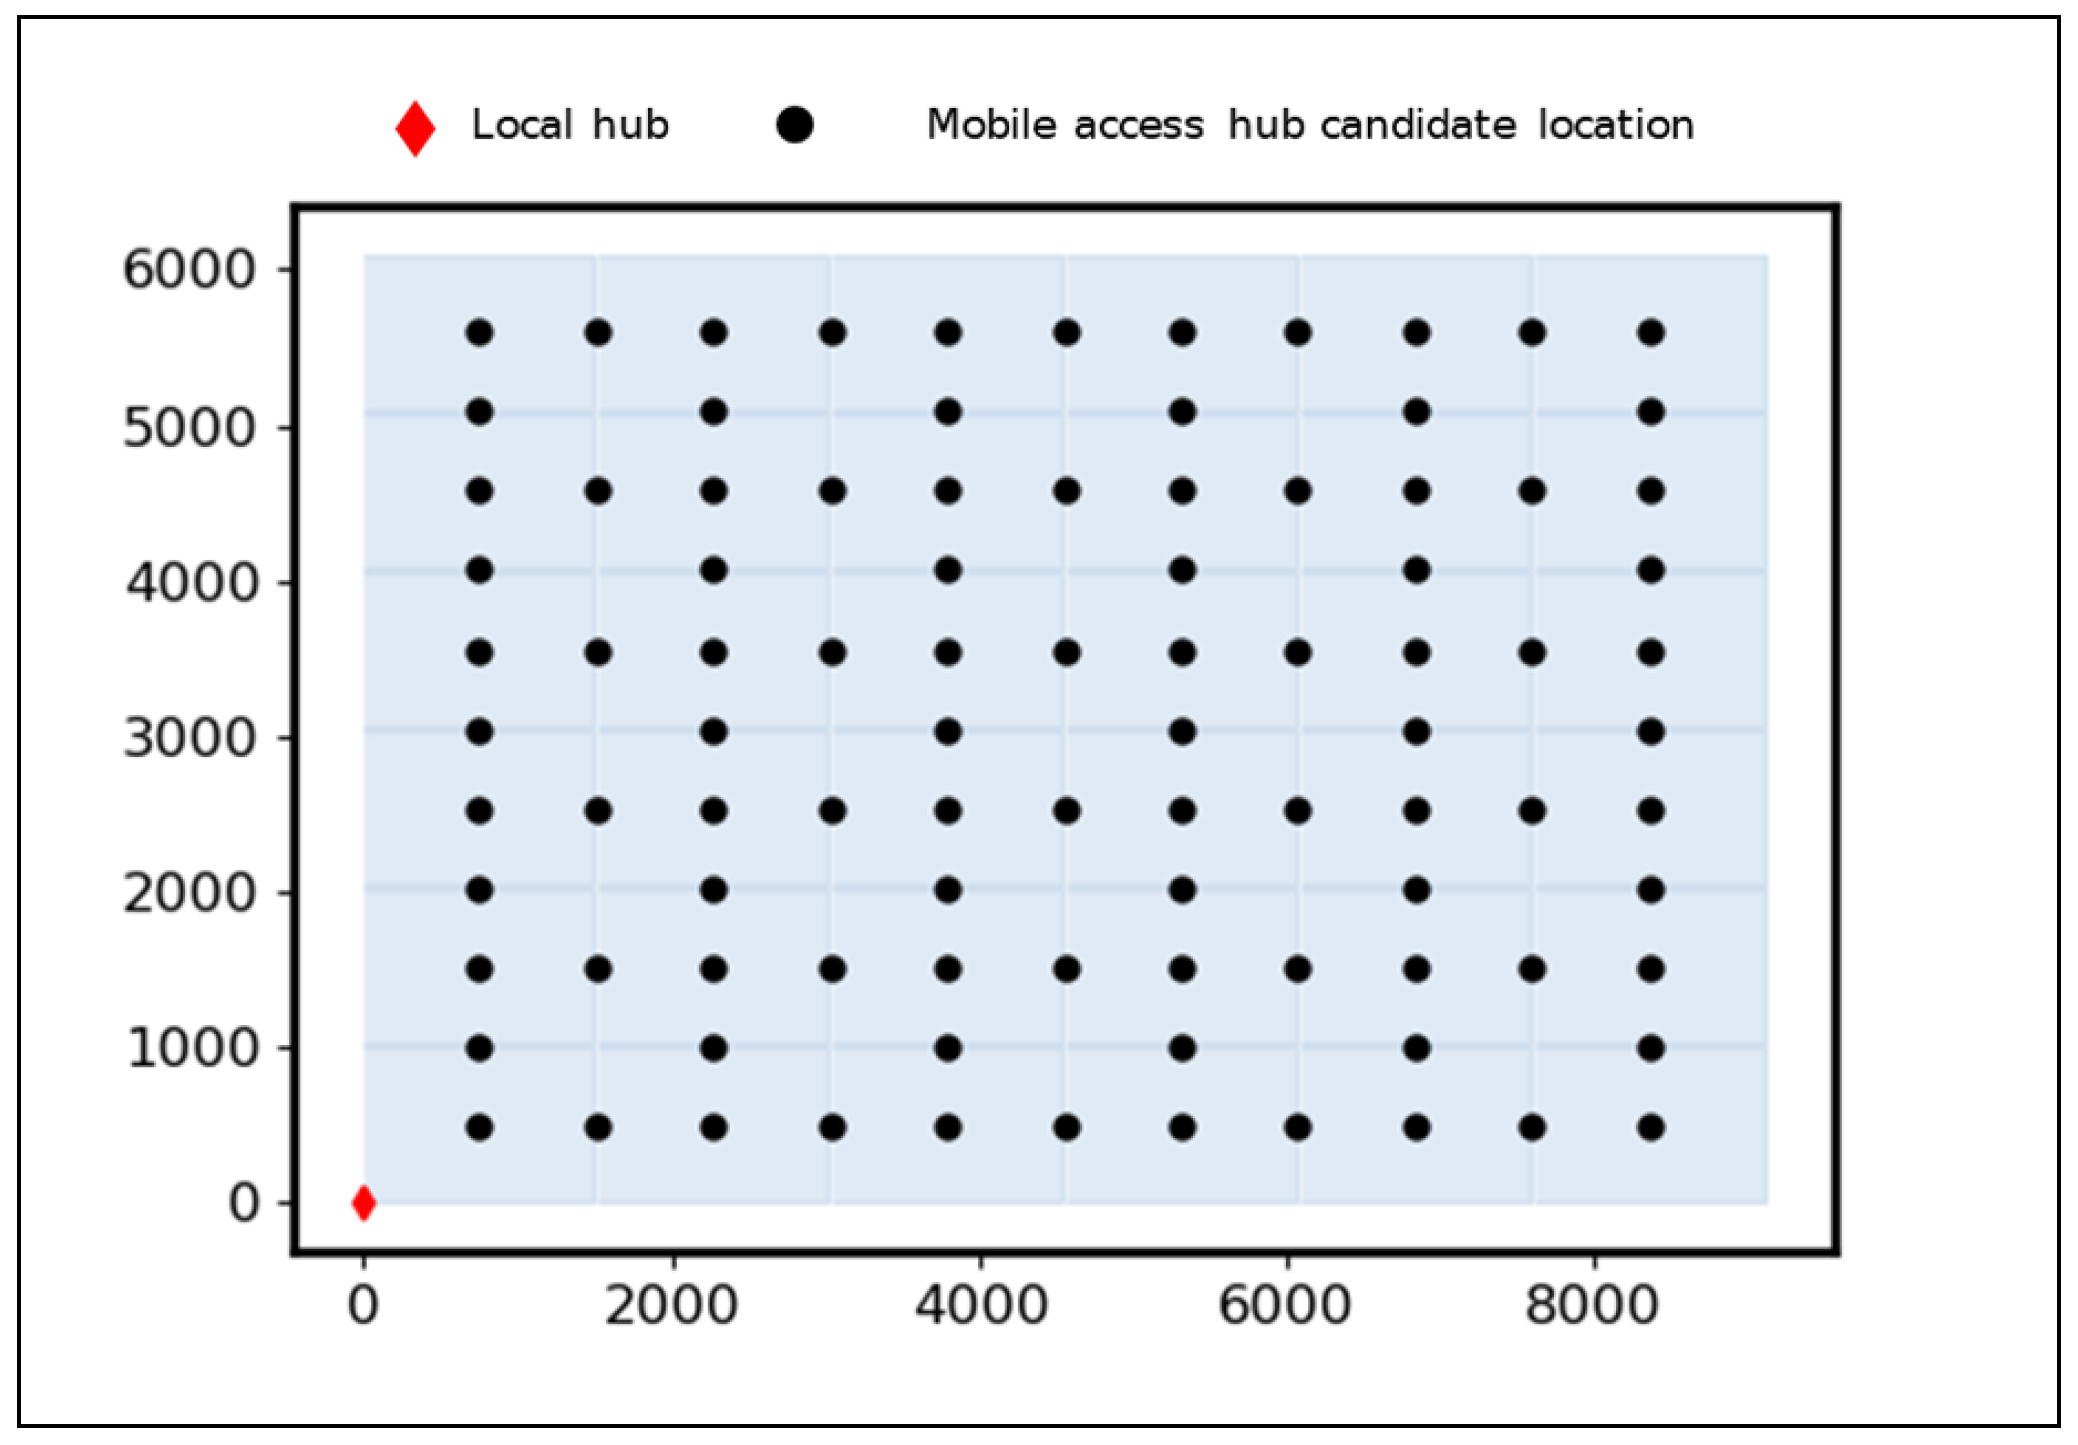
In order to assess different factors impacting mobile access hubs deployment performance over several unit zones served by a single local hub while breaking free from the impact of specific geography, a synthetic local cell instance is considered. The instance is composed of rectangular unit zones of dimensions 1 km by 1.5 km arranged in a 6 by 6 local cell with 20 m inter-zone interstices served by a local hub located at the bottom left corner. Each unit zone is operated daily for 10 h (), and is subject to normally distributed expected demand in terms of number of stops . Each experiment presented in this section is performed over 1000 demand instances (i.e., days) generated by Monte Carlo simulation for which, unless stated otherwise, default values are defined as the mean and the coefficient of variation . Candidate mobile access hub locations are defined as the combination of (1) centroids of each unit zone, able to serve the unit zone itself, and (2) the midpoint on the segment between two centroids, able to serve the corresponding two unit zones, for each pair of neighboring unit zones. Figure 4 illustrates the synthetic instance and its set of candidate locations.
4.2.1. Impact of Demand Variability
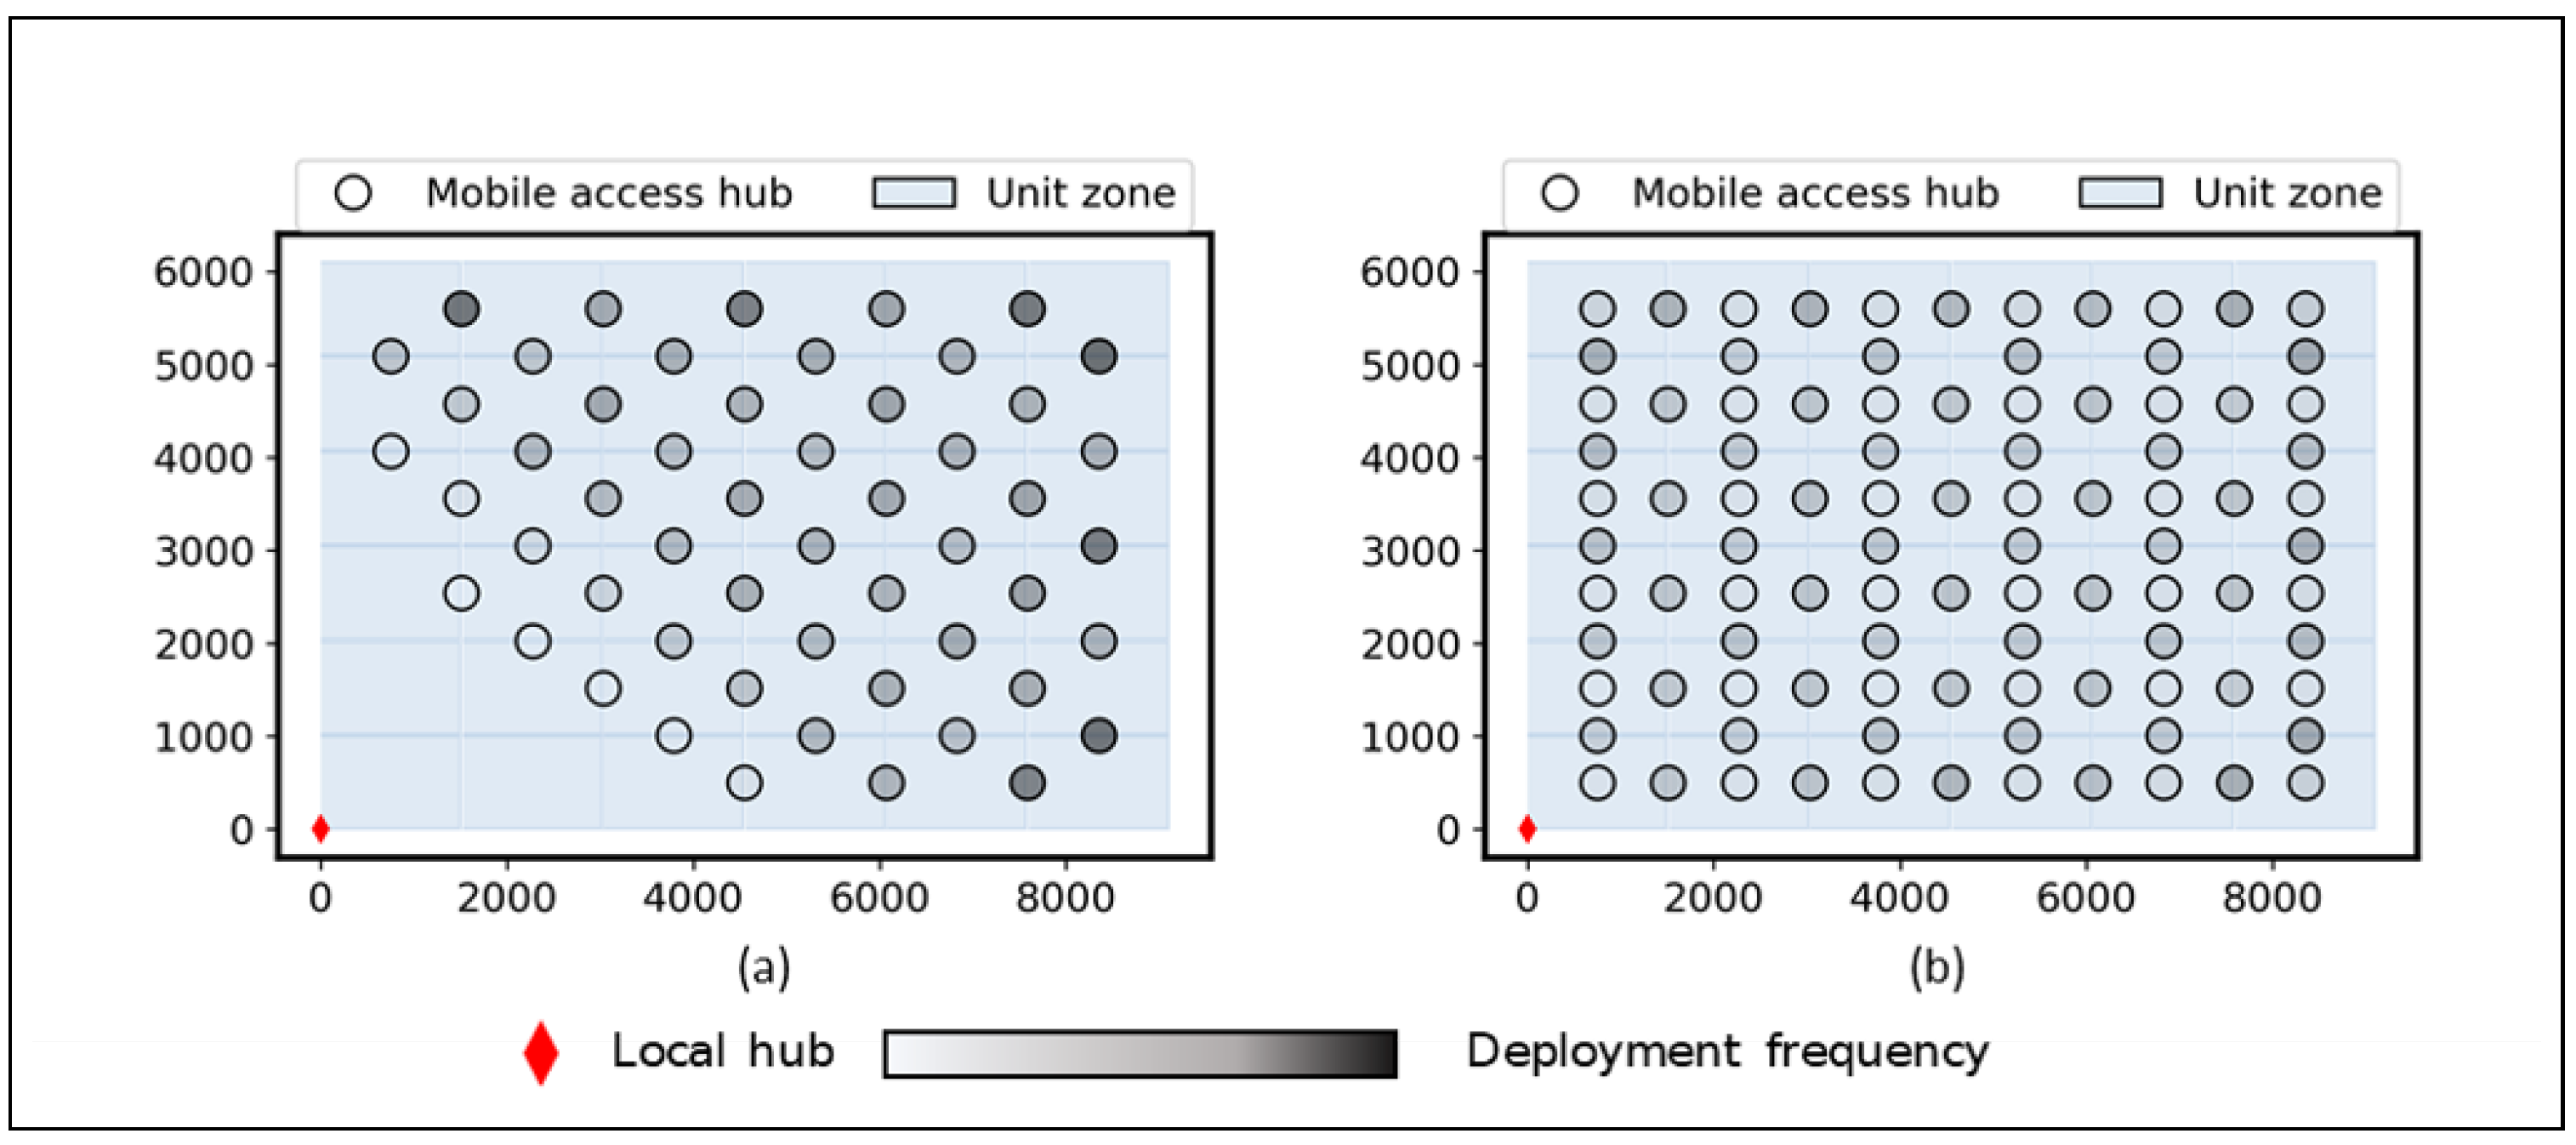
Demand variability impacts the diversity of demand realizations from one day to another. In terms of mobile access hub deployments, a low variability context makes deployments more likely to be similar day after day than a context where demand is highly volatile. Figure 5 illustrates this by displaying the frequency of mobile access hub deployments at each location used for different coefficients of variation by changing the value of . Figure 5a (low variability) shows that a few locations at the perimeter of the local cell are more frequently used for mobile access hub deployments, which indicates that these locations are used in most of the 1000 deployments in the sample. Moreover, a few locations close to the local hub are rarely used, and all locations that are used are serving two unit zones. Comparatively, Figure 5b (high variability) shows a more homogeneous deployment frequency over the set of used locations, with a medium deployment frequency over all candidate locations serving two unit zones, and a low deployment frequency over all candidate locations serving a single unit zone.
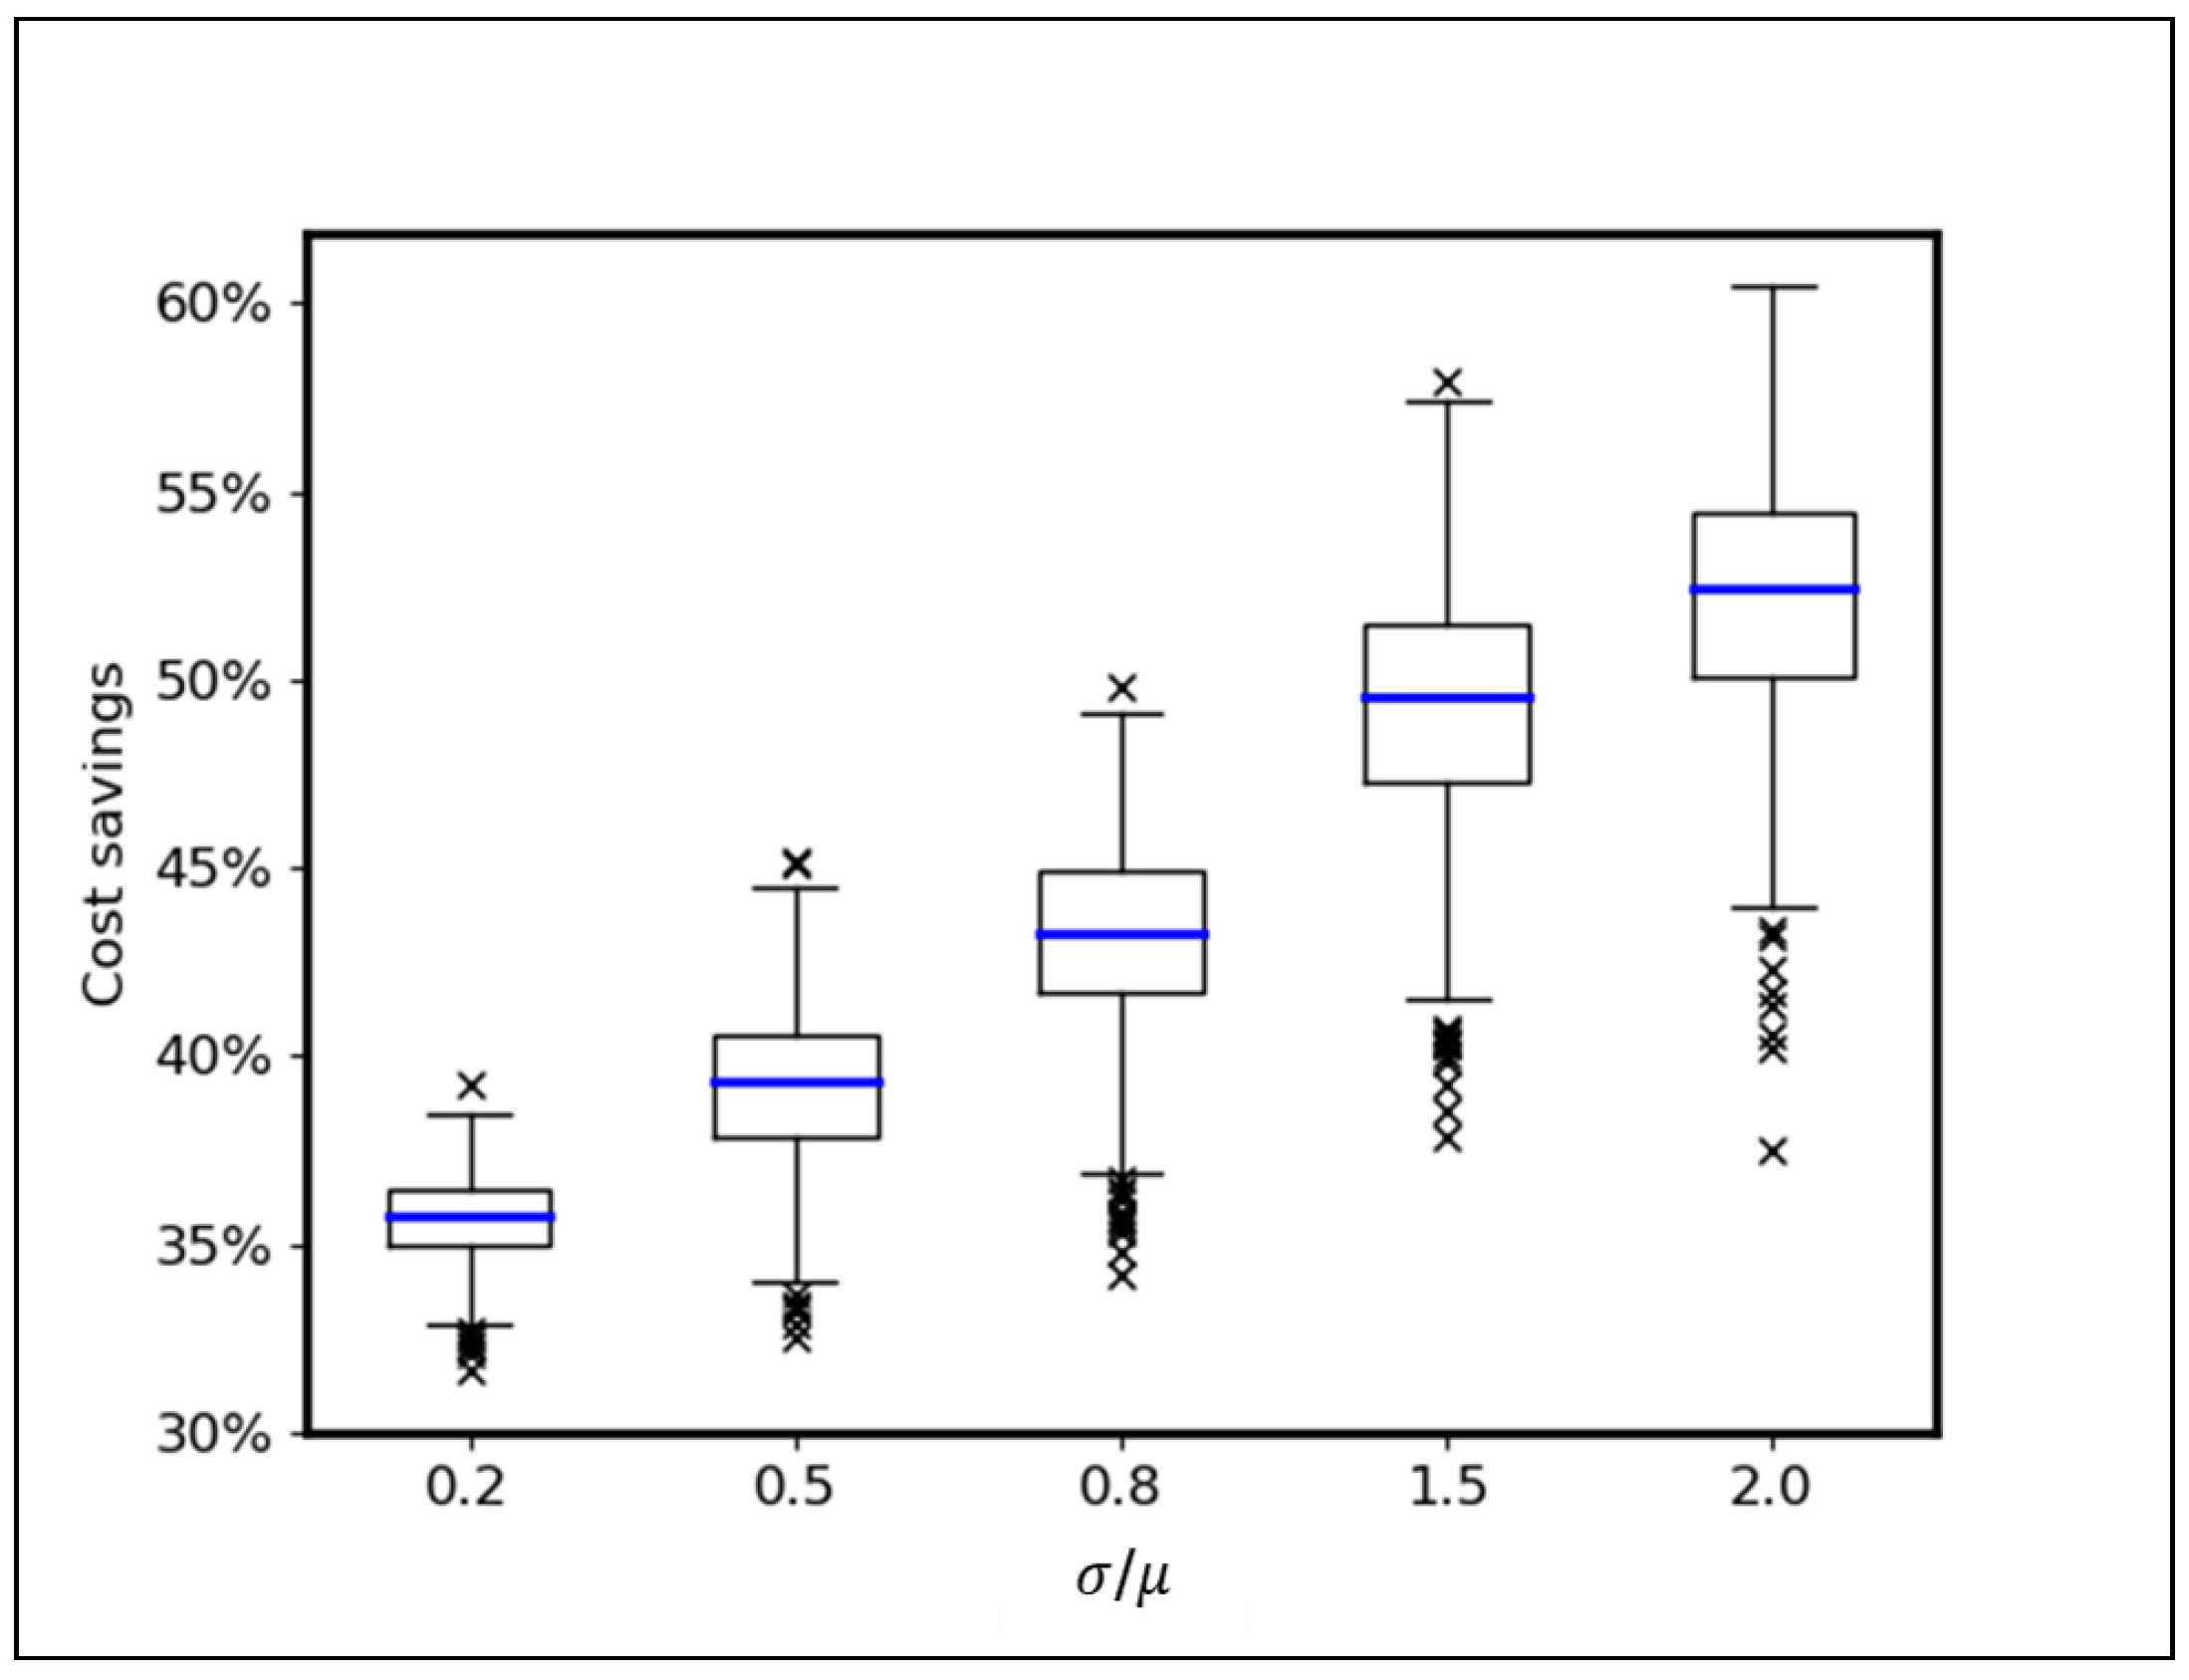
Figure 6 presents cost saving distributions for different coefficients of variation (i.e., for different values of ). The spread of cost saving distributions increase with demand variability, which confirms the diversity of demand realizations from one day to another for high coefficients of variation. Moreover, Figure 6 shows that, for the same demand mean value , cost savings increase with demand variability. That is, local cells where demand is highly variable seem to better benefit from mobile access hub deployments.
4.2.2. Impact of Transit Time Constraints
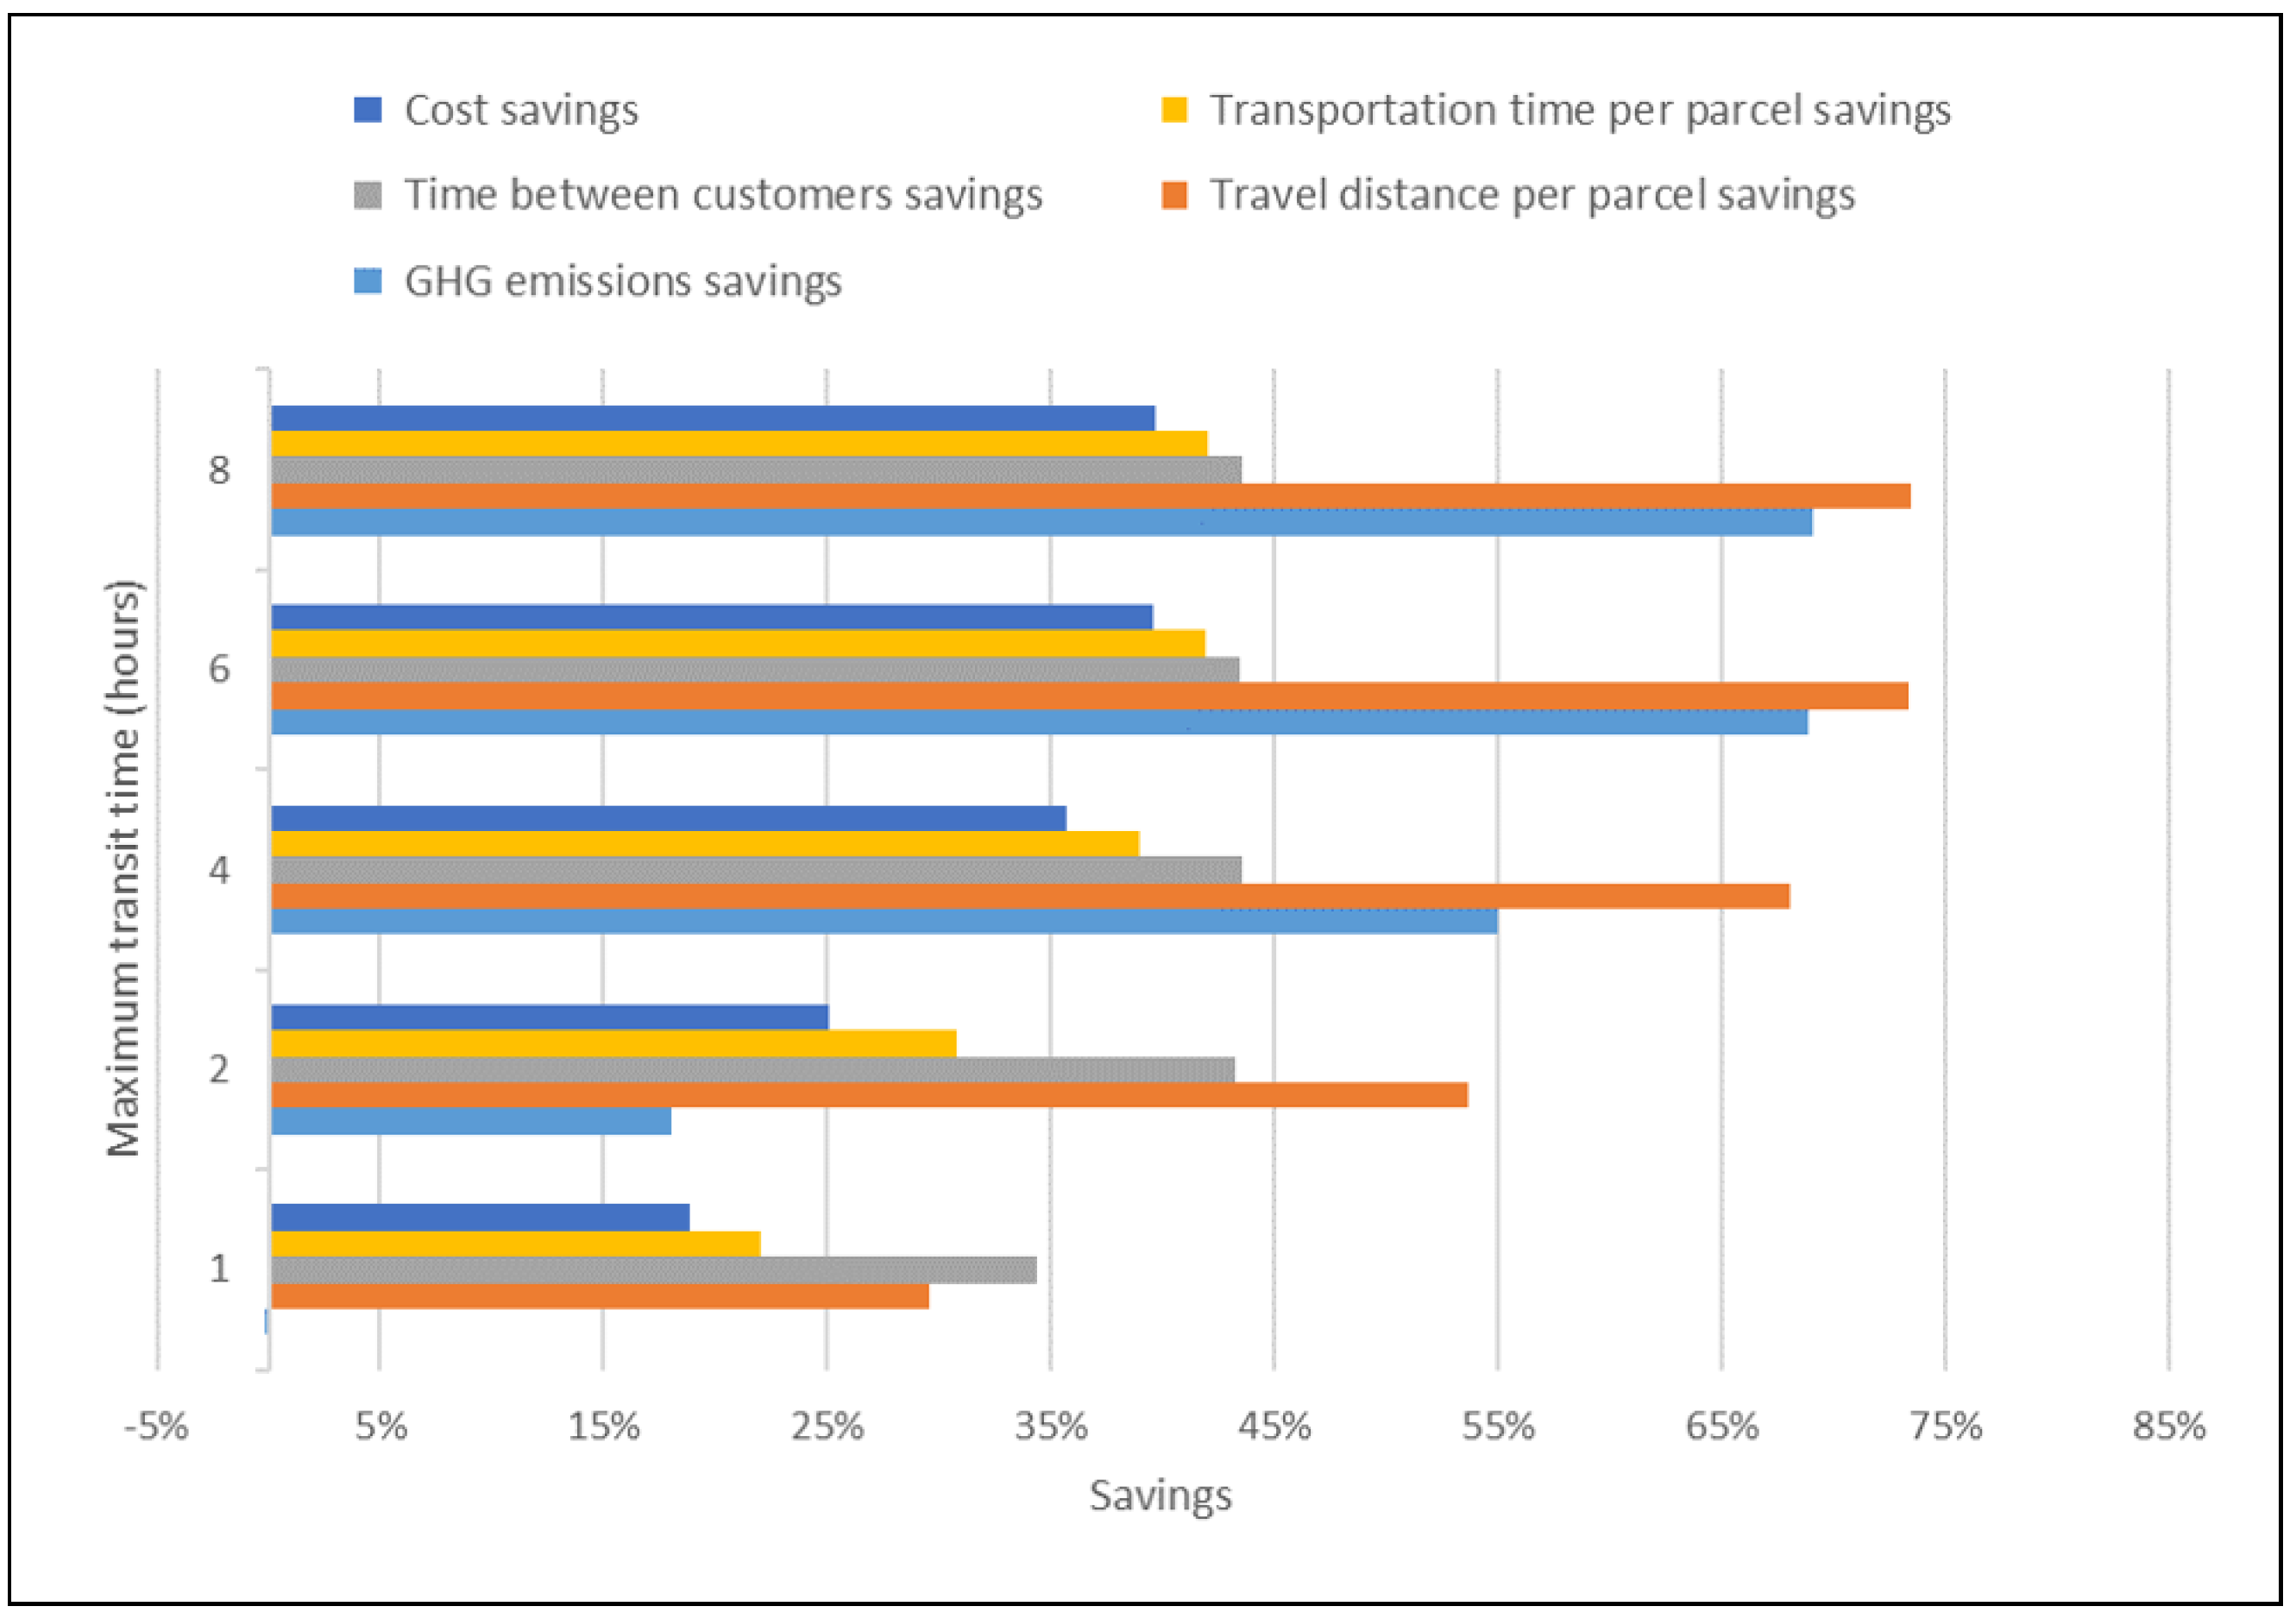
The maximum transit time as defined in Section 3.1 impacts the profitability of each mobile access hub candidate location by determining the number of rider trips between the local hub and the mobile access hub. Additionally, the maximum transit time may also limit the maximum number of stops on a courier route, and therefore impact both the baseline operations costs and the cost of operations of mobile access hub candidates. Figure 7 displays performance indicators defined in Section 3.2 for maximum transit time values ranging from 1 h to 8 h.
Every performance indicator increases with the maximum transit time value; the advantages of using mobile access hubs are greater when the time constraint is not too tight as less overall vehicle movement is required for each mobile access hub candidate (i.e., rider trips). However, savings are still significant for tight time constraints. For instance, for 1 h, mobile access hubs provide significant cost, time, and travel savings compared to baseline operations even if greenhouse gas emissions are not improved in this case as a result of the high frequency of rider vehicle movements and their relative greenhouse gas emissions efficiency.
4.2.3. Impact of Mobile Access Hub Fleet Size
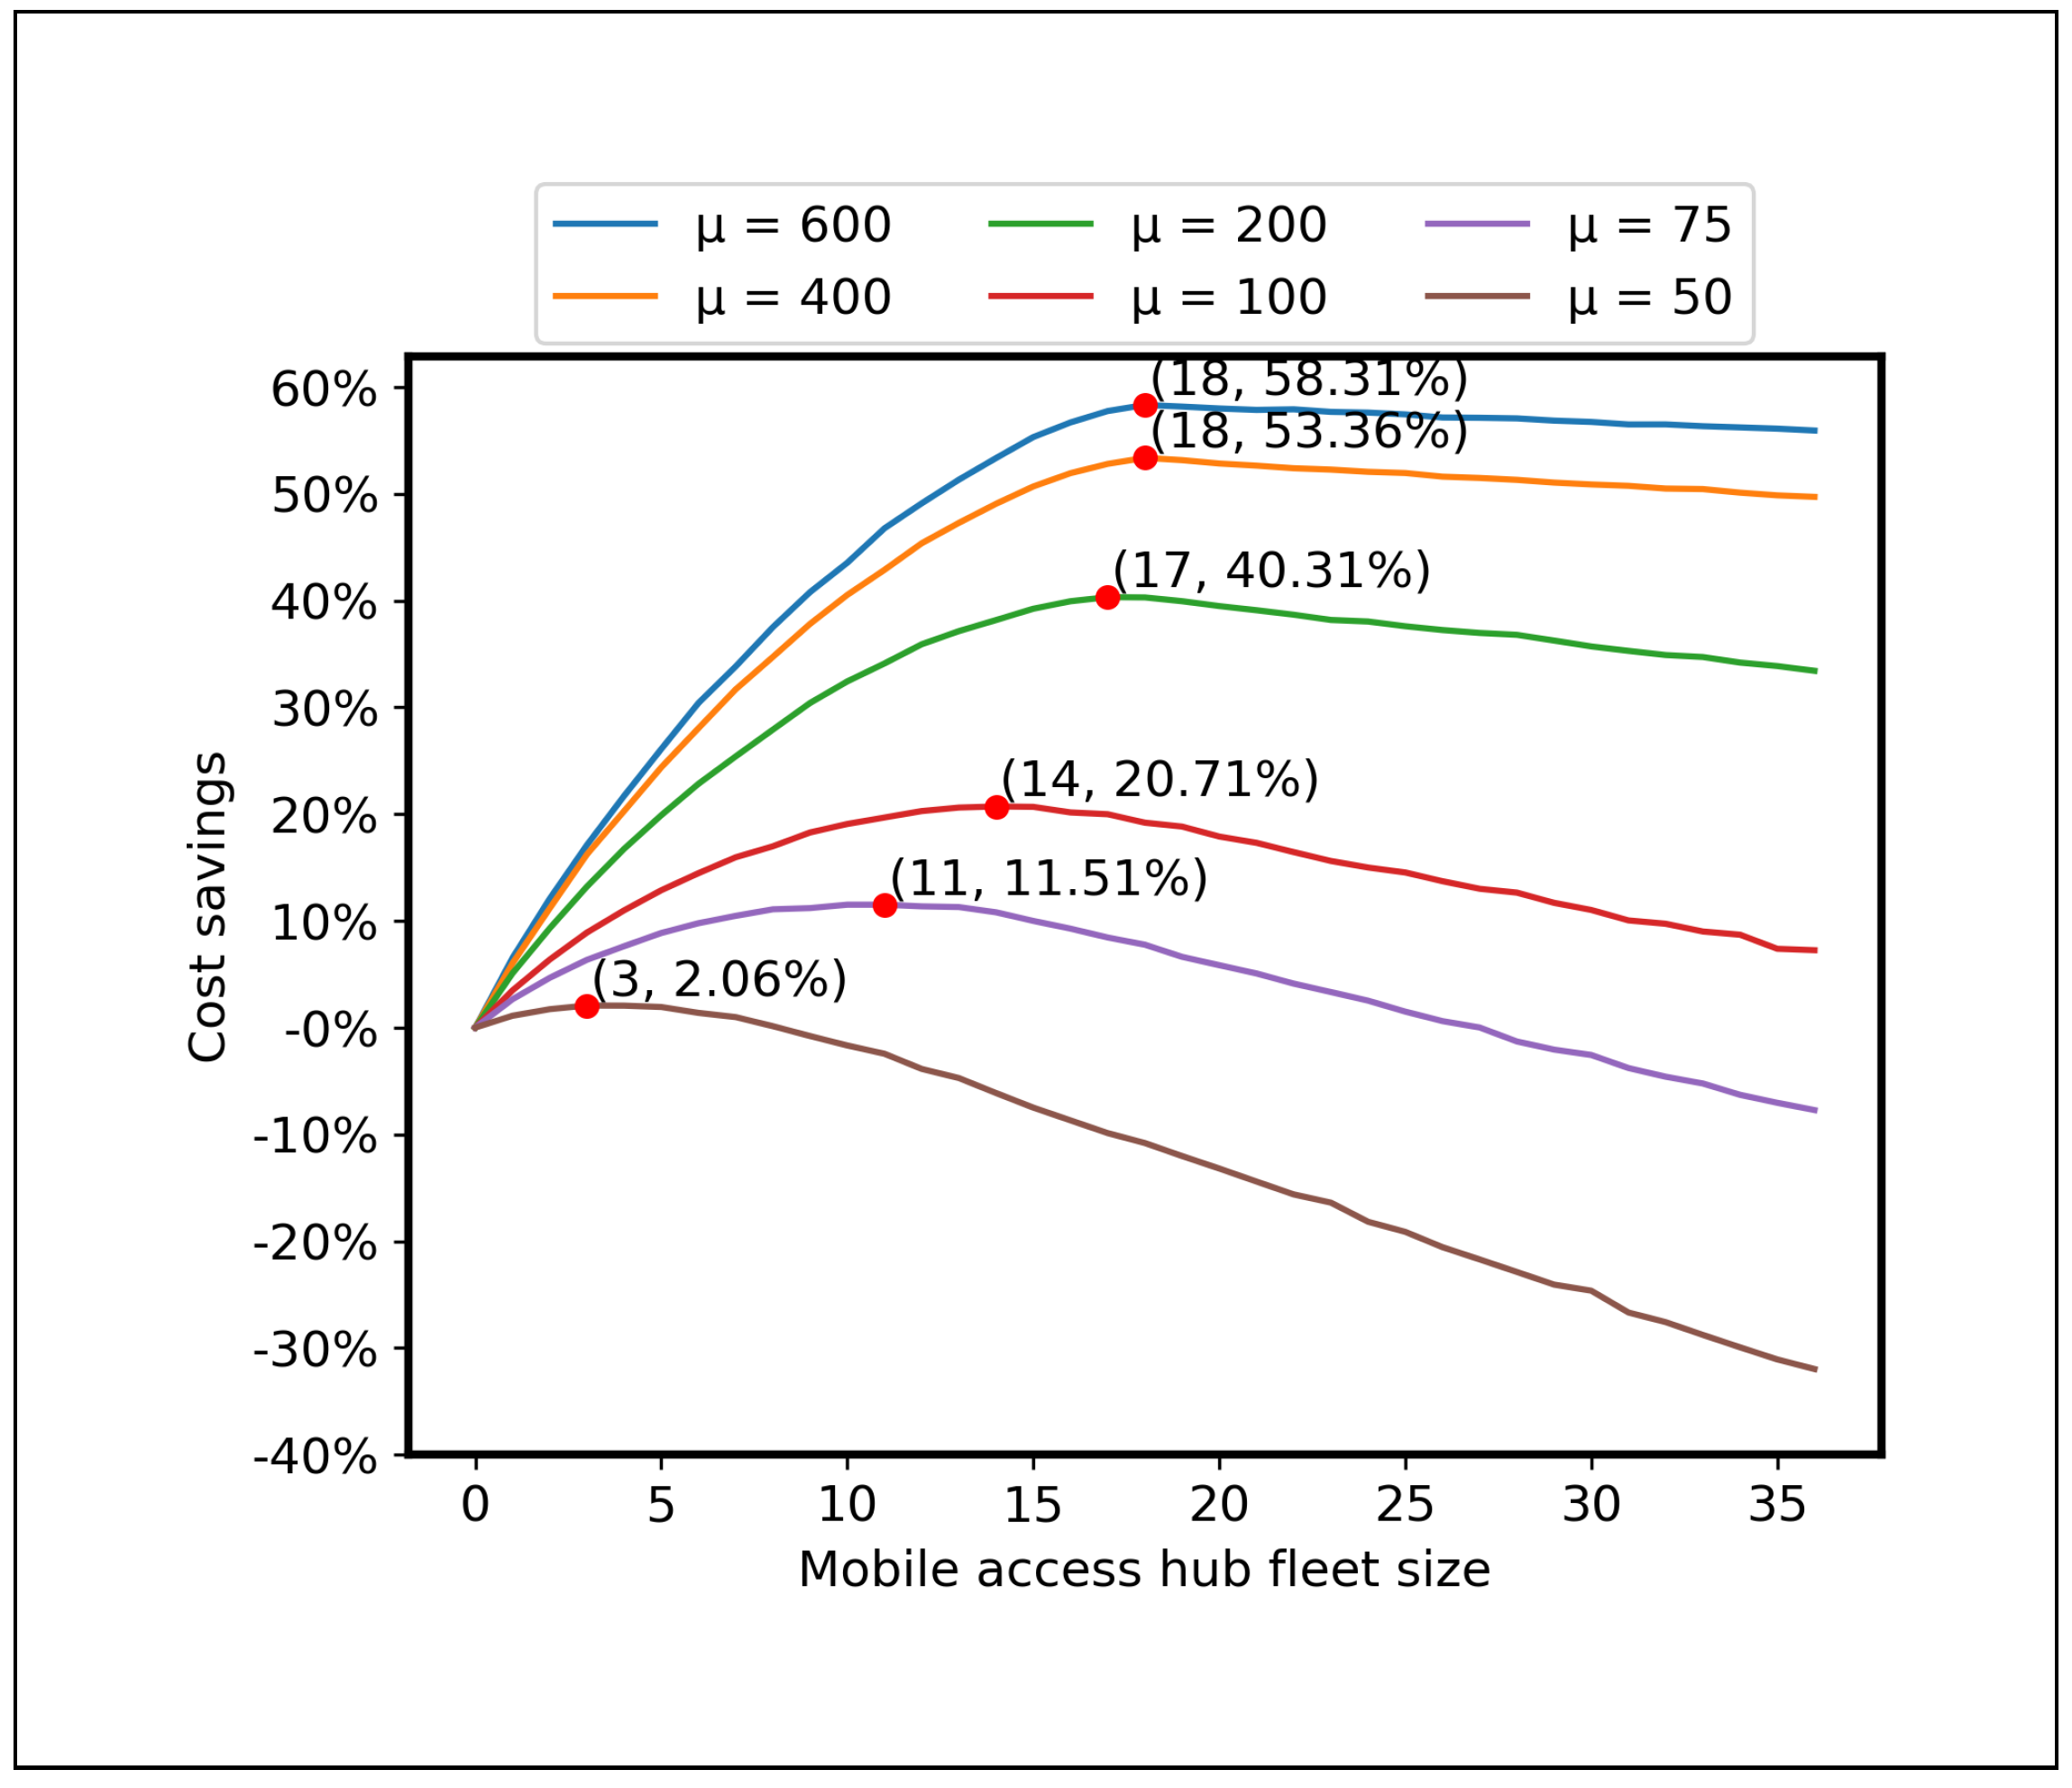
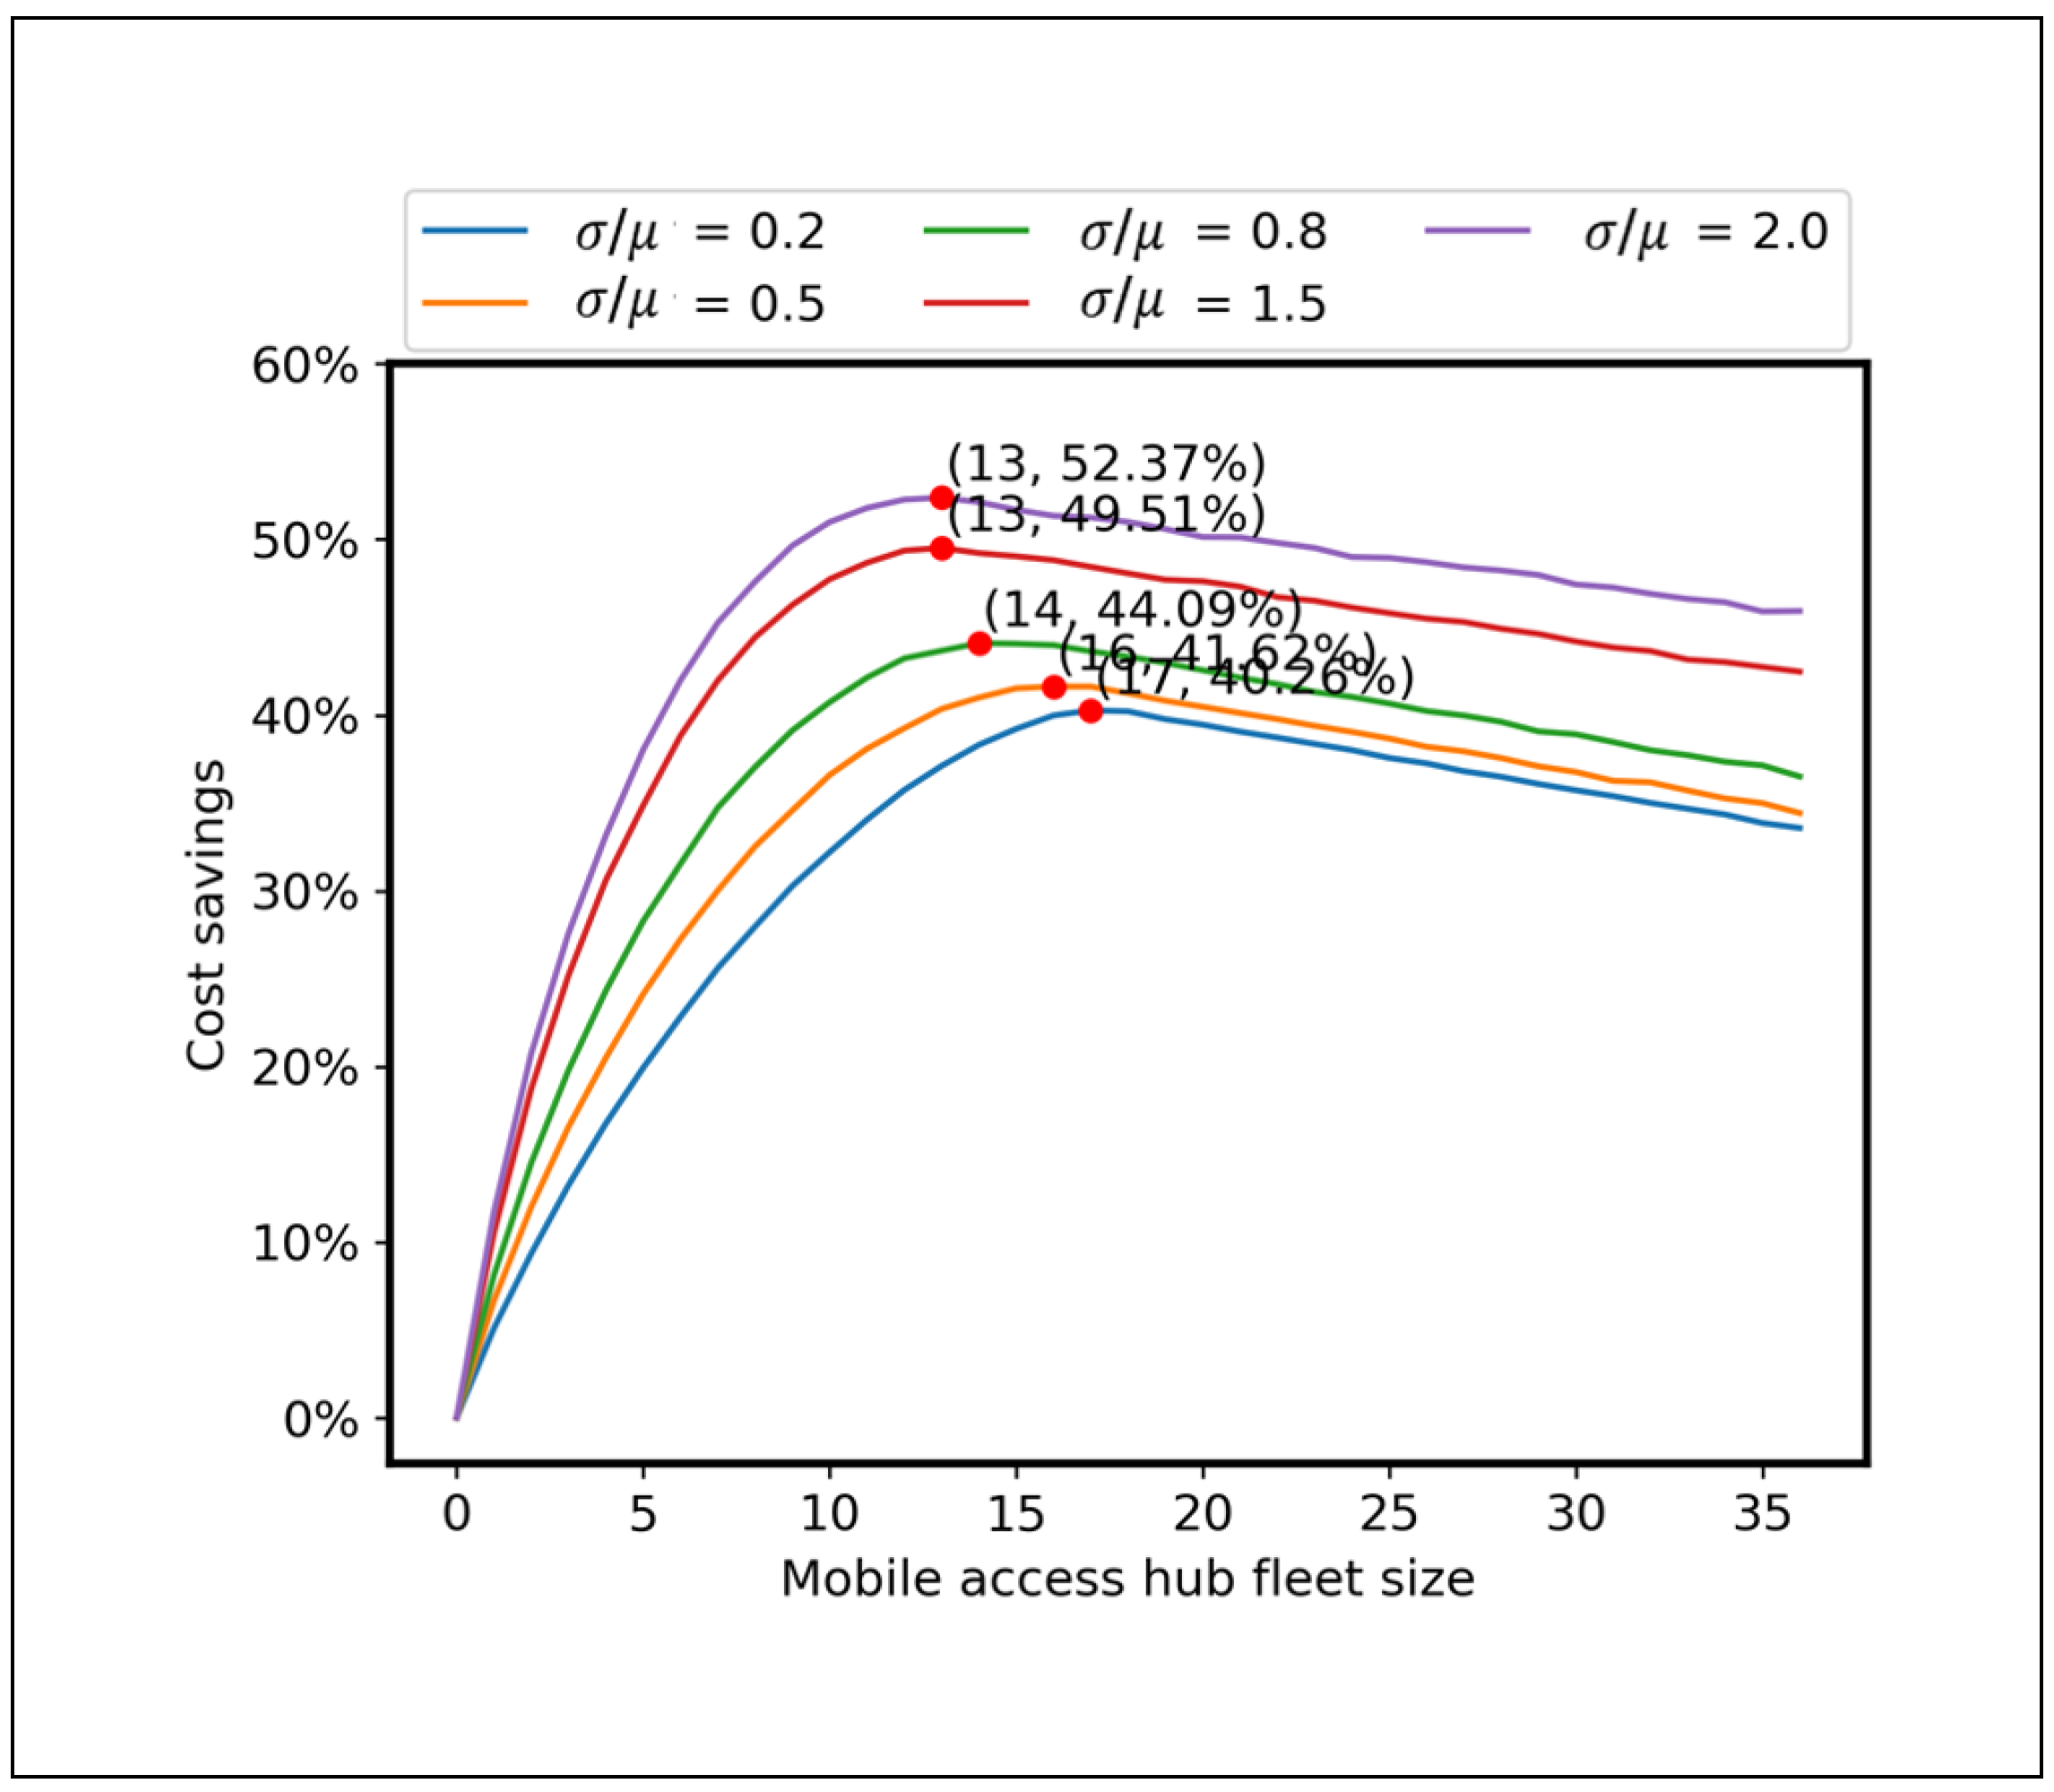
The number of mobile access hubs available to deploy, or the mobile access hub fleet size M, directly impacts the cost efficiency of solutions as mobile access hubs depreciate whether or not they are deployed. That is, having a large fleet may result in reduced or even negative cost savings, and lower fleet utilization. Similarly, having a small fleet may reduce the potential cost savings by missing opportunities to deploy mobile access hubs in profitable locations, but has the advantage of avoiding negative savings and ensuring high fleet utilization. Figure 8 and Figure 9 show the evolution of cost savings as a function of fleet size for different demand levels and different demand coefficients of variation.
Both Figure 8 and Figure 9 show that cost savings increase with the fleet size until a maximum is reached (i.e., the optimal fleet size, marked as a red dot), before decreasing asymptotically linearly (accordingly to the depreciation rate). Additionally, Figure 8 shows that the optimal fleet size increases as increases, which indicates that more mobile access hub locations become profitable. In addition, Figure 9 shows that the optimal fleet size decreases as demand variability increases, as mobile access hub candidate locations are less frequently profitable.
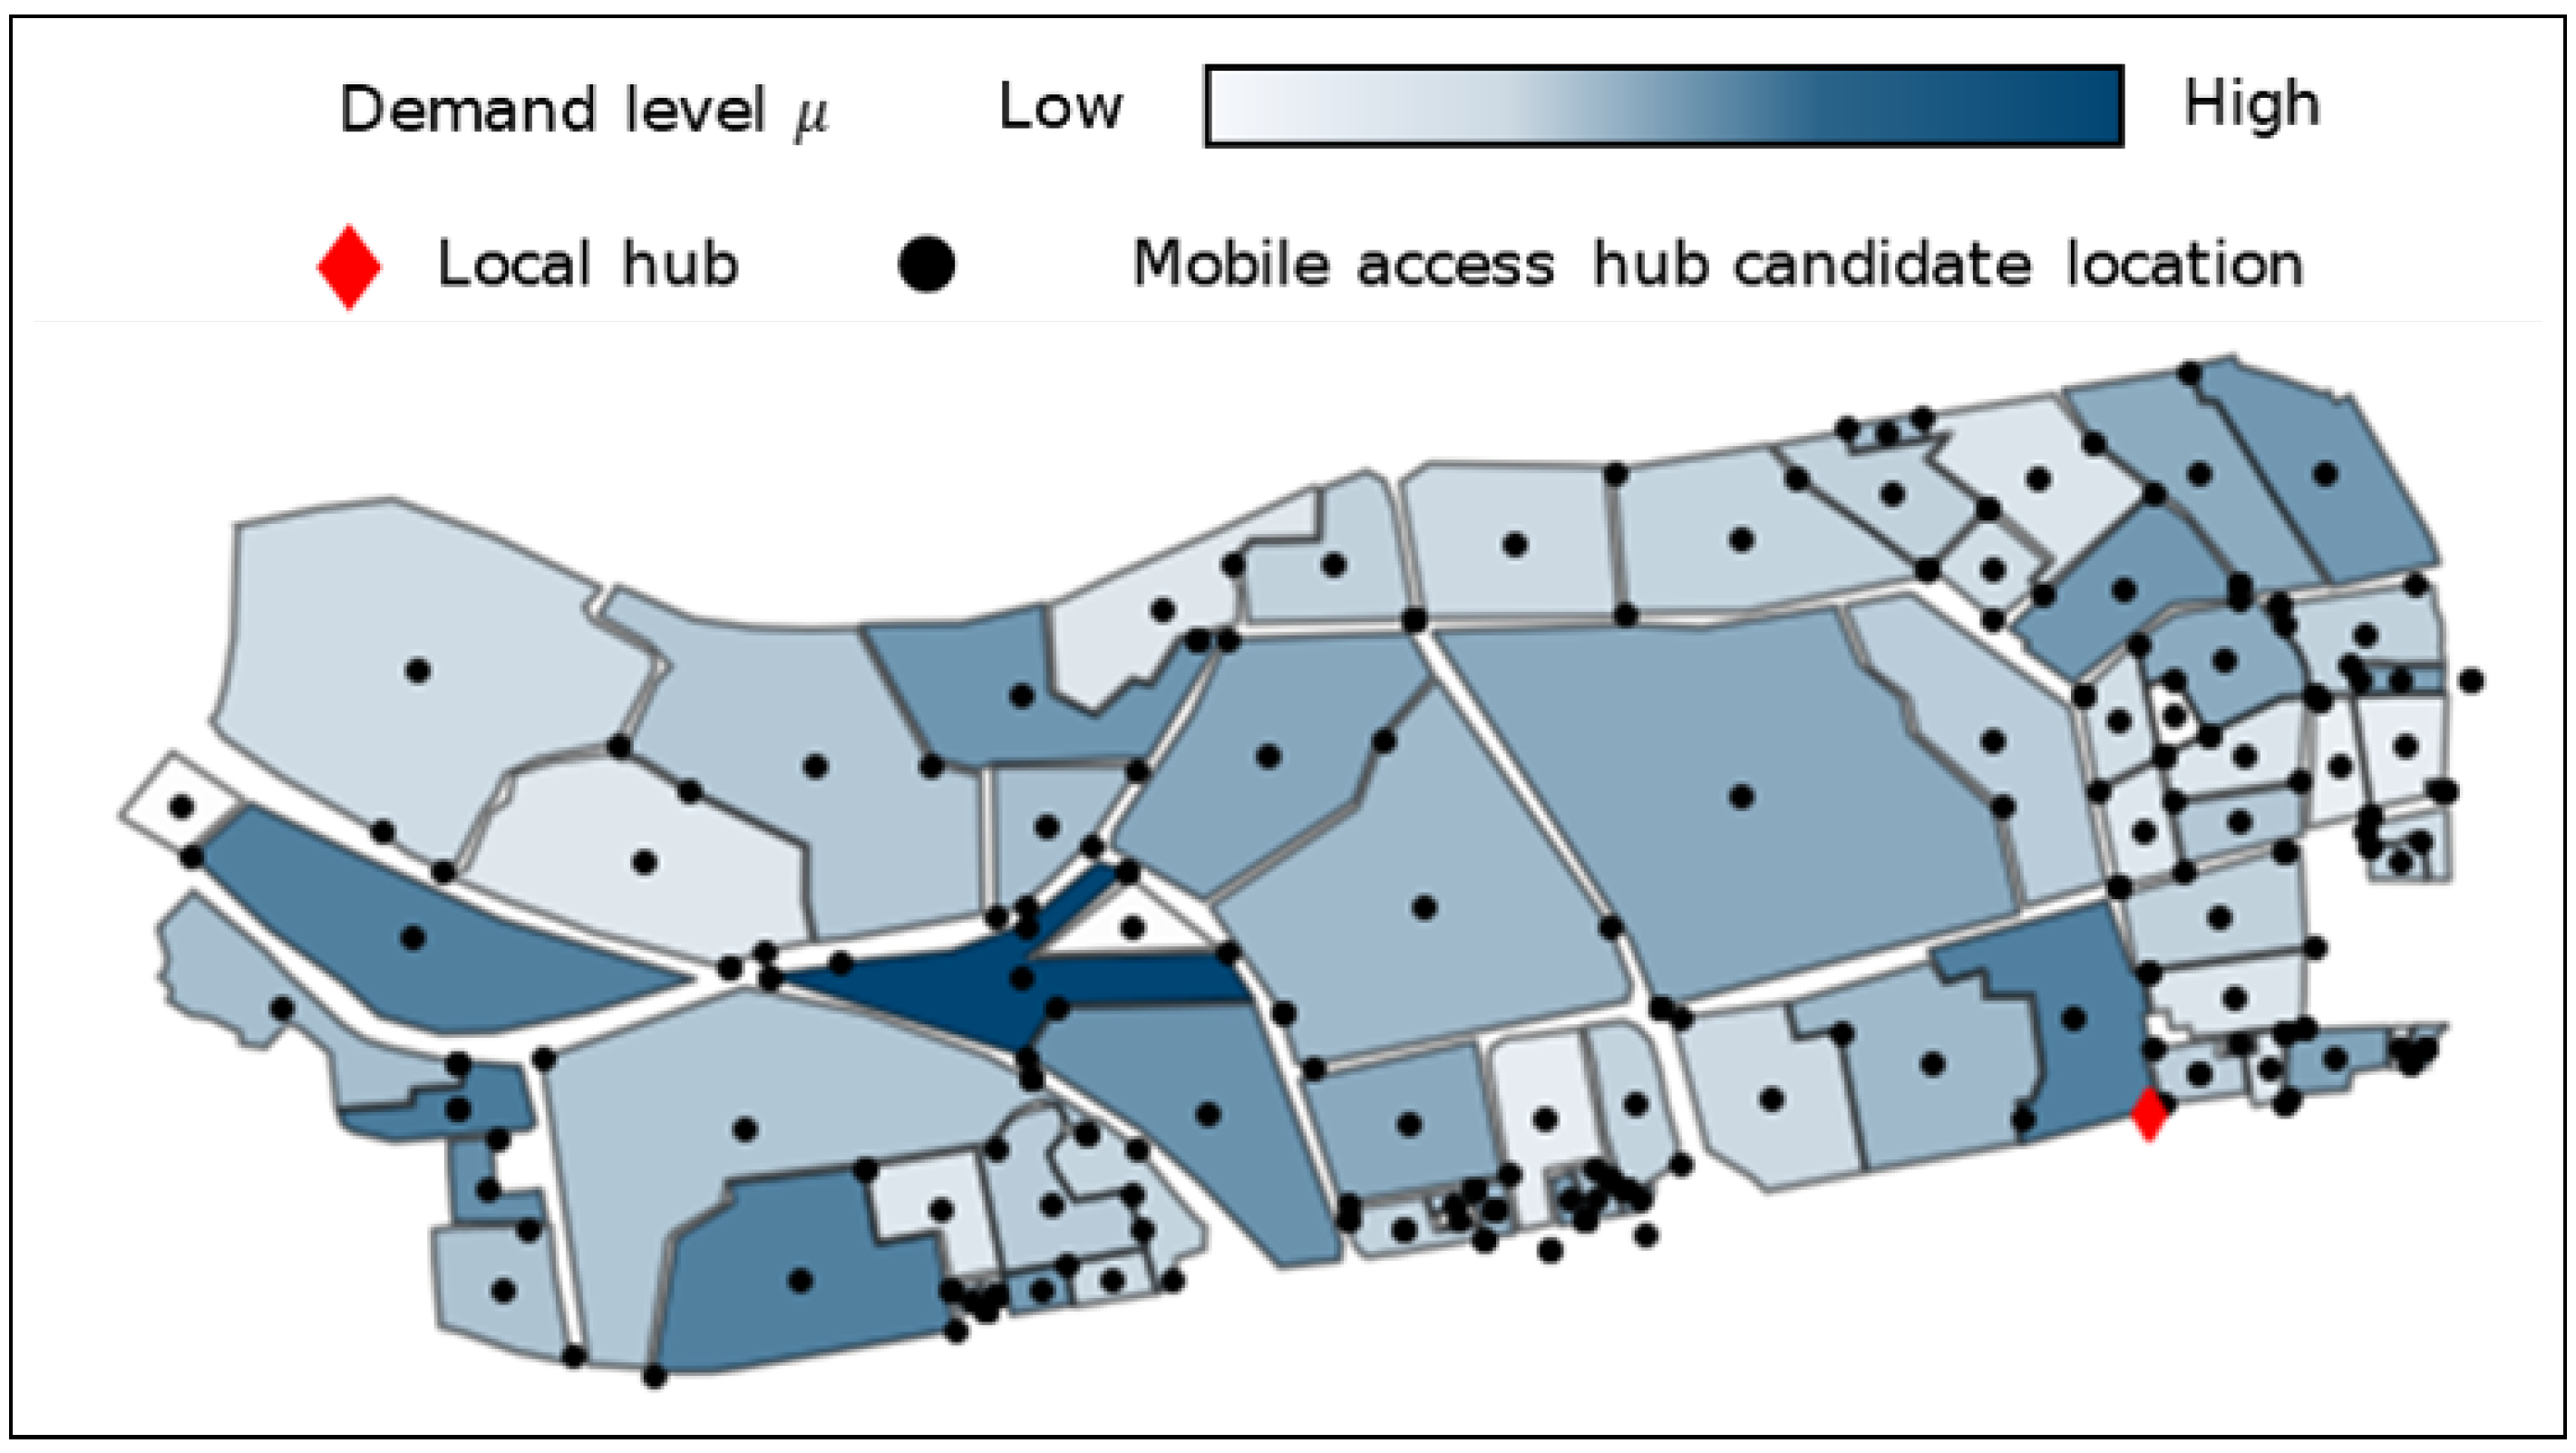
4.3. Illustrative Case
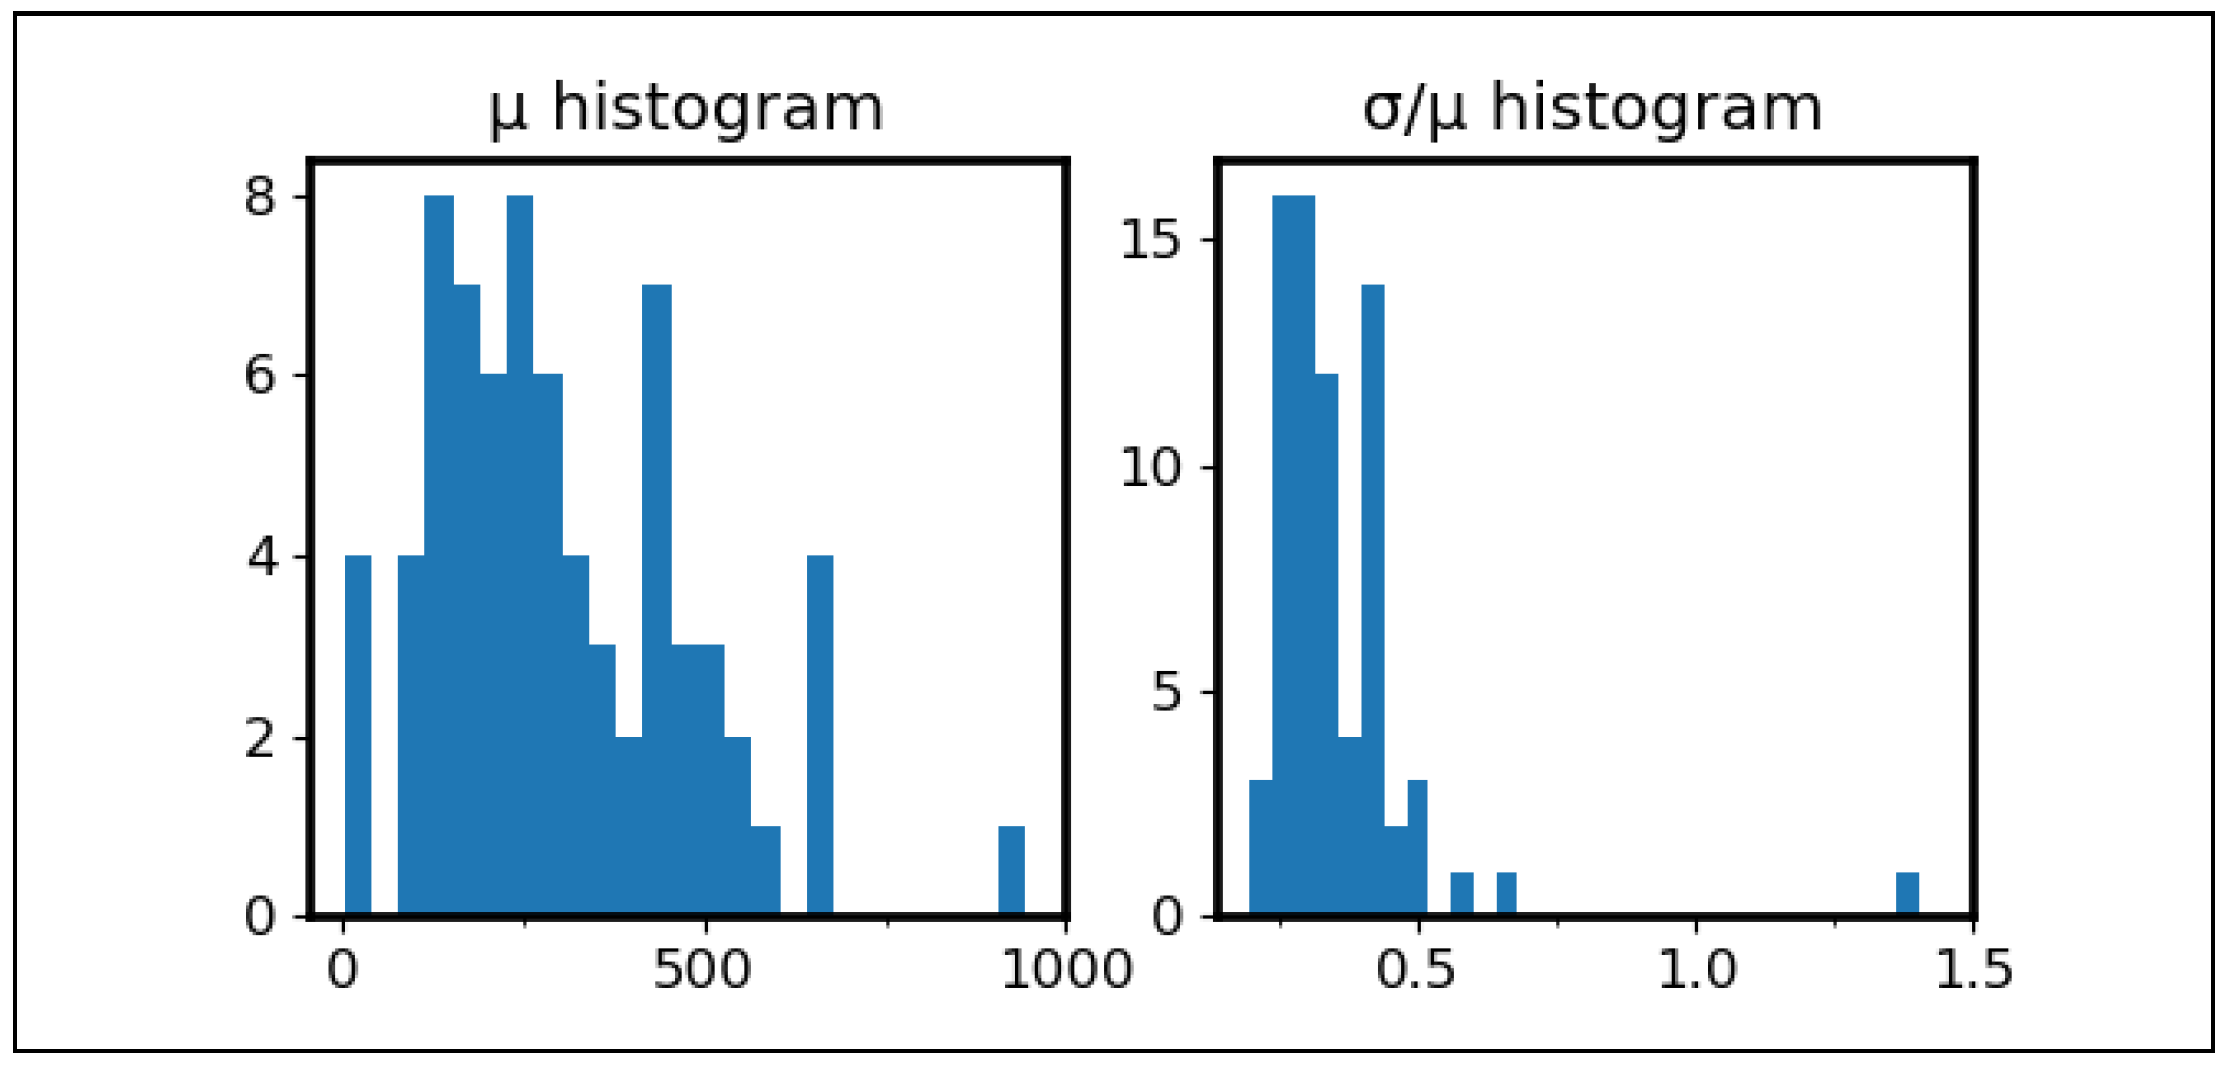
This section provides sample results for a case inspired from urban operations of a large parcel express company to assess the potential of mobile access hub deployments in the real-world context. The case is inspired from a relatively dense part of an Asian megacity with demand profiles representative of an average seasonality. Figure 10 illustrates the examined local cell’s geography and demand density along with a set of mobile access hub candidates located at the center or close to the border and the intersection of unit zones and each serving up to two neighboring unit zones. The local cell is composed of 73 unit zones covering 12 square kilometers, with heterogeneous demand . The case is geographically more compact than the synthetic grid illustrated in Figure 4, but features more diverse unit zone dimensions and demand densities. Demand averages range from 0.35 to 943.8 stop per day (each unit zone is operated daily for 10 h) with coefficients of variation () ranging from 19.7% to 140.6% (see demand histograms in Figure A1 in Appendix B.2).
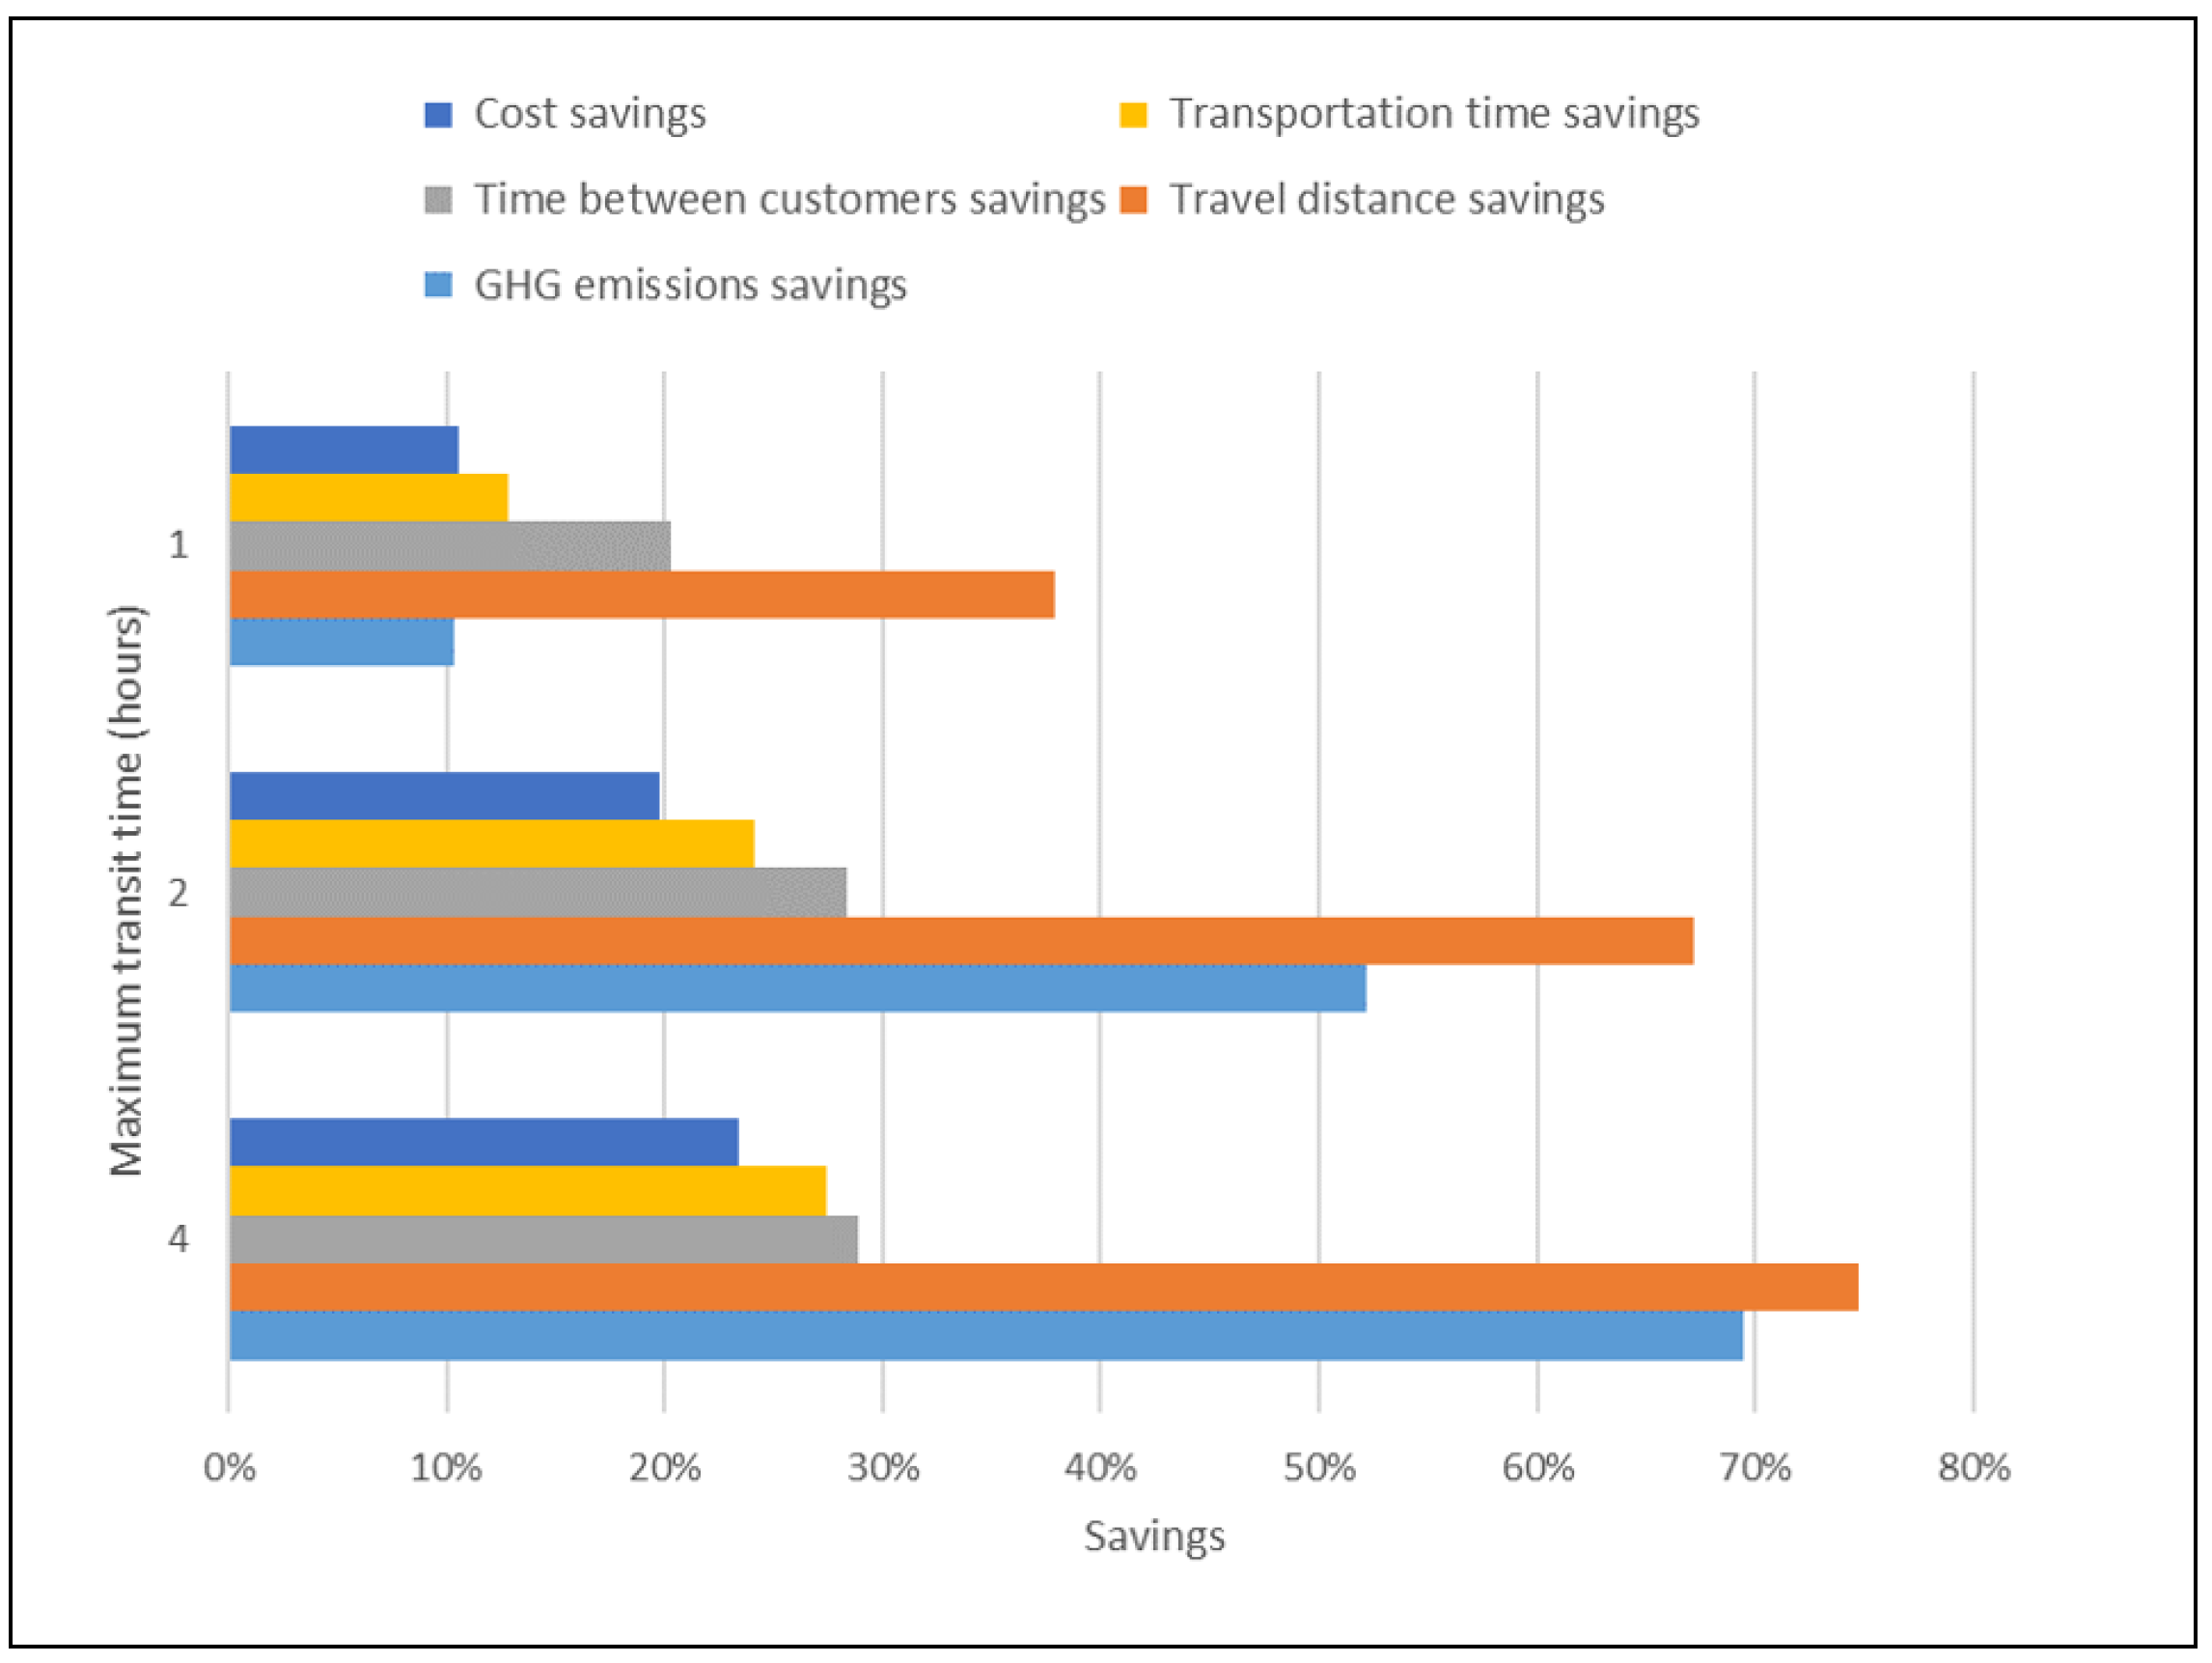
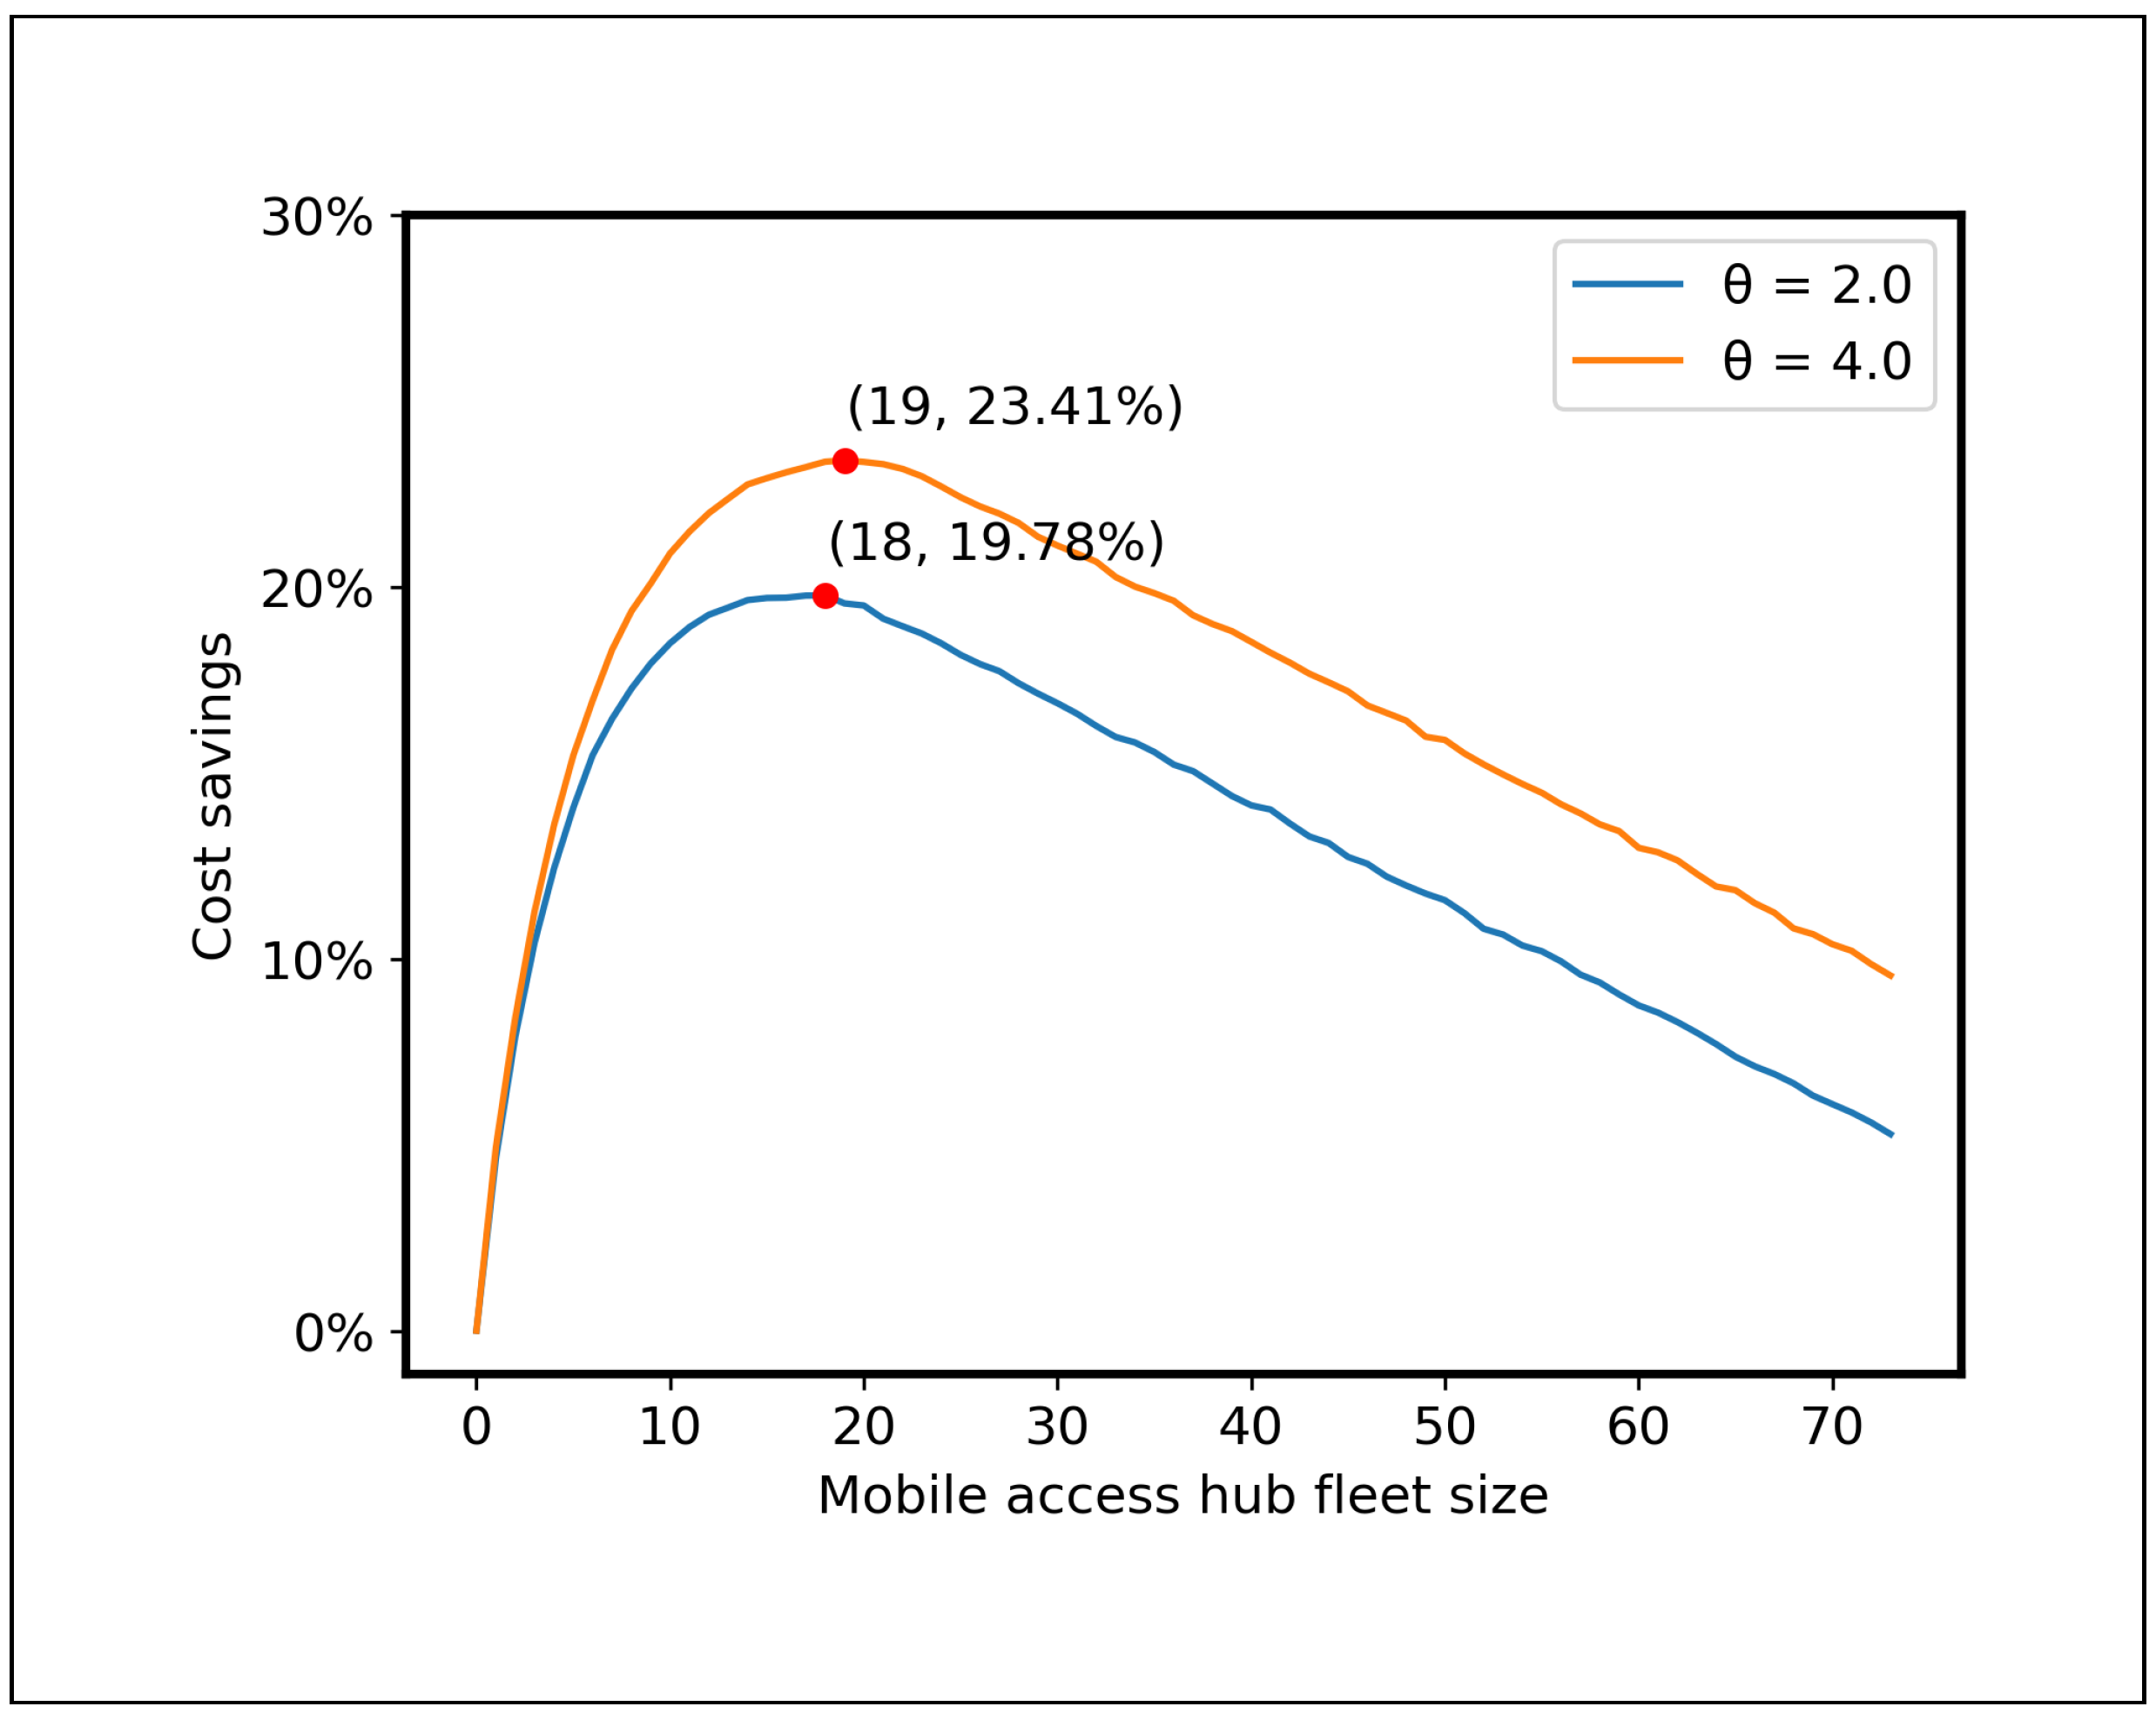
Figure 11 displays average values of key performance indicators for 1000 Monte Carlo simulation scenarios on the illustrative case for different values of the maximum transit time and for optimal fleet sizes. Complete results and sample deployments are presented respectively in Table A2 and Figure A2 in Appendix B.2. The range of values for is chosen to have realistic cases based on the fact that baseline operations without transit time constraint have a maximum transit time of 1 h. Figure A3 in Appendix B.2 displays the identification of optimal fleet sizes.
Figure 11 shows that, for a tight maximum transit time of 1 h, mobile access hub deployments can save up to 10.55% of operations cost on average bringing the total cost per parcel from $0.41 to $0.37, saving on average $865/day or about $315,000 a year operating every day (10 h a day). Total transportation time savings are evaluated to 12.81% on average, with time between customer savings of 20.28% indicating a significant gain in courier productivity (more time spent performing pickup and deliveries versus traveling from a hub to a unit zone). While travel distance savings are evaluated to 37.86% on average which may significantly reduce negative externalities, greenhouse gas emissions are only reduced by 10.31% as the maximum transit time constraint forces riders to travel between the local hub and mobile access hubs very frequently.
Relaxing the maximum transit time constraint to 2 h almost doubles average cost savings bringing the total cost per parcel down to 0.30 $, saving on average $1724/day or about $630,000 a year operating every day. It also significantly increases time and travel savings, and multiply greenhouse gas emissions savings by a factor of 5 (up to 52.15% on average). The relaxation of the maximum transit time constraint to 2 h may be reasonable to consider operationally, motivated by significant additional savings and the gain on environmental efficiency and negative externalities reduction. Such considerations highlight a trade-off between operational efficiency mostly driven by cost and time efficiency and sustainability related to environmental aspects.
Figure 11 also shows that further relaxing the maximum transit time constraint to 4 h has a lighter impact on savings over the different key performance indicators. Considering that speed is one of the important components of urban parcel logistics, further increasing the maximum transit time constraint is not likely to be an option that makes sense operationally, especially as it is not supported by significant additional savings.
5. Conclusions
This paper contributes to the development of sustainable vehicle-based alternatives in urban parcel logistics by expanding the understanding of characteristics influencing the performance of mobile access hub deployments and assessing the potential of using such a solution in last-mile logistics with an illustrative case inspired from a large parcel express carrier operations. In particular, it proposed a mathematical modeling framework to assess the economic, time efficiency, and environmental performance of mobile access hub deployments through synthetic and illustrative cases.
The analysis revealed that, under very tight maximum transit time requirements, mobile access hubs can only be profitable if they are handling large loads; however, the economic load decreases quickly as maximum transit time requirements increase. Furthermore, the profitability threshold of a mobile access hub is flexible relative to its distance from the demand zone; that is, mobile access hubs do not need to be placed in the center of the zone where pickups and deliveries are performed to be profitable and can be located anywhere within or very close to the zone. The analysis also revealed that the value of mobile access hubs is greater when demand is highly variable, and result in more diverse deployments than in the case of low variability where mobile access hubs are deployed in the same location more frequently. While the number of mobile access hubs available to deploy impacts overall profitability, each increment in fleet size brings significant additional savings, until the optimal fleet size is reached and overall performance starts decreasing due to unused mobile access hubs.
The illustrative case, inspired from operations of a large parcel express carrier, suggests respectively up to 10.55% and 19.78% cost savings under very tight and tight maximum transit time constraints for optimal fleet sizes. It also suggests potential in reducing negative externalities and environmental impact with up to respectively 37.86% and 67.19% travel distance savings and 10.31% and 52.15% greenhouse gas emission savings under very tight and tight maximum transit time constraints. The illustrative case emphasizes a trade-off between operational efficiency and environmental sustainability that can be balanced to achieve global sustainability goals while being economically sound. For instance, environmental sustainability can be greatly improved by reasonably relaxing very tight transit time constraints.
This paper suggests that mobile access hub deployments for urban parcel delivery has significant potential both economically and environmentally, with the manageable downsides of having to deal with a dynamic fleet of hubs and the addition of extra-handling due to transshipments—while, for instance, implementation may require a more agile workforce, potential productivity gain can motivate couriers to accept changes in their daily tasks.
Finally, there are numerous research avenues to further develop sustainable systems using mobile access hubs. For instance, studying flow dynamics and traffic congestion through simulation studies can help better understand the utilization of hubs relative to their capacity and the efficiency of vehicle routes at different times of the day, potentially further optimizing the dynamic use of urban space. Dynamic routing strategies can then be developed to better replenish hubs, further increasing the overall economic and environmental potential. Mobile access hubs can also be relocated throughout the day or be considered as an option to complement fixed access hub networks by temporarily enhancing network capacity in the context of dynamic pooled capacity deployments as suggested in [38].
Author Contributions
Conceptualization, L.F., C.W.III, and B.M.; Data curation, L.F.; Formal analysis, L.F.; Investigation, L.F.; Methodology, L.F.; Supervision, C.W.III and B.M.; Validation, L.F. and C.W.III; Visualization, L.F.; Writing—original draft, L.F.; Writing—review and editing, L.F., C.W.III, and B.M. All authors have read and agreed to the published version of the manuscript.
Funding
This research received no external funding.
Acknowledgments
This research was undertaken, in part, thanks to funding from the Schneider National Chair in Transportation and Logistics and the Coca-Cola Material Handling and Distribution Chair.
Conflicts of Interest
The authors declare no conflict of interest.
Appendix A. Mobile Access Hub Modeling
Appendix A.1. Transit Time Feasibility
The minimum value for the transit time constraint in the case of baseline operations, say , is equivalent to the maximum transit time with a courier performing out-and-back trips between the local hub and customers (i.e., ) and is expressed as follows:
In the case of mobile access hub operations, is the minimum value for is equivalent to the largest maximum transit time with maximum replenishment frequency (i.e., ) and couriers performing out-and-back trips from the mobile access hub to their respective unit zone(s) (i.e., , and is expressed as follows:
Appendix A.2. Transit Time Constraint
The following algorithm sets the route lengths and the rider visit frequency to satisfy the transit time constraint when feasible for z unit zones served by mobile access hub a, and to the shortest possible transit time otherwise. It prioritizes courier efficiency by iteratively decreasing the length of courier routes and computing the required rider visit frequency to meet the transit time constraint.
| Algorithm A1: Setting replenishment frequency and route length for a mobile access hub serving multiple unit zones. |
 |
Appendix B. Mobile Access Hub Deployment Experiments
Appendix B.1. Default Parameters

Table A1.
Default experiment parameters.
| Parameter | Value | Description | Parameter | Value | Description |
|---|---|---|---|---|---|
| $0.1/km | Courier variable cost in tour | 15 stops | Courier capacity | ||
| $0.15/km | Courier variable cost in stem | 33 | Maximum replenishments per day | ||
| $10/h | Courier hourly rate | 7 km/h | Courier tour speed | ||
| $0.25/km | Mobile access hub variable transportation cost | 30 km/h | Courier stem speed | ||
| $0.20/km | Rider variable cost | 35 km/h | Rider speed | ||
| $10/h | Rider hourly rate | 40 | Standard deviation of load per day | ||
| $22/day | Mobile access hub depreciation | 0.5 min | Courier handling time per parcel | ||
| g/km [27] | Courier greenhouse gas emissions | 1 min | Courier setup time | ||
| g/km [39] | Rider greenhouse gas emission | 0.5 min | Courier stopping time | ||
| $25/day | Location reservation cost | 5 min | Rider setup time per trip | ||
| k | 1.15 [40] | Route length estimation constant | 2 min | Rider stopping time | |
| 200 | Average load per day |
Appendix B.2. Illustrative Case
Figure A1 depicts the demand characteristics (mean demand and coefficient of variation) of unit zones composing the local cell in the illustrative case.
Figure A1.
Demand histograms for the illustrative case.

Table A2.
Illustrative Case Results.
| Max transit time | 4:00 | 2:00 | 1:00 |
| Fleet size | 19 | 18 | 9 |
| UZ covered by a MAH | 38 | 36 | 18 |
| Mean max transit | 2:36 | 1:19 | 0:37 |
| Max transit | 3:53 | 1:54 | 0:56 |
| Total cost | $6283.28 | $6571.65 | $7327.93 |
| Cost per parcel | $0.28 | $0.30 | $0.37 |
| Cost savings | 23.41% | 19.78% | 10.55% |
| Transportation time per parcel | 1.4 min | 1.46 min | 1.68 min |
| Transportation time savings | 27.42% | 24.08% | 12.81% |
| Time between customers | 1.37 min | 1.38 min | 1.54 min |
| Time between customers savings | 28.90% | 28.31% | 20.28% |
| Travel distance per parcel | 90 m | 120 m | 220 m |
| Travel distance savings | 74.77% | 67.19% | 37.86% |
| GHG emissions | 515.17 kg | 537.48 kg | 775.82 kg |
| GHG per parcel | 22.96 g | 24.54 g | 39.17 g |
| GHG emissions savings | 69.49% | 52.15% | 10.31% |
Figure A2 illustrates samples mobile access hub deployments on the illustrative case instance by displaying the locations of mobile access hubs and their assignments to unit zones when they cover more than one unit zone.
Figure A2.
Sample mobile access hub deployments for the illustrative case.

Figure A3 displays the plot of cost savings against mobile access hub fleet size for different transit time constraint values for the illustrative case.
Figure A3.
Fleet size analysis for the illustrative case.

References
- Goodman, R.W. Whatever you call it, just don’t think of last-mile logistics, last. Glob. Logist. Supply Chain. Strateg. 2005, 9, 46–51. [Google Scholar]
- European Commission. Roadmap to a Single European Transport Area-Towards a competitive and resource efficient transport system. White Pap. Commun. 2011, 144, 1–32. [Google Scholar]
- United Nations. 2018 Revision of World Urbanization Prospects; United Nations: New York, NY, USA, 2018. [Google Scholar]
- eMarketer. Annual Retail e-Commerce Sales Growth Worldwide from 2014 to 2023; eMarketer: New York, NY, USA, 2019. [Google Scholar]
- Savelsbergh, M.; Van Woensel, T. 50th anniversary invited article—City logistics: Challenges and opportunities. Transp. Sci. 2016, 50, 579–590. [Google Scholar] [CrossRef]
- Holguín-Veras, J.; Leal, J.A.; Sanchez-Diaz, I.; Browne, M.; Wojtowicz, J. State of the art and practice of urban freight management Part II: Financial approaches, logistics, and demand management. Transp. Res. Part Policy Pract. 2020, 137, 383–410. [Google Scholar] [CrossRef]
- Wade, M.; Bjerkan, H. Three Proactive Response strategies to COVID 19 business Challenges. MIT Sloan Manag. Rev. 2020; in print. [Google Scholar]
- Holguín-Veras, J.; Leal, J.A.; Sánchez-Diaz, I.; Browne, M.; Wojtowicz, J. State of the art and practice of urban freight management: Part I: Infrastructure, vehicle-related, and traffic operations. Transp. Res. Part Policy Pract. 2020, 137, 360–382. [Google Scholar] [CrossRef]
- Ranieri, L.; Digiesi, S.; Silvestri, B.; Roccotelli, M. A Review of Last Mile Logistics Innovations in an Externalities Cost Reduction Vision. Sustainability 2018, 10, 782. [Google Scholar] [CrossRef] [Green Version]
- de Oliveira, C.M.; Albergaria De Mello Bandeira, R.; Vasconcelos Goes, G.; Schmitz Gonçalves, D.N.; D’Agosto, M.D.A. Sustainable vehicles-based alternatives in last mile distribution of urban freight transport: A systematic literature review. Sustainability 2017, 9, 1324. [Google Scholar] [CrossRef] [Green Version]
- Verlinde, S.; Macharis, C.; Milan, L.; Kin, B. Does a mobile depot make urban deliveries faster, more sustainable and more economically viable: Results of a pilot test in Brussels. Transp. Res. Procedia 2014, 4, 361–373. [Google Scholar] [CrossRef] [Green Version]
- Montreuil, B.; Buckley, S.; Faugère, L.; Khir, R.; Derhami, S. Parcel Logistics Hub Design: The Impact of Modularity and Hyperconnectivity. Prog. Mater. Handl. Res. 2018, 19, 1–9. [Google Scholar]
- TNT Express. TNT Express is Using a Mobile Depot in Brussels to Enable More Efficient Delivery. 2013. Available online: http://www.tnt.de/__C1257442002D0760.nsf/html/pressemitteilungen_tntexpresseroeffnetmobilesdepotinbruessel.html (accessed on 10 July 2020).
- UPS. Letzte Meile: Studie zu Micro-Hubs. 2018. Available online: https://logistik-heute.de/news/letzte-meile-studie-zu-micro-hubs-14471.html (accessed on 10 July 2020).
- Hu, W.; Dong, J.; Hwang, B.g.; Ren, R.; Chen, Z. A Scientometrics Review on City Logistics Literature: Research Trends, Advanced Theory and Practice. Sustainability 2019, 11, 2724. [Google Scholar] [CrossRef] [Green Version]
- Quak, H.J.H.; de Koster, M.R.B.M. Delivering Goods in Urban Areas: How to Deal with Urban Policy Restrictions and the Environment. Transp. Sci. 2009, 43, 211–227. [Google Scholar] [CrossRef]
- Navarro, C.; Roca-Riu, M.; Furió, S.; Estrada, M. Designing new models for energy efficiency in urban freight transport for smart cities and its application to the Spanish case. Transp. Res. Procedia 2016, 12, 314–324. [Google Scholar] [CrossRef] [Green Version]
- Visser, J.; Nemoto, T.; Browne, M. Home delivery and the impacts on urban freight transport: A review. Procedia-Soc. Behav. Sci. 2014, 125, 15–27. [Google Scholar] [CrossRef] [Green Version]
- Crainic, T.; Ricciardi, N.; Storchi, G. Advanced freight transportation systems for congested urban areas. Transp. Res. Part Emerg. Technol. 2004, 12, 119–137. [Google Scholar] [CrossRef]
- Benjelloun, A.; Crainic, T. Trends, challenges, and perspectives in city logistics. Transp. Land Use Interact. Proc. TRANSLU 2008, 8, 269–284. [Google Scholar]
- Mancini, S. Multi-echelon distribution systems in city logistics. Eur. Transp. 2013, 54, 1–24. [Google Scholar]
- Guastaroba, G.; Speranza, M.; Vigo, D. Intermediate facilities in freight transportation planning: A survey. Transp. Sci. 2016, 50, 763–789. [Google Scholar] [CrossRef] [Green Version]
- Janjevic, M.; Winkenbach, M.; Merchán, D. Integrating collection-and-delivery points in the strategic design of urban last-mile e-commerce distribution networks. Transp. Res. Part Logist. Transp. Rev. 2019, 131, 37–67. [Google Scholar] [CrossRef]
- Raicu, S.; Costescu, D.; Burciu, S. Distribution System with Flow Consolidation at the Boundary of Urban Congested Areas. Sustainability 2020, 12, 990. [Google Scholar] [CrossRef] [Green Version]
- Janjevic, M.; Ndiaye, A.B. Development and Application of a Transferability Framework for Micro-consolidation Schemes in Urban Freight Transport. Procedia-Soc. Behav. Sci. 2014, 125, 284–296. [Google Scholar] [CrossRef] [Green Version]
- Leonardi, J.; Browne, M.; Allen, J. Before-after assessment of a logistics trial with clean urban freight vehicles: A case study in London. Procedia-Soc. Behav. Sci. 2012, 39, 146–157. [Google Scholar] [CrossRef] [Green Version]
- Marujo, L.; Goes, G.; D’Agosto, M.; Ferreira, A.; Winkenbach, M.; Bandeira, R. Assessing the sustainability of mobile depots: The case of urban freight distribution in Rio de Janeiro. Transp. Res. Part Transp. Environ. 2018, 62, 256–267. [Google Scholar] [CrossRef]
- Stodick, K.; Deckert, C. Sustainable Parcel Delivery in Urban Areas with Micro De-pots. Mobil. Glob. World 2018 2019, 22, 233. [Google Scholar]
- Assmann, T.; Lang, S.; Müller, F.; Schenk, M. Impact Assessment Model for the Implementation of Cargo Bike Transshipment Points in Urban Districts. Sustainability 2020, 12, 4082. [Google Scholar] [CrossRef]
- Browne, M.; Allen, J.; Leonardi, J. Evaluating the use of an urban consolidation centre and electric vehicles in central London. IATSS Res. 2011, 35, 1–6. [Google Scholar] [CrossRef] [Green Version]
- Arvidsson, N.; Pazirandeh, A. An ex ante evaluation of mobile depots in cities: A sustainability perspective. Int. J. Sustain. Transp. 2017, 11, 623–632. [Google Scholar] [CrossRef]
- Oliveira, B.; Ramos, A.G.; de Sousa, J.P. A classification of two-tier distribution systems based on mobile depots. Transp. Res. Procedia 2020, 47, 115–122. [Google Scholar] [CrossRef]
- Browne, M.; Allen, J.; Nemoto, T.; Patier, D.; Visser, J. Reducing social and environmental impacts of urban freight transport: A review of some major cities. Procedia-Soc. Behav. Sci. 2012, 39, 19–33. [Google Scholar] [CrossRef]
- Daganzo, C.F.; Gayah, V.V.; Gonzales, E.J. The potential of parsimonious models for understanding large scale transportation systems and answering big picture questions. EURO J. Transp. Logist. 2012, 1, 47–65. [Google Scholar] [CrossRef] [Green Version]
- Ansari, S.; Başdere, M.; Li, X.; Ouyang, Y.; Smilowitz, K. Advancements in continuous approximation models for logistics and transportation systems: 1996–2016. Transp. Res. Part Methodol. 2018, 107, 229–252. [Google Scholar] [CrossRef]
- Daganzo, C.F. The length of tours in zones of different shapes. Transp. Res. Part Methodol. 1984, 18, 135–145. [Google Scholar] [CrossRef]
- Daganzo, C.F. Logistics Systems Analysis; Springer Science & Business Media: Berlin/Heidelberg, Germany, 2005. [Google Scholar]
- Faugère, L.; Klibi, W.; White, C., III; Montreuil, B. Dynamic Pooled Capacity Deployment for Urban Parcel Logistics. arXiv 2020, arXiv:2007.11270. [Google Scholar]
- United States Environment Protection Agency (EPA). The 2019 EPA Automotive Trends Report: Greenhouse Gas Emissions, Fuel Economy, and Technology Since 1975; EPA: Washington, DC, USA, 2020.
- Winkenbach, M.; Kleindorfer, P.R.; Spinler, S. Enabling Urban Logistics Services at La Poste through Multi-Echelon Location-Routing. Transp. Sci. 2016, 50, 520–540. [Google Scholar] [CrossRef]
Figure 1.
Examples of Mobile Access Hubs ((Left) TNT Pilot in Brussels, Belgium [13]; (Right) UPS Pilot in Berlin, Germany [14]).

Figure 2.
Illustration of a mobile access hub serving a unit zone.

Figure 3.
Economic load assessment for a mobile access hub serving one unit zone for different maximum transit time constraints.
Figure 3.
Economic load assessment for a mobile access hub serving one unit zone for different maximum transit time constraints.

Figure 4.
Synthetic local cell grid and mobile access hub candidate locations.

Figure 5.
Mobile access hub deployments with (a) and (b) .

Figure 6.
Savings as a function of coefficient of variation .

Figure 7.
Savings as a function of maximum transit time .

Figure 8.
Savings as a function of fleet size for different demand levels.

Figure 9.
Savings as a function of fleet size for different demand variability.

Figure 10.
Illustrative case.

Figure 11.
Illustrative case savings for different maximum transit times.

Table 1.
Sustainability performance indicators.
| Assessment | Performance Indicator |
|---|---|
| Economic | Total cost |
| Cost per parcel | |
| Time efficiency | Transportation time per parcel |
| Average time between customers | |
| Environmental | Greenhouse gas emissions |
| Travel distance per parcel |
© 2020 by the authors. Licensee MDPI, Basel, Switzerland. This article is an open access article distributed under the terms and conditions of the Creative Commons Attribution (CC BY) license (http://creativecommons.org/licenses/by/4.0/).
Share and Cite
MDPI and ACS Style
Faugère, L.; White, C., III; Montreuil, B. Mobile Access Hub Deployment for Urban Parcel Logistics. Sustainability 2020, 12, 7213. https://0-doi-org.brum.beds.ac.uk/10.3390/su12177213
AMA Style
Faugère L, White C III, Montreuil B. Mobile Access Hub Deployment for Urban Parcel Logistics. Sustainability. 2020; 12(17):7213. https://0-doi-org.brum.beds.ac.uk/10.3390/su12177213
Chicago/Turabian StyleFaugère, Louis, Chelsea White, III, and Benoit Montreuil. 2020. "Mobile Access Hub Deployment for Urban Parcel Logistics" Sustainability 12, no. 17: 7213. https://0-doi-org.brum.beds.ac.uk/10.3390/su12177213
Note that from the first issue of 2016, this journal uses article numbers instead of page numbers. See further details here.