Analysis of Transportation Network Vulnerability and Resilience within an Urban Agglomeration: Case Study of the Greater Bay Area, China


Institute of Transportation Engineering, Tsinghua University, Beijing 100084, China
*
Author to whom correspondence should be addressed.
Sustainability 2020, 12(18), 7410; https://0-doi-org.brum.beds.ac.uk/10.3390/su12187410
Submission received: 17 August 2020
/
Revised: 7 September 2020
/
Accepted: 8 September 2020
/
Published: 9 September 2020
(This article belongs to the Section Sustainable Transportation)
Abstract
:Recently, urban agglomerations have become the main platform of China’s economic development. As one of those, the Guangdong-Hong Kong-Macao Greater Bay Area (GBA) has an important strategic position in national blueprints. Its amazing achievement is inseparable from reliable and resilient transportation networks. With the aim of improving the sustainability of the GBA, this paper presents a novel view of vulnerability and resilience of integrated transportation networks within an urban agglomeration. According to complex network theory, the integrated transportation network model of the GBA was established. Various scenarios were considered to improve the overall level of defensive ability, including random failures, targeted attacks and natural hazards. Vulnerability and resilience assessment models were developed to investigate the influences on the whole network. Finally, a simulation analysis was conducted on the GBA to examine the variations in network performance when faced with different attack scenarios. The results indicate that the transportation network of the GBA is more vulnerable and has less resilience to targeted attacks, while natural hazards had little influence on the performance, to a certain extent. Moreover, the betweenness recovery strategy seemed to be the best choice for every attack scenario.
1. Introduction
Since urban agglomeration appeared in a top-level policy blueprint of China in 2006, it has shown a favorable trend. Since then, this ambitious plan has facilitated 19 urban agglomerations, leading China into a new stage of economic development. As one of those, the Greater Bay Area (GBA) is not only the heart of China’s growth dynamic, but also a core of global cooperation. The GBA consists of the nine municipalities of Guangzhou, Shenzhen, Zhuhai, Foshan, Huizhou, Dongguan, Zhongshan, Jiangmen and Zhaoqing in Guangdong Province, as well as two special administrative regions including Hong Kong and Macao, covering a total area of 56000 square kilometers. At the end of 2019, the total population reached over 72 million, the GDP was USD 1679.5 billion and GDP per capita was USD 23371 [1].
A reliable transportation system is a necessary condition and driving force to support high-quality and sustainable development, especially for the GBA. However, transportation networks face a constant barrage of external stresses or threats that challenge their operation. They must deal with the frequent occurrence of random breakdowns and unexpected events such as terrorist attacks. Therefore, several attempts have been made to study the vulnerability and resilience of transportation networks [2,3].
The concept of vulnerability was proposed by the geographer Timmerman in 1981 [4], and has been widely extended to ecology, economics and other fields [5,6,7]. A lot of scholars believe that vulnerability of transportation is closely related to the sensitivity to disturbance [8,9]. Much of the current literature on transportation vulnerability pays particular attention to random failures and deliberate attacks [10,11,12,13,14]. However, there has been a lack of quantitative analysis of transportation vulnerability under natural disasters, leading to a large scale failure of infrastructure [15,16].
As for resilience, it was defined by Holling, an ecologist, to characterize the ability of a system to absorb various changes [17]. Bruneau et al. created the “4R” framework (robustness, redundancy, resourcefulness and rapidity) to represent resilience [18]. Similarly, Ouyang et al. proposed a three-stage framework to analyze the resilience of infrastructure, and different evaluation indicators were used in the stages [19]. Although these frameworks are simple and clear, they cannot provide targeted judgment and improvement measures. With the progress of complex network theory [20,21], the network-based modeling method is gradually rising in the field of transportation resilience, which shows more details related to time and enhances the understanding of resilience under a variety of attacks [22,23].
In general, these two concepts are used to describe the changes in a disturbed system. Vulnerability analyses focus on the sensitivity of a system to interference and the propagation of the impact in the network, while the resilience analyses are focused on the ability to maintain or restore balance [24,25]. Meanwhile, the majority of studies applied complex network theory to assess these two characteristics of various transportation systems at the topological level [26,27,28,29].
Although quite a number of studies have been carried out on the vulnerability and resilience of a single mode of transportation (road [30,31], railway [11,16,22] and air [32,33]), there have been limited empirical investigations into integrated transportation systems. As one of the few studies, Chen and Miller-Hooks quantified the resilience of an intermodal freight transport network [34]. In fact, people usually travel by more than one mode of transportation, particularly within urban agglomerations. Different from cities, urban agglomerations encounter difficulties of multi-level traffic demand, containing various modes and spanning multiple cities [35]. Hence, there is a need to evaluate the vulnerability and resilience of integrated transportation systems within an urban agglomeration to guarantee security and achieve sustainability.
To sum up, there is a lack of in-depth studies on vulnerability and resilience of integrated transportation systems. Furthermore, natural hazards are mostly regarded as a part of random failure or simply ignored in the existing research; however, regional characteristics will be overlooked in this case. Thus, the main aim of this study is to measure vulnerability and resilience of an integrated transportation network within an urban agglomeration. To address the gaps mentioned above, several scenarios including random failures, targeted attacks and natural hazards are considered and simulated in the integrated transportation network. This study provides new insights into emergency management and sustainable development of urban agglomerations.
2. Materials and Methods
2.1. Network Construction
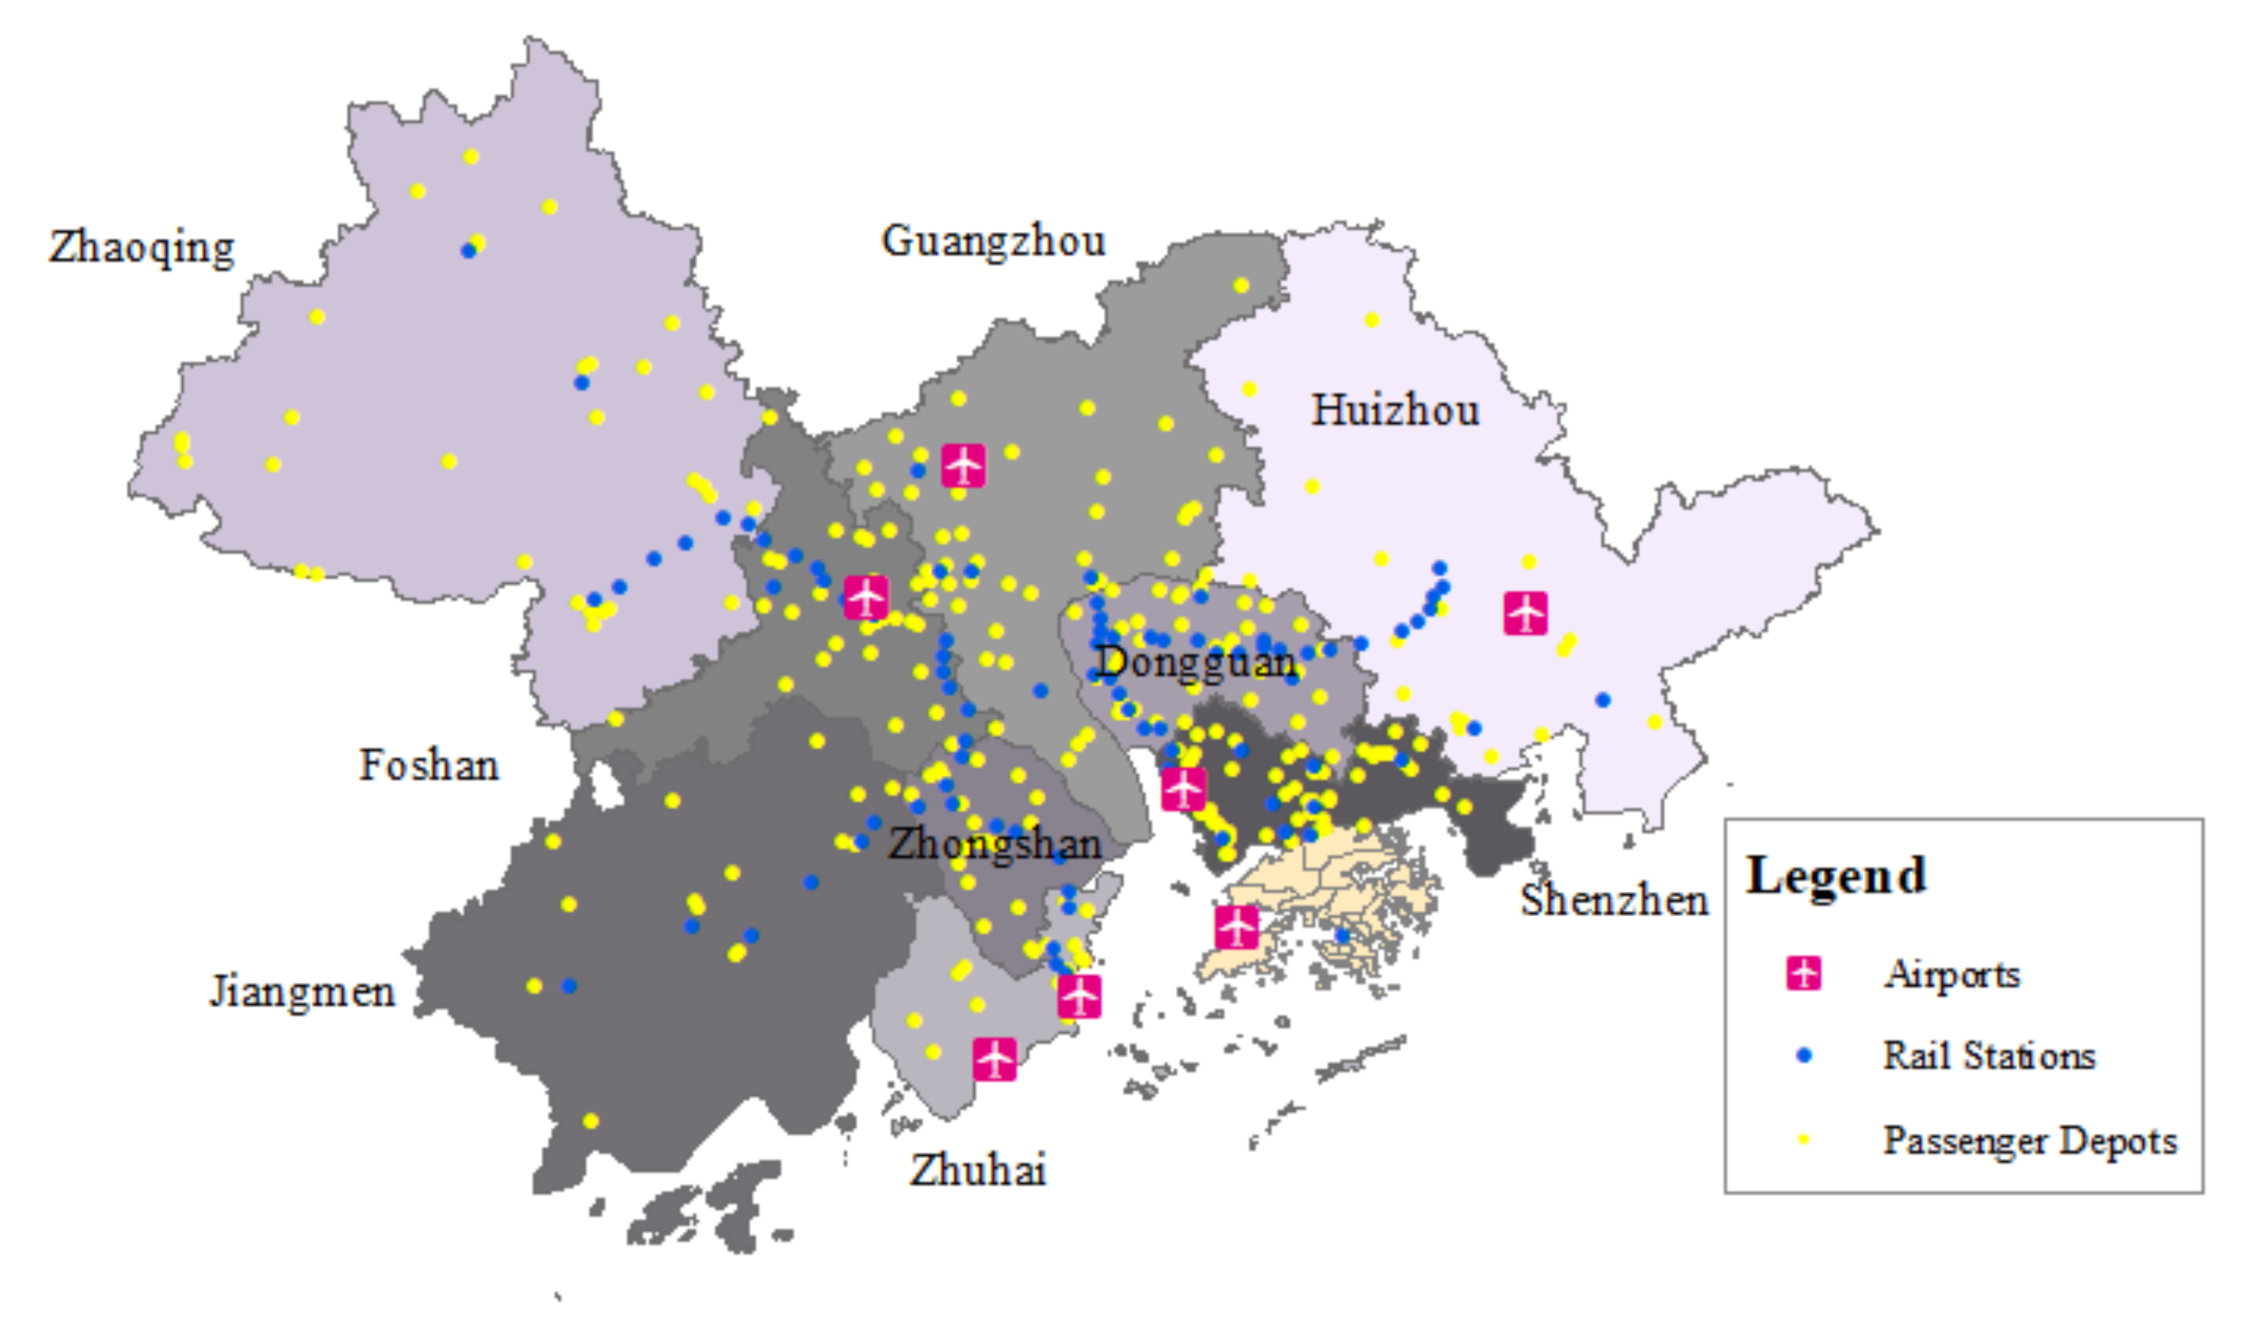
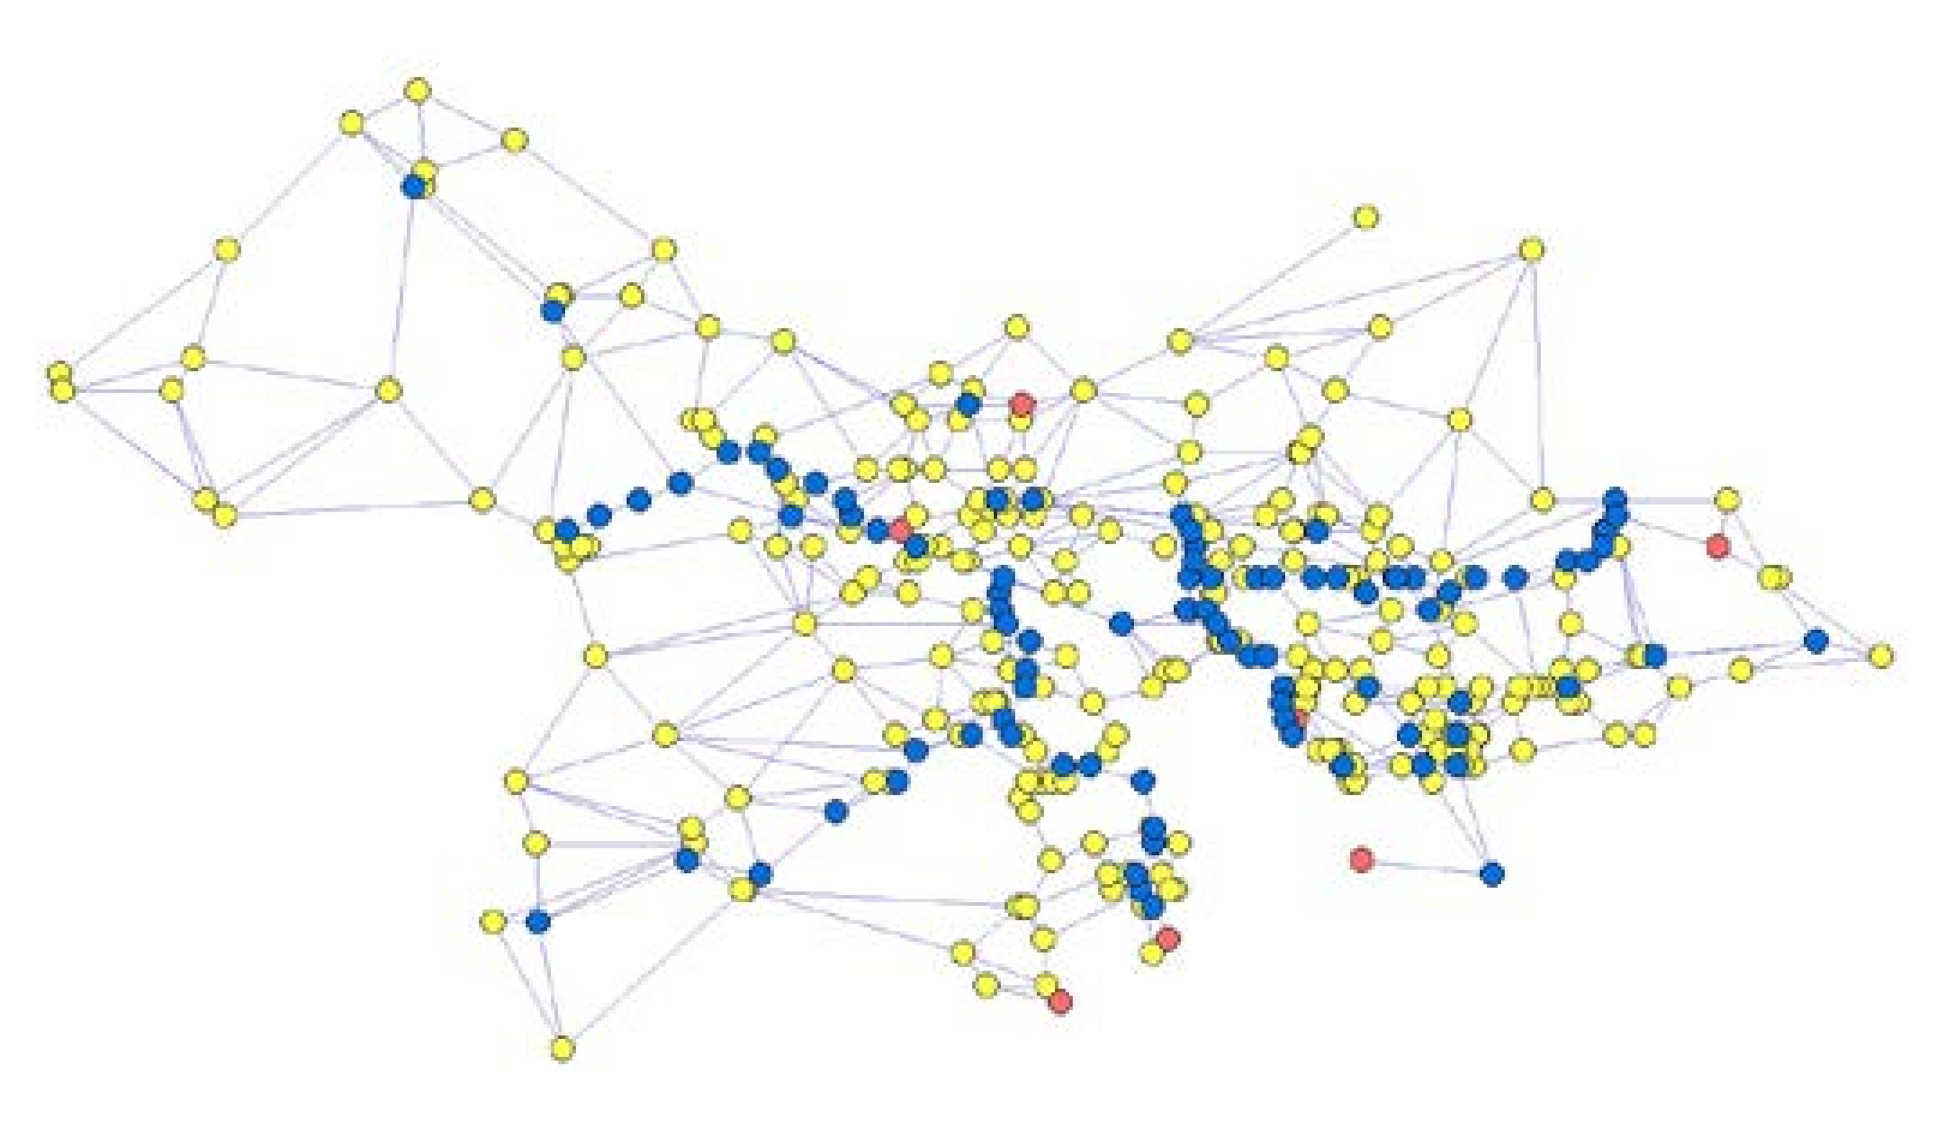
The map in Figure 1 shows the distribution of transportation facilities (7 airports, 89 rail stations and 252 passenger depots) in the GBA. In this study, AutoNavi, a widely used map service provider in China, is selected to provide information. Under the complex network theory, the topology structure of each urban agglomeration is extracted by an undirected graph G(N, E) including a node set N and a link set E ⊆ N × N, as shown in Figure 2. The network construction rules are as follows:
- Each passenger depot, railway station and airport in the urban agglomeration is treated as a node. If they are so close that their distance (<500 m) can be ignored, they are regarded as one node in the comprehensive transportation network.
- The link is formed if there are transport services between nodes. Specifically, there are direct flights between airports, direct railway lines between railway stations and highways between passenger depots and others.
- The network model of urban agglomeration is an undirected network.
2.2. General Properties
As for the network, the topological properties can be reflected by the network centrality. Several widely applied indicators are adopted to give an insight into the GBA, including the number of nodes and links, the average degree (the average number of links connected with the node) and the average betweenness (the average number of shortest paths that pass through the node). Table 1 presents more details about the indicators. The average degree of the GBA shows that each node has connections with four adjacent transportation stations. As for the relative low density, it indicates that nodes are relatively sparsely connected.
2.3. Scenario Generation
2.3.1. Attack Scenarios
The transportation network simulation usually encounters two types of attacks: random attack (RA) and targeted attack (TA) [36,37]. The former represents the widespread disruption of service caused by technical operations, passenger behaviors, etc. The latter considers deliberate destruction such as terrorist attacks. In this situation, destroying nodes based on a descending sequence of degree or betweenness is often applied [38]. Moreover, another failure mode, natural hazard, which has obvious regional characteristics, always lacks attention.
In this paper, vulnerability and resilience through four scenarios will be explored: random attack (RA), degree attack (DA), betweenness attack (BA) and natural hazard (NH). Random attack may cause the failure of several nodes with a random probability, so it is simulated by 200 random sequence attacks, and the average value is taken. As for targeted attacks, terrorists have a strong desire to launch attacks in big cities, which will undoubtedly damage the stable development, international image and investment environment. In addition, it is difficult to arrest terrorists in regions with convenient transportation and dense populations; hence, two scenarios for targeted attack based on a sequence of degree and betweenness were considered. There is little doubt about the two indicators according to the previous studies [37,38]. The simulation is conducted by deleting nodes from the GBA network according to the degree and betweenness.
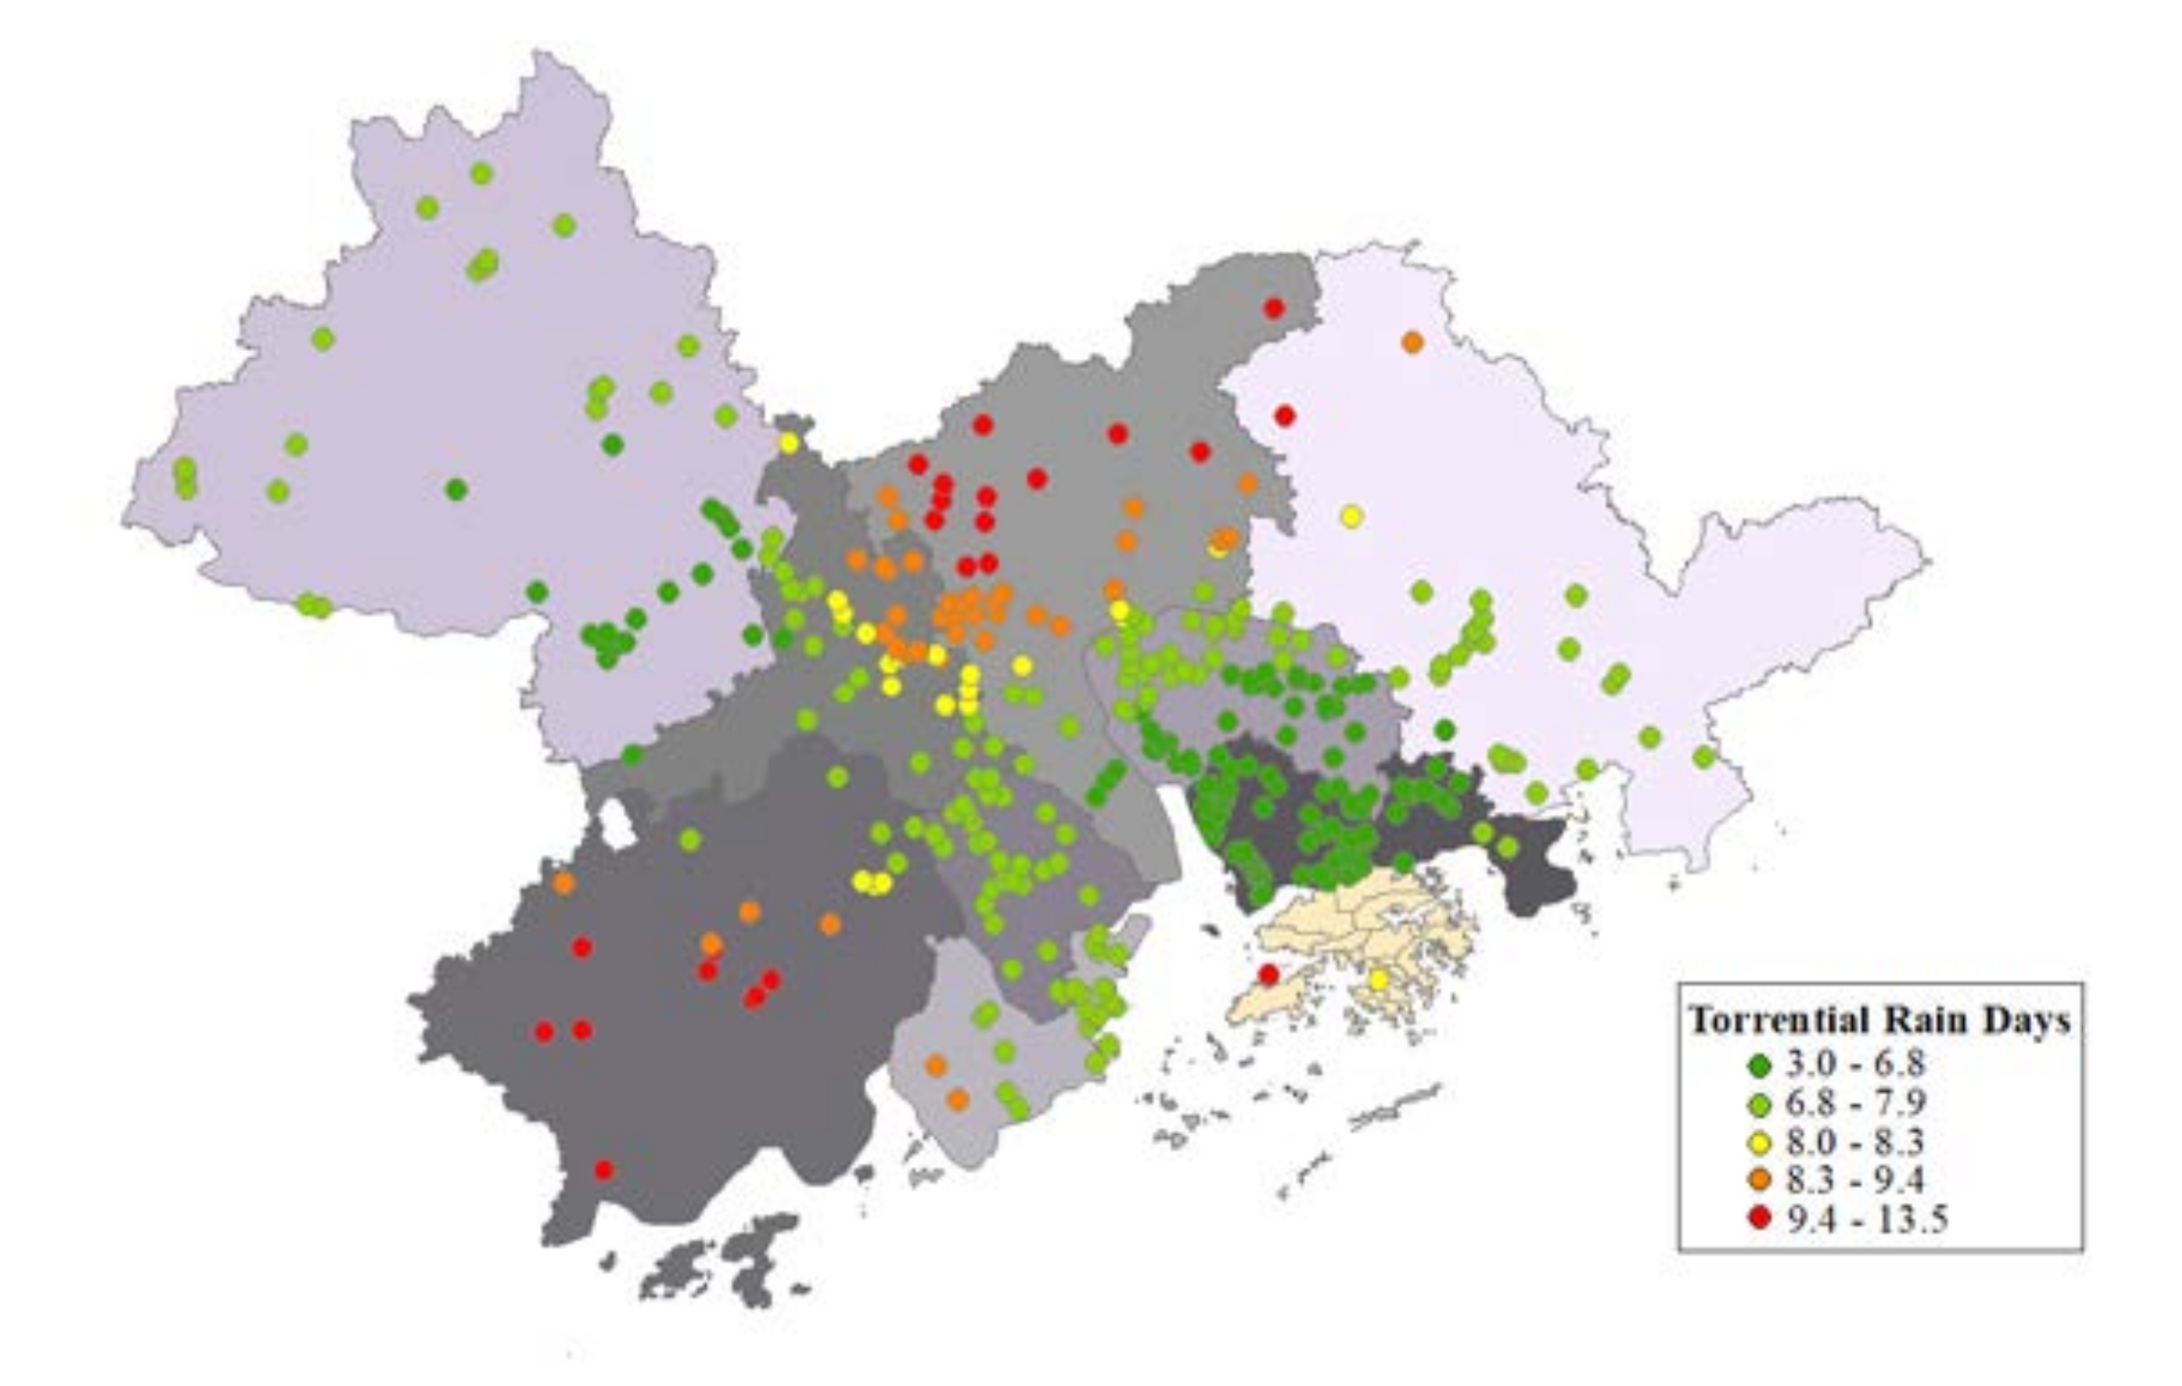
An analysis of the impact of natural hazards entails the representation of the associated patterns. According to United Nations International Strategy for Disaster Reduction (UNISDR), floods were the most frequent type of disaster, which make up a relatively significant share (43%) of all recorded disaster events from 1998–2017 [39]. Therefore, floods are the main focus in this paper. A natural hazard scenario was generated using 24-h precipitation in 2019 of 17 meteorological observation stations in Guangdong Province, Hong Kong and Macao, obtained from the China Meteorological Data Service Center. The China Meteorological Administration defines “torrential rain” as rain that accumulates 50 mm or more in 24 h. Torrential rain days in 2019 of each node were calculated by the inverse distance interpolation method in ArcGIS to represent the susceptibility of natural disasters, as shown in Figure 3. The simulation was conducted by deleting nodes from the GBA network according to the sequence of torrential rain days. In addition, floods can be triggered by different natural and anthropogenic phenomena. Limited by the data, this article adopts a simple model to generate natural hazard scenarios, which could be improved if detailed geographical information is available.
2.3.2. Recovery Scenarios
As time goes on, external interference gradually disappears, and different recovery strategies are used to improve the performance of the network. The important nodes are usually chosen to recover first due to their key roles in the national economy and security, and government may also adopt the principle of which is attacked first and which recovers first. At the same time, it is possible that the recovery sequence is arranged in a random order because of different restoration capability. In this paper, three recovery scenarios are simulated for degree attack and betweenness attack, i.e., recovering nodes randomly (RR) or in a descending sequence of degree (DR) or betweenness (BR). In addition, a sequential recovery mode (SR) is added for random attack and natural hazard; that is, the nodes which fail first recover first.
2.4. Vulnerability Assessment
Two common indicators are selected to assess vulnerability [10,22,40,41]. Under each attack scenario, these two indicators will be calculated in the process.
1. Proportion of initial efficiency (Pie):
The efficiency E is defined as the average value of the inverse of the shortest path distance as shown in Equation (2). N indicates the total number of nodes, dij represents the shortest path between nodes i and j and E0 denotes the efficiency of initial state. Pie indicates the ability of maintaining original status; a higher Pie reflects the greater connectivity and the invulnerability of the network.
2. Largest connected subgraph (LCS):
Under the deletions of nodes, several subgraphs will be yielded from the original connected graph. Among them, the one having the most connected nodes is defined as the largest connected subgraph [37]. As shown in Equation (3), LCS is measured by the ratio of the number of nodes in the largest connected subgraph and the number of nodes in the original network.
2.5. Resilience Assessment
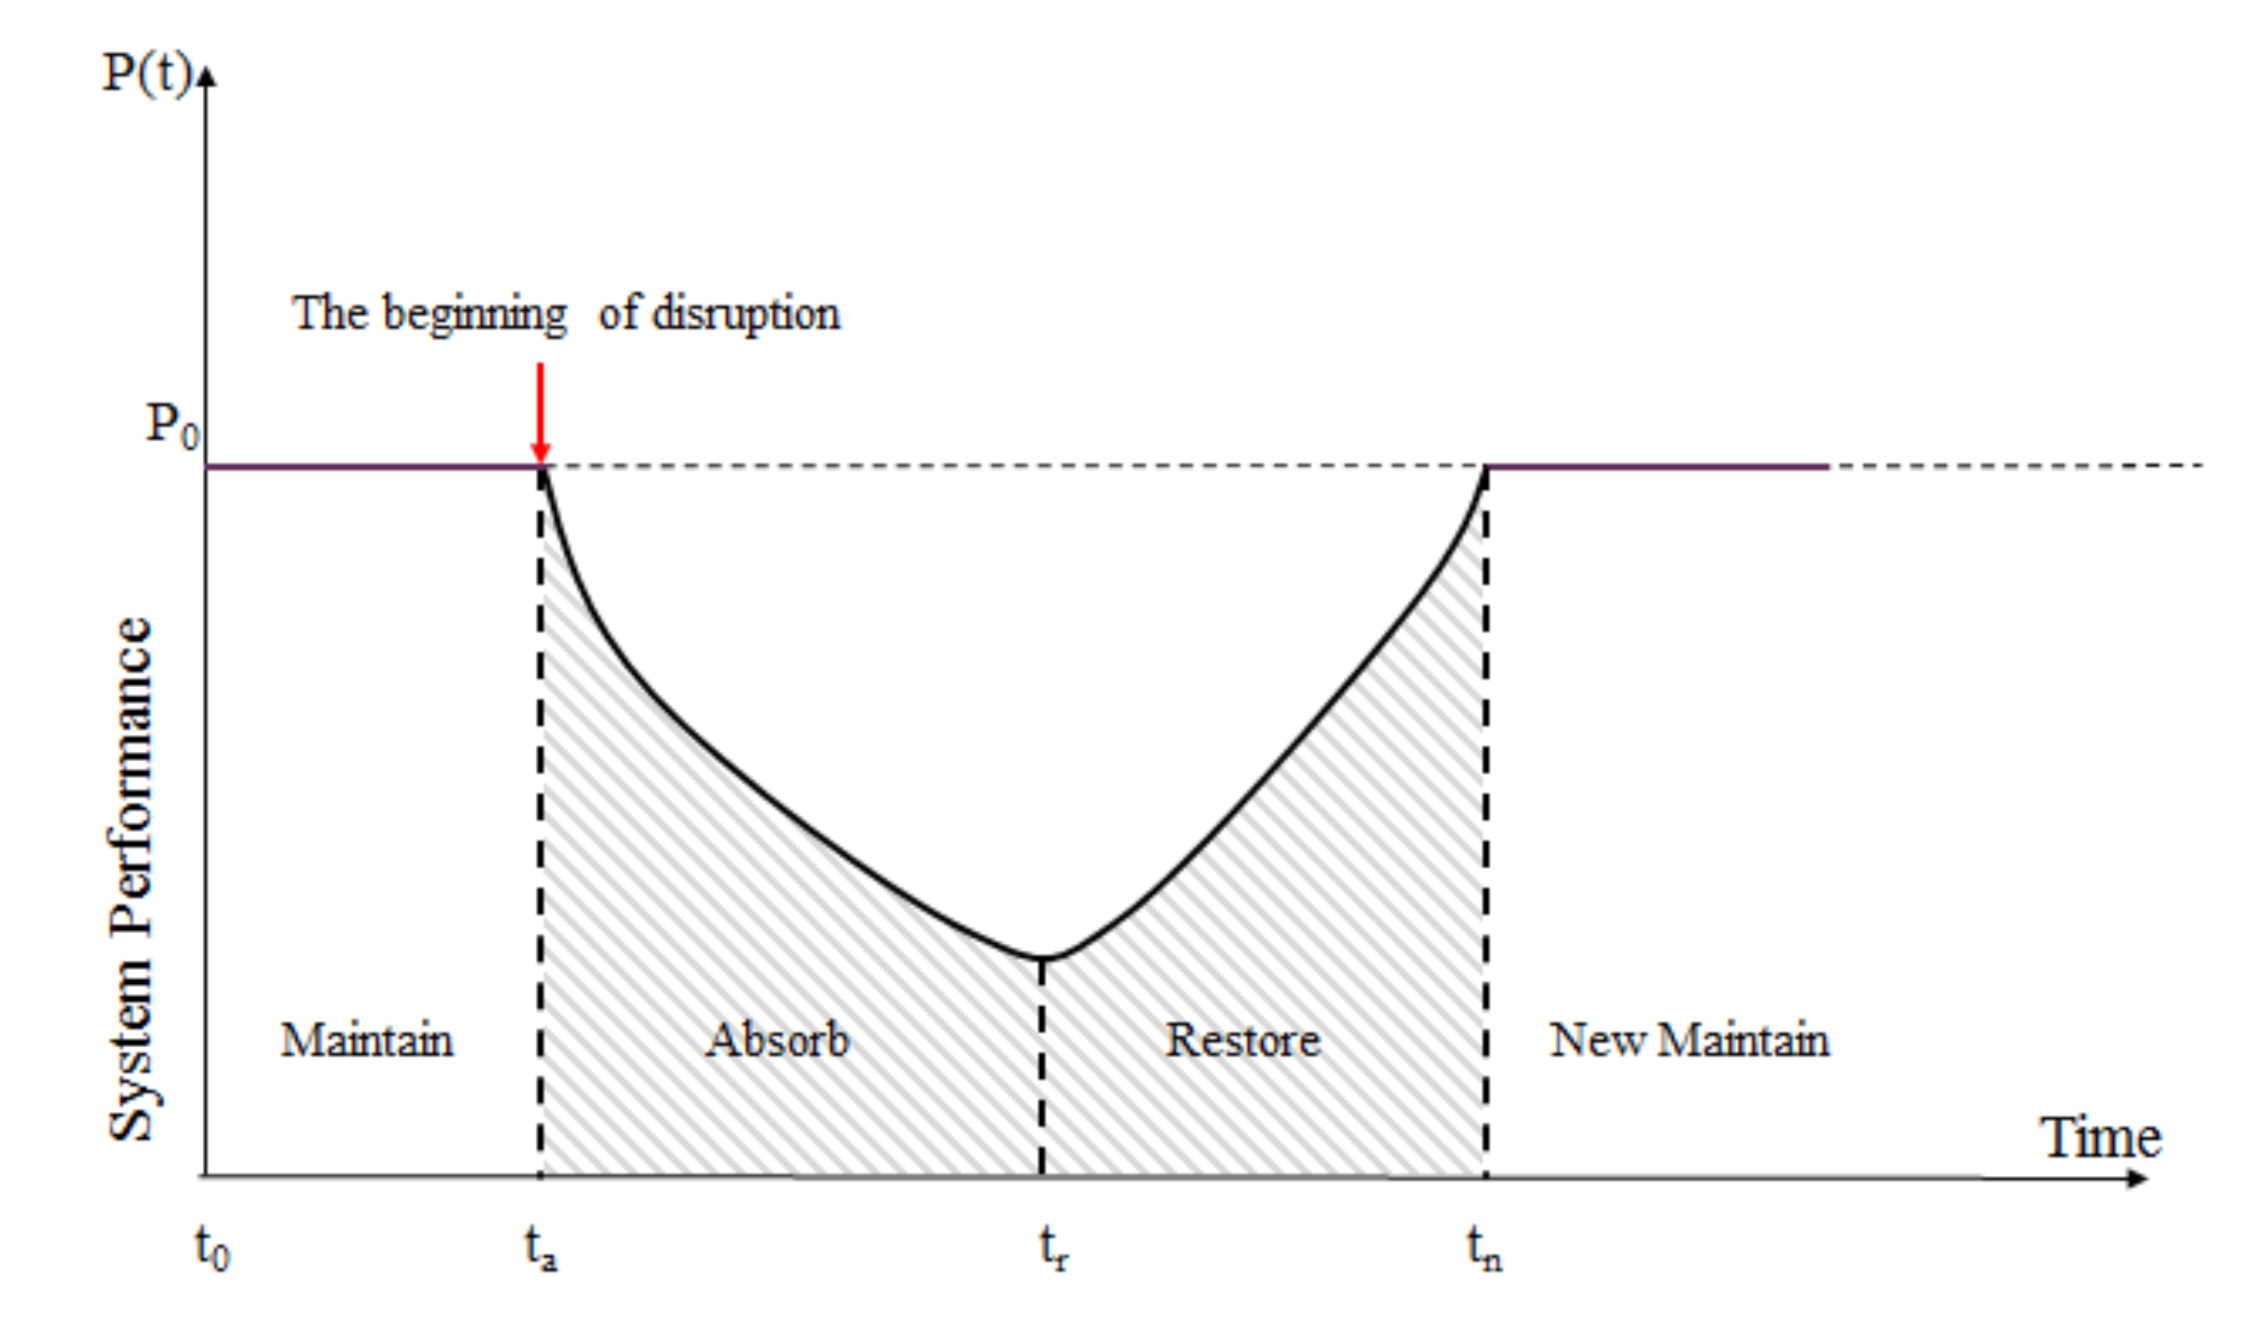
As mentioned above, many scholars have studied the definition and characteristics of resilience. In this paper, resilience of transportation networks is used to describe the restore ability under an attack. When encountering a disturbance, the system performance will decrease and gradually restore to a stable state, as shown in Figure 4 (modified by [42]).
The system performance P(t) experiences maintenance, absorption, restoration and new maintenance stages represented by a solid black line. P0 represents the system performance at t0, after the disturbance at ta, P(t) begins to decrease until it reaches the lowest point at tr. Through effective measures, P(t) is restored to a new maintenance stage at tn. In this process, the proportion of the area under the P(t) function from ta to tn is defined as the system resilience, as shown in Equation (4) [18,42,43,44]. tn represents the time to a new maintenance stage and ta denotes the time of disruption. In order to keep pace with vulnerability, the proportion of initial efficiency and largest connected subgraph are chosen to represent the system performance. More concretely, the system performance is 1 in maintenance and new maintenance stages, while it varies between 0 and 1 during absorption and restoration stages.
Two cases in which the restoration stage starts at the time of 25% and 50% of node failure are assumed and calculated, respectively, which is intended to compare the impact on the choice of recovery strategies.
3. Results and Discussion
3.1. Vulnerability Assessment of the GBA
The top 10 transportation stations of degree attack (DA), betweenness attack (BA) and natural hazard (NH) rankings are shown in Table 2. Meanwhile, the results of random attack were the average of 200 random sequence attacks, hence the rankings were not listed.
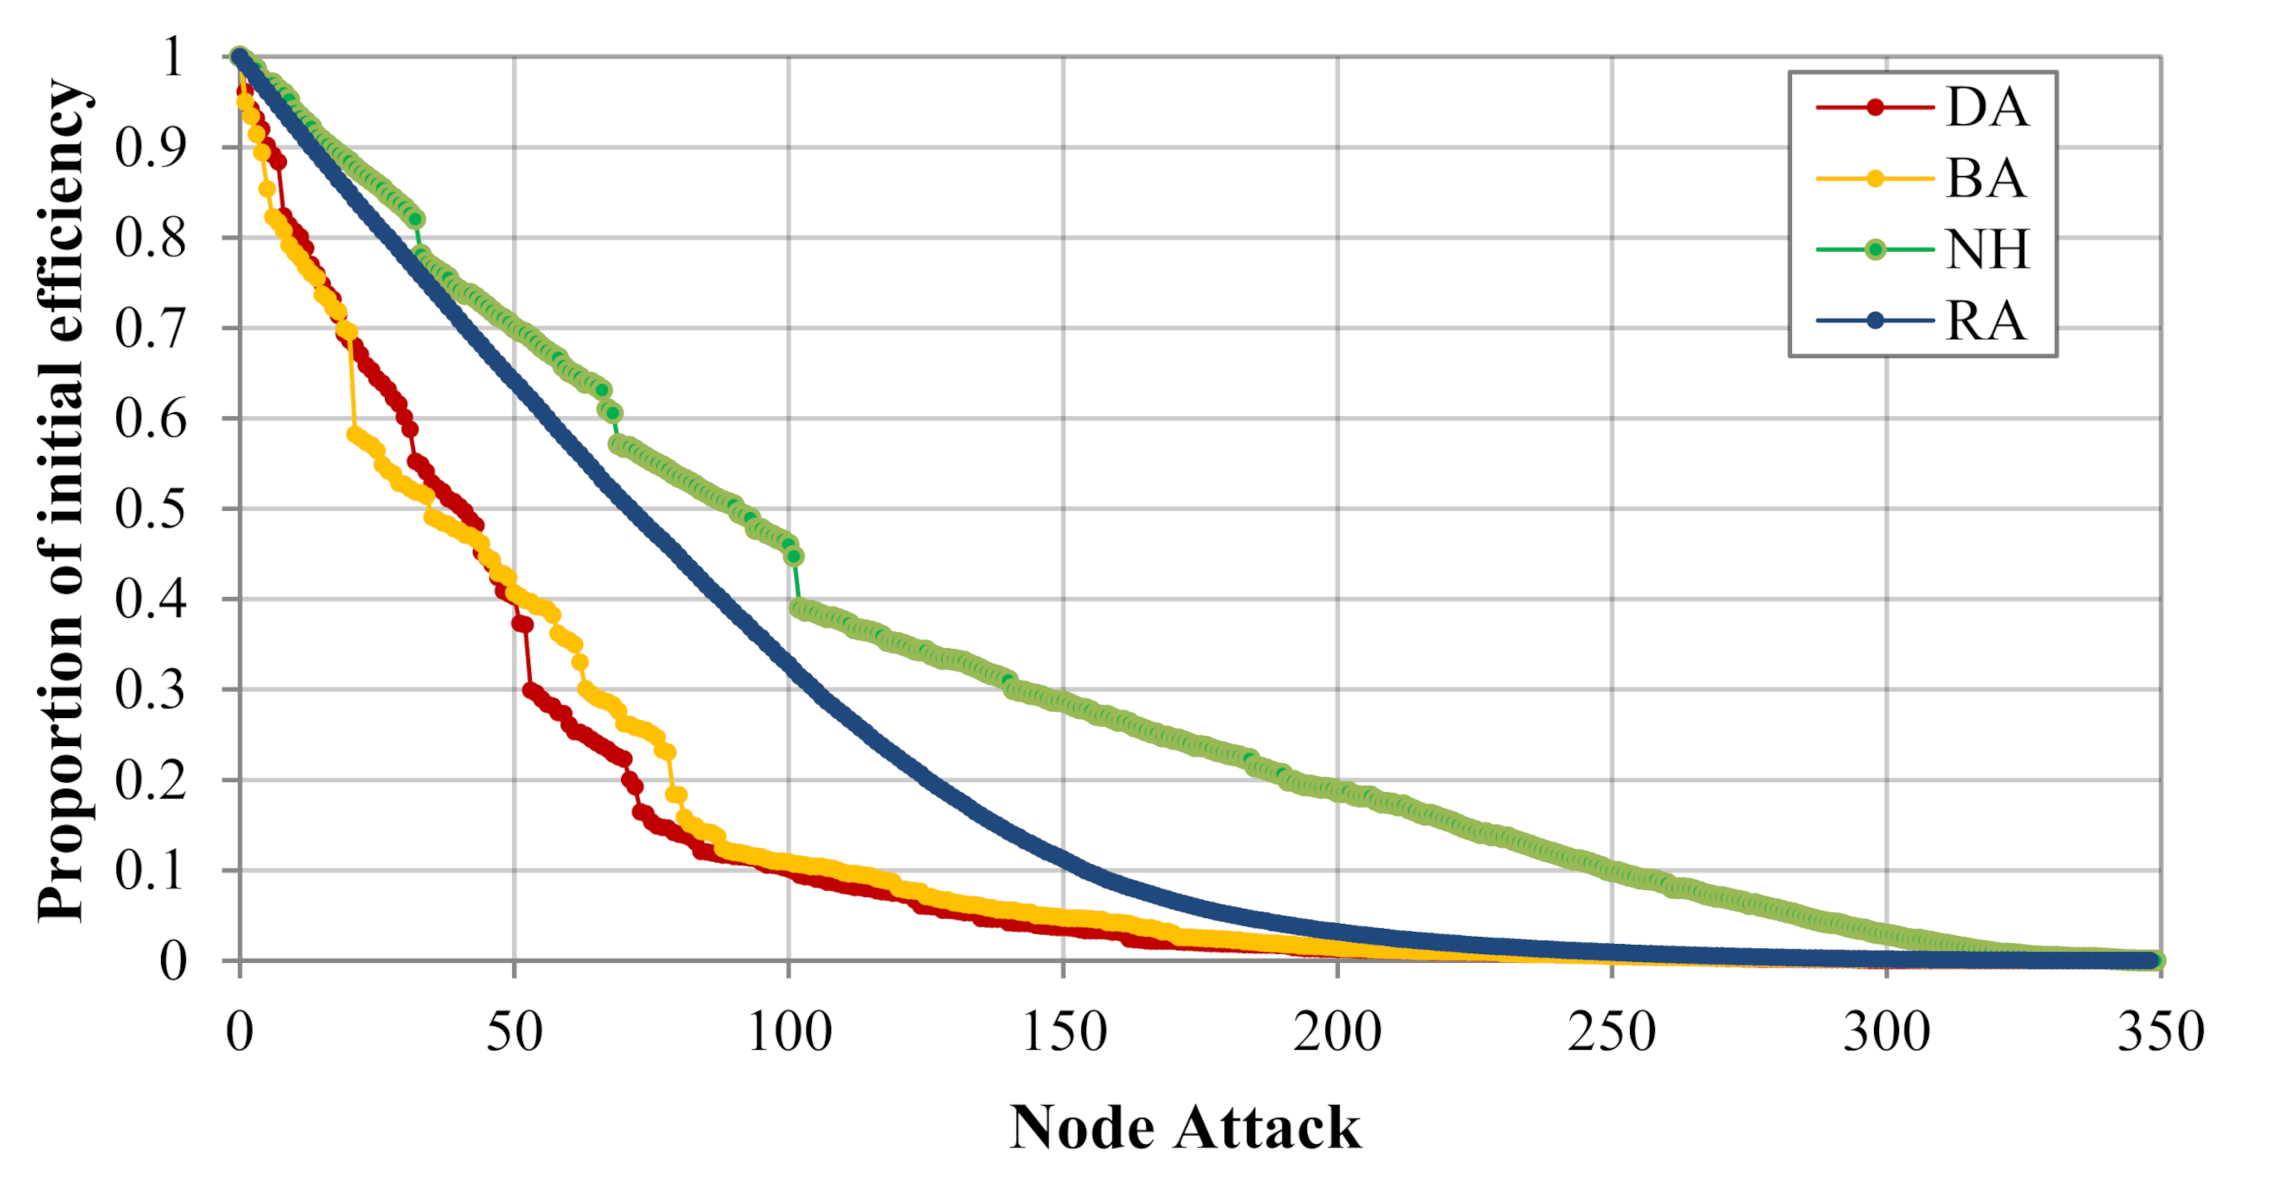
As shown in Figure 5 and Figure 6, proportion of initial efficiency and largest connected subgraph of the GBA presented different change patterns under random attack (RA), degree attack (DA), betweenness attack (BA) and natural hazard (NH). As a whole, the drop rates of degree attack and betweenness attack were far faster than natural hazard and random attack, which indicated that the GBA was more vulnerable to targeted attack.
In efficiency measurement, degree attack and betweenness attack had almost the same downward trend, which made much more serious impacts than the other two attack scenarios. After the deletion of the eighth nodes of degree attack, Guangmingcheng railway station, the efficiency dropped to around 80% of the original state in an instant. When 10% of the nodes (equivalent to 35 transportation stations) were destroyed under degree attack or betweenness attack, the network efficiency decreased to nearly 50% of the initial value. This is a rather remarkable outcome that the curve of natural hazard was observed to drop most slowly. This result may be explained by the fact that the central region of the GBA had relatively close connections and rarely experienced torrential rain, while southwestern and northern parts of the GBA were relatively sparsely connected and prone to natural hazards as shown in Figure 3.
In the largest connected subgraph measurement, stepped decrease trends were obvious under degree attack and betweenness attack. When the attack reached 6% of the nodes (equivalent to 21 transportation stations), the drop rate of betweenness attack was significantly faster than degree attack. With continual disruptions, the LCS reduced to less than half after 15% of the nodes of degree attack failed. However, under the deletion of 20% of nodes of betweenness attack, the performance could still maintain more than 50%. These results indicated that the GBA was more vulnerable to the betweenness attack in the case of a small number of node failures. Furthermore, after the deletion of the 18th and 53rd nodes of degree attack, Shenzhen Fukuda and Guangzhou Dongpu passenger depots, sudden drops of the performance of the GBA emerged. Similarly, the failure of the 21st and 79th nodes of betweenness attack, Heshan and Xintang passenger depots, also led to an abrupt descent. The results indicated that some small stations may play a great role in the continuous attack. Likewise, the natural hazard had little influence on the performance, to a certain extent.
3.2. Resilience Assessment of the GBA
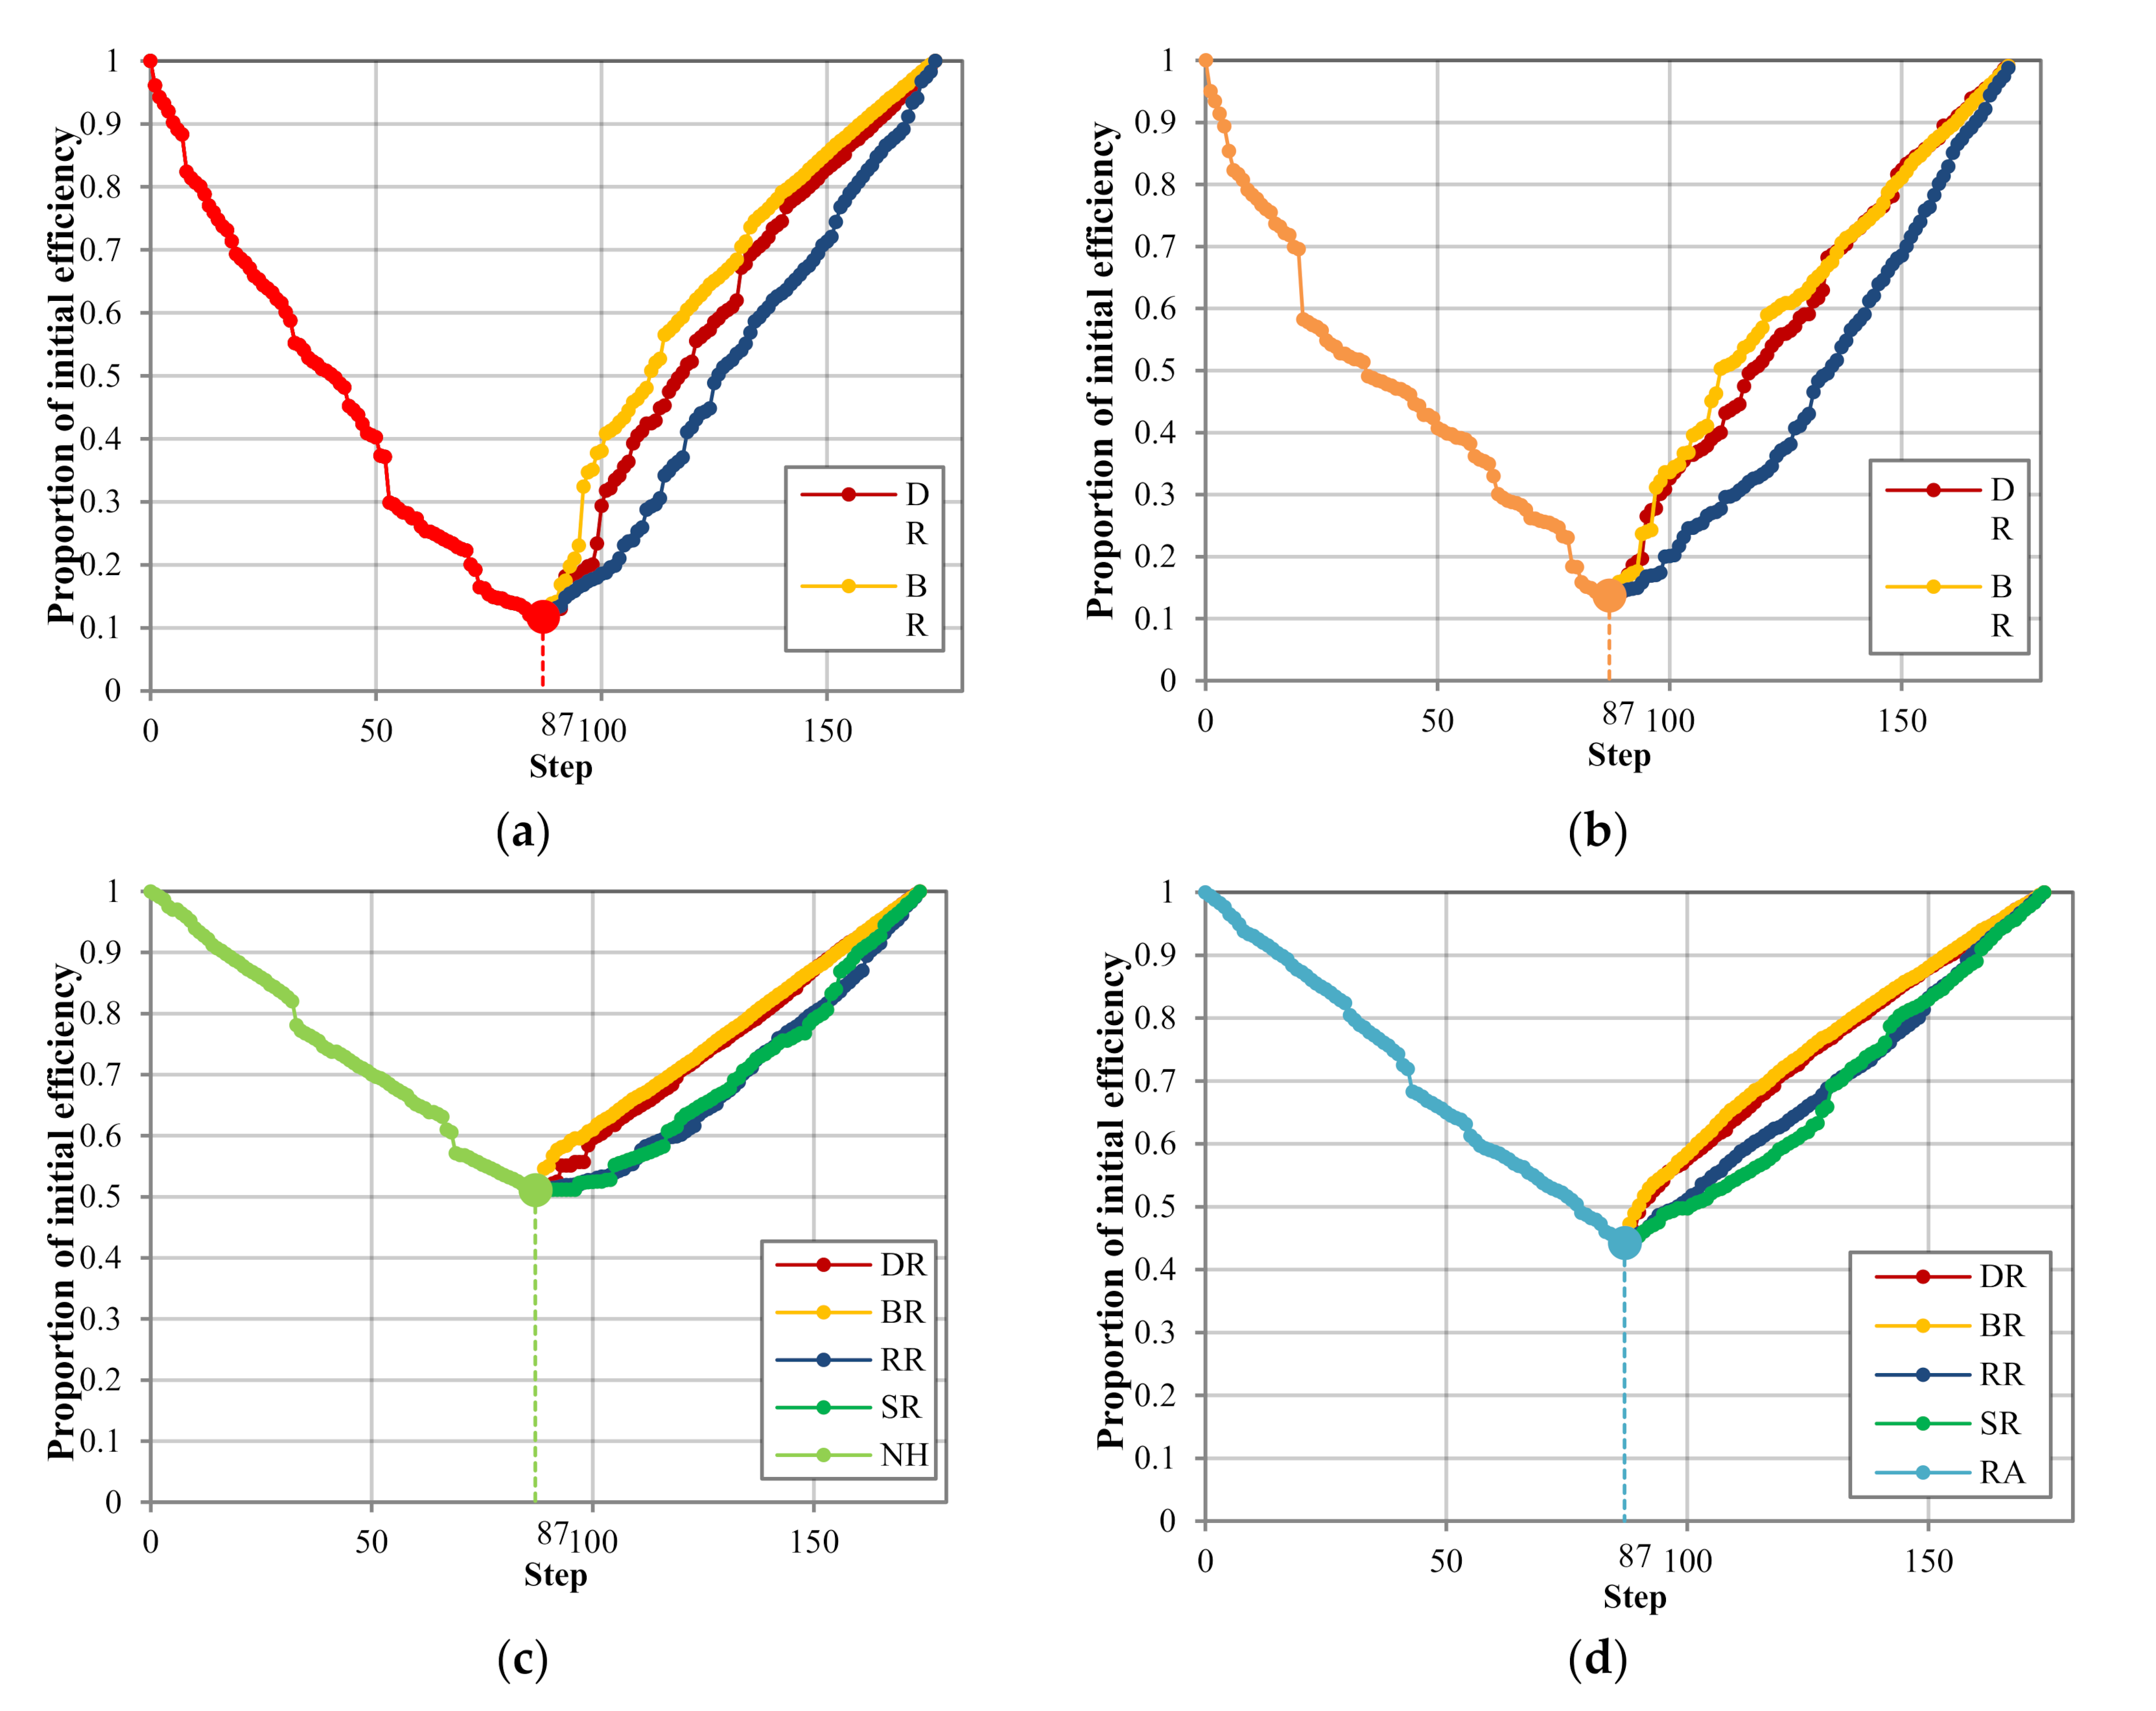
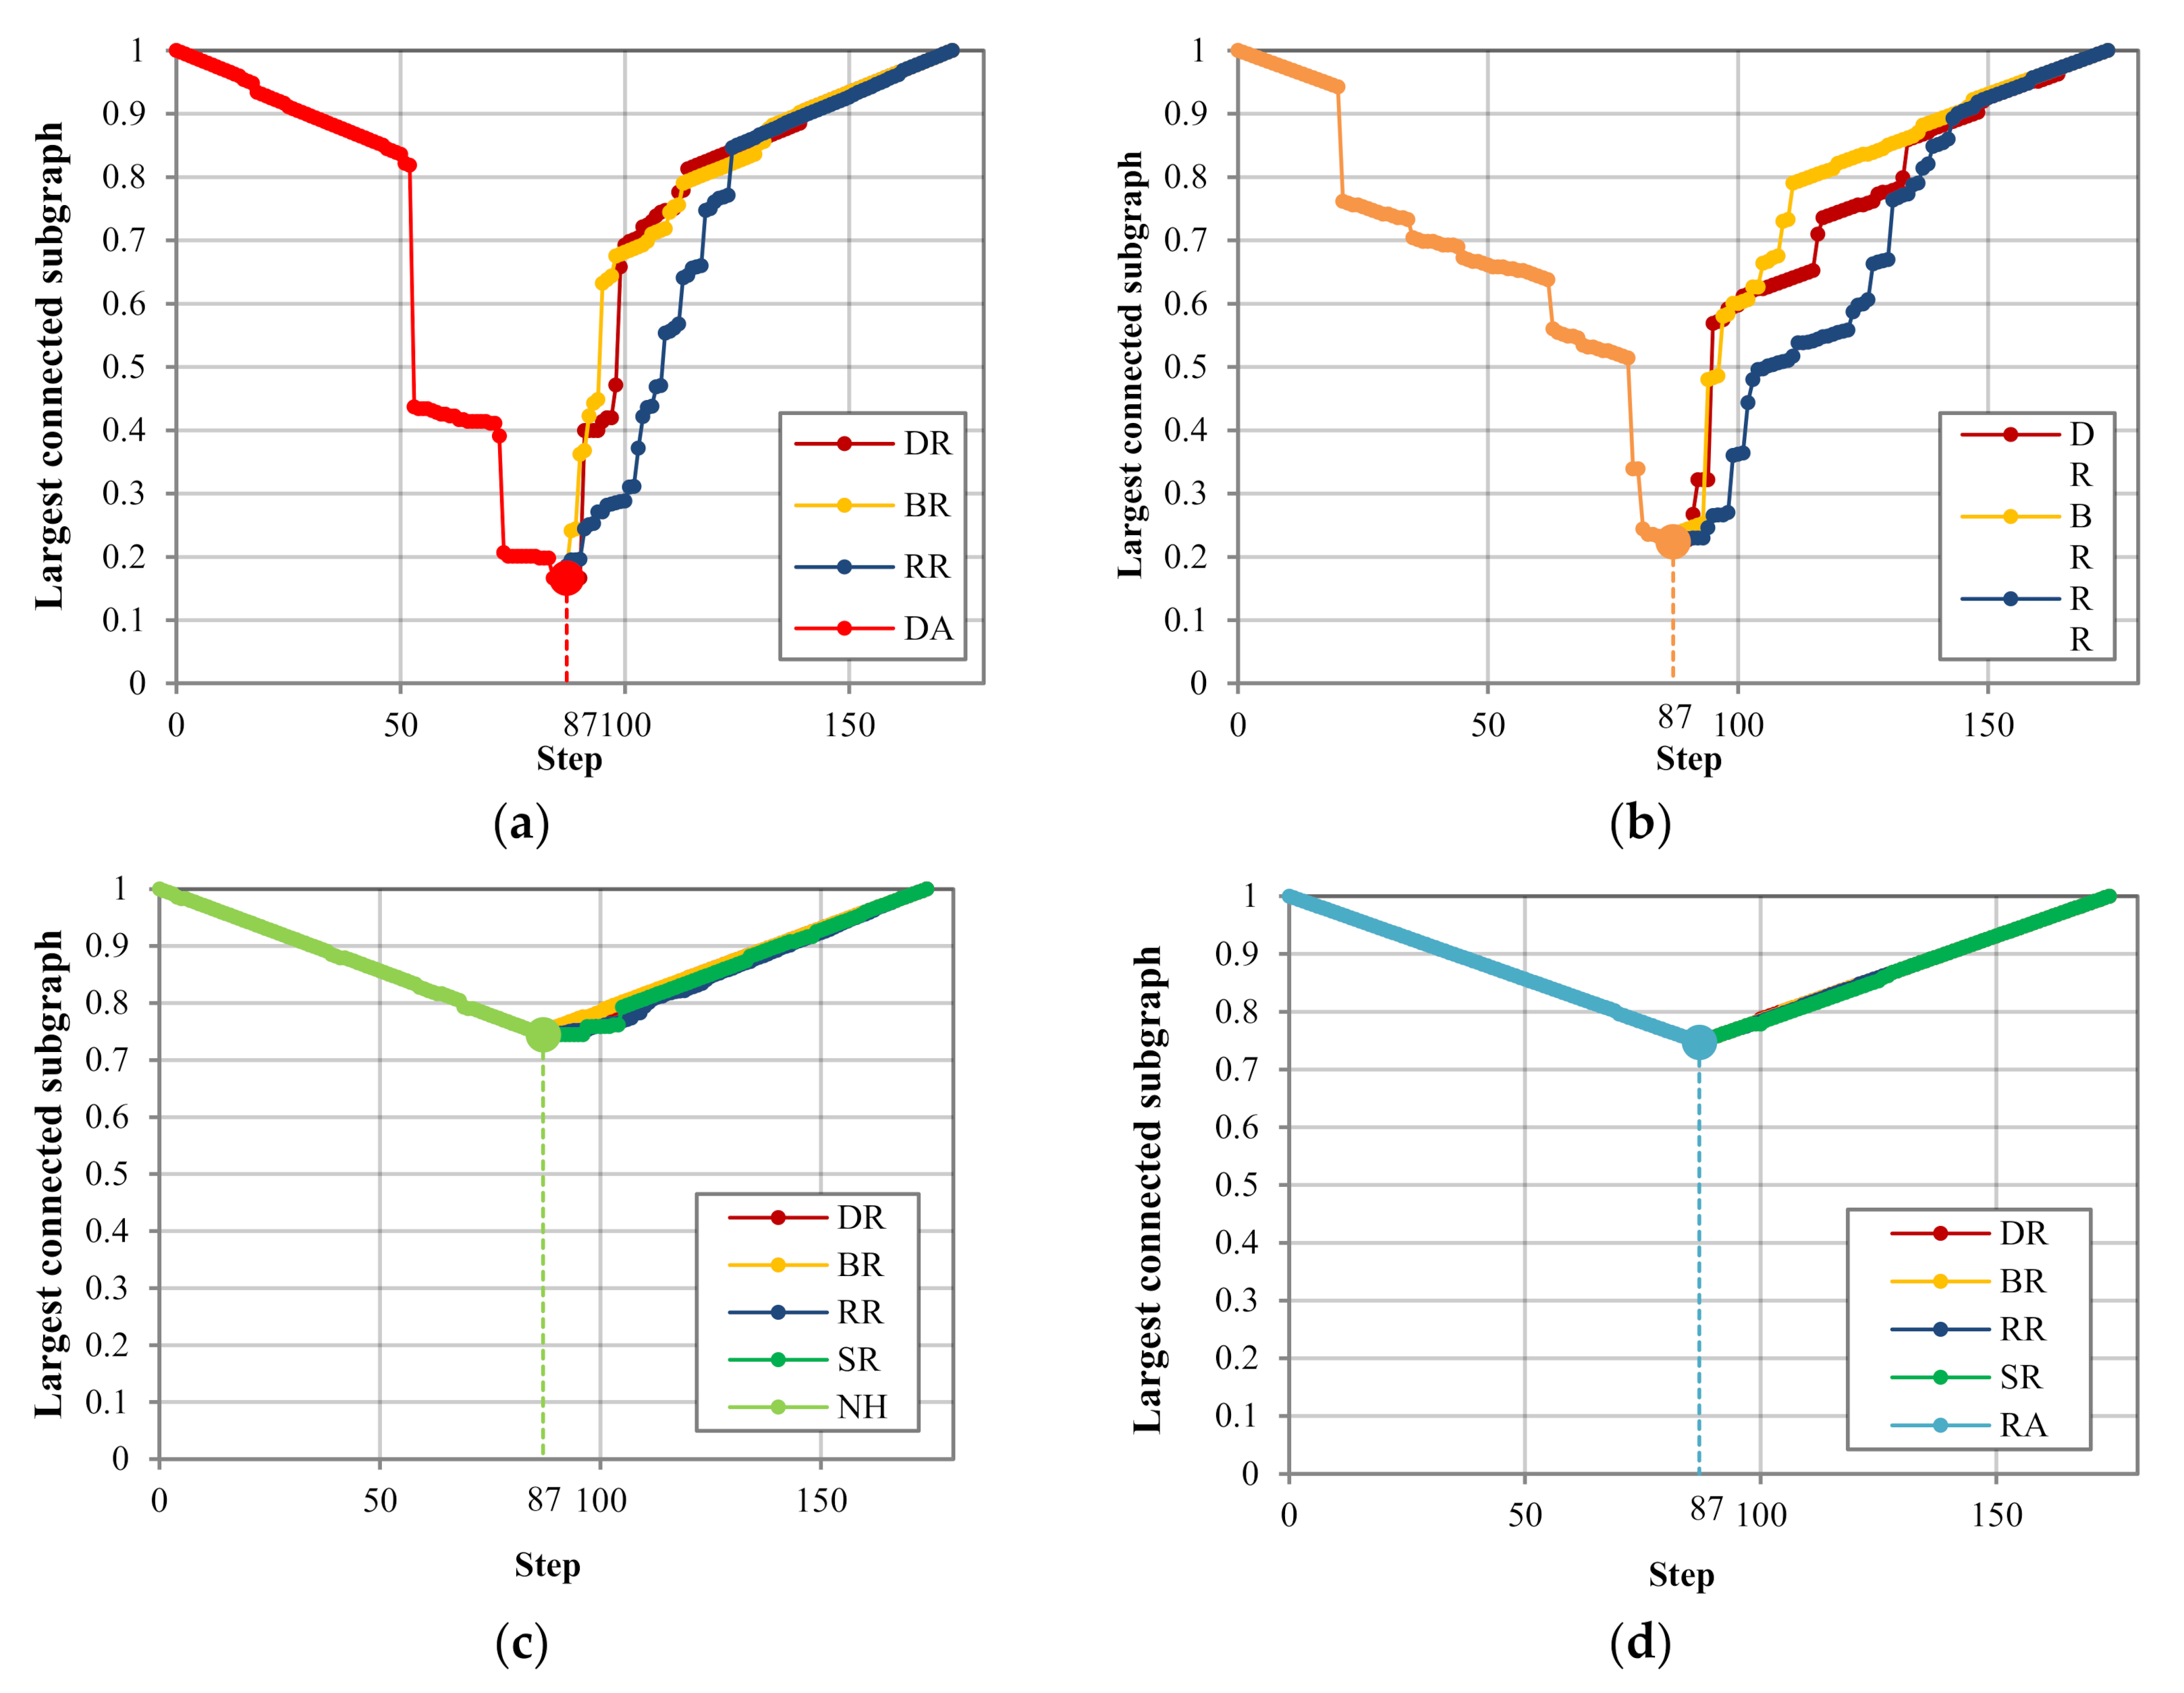
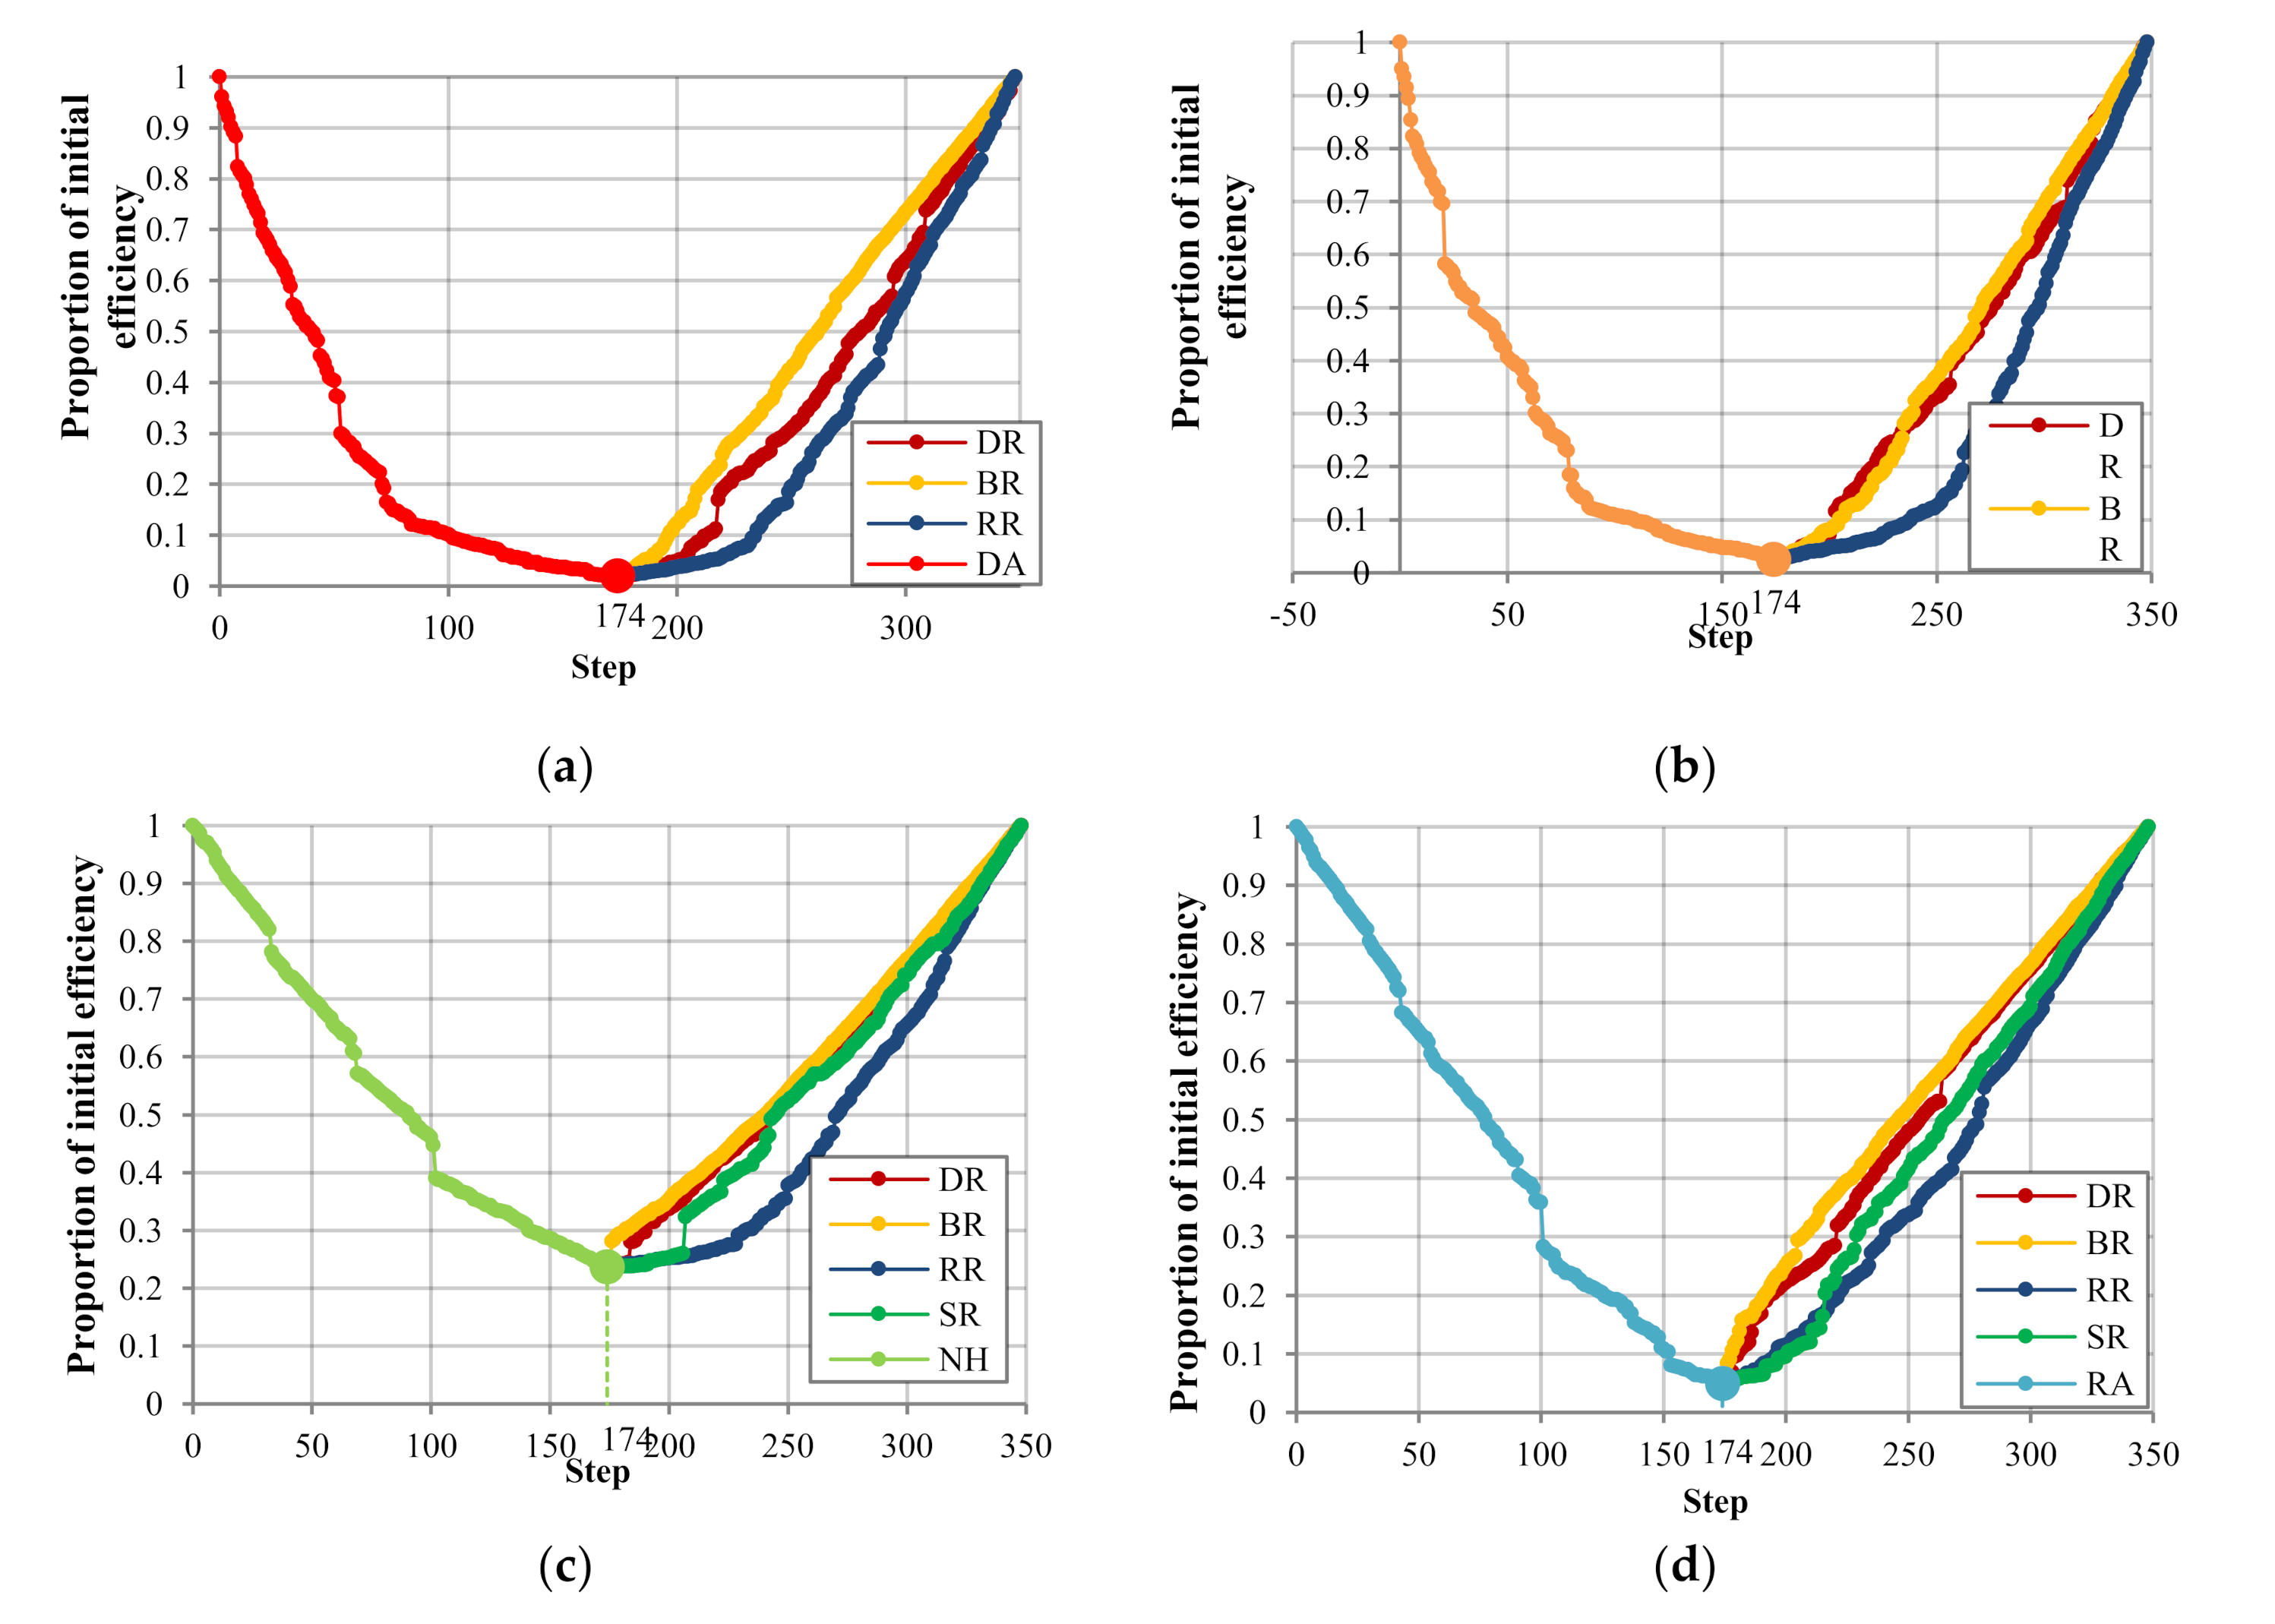
The requirement to enhance resilience has become more urgent in the wake of increasingly frequent natural disasters and terrorism. Considering that the government may adopt various recovery sequences to rebuild homelands and ensure production and life, the resilience assessment of the GBA was conducted to seek a proper strategy. In the following figures, the step implied node attack or recovery. For example, as shown in Figure 7 and Figure 8, the 87th step indicated that 25% of total nodes (equivalent to 87 transportation stations) failed. After that, the recovery strategies began to work.
Results in Figure 7 reveal the variations of the efficiency under different attacks and recovery scenarios with the restoration stage starting at 25% of total disruptions. There was no doubt that the recovery based on degree and betweenness had faster recovery rates than others. Betweenness had little advantage over degree under degree attack, while there was no significant difference in other attack scenarios.
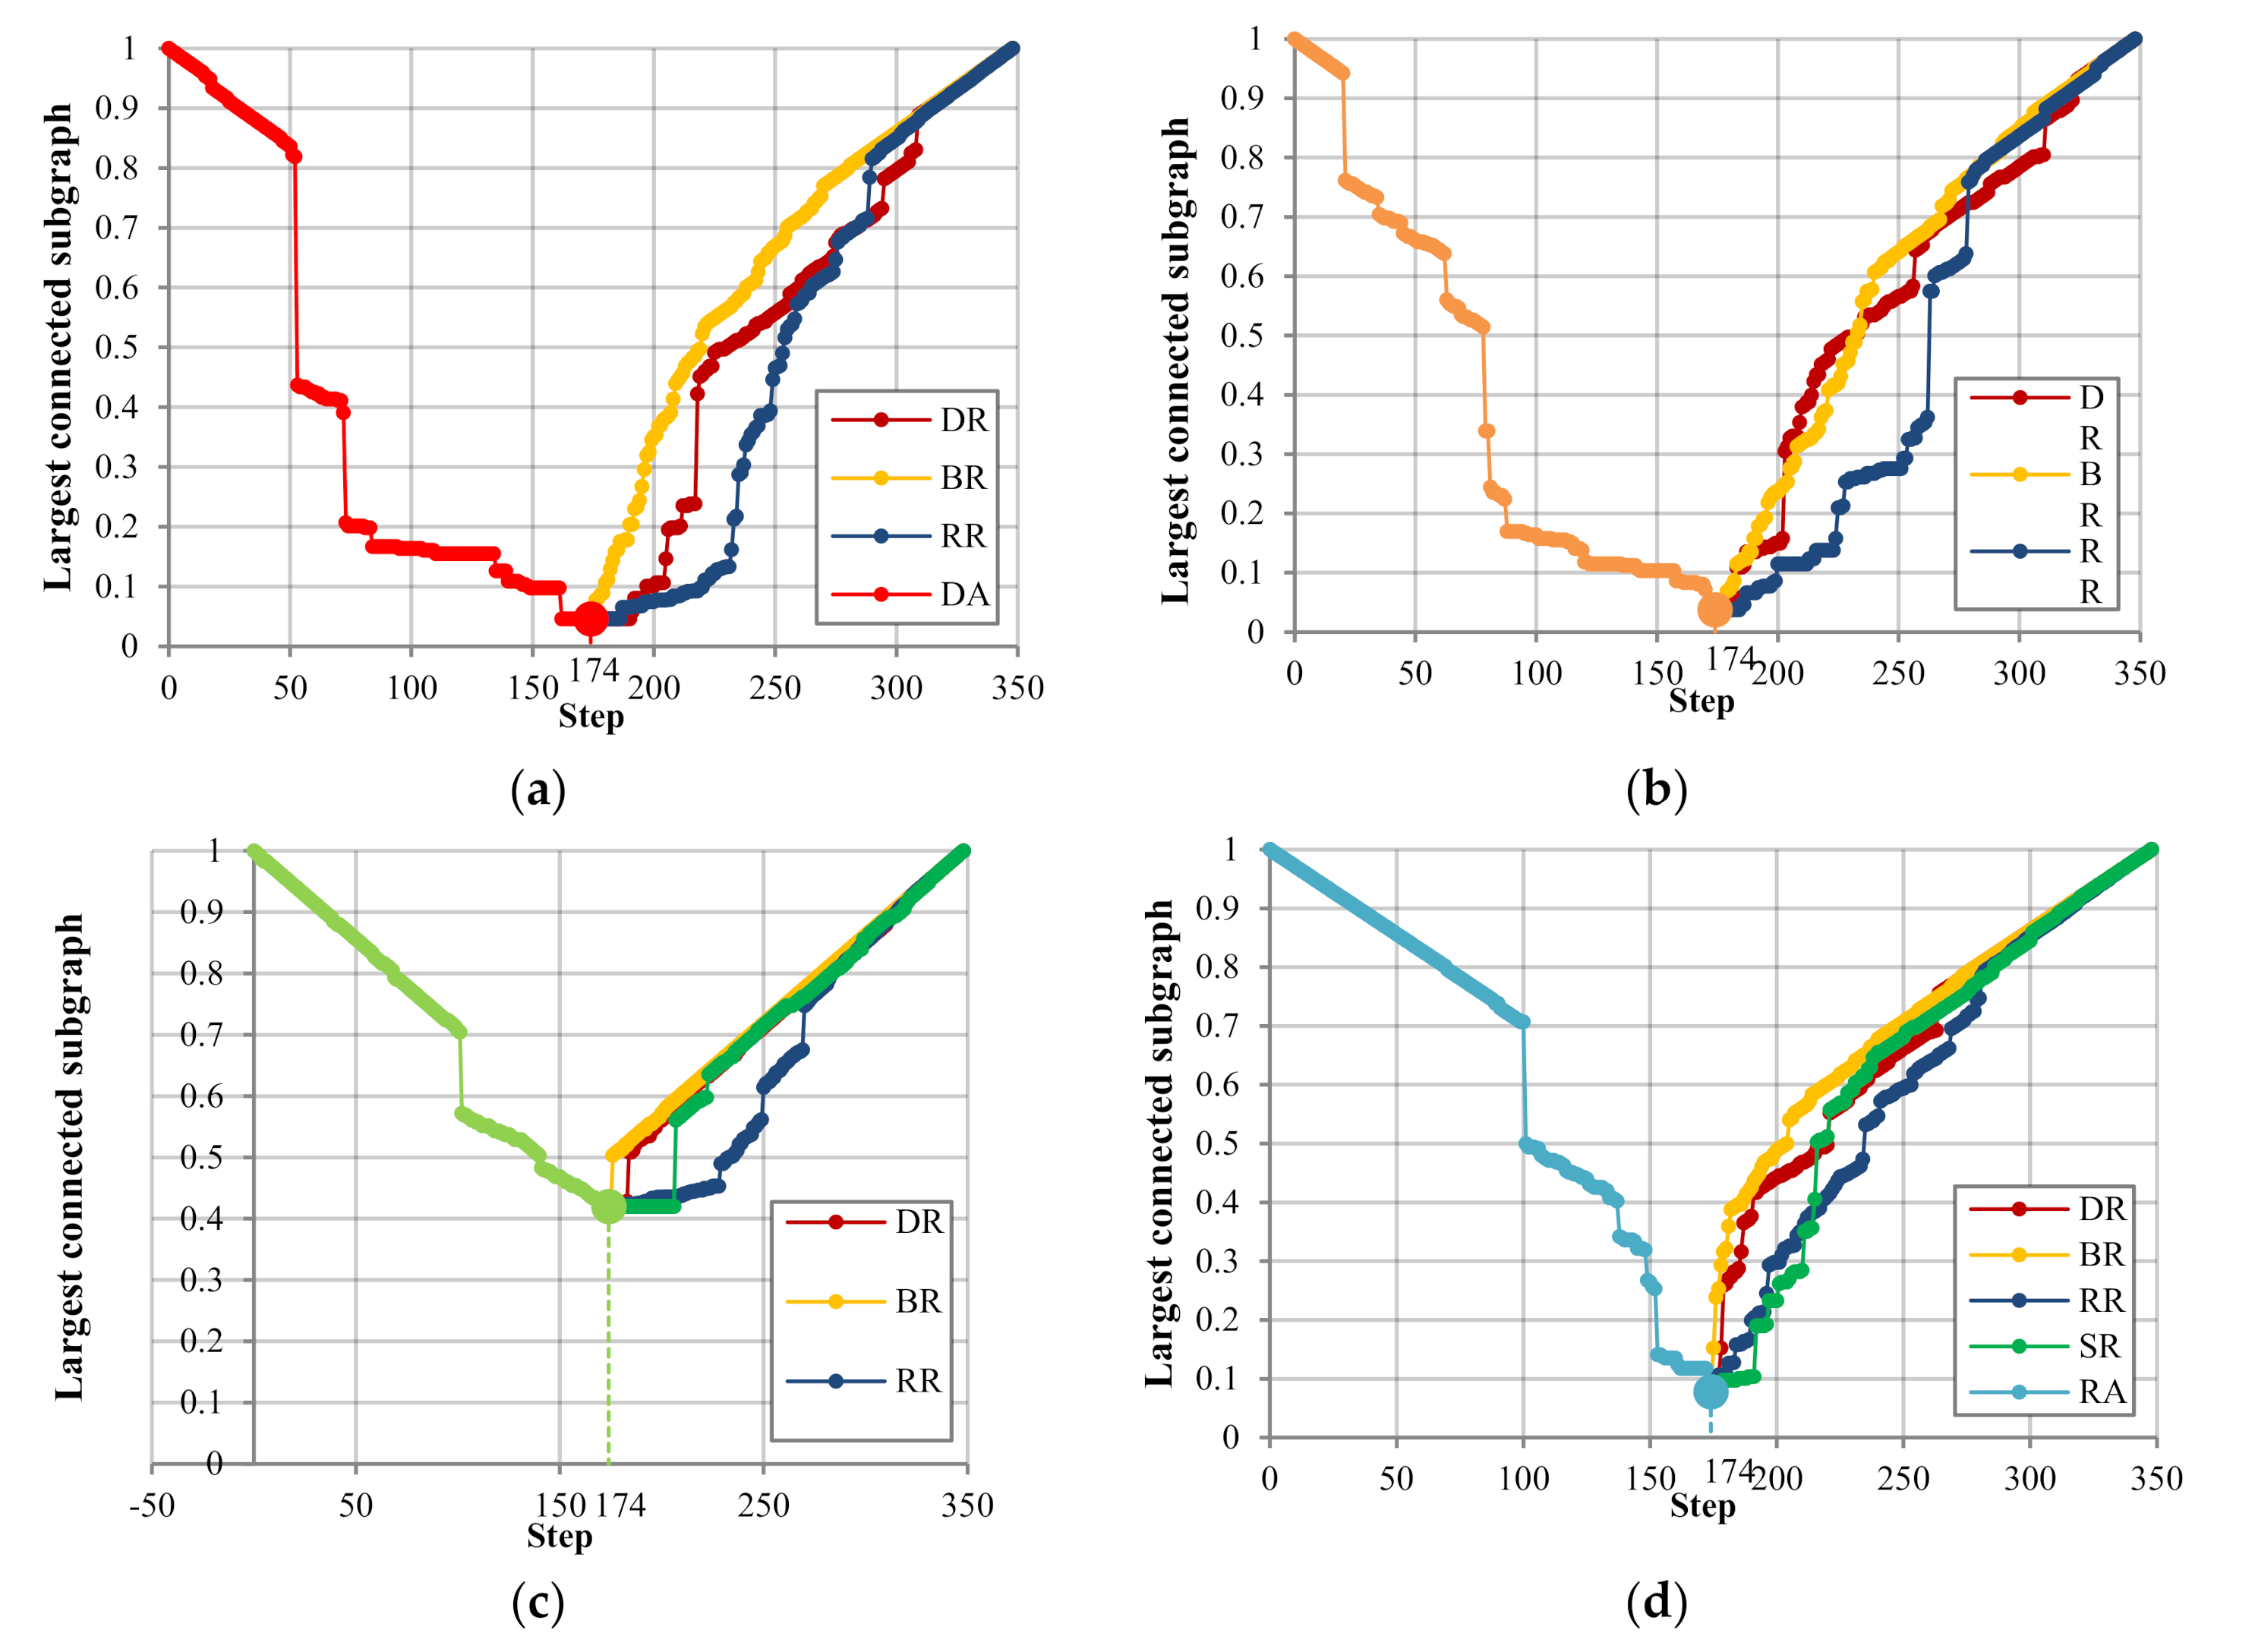
As can be seen from Figure 8, they presented a similar phenomenon to Figure 7. Under degree attack and betweenness attack, recovery based on degree and betweenness had faster recovery rates than others. However, there seemed to be little difference in the effect among various recovery strategies under natural hazard and random attack. These results are likely to be related to the severity that networks suffered. Natural hazard reduced the GBA performance to the lowest value of 0.74. RA was 0.75, while DA was 0.17 and BA was 0.22.
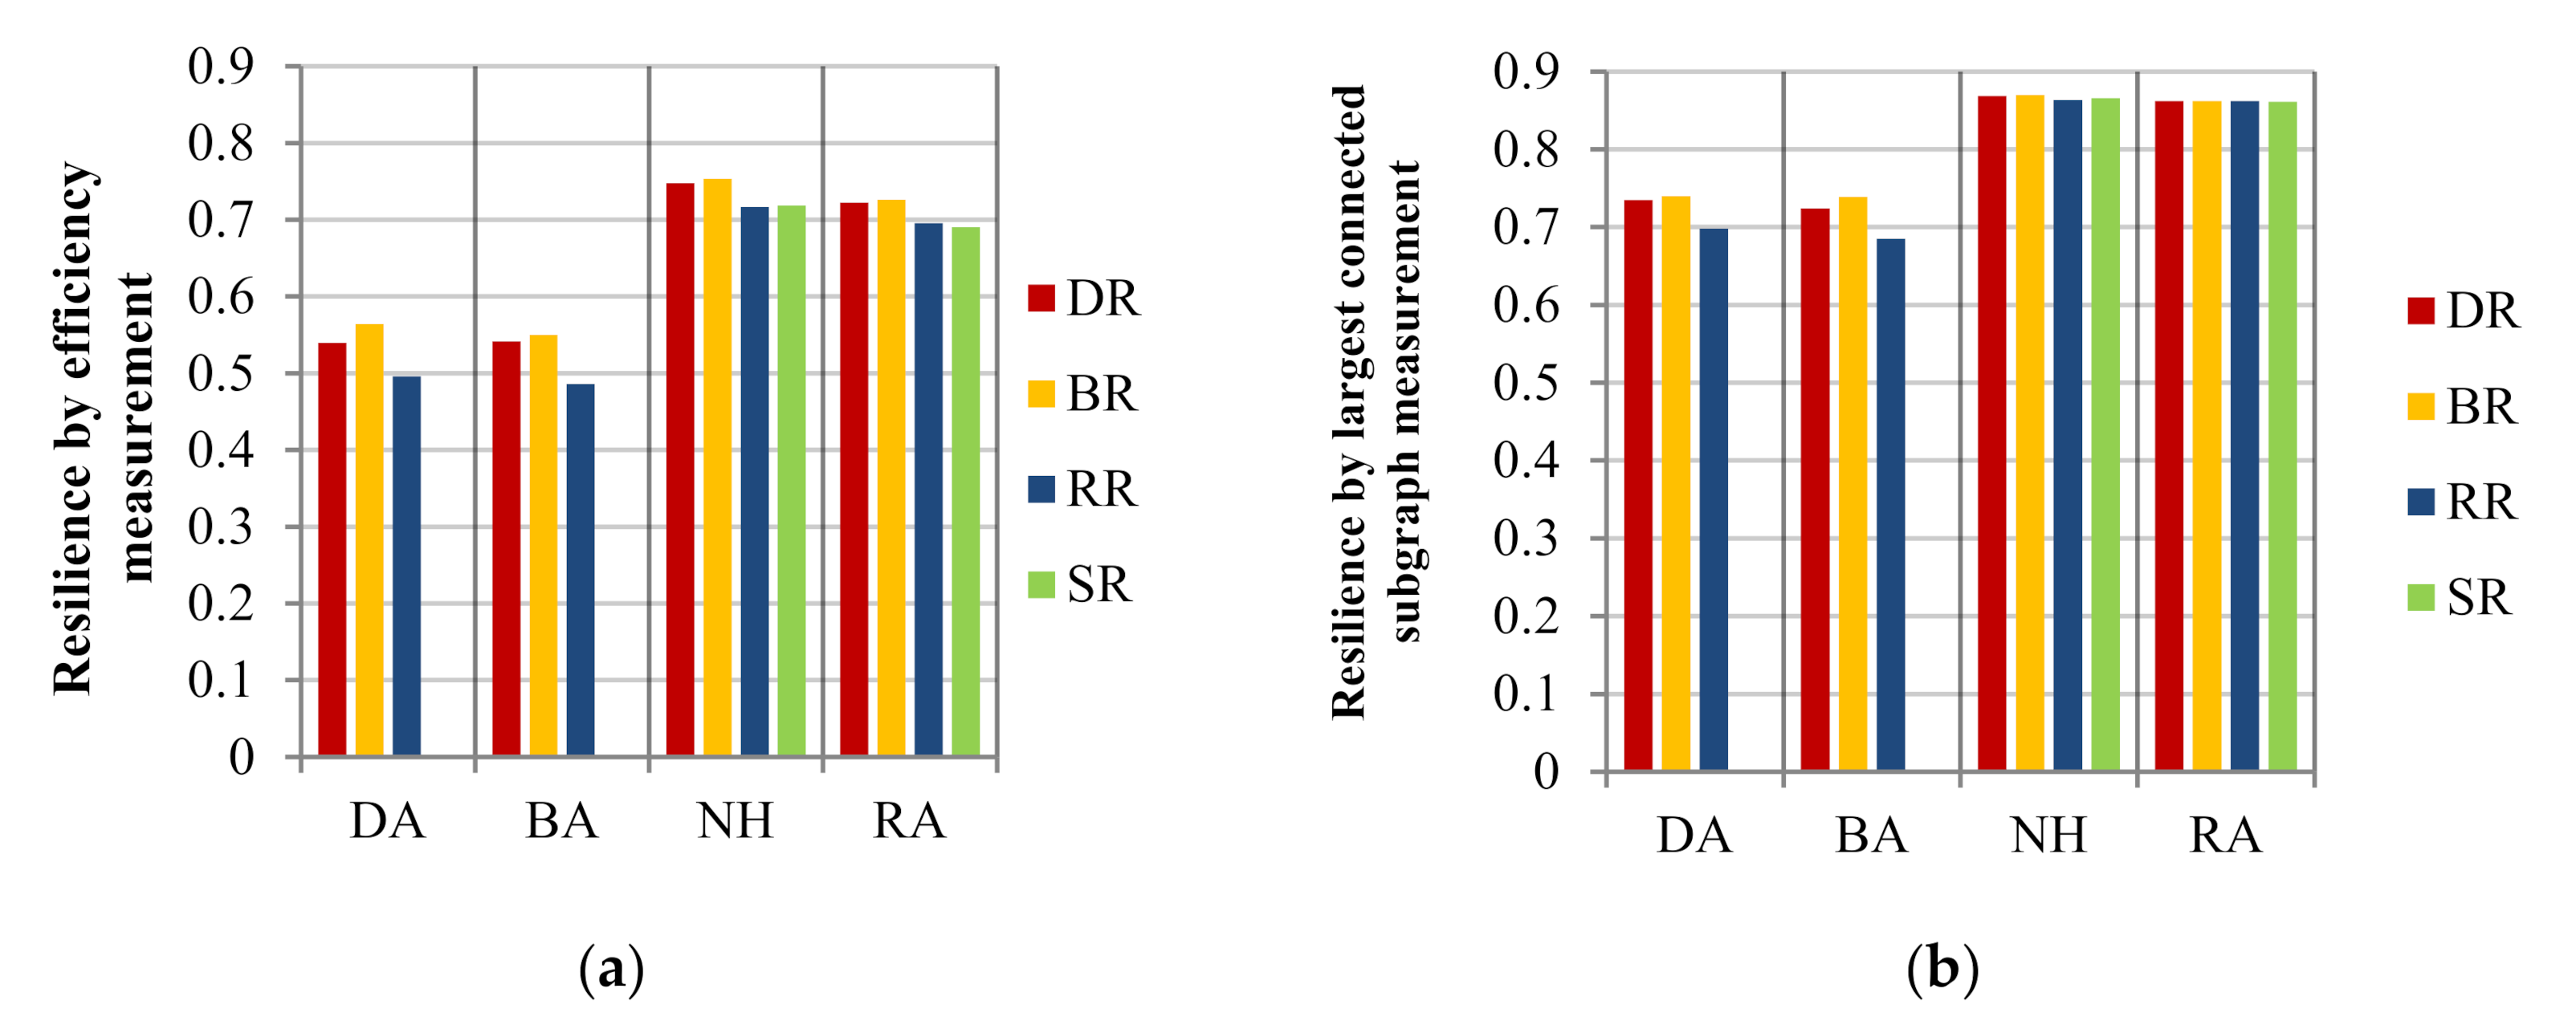
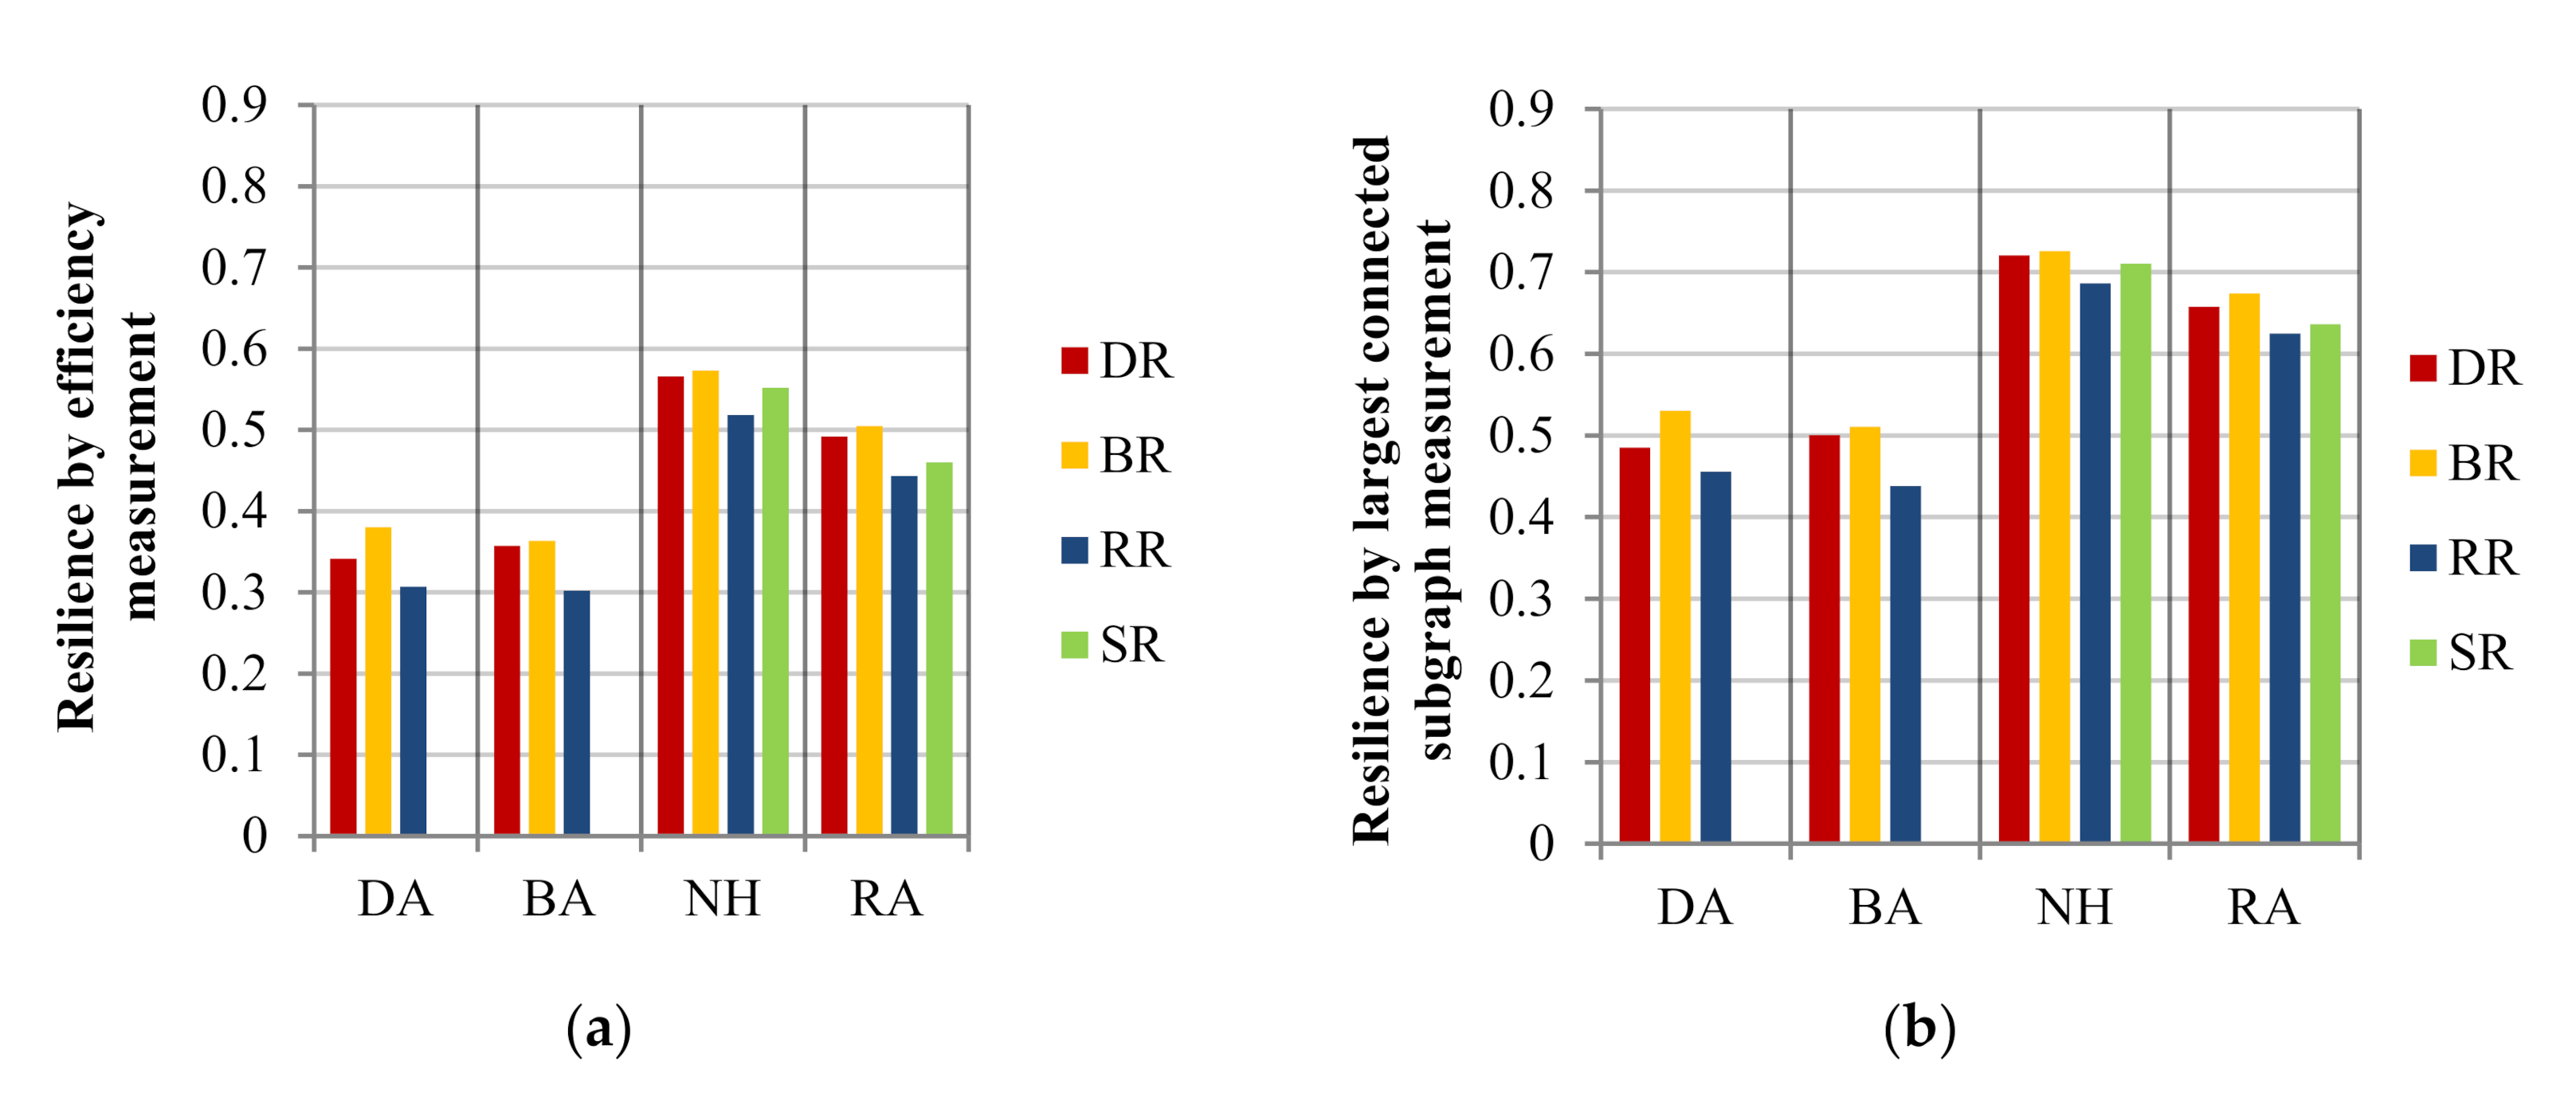
According to the resilience assessment, as shown in Figure 9, the following results can be drawn. Under two types of measurement, resilience values were different, but the basic trends were similar. For every attack scenario, the betweenness recovery strategy seemed to be the most effective, because the earlier recovered nodes hold up the connectivity of the whole network. Among different attack scenarios, the GBA presented poor resilience due to targeted attacks, mainly due to the large performance loss. Meanwhile, the GBA had approximately the same resilience under natural hazard and random attacks.
As for the resilience of the GBA in the context of further attacks, Figure 10 and Figure 11 show the variations of Pie and LCS with the restoration stage starting at 50% of total disruptions. Similar to the previous case, the recovery rates of degree and betweenness were faster than others. In addition, betweenness recovery presented slightly stronger effects than degree recovery under DA. However, unlike the case of 25% nodes failure, a slight advantage of recovering sequentially over randomly under natural hazard was observed. A possible explanation for this is that the sequential recovery strategy could add points effectively in the remaining network by forming large connected networks instead of several small-sized networks, which enhanced the performance quickly. Meanwhile, this phenomenon can be observed more clearly for the case of more serious damage.
Figure 12 illustrates the resilience under the case of half nodes’ failure. Compared to the case of 25% of total disruptions, the GBA had less resilience which almost decreased to two-thirds. The resilience value of betweenness recovery for each scenario was larger than other strategies, which indicated that the superiority of betweenness became increasingly apparent with the aggravating of disturbances. Moreover, it was apparent from this figure that the network had greater resilience under natural hazard, which confirmed that the GBA had a relatively strong ability to withstand natural disasters.
Overall, recovery based on degree and betweenness presented better effects than others and betweenness recovery was slightly more desirable. However, a clear weakness was that the GBA had the least resilience under random recovery strategy for targeted attacks. With further attacks, these two trends became more obvious. In fact, these results could provide references for disaster relief and rehabilitation. The government and planners have roles and responsibilities to identify and lay out policies and operational strategies following a major or catastrophic disaster. Recovery strategies should be designed to ensure that the urban agglomeration was able to take care of its development needs and was resilient against future disasters.
4. Conclusions
The purpose of this study was to analyze the vulnerability and resilience of the transportation networks in the GBA. Two characteristics were explored through the simulation of four attack scenarios (i.e., random attack (RA), degree attack (DA), betweenness attack (BA) and natural hazard (NH)) and four recovery scenarios (i.e., recovery based on degree (DR), recovery based on betweenness (BR), random recovery (RR) and sequential recovery (SR)). Previous studies mainly focused on a single mode of transportation; hence, this study concentrated on the evaluation of integrated transportation systems within an urban agglomeration.
Several findings have emerged. The drop rates of degree attack and betweenness attack were far faster than natural hazard and random attacks, which indicated that the transportation network of the GBA was more vulnerable to targeted attack, while the natural hazard had a small influence on the performance, to a certain extent. Moreover, some small stations may contribute a lot to the invulnerability in the continuous attack. These results could help the government and planners make preparedness, rescue, care and relief work smoothly and effectively. In order to minimize the impact of targeted attack, it is necessary to intensify emergency shelters and the equipment of stations with high degree and betweenness, such as Guangzhou and Foshan railway stations. However, it is worth noting that the roles of some small stations cannot be ignored, like Shenzhen Fukuda and Heshan passenger depots, which may abruptly cause network fragmentation.
Under measurements of efficiency and largest connected subgraph, resilience values were different, but the basic trends were similar. Owing to the effective restoration of connectivity, the betweenness recovery strategy seemed to be the best choice for every attack scenario. However, a clear weakness was that the GBA had the least resilience under random recovery strategy for targeted attacks. With further attacks, these two trends became more obvious. Like vulnerability, the GBA had poor resilience when faced with targeted attacks, mainly due to the large performance loss. Furthermore, it was apparent that the GBA had greater resilience under natural hazard, which confirmed that the GBA had a relatively strong ability to withstand natural disasters. Comparing different recovery times, we found that the GBA had less resilience which almost decreased to two-thirds in the context of further attacks. Actually, these results suggest that resilience can be achieved by starting recovery as soon as possible and selecting an optimal strategy. The government and planners could gain inspiration for disaster relief and rehabilitation.
This study provided the first comprehensive assessment of vulnerability and resilience of an integrated transportation network within an urban agglomeration. The findings reported here shed new light on policies and operational strategies following a major or catastrophic disaster. Greater efforts are needed to ensure emergency management and sustainable development of urban agglomerations.
Author Contributions
Conceptualization, M.C. and H.L.; methodology, M.C.; software, M.C.; validation, M.C.; formal analysis, M.C.; investigation, M.C.; resources, M.C. and H.L.; data curation, M.C.; writing—original draft preparation, M.C.; writing—review and editing, M.C.; visualization, M.C.; supervision, H.L.; project administration, H.L.; funding acquisition, H.L. All authors have read and agreed to the published version of the manuscript.
Funding
This research is supported by the consulting project of the Chinese Academy of Engineering: Research of the Development Strategy of Integrated Intelligent Transportation in the Guangdong-Hong Kong-Macao Greater Bay Area (2020-GD-04).
Acknowledgments
We are grateful to the editor and anonymous reviewers for their valuable suggestions. We would like to express our thanks to Wanning Li, Xinyan Liu, Qiu Chen and Xilian Ni for constructive discussions and strong encouragement on earlier drafts of this paper.
Conflicts of Interest
The authors declare no conflict of interest.
References
- Great Bay Area Overview. Available online: https://www.bayarea.gov.hk/en/about/overview.html (accessed on 28 July 2020).
- Hosseini, S.; Barker, K.; Ramirez-Marquez, J.E. A review of definitions and measures of system resilience. Reliab. Eng. Syst. Saf. 2016, 145, 47–61. [Google Scholar] [CrossRef]
- Aven, T. On Some Recent Definitions and Analysis Frameworks for Risk, Vulnerability, and Resilience. Risk Anal. 2011, 31, 515–522. [Google Scholar] [CrossRef] [PubMed]
- Timmerman, P. Vulnerability. Resilience and the Collapse of Socieiy: A Review of Models and Possible Climatic Applications; Environmental Monograph, Institute for Environmental Studies: Toronto, ON, Canada, 1981; pp. 1–42. [Google Scholar]
- Bussière, M.; Mulder, C. Political Instability and Economic Vulnerability. Int. J. Financ. Econ. 2000, 5, 309–330. [Google Scholar] [CrossRef]
- Collins, T.W. The political ecology of hazard vulnerability: Marginalization, facilitation and the production of differential risk to urban wildfires in Arizona’s White Mountains. J. Political Ecol. 2008, 15, 22–43. [Google Scholar] [CrossRef] [Green Version]
- Yeh, E.; Nyima, Y.; Hopping, K.; Klein, J. Tibetan Pastoralists’ Vulnerability to Climate Change: A Political Ecology Analysis of Snowstorm Coping Capacity. Hum. Ecol. 2014, 42, 61–74. [Google Scholar] [CrossRef]
- Berdica, K. An introduction to road vulnerability: What has been done, is done and should be done. Transp. Policy 2002, 9, 117–127. [Google Scholar] [CrossRef]
- Haimes, Y. On the Definition of Vulnerabilities in Measuring Risks to Infrastructures. Risk Anal. Off. Publ. Soc. Risk Anal. 2006, 26, 293–296. [Google Scholar] [CrossRef]
- Liu, J.; Lu, H.; Ma, H.; Liu, W. Network Vulnerability Analysis of Rail Transit Plans in Beijng-Tianjin-Hebei Region Considering Connectivity Reliability. Sustainability 2017, 9, 1479. [Google Scholar] [CrossRef] [Green Version]
- Shi, J.; Wen, S.; Zhao, X.; Wu, G. Sustainable Development of Urban Rail Transit Networks: A Vulnerability Perspective. Sustainability 2019, 11, 1335. [Google Scholar] [CrossRef] [Green Version]
- Xing, Y.; Lu, J.; Chen, S.; Dissanayake, S. Vulnerability analysis of urban rail transit based on complex network theory: A case study of Shanghai Metro. Public Transp. 2017, 9, 501–525. [Google Scholar] [CrossRef]
- Taylor, M.A.P.; Sekhar, S.V.C.; D’Este, G.M. Application of Accessibility Based Methods for Vulnerability Analysis of Strategic Road Networks. Netw. Spat. Econ. 2006, 6, 267–291. [Google Scholar] [CrossRef]
- Zhang, J.; Yunze, C.; Xiaoming, X.; Hong, L.; Wang, S. Topological Vulnerability of Chinese High Speed Rail Network. In Proceedings of the 30th Chinese Control Conference, Yantai, China, 22–24 July 2011; pp. 832–837. [Google Scholar]
- Moran, A.P.; Thieken, A.H.; Schöbel, A.; Rachoy, C. Documentation of Flood Damage on Railway Infrastructure. In Data and Mobility; Springer: Berlin/Heidelberg, Germany, 2010. [Google Scholar]
- Hong, L.; Ouyang, M.; Peeta, S.; He, X.; Yan, Y. Vulnerability assessment and mitigation for the Chinese railway system under floods. Reliab. Eng. Syst. Saf. 2015, 137, 58–68. [Google Scholar] [CrossRef]
- Holling, C.S. Resilience and Stability of Ecological Systems. Annu. Rev. Ecol. Syst. 1973, 4, 1–23. [Google Scholar] [CrossRef] [Green Version]
- Bruneau, M.; Chang, S.E.; Eguchi, R.T.; Lee, G.C.; O’Rourke, T.D.; Reinhorn, A.M.; Shinozuka, M.; Tierney, K.; Wallace, W.A.; von Winterfeldt, D. A Framework to Quantitatively Assess and Enhance the Seismic Resilience of Communities. Earthq. Spectra 2003, 19, 733–752. [Google Scholar] [CrossRef] [Green Version]
- Ouyang, M.; Dueñas-Osorio, L.; Min, X. A three-stage resilience analysis framework for urban infrastructure systems. Struct. Saf. 2012, 36–37, 23–31. [Google Scholar] [CrossRef]
- Watts, D.J.; Strogatz, S.H. Collective dynamics of ‘small-world’ networks. Nature 1998, 393, 440–442. [Google Scholar] [CrossRef]
- Barabasi, A.L.; Albert, R. Emergence of scaling in random networks. Science 1999, 286, 509–512. [Google Scholar] [CrossRef] [Green Version]
- Zhang, D.-M.; Du, F.; Huang, H.; Zhang, F.; Ayyub, B.M.; Beer, M. Resiliency assessment of urban rail transit networks: Shanghai metro as an example. Saf. Sci. 2018, 106, 230–243. [Google Scholar] [CrossRef]
- Aydin, N.Y.; Duzgun, H.S.; Heinimann, H.R.; Wenzel, F.; Gnyawali, K.R. Framework for improving the resilience and recovery of transportation networks under geohazard risks. Int. J. Disaster Risk Reduct. 2018, 31, 832–843. [Google Scholar] [CrossRef]
- Reggiani, A.; Nijkamp, P.; Lanzi, D. Transport resilience and vulnerability: The role of connectivity. Transp. Res. Part A Policy Pract. 2015, 81, 4–15. [Google Scholar] [CrossRef]
- Mattsson, L.-G.; Jenelius, E. Vulnerability and resilience of transport systems–A discussion of recent research. Transp. Res. Part A Policy Pract. 2015, 81, 16–34. [Google Scholar] [CrossRef]
- Wang, J.; Rong, L.; Liang, Z.; Zhang, Z. Attack vulnerability of scale-free networks due to cascading failures. Phys. A Stat. Mech. Appl. 2008, 387, 6671–6678. [Google Scholar] [CrossRef]
- Holme, P.; Kim, B.J.; Yoon, C.N.; Han, S.K. Attack vulnerability of complex networks. Phys. Rev. EStat. Nonlinear Soft Matter Phys. 2002, 65, 056109. [Google Scholar] [CrossRef] [PubMed] [Green Version]
- Xia, Y.; Jin, F.; Hill, D. Cascading failure in Watts–Strogatz small-world networks. Phys. A Stat. Mech. Appl. 2010, 389, 1281–1285. [Google Scholar] [CrossRef]
- Paul, G.; Sreenivasan, S.; Stanley, H.E. Resilience of Complex Networks to Random Breakdown. Phys. Rev. E 2005, 72, 056130. [Google Scholar] [CrossRef] [Green Version]
- Faturechi, R.; Miller-Hooks, E. Travel time resilience of roadway networks under disaster. Transp. Res. Part B Methodol. 2014, 70, 47–64. [Google Scholar] [CrossRef]
- Hsieh, C.-H.; Feng, C.-M. The highway resilience and vulnerability in Taiwan. Transp. Policy 2020, 87, 1–9. [Google Scholar] [CrossRef]
- Wang, X.; Miao, S.; Tang, J. Vulnerability and Resilience Analysis of the Air Traffic Control Sector Network in China. Sustainability 2020, 12, 3749. [Google Scholar] [CrossRef]
- Janić, M. Modeling the resilience of an airline cargo transport network affected by a large scale disruptive event. Transp. Res. Part D Transp. Environ. 2019, 77, 425–448. [Google Scholar] [CrossRef]
- Chen, L.; Miller-Hooks, E. Resilience: An Indicator of Recovery Capability in Intermodal Freight Transport. Transp. Sci. 2012, 46, 109–123. [Google Scholar] [CrossRef]
- Xia, T.; Tian, Q.; Liu, T.L.; Wang, C.; Li, D. Transportation issues in developing China’s urban agglomerations. Transp. Policy 2020, 85. [Google Scholar] [CrossRef]
- Wang, H.; Huang, J.; Xu, X.; Xiao, Y. Damage attack on complex networks. Phys. A Stat. Mech. Appl. 2014, 408, 134–148. [Google Scholar] [CrossRef]
- Yang, Y.; Liu, Y.; Zhou, M.; Li, F.; Sun, C. Robustness assessment of urban rail transit based on complex network theory: A case study of the Beijing Subway. Saf. Sci. 2015, 79, 149–162. [Google Scholar] [CrossRef]
- Duan, Y.; Lu, F. Robustness of city road networks at different granularities. Phys. A Stat. Mech. Appl. 2014, 411, 21–34. [Google Scholar] [CrossRef]
- Wallemacq, P.; House, R. Economic Losses, Poverty & Disasters: 1998–2017. Available online: https://www.preventionweb.net/publications/view/61119 (accessed on 20 July 2020).
- Wang, S.; Zhang, J.; Zhao, M.; Min, X. Vulnerability analysis and critical areas identification of the power systems under terrorist attacks. Phys. A: Stat. Mech. Appl. 2017, 473, 156–165. [Google Scholar] [CrossRef]
- Gu, Y.; Fu, X.; Liu, Z.; Xu, X.; Chen, A. Performance of transportation network under perturbations: Reliability, vulnerability, and resilience. Transp. Res. Part E Logist. Transp. Rev. 2020, 133, 101809. [Google Scholar] [CrossRef]
- Guo, Q.; Amin, S.; Hao, Q.; Haas, O. Resilience assessment of safety system at subway construction sites applying analytic network process and extension cloud models. Reliab. Eng. Syst. Saf. 2020, 201. [Google Scholar] [CrossRef]
- Song, K.; You, S.; Chon, J. Simulation modeling for a resilience improvement plan for natural disasters in a coastal area. Environ. Pollut. 2018, 242, 1970–1980. [Google Scholar] [CrossRef]
- Ouyang, M.; Leonardo, D.-O. Time-dependent resilience assessment and improvement of urban infrastructure systems. Chaos 2012, 22, 1–23. [Google Scholar]
Figure 1.
The distribution of transportation facilities in the Greater Bay Area (GBA).

Figure 2.
The topology networks of the GBA.

Figure 3.
Torrential rain days of nodes in the GBA.

Figure 4.
Transportation network resilience diagrams.

Figure 5.
Variations in efficiency in four attack scenarios.

Figure 6.
Variations in largest connected subgraph in four attack scenarios.

Figure 7.
Variations in efficiency in attack scenarios and recovery scenarios with the restoration stage starting at 25% of total disruptions: (a) degree attack (DA); (b) betweenness attack (BA); (c) natural hazard (NH); (d) random attack (RA).
Figure 7.
Variations in efficiency in attack scenarios and recovery scenarios with the restoration stage starting at 25% of total disruptions: (a) degree attack (DA); (b) betweenness attack (BA); (c) natural hazard (NH); (d) random attack (RA).

Figure 8.
Variations in largest connected subgraph in attack scenarios and recovery scenarios with the restoration stage starting at 25% of total disruptions: (a) degree attack (DA); (b) betweenness attack (BA); (c) natural hazard (NH); (d) random attack (RA).
Figure 8.
Variations in largest connected subgraph in attack scenarios and recovery scenarios with the restoration stage starting at 25% of total disruptions: (a) degree attack (DA); (b) betweenness attack (BA); (c) natural hazard (NH); (d) random attack (RA).

Figure 9.
Resilience of the GBA with the restoration stage starting at 25% of total disruptions: (a) efficiency measurement; (b) largest connected subgraph measurement.
Figure 9.
Resilience of the GBA with the restoration stage starting at 25% of total disruptions: (a) efficiency measurement; (b) largest connected subgraph measurement.

Figure 10.
Variations in efficiency in attack scenarios and recovery scenarios with the restoration stage starting at 50% of total disruptions: (a) degree attack (DA); (b) betweenness attack (BA); (c) natural hazard (NH); (d) random attack (RA).
Figure 10.
Variations in efficiency in attack scenarios and recovery scenarios with the restoration stage starting at 50% of total disruptions: (a) degree attack (DA); (b) betweenness attack (BA); (c) natural hazard (NH); (d) random attack (RA).

Figure 11.
Variations in largest connected subgraph in attack scenarios and recovery scenarios with the restoration stage starting at 50% of total disruptions: (a) degree attack (DA); (b) betweenness attack (BA); (c) natural hazard (NH); (d) random attack (RA).
Figure 11.
Variations in largest connected subgraph in attack scenarios and recovery scenarios with the restoration stage starting at 50% of total disruptions: (a) degree attack (DA); (b) betweenness attack (BA); (c) natural hazard (NH); (d) random attack (RA).

Figure 12.
Resilience of the GBA with the restoration stage starting at 50% of total disruptions: (a) efficiency measurement; (b) largest connected subgraph measurement.
Figure 12.
Resilience of the GBA with the restoration stage starting at 50% of total disruptions: (a) efficiency measurement; (b) largest connected subgraph measurement.


Table 1.
Topological properties of the GBA.
| Networks | Number of Nodes | Number of Links | Average Degree | Average Betweenness | Density |
|---|---|---|---|---|---|
| GBA | 348 | 1408 | 4.05 | 1250.05 | 0.012 |
Table 2.
The top 10 transportation stations of different failure scenarios.
| No. | Stations under DA | Stations under BA | Stations under NH |
|---|---|---|---|
| 1 | Guangzhou east railway station | Qingsheng railway station | Hengshan passenger depot |
| 2 | Guangzhou railway station | Guangzhou south railway station | Enping passenger depot |
| 3 | Zengcheng licheng passenger depot | Humenbei railway station | Enping railway station |
| 4 | Foshan gaoming passenger depot | Foshan west railway station | Conghua passenger depot |
| 5 | Huadu beixing passenger depot | Guangzhou railway station | Hong Kong international airport |
| 6 | Shenzhen west railway station | Guangzhou east railway station | Lvtian passenger depot |
| 7 | Shenzhen longhua passenger depot | Guangmingcheng railway station | Guangzhou timian passenger depot |
| 8 | Guangmingcheng railway station | Sanshui south railway station | Tashan passenger depot |
| 9 | Shenzhen railway station | Shenzhen north railway station | Guangzhou baiyun international airport |
| 10 | Foshan railway station | Dongguan east railway station | Taishan passenger depot |
© 2020 by the authors. Licensee MDPI, Basel, Switzerland. This article is an open access article distributed under the terms and conditions of the Creative Commons Attribution (CC BY) license (http://creativecommons.org/licenses/by/4.0/).
Share and Cite
MDPI and ACS Style
Chen, M.; Lu, H. Analysis of Transportation Network Vulnerability and Resilience within an Urban Agglomeration: Case Study of the Greater Bay Area, China. Sustainability 2020, 12, 7410. https://0-doi-org.brum.beds.ac.uk/10.3390/su12187410
AMA Style
Chen M, Lu H. Analysis of Transportation Network Vulnerability and Resilience within an Urban Agglomeration: Case Study of the Greater Bay Area, China. Sustainability. 2020; 12(18):7410. https://0-doi-org.brum.beds.ac.uk/10.3390/su12187410
Chicago/Turabian StyleChen, Mingyu, and Huapu Lu. 2020. "Analysis of Transportation Network Vulnerability and Resilience within an Urban Agglomeration: Case Study of the Greater Bay Area, China" Sustainability 12, no. 18: 7410. https://0-doi-org.brum.beds.ac.uk/10.3390/su12187410
Note that from the first issue of 2016, this journal uses article numbers instead of page numbers. See further details here.