Article

Assessing Climate Change Impacts and Adaptation Options for Farm Performance Using Bio-Economic Models in Southwestern France

1
Leibniz Centre for Agricultural Landscape Research (ZALF) e.V., Eberswalder Str. 84, 15374 Müncheberg, Germany
2
Wageningen University & Research (WUR), Droevendaalsesteeg 4, 6708 PB Wageningen, The Netherlands
3
Université de Toulouse, INRAE, UMR AGIR, F-31326 Castanet-Tolosan, France
*
Author to whom correspondence should be addressed.
Sustainability 2020, 12(18), 7528; https://0-doi-org.brum.beds.ac.uk/10.3390/su12187528
Submission received: 31 July 2020 / Revised: 10 September 2020 / Accepted: 10 September 2020 / Published: 12 September 2020
(This article belongs to the Special Issue Effects of Climate Change on Sustainable Agriculture)

Abstract

:
Regional impact studies are needed to explore possible adaptation options to climate change. We estimated impacts and adaptation options for future scenarios that feature different assumptions regarding climate, cropping pattern and access to irrigation with two bio-economic farm models. Farm profit, soil organic matter balance and labor input are used as indicators of farm performance. The difference between the baseline and the alternative configurations computed by models is referred as adaptation potential, indicative of the adaptation options including the corresponding changes in cropping patterns. Our results show that as long as there is sufficient access to irrigation water, there is little incentive to change current practices, as farming is at the economic optimum, has a positive soil organic matter balance and labor requirements can be met. Conversely, if irrigation is no longer possible, drastic impacts occur, causing a need to sustainably adjust on-going farm practices. Adaptation through changed crop selection reduced losses to some extent. We conclude that the use of bio-economic models can assist in evaluating the qualitative findings of participatory studies by quantitatively assessing possible climate change impacts and adaptation measures. Strong impacts of climate change, however, cannot be offset by changes in cropping patterns and need further adaptation measures.

1. Introduction

Climate change is one of the major environmental problems of the 21st century that will strongly influence global agricultural production, mainly due to ever-increasing temperatures and fluctuating precipitation patterns across different regions of the globe [1,2]. Globally, there has also been an increasing spatiotemporal trend in the occurrence, intensity and duration of heatwaves, droughts and unpredictable heavy rainfalls attributed to climate change [3]. Europe experienced an increase of annual mean temperature of 0.9 °C during 1901–2005, with a mean trend of +0.4 °C/decade toward the end of the period, and an increase of warm extremes has been reported as the cause of increased temperature [4]. Precipitation decreased in the Mediterranean as opposed to an increase in most of the Atlantic and northern Europe, although rainfall intensity increased throughout Europe, often leading to summer floods [5]. In northern Europe, such changes in regional climates are expected to impact agriculture positively, with rising crop yield levels and enlarged possibilities for new crops, while for southern Europe impacts are expected to be negative [6,7].
Agricultural production in southwestern France exhibits an uncertain future due to climate change, and especially increasing temperatures, decreasing rainfalls and less crop water availability. Groundwater recharge in this region is likely to decrease by 50% in the future [8]. A considerable decrease in water availability is expected, since warmer and drier conditions are projected that will lead to more frequent and longer summer droughts [9]. As a consequence, an appropriate water supply to compensate future higher crop irrigation requirements will not be met [10]. A complete ban on irrigation in the region may be a potential future scenario, shifting the systems under rainfed farming. Against this background, there is a need to quantitatively assess the impacts of climate change at farm level and suggest subsequent adaptation options for the farming systems in the region.
Willaume, Rollin and Casagrande [10] worked with a group of farmers in southern France within a participatory research setting to analyze and design adaptation strategies to climate change. Based on a series of interviews and workshops held with active farmers, the authors developed certain adaptation strategies describing them as exploratory and exploitative. Exploratory strategies featured important changes in crop choices, while exploitative measures were characterized by small modifications in current cropping systems that were assumed to be already adapted to future heat and water stresses. With regard to irrigation water use, they categorized the farmers into two types: (i) “Non or hardly irrigating farmers”, who assumed that their current cropping systems are already being adapted to the changing local climatic conditions. These farmers appeared to be cognizant of climate change, and for them adaptation comprises already known management practices. (ii) “Irrigating farmers”, on the other hand, adapt by substituting climate sensitive crops or by adjusting farm practices. Yet most farmers stayed within known patterns of current cropping choices and economical and technical constraints [10] in order to avoid the adverse effects of the shortage of irrigation water on their farms. The study by Willaume, Rollin and Casagrande [10] was primarily qualitative in nature, as the analysis and subsequent findings are based on farmers’ views on the adaptation to their regional changing climate, collected through face to face interviews and group discussions. Therefore, a quantitative study is useful to analyze the possible impacts.
The extent to which a system is affected by climate change depends on its exposure to climate change, its sensitivity and its adaptation potential [11]. Exposure is defined as the nature and degree to which a system is exposed to climatic variations, while sensitivity is the degree to which a system is affected, either adversely or beneficially, by climate-related stimuli [11]. Adaptation potential is seen as the ability and responsiveness of a system in taking appropriate actions to adjust and adapt to the actual or future changes and effects caused by climate change [12]. Therefore, in order to cope with the adverse effects of climate change, there is a need to not only have knowledge of the exposure and sensitivity of farming systems, but also to assess climate change impacts quantitatively and to suggest appropriate adaptation options.
Mechanization, intensification and specialization radically changed farming systems throughout Europe in the past century [13]. The introduction of technology such as chemical fertilizers, improved varieties and irrigation, in combination with a growing access to mechanization, enabled large improvements in productivity and labor-efficiency [14], but led at the same time to an increasing reliance on external and often non-renewable resources [15]. As a result of these developments, highly specialized agricultural systems emerged, often located in concentrated agricultural landscapes that are potentially vulnerable to the adverse effects of climate change [7]. Coping with the negative effects of climate change asks for effective responsiveness and adaptation in order to sustain agricultural productivity. This has been recognized by researchers and the farming communities alike, as a wide array of adaptation measures already exists [4,16,17]. Short-term adaptation could include changes in crop species or changes in sowing and harvesting dates, while long-term adaptation requires structural changes of the farming system, new land management techniques to conserve water, increased irrigation use efficiencies (or breeding of new crop varieties, which is beyond the farm scale) [4,18,19]. From a farmer’s perspective, the short-term options often seem more obvious and feasible, although in the long run a variety of adaptation options may be taken into consideration.
The main aim of our study is to quantitatively assess the impacts of a lack of irrigation under future climatic conditions for a typical arable farm in southern France and to compare our analytical findings with those of Willaume et al. (2014) and other qualitative research findings on adaptation by using a bio-economic model-based approach.
In undertaking this study, we assumed a difference between farm adaptations suggested by models based on specific objectives and those obtained by a more qualitative interaction with farmers, and thus a further room for discussion on future adaptation options. We analyze the impacts of climate projections starting from the current conditions, with irrigation, toward future conditions with and without the possibility to irrigate, assessing how a lack of irrigation water would affect the farming system. We simultaneously suggest possible adaptation options inferred from the quantitative impact estimations.

2. Materials and Methods

2.1. General Approach

In our approach, exposure and sensitivity to the effects of climate change are reflected in the changes of crop yields and water requirements which are introduced as external variables, taken from the soil-crop model STICS (step 1, see data). All other steps (modeling of the farm, optimization of the farm activities and assessment and visualization of the results) are part of the bio-economic models. Socio-economic and biophysical objectives and constraints (i.e., profit, soil organic matter, labor) are taken into account with a focus on short-term adaptations to changing climatic conditions at farm level (esp. water availability and temperature). These indicators reflect an economic, ecologic and social set of sustainability dimensions. Short-term adaptations are easy to implement by farmers without investing in new technologies. To this end, we compare the results of a baseline farm configuration in terms of operational profit, organic matter balance, workload and water use to present (irrigated) and future (irrigated or rainfed) scenarios. This comparison allows for an impact assessment by estimating the losses or gains under present and future scenarios. Large impacts mean that the farming system faces strong changes, and stronger adaptation will be required to adjust the farming system to the new situation.

2.2. Model Descriptions at Farm and Field Level

2.2.1. Bio-Economic Farm Models

To evaluate the effects of climate change and the lack of irrigation water, we used the bio-economic farm models FarmDESIGN [20] and MODAM [21], and applied them to the data of a typical farm in southwestern France. We expected the models to provide complementary strengths in generating informative results on assessing the impacts and suggesting region- and farm-specific adaptation options simultaneously [22].
A number of different approaches have been applied for the assessment of economic and environmental effects of adaptation on new frame conditions (e.g., climate change) at farm scale. Payraudeau and van der Werf [23] reviewed different methods, including bio-economic farm models (BEFMs), multi-agent systems, environmental risk mapping, life cycle analysis, environmental impact assessment and agri-environmental indicators which are applied within different contexts and for varying purposes. With a focus on BEFM, Anderson, et al. [24] highlight the advantage of BEFM as a method of constrained optimization, which appears to match the reality of farmers striving, with limited resources, to improve their livelihood. The numerous activities, restrictions and new production techniques of farms can be considered simultaneously, including linkages between crop and livestock production [21]. For an overview of BEFM used for mixed farming systems, see [22].
We optimized the crop choice, irrigation use and land allocation as adaptation options for the modeled farm from the southwest of France under different climate scenarios to assess the impact of changing yields and a lack of water, using both models. These adaptation options for the farm to these climate-driven changes were evaluated based on a set of three main indicators: operating profit (total gross margin), soil organic matter and labor use. We allowed for changes in crop choice and in the area of each crop in the rotation. Crops and their acreages are “decision variables” for the optimization of single (MODAM) or multiple (FarmDESIGN) objectives: (i) maximize operating profit (MODAM and FarmDESIGN) and (ii) maximize organic matter balance, minimize labor use and minimize water use (FarmDESIGN). Table 1 provides an overview of the main elements of both models.

2.2.2. FarmDESIGN

FarmDESIGN is a static multi-objective whole-farm optimization model [20], with calculations on an annual basis. The model starts from a quantitative representation of the current farm configuration and its performance in terms of a set of indicators describing, amongst others, nutrient balances and flows, labor balance, soil organic matter balance and operating profit. Farm structural variables can be set as decision variables for optimization, while indicators can be used as objectives or constraints. Evolutionary optimization is used to explore alternative farm configurations that simultaneously meet two or more objectives within the set boundaries. The heuristic optimization algorithm (differential evolution, [25]) uses a Pareto-based ranking method to reduce the multi-objective space into a one-dimensional decision problem. The model has been used to assess opportunities for increasing economic and environmental farm performance [20], for understanding farm resilience and vulnerability and for exploring options for improving farm livelihoods [12].

2.2.3. MODAM

MODAM is static bio-economic farm model which uses mathematical programming to find an optimal farm organization based on the optimization of one objective, while secondary objectives can be considered through trade-offs. It also works on an annual basis. Within the model, the farm is described in detail by the possible farming activities, a given set of resources and restrictions (e.g., the available on-farm labor, farm size and crop rotation constraints). Furthermore, environmental, social and economic indicators can be linked to the farming activities, reflecting the impact of a given farm organization on these indicators [26]. The model approach is based on the assumption that a farmer tries to maximize profits (or other goals) while taking into account the farm resources and other restrictions (such as phytosanitary cropping rules). The model has been used in various studies—for instance, to evaluate the effect of new agricultural policies on farm organization, production orientation and environmental outcome [26] and to test the economic performance of environmentally friendlier farming practices [27].

2.3. Scenarios

Three scenarios were developed representing climate change alternatives and irrigation responses: (1) present climate with irrigation possible (‘2015 irrigation”), and a future climate with (2) irrigation possible (‘2085 irrigation”) and (3) only rainfed (‘2085 rainfed”). 2085 stands for the period yields were calculated (i.e., 2071–2100). In the scenario “2085 irrigation”, the same amount of irrigation water was assumed to be available as in the 2015 scenario, while under the “2085 rainfed” scenario irrigation was assumed to be no longer part of the farm’s options. Note that under the irrigation scenarios, rainfed cropping practices were also allowed, while in the rainfed scenario irrigated practices were excluded. In the irrigation scenarios, irrigated crops take fixed amounts of the available water budget; if this budget is used up, rainfed crops are the only remaining choice. Baseline cropping plans for each of the three scenarios served as starting points for the exploration of alternative farm configurations with both FarmDESIGN and MODAM, and the baseline is therefore used for the initialization of the models.
The economic objective in both models was the operating profit realized through a combination of cropping practices (gross margin including labor costs). Total farmer labor use (711 h per year derived from the 2015 baseline) was set as a maximum in MODAM and formulated as an objective to be minimized in FarmDESIGN. In the latter model, hiring external labor was allowed. As environmental indicators, we evaluated the soil organic matter balance (SOM) (to be maximized in FarmDESIGN, only observed in MODAM). Irrigation water use was constrained to the baseline level needed for irrigating current crops adequately. Crop areas were selected to optimize the objective(s), subject to the constraints. For “2015 irrigation”, a regionally typical set of crop shares was chosen as baseline, which included maize, winter wheat, sunflower and pea (Table 2). Limits were set on crop shares to avoid soil-borne pests, pathogens and weeds (Table 3). Since water is expected to be scarce in 2085, we restricted the water availability in the 2085 irrigation scenario to that in “2015 irrigation”, i.e., 80,000 m³ in total, equivalent to 80 mm/ha on average. This required the adjustment of the 2085 baseline crop shares, since irrigation demand in 2085 exceeded water availability as a result of higher evapotranspiration. For the baseline, the share of irrigated maize was decreased, and the shares of the remaining crops were increased (42 ha wheat, 30 ha irrigated maize, 19 ha sunflower and 9 ha pea). The same crop shares were then used as baseline in the “2085 rainfed” scenario (Table 2). Alternative farm configurations were evaluated for the above-mentioned objectives and compared with the baseline of the particular scenario and between the models.

2.4. Data

2.4.1. Crop Yields and Irrigation Requirements

The soil-crop model STICS [28] version 8.50 was applied using climatic data for the site of Carmaux (France) to predict crop yields and irrigation requirements. This site was chosen to select consistent climatic and soil data. Inputs to the model included daily minimum and maximum temperatures, rainfall, global radiation, average wind speed and average relative humidity for the period 2006 to 2100. These variables were extracted from projections (Météo-France/CNRM2014 experiment) of the regional climate model ALADIN [29] assuming representative concentration pathway (RCP) 8.5 [1]. Daily CO2 concentrations estimated from the RCP 8.5 projections were input to STICS. Average temperature increased from 11.4 to 14.1 °C, and rainfall slightly increased from 863 to 903 mm, while CO2 rose from 398 to 808 ppm. CO2 impacts on crop development were simulated as a factor affecting the crops’ radiation use efficiency based on crop type (C3 or C4). Future irrigation requirements were predicted by utilizing the STICS option to automate irrigation. Irrigation dates and amounts were calculated according to a fixed crop water stress threshold; 0.6 for winter crops and 0.3 for spring/summer crops. This index is not only based on the ratio of actual transpiration to maximum transpiration (stomatal stress), but also on conditions where leaf growth is already decreasing (see [28]). Minimum and maximum amounts of water applied per irrigation event were set to 20 and 40 mm, respectively. No upper total limits were set.

2.4.2. Farm Characteristics

Farm data were based on a typical arable farm with 100 ha of agricultural land, consistent with the farms of southwestern France [30]. The baseline farm system was assumed to have 40 ha irrigated maize, 36 ha wheat, 16 ha sunflower and 8 ha peas, based on agronomic expert knowledge from INRA Toulouse about common crop areas in southwestern France. The soil type was clay silt loam with 2.37% active organic matter and a soil pH of 8.2. We selected alternative crops that were already grown in the region or that were a) appropriate crops for improving the crop rotation or b) likely to be adopted after the effects of climate change. Yields for all crops were calculated with STICS both for the baseline year (2015) and the future year (2085), with and without irrigation.
In both models the possible crop shares were subject to phytosanitary crop rotation restrictions (Table 3) which are based on good technical practices in southern France. These restrictions serve as constraints in the models, so that no solution exceeding a certain crop share is feasible. As an additional crop share constraint in the 2015 scenario, one of the EU-CAP greening rules was applied, stipulating ≥ 8% of leguminous crops in order to be eligible for EU payments. Therefore, this minimum amount of leguminous crops (pea, faba bean, soybean) is needed in all solutions computed by the models. In the future scenarios, we assumed this rule would no longer apply. Apart from these constraints, all crop shares were assumed to be feasible, i.e., the farm area can be subdivided into any size, and a static one-year result was calculated.
Average crop yields for baseline 2015 were calculated by running STICS for the years 2006–2020. Yields for 2085 were calculated by averaging the simulation results over 2071–2100 (Table 4). The soil organic matter (SOM) balance was calculated over the top 20 cm. The balance was calculated as the difference between organic matter (OM) accumulation and loss. Organic matter accumulated on the farm is partly degraded. The rate of degradation is affected by the environment variables of soil texture, moisture availability and the average temperature. The organic matter input from crop residues depends on the effective organic matter input per crop and crop area. It was assumed that 80% of organic matter was degraded during the year after application, so that 20% (fraction 0.2) remains. For more details, see [20].

2.4.3. Costs and Gross Margins

Economic performance was expressed as the cumulative crop gross margins based on revenues (simulated yields x crop prices) minus variable costs. We assumed variable costs to change in proportion to the cultivated area, ignoring economies of scale. Prices for inputs and outputs were fixed to current average values. Fixed costs were excluded based on the assumption that they depend more on farmer long-term investment strategy than on production. Variable costs were attributed to cropping practices on a per hectare basis. Cultivation costs as well as labor input were calculated based on costs of contract work (tillage, seedbed preparation, sowing, fertilization, spraying, harvesting and irrigation) [32]. Labor costs were calculated using a rate of 18 euro/h for regular labor and 9 euro/hour for casual labor. On the farm, 711 h of own labor were available, which were not taken into account in the operational profit. Fertilizer costs comprised purchases of N, P and K. Fertilization amounts were based on the simulated yields for the current climate. N fertilization for future scenarios in this STICS version was not adjusted to potential yields, and thus does not differ for current and future mean yields. Irrigation equipment (if used) was assumed to be mobile (“traveling sprinkler”) and could be used on all fields of the farm. The resulting gross margins for rainfed and irrigated practices (also reduced by labor costs) are shown in Table 4.

2.5. Model Validation

For the model validation, we applied three evaluation criteria, as suggested in [33]:
  • Has the model been constructed with approved materials, i.e., approved constituent hypotheses (in scientific terms)?
  • Does its behavior approximate well what is observed in respect to real world observations?
  • Does it work, i.e., does it fulfill its designated task, or serve its intended purpose?
All coefficients of the farming practices (inputs for labor, machinery, fertilizers) for our models were taken from farm advisory data and correspond to the current farming practices. Observed yield data for the period 2011–2014 were compared to the estimated model outputs (see Table 4). Deviations between observed and modeled yields may be caused by the shorter time interval of observed yields, the difference between actual and modeled sites and the influence of pests which are not covered in most crop models. Water demands for irrigated crops were within the usual range and approved by regional experts from INRA Toulouse. All constraints incorporated in the models across the different scenarios are explicitly mentioned and discussed.
The observed shares of the most important crops in the region Midi-Pyrénées are shown in Table 5. Differences in the overall picture can be explained by different farm types in the region (livestock vs. arable farms, different soil conditions). The higher share of irrigated maize in the baseline of our study is also based on expert knowledge: Irrigation is mainly used for maize in the region. The baseline crop shares for the comparison of the 2015 baseline with 2015 irrigation have been approved by regional experts, and the rather small differences in the crop shares of the suggested and optimized baseline also serve as a validation of the models. This is because, except for the phytosanitary and CAP constraints, no further constraints were applied. Furthermore, Verburg et al. emphasize that “validation against past data should not be overstated because it risks ‘over training’ the models to a situation (in the past) that will never occur again (in the future)” [34].
The modeling approach of both models is generic and has been tested in a variety of other published, peer-reviewed studies. The hypotheses of rational behavior and profit maximization have been widely used to simulate farmers’ behavior, especially in developed countries where subsistence is not a part of the decision rules. Furthermore, Linear Programming (LP) is also used in actual farm management, which allows for the assumption that farmers, in the future, will tend to achieve the optimal outcome of the farm enterprise while maintaining a sustainable use of their resources. By applying two kinds of bio-economic models, we widened the range of plausibility, since FarmDESIGN also allows for a simultaneous observation of other objectives.
Overall, both models produced valid and plausible results that were approved by economic and agronomic regional experts.

3. Results

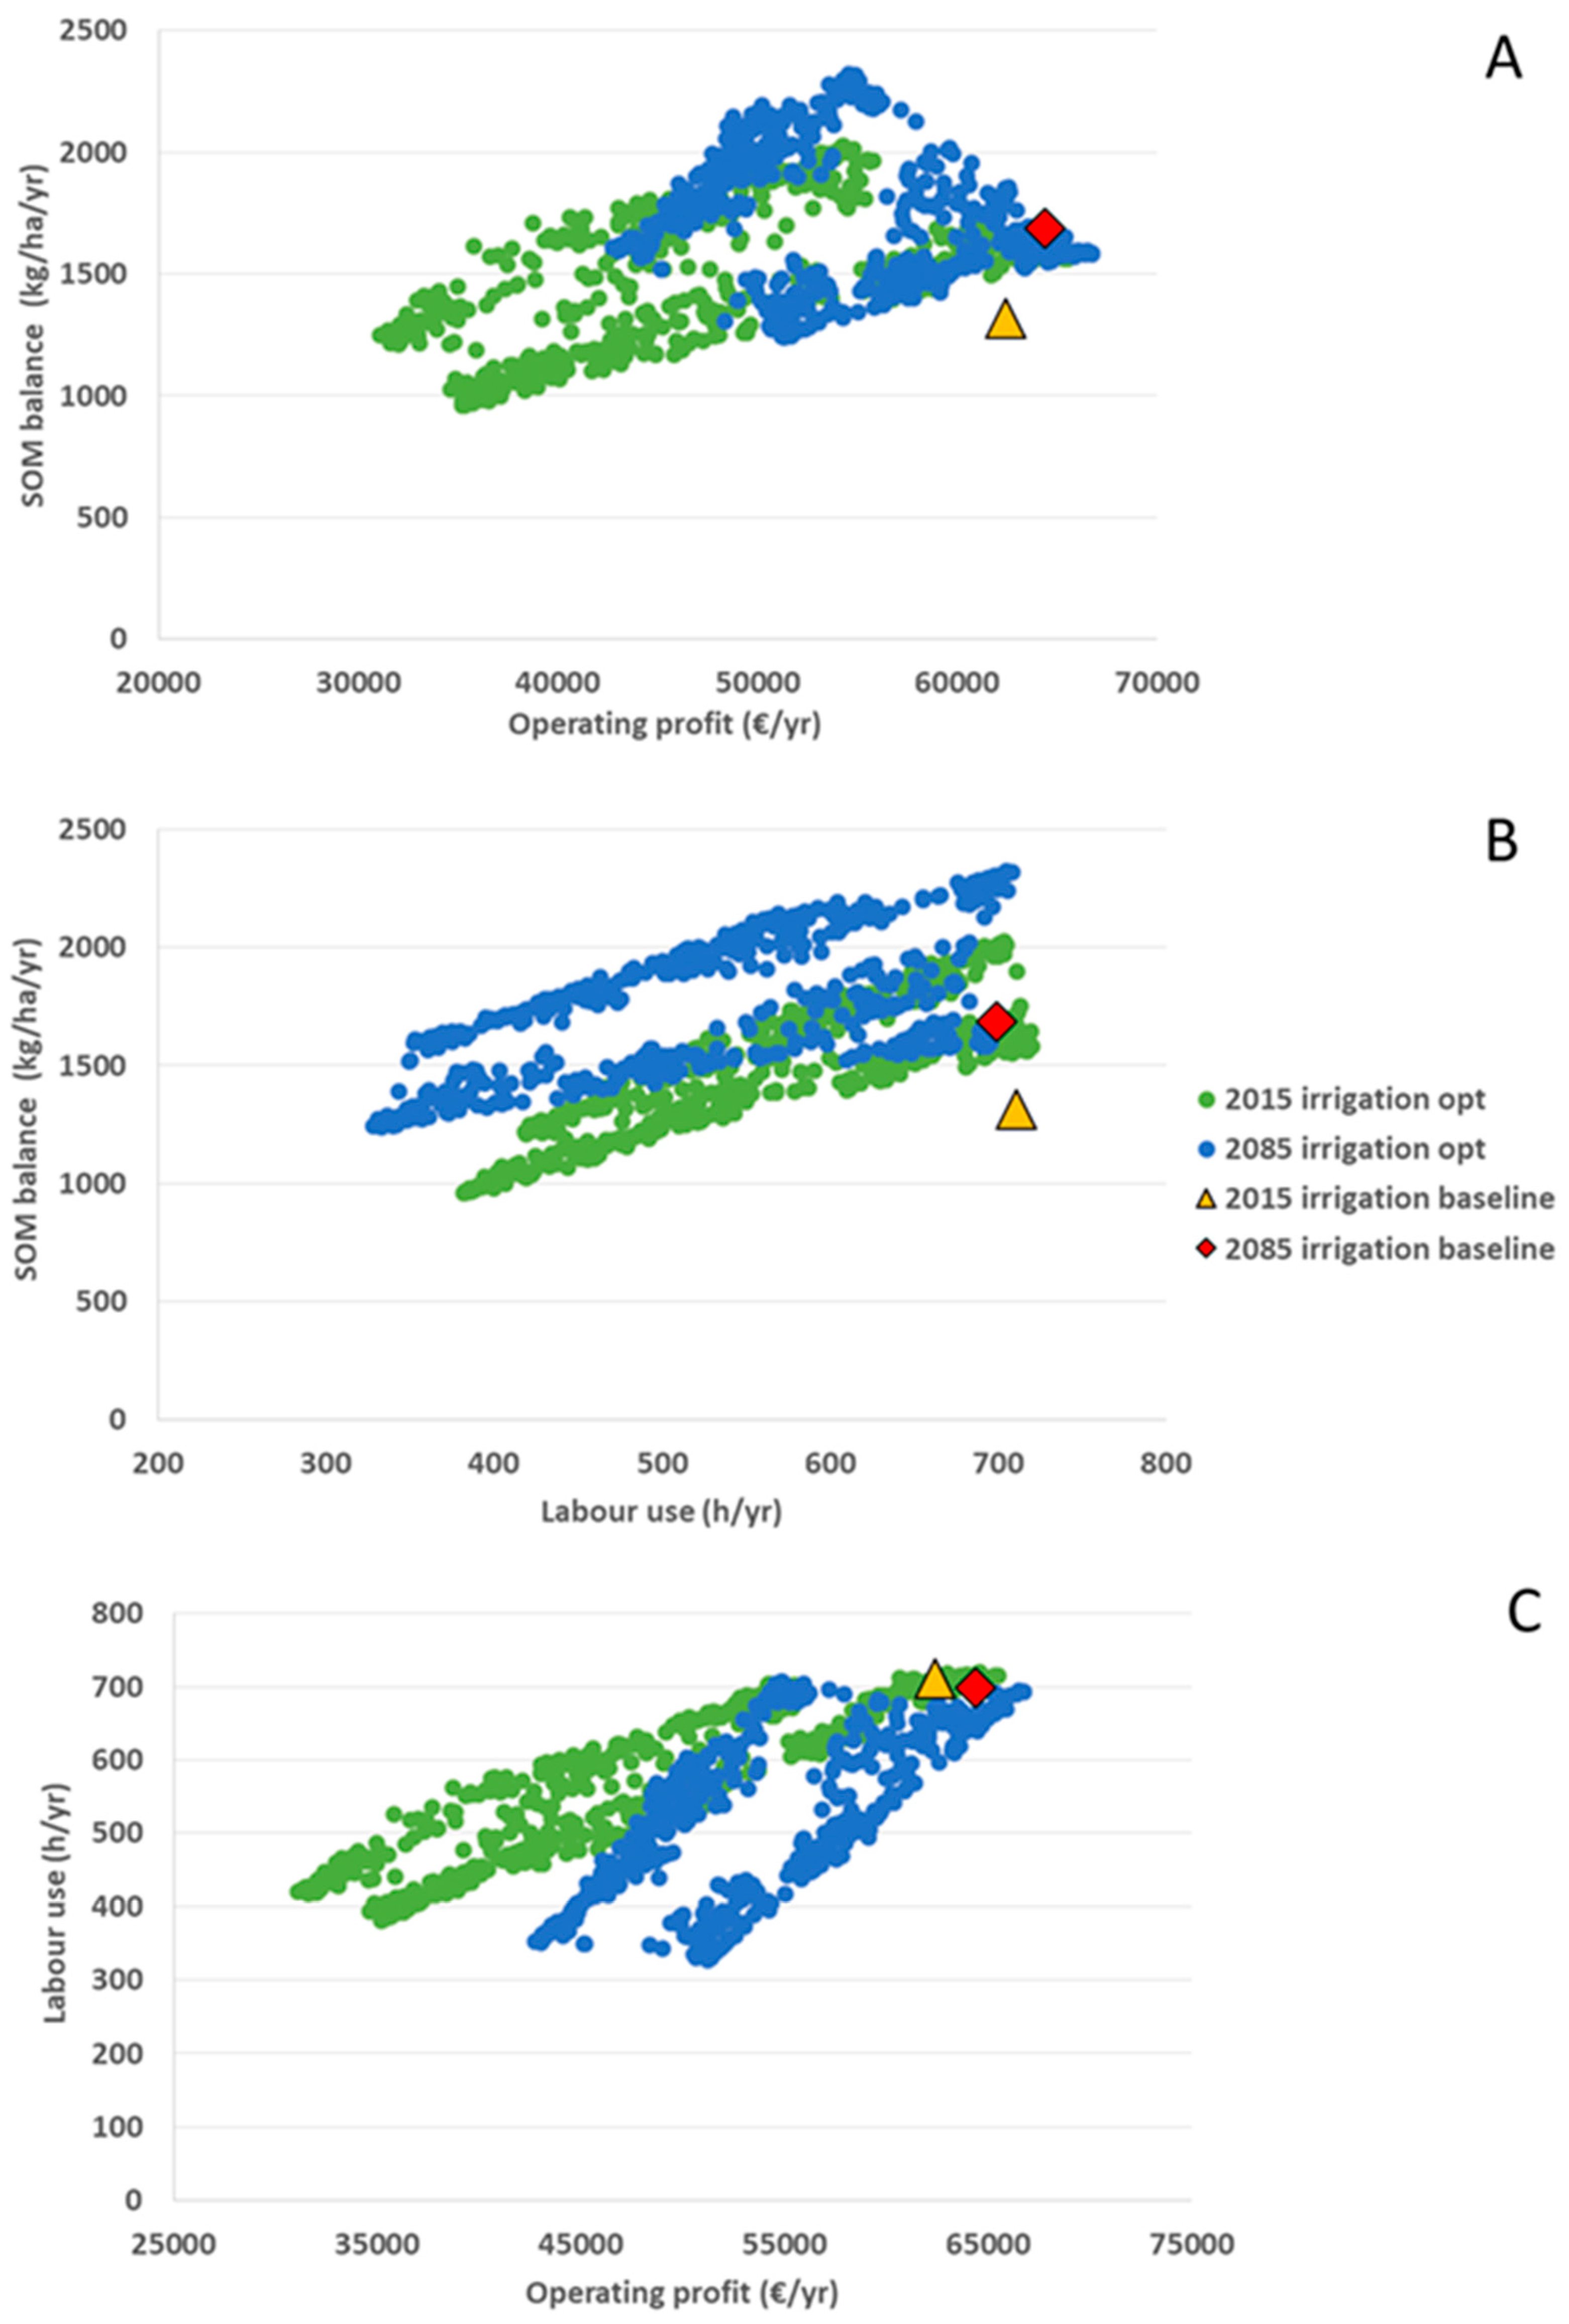
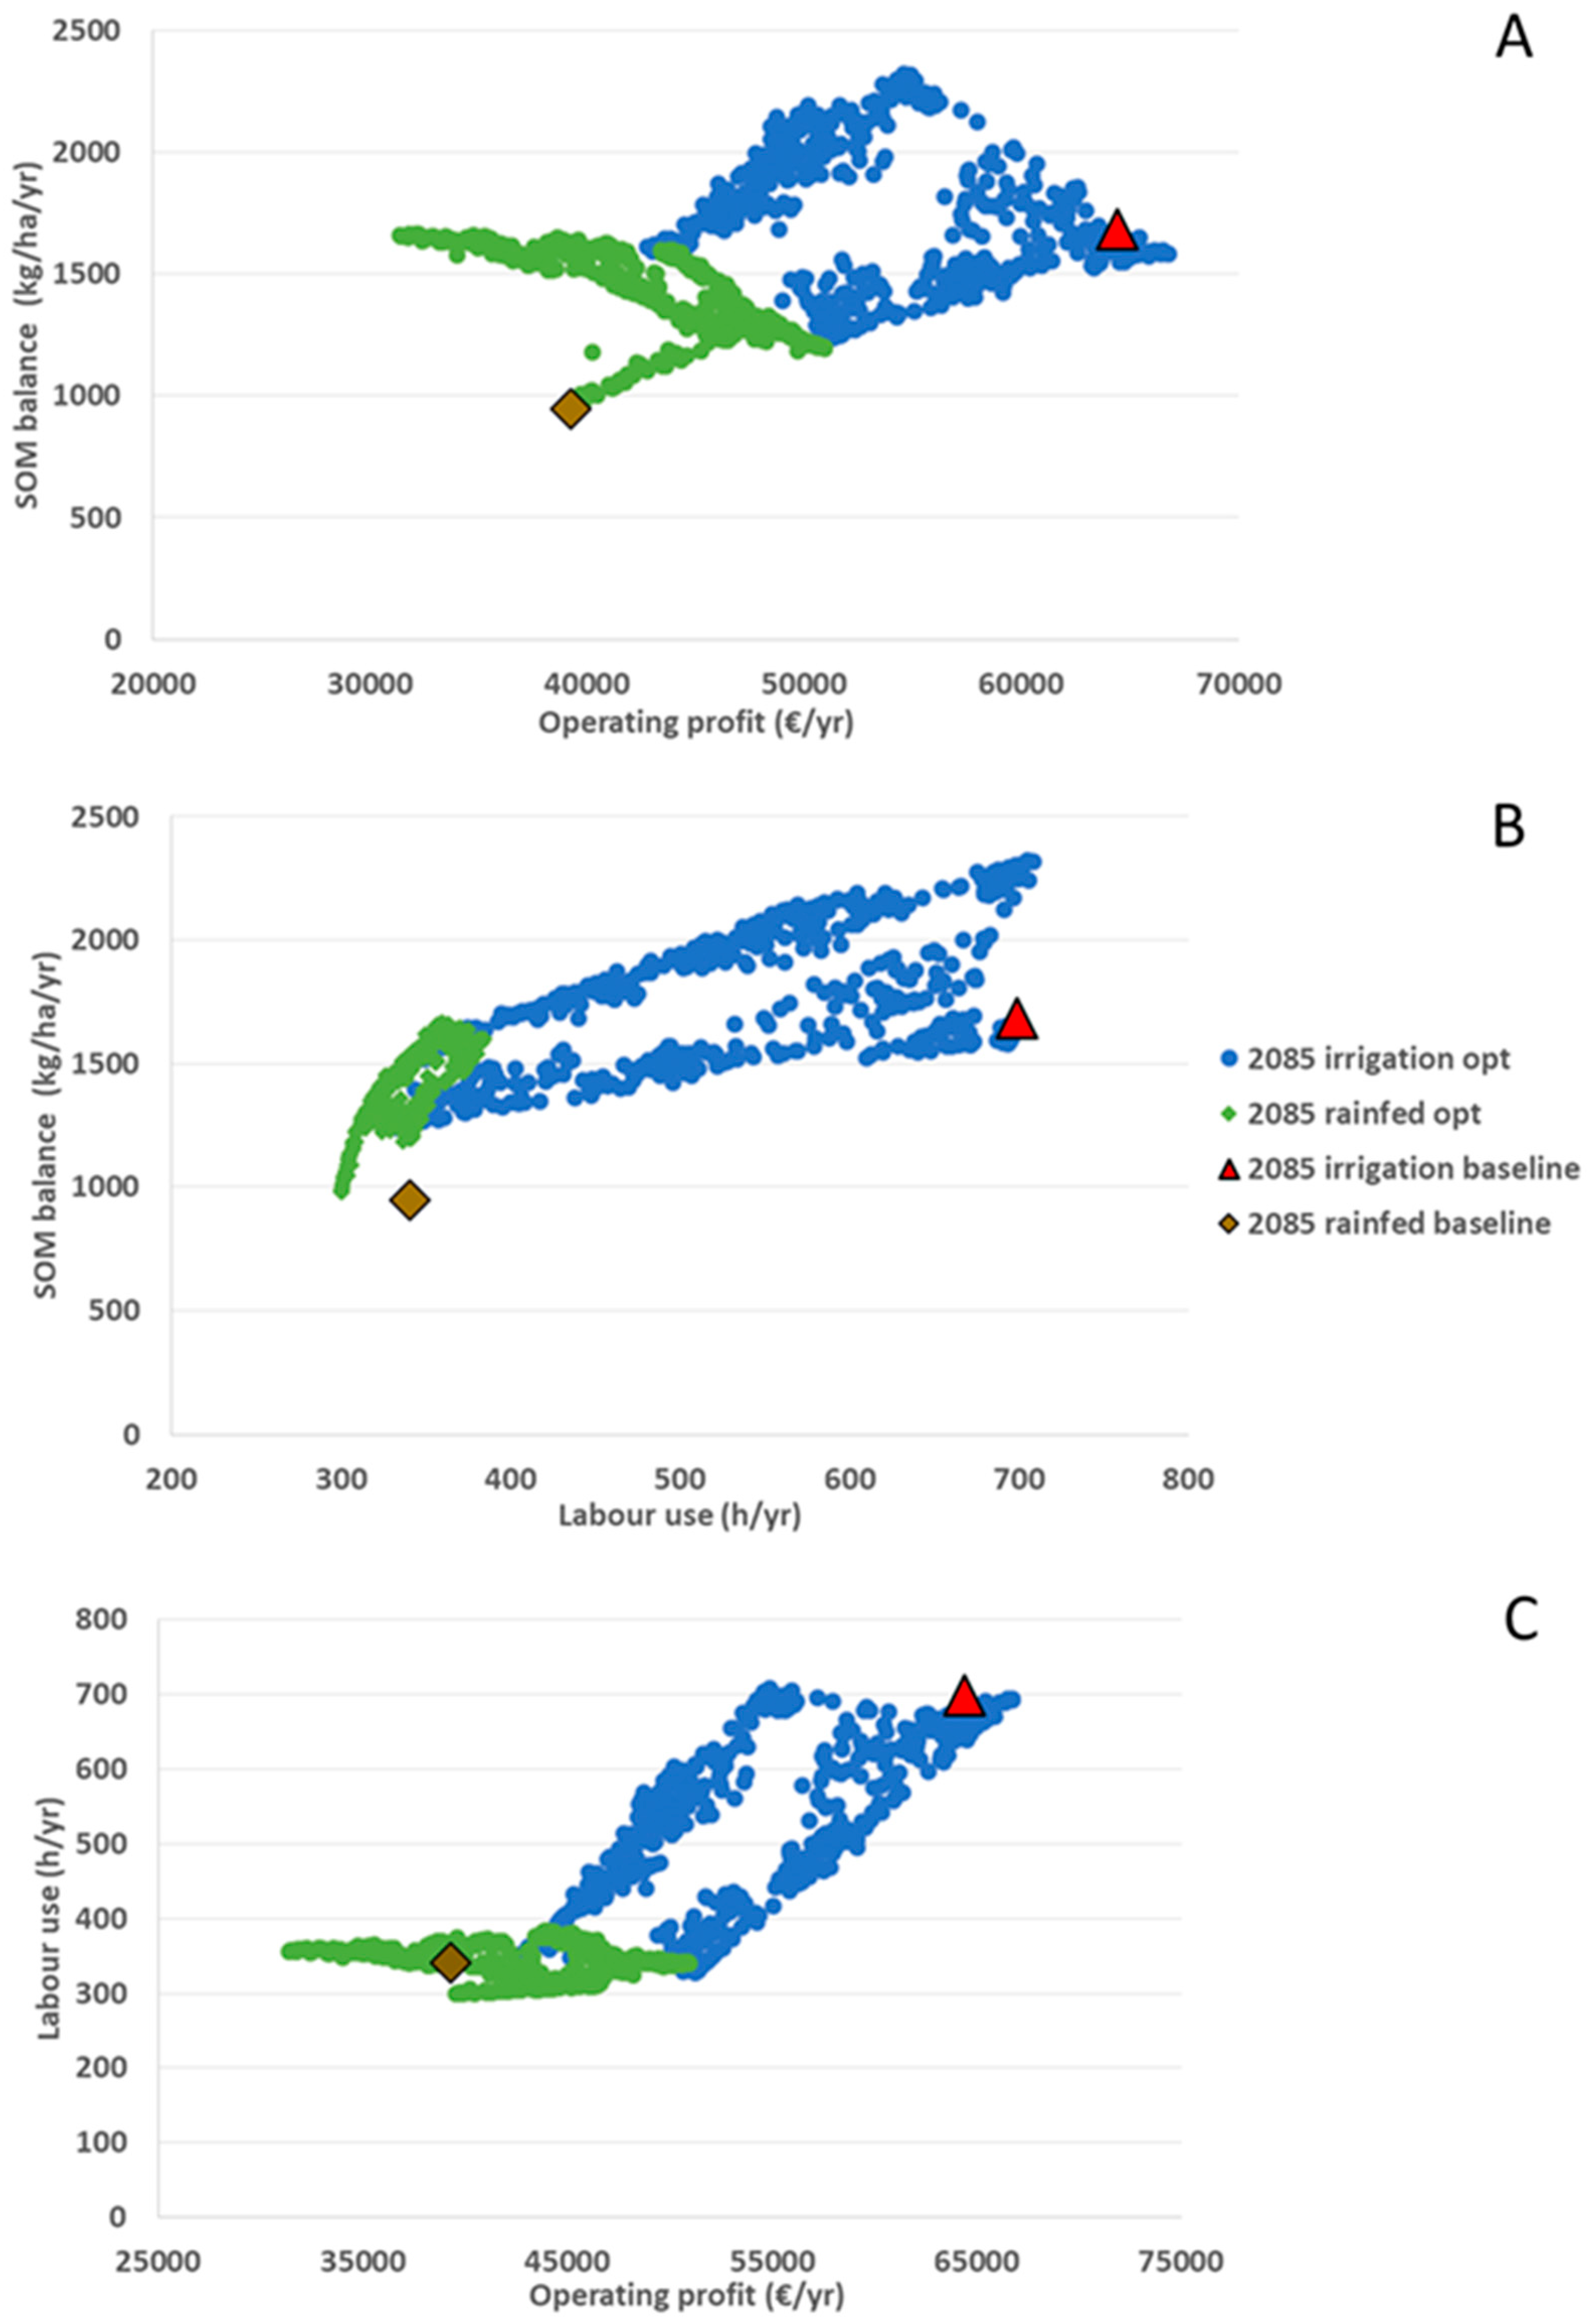
3.1. Impact of Climate and Water Availability Scenarios on Operating Profit, Soil Organic Matter and Labor Use

For 2015 climate with irrigation as an option (2015 irrigation) both optimization models found solutions slightly better than the 2015 baseline (see Table 2) in terms of economic performance (a gain in operating profit from 62,434 € to 65,485 € for FarmDESIGN, and 70,492 € for MODAM, respectively), showing that the 2015 baseline farm organization is close to the economic optimum (Table 6). The economic optimum can even be achieved with a higher SOM balance. Irrigation water was completely used under profit maximization conditions. When SOM balance was maximized, this came with a reduction of operating profit (54,261 €). If labor use was minimized, the operating profit was almost halved, and the SOM balance was reduced to 964 kg/ha/year.
When a similar farm organization from the 2015 baseline (now adjusted to higher irrigation needs due to climate change effects) was followed under the 2085 conditions (2085 irrigation), the operating profit would slightly increase (from 62,434 € to 64,410 €) due to higher yields in the future, when irrigation is still secured. Note that not exactly the same crop shares were realized due to the limited amount of irrigation water (see Table 2). Under the objective of profit maximization, this result would increase to 68,929 €, again with an increase in the SOM balance (Table 6; MODAM). Overall, as long as irrigation water was still available, the model results indicated only a slight reduction in operating profits, with similar results for SOM balance and labor use as compared to the 2015 scenario.
However, when irrigation was no longer possible (2085 rainfed), the farm would face serious losses if the same crops were to be grown as in the 2085 irrigation scenario. The operating profit would drop by almost 40%, to 39,279 €, together with a drop in SOM balance (−44%). However, with the reorganization of the crops, the economic losses could be reduced, resulting in a maximum profit of 51,454 € and a SOM of 1235 kg/ha/year (MODAM). Relative changes are shown in Table 7. For the 2085 rainfed scenario, it is obvious that the abolishment of irrigation reduces the labor input (−52%).

3.2. Impacts at Farm Level

The three-dimensional trade-off frontiers that result from the FarmDESIGN calculations are depicted in Figure 1 and Figure 2, together with the baseline results. In these figures, the farm’s adaptation options to changing yields caused by climate change and a lack of irrigation water were visualized. The given baseline situation can be improved toward either higher profits, a higher overall SOM balance or a reduced labor input.

3.2.1. Changes between Baseline 2015 and the “2015 Irrigation” Scenario

The reorganization of the farm portfolio can lead to optimized organic matter balance or labor use, but the maximization of these objectives is achieved at the expense of one of the other objectives. The objective space is bounded by a maximal envelope curve, depicting trade-offs between target variables (Figure 1). The baseline 2015 is not positioned on the trade-off curves for profit and SOM, which means that there was a high potential to increase profits and the SOM balance of the farm.

3.2.2. Adaptation Options in the “2085 Irrigation” Scenario

In Figure 1 A, the continued possibility for irrigation shifted the objective space toward higher profits and a higher SOM balance in the future, given the higher yields with irrigation. When labor input is shown against soil organic matter (Figure 1 B), the future scenario allows for a higher SOM balance compared to present levels. Similarly, in the future scenario, a shift toward higher profits with a given labor input was computed (Figure 1 C). Furthermore, within one scenario, it was possible to visualize the trade-offs between all indicators. For example, in Figure 1 A, starting at the maximum profit, a clear trade-off with SOM was calculated: increasing SOM is only possible with a reduction of profit. Values for the three objectives in baseline 2085 are similar to those of baseline 2015.
The difference in adaptation options between the “2015 irrigation” and “2085 irrigation” scenarios was small (reflected in the overlap of both clouds), indicating that the models could not identify configurations which improved the farming system in such a way that it performs much better on the objectives. However, compared to the alternatives computed by FarmDESIGN for 2015, optimizations for soil organic matter and labor balance showed better results on the other objectives. There is no solution outcompeting the baseline on the three target variables altogether, with the baseline for 2085 being on the trade-off curves of the solution space.

3.2.3. Adaptation Options in the “2085 Rainfed” Scenario

Figure 2 shows the possible trade-offs and objective spaces for both future climate scenarios (“2085 irrigation” and “2085 rainfed”). The lack of irrigation water in the “2085 Rainfed” scenario caused a drastic decrease in operating profits and SOM balance for the baseline solutions (Figure 2 A). The optimization process improved the results for both indicators, but the whole objective space for the “2085 rainfed” scenario stayed below the cloud drawn for the “2085 irrigation” options. Much less labor is needed, since labor-intensive irrigation is no longer available. However, it is apparent that for a wide range of profit levels, labor input stays relatively stable (Figure 2B,C). Yet in both future scenarios, optimization in both models helps to increase profits and SOM as compared to the baseline results.

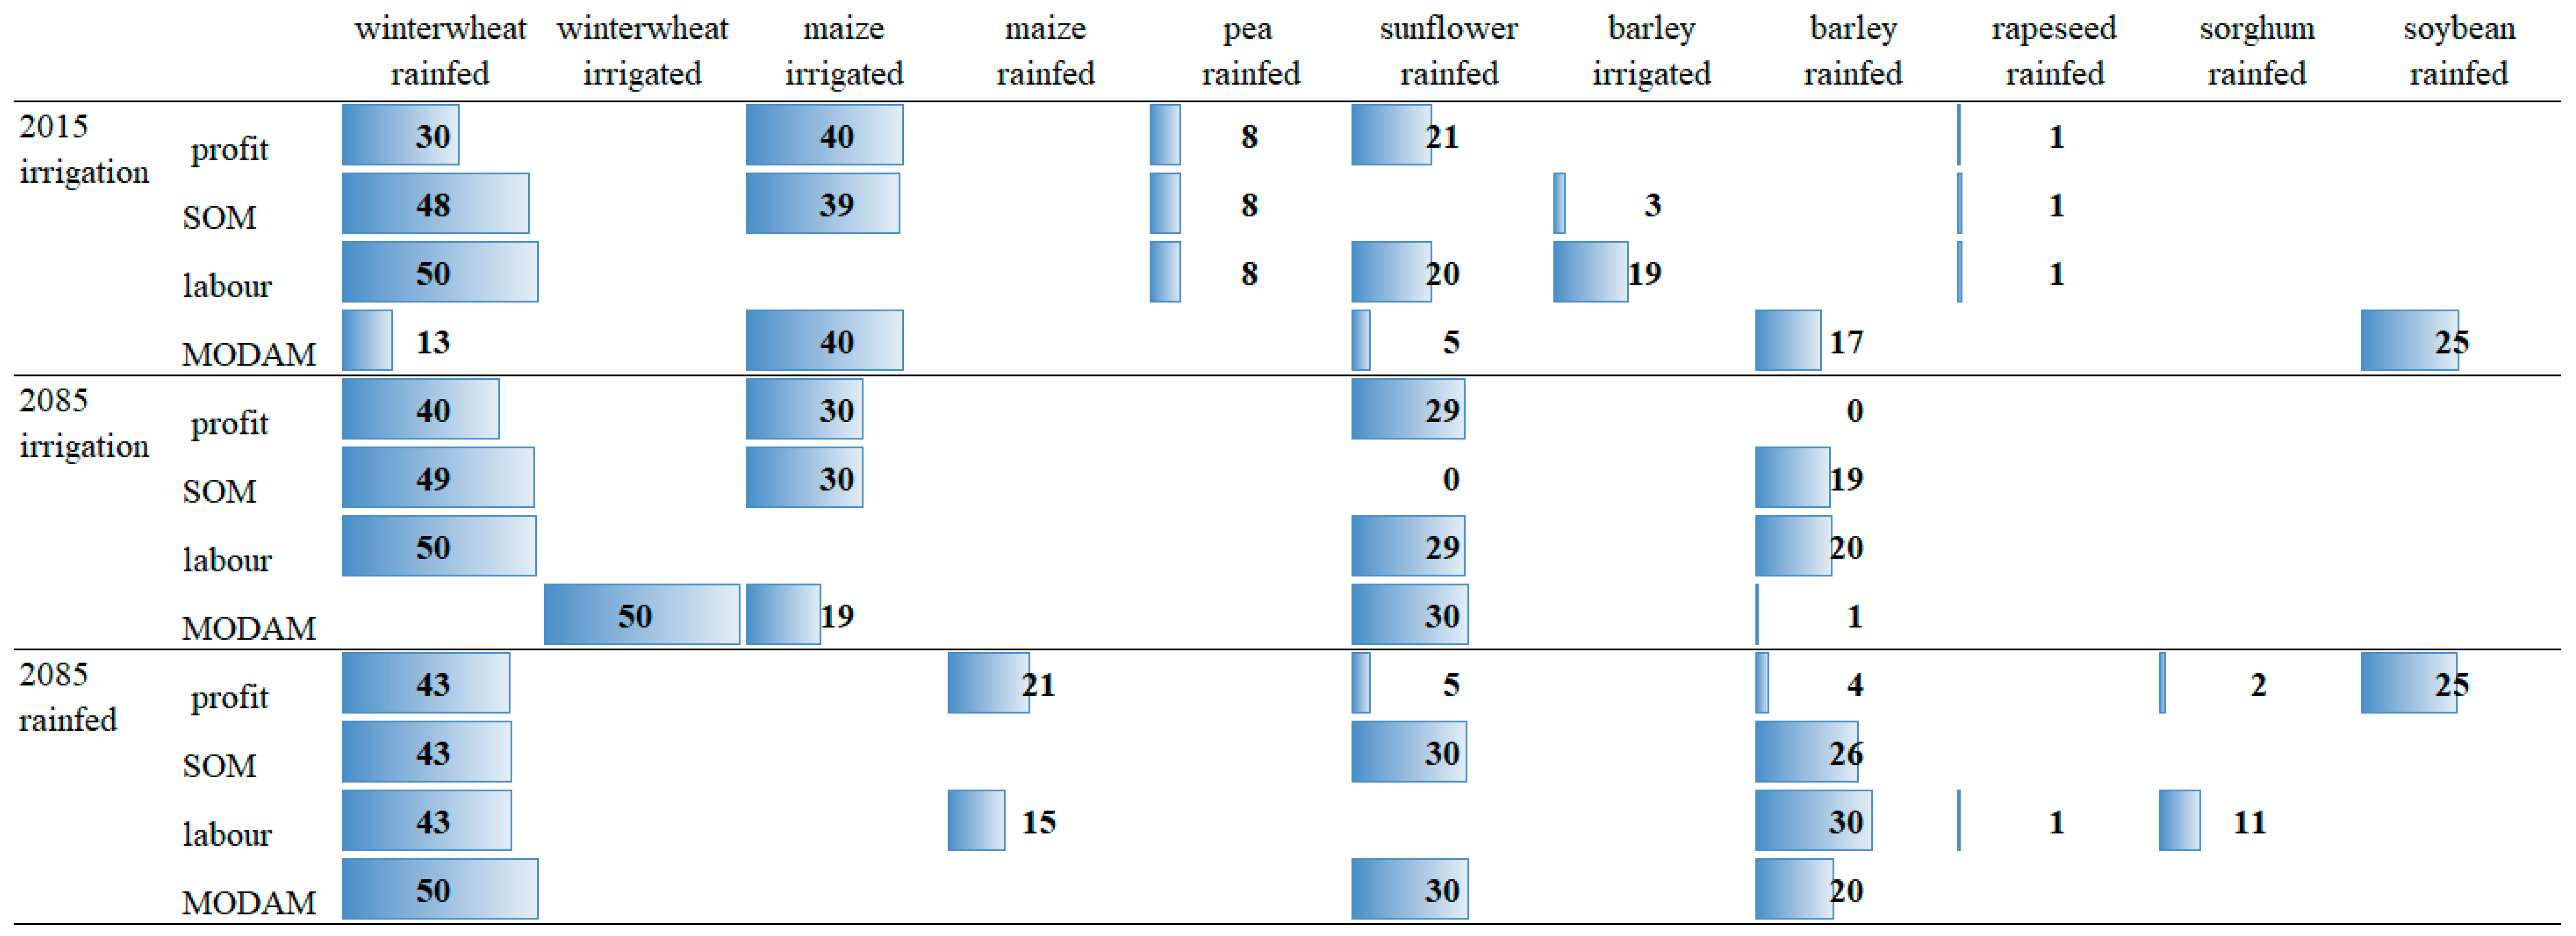
3.3. Optimal Crop Shares

Both models adapted differently to the new conditions for each scenario. Figure 3 shows the resulting crop shares that were chosen for the optimization of the objectives. For FarmDESIGN, the crop shares for maximum operating profit and SOM balance, as well as for the minimum labor input, are shown. For MODAM, the crop shares for profit maximization are drawn.
MODAM optimized the profits in the “2015 irrigation” scenario by using the crops with the highest crop margin, considering the crop rotation and irrigation water constraints. Therefore, the maize with the highest irrigation pay-off was provided with all irrigation water, while the remaining areas were used with the most profitable rainfed crops. In the same scenario, FarmDESIGN’s most profitable solution also focusses on irrigated maize, while an even more diverse crop share was kept due to the multi-objective optimization mode of this model. The maximum SOM balance was achieved through a higher share of winter wheat, and labor input was minimized by focusing on winter wheat and other cereals and a reduction of irrigation.
For the “2085 irrigation” scenario, rainfed winter wheat had a high share under all objectives in FarmDESIGN. When SOM was maximized, wheat increased and rainfed barley was introduced in the farming pattern. Minimized labor use resulted in a complete abandonment of irrigation. In the linear programming solution of MODAM, the irrigation water was divided up between wheat and maize, due to the higher water needs per crop in this scenario, which is no longer sufficient to irrigate the whole maize area.
Under the conditions of future climate and no available irrigation water (“2085 rainfed”), MODAM calculated the optimal crop share with mainly winter wheat, sunflower and barley. FarmDESIGN kept a share of winter wheat for under all considered objectives, with high shares of maize and soybeans for profit maximization and high shares of sunflower and barley for the highest possible SOM balance. Labor input was minimized by using maize, barley and sorghum.

4. Discussion

4.1. Model Results Versus Qualitative Findings

Willaume, Rollin and Casagrande [10] studied perceptions of French farmers on climate change adaptation and found that farmers with irrigation options were not led to change as long as there was sufficient irrigation water. In future scenarios with limited irrigation water availability, irrigating farmers did see the need to change their production portfolio in order to sustain their farm operations, while farmers with no or little irrigation found themselves already adapted to climatic changes. In this study, irrigated crop rotations were maize-based, and farmers seemed reluctant to substitute their most profitable crop. However, the rainfed crop sequences for the future suggested by the non-irrigating farmers did not include maize, and cereals were proposed instead.
Our model explorations confirmed the farmers’ perceptions in the study of Willaume, Rollin and Casagrande [10], according to which the 2015 baseline performed well on the objectives given that there was access to irrigation water. A sudden lack of irrigation water will cause a shock and raise the demand for an adapted crop-sequence, as shown in the “2085 rainfed” scenario. Both models showed that there is room for adaptation: a change of the crops grown could improve the results on the “profit” and “soil organic matter balance” indicators, with low labor use compared to irrigated scenarios. Our study showed that when profit maximization was the main objective, the crops selected for a rainfed situation were mainly wheat, barley and sunflower. In the results of FarmDESIGN where other objectives (labor, soil organic matter balance) were as important as operational profit, wheat and barley were supplemented with rapeseed, soybean, maize or sorghum in varying quantities. Nevertheless, with the crops and the corresponding assumptions and constraints we used, operating profits under rainfed conditions in the future will be much lower than in a future scenario with irrigation. To close this gap, alternative practices or sources of income need to be introduced.
Differences between farmers’ objectives as revealed in group discussions or in the actual behavior and optimized modeling results can be explained by the observation that farmers are “satisfiers” rather than optimizers [36]. Specific needs and preferences need to be satisfied, but less importance is given to maximizing individual objectives. In economic terms, reality is determined by bounded rather than by absolute economic rationality. Farmers’ decision making is driven by their personal objectives and potential risks.
For all scenarios, we can conclude that with irrigation there is little room to improve profits compared to the baselines of both 2015 and 2085. The results from the optimization in MODAM indicate that organic matter balance can still be increased compared to the baselines in 2015 and 2085. In contrast, under the future rainfed conditions, through the adaptation of crop choices, the extreme losses both for profit and SOM can at least be reduced. Overall, when the results from both figures (Figure 1 and Figure 2) are compared, irrigation plays a major role in offsetting the negative effects of climate change. A likely reduction of irrigation under future conditions most definitely reduces profits and soil organic matter. However, in all computed configurations the SOM balance stays well above zero, indicating a gain in organic matter.

4.2. Discussion of the Modeling Approach

BEFMs are able to reveal the impacts and point out the future prospective adaptation options simultaneously for policy makers and for farmers without relying strongly on past responses, as is the case with many statistical regression models. Instead, BEFMs are able to test the objective space provided by the resources of the farm and the technologies available. So far, the use of BEFMs for assessing the climate change impacts and adaptations has mainly focused on the agricultural adaptation to climate change, with a focus on yields and profit, but these optimized modeling results could deviate from farmers’ objectives or environmental goals. The implementation of adaptation strategies such as crop substitution could, for example, put pressure on environmental goods [3]. The analysis of such trade-offs is, therefore, an important step that needs to be included in an in-depth analysis of every adaptation strategy. In our analysis, SOM did not drop seriously with maximizing profit, but for other environmental goods this still needs to be accounted for.
From a modeling perspective, even though we use different models with different optimization algorithms, the results of each model are to some extent comparable. The typical expected behavior of both types of models did appear in this study: the heuristic algorithm applied in FarmDESIGN did not reach the optimization levels of the linear programming algorithm used in MODAM (see Table 6) [see also 37]. The character of linear programming models that often show an over-specialization toward a few activities [22] was only visible in the “2085 rainfed” scenario (see Figure 3). This is due to the fact that the constraints (e.g., on crop rotation requirements) applied to both models were sufficient for diversifying the solutions. An advantage of combining both approaches is that it allows for insights into what is possible in a single objective optimization limited by constraints and the multiple solutions generated by Pareto-optimization with multiple objectives. For example, the optimal solutions provided by MODAM can serve as a starting point for further exploration with FarmDESIGN (see Figure 1), a procedure that was also applied in Groot, Rossing, Jellema, Stobbelaar, Renting and Van Ittersum [37].
The limitations of our study lay in the fact that the only way for both models to implement adaptations to the change scenarios was to change crop species and adjust the irrigation of each crop. We only changed the expected yields of the possible crops based on climate change predictions, but did not adjust the way farmers might adapt to new climatic conditions, i.e., by changing sowing dates and density, or using different machinery or cultivars. Other adaptations to climate change may include soil tillage, type of crop and cultivar, sowing date and density, N fertilization and irrigation timing, amount and frequency, which offer a higher flexibility, especially when different adaptation measures are used in combination. Moreover, financial instruments such as crop insurance serve as potential instruments, instead of choosing only agronomic measures to adapt to the negative effects of climate change [38].
The number of crops used for adaptation was limited; five alternative crops were selected, which reflect the current options for farmers. The introduction of new crops is often not only a management-driven or economic decision, as farmers also need to improve their technological control of new crops (with limited access to knowledge or advice); see also the literature on legume lock-out which relates to the effects of specialization on certain crops in terms of knowledge, technology and value chains [39]. Furthermore, no cumulative effects or pre-crop effects were taken into account (for nitrogen fertilization, weed or disease control), which might improve the yields of specific crops. However, maximum crop shares were included in both models to prevent unrealistic solutions.
Uncertainty and risk were not considered in this study. Further studies may include uncertainty regarding yield, rainfall patterns, pests and diseases. Furthermore, we assumed future prices and costs to be unchanged, although (relative) changes in yields will change the relative prices of inputs and outputs depending on the price elasticities of each crop. Therefore, our results presuppose the farmers’ current farm management conditions. However, we purposely chose to have fixed cost and prices to de-correlate climate change from other global change drivers (i.e., induced price and cost changes).
Applying a single farm case study could be seen as limiting our study to a narrow perspective. Bozzola, et al. [40] applied a Ricardian analysis based on highly disaggregated land values for Italy, showing the effect of climate change on different farm types and also distinguishing between rainfed and irrigating farms. However, as the authors state, this approach implicitly estimates the effect of the possible adaptation derived from marginal land value changes. In this light, we argue that, given the purpose of our study, using a single farm approach with detailed data on cropping activities allows for a detailed understanding of how a farm reacts, as compared to applying a model based on aggregated panel data [41]. Moreover, it allows us to study the impact of each crop with its specific costs for inputs and labor, and the corresponding environmental effects, and to subsequently suggest crop- and farm-specific adaptation measures (e.g., SOM).

5. Conclusions

Our findings support the results of Willaume, Rollin and Casagrande [10] as to the way farmers perceive and plan to adapt to climate change. The impacts and adaptation options for farms were reflected in the relative changes of profit, soil organic matter balance and labor input. Our study also demonstrated how the use of bio-economic models can complement qualitative findings from participatory studies by quantitatively assessing possible climate change impacts and adaptation measures simultaneously, at the farm level.
Overall, our results showed that there was only little need for adaptation for a simulated model farm as long as there was sufficient access to irrigation water, thus supporting the findings of Willaume et al. [9] showing that the current farming systems in southern France are already well adapted to climate change. The simulated future scenario with possible irrigation (2085 irrigation) had only little impact on the farm configuration, and the adaptation steps were comparable: the model farm could sustain profit, soil organic matter balance and labor use without changing the cropping system compared to the “2015 irrigation” scenario.
In contrast, income, profit, SOM balance and labor input were strongly affected in the “2085 rainfed” scenario. The lower yields caused decreases in both profit and soil organic matter balance, but, as irrigation is labor-intensive, the absence of irrigation resulted in lower labor requirements. Sufficient adaptation options were not available for the farm to reach former levels of the targeted objectives. Production under rainfed conditions impacted the farm system as yields dropped, and profit and organic matter balance could not be sustained, but labor use decreased. A change of crops allowed for adaptation, but in order to sustain income alternatives, farming practices need to be explored. Therefore, in order to capture more radical adaptation options, new production systems need to be implemented. Otherwise, at least a partial abandonment of agriculture is the possible consequence in this region, which calls for early adjustments in the corresponding policies. Such adjustments could comprise the support for a gradual shift from irrigation to rainfed agriculture either through risk-mitigating agronomic (e.g., diversification) or financial instruments such as crop insurances. Regulatory policies could aim at a more efficient, targeted use of irrigation water to horticultural crops, avoiding the widespread use on arable crops. The same effect could also be achieved by increased water prices.

Author Contributions

Conceptualization, J.S., R.A.T., M.W., P.Z. and W.R.; methodology, J.S., R.A.T., M.W., P.Z. and W.R.; software, A.V., P.Z. and W.R.; validation, J.S., R.A.T., M.W., A.V. and N.S.; formal analysis, J.S., R.A.T., A.V. and N.S.; investigation, J.S., R.A.T., M.W. and N.S.; writing—original draft preparation, J.S. and R.A.T.; writing—review and editing, J.S., R.A.T., M.W., A.V., N.S., S.U., P.Z. and W.R.; visualization, J.S. and R.A.T.; supervision, P.Z. and W.R.; project administration, P.Z. and W.R.; funding acquisition, P.Z. and W.R. All authors have read and agreed to the published version of the manuscript.

Funding

This work received funding under the FACCE-JPI ERA-NET+ Project Climate-CAFE from different national funding bodies: the Federal Ministry of Education and Research (BMBF), Germany (grant PTJ-031A544), Agence Nationale pour la Recherche (ANR), France (grant ANR-14-JFAC-0001-0) and The Netherlands Ministry of Economic Affairs (contract br. 13000191089).

Acknowledgments

We would like to thank our colleagues Takamasa Nishizawa and Muhammad Arshad for having a final check on this manuscript, Kerstin Franke for hints on the graphic layout and Renate Wille for her Endnote advice.

Conflicts of Interest

The authors declare no conflict of interest. The funders had no role in the design of the study; in the collection, analyses, or interpretation of data; in the writing of the manuscript, or in the decision to publish the results.

References

  1. IPCC. Climate Change 2014: Synthesis Report. Contribution of Working Groups I, II and III to the Fifth Assessment Report of the Intergovernmental Panel on Climate Change; IPCC: Geneva, Switzerland, 2014. [Google Scholar]
  2. Calzadilla, A.; Rehdanz, K.; Betts, R.; Falloon, P.; Wiltshire, A.; Tol, R.J. Climate change impacts on global agriculture. Clim. Chang. 2013, 120, 357–374. [Google Scholar] [CrossRef]
  3. Steffen, W.; Richardson, K.; Rockström, J.; Cornell, S.E.; Fetzer, I.; Bennett, E.M.; Biggs, R.; Carpenter, S.R.; de Vries, W.; de Wit, C.A.; et al. Planetary boundaries: Guiding human development on a changing planet. Science 2015, 347. [Google Scholar] [CrossRef] [PubMed] [Green Version]
  4. Olesen, J.E.; Trnka, M.; Kersebaum, K.C.; Skjelvåg, A.O.; Seguin, B.; Peltonen-Sainio, P.; Rossi, F.; Kozyra, J.; Micale, F. Impacts and adaptation of European crop production systems to climate change. Eur. J. Agron. 2011, 34, 96–112. [Google Scholar] [CrossRef]
  5. Christensen, J.H.; Christensen, O.B. Climate modelling: Severe summertime flooding in Europe. Nature 2003, 421, 805. [Google Scholar] [CrossRef] [PubMed]
  6. Reidsma, P.; Ewert, F.; Lansink, A.O.; Leemans, R. Adaptation to climate change and climate variability in European agriculture: The importance of farm level responses. Eur. J. Agron. 2010, 32, 91–102. [Google Scholar] [CrossRef]
  7. Olesen, J.E.; Bindi, M. Consequences of climate change for European agricultural productivity, land use and policy. Eur. J. Agron. 2002, 16, 239–262. [Google Scholar] [CrossRef]
  8. Ministere de l’Ecologie, du Developpement Durable et de l’Energie. Hydrologie souterraine - Synthèse. Available online: https://www.gesteau.fr/sites/default/files/gesteau/content_files/document/explore2070-hydrologie-souterraine.pdf (accessed on 11 September 2020).
  9. Vidal, J.P.; Martin, E.; Franchistéguy, L.; Baillon, M.; Soubeyroux, J.M. A 50-year high-resolution atmospheric reanalysis over France with the Safran system. Int. J. Climatol. 2010, 30, 1627–1644. [Google Scholar] [CrossRef] [Green Version]
  10. Willaume, M.; Rollin, A.; Casagrande, M. Farmers in southwestern France think that their arable cropping systems are already adapted to face climate change. Reg. Environ. Chang. 2014, 14, 333–345. [Google Scholar] [CrossRef]
  11. IPCC. Climate Change 2001: Impacts, Adaptation, and Vulnerability: Contribution of Working Group II to the Third Assessment Report of the Intergovernmental Panel on Climate Change; Cambridge University Press: Cambridge, UK, 2001; Volume 2. [Google Scholar]
  12. Groot, J.; Cortez-Arriola, J.; Rossing, W.; Améndola Massiotti, R.; Tittonell, P. Capturing Agroecosystem Vulnerability and Resilience. Sustainability 2016, 8, 1206. [Google Scholar] [CrossRef] [Green Version]
  13. Jepsen, M.R.; Kuemmerle, T.; Müller, D.; Erb, K.; Verburg, P.H.; Haberl, H.; Vesterager, J.P.; Andrič, M.; Antrop, M.; Austrheim, G.; et al. Transitions in European land-management regimes between 1800 and 2010. Land Use Policy 2015, 49, 53–64. [Google Scholar] [CrossRef]
  14. Matson, P.A.; Parton, W.J.; Power, A.G.; Swift, M.J. Agricultural Intensification and Ecosystem Properties. Science 1997, 277, 504–509. [Google Scholar] [CrossRef] [PubMed] [Green Version]
  15. Pretty, J. Agricultural sustainability: Concepts, principles and evidence. Philos. Trans. R. Soc. B Biol. Sci. 2008, 363, 447–465. [Google Scholar] [CrossRef] [Green Version]
  16. Debaeke, P.; Aboudrare, A. Adaptation of crop management to water-limited environments. Eur. J. Agron. 2004, 21, 433–446. [Google Scholar] [CrossRef]
  17. Howden, S.M.; Soussana, J.-F.; Tubiello, F.N.; Chhetri, N.; Dunlop, M.; Meinke, H. Adapting Agriculture to Climate Change. Proc. Natl. Acad. Sci. USA 2007, 104, 19691–19696. [Google Scholar] [CrossRef] [PubMed] [Green Version]
  18. Esteve, P.; Varela-Ortega, C.; Blanco-Gutiérrez, I.; Downing, T.E. A hydro-economic model for the assessment of climate change impacts and adaptation in irrigated agriculture. Ecol. Econ. 2015, 120, 49–58. [Google Scholar] [CrossRef] [Green Version]
  19. Steidl, J.; Schuler, J.; Schubert, U.; Dietrich, O.; Zander, P. Expansion of an Existing Water Management Model for the Analysis of Opportunities and Impacts of Agricultural Irrigation under Climate Change Conditions. Water 2015, 7, 6351–6377. [Google Scholar] [CrossRef]
  20. Groot, J.C.J.; Oomen, G.J.M.; Rossing, W.A.H. Multi-objective optimization and design of farming systems. Agric. Syst. 2012, 110, 63–77. [Google Scholar] [CrossRef]
  21. Zander, P.; Kächele, H. Modelling multiple objectives of land use for sustainable development. Agric. Syst. 1999, 59, 311–325. [Google Scholar] [CrossRef]
  22. Janssen, S.; Van Ittersum, M.K. Assessing farm innovations and responses to policies: A review of bio-economic farm models. Agric. Syst. 2007, 94, 622–636. [Google Scholar] [CrossRef]
  23. Payraudeau, S.; van der Werf, H.M.G. Environmental impact assessment for a farming region: A review of methods. Agric., Ecosyst. Environ. 2005, 107, 1–19. [Google Scholar] [CrossRef]
  24. Anderson, J.R.; Dillon, J.L.; Hardaker, J.B. Socioeconomic modelling of farming systems. In Agricultural Systems Research for Developing Countries, Proceedings of an International Workshop, Richmond, NSW, Australia, 12–15 May 1985; ACIAR Proceedings Series; Australian Centre for International Agricultural Research, Hawkesbury Agricultural College: Richmond, NSW, Australia, 1985; pp. 77–88. [Google Scholar]
  25. Storn, R.; Price, K. Differential evolution–a simple and efficient heuristic for global optimization over continuous spaces. J. Glob. Optim. 1997, 11, 341–359. [Google Scholar] [CrossRef]
  26. Schuler, J.; Sattler, C. The estimation of agricultural policy effects on soil erosion--An application for the bio-economic model MODAM. Land Use Policy 2010, 27, 61–69. [Google Scholar] [CrossRef]
  27. Schuler, J.; Sattler, C.; Helmecke, A.; Zander, P.; Uthes, S.; Bachinger, J.; Stein-Bachinger, K. The economic efficiency of conservation measures for amphibians in organic farming - Results from bio-economic modelling. J. Environ. Manag. 2013, 114, 404–413. [Google Scholar] [CrossRef] [PubMed]
  28. Brisson, N.; Gary, C.; Justes, E.; Roche, R.; Mary, B.; Ripoche, D.; Zimmer, D.; Sierra, J.; Bertuzzi, P.; Burger, P. An overview of the crop model STICS. Eur. J. Agron. 2003, 18, 309–332. [Google Scholar] [CrossRef]
  29. Bubnová, R.; Hello, G.; Bénard, P.; Geleyn, J.-F. Integration of the Fully Elastic Equations Cast in the Hydrostatic Pressure Terrain-Following Coordinate in the Framework of the ARPEGE/Aladin NWP System. Mon. Weather Rev. 1995, 123, 515–535. [Google Scholar]
  30. RGA. Recensement Agricole. Available online: https://agriculture.gouv.fr/recensement-agricole-2010 (accessed on 9 June 2020).
  31. Préfet de la Region Occitanie. Application de l’équilibre de la fertilisation azotée - annexes de l’arrêté référentiel Midi-Pyrénées. Available online: http://www.occitanie.developpement-durable.gouv.fr/IMG/pdf/20151229_ap_ref-azote_annexes-compilees-final-3.pdf (accessed on 29 July 2020).
  32. APCA. Mutual aid and exchange rate scale, issue 2014-2015. Available online: https://www.terre-net.fr/ulf/data/Amelie/140829_bar%C3%A8mes_entraide_2015-15_grilles1.PDF (accessed on 19 November 2019).
  33. Parker, P.; Letcher, R.; Jakeman, A.; Beck, M.B.; Harris, G.; Argent, R.M.; Hare, M.; Pahl-Wostl, C.; Voinov, A.; Janssen, M.; et al. Progress in integrated assessment and modelling1A Summary of a workshop on Integrated Assessment and Modelling, held at EcoSummit 2000: Integrating the Sciences, Halifax, June 18–22, 2000. See Costanza and Jorgensen (2001) for a further report on Ecosummit.1. Environ. Model. Softw. 2002, 17, 209–217. [Google Scholar]
  34. Verburg, P.H.; Rounsevell, M.D.A.; Veldkamp, A. Scenario-based studies of future land use in Europe. Agric. Ecosyst. Environ. 2006, 114, 1–6. [Google Scholar] [CrossRef]
  35. Préfet de la Region Occitanie. Précédents mémentos de la statistique agricole d’Occitanie - Mémento 2016 - Donnés téléchargeables. Available online: http://draaf.occitanie.agriculture.gouv.fr/IMG/xls/memento2016pagesregionales_cle44c3e9.xls (accessed on 29 July 2020).
  36. Simon, H.A. Methodological foundations of economics. Praxiologics and the philosophy of economics; Transaction Publishers: New York, NY, USA, 1992; pp. 25–41. [Google Scholar]
  37. Groot, J.C.J.; Rossing, W.A.H.; Jellema, A.; Stobbelaar, D.J.; Renting, H.; Van Ittersum, M.K. Exploring multi-scale trade-offs between nature conservation, agricultural profits and landscape quality—A methodology to support discussions on land-use perspectives. Agric. Ecosyst. Environ. 2007, 120, 58–69. [Google Scholar] [CrossRef]
  38. Falco, S.D.; Adinolfi, F.; Bozzola, M.; Capitanio, F. Crop Insurance as a Strategy for Adapting to Climate Change. J. Agric. Econ. 2014, 65, 485–504. [Google Scholar] [CrossRef]
  39. Magrini, M.-B.; Anton, M.; Cholez, C.; Corre-Hellou, G.; Duc, G.; Jeuffroy, M.-H.; Meynard, J.-M.; Pelzer, E.; Voisin, A.-S.; Walrand, S. Why are grain-legumes rarely present in cropping systems despite their environmental and nutritional benefits? Analyzing lock-in in the French agrifood system. Ecol. Econ. 2016, 126, 152–162. [Google Scholar] [CrossRef]
  40. Bozzola, M.; Massetti, E.; Mendelsohn, R.; Capitanio, F. A Ricardian analysis of the impact of climate change on Italian agriculture. Europ. Rev. Agr. Econ. 2017, 45, 57–79. [Google Scholar] [CrossRef] [Green Version]
  41. Kanellopoulos, A.; Reidsma, P.; Wolf, J.; van Ittersum, M.K. Assessing climate change and associated socio-economic scenarios for arable farming in the Netherlands: An application of benchmarking and bio-economic farm modelling. Eur. J. Agron. 2014, 52, 69–80. [Google Scholar] [CrossRef]
Figure 1. Comparison of the present “2015 irrigation” and future “2085 irrigation” scenario results. Figures combine each baseline (starting points of the optimization) and the FarmDESIGN solution spaces (dots). Baseline performance in the “2015 irrigation” [triangle] and “2085 irrigation” [diamonds] scenarios. The clouds visualize the solution space for all indicators when adapting to the new situation. Part (A) shows trade-offs between SOM profit and labor, part (B) trade-offs between labor and SOM, and (C) shows trade-offs between profit and labor input.
Sustainability 12 07528 g001
Figure 2. Comparison of future “2085 irrigation” and future “2085 rainfed” scenario results. Baseline performance in the “2085 irrigation” [triangle] and “2085 irrigation” [diamonds] scenarios. The clouds visualize the solution space for all indicators when adapting to the new situation. Part (A) shows trade-offs between SOM profit and labor, part (B) trade-offs between labor and SOM, and (C) shows synergies between profit and labor input.
Sustainability 12 07528 g002
Figure 3. Optimal crop shares for different scenarios. For FarmDESIGN, results for each of the highest objective values are shown (maximized profit (€/year), max SOM balance (kg/ha/year), min labor input (h/year); for MODAM, maximized operating profit (€/year).
Sustainability 12 07528 g003
Table 1. Main elements of the whole-farm models FarmDESIGN and MODAM.
NameFarmDESIGNMODAM
CriterionStaticStatic
Multi-objectiveSingle objective with additional indicators
Whole farmWhole farm
Solver typeEvolutionary optimizationLinear programming
ObjectivesOperating profitOperating profit
Soil organic matterSoil organic matter (indicator)
Labor useLabor use (indicator)
Table 2. Description of crop and management choices for the model farm baselines in three scenarios. Each scenario represents a combination of climate and management options. Baselines serve as starting points for optimization.
ScenarioBaselineDescription
“2015 irrigation”Irrigated maize (40 ha); winter wheat rainfed (36 ha); sunflower rainfed (16 ha); peas rainfed (8 ha)Current climate; irrigation possible for all crops; all legumes can be cultivated to satisfy CAP greening rule (≥ 8% leguminous crop).
“2085 irrigation”Irrigated maize (30 ha); winter wheat rainfed (42 ha); sunflower rainfed (19 ha); peas rainfed (9 ha)Future climate;
irrigation possible for all crops; but rainfed crops are also possible.
“2085 rainfed”Maize rainfed (30 ha); winter wheat rainfed (42 ha); sunflower rainfed (19 ha); peas rainfed (9 ha)Future climate;
no irrigation possible.
Table 3. Phytosanitary crop rotation restrictions based on good technical practices in the region. In the model, crop shares were not allowed to exceed the maximum. For crops that multiplied Sclerotinia sclerotiorum, the total share of all affected crops could not be exceeded.
Crop/TypeMax. Share in Rotation
Barley0.3
Faba bean0.2
Maize1
Pea0.25
Rapeseed0.3
Sorghum 0.5
Soybean0.25
Sunflower0.3
Winter wheat0.5
Crops multiplying Sclerotinia sclerotiorum * 0.3
* Faba bean, pea, soybean, rapeseed, sunflower.
Table 4. Simulated average yields (Y) and gross margins (GM) per crop, labor input per crop (L) and water use per crop (W) based on STICS results for the different time series. “2015” and “2085” represent the current climate and future climate, respectively. Soil organic matter balance (SOM) values were calculated with FarmDESIGN [20]. Observed values are average yields for the Département Tarn for the years 2011 to 2014 [31]; note that observed yields can be rainfed and irrigated, except for maize, which shows irrigated yields in brackets.
ObservedRainfedIrrigated
Time Slot2011–142015208520152085
YYGMSOMLYGMSOMLYGMSOMLWYGMSOMLW
t/hat/ha€/hakg/haht/ha€/hakg/haht/ha€/hakg/hahmmt/ha€/hakg/hahmm
Crop
Barley4.96.223315854.56.321216494.56.824418606.9556.725718347.260
Faba bean1.82.5179–6173.73.5569–3623.72.9197–5157.1754.6455–828.4105
Maize6.9 (10.5)5.17997294.14.55884954.111.272319513.120010.6–34295716.0265
Pea3.33.6271–4564.25.3582–804.24.8132–1907.4706.74892309.8125
Rapeseed2.83.979887653.355554954.37068456.6353.64847136.125
Sorghum5.75.629214034.15.222212134.1815125429.91307.893244711.1155
Soybean2.83.1704–5952.32.9965–5622.34644–35810.21754.9568–3912.4225
Sunflower2.13.3689–7053.53.4712–6893.53.7678–6387.6903.8717–6228.0100
Winter wheat5.44.82245132.7647522242.75.71608455.665738428045.460
Table 5. Share of main crops grown in the Midi-Pyrénées region [35].
Crop% of Total Arable Land
Barley9.7
Maize irrigated9.5
Maize rainfed3.6
Rapeseed4.2
Sorghum2.6
Soy3.0
Sunflower20.3
Wheat27.2
Table 6. Results per indicator and scenario; baseline represents results for starting points in each scenario. 2015: original farm organization, 2085 irrigation: same crops as 2015 optimized, 2085 rainfed: same crops as 2085 irrigation. For FarmDESIGN, the corresponding indicator values for each optimum (profit, SOM, labor) are shown, for MODAM maximum operating profit.
ScenarioIndicator FarmDESIGN Results at Extreme Indicator ValuesMODAM
BaselineMax
Profit
Max
SOM
Min LaborMax Profit
2015 irrigation Operating Profit (€/year)62,43465,48554,26135,14970,492
SOM (kg/ha/year)1313156420279641432
Labor use (h/year)711717703381711
Irrigation water used (m³/year)80,00079,95879,98510,65580,000
2085 irrigation Operating Profit (€/year)64,41066,73454,55451,19768,929
SOM balance (kg/ha/year)16831586232412461772
Labor use (h/year)699694705328682
Irrigation water used (m³/year)79,50079,57679,86120580,000
2085
rainfed
Operating Profit (€/year)39,27950,91131,77439,79251,454
SOM balance (kg/ha/year)945119416679811235
Labor use (h/year)341341360300330
Irrigation water used (m³/year)00000
Table 7. Relative changes between scenarios for indicators, both for changes between baseline farm organizations as well as for maximized profits; for clarity, only MODAM results are shown.
Relative Changes from ScenarioIndicatorBaseMax Operating Profit
2015 irrigation to 2085 irrigationOperating Profit3%–2%
Organic matter balance28%24%
Labor use –2%–4%
Irrigation water used–1%0%
2085 irrigation to 2085 rainfedOperating Profit–39%–25%
Organic matter balance–44%–30%
Labor use –51%–52%
Irrigation water used–100%–100%

