Financial Development, Institutional Quality, and Environmental Degradation Nexus: New Evidence from Asymmetric ARDL Co-Integration Approach


Abstract
:1. Introduction
2. Literature Review
2.1. Financial Development and Environmental Sustainability
2.2. Trade Openness and Environmental Sustainability
2.3. Institutional Quality and Environmental Sustainability
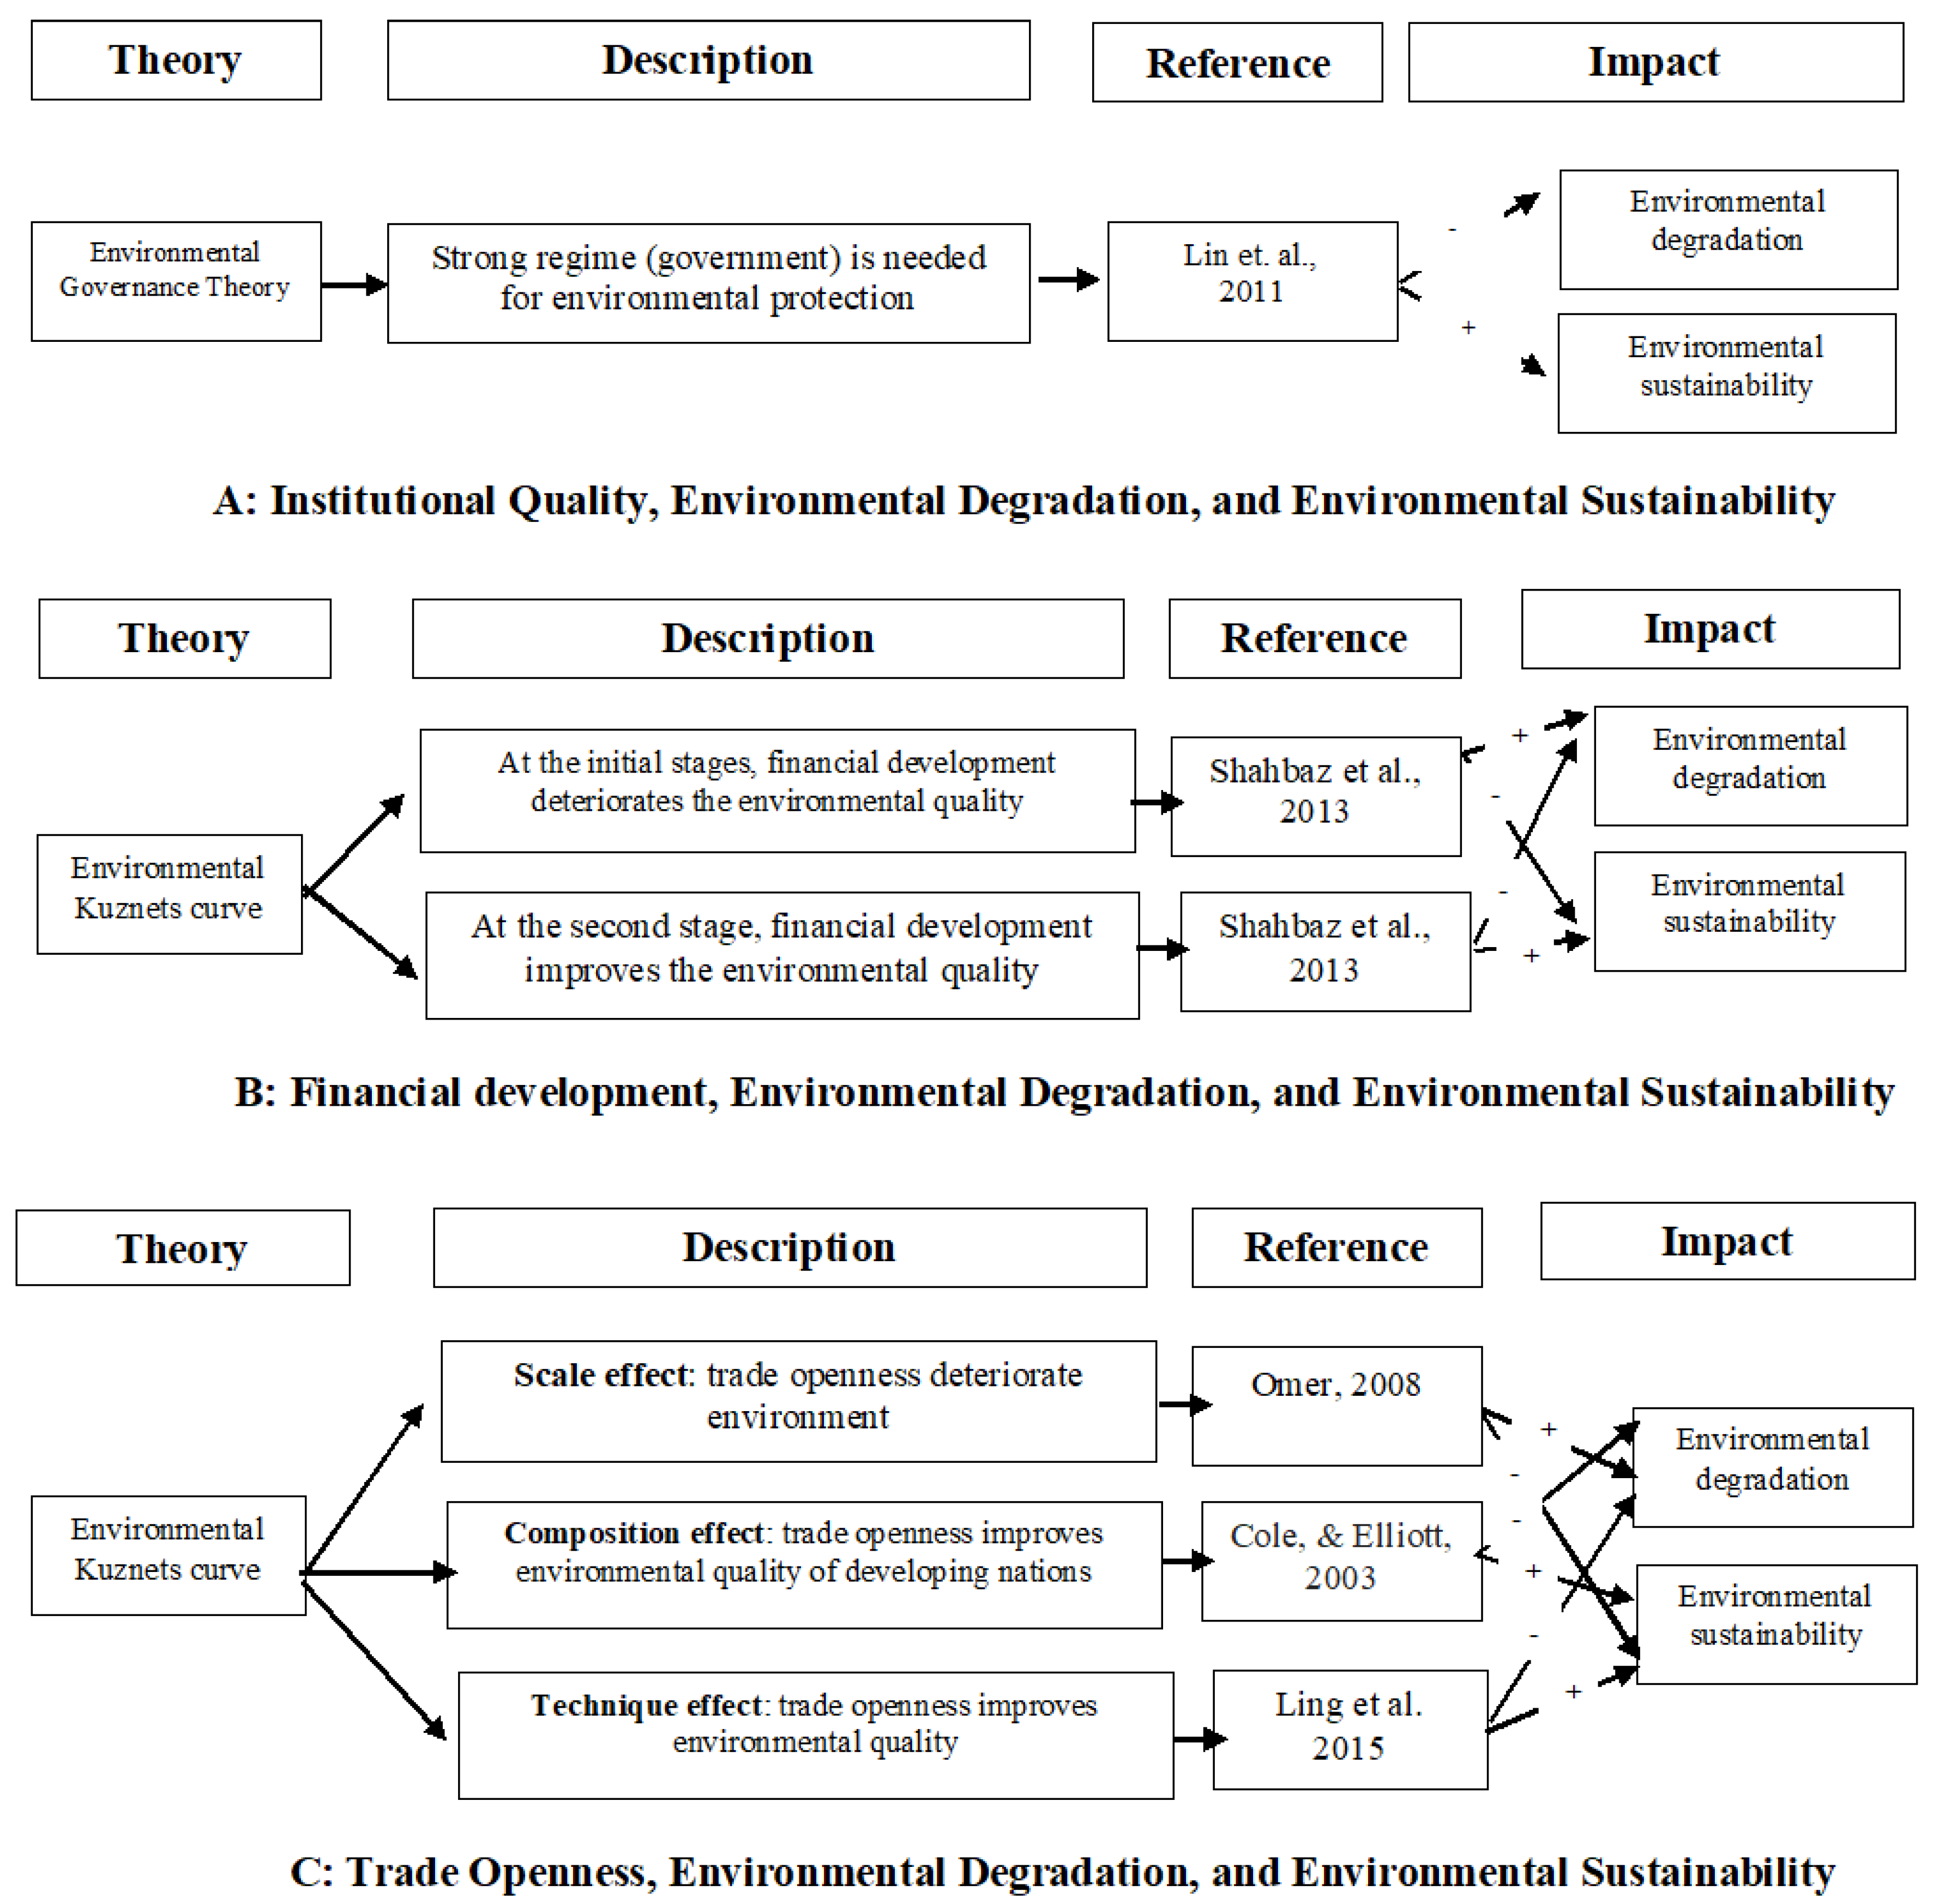
2.4. Conceptual/Theoretical Justification of the Study
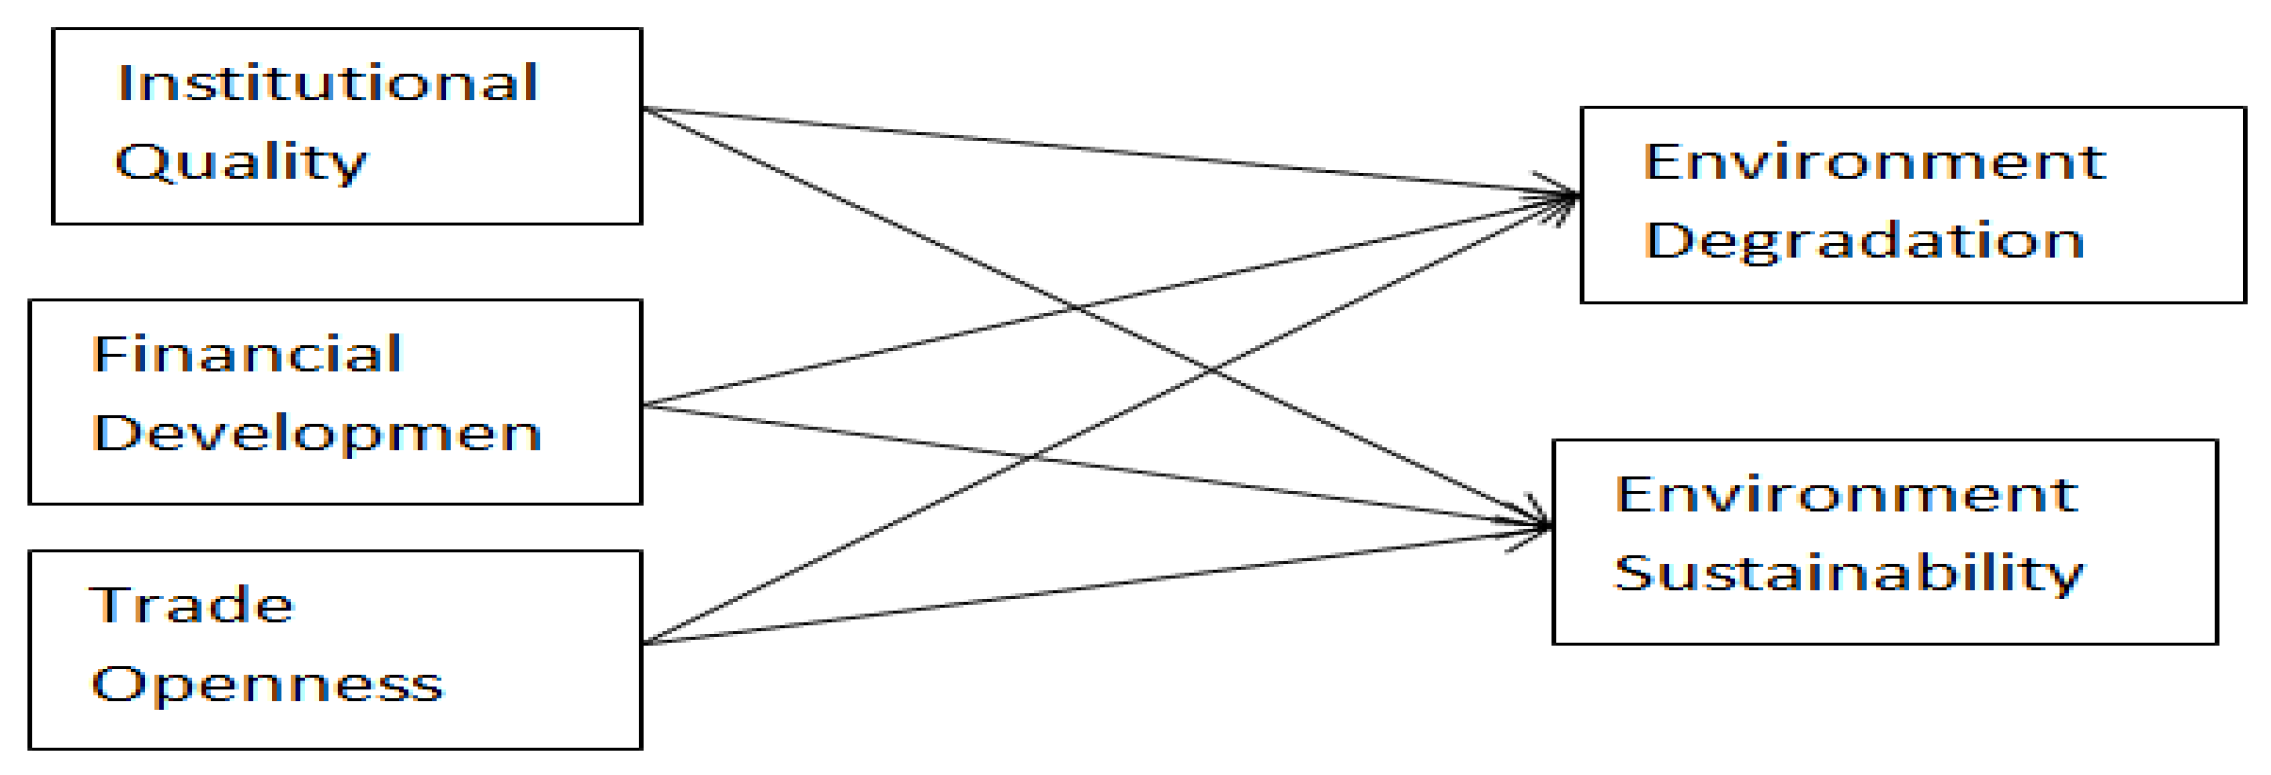
2.5. Conceptual Model of the Study
3. Methodology and Data
3.1. Hypothesis Specification, Data, and Methodology
3.1.1. Hypothesis
3.1.2. Empirical Model
3.1.3. Model Specification ARDL
3.1.4. Non-Linear Auto Regressive Distributive Lag Model (NARDL)
4. Empirical Analysis and Discussion
Estimates of Non-Linear Auto Regressive Distributed Lag (NARDL)
5. Conclusions
Policy Recommendations
Author Contributions
Funding
Conflicts of Interest
References
- B.P. Energy Economics. BP Energy Outlook 2018; PB p.l.c.: London, UK, 2018. [Google Scholar]
- Boutabba, M.A. The impact of financial development, income, energy and trade on carbon emissions: Evidence from the Indian economy. Econ. Model. 2014, 40, 33–41. [Google Scholar] [CrossRef] [Green Version]
- Shahbaz, M.; Mutascu, M.; Azim, P. Environmental Kuznets curve in Romania and the role of energy consumption. Renew. Sustain. Energy Rev. 2013, 18, 165–173. [Google Scholar] [CrossRef] [Green Version]
- Muhammad, S.; Tiwari, A.; Muhammad, N. The effects of financial development, economic growth, coal consumption and trade openness on environment performance in South Africa. Energy Policy 2011, 61. [Google Scholar] [CrossRef] [Green Version]
- Shahbaz, M.; Hye, Q.M.A.; Tiwari, A.K.; Leitão, N.C. Economic growth, energy consumption, financial development, international trade and CO2 emissions in Indonesia. Renew. Sustain. Energy Rev. 2013, 18, 165–173. [Google Scholar] [CrossRef] [Green Version]
- Tamazian, A.; Rao, B.B. Do economic, financial and institutional developments matter for environmental degradation? Evidence from transitional economies. Energy Econ. 2010, 32, 137–145. [Google Scholar] [CrossRef] [Green Version]
- Komal, R.; Abbas, F. Linking financial development, economic growth and energy consumption in Pakistan. Renew. Sustain. Energy Rev. 2015, 44, 211–220. [Google Scholar] [CrossRef]
- Gokmenoglu, K.; Ozatac, N.; Eren, B.M. Relationship between industrial production, financial development and carbon emissions: The case of Turkey. Procedia Econ. Finance 2015, 25, 463–470. [Google Scholar] [CrossRef] [Green Version]
- Charfeddine, L.; Ben Khediri, K. Financial development and environmental quality in UAE: Cointegration with structural breaks. Renew. Sustain. Energy Rev. 2016, 55, 1322–1335. [Google Scholar] [CrossRef]
- Ahmad, M.; Khan, Z.; Rahman, Z.U.; Khan, S. Does financial development asymmetrically affect CO2 emissions in China? An application of the nonlinear autoregressive distributed lag (NARDL) model. Carbon Manag. 2018, 9, 631–644. [Google Scholar] [CrossRef]
- Ganda, F. The environmental impacts of financial development in OECD countries: A panel GMM approach. Environ. Sci. Pollut. Res. 2019, 26, 6758–6772. [Google Scholar] [CrossRef]
- Khobai, H.; Le Roux, P. The relationship between energy consumption, economic growth and carbon dioxide emission: The case of South Africa. Int. J. Energy Econ. Policy 2017, 7, 102–109. [Google Scholar]
- Zamil, A.M.A.; Furqan, M.; Mahmood, H. Trade openness and CO2 emissions nexus in Oman. Entrep. Sustain. Issues 2019, 7, 1319–1329. [Google Scholar] [CrossRef] [Green Version]
- Frutos-Bencze, D.; Bukkavesa, K.; Kulvanich, N. Kulvanich, Impact of FDI and trade on environmental quality in the CAFTA-DR region. Appl. Econ. Lett. 2017, 24, 1393–1398. [Google Scholar] [CrossRef]
- Honma, S. Does international trade improve environmental efficiency? An application of a super slacks-based measure of efficiency. J. Econ. Struct. 2015, 4, 877. [Google Scholar] [CrossRef] [Green Version]
- Abbas, S.; Kousar, S.; Yaseen, M.; Mayo, Z.A.; Zainab, M.; Mahmood, M.J.; Raza, H. Impact assessment of socioeconomic factors on dimensions of environmental degradation in Pakistan. SN Appl. Sci. 2020, 2, 468. [Google Scholar] [CrossRef] [Green Version]
- Solarin, S.A.; Al-Mulali, U.; Musah, I.; Ozturk, I. Investigating the pollution haven hypothesis in Ghana: An empirical investigation. Energy 2017, 124, 706–719. [Google Scholar] [CrossRef]
- Shahbaz, M. Tiwari, The Effects of Financial Development, Economic Growth, Coal Consumption and Trade Openness on Environment. Energy Policy 2013, 61, 1452–1459. [Google Scholar] [CrossRef] [Green Version]
- Charfeddine, L.; Kahia, M. Impact of renewable energy consumption and financial development on CO2 emissions and economic growth in the MENA region: A panel vector autoregressive (PVAR) analysis. Renew. Energy 2019, 139, 198–213. [Google Scholar] [CrossRef]
- Udeagha, M.C.; Ngepah, N. Revisiting trade and environment nexus in South Africa: Fresh evidence from new measure. Environ. Sci. Pollut. Res. 2019, 26, 29283–29306. [Google Scholar] [CrossRef]
- De-yong, D.B.-s.S. A Research on the Relationship of Foreign Trade, FDI and Environment Pollution: 1995–2005. J. Int. Trade 2008, 4, 18–29. [Google Scholar]
- Sinha, A.; Shahbaz, M.; Sengupta, T. Renewable energy policies and contradictions in causality: A case of Next 11 countries. J. Clean. Prod. 2018, 197, 73–84. [Google Scholar] [CrossRef] [Green Version]
- Goel, R.K.; Herrala, R.; Mazhar, U. Institutional quality and environmental pollution: MENA countries versus the rest of the world. Econ. Syst. 2013, 37, 508–521. [Google Scholar] [CrossRef]
- Cole, M.A. Corruption, income and the environment: An empirical analysis. Ecol. Econ. 2007, 62, 637–647. [Google Scholar] [CrossRef]
- Lau, L.-S.; Choong, C.-K.; Eng, Y.-K. Carbon dioxide emission, institutional quality, and economic growth: Empirical evidence in Malaysia. Renew. Energy 2014, 68, 276–281. [Google Scholar] [CrossRef]
- Zakaria, M.; Bibi, S. Financial development and environment in South Asia: The role of institutional quality. Environ. Sci. Pollut. Res. 2019, 26, 7926–7937. [Google Scholar] [CrossRef]
- Ibrahim, M.H.; Law, S.H. Institutional Quality and CO2 Emission–Trade Relations: Evidence from Sub-Saharan Africa. South Afr. J. Econ. 2016, 84, 323–340. [Google Scholar] [CrossRef]
- Harris, R.; Sollis, R. Applied Time Series Modelling and Forecasting; Wiley: Hoboken, NJ, USA, 2003. [Google Scholar]
- Pesaran, M.H.; Shin, Y. An autoregressive distributed-lag modelling approach to cointegration analysis. Econom. Soc. Monogr. 1998, 31, 371–413. [Google Scholar]
- Felipe, J.; Lim, J. An Analysis of Pakistan’s Macroeconomic Situation and Prospects; ADB: Mandaluyong City, Philippines, 2008. [Google Scholar]
- Fukumi, A.; Nishijima, S. Institutional quality and foreign direct investment in Latin America and the Caribbean. Appl. Econ. 2010, 42, 1857–1864. [Google Scholar] [CrossRef] [Green Version]
- Le, T.-H.; Chang, Y.; Park, D. Trade openness and environmental quality: International evidence. Energy Policy 2016, 92, 45–55. [Google Scholar] [CrossRef]
- Shin, Y.; Yu, B.; Greenwood-Nimmo, M. Greenwood-Nimmo, Modelling asymmetric cointegration and dynamic multipliers in a nonlinear ARDL framework. In Festschrift in Honor of Peter Schmidt; Springer Science and Business Media: Berlin/Heidelberg, Germany, 2014; pp. 281–314. [Google Scholar]
- Perron, P. Testing for a unit root in a time series with a changing mean. J. Bus. Econ. Stat. 1990, 8, 153–162. [Google Scholar]
- Ozturk, I.; Al-Mulali, U. Investigating the validity of the environmental Kuznets curve hypothesis in Cambodia. Ecol. Indic. 2015, 57, 324–330. [Google Scholar] [CrossRef]
- Batuo, M.; Mlambo, K.; Asongu, S. Linkages between financial development, financial instability, financial liberalisation and economic growth in Africa. Res. Int. Bus. Financ. 2018, 45, 168–179. [Google Scholar] [CrossRef] [Green Version]
- Zivot, E.; Andrews, D.W.K. Further evidence on the great crash, the oil-price shock, and the unit-root hypothesis. J. Bus. Econ. Stat. 2002, 20, 25–44. [Google Scholar] [CrossRef]
- Salahuddin, M.; Gow, J. The effects of Internet usage, financial development and trade openness on economic growth in South Africa: A time series analysis. Telemat. Inform. 2016, 33, 1141–1154. [Google Scholar] [CrossRef] [Green Version]
- Erdoğdu, H.; Çiçek, H. Modelling beef consumption in Turkey: The ARDL/bounds test approach. Turk. J. Veter Anim. Sci. 2017, 41, 255–264. [Google Scholar] [CrossRef]
- Perrone, D.; Hornberger, G.M. Water, food, and energy security: Scrambling for resources or solutions? Wiley Interdiscip. Rev. Water 2014, 1, 49–68. [Google Scholar] [CrossRef]
- Salahuddin, M.; Khan, S. Empirical link between economic growth, energy consumption and CO2 emission in Australia. J. Dev. Areas 2013, 1, 81–92. [Google Scholar] [CrossRef]
- Pesaran, M.H.; Shin, Y.; Smith, R.P. Pooled mean group estimation of dynamic heterogeneous panels. J. Am. Stat. Assoc. 1999, 94, 621–634. [Google Scholar] [CrossRef]
- Mavragani, A.; Nikolaou, I.E.; Tsagarakis, K.P. Open economy, institutional quality, and environmental performance: A macroeconomic approach. Sustainability 2016, 8, 601. [Google Scholar] [CrossRef] [Green Version]
- Majeed, M.T.; Samreen, I.; Tauqir, A.; Mazhar, M. The asymmetric relationship between financial development and CO2 emissions: The case of Pakistan. SN Appl. Sci. 2020, 2, 827. [Google Scholar] [CrossRef] [Green Version]
- Vogel, D. Trading up and governing across: Transnational governance and environmental protection. J. Eur. Public Policy 1997, 4, 556–571. [Google Scholar] [CrossRef]


| Variable | Notation | Measurement | Data Source | References |
|---|---|---|---|---|
| Dependent Variable (s) | ||||
| Environmental Sustainability | ES | “National adjusted net savings (excluding particular emission damage)” | WDI | Ganda (2019) [11] |
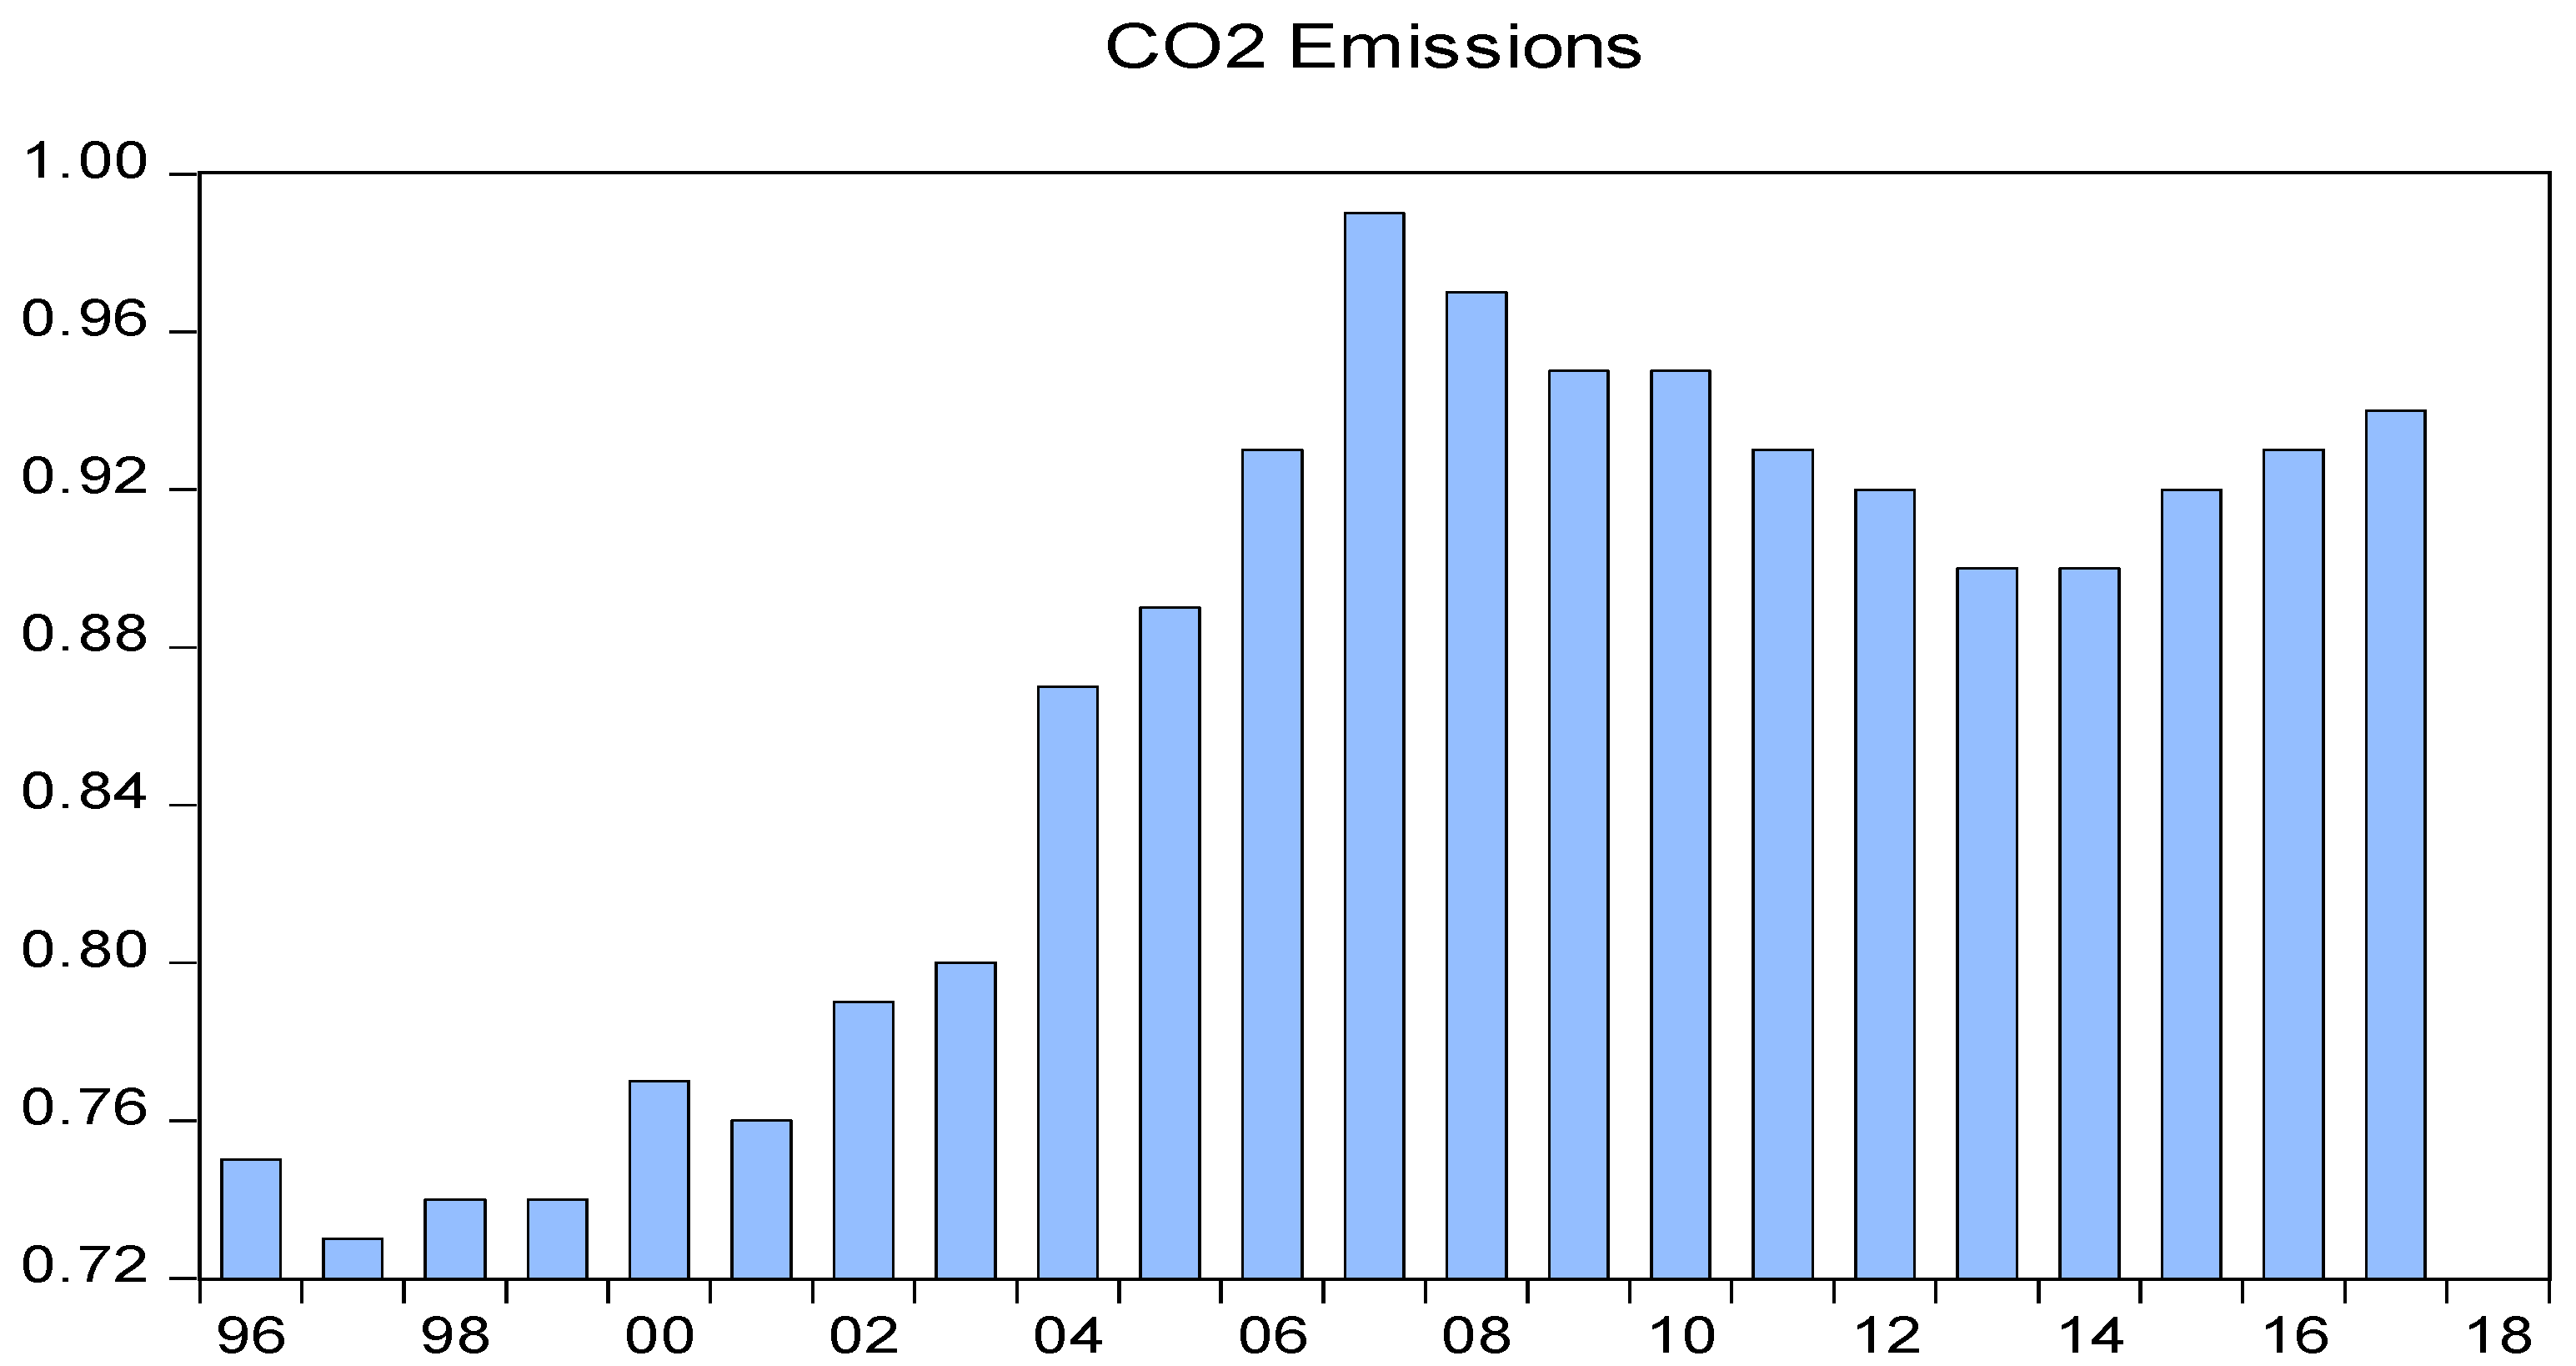
| Environmental Degradation | ED | “Per capita CO2 Emissions” | WDI | Ozturk & Acaravci (2010) [35] |
| Independent Variable (s) | ||||
| Institutional Quality | IQ | “To measure institutional quality, the study will construct an index based on six variables that are government effectiveness, political stability, voice and accountability, control of corruption, and regulatory quality. The overall index will be calculated by using principal component analysis” | WDI | Fukumi & Nishijima (2010) [31] |
| Financial Development | FD | “To measure financial development, the study will construct an index based on 3 variables, including liquid liabilities (% of GDP); Money supply (% of GDP), and domestic private credit to the banking sector (% of GDP). The overall index will be calculated by using principal component analysis” | WDI | Batuo et al. (2018) [36] |
| Trade openness | TO | “Exports + imports (% of GDP)” | WDI | Le et al. (2016) [32] |
| Variables | ADF | PP | ||
|---|---|---|---|---|
| I (0) | I (1) | I (0) | I (1) | |
| IQ | −1.499561 | −3.418185 * | −1.526926 | −3.412630 * |
| FD | −0.010631 | −4.323359 * | −0.212541 | −4.323359 * |
| TO | −2.222722 | −5.068862 * | −2.310778 | −5.068862 * |
| ED | −1.088568 | −3.562594 * | −1.148435 | −3.602603 * |
| ES | −1.098678 | −3.702963 * | −1.098678 | −3.661068 * |
| Variables | t-Statistics | Year of Break |
|---|---|---|
| ED | −4.741431 * | 2004 |
| ES | −4.644488 * | 2006 |
| D(FD) | −2.457307 * | 2008 |
| D(IQ) | −3.46234 * | 2006 |
| TO | −4.205241 * | 2004 |
| Test Statistic | Model 1 | Model 2 | ||
| Value | k | Value | k | |
| F. Statistics | 26.25711 | 3 | 5.483794 | 5 |
| 8.536390 | 3 | 9.938447 | 5 | |
| Critical Value Bounds | ||||
| Lower bound | Upper Bound | Lower bound | Upper Bound | |
| 10% | 2.72 | 3.77 | 2.26 | 3.35 |
| 5% | 3.23 | 4.35 | 2.62 | 3.79 |
| 2.5% | 3.69 | 4.89 | 2.96 | 4.18 |
| 1% | 4.29 | 5.61 | 3.41 | 4.68 |
| Variable | Model 1(1, 0, 0, 0) DV = ED | Model 2 (1, 2, 0, 1) DV = ES | ||||
|---|---|---|---|---|---|---|
| β | S.E | t-Statistic | β | S.E | t-Statistic | |
| D (IQ) | −0.126978 | 0.096853 | −1.311044 | −1.324428 | 9.587217 | −0.138145 |
| D (IQ (−1)) | 32.737021 * | 9.588269 | 3.414278 | |||
| D (FD) | 0.007529 * | 0.002391 | 3.148906 | 2.025239 * | 0.443035 | 4.571287 |
| D(TO) | −0.001222 | 0.001904 | −0.641743 | −0.075875 | 0.248866 | −0.304883 |
| ECM | −0.411565 * | 0.145497 | −2.828689 | −0.897076 * | 0.192725 | −4.654691 |
| Model 1 | Model 2 | |||||
|---|---|---|---|---|---|---|
| Variable | Coefficient | Std. Error | t-Statistic | Coefficient | Std. Error | t-Statistic |
| IQ | −0.308525 * | 0.143636 | −2.14796 | 53.463064 * | 15.182418 | 3.521380 |
| FD | 0.018294 * | 0.004196 | 4.35973 | −2.257602 * | 0.435656 | −5.182079 |
| TO | −0.02969 * | 0.004111 | −7.22208 | 0.638411 * | 0.176480 | 3.617477 |
| C | 0.002816 | 0.179732 | 0.01566 | −69.130437 | 30.934520 | −2.234734 |
| Model 1 (1, 1, 0, 1, 0, 0) DV: ED | Model 2 (1, 0, 0, 0, 0, 0) DV: ES | |||||
|---|---|---|---|---|---|---|
| Variable | β | S.E | t-Statistic | β | S.E | t-Statistic |
| D(IQ+) | −0.406090 * | 0.201064 | −2.0197 | 1.683484 * | 0.618599 | 2.72144 |
| D(IQ-) | −0.096614 | 0.128870 | −0.7497 | 1.124892 * | 0.543223 | 2.07077 |
| D(FD+) | −0.01412 * | 0.005228 | −2.7008 | 5.182998 * | 1.240799 | 4.17714 |
| D(FD-) | 0.04637 * | 0.002688 | 17.2507 | −6.274767 * | 1.353847 | −4.63476 |
| D(TO) | 0.09099 * | 0.02694 | 3.3775 | −0.032170 | 0.272118 | −0.11822 |
| ECM | −0.210394 | 0.103389 | −2.0349 | −0.158403 | 0.031748 | −4.9893 |
| IV | Model 1 (1, 1, 0, 1, 0, 0) DV: ED | Model 2 (1, 0, 0, 0, 0, 0) DV: ES | ||||
|---|---|---|---|---|---|---|
| β | S.E | t-Statistic | β | S.E | t-Statistic | |
| IQ+ | −3.875723 * | 1.574625 | −2.46136 | 1.453280 * | 0.635865 | 2.28551 |
| IQ- | −0.459204 * | 0.057875 | −7.93441 | 0.097107 | 0.282559 | 0.34366 |
| FD+ | −0.192986 ** | 0.097802 | −1.973231 | 4.474262 * | 1.487417 | 3.00807 |
| FD- | 0.122039 * | 0.014466 | 8.43626 | 5.416740 * | 1.746447 | 3.10157 |
| TO | 0.143246 | 0.037562 | 3.813588 | −0.027771 | 0.234810 | −0.11827 |
| C | 0.175503 | 0.587932 | 0.298510 | 40.805676 | 8.216352 | 4.966398 |
| Tests Specification | ARDL | NARDL | Decision | ||
|---|---|---|---|---|---|
| Model 1 | Model 2 | Model 1 | Model 2 | ||
| LM Test | 2.829349 (0.1062) | 4.729477 (0.0706) | 1.259593 (0.3217) | 0.475793 (0.6336) | No serial correlation exists |
| Brush Pagan | 1.380220 (0.8921) | 2.35054 (0.2154) | 1.166538 (0.3701) | 0.170182 (0.9498) | No hetroscadasticity exists |
| Adjusted R2 | 0.903815 | 0.829483 | 0.951113 | 0.823486 | The value of adjusted R. Square is above 0.80 |
| F-statistic | 16.26944 (0.003508) | 12.35054 (0.001150) | 67.14820 (0.0000) | 16.86190 (0.000046) | Models are a good fit |
| Ramsey Reset Test | 2.287644 (0.1586) | 1.772541 (0.1040) | 1.233333 (0.2850) | 0.103374 (0.9271) | Models are correctly specified |
| Jarqa Bera Test | 1.060869 (0.588349) | 0.683017 (0.710697) | 0.810324 (0.666869) | 1.045609 (0.592856) | Residuals in all models are normally distributed |
© 2020 by the authors. Licensee MDPI, Basel, Switzerland. This article is an open access article distributed under the terms and conditions of the Creative Commons Attribution (CC BY) license (http://creativecommons.org/licenses/by/4.0/).
Share and Cite
Ahmed, F.; Kousar, S.; Pervaiz, A.; Ramos-Requena, J.P. Financial Development, Institutional Quality, and Environmental Degradation Nexus: New Evidence from Asymmetric ARDL Co-Integration Approach. Sustainability 2020, 12, 7812. https://0-doi-org.brum.beds.ac.uk/10.3390/su12187812
Ahmed F, Kousar S, Pervaiz A, Ramos-Requena JP. Financial Development, Institutional Quality, and Environmental Degradation Nexus: New Evidence from Asymmetric ARDL Co-Integration Approach. Sustainability. 2020; 12(18):7812. https://0-doi-org.brum.beds.ac.uk/10.3390/su12187812
Chicago/Turabian StyleAhmed, Farhan, Shazia Kousar, Amber Pervaiz, and José Pedro Ramos-Requena. 2020. "Financial Development, Institutional Quality, and Environmental Degradation Nexus: New Evidence from Asymmetric ARDL Co-Integration Approach" Sustainability 12, no. 18: 7812. https://0-doi-org.brum.beds.ac.uk/10.3390/su12187812