1. Introduction
An increase of global energy consumption is mainly due to the preventable heating/cooling energy loss from residential buildings [
1,
2]. It is well known that the energy consumption in buildings is largely influenced by inadequate thermal insulation of the building’s exterior facades. In the ongoing trend of the construction of high-rise buildings, a vast exterior facade has usually been constructed from a transparent glazed window. These glazing facades accomplish a modern appearance for buildings. However, it also increases the building heat gain, especially for the facades oriented to the south. Therefore, proposing an elegant facade for these applications is of great importance to mitigate the thermal energy transfer via these boundaries. In more detail, plenty of research findings have stated that the building sector consumes over 40% of the end-use energy in the world [
3].
The energy consumption for heating and air conditioning systems is still rising with the increasing demand for thermal comfort. Therefore, there is an enormous potential to enhance building energy efficiency in the areas of heating and cooling technologies [
1]. The glazed area and the shading devices have a significant role over energy building consumption, so many research studies and prototypes have been developed in the last years to increase the thermal and energy efficiency of the buildings’ exterior facades. An improvement to the thermal performance of the glazing area of the building can be attained with the integration of modern renewable energy and storage devices that contributes to the utilization of new phase change and photovoltaic materials, geometrics, and new techniques to propose solutions for buildings’ energy issues. Moreover, ventilated facades (VF) has been a priority area by the European Directive, and as a suitable tool to improve the energetic efficiency of refurbished buildings [
4].
Goia et al. [
5] proposed one of the efficient ways to enhance the thermal capacity of the glazing system, the double glazed window filled with phase change material (PCM). Ismail et al. [
6] compared two different types of windows, filled with absorbing gases and the other one filled with PCM. They calculated the heat transfer through the window, which compared and discussed the total heat gain coefficients. Weinläder et al. [
7] studied the excellent capability of the double-glazed window filled with PCM to decrease solar heat gains. The authors investigated the thermal performance of three glazing systems that integrated a plastic container filled with different PCMs and compared them with a double-glazed window filled with PCM through experimental and mathematical methods and analyzed the energy performance of the components. They concluded that the PCM configuration could decline the heat losses in the south-oriented façade by approximately 30% and solar gains by nearly 50%. Zhong et al. [
8] conducted experimental and simulation studies to investigate the performance of heat transfer of the double-glazed window filled with PCM, and they enhanced the thermophysical parameters of PCM filled inside the windows. Manz et al. [
9] experimentally proposed a two-layered passive wall system, combining a salt hydrate PCM and a transparent honeycomb-type insulation material. The PCM was filled into glass containers. They concluded that the phase change energy storage was a higher usage of the solar gains because of more evenly distributed energy flows into the building; on the contrary, the backscattering of solar radiation in the solid-state leading to reductions of heat and light gains.
Several transparent building elements incorporating translucent or see-through PCM have been proposed in recent years, Weinlaeder et al. [
7] combined PCM with double glazing, which encapsulated PCMs in transparent plastic containers. The containers were placed behind conventional double-glazing with an air gap of about 10 mm. Ismail and Henriquez [
10] proposed a more advanced and dynamic technology based on an active PCM moving curtain, resulting in a highly responsive system designed to reduce heat loss in cold seasons. The results indicated that the PCM filled double glass window is more thermally efficient than the air-filled window itself. In another study, Ismail and Henriques [
11] investigated the heat transmittance and optical/thermal properties of a conventional double-glazed unit filled with a glycol mixture using numerical models and dedicated spectrophotometric analyses. They concluded that the proposed composite window design appears to be efficient in minimizing incoming solar radiation.
Goia et al. [
12] proposed a simple prototype of a PCM glazing system compared with a conventional double-glazed unit with air. The result indicated that the PCM glazing system provided better indoor thermal conditions than the traditional system during various seasons. Furthermore, they concluded that the higher the outdoor solar radiation, the better performance offered by the PCM glazing unit. Gowreesunker et al. [
13] evaluated the thermal and optical characterization of the PCM glazing systems. The results concluded that the use of the PCM within a double-glazed unit enhances the thermal mass throughout phase change, and it influences the visual characteristics of the window. Zhong et al. [
8] indicated that when PCM was used in the PCM-filled glass window, the thermal insulation and peak cooling load shifting were remarkable in China’s hot summer and cold winter. Besides, the heat entered the building through this structure decreased by 18.3% on the average sunny summer day. In Northeast China, Dong et al. [
14] simulated the thermal performance of PCM-filled double-glazing units with different PCM properties. Solgi et al. [
15] explored the potential for coupling PCMs with night ventilation under various Australian climate conditions. It has been shown that the amount of ventilation airflow does not affect the PCM’s transition temperature, while it affects the use of cooling energy. In Brisbane, the city with the highest daily temperature fluctuations, higher cooling energy savings were measured up to 82%. Ismail et al. [
6] conducted a computational simulation of the two principles of glass windows, that is, a double glass window filled with infrared absorbing gases, and studied the other one filled with PCM. They concluded that the double glass window filled with an absorbing gas mixture and using reflective glass is more efficient.
Based on the recent literature survey, the PCM application in the window proved its efficiency for building’s energy saving. However, the transparency of the PCM filled in the window glazing changes according to the transient melting behavior. Besides, in most recent investigations, they applied the PCM filled between two glazings for windows. In this structure, the building heat gain from windows increases very fast once the melting starts. Therefore, the optimal design of the PCM thickness is essential to avoid the complete melting at noontime is of great importance.
Further, once the complete melting occurs, the transparent view of the PCM allows the sun rays to enter the building and increases the solar heat gain. Finally, daylighting is also essential for human comfort. Therefore, a new design for integrating the PCM in windows is of great importance.
In commercial and domestic buildings with large glazing facades oriented to the south, the HVAC designers recommend using window shutters to block the sun rays. This approach decreases the solar heat gain from the window and slightly affects the heat transfer rate from the outside air. Therefore, the novelty of the present study can be represented in two main aspects. First, four different designs of sliding windows are proposed. With this sliding option, the occupants can choose manually or automatically between different window structures. In these window structures, the integration of photovoltaic (PV), PCM, and vacuum glazing (VG) options are implemented. Instead of using the traditional window shutters to decrease the solar heat gain, the glazed PV layer is used to block the sun rays and simultaneously generates electricity at the time where the sun ray block is essential. The PCM functions are to decrease the thermal heat gain and keep safe operation for the PV layer. Second, a comprehensive transient thermal model for the proposed windows is developed, and is validated step by step with data in the literature. The model is simulated at typical hot weather conditions of Kuwait City. The proposed window designs consist of multiple sliding parts that can be hidden into the wall structure to fulfill different occupant needs with the most recent energy-saving technologies.
2. Physical Model
The proposed window designs differ from traditional design. In the conventional methods, to enhance the thermal insulation performance of the single glass (SG) window, two-glass layers with a single air gap (SAG) in between are commonly used. This decreases the thermal heat transfer to the building due to the higher thermal resistance of the air gap layer. This structure can be achieved by forming a single glass layer facing the outside, and the air gap is formed by sliding the inside glass layer. In addition, hanging or sliding window shutters are used to decrease solar heat gain.
On the other hand, in the currently proposed window designs, the window is constructed from two main parts. The first part is the outside glass regular sheet, while the sliding elements are different. The sliding elements in the current new design consist of different layers to mimic different operating scenarios. These designs combine the conventional SG layer with the photovoltaic (PV) layer, phase change material (PCM) layer, and vacuum glazing (VG) technology. These designs are proposed to reduce the building solar thermal heat gain along with electrical energy generation and providing indoor privacy and security. These scenarios are depicted in
Figure 1. All these windows are simulated with an area of 1 m by 1 m. The main advantages of these designs are that they can accomplish very high thermal insulation, lower solar heat gain, and electricity generation. In addition, no conventional shutters are needed because the opaque structure of the used PV layer makes the same function for the shutter with electricity production.
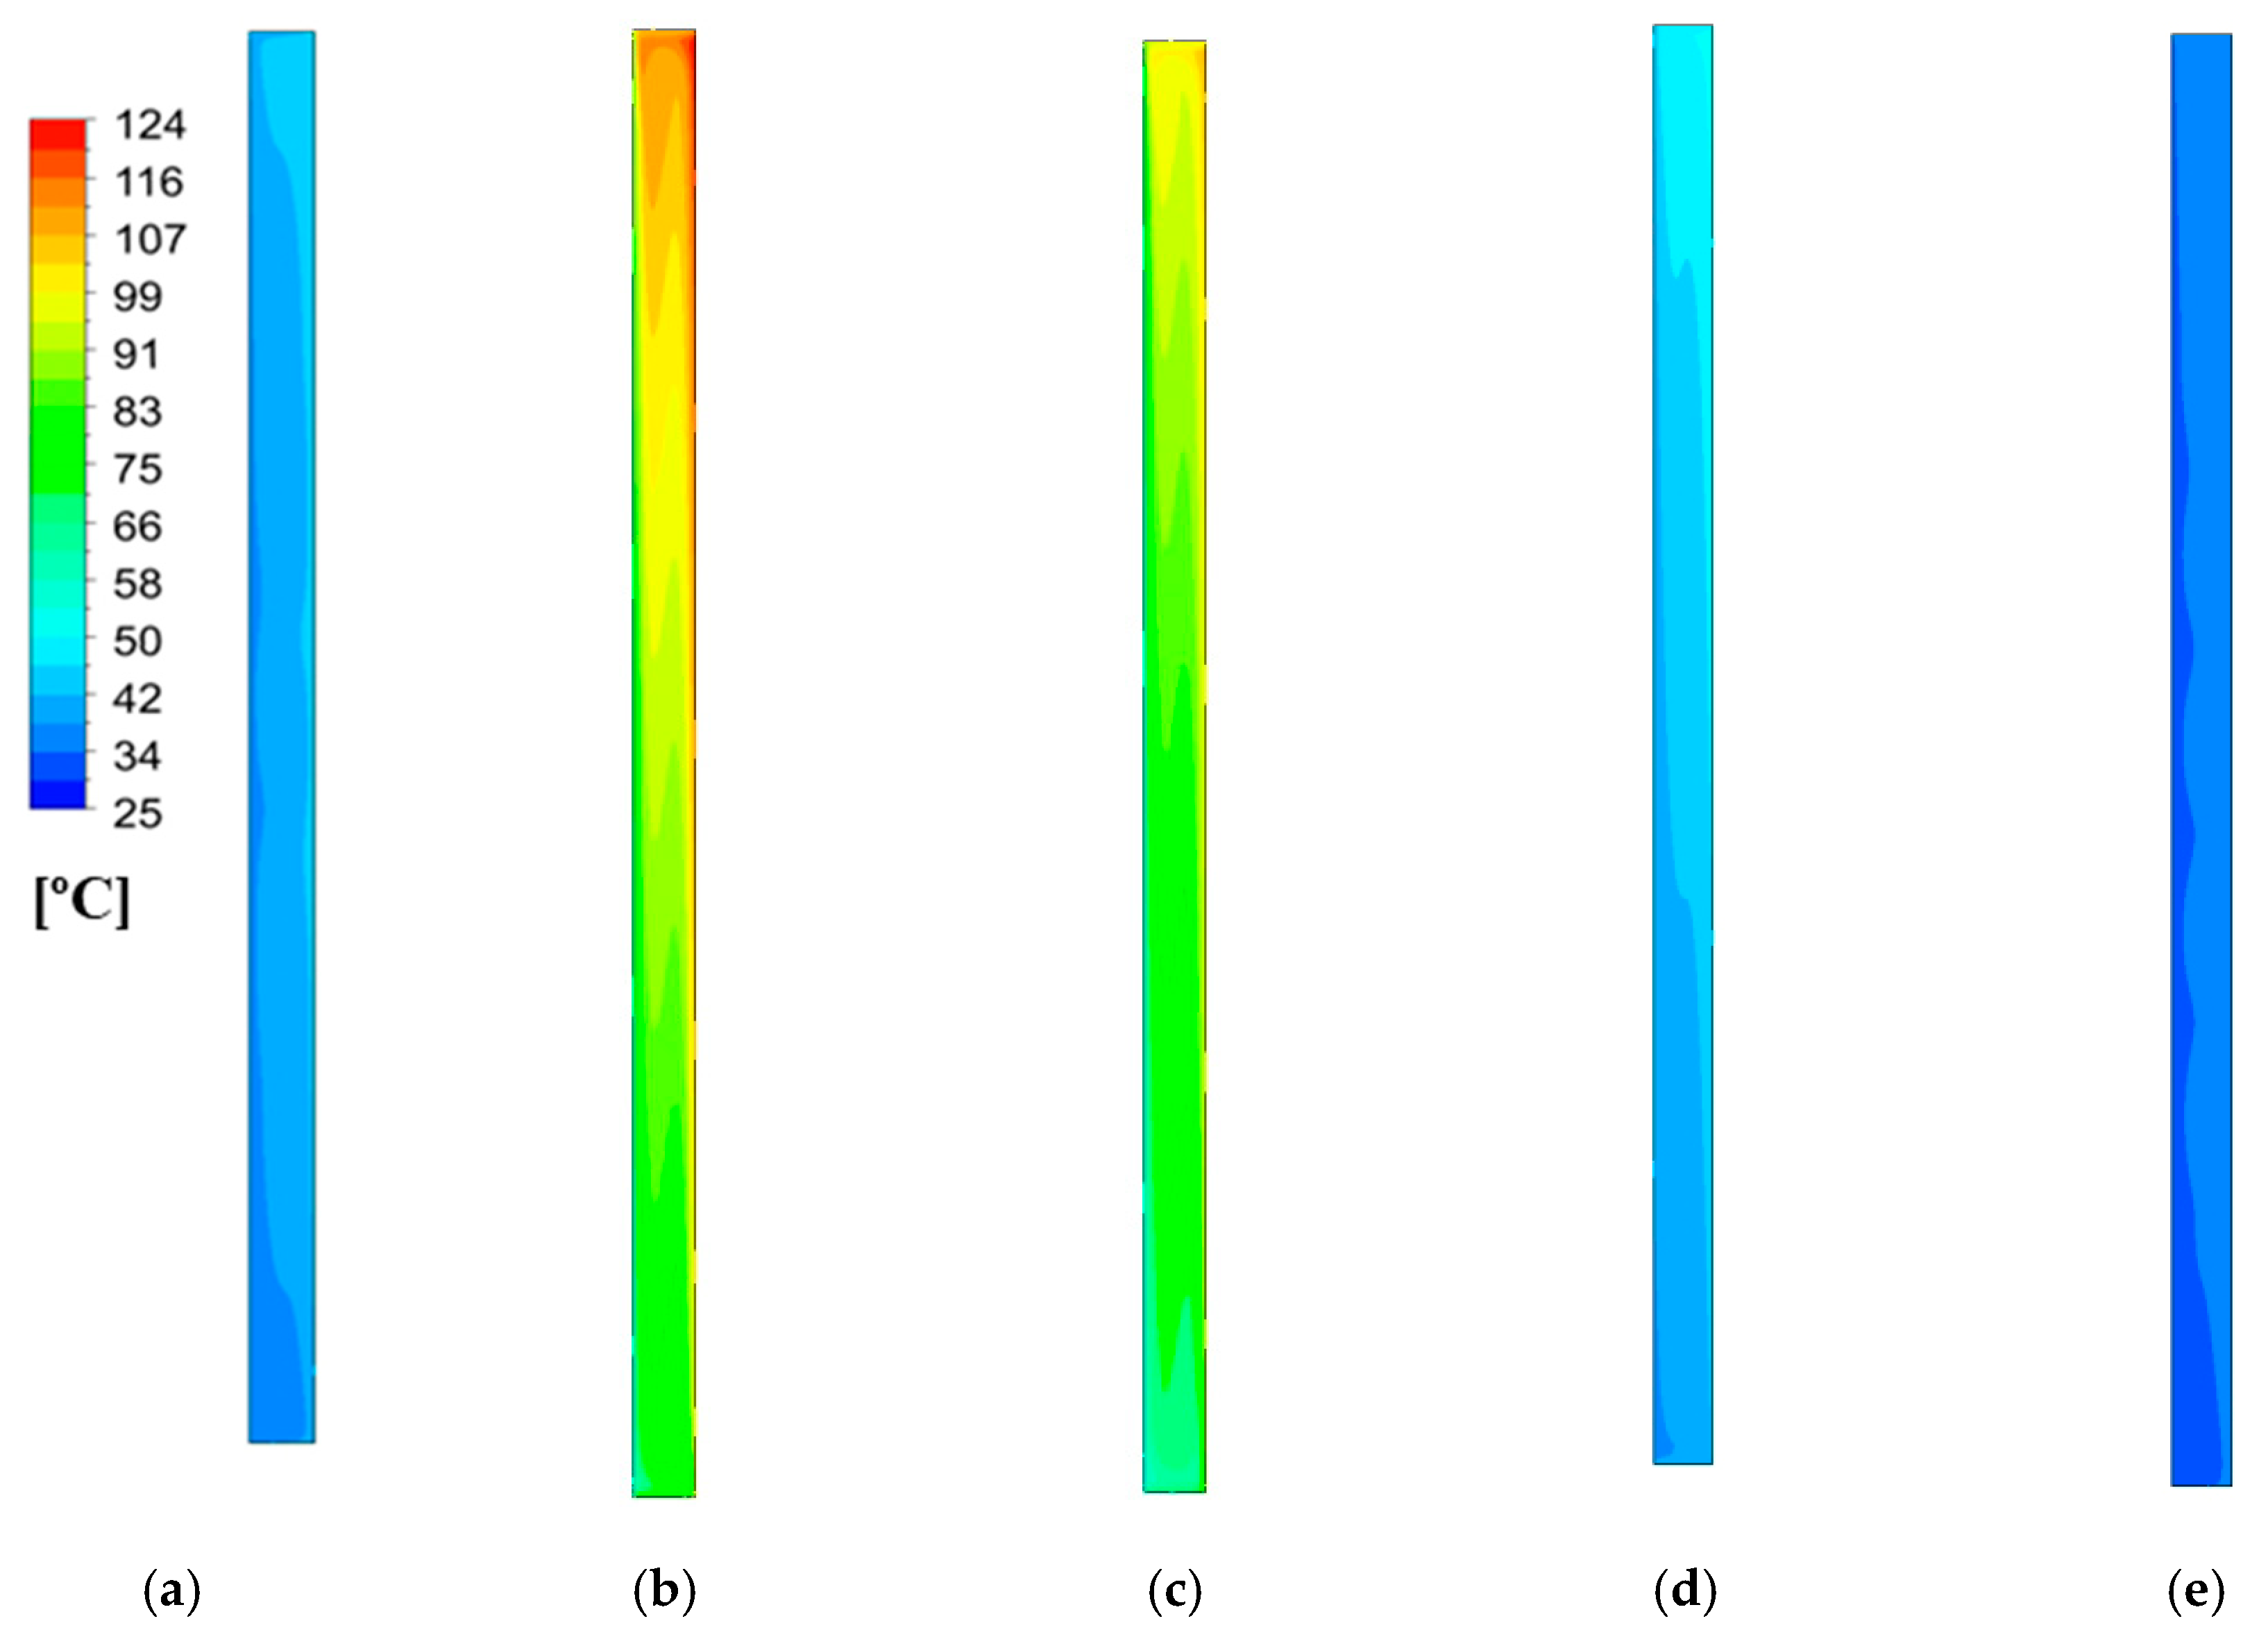
In the first design, named base-case in
Figure 1a, the structure consists of a 3 mm glass layer representing the existing SG window. The sliding part, in this case, is a polycrystalline silicon wafer pasted on another single layer of glass with a thickness of 3 mm. And another third glass layer slides at the backside of the photovoltaic layer to make a double air gap layer. This second air gap layer further decreases the heat transfer rate from the building exterior to the indoor air.
Consequently, a lower U-value along with a lower noise effect can be accomplished with this air gap compared with the single glazing window (SGW) or the double glass window with an air gap in between. As this structure contains three glass layers with a double air gap (DAG) and layers PV layer, for easier mentioning it is called (DAG + PV) window. In this design, for the outdoor light transparency requirements, the sliding part can be kept inside the wall or partially opened according to the indoor human needs. However, at the time where no indoor light requirements such as being out or daytime sleeping, the sliding part can be moved to allow the electrical power generation by the PV layer. This idea can be considered as a new window integrated photovoltaic system.
However, the base-case in
Figure 1a could suffer from a high heat transfer rate, especially in hot arid or harsh cold climates. Therefore, the second window in
Figure 1b is proposed to overcome this problem. In this design, a vacuum gap with a thickness of 0.12 mm attained by an array of micropillars is used to separate two 3 mm glass sheets. This vacuum gap is edge sealed using indium sealing, as detailed in [
16]. The silicon wafer is pasted on one side of the glass layer facing the outdoor. The structure of vacuum-based PV is detailed investigated and proved its lower U-value in [
17]. Therefore, in this design, the sliding part is the PV with the PCM layer followed with the VG layer. This structure has the benefit of three thermal insulating layers of the external formed air gap, lower thermal conductive PCM layer, and the VG layer. In addition, electrical power generation can be accomplished by the PV layer. Further, the essential function of the thin PCM layer is to accomplish efficient thermal management for the silicon wafer and attain safe and lower solar cell operating temperatures [
18]. For easier mentioning, this case is called (SAG + PV + PCM + VG) structure.
To clarify the benefit of using the VG to decrease the thermal heat gain, the structure in
Figure 1c is proposed. In this design, called (SAG + PV + PCM) without VG, the window structure includes the air cavity and PV with the PCM layer. Finally, in
Figure 1d, the full case of (SAG + PV + PCM + VG) is proposed with removing the outside air cavity. The exterior air cavity is removed by sliding the outer glass layer inside the building wall. This last case is presented to further increase the heat loss from the external surface of the silicon wafer to exterior ambient air. For easier mentioning, the final case is called (PV + PCM + VG) window.
Another important case called ventilated full case is also investigated. In this case, the same structure, as in the full case,
Figure 1b, is used. In contrast, the air cavity is considered as an air duct on the front surface of the PV. This design increases the heat dissipation rate from the top surface of the PV module and decreases its temperature. This design could result in enhancing the PV efficiency along with lowering the heat gain by the building. In the present study, the air gaps are kept at 150 mm through all the simulation. In addition, all the used glass layers have a thickness of 3 mm, as indicated in
Figure 1e.
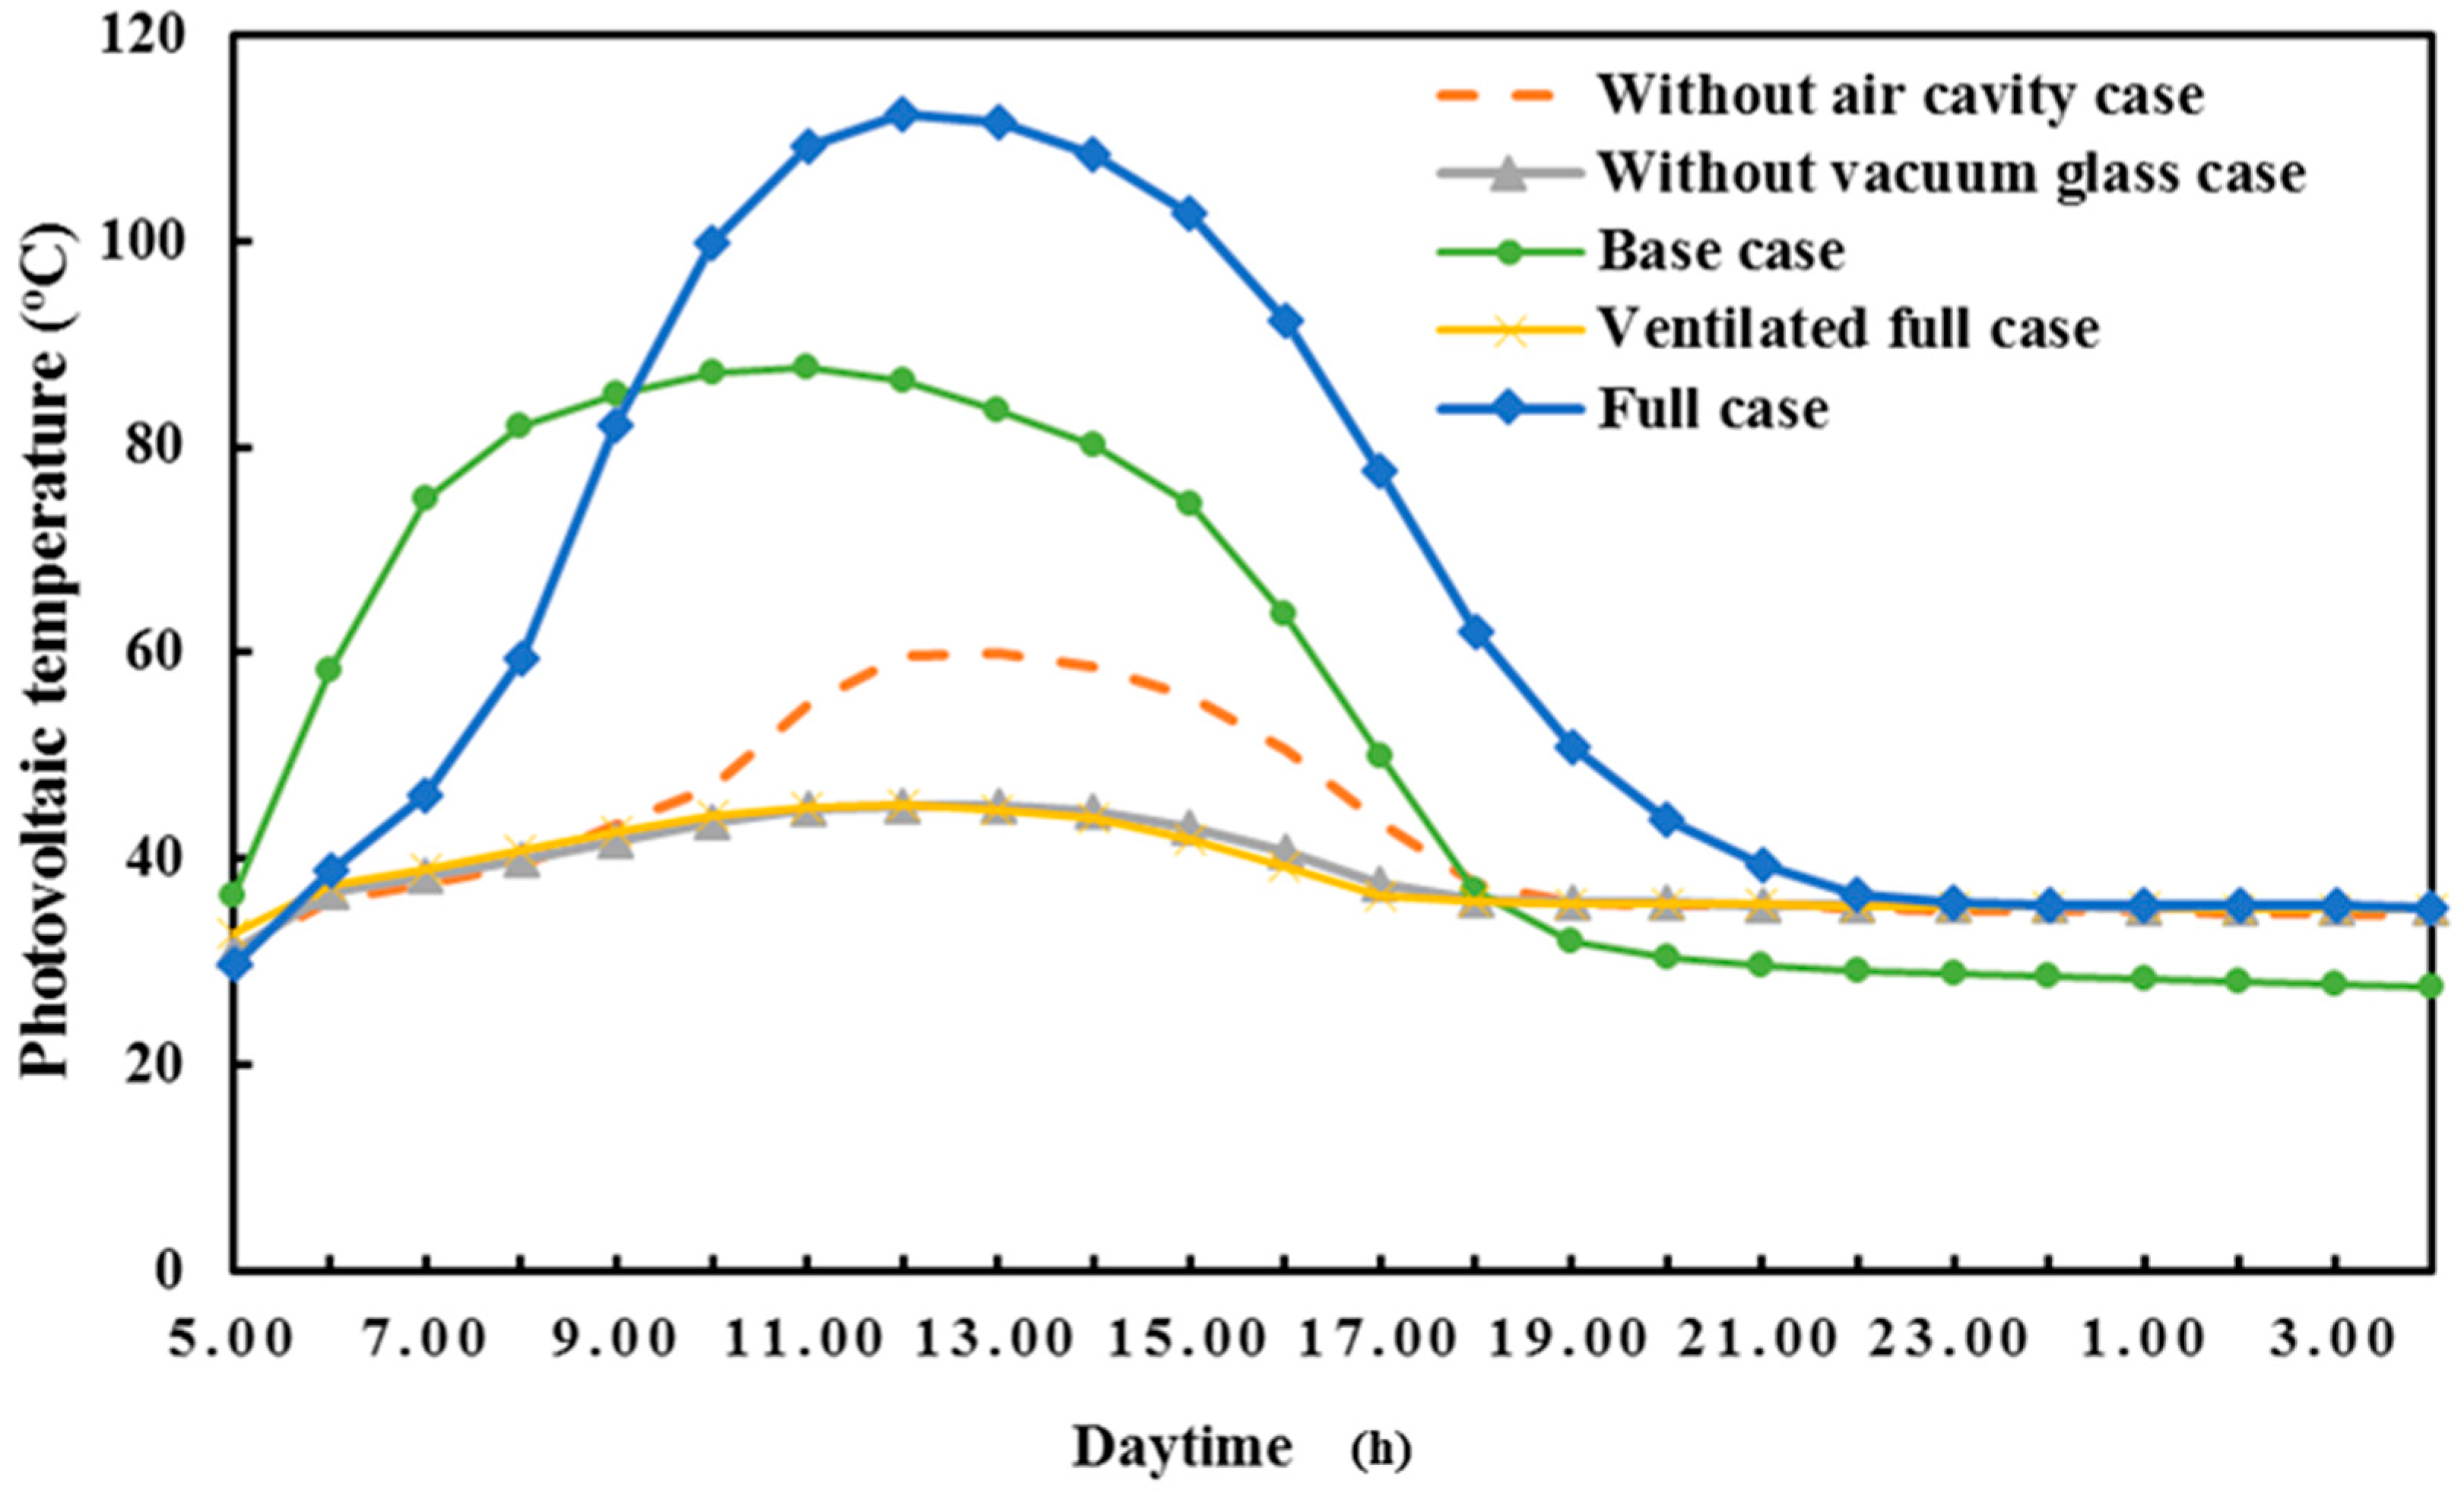
The evaluation criteria are conducted based on the inner glass layer temperature, solar cell temperature, generated electric power, and the indoor heat gain.
3. Theoretical Analysis
To thermally model the dynamic and responsive behavior of the proposed designs, a 2D multiphysics model is developed. The developed model combines three modes of heat transfer, including conduction in the solid layers of the glass and the PV layer with the natural convection equation inside the air cavity and the radiation heat exchanges in the vacuum and the air gap layer. In addition, the solidification and melting model is activated to consider the heat transfer process in the PCM layer using the enthalpy porosity technique [
16]. This model tracks the transient liquid-solid interface along with the temperature field in the PCM domain during the melting and solidification process. To simulate the proposed complicated problem, the following assumptions are adjusted.
The thermophysical properties of all solid layers are assumed to be homogeneous and temperature independent.
The heat transfer through the glass thickness is assumed to be negligible due to the smaller glass thickness compared to the front area.
The received solar radiation is assumed to be uniformly incident on the PV layer.
The indoor environment is assumed at the temperature of 25 °C with an indoor convection heat transfer coefficient of 8.1 W/m
2. K through all the daytime. This convention heat transfer coefficient mimics the natural convection in the building indoor as used in American Soceity for Testing and Material (ASTM) [
17].
3.1. Governing Equation and Boundary Conditions
A comprehensive 2D model for the proposed window layers is developed. This model couples the phase change phenomenon in the PCM with the natural convection in the air cavity with the surface to surface (S2S) radiation model in the vacuum gap. The governing equations used to solve the conjugated heat and fluid flow are stated as follows:
For the solid glass layers, the conduction heat transfer occurs. Consequently, the transient conduction heat conduction equation with internal heat generation source can be written as follows:
where is
is the Laplacian operator,
T is temperature,
qi is the internal heat generation per unit volume in the layer
i resulted from the solar radiation absorption in (W/m
3),
ki is the thermal conductivity of the layer
i in W/(m·K),
αi is the thermal diffusivity of layer
i in (m
2/s), and
t is the flow time (s). The heat generation term in each layer is estimated for the front glass layer and the silicon wafer only. This because the opaque or low light transmissivity of the silicon wafer does not allow the solar light to be transferred to the glass layer underneath the silicon wafer. Therefore, the heat generation term in the glass layer, and the silicon wafer can be estimated as follows [
18]:
For the solar cell layer:
where
V is the layer volume,
A is the surface area of the layer, and
G is the solar radiation falling on the top surface of the module. The ratio between the output electric energy and the received solar energy is the cell electrical efficiency. This efficiency depends on the cell operating temperature as follows [
18]:
where:
ηref is the PV cell electrical efficiency at standard reference temperature
Tref of 25 °C. And
Tsc is the solar cell operating temperature. The value of
βref is 0.0045 K
−1 for polycrystalline silicon. Based on Equations (4) and (5), the heat generation in the silicon wafer is dependent on the cell electrical efficiency, which is a function of the PV cell temperature. This operating temperature is also a function of the internal heat generation in the silicon wafer. Therefore, to solve this problem, an iterative technique should be applied. The details of this iterative technique are detailed and explained in the author’s earlier work [
19]. The optical properties of the glass and silicon wafer layers used for estimating the internal heat generation in each layer are listed in
Table 1.
The light transmittances through the PCM layer are of great importance, and this phenomenon is still challenging to be computationally modeled. Because the phase transition of the PCM from solid to liquid in the melting process and from liquid to solid in the solidification process with the time significantly change the light transmission. Therefore, this study used an opaque PV layer, with a light transmittance of 2%, to completely covers the PCM cavity. In this case, the light transmittance through the silicon wafer becomes very small and negligible due to the lower transmissivity of this layer. Ninety percent of solar radiation received on the silicon wafer is absorbed in the silicon wafer, causing temperature rise in this layer. This absorbed light energy is transferred to the adjacent layers in the sliding windows. Only 2% of the incident solar radiation is transmitted to the PCM cavity underneath the silicon wafer. Therefore, this small amount, 2%, is neglected in the current simulation.
For the fluid domain in the air cavity, the natural convention governing equations in a narrow cavity is solved. The details of the natural convection model with Boussinesq approximation in the air cavity are explained in [
20]. While the melting and solidification model in the PCM domain is also solved to capture the instantaneous melting profile and the liquid fraction contours in the PCM domain, this model is also included in ANSYS Fluent. The PCM governing equations used in ANSYS are detailed, explained in [
21]. In the air cavity and the vacuum glazing regions, thermal radiation heat exchange is also considered. To model the radiation heat exchange in the air cavity and the vacuum gap for the vacuum glazing, surface to surface (S2S) radiation model is also activated. The S2S model is also validated to model the vacuum glazing and vacuum insulated panels in the author’s earlier work [
22]. The S2S governing equation is also can be found in [
20]. A 3 mm thickness is used for all used glass layers, while the air gap and PCM thickness are 20 mm and 15 mm, respectively. The thermophysical properties of the different layers used in the simulation work were depicted in
Table 2.
The structure element with different size is used to discretize all the domains in each case as shown in
Figure 2. The adopted number of elements used in each case are listed in
Table 3. The solution is conducted after confirming that the solution is independent of the number of elements and the time step.
3.2. Boundary and Initial Conditions
Initially, the glazing structure containing a solid PCM at an initial temperature is lower than the melting temperature. This initial temperature is assumed to be 25 °C, which is the ambient temperature at midnight, early morning. At this time, all the layers are considered to be at this temperature. Furthermore, no-slip boundary conditions are applied at the interfaces of the air cavity layer with the glass layer and the glass interface in connection with the PCM cavity. However, the thermally coupled boundary condition is considered at all the interfaces between two adjacent materials. An energy source term is added in the PV layer and the front glass layer according to Equations (2) and (3) to consider the heat gain resulted from the solar radiation absorption. The internal emissivity of each glass layer is defined in the vacuum gap and the air cavity layer to consider the radiation heat exchange in the vacuum gap layer. The emissivity of the vacuum gap is 0.18 for both sides; the emissivity of the glass layer and PV layer facing the air cavity is 0.9. Finally, to consider the external convection and radiation from the outer surface of the window to the atmosphere, combined radiation and convection heat exchange is applied. The natural convection boundary condition is applied at the internal surface of the glass layer facing the indoor air. In more details, the mathematical expression of the applied boundary conditions at the indoor and the outdoor glass surfaces can be written as follows:
On the front surface of the glazing window:
where
kg the glass thermal conductivity,
hconv,o is the convection heat transfer coefficient from the glass surface to the ambient air caused by the wind effect,
Tg front glass surface temperature,
Ta ambient temperature, and
εg the front glass emissivity. The instantaneous estimated value of
hconv,o is estimated as a function of the wind speed facing the outer surface of the window as follows [
23]:
where
Uwind is the wind speed in m/s, this correlation was developed based on the fundamentals of heat transfer theory and wind tunnel measurements. This equation was valid for wind speed up to 5 m/s and previously used for similar problems in [
16,
24].
The boundary condition on the indoor glass surface is expressed as follows:
where
Qindoor is the heat transmission rate to the indoor air;
hconv,i, and
Tin are the indoor natural convection and the indoor temperature, and they were taken as 8.1 W/(m
2·K) and 25°, respectively [
22]. It is worth mentioning that the ambient temperature, solar radiation, and wind speed are varied according to the daytime. Therefore, the estimated heat generation in the glass layer and the silicon layer are time-dependent. In addition to the external forced convection due to the wind effect and the external boundary condition are also time-dependent. To do this, a transient profile for the heat generation in the silicon layer and the glass layer and transient table for the ambient temperature and the external forced convection caused by the wind is imported by ANSYS, and the solution is solved by reading these values at every time step.
Figure 3 shows the workflow of Computational Fluid Dynamics (CFD) simulation solution used in the present study. One second time step for 24 h is used through the four cases. The weather condition for Kuwait City (29.3759° N, 47.9774° E) on the 10th of June 2018 is used to make this comparison.
Figure 4 shows the variation of weather conditions in the daytime. The hourly variation of solar radiation and ambient air temperature during June, which represents the typical summer day in the Kuwait climate, are shown in
Figure 3. The sun rises at 5:00 a.m. and sets at 7:00 p.m. with approximately fourteen hours of solar hours; the maximum solar radiation recorded a value of 860 W/m
2 at 11:00 a.m. morning. At the same time, the air temperature fluctuated between the minimum and maximum values of 29 °C and 38 °C at 6:00 a.m. and 2:00 p.m., respectively. The window was oriented to the south direction, and the total solar radiation incident on the window glass surface is the measured value and displayed in
Figure 3.
For the window “without air cavity,” the outer temperature displayed on the figures is the instantaneous temperature for the outer surface of the silicon wafer. And the heat flux is estimated using Equation (7) on the indoor surface of the glazing facing the indoor environment.
3.3. Model Validation and Verification
The current model is validated by the authors in their previous studies [
22,
24] for the PV modeling and the vacuum glazing part. However, the PCM domain is validated with the results in the literature of the PCM cavity [
25]. Based on the predicted results, the current model for the PCM domain is in a good agreement with the results of [
25], as shown in
Figure 5. It is evident that the model accurately predicts the melting history of the PCM contained in the cavity at different inclination angles. Besides, the predicted solid-fluid interface behaves similarly to the experimental captured melting behavior measured by [
25] as seen in
Figure 6.
The laminar natural convection in the air cavity is also validated at different conditions. The current model was simulated for a 2D square cavity with an edge dimension of
Lr =
Hr = 0.75 m [
26]. The experiments in [
26] were conducted at a left wall at
Th = 50 °C and right wall at
Tc = 10 °C. The current CFD model is simulated at the same conditions, and the comparison between the predicted and the experimental results of [
26] are depicted in
Figure 7. In this case, the local temperature on a horizontal line was displayed in a dimensionless temperature form, Γ
= (T − Tc)/(Th −
Tc). The predicted local dimensionless temperature variation on a horizontal line locates at y =
Hr/2 was compared with their pairs in the experiment. The experimental points are in
Figure 7. Therefore, the current CFD model with the mentioned turbulence settings showed a very good agreement with the experimental data in [
26].


 ,
, 


