False Alarms Analysis of Wind Turbine Bearing System


Ingenium Research Group, ETSII, Avda. Campus Universitario S/N, 13071 Ciudad Real, Spain
*
Author to whom correspondence should be addressed.
Sustainability 2020, 12(19), 7867; https://0-doi-org.brum.beds.ac.uk/10.3390/su12197867
Submission received: 9 August 2020
/
Revised: 14 September 2020
/
Accepted: 17 September 2020
/
Published: 23 September 2020
(This article belongs to the Special Issue Ensuring Sustainability towards the 2030 Mission)
Abstract
:Wind turbines are complex systems that use advanced condition monitoring systems for analyzing their health status. The gearbox is one of the most critical components due to its elevated downtime and failure rate. Supervisory Control and Data Acquisition systems are employed in wind farms for condition monitoring and control in real time. The volume and variety of the data require novel and robust techniques for data analysis. The main novelty of this work is the development of a new modelling of the temperature curve of the gearbox bearing versus wind speed to detect false alarms. An approach based on data partitioning and data mining centers is employed. The wind speed range is divided into intervals to increase the accuracy of the model, where the centers are considered representative samples in the modelling. A method based on the alarm detection is developed and studied together with the alarms report provided by a real case study. The results obtained allow the identification of critical alarm periods outside the confidence interval. It is validated that the study of alarm identification, pre-filtered data, state variable, and output power contribute to the detection of the false alarms.
1. Introduction
Greenhouse gas emissions are the main contributors to global warming and climate change, e.g., specifically CO2 emissions account for 70% of greenhouse gas emissions [1]. The aviation industry is one of the greatest producers of greenhouse gases [2], although governments are providing incentives to airlines to optimize their routes to minimize CO2 emissions [3]. International maritime trade is another industry that has grown considerably over the last decade, and this trend is expected to continue [4], where its operations should be optimized to reduce the CO2 produced [5]. In the United Nations Framework Convention on Climate Change, the so called “Paris Agreement”, the parties proposed as a goal to reach the global maximum of greenhouse gases soon. In this context, China is the largest emitter of CO2 [6], currently working on its transition to lower carbon emissions and reduce consumption of fossil fuels [7].
Sustainability and green energies are main objectives to be accomplished by 2050. Wind energy is one of the most relevant renewable energy sources, reaching 597 GW of wind power capacity in 2018 [8]. The industry is growing constantly, and the trend is expected to continue in the future due to improvements in wind energy technology and economic policies of the governments. Despite the advances, the maintenance costs of wind turbines (WTs) are relevant, between 15% and 25% of the total investment for an onshore WT, and 35% in offshore WTs [9]. Suitable monitoring operations and maintenance activities are required for ensuring the sustainability of electricity generation [10].
The system must work efficiently without failures to comply WT sustainability requirements. The Supervisory Control and Data Acquisition (SCADA) system acquires data from sensors from critical components of WT. In this paper, SCADA provides the following statistical parameters of the signal for the interval of 10 min: mean, maximum, minimum, and standard deviation [11,12]. The measurements depend on environmental factors, e.g., wind speed, ambient temperature, etc. [13]. SCADA system provides signal data related to different parameters such as temperature, orientation, or electric behavior among others, and alarms that are activated when certain conditions of the WT are reached. Several issues in the sensors or the SCADA system may lead to false alarms, indicating a failure when the real condition of the WT is healthy, increasing the maintenance costs and downtimes [14,15]. Due to different nature and volume of the data, new methods are required for fault detection and diagnosis [16,17], and accurate methods to reduce and identify false alarms [18].
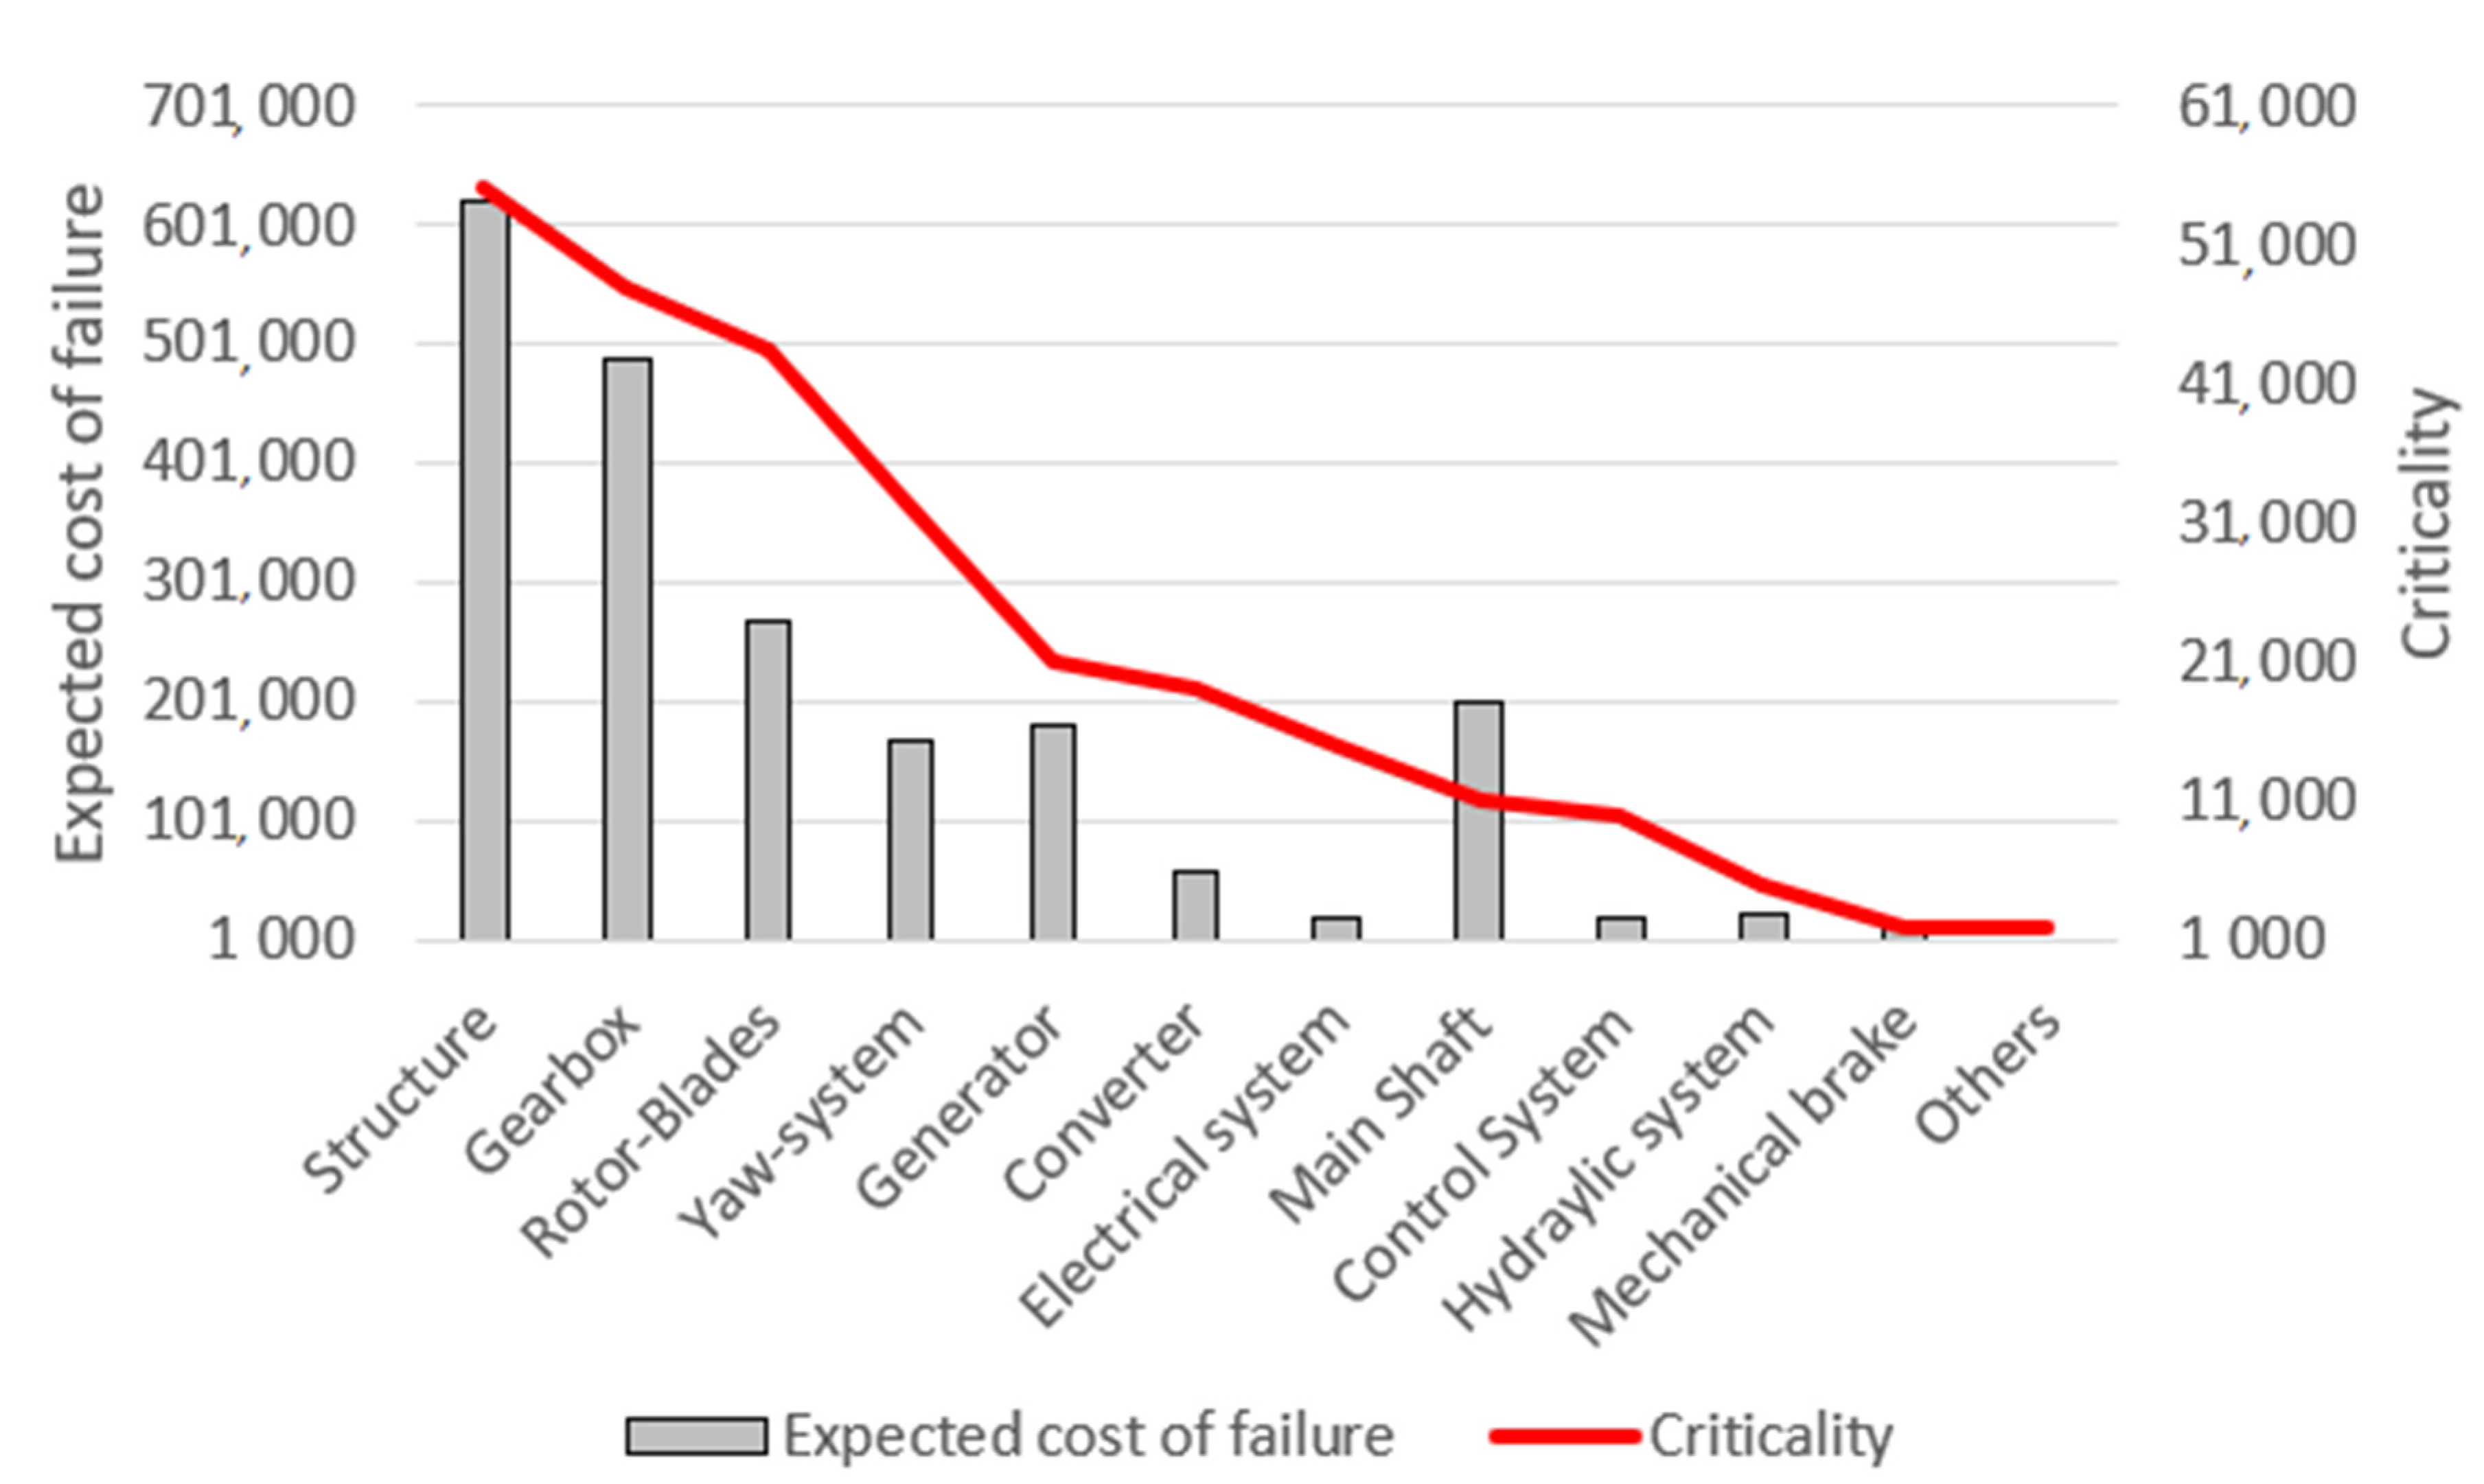
Figure 1 shows the criticality and expected cost of failures for the main WT components [19]. The expected cost of failure is defined as the probability and cost associated to a failure, also considering the loss of production cost. The criticality is the product between the expected failure cost and the failure rate. According to Figure 1, the gearbox presents one of the most elevated expected costs and criticality levels. The costs of gearbox replacement and downtimes for maintenance operations are bigger compared to other components of the WT [20]. Downtimes produced by gearbox replacements are approximately 20% of the total downtimes [21]. The occurrence factor was calculated according to the average rate extracted from the SCADA data, and the severity factor was based on the decrease in the production of energy generated by the failure modes.
Bearings have been determined to cause the majority of the WT gearbox failures [22] due to dynamic and unpredictable stresses [23,24]. The WT temperatures are a fundamental indicator of the WT health, and thermal increments may indicate overload, lubrication, or cooling issues [25]. The temperature monitoring and analysis of the gearboxes and bearings can, therefore, prevent failures [26,27].
Prognosis and health management of WT bearings, following Ouyang [28], are divided in this paper into four phases: Data acquisition; feature extraction; construction of the health indicator; and remaining life prediction. The wind-power speed curve of a WT is usually employed to set the system condition. Several techniques are applied for modelling these curves, mainly divided into parametric and non-parametric approaches [29,30]. The principal parametric techniques are linearized segmented model, polynomial power curve, etc. [31,32]. The main non-parametric techniques are copula power curve, cubic spline interpolation, neural networks, fuzzy methods, and data mining algorithms [28,33,34].
The main contribution of this paper to the state of the art is the study of the gearbox bearing temperature and wind speed to detect faults and false alarms in the gearbox. The novelties proposed are based on the segmentation of temperature curve for determining the optimal centers, increasing the false alarm detection for temperature analysis. Ouyand et al. [35] used a similar partition approach for modelling wind-turbine power curve. The approach presented in this paper is adapted from [35] aiming to increment the number of centroids in the modelling efficiency. Once the points of interest are defined with this method, an analysis based on the condition detection is proposed, considering the power output analysis and the alarm information provided by the operators. With this information, it is possible to determine if the alarm is false or not.
This paper is structured into the following sections: Section 2 shows the approach based on data partitioning for data from gearbox bearing and wind speed; in Section 3, a real case study with three WTs and an analysis of the results is presented; finally, Section 4 provides the conclusions, summarizing the results.
2. Approach
This paper analyzes the data acquired from a gearbox bearing and the wind speed with the aim of obtaining an efficient modelling for reducing uncertainty due to false alarms and increasing the sustainability of energy generation [36,37]. The alarm activation produces the WT to stop in several cases. A study interval of 2 h before the WT stop is defined for ensuring the presence of data in the analysis. The approach developed in this work is based on the division of the temperature–wind speed curve in several intervals, or partition centers, defined with k-means, for obtaining an increment in the data analysis accuracy.
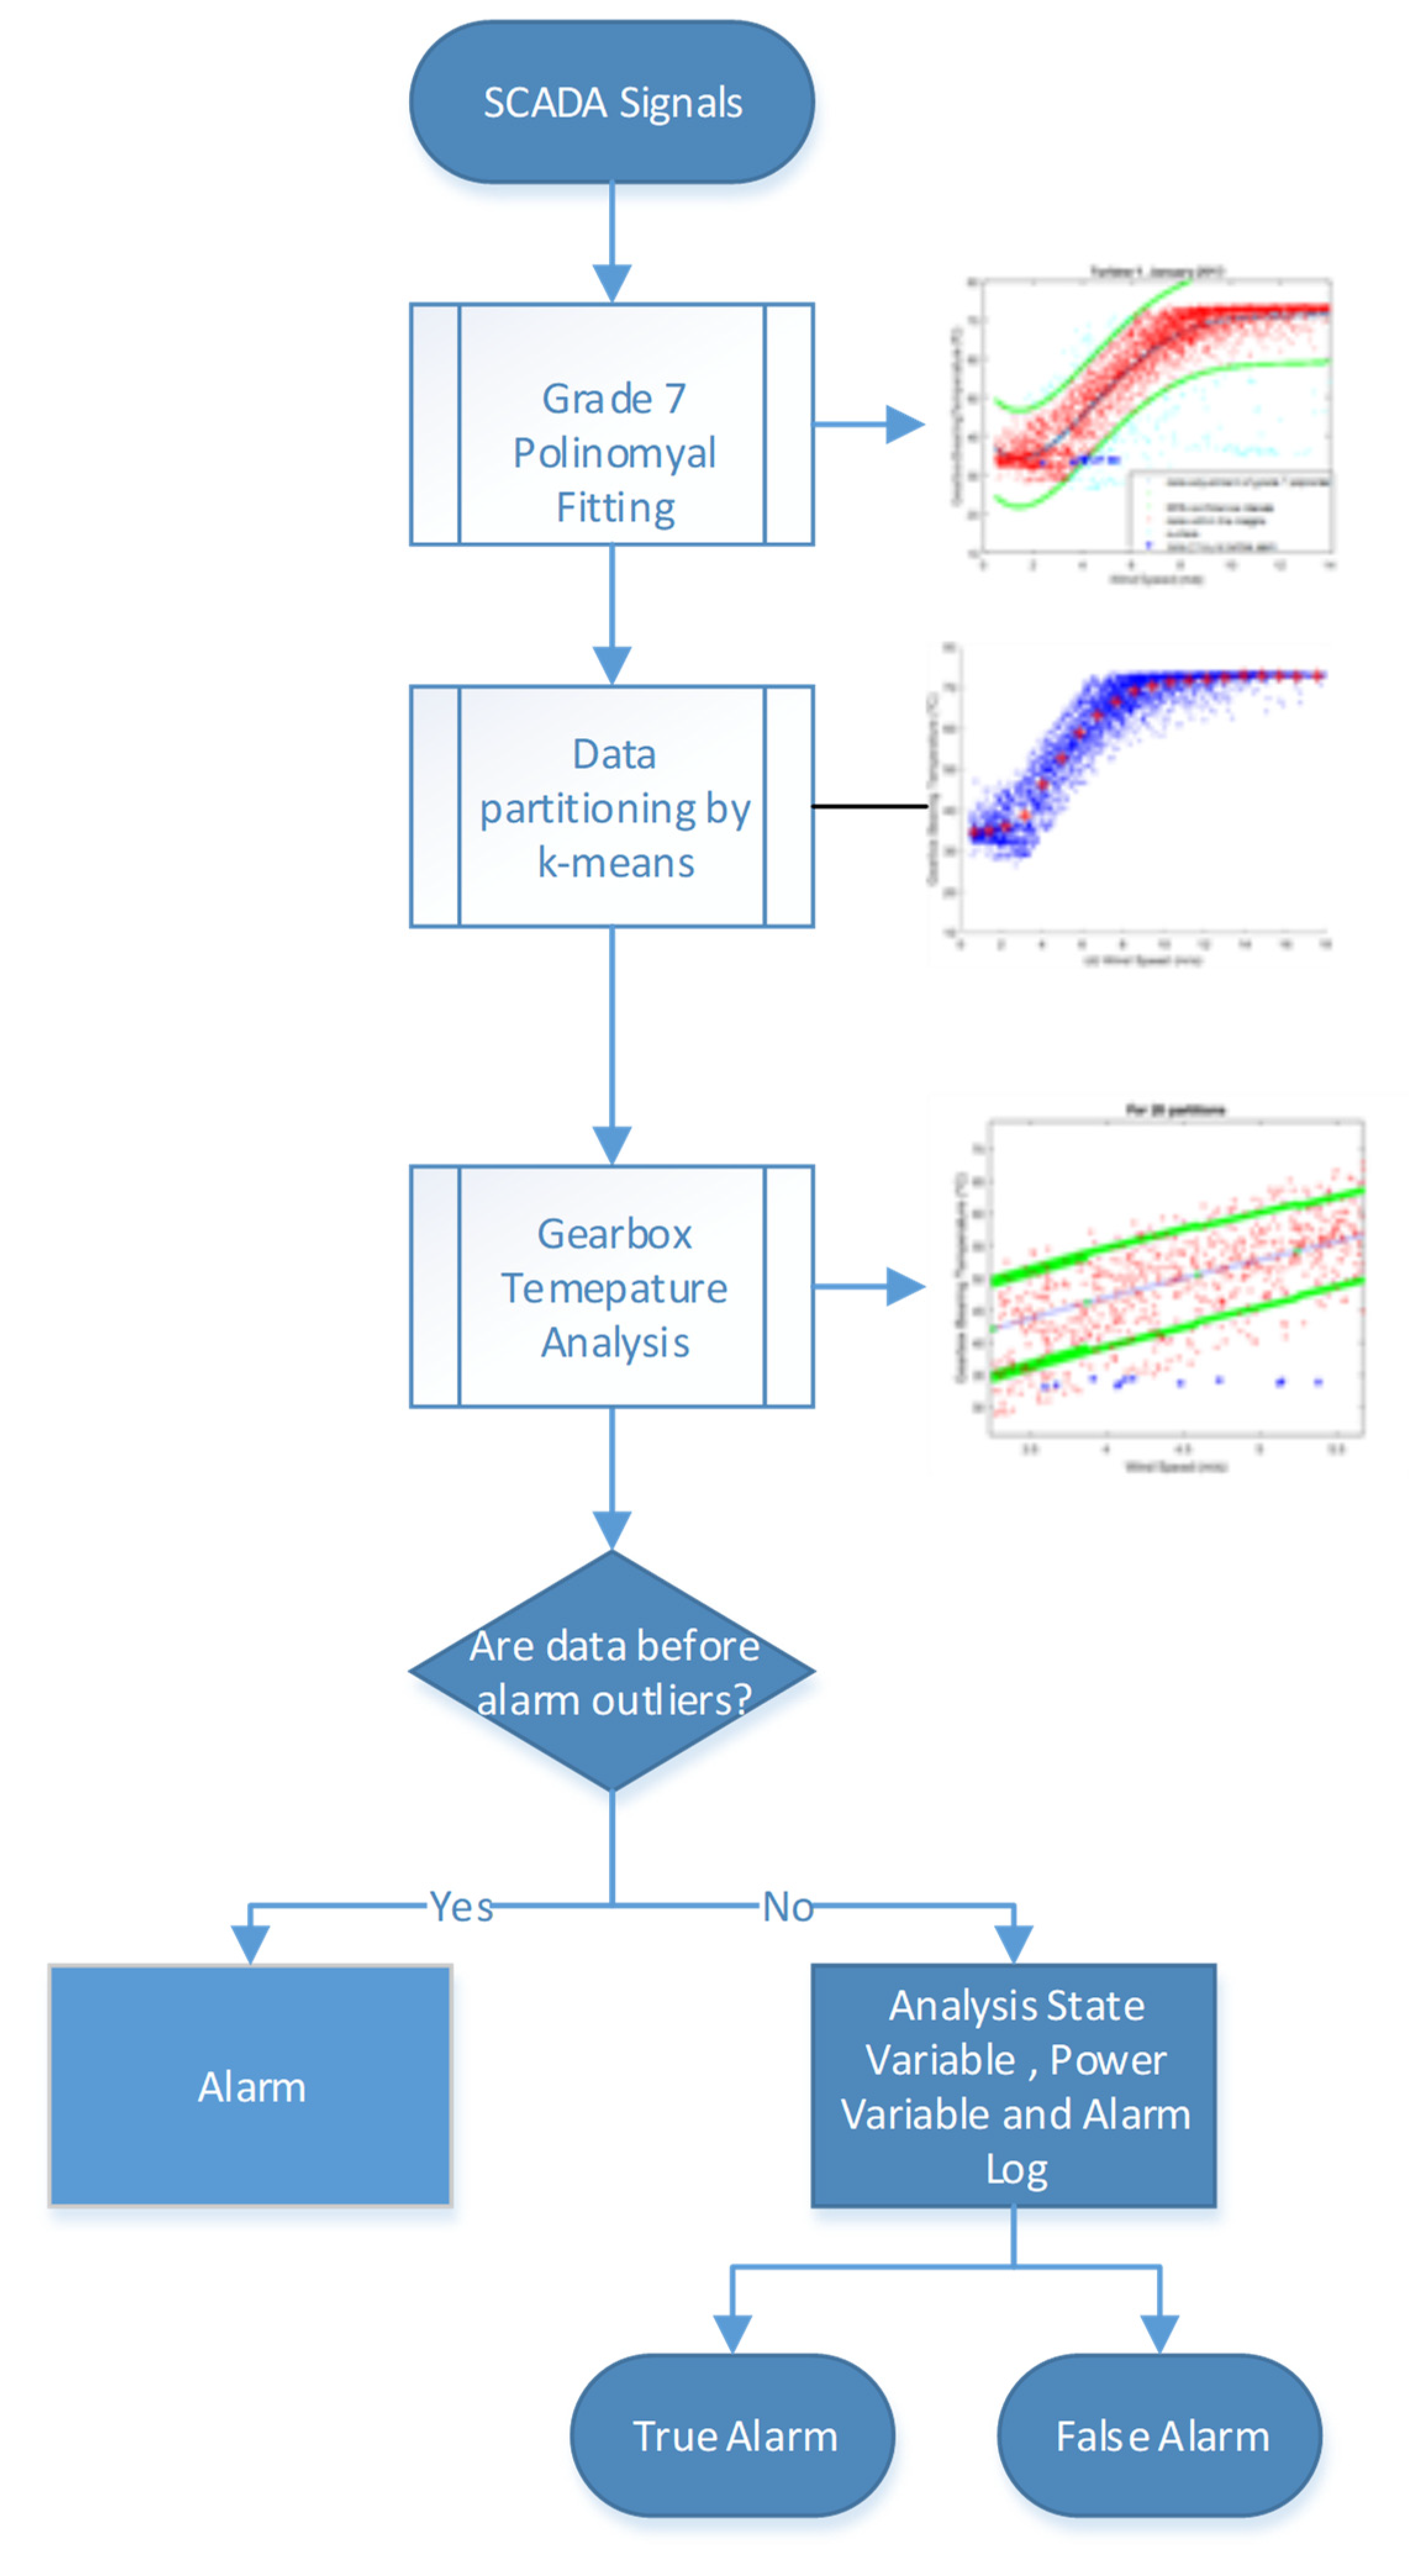
Figure 2 shows the diagram of the approach. In the first phase, SCADA signals, alarms, state variable, alarm log, and alarm manual are obtained. The state variable is only registered when the WT presents changes in the state. This variable and the output power must be coherent [38,39]. The alarm tutorial, or manual, is used to define the alarms. It is a document offered by the alarm management company that stablishes the normal behavior of the WT when different alarms arise, e.g., emergency, stop, fault, atmospheric condition, maintenance, shutdown, etc. It also shows the severity of the alarms and, in certain cases, the WT must be automatically shut down to avoid catastrophic failures [40]. The alarm log collects the information of the alarm activation and deactivation, the code, the description, and severity. The periodicity of the alarm log is not defined, and for this reason, several alarms may arise at the same time, known as alarm flood, producing an overload in the system [41].
For this real case, only average values are used by the SCADA data for each 10 min time interval of gearbox bearing temperature, wind speed, and power output. The data acquired are fitted to a polynomial of degree 7, according to a previous study [42]. The polynomial of degree 9 has a quadratic mean error (RMSE) of 4.808, and the polynomial of degree 7 has an RMSE of 4.809. The results are considered not significant; therefore, it was decided to employ grade 7 polynomial due to lower computational costs. The graph of the gearbox bearing temperature data versus wind speed is adjusted, therefore, to a grade 7 polynomial, and the outliers are eliminated. The decision to consider it a point as outliers is based on whether the point is within or outside the confidence interval. The next phase is the selection of the partition centers with the centroids calculated for 5, 10, 15, and 20 partitions.
The algorithm used to calculate the center points is based on the k-means algorithm, where a heuristic method is employed to find centroid seeds for k-means clustering. The k-means problem involves finding groups of points with the intra-group variance minimized, reducing the sum of the squared distances from each point to the center nearest to it [43].
The k-means algorithm divides the dataset into k-clusters. A uniform is chosen, and random observation of the dataset according to Har-Peled and Sadri [44], in this case from the wind speed data. The selected observation is the first center point, called c1. The distances from each observation to c1 are calculated, where the distance between cj and the observation m is defined as d(xm,cj). It is defined on the centroid c2 as random distance from wind speed and probability according to the Equation (1).
The centroid j is chosen as:
- Calculating the distances from each observation to each center and designating each observation to its nearest centroid.
- For m = 1,...,n and p = 1,...,j − 1, choosing centroid j at random from wind speed with probability according to the Equation (2), where is the set of all observations nearest to centroid , and xm fits to .
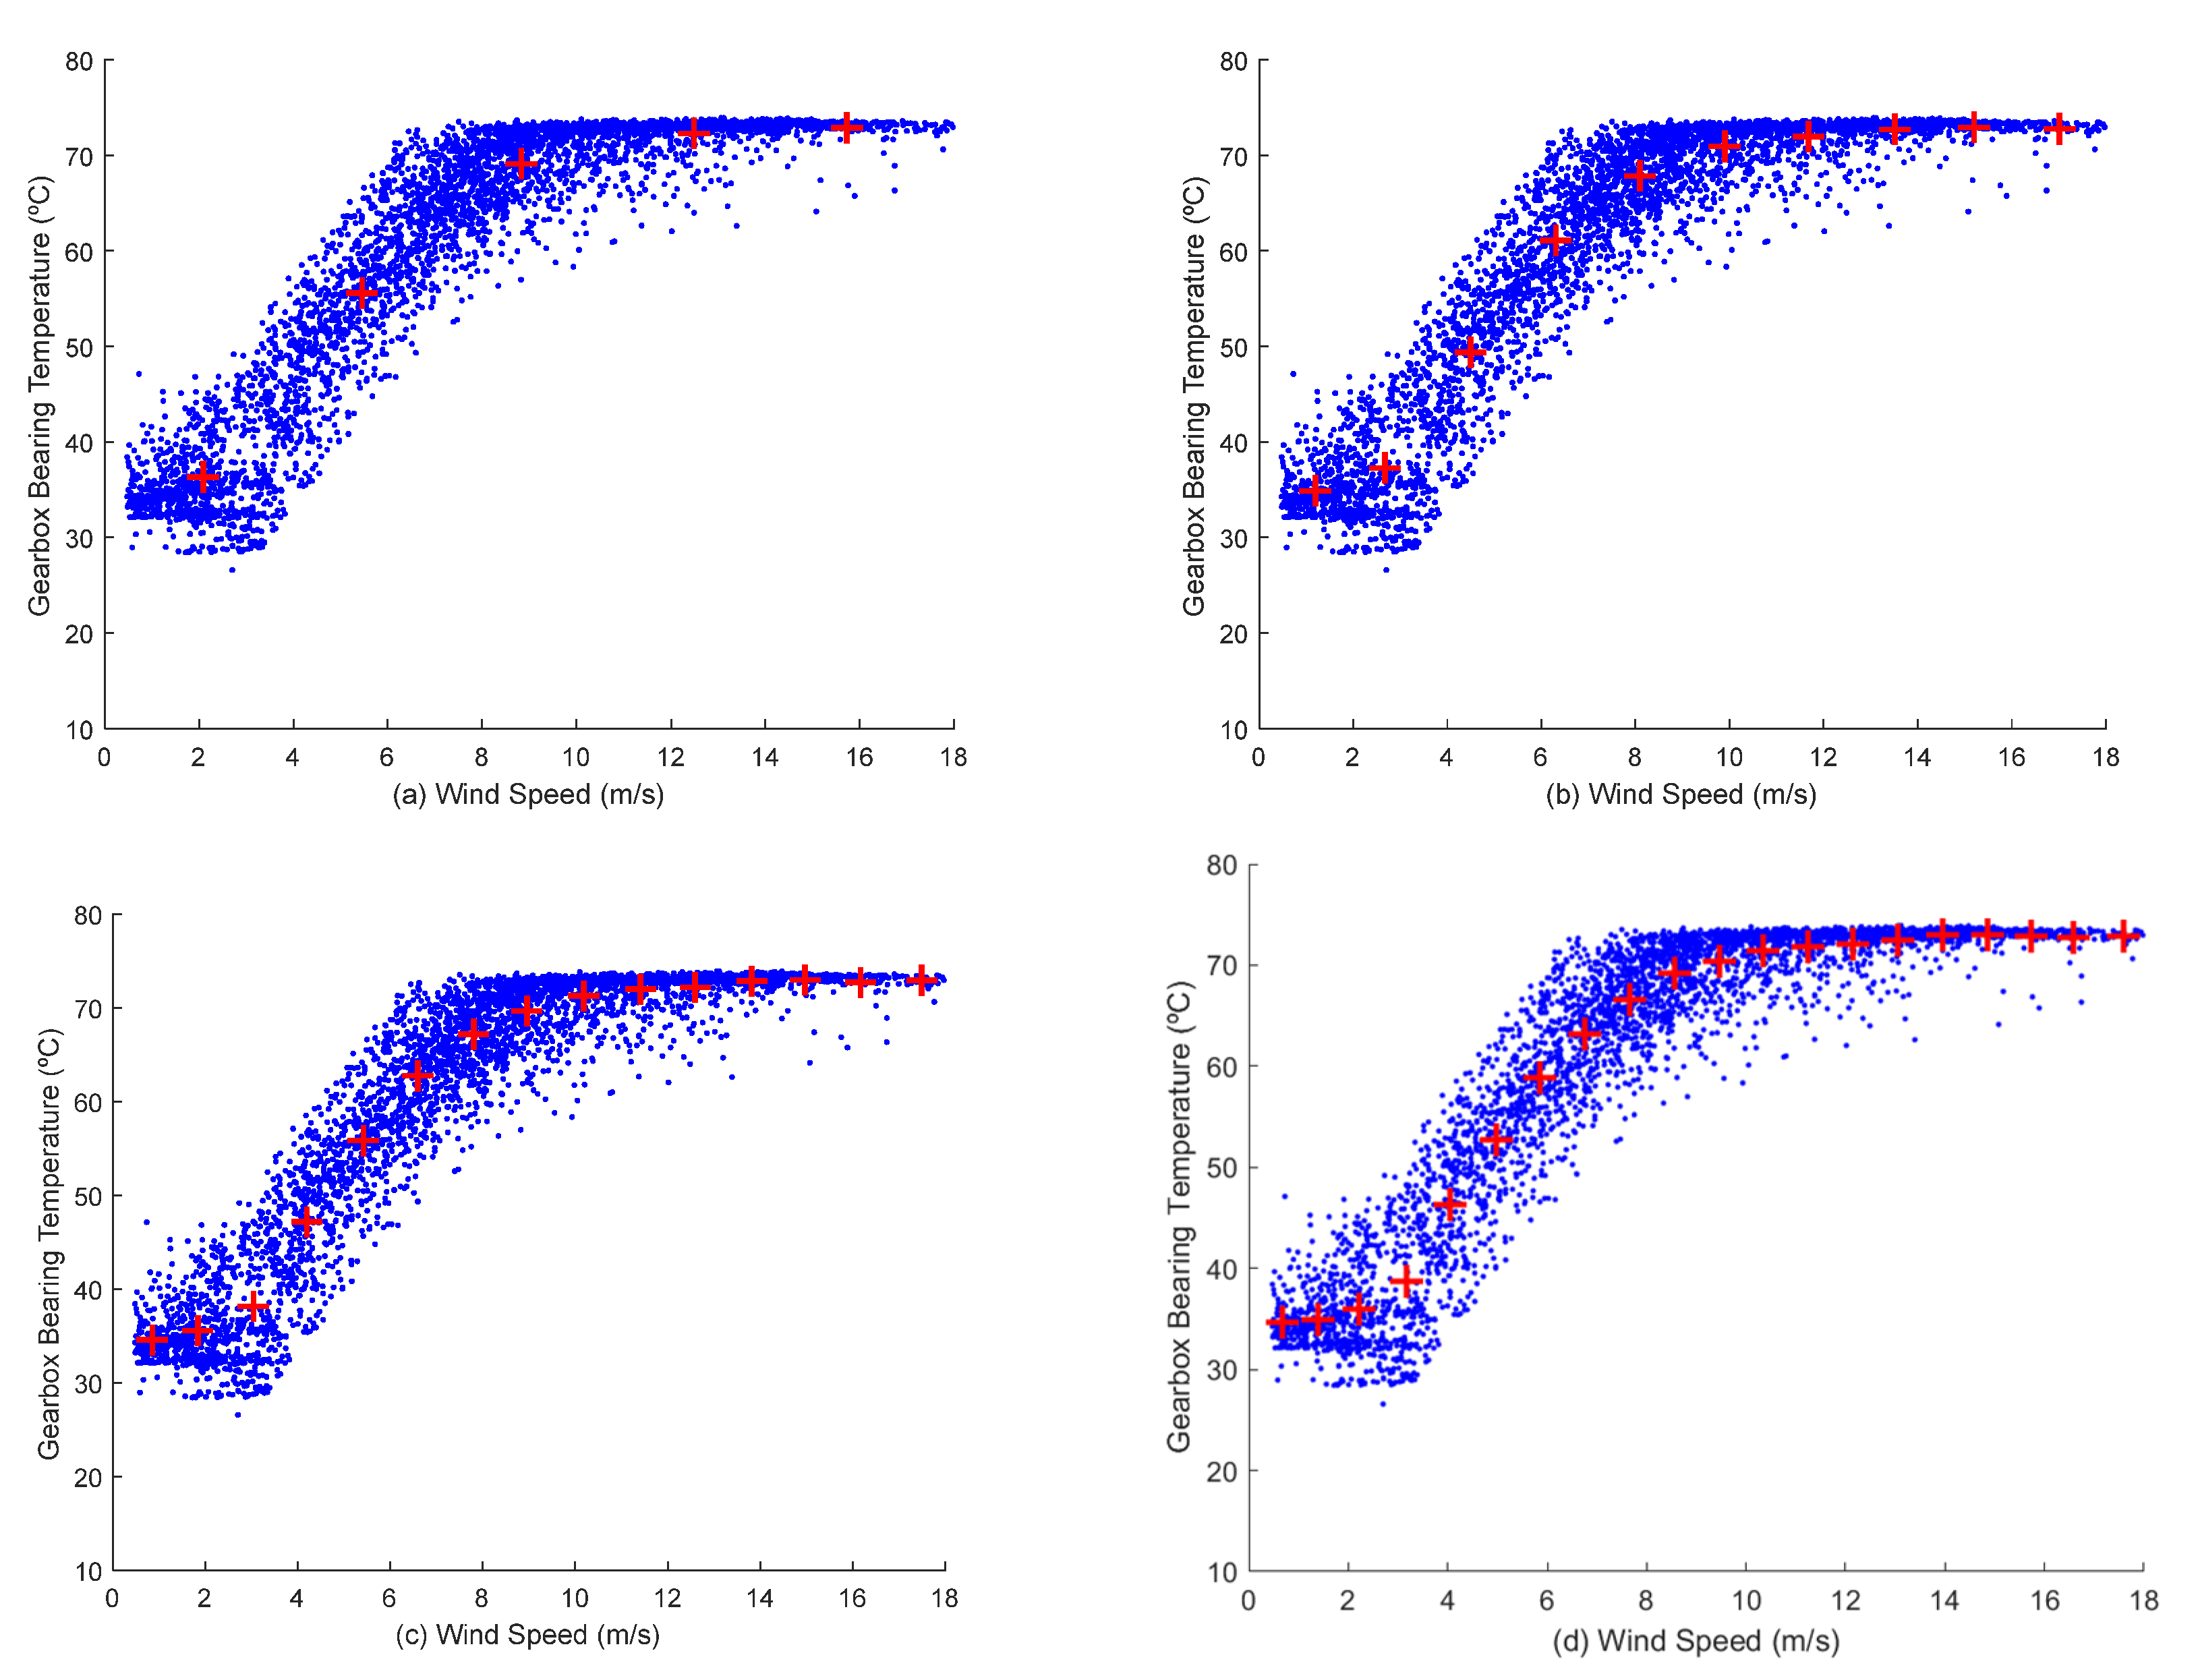
Each centroid is calculated with a probability proportional to the distance from itself to the nearest center previously calculated. This step is iterative until all k-centroids are chosen [45]. The partition centers are identified as Ci = (Wi,Ti), i = 1,2…N, where N is the number of partitions, Wi and Ti are the wind speed and gearbox bearing temperature, respectively, at the ith center. Figure 3 shows the different models applied, where the centres of each clusters are represented as red crosses, being the center distributions for different partitions developed in this paper.
The confidence interval is set to 95% according to references [46,47,48]. A dynamic fitting with this confidence interval is applied to each interval determined by the centroid, then the outliers are identified. Therefore, further analysis of outliers is required. If these data are classified as normal data (within the confidence interval), the state variable, the power output variable, and the alarm log are analyzed to determine if it is a false alarm.
3. Real Case Study and Results
The SCADA data employed correspond to the European project OPTIMUS. The proposed real case study considers SCADA data from three WTs in a time period of two years. It collected the signals of 40 variables every 10 min with a total of 101,752 samples. For each SCADA variable, the system provides a signal with maximum, minimum, average, and the standard deviation. In this case, the average signal has been used for gearbox bearing temperature, power output, and wind speed. The data were filtered, where ‘nan’ values obtained by the SCADA system were eliminated for this study, since they are considered as wrong data according to the company.
The alarm log collects information of the alarms and the activation period providing the following data: Alarm code; description; timestamp of data collection of activation; and timestamp of data collection of deactivations. The behavior of the WT is analyzed statistically. The scenarios are studied when an alarm occurs in the gearbox system. For this case study, five different alarms are considered, shown in Table 1. The WT is not working when these alarms are activated because this information is derived from the power output variable and the state variable.
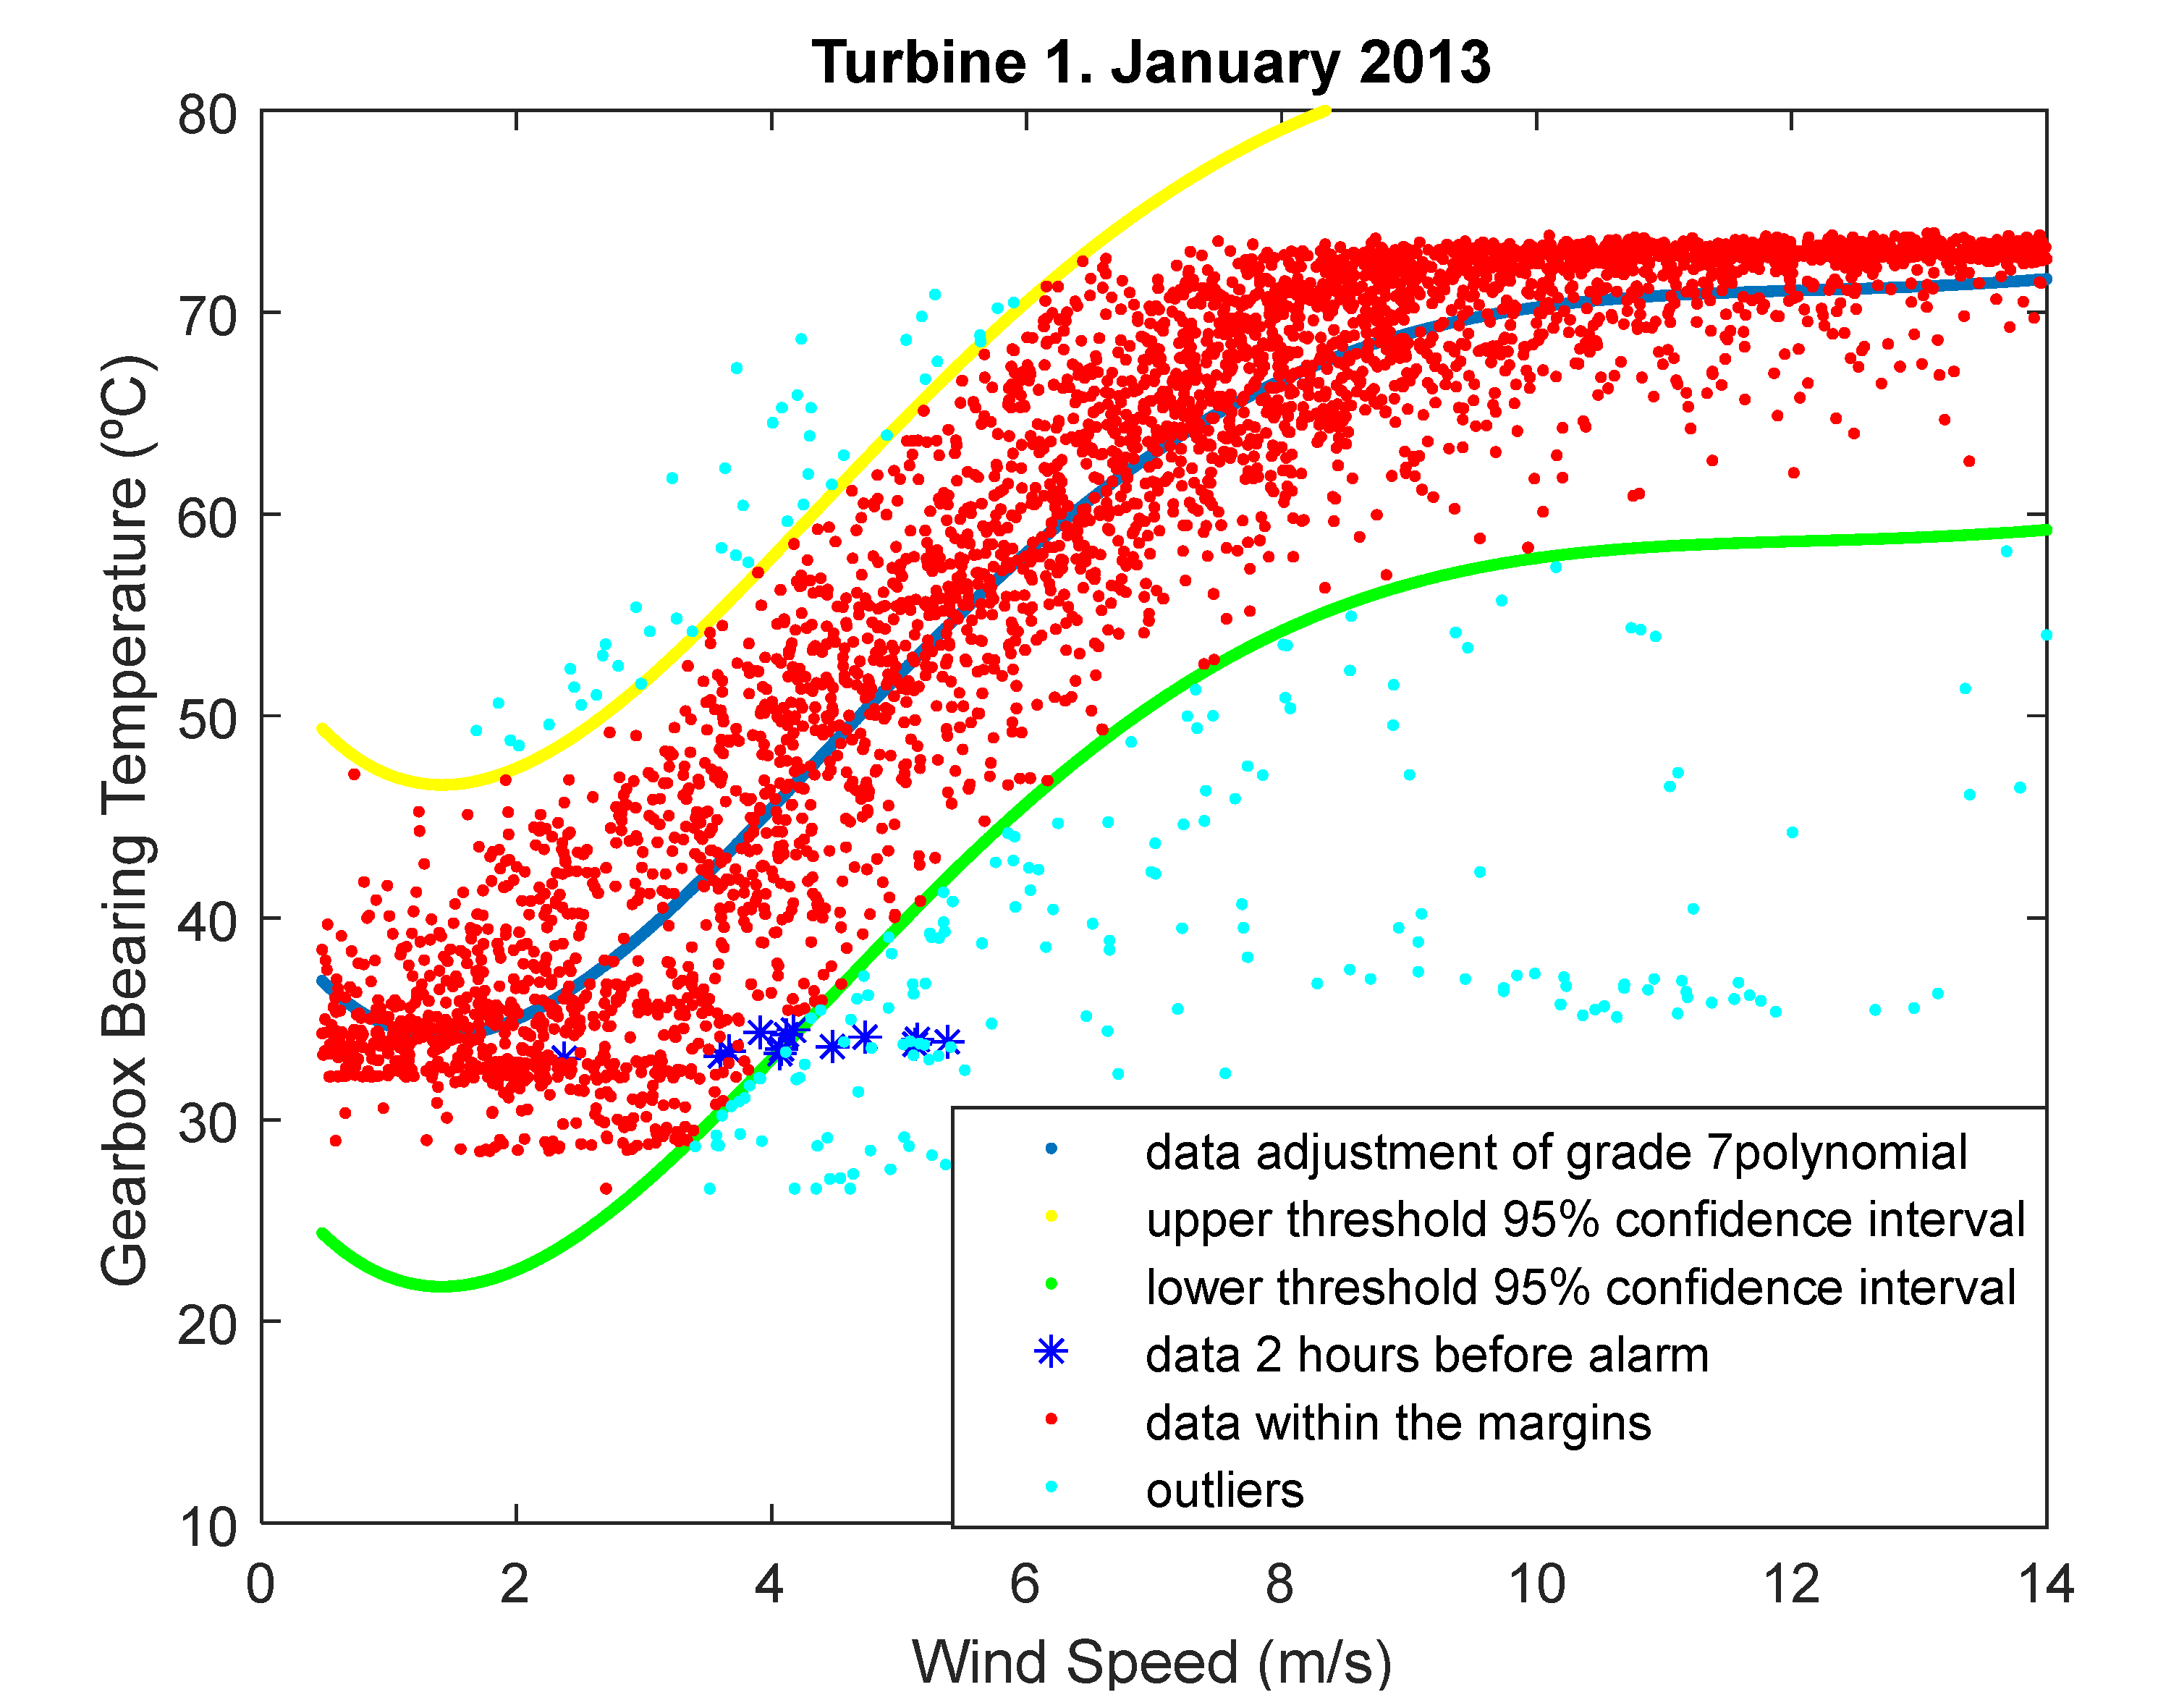
Gearbox bearing temperature versus wind speed is studied to determine the alarms produced in the gearbox. Post-processing of the data performed is presented, using a grade 7 polynomial adjustment to reduce the amount of data, with a 95% confidence interval, given by green and yellow lines in Figure 4. The points outside of the confidence interval are identified as outliers. The blue points are the SCADA data measured two hours before of the WT deactivation, with 12 measurements being detected. Figure 4 shows that different blue points are inside the confidence intervals, and it is necessary a new calculation of confident intervals to confirm that these points are outliers. The bearing gearbox temperature sensor has a saturation at 75 °C; therefore, at higher temperature, it activates an alarm to stop the WT due to overheating of the component, but this has never occurred in this case of study. The fact that the temperature of the gearbox bearing is stabilized for wind speed between 6 and 14 m/s affects the grouping of k-means.
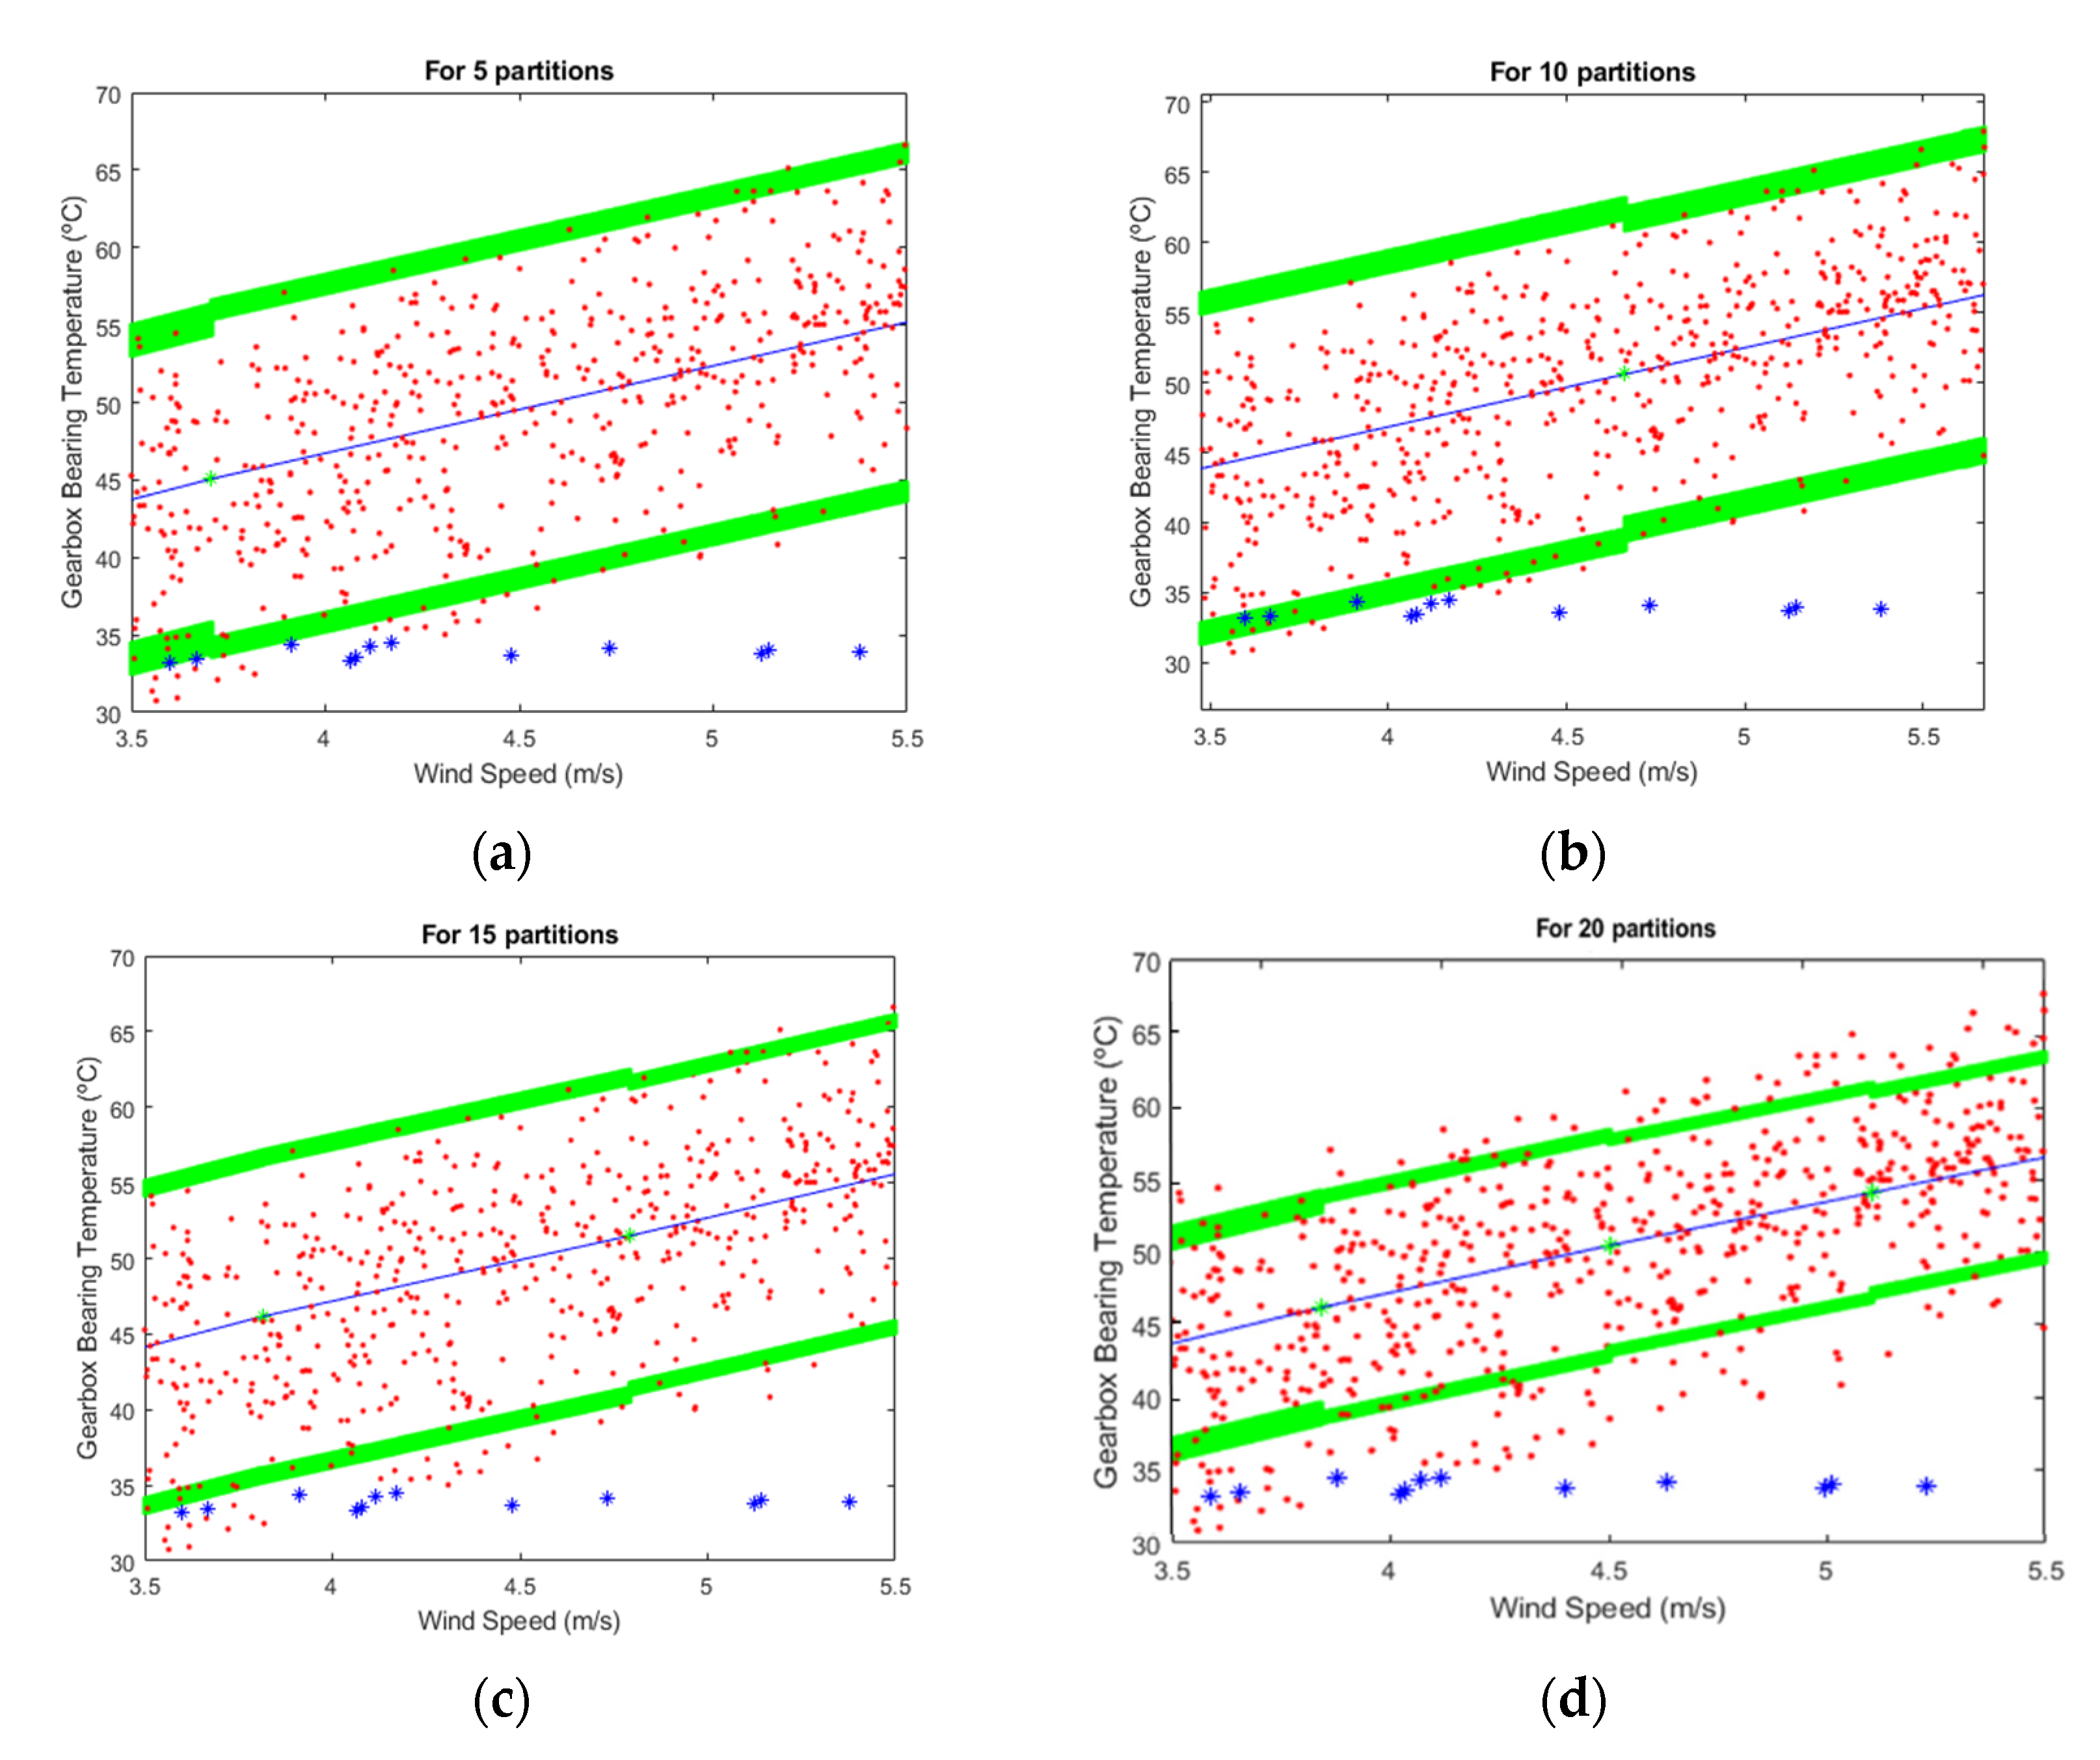
The dataset is divided with the partitions obtained from the k-means approach, and each partition is analyzed with its confidence interval. Figure 5 analyses the same alarm region of interest with several partitions. The variables related to alarms, the state and output power, are analyzed together considering the alarm manual, leading to the correct condition of the WT.
Figure 4 shows that the measurements before the alarm activation appear within the confidence interval employing only the polynomial 7 used in reference [42]. However, in Figure 5, where the approach is applied, those measurements are classified as outliers, allowing the identification of critical alarm periods outside the confidence interval. The new confidence intervals, defined by green lines, present different values, but in two cases, for 15 and 20 partitions, all the interest alarms are outside the confidence interval. From these observations, it is concluded that the number of partitions may be greater than 15 to ensure that the alarm interest period is outside the confidence interval.
Once all the points are defined as outliers, it is concluded that:
- 1
- The first alarm is produced due to a low temperature of the gearbox oil. The alarm is activated 15 h after the WT is turned off and starts working without any maintenance operations. There is no information in the state variable for determining the WT stop, although this variable indicates that the WT has been stopped due to “atmospheric conditions” at least 12 h. There are outliers before the shutdown (blue points in Figure 4), but no alarms have been activated at that time. The main hypothesis is the delay of the alarm, and this alarm is related to the outliers detected with the methodology. Another possible cause is the decreasing of the gearbox temperature due to low environmental temperatures for 15 h. The results are not convincing, and more data are required to check the cause and the classification of the alarm.
- 2
- The alarms 2 and 4 occur at the same time for WTs 1 and 2. Both WTs coincide in downtime periods and the state variable provides the same information. The alarm activation time is reduced, about 2 min. The system has not enough time to react and there are no maintenance activities carried out, and this alarm is set as false.
- 3
- The third alarm has an abnormal behavior, with 23 alarms in an interval of 5 s. The state variable indicates emergency, implying that the reset must be manual and local, then the state variable indicates that there are maintenance actions for more than one hour. When the alarms are activated, the SCADA system takes nonsense measures, being evidence that an anomaly is occurring. The gearbox system alarm is not caused by a failure in the gearbox, because the alarms triggered belong to different components and alarm systems. The maintenance time is insufficient to perform maintenance on the gearbox itself. With the data obtained and analyzed, it can be stated that this is a SCADA system failure and not a gearbox failure.
- 4
- The alarm 5 is activated and deactivated in five times in an interval of time of 40 min. The SCADA system offers null values before and after the alarm appears for all SCADA variables, and the maintenance activities are carried out.
The causes of the above alarms are studied and classified as false or true. The hypothesis for considering the alarm as false is based in the absence of failures in the gearbox (see Table 2). The reliability of the status variable has been analyzed according to the alarm manual.
4. Conclusions
The main novelty presented in this method is the early prediction of failures for false alarm identification by employing center partitions. The data studied are obtained by a Supervisory Control and Data Acquisition system. The analysis of the gearbox temperature, the state variable, and the power output have been considered and studied. The application of partitions method allows the identification of critical alarm periods outside the confidence interval, in comparison with other methods, e.g., polynomial grade 7. For this particular case, the different partitions approach does not provide variations in the data filtered, and further research is needed to analyze the partitions. It is proved that the combination between alarm identification, prefiltering data, state variables, and output power contribute to false alarm identification. Different alarms of the gearbox system are presented, and it has been verified that the alarms are false, because the operators do not carry out any maintenance activity in the wind turbine and no failures were detected. The alarms have been caused by various factors such as: erroneous measures, appearance of many alarms in a short time, failures, etc. The application of the methodology proposed in this work ensures the sustainability of the wind energy production. This method has only been applied to the alarms produced in the gearbox system. For future research, it is proposed to study the alarms of other components such as generator, power converter, etc. On the other hand, it would also be interesting to combine this method with other machine learning approaches, e.g., classification learner, and to consider more variables to the study, and to be able to determine with a greater degree of accuracy the cases of false alarms.
Author Contributions
The work presented here was carried out through the cooperation of all authors. F.P.G.M., I.S.R. and A.M.P.C. conducted the research and wrote the paper. They edited the manuscript including the literature review. F.P.G.M., I.S.R. and A.M.P.C.; methodology, F.P.G.M., I.S.R. and A.M.P.C.; software, A.M.P.C.; validation, F.P.G.M., I.S.R. and A.M.P.C.; formal analysis, F.P.G.M., I.S.R. and A.M.P.C.; resources, F.P.G.M.; data curation, F.P.G.M.; writing—original draft preparation, F.P.G.M., I.S.R. and A.M.P.C.; writing—review and editing, F.P.G.M., I.S.R. and A.M.P.C.; visualization, F.P.G.M., I.S.R. and A.M.P.C.; supervision, F.P.G.M.; project administration, F.P.G.M.; funding acquisition, F.P.G.M. All authors have read and agreed to the published version of the manuscript.
Funding
This research was funded by the Dirección General de Universidades, Investigación e Innovación of Castilla-La Mancha, under Research Grant ProSeaWind project (Ref.: SBPLY/19/180501/000102).
Acknowledgments
The authors like to thank Alfredo Peinado (Birmingham University, UK) for his detailed revision of the context.
Conflicts of Interest
The authors declare no conflict of interest.
References
- Lin, B.; Xu, M. Regional differences on CO2 emission efficiency in metallurgical industry of China. Energy Policy 2018, 120, 302–311. [Google Scholar] [CrossRef]
- Dube, K.; Nhamo, G. Climate change and the aviation sector: A focus on the Victoria Falls tourism route. Environ. Dev. 2019, 29, 5–15. [Google Scholar] [CrossRef]
- Lo, P.L.; Martini, G.; Porta, F.; Scotti, D. The determinants of CO2 emissions of air transport passenger traffic: An analysis of Lombardy (Italy). Transp. Policy 2020, 91, 108–119. [Google Scholar] [CrossRef]
- Abioye, O.F.; Dulebenets, M.A.; Pasha, J.; Kavoosi, M. A Vessel Schedule Recovery Problem at the Liner Shipping Route with Emission Control Areas. Energies 2019, 12, 2380. [Google Scholar] [CrossRef] [Green Version]
- Dulebenets, M.A.; Moses, R.; Ozguven, E.E.; Vanli, A. Minimizing Carbon Dioxide Emissions Due to Container Handling at Marine Container Terminals via Hybrid Evolutionary Algorithms. IEEE Access 2017, 5, 8131–8147. [Google Scholar] [CrossRef]
- Andersson, F.N.; Opper, S.; Khalid, U. Are capitalists green? Firm ownership and provincial CO emissions in China. Energy Policy 2018, 123, 349–359. [Google Scholar] [CrossRef]
- Zhang, N.; Liu, G.; Chen, C.; Zhang, Y.; Hao, Y.; Casazza, M. Medium-to-long-term coupled strategies for energy efficiency and greenhouse gas emissions reduction in Beijing (China). Energy Policy 2019, 127, 350–360. [Google Scholar] [CrossRef]
- W.H. OFFICE. Wind Power Capacity Worldwide Reaches 597 GW, 50,1 GW added in 2018. Available online: https://wwindea.org/blog/2019/02/25/wind-power-capacity-worldwide-reaches-600-gw-539-gw-added-in-2018/ (accessed on 17 February 2020).
- Zhao, H.-S.; Zhang, X.-T. Early Fault Prediction of Wind Turbine Gearbox Based on Temperature Measurement. In Proceedings of the 2012 IEEE International Conference on Power System Technology (POWERCON), Auckland, New Zealand, 30 October–2 November 2012; pp. 1–5. [Google Scholar]
- Márquez, F.P.G.; Karyotakis, A.; Papaelias, M. Renewable Energies: Business Outlook 2050; Springer: Geneva, Switzerland, 2018. [Google Scholar]
- Patel, K.K.; Patel, S.M. Internet of things-IOT: Definition, characteristics, architecture, enabling technologies, application & future challenges. Int. J. Eng. Sci. Comput. 2016, 6. [Google Scholar] [CrossRef]
- Márquez, F.P.G.; Marugán, A.P.; Pérez, J.M.P.; Hillmansen, S.; Papaelias, M. Optimal Dynamic Analysis of Electrical/Electronic Components in Wind Turbines. Energies 2017, 10, 1111. [Google Scholar] [CrossRef] [Green Version]
- Jiménez, A.A.; Márquez, F.P.G.; Moraleda, V.B.; Muñoz, C.Q.G. Linear and nonlinear features and machine learning for wind turbine blade ice detection and diagnosis. Renew. Energy 2019, 132, 1034–1048. [Google Scholar] [CrossRef] [Green Version]
- Gomez, C.Q.; Garcia, F.P.; Arcos, A.; Cheng, L.; Kogia, M.; Papaelias, M. Calculus of the defect severity with EMATs by analysing the attenuation curves of the guided waves. Smart Struct. Syst. 2017, 19, 195–202. [Google Scholar] [CrossRef]
- Jiménez, A.A.; Zhang, L.; Muñoz, C.Q.G.; Márquez, F.P.G. Maintenance management based on Machine Learning and nonlinear features in wind turbines. Renew. Energy 2020, 146, 316–328. [Google Scholar] [CrossRef]
- Márquez, F.P.G.; Ramírez, I.S.; Pliego-Marugán, A. Decision Making using Logical Decision Tree and Binary Decision Diagrams: A Real Case Study of Wind Turbine Manufacturing. Energies 2019, 12, 1753. [Google Scholar] [CrossRef] [Green Version]
- Márquez, F.P.G.; Tobias, A.M.; Pérez, J.M.P.; Papaelias, M. Condition monitoring of wind turbines: Techniques and methods. Renew. Energy 2012, 46, 169–178. [Google Scholar] [CrossRef]
- Marugán, A.P.; Márquez, F.P.G. Advanced analytics for detection and diagnosis of false alarms and faults: A real case study. Wind. Energy 2019, 22, 1622–1635. [Google Scholar] [CrossRef]
- Tazi, N.; Châtelet, E.; Bouzidi, Y. Using a Hybrid Cost-FMEA Analysis for Wind Turbine Reliability Analysis. Energies 2017, 10, 276. [Google Scholar] [CrossRef] [Green Version]
- Carroll, J.; Koukoura, S.; McDonald, A.; Charalambous, A.; Weiss, S.; McArthur, S.D.J. Wind turbine gearbox failure and remaining useful life prediction using machine learning techniques. Wind. Energy 2018, 22, 360–375. [Google Scholar] [CrossRef] [Green Version]
- Mandic, G.; Nasiri, A.; Muljadi, E.; Oyague, F. Active Torque Control for Gearbox Load Reduction in a Variable-Speed Wind Turbine. IEEE Trans. Ind. Appl. 2012, 48, 2424–2432. [Google Scholar] [CrossRef]
- Muñoz, C.Q.G.; Márquez, F.P.G.; Crespo, B.H.; Makaya, K. Structural health monitoring for delamination detection and location in wind turbine blades employing guided waves. Wind. Energy 2019, 22, 698–711. [Google Scholar] [CrossRef] [Green Version]
- Kusiak, A.; Verma, A. Analyzing bearing faults in wind turbines: A data-mining approach. Renew. Energy 2012, 48, 110–116. [Google Scholar] [CrossRef]
- Abdusamad, K.B.; Gao, D.W.; Muljadi, E. A Condition Monitoring System for Wind Turbine Generator Temperature by Applying Multiple Linear Regression Model. In Proceedings of the 2013 North American Power Symposium (NAPS), Manhattan, KS, USA, 22–24 September 2013; pp. 1–8. [Google Scholar]
- Cambron, P.; Masson, C.; Tahan, A.; Pelletier, F. Control chart monitoring of wind turbine generators using the statistical inertia of a wind farm average. Renew. Energy 2018, 116, 88–98. [Google Scholar] [CrossRef]
- Lei, Y.; Li, N.; Guo, L.; Li, N.; Yan, T.; Lin, J. Machinery health prognostics: A systematic review from data acquisition to RUL prediction. Mech. Syst. Signal Process. 2018, 104, 799–834. [Google Scholar] [CrossRef]
- Márquez, F.P.G.; Ramírez, I.S.; Mohammadi-Ivatloo, B.; Marugán, A.P. Reliability Dynamic Analysis by Fault Trees and Binary Decision Diagrams. Information 2020, 11, 324. [Google Scholar] [CrossRef]
- Ouyang, T.; Kusiak, A.; He, Y. Modeling wind-turbine power curve: A data partitioning and mining approach. Renew. Energy 2017, 102, 1–8. [Google Scholar] [CrossRef]
- Jiménez, A.A.; Muñoz, C.Q.G.; Márquez, F.P.G. Machine Learning for Wind Turbine Blades Maintenance Management. Energies 2017, 11, 13. [Google Scholar] [CrossRef] [Green Version]
- Márquez, F.P.G.; García-Pardo, I.P. Principal component analysis applied to filtered signals for maintenance management. Qual. Reliab. Eng. Int. 2009, 26, 523–527. [Google Scholar] [CrossRef]
- Márquez, F.P.G.; Muñoz, J.M.C. A pattern recognition and data analysis method for maintenance management. Int. J. Syst. Sci. 2012, 43, 1014–1028. [Google Scholar] [CrossRef]
- Lydia, M.; Kumar, S.S.; Kumar, K.V.; Kumar, G.E.P. A comprehensive review on wind turbine power curve modeling techniques. Renew. Sustain. Energy Rev. 2014, 30, 452–460. [Google Scholar] [CrossRef]
- Muñoz, C.Q.G.; Jiménez, A.A.; Márquez, F.P.G. Wavelet transforms and pattern recognition on ultrasonic guides waves for frozen surface state diagnosis. Renew. Energy 2018, 116, 42–54. [Google Scholar] [CrossRef]
- Márquez, F.P.G.; Muñoz, C.Q.G. A New Approach for Fault Detection, Location and Diagnosis by Ultrasonic Testing. Energies 2020, 13, 1192. [Google Scholar] [CrossRef] [Green Version]
- Marugán, A.P.; Chacón, A.M.P.; Márquez, F.P.G. Reliability analysis of detecting false alarms that employ neural networks: A real case study on wind turbines. Reliab. Eng. Syst. Saf. 2019, 191, 106574. [Google Scholar] [CrossRef] [Green Version]
- Pérez, J.M.P.; Márquez, F.P.G.; Ruiz-Hernandez, D. Economic viability analysis for icing blades detection in wind turbines. J. Clean. Prod. 2016, 135, 1150–1160. [Google Scholar] [CrossRef] [Green Version]
- Muñoz, C.Q.G.; Márquez, F.P.G.; Jiménez, A.A.; Cheng, L.; Kogia, M.; Mohimi, A.; Papaelias, M. A heuristic method for detecting and locating faults employing electromagnetic acoustic transducers. Ekspolatacja Niezawodn. Maint. Reliab. 2017, 19, 493–500. [Google Scholar] [CrossRef]
- Márquez, F.P.G. An Approach to Remote Condition Monitoring Systems Management. In Proceedings of the IET International Conference on Railway Condition Monitoring, Birmingham, UK, 29–30 November 2006; pp. 156–160. [Google Scholar]
- Márquez, F.P.G. A new method for maintenance management employing principal component analysis. Struct. Durab. Health Monit. 2010, 6, 89–99. [Google Scholar]
- Jiménez, A.A.; Muñoz, C.Q.G.; Márquez, F.P.G. Dirt and mud detection and diagnosis on a wind turbine blade employing guided waves and supervised learning classifiers. Reliab. Eng. Syst. Saf. 2019, 184, 2–12. [Google Scholar] [CrossRef] [Green Version]
- Ahmed, K.; Izadi, I.; Chen, T.; Joe, D.; Burton, T. Similarity Analysis of Industrial Alarm Flood Data. IEEE Trans. Autom. Sci. Eng. 2013, 10, 452–457. [Google Scholar] [CrossRef]
- Chacón, A.M.P.; Zhang, L.; Márquez, F.P.G. Maintenance Management in Wind Turbines by Monitoring the Bearing Temperature. In Advances in Intelligent Systems and Computing; Springer Science and Business Media LLC: Berlin, Germany, 2019; pp. 678–687. [Google Scholar]
- Arthur, D.; Vassilvitskii, S. k-means++: The Advantages of Careful Seeding, Stanford 2006. Available online: http://ilpubs.stanford.edu:8090/778/ (accessed on 17 February 2020).
- Har-Peled, S.; Sadri, B. How Fast Is the k-Means Method? Algorithmica 2004, 41, 185–202. [Google Scholar] [CrossRef] [Green Version]
- Seber, G.A. Multivariate Observations; John Wiley & Sons: Hoboken, NJ, USA, 2009; Volume 252. [Google Scholar]
- Yang, X.; Yang, M.; Zeng, X.; Zhu, Y.; Zhou, Y. Fault Warning of Pitch System of Wind Turbine Based on Kernel Density Estimation. In Proceedings of the 8th Renewable Power Generation Conference (RPG 2019), Shanghai, China, 24–25 October 2019; pp. 1–5. [Google Scholar]
- Pandit, R.; Infield, D. SCADA-based wind turbine anomaly detection using Gaussian process models for wind turbine condition monitoring purposes. IET Renew. Power Gener. 2018, 12, 1249–1255. [Google Scholar] [CrossRef] [Green Version]
- Pandit, R.; Infield, D.; Carroll, J. Incorporating air density into a Gaussian process wind turbine power curve model for improving fitting accuracy. Wind Energy 2018, 22, 302–315. [Google Scholar] [CrossRef] [Green Version]
Figure 1.
Expected costs of failure and criticality for wind turbine (WT) components [19].
Figure 1.
Expected costs of failure and criticality for wind turbine (WT) components [19].

Figure 2.
Gearbox alarm analysis process.

Figure 3.
Different curve models: (a) 5 partitions; (b) 10 partitions; (c) 15 partitions; (d) 20 partitions.
Figure 3.
Different curve models: (a) 5 partitions; (b) 10 partitions; (c) 15 partitions; (d) 20 partitions.

Figure 4.
Gearbox bearing temperature curve versus wind speed without partition approach.

Figure 5.
Gearbox bearing temperature curve for: (a) 5 partitions; (b) 10 partitions; (c) 15 partitions; (d) 20 partitions.
Figure 5.
Gearbox bearing temperature curve for: (a) 5 partitions; (b) 10 partitions; (c) 15 partitions; (d) 20 partitions.


Table 1.
Summary results.
| Alarm Number | WT Analysed | Alarm Description | State Variable | Number of Activations of Other Alarms |
|---|---|---|---|---|
| 1 | 1 | Low temperature of gearbox oil | Pause | 3 |
| 2 | 1 | Gearbox frequency converter no feedbackGearbox oil flow no feedback | Stop | 5 |
| 3 | 1 | Gearbox bearing 1 PT100 error | Emergency | 23 |
| 4 | 2 | Gearbox bearing 1 PT 100 error Gearbox oil flow no feedback | Stop Fault | 6 |
| 5 | 3 | Gearbox frequency converter no feedback | I/O timeout Fault Stop | 11 |
Table 2.
Classification of alarms.
| Alarm | Description Causes | Alarm |
|---|---|---|
| 1 | The WT is stopped for more than 14 h before the alarm occurs. The gearbox temperature decreases because it tends to equalize with the ambient temperature. | N/A |
| 2 | Due to the short period of activation of the alarm, the system could not react. | False |
| 3 | Fault in the SCADA measurement system, sensors give unreal values | False |
| 4 | Due to the short period of activation of the alarm, the system could not react. Dependence on turbine 1 and 2, because these alarms occur at the same time, for no obvious reason. | False |
| 5 | SCADA system provides measurements in null and zero value intervals. 11 different alarms arise in half an hour, since the alarm system detects faults, although they are failures of the SCADA system itself and not of the WT components. | False |
© 2020 by the authors. Licensee MDPI, Basel, Switzerland. This article is an open access article distributed under the terms and conditions of the Creative Commons Attribution (CC BY) license (http://creativecommons.org/licenses/by/4.0/).
Share and Cite
MDPI and ACS Style
Chacón, A.M.P.; Ramírez, I.S.; Márquez, F.P.G. False Alarms Analysis of Wind Turbine Bearing System. Sustainability 2020, 12, 7867. https://0-doi-org.brum.beds.ac.uk/10.3390/su12197867
AMA Style
Chacón AMP, Ramírez IS, Márquez FPG. False Alarms Analysis of Wind Turbine Bearing System. Sustainability. 2020; 12(19):7867. https://0-doi-org.brum.beds.ac.uk/10.3390/su12197867
Chicago/Turabian StyleChacón, Ana María Peco, Isaac Segovia Ramírez, and Fausto Pedro García Márquez. 2020. "False Alarms Analysis of Wind Turbine Bearing System" Sustainability 12, no. 19: 7867. https://0-doi-org.brum.beds.ac.uk/10.3390/su12197867
Note that from the first issue of 2016, this journal uses article numbers instead of page numbers. See further details here.