Estimate of Secondary NO2 Levels at Two Urban Traffic Sites Using Observations and Modelling


Department of Engineering “Enzo Ferrari”, University of Modena and Reggio Emilia, 41125 Modena, Italy
*
Author to whom correspondence should be addressed.
Sustainability 2020, 12(19), 7897; https://0-doi-org.brum.beds.ac.uk/10.3390/su12197897
Submission received: 12 July 2020
/
Revised: 16 September 2020
/
Accepted: 21 September 2020
/
Published: 24 September 2020
Abstract
:Assessing secondary and primary NO2 in urban areas is important to support carefully designed environmental policies, particularly in areas with recurrent exceedance of NO2 regulatory limits. The share of secondary NO2 was preliminary estimated in intense traffic areas of Modena and Reggio Emilia (Northern Italy) by the combined analysis of regulatory air quality observations at urban traffic and urban background conditions. In addition simulations performed by the Lagrangian particle dispersion models Micro SWIFT SPRAY and the chemical transport model WRF-Chem were performed. The former was applied on the urban area representative of traffic conditions for both cities, in winter. The latter was applied twice in Modena, both with and without urban traffic emissions. Results suggest a large amount of secondary NO2 mainly at the Modena traffic site, and a better representativity of background conditions of the corresponding urban station in Reggio Emilia. NOx levels simulated by WRF-Chem show good results at Modena urban background and performance in line with reference benchmark values in reproducing observed NO2 and NOx concentrations at rural background sites, although a non-negligible bias in simulated urban NO2 remained. Overall the simulation models suggest that contribution to atmospheric NOx by domestic heating or industrial combustion emissions are not as relevant compared to traffic, consistently with the local emission inventory.
1. Introduction
Vehicle emissions are among the main sources of pollutants impairing air quality in urban areas. The level of pollution produced by traffic emissions is mainly influenced by the type of vehicles on the road, the volume of traffic and the distance from the street. However, weather conditions unfavorable to atmospheric dispersion can cause high level of vehicular traffic pollutants even at a great distance from busy roads. Indeed, high concentration peaks of the main combustion tracers, such as NOx, are measured by the local Environmental Agencies at both urban traffic and urban background sites.
The urban traffic stations, placed in close proximity to the busiest urban streets, are directly influenced by local traffic, while at background monitoring stations the pollution level should be influenced by the integrated contribution from all sources upwind of the station (Directive 2008/50/CE, received in Italy by the D.Lgs. 155—13 August 2010). However, vehicular emissions can strongly affect the urban air quality so much that during rush hours, traffic peaks are large even at urban background stations.
At urban traffic sites, vehicle emissions on the nearby roads sum with the urban background levels [1], and higher NOx concentration values are observed than at urban background stations. Moreover, the rural background concentrations can be attributed to natural sources and long range transport at local and global scale, with negligible influence of nearby sources. Therefore, according to the previous rationale [1], to identify the contribution of local and distant emission sources to atmospheric pollution in urban areas, air quality observations at rural, urban background and urban traffic sites must be compared. A recent study [2] demonstrated that the “Lenschow approach” [1] is a valuable method to estimate the impact of cities on their air pollution only when two assumptions are concurrently fulfilled. The first is verified when the pollution concentrations experienced at rural background sites are not influenced by the emissions occurred within the city of interest, whereas the second requires that rural background concentrations are identical between rural and city locations when city emissions are set to zero.
With the aim of investigating the contribution of different emission sources to urban air pollution, several methods have been tested in recent years, such as interpolation methods or land use regression models [3,4,5,6]. However, atmospheric dispersion models were proven to be among the most successful approach in reproducing pollutant concentrations, especially when applied for environmental impact assessments [7,8,9]. The skill of dispersion models to account also for obstacle-resolving domains at very high resolution (at micro scale) [10] makes them an effective tool to describe the fate of intra-urban atmospheric emissions and to support urban air pollution control strategies.
Nitrogen oxides (NOx) in vehicle exhausts consist of NO and NO2. The NO2 mass fraction of total NOx (primary NO2) is of particular importance for several reasons: Its higher toxicity, causing irritation of airways in the human respiratory system and aggravation of respiratory diseases [11,12], its higher atmospheric lifetime compared to NO and because regulatory limits are established for hourly maximum NO2 (Directive 2008/50/CE, received in Italy by the D.Lgs. 155—13 August 2010). NO is rapidly transformed to NO2 by photochemical atmospheric reactions, hence primary NO2 from vehicle exhaust emissions should be present mostly at urban traffic sites, i.e., in the immediate vicinity of the sources. Conversely, secondary NO2 should be prevailing at urban background sites, where air quality is affected by the combination of urban and regional pollutant contribution without the direct effect of nearby sources. Nevertheless, meteorological conditions favorable to air masses stagnation may produce similar concentration values at both urban traffic and background sites, consequently affecting also the atmospheric NO2/NOx ratio. The estimation of NO2 concentration values by the means of dispersion models can therefore be very complex.
Several methods have been recently applied to discern local traffic impact from the background. Among the others, it is worth mentioning the interpolation of rolling minima and the differences in downwind and upwind pollutant averages, both tested by Hilker, N. et al. [13] to distinguish between background and near-road pollution concentrations. Other statistical methods, based for example on hierarchical clustering or probabilistic approach such as the finite mixture models, have been implemented to estimate urban background concentrations using traffic and background measurements [14]. An alternative to statistical methods, as introduced before, is represented by air quality dispersion models, which at the cost of high computing resources combined with the need of qualified users can be exploited to elaborate specific emission scenarios. More in detail, by applying the so called Brute-force method [15,16] it is possible to isolate the effect of specific emission sources by performing and subtracting simulations with and without the source of interest.
On the other hand, when dispersion models are not designed to account for chemical reactions, different screening approaches have been defined by the EPA (Environmental Protection Agency) to calculate NO2 concentrations starting from NOx emissions. The latter, usually called Ambient Ratio Method [17], allow estimating the NO2/NOx ratio produced by specific emission sources, useful for comparison with the measured NO2/NOx ratio at the air quality station of interest.
In a recent study [18], the single micro scale lagrangian particle model (LPM) Micro SWIFT SPRAY (MSS) [19] was used to simulate the atmospheric dispersion of primary NOx vehicular emissions in urban areas with intense traffic, in Modena and Reggio Emilia (Northern Italy), i.e., the dispersion of NO and primary NO2, because LPMs are not able to simulate atmospheric chemistry processes. These two cities are located within the Po Valley, a European hotspot for NOx, whose weather is characterised by calm winds [9] and high pressure events producing long lasting high concentrations even in remote rural sites [20,21,22].
The NOx dispersion produced by urban traffic flows was also simulated for the city of Modena [23] adopting a multi-level modelling approach involving two different tools, the Parallel Micro SWIFT SPRAY (PMSS) [24,25] modelling system able to estimate the primary contribution of urban sources taking into account the effect of street canyon in urban complex environment and the WRF-Chem model [26]. This latter was applied to compute urban NOx background concentrations produced by the sources located outside the urban area of Modena or by emission sectors different from traffic both in and out of the urban area. Among the main advantages expressed by WRF-Chem it is worth remembering the ability to simulate the chemical transformation of trace gases and aerosols that occur in the atmosphere [27,28]. Therefore, it is possible to estimate the formation of secondary compounds starting from precursors, such as NO2, by using specific computational schemes.
Within this paper the difference in NO2 and NOx between the regulatory air quality data collected at urban traffic and urban background stations, in Modena and Reggio Emilia, are investigated. Moreover, with the aim of estimating primary and secondary NO2 level at the urban background sites, observed concentrations at air quality stations are compared with NO2 and NOx concentrations simulated with the WRF-Chem model for the city of Modena. In addition, estimate of primary traffic emissions focusing on the same area, taken from the literature, was used for further discussion and comparison.
2. Materials and Methods
Direct surveys of traffic flow by Doppler radar traffic counters for periods of about two weeks were carried out in two medium-sized cities (just under 200 thousand inhabitants) of the Po valley, Modena and Reggio Emilia, located about 40 km and 60 km West of Bologna respectively. In both cities high-traffic urban roads near busy intersections were monitored by the traffic counters.
The survey took place from 28 October to 8 November 2016 in Modena and from 13 to 24 January 2014 in Reggio Emilia [18]. During both measurement campaigns, either in Modena and in Reggio Emilia, hourly concentration of atmospheric NO and NOx were provided by the local urban traffic station placed in close proximity to the high-traffic urban road monitored by traffic counters, and by the urban background station; all these stations belong to the regional air quality monitoring network of the regional environmental agency (Arpae) (Figure 1). An estimation of the NO2 atmospheric concentration was given by considering the primary emissions (NO and NOx) produced by the traffic recorded in the measurement campaigns.
The survey in Modena was carried out under typical autumn weather conditions in the Po Valley: Generally low rainfall, average wind speed <2 m s−1, 20% calm events (i.e., wind speed <1 m s−1), mixing height generally <300 m and average daily air temperature in the range 7.4 to 13.6 °C. From 29 October to 1 November 2016 the traffic was less intense than usual for a national holiday.
In Reggio Emilia the measurement campaign was carried out during unusual weather conditions for winter in the Central Po Valley: The survey period was characterized by strong atmospheric instability, exceptional rainfall, average wind speed <1 m s−1 and average daily air temperature in the range 3 to 10 °C, with a greater daytime excursion. During the whole January 2014 there were heavy rainfalls and uncommonly high temperatures, the largest for January over the period 2010–2017. These conditions were favorable to the atmospheric dispersion of pollutants.
In both case studies [18] the NOx emission factors (i.e., primary NO and NO2) were evaluated according to the European EMEP/SEE guidelines [29], using the data (time, length and speed of passing vehicles) recorded by the radars and the vehicle fleet composition data for the year 2015 in Modena [30] and for the year 2013 in Reggio Emilia [31]. Given the radar’s inability to count stationary vehicles, only warm emissions (engine at normal operating temperature) were considered. The hourly mass flows of NOx emitted were estimated by coupling the hourly radar records with the EF value for each counted vehicle: the traffic emissions modulated according to the hourly variation of the traffic flows were thus obtained for each day of the two surveys.
The atmospheric dispersion of NOx emissions was simulated using the Micro SWIFT SPRAY (MSS) model over 500 m × 500 m domains with grid step of 2 m (square cells). The simulation was run at hourly time step, consistently with the meteorological data provided by CALMET (for Reggio) and COSMO (for Modena) mesoscale model simulations performed by Arpae.
In order to analyze the contribution of all the emissions sectors except vehicular traffic, a chemical transport simulation was performed at very high resolution (1 km) only for the Modena case study. The WRF-Chem model [26], which represents the state of the art system for numerical weather prediction coupled with aerosol and chemical modules to estimate air pollution concentrations, was applied over three nested domains (Figure 2). The outer domain, with a resolution of 15 km covers most of the central Europe, while the central and the innermost domains focus respectively on the Northern part of Italy (at 3 km resolution) and on the Emilia-Romagna region (Northern Italy) with a resolution of 1 km. The vertical structure of the model includes 35 levels, with 12 of them in the lowest 3 km and the center of the first one approximately located at 35 m above the terrain. The maximum model altitude is fixed at 50 hPa.
The WRF-Chem set-up further encompasses the MOSAIC aerosol scheme and the MOZART gas-phase chemical mechanism. ECMWF ERA5 reanalysis data were used to drive meteorological simulation as boundary and initial condition, while the Corine Land Cover data were substituted to the original USGS dataset traditionally provided with the WRF-Chem code.
The emission data used in this case study are from the TNO-MACC III inventory. Two simulations were produced: One including emissions by all SNAP sectors of the inventory (hereafter full WRF-Chem background), and one without the traffic emissions for the urban area of Modena (hereafter WRF-Chem background). For this latter simulation the TNO-MACC emissions were post-processed with the aim of excluding traffic contribution to city pollution level. The original inventory was downscaled to 1 km within the innermost WRF-Chem domain for the 71–75 SNAP sectors using traffic modelled data as a proxy variable. The latter were estimated by the Municipality of Modena with the PTV VISUM model for a typical morning rush of a working day. Once created the downscaled grid dataset, the TNO-MACC III traffic emissions within the urban area of Modena were set to zero. Finally, NO2 and NOx background concentrations were modelled with WRF-Chem in the urban area of Modena considering the modified version of the TNO-MACC III inventory. It follows that secondary NO2 background concentrations are due to precursors in TNO-MACC III anthropogenic emissions. In order to estimate the WRF-Chem background bias in reproducing urban concentration levels, the additional full WRF-Chem background simulation was also performed.
3. Model Evaluation
The evaluation of modelled concentrations with respect to observations are based on the following statistical metrics: Pearson correlation coefficient (r), Mean Bias (MB), Normalized Mean Bias (NMB), Fractional Bias (FB), Normalized Absolute Difference (NAD), Normalized Mean Square Error (NMSE) and the fraction of predicted values within a factor of two of observations (FAC2). Considering M the modelled values (with the averaged modelled value) and O the observations (with the averaged observed value), the mentioned metrics can be defined as follow:
4. Results and Discussion
With the aim of assessing the effect of the emissions in urban areas at traffic and background sites, measured concentrations of NOx and NO2/NOx ratio were compared and investigated along with the simulation results. The modelling activity consists in the hourly NOx concentrations reproduced at traffic sites with MSS at micro-scale resolution, for the duration of both the measurement campaigns, in Modena and Reggio Emilia [18]. Moreover, the NO2 and NOx background concentrations were also estimated with the WRF-Chem model for the period between 28 October and 8 November 2016, only for the city of Modena [23].
The micro-scale simulated concentrations were compared with NOx observations at the urban traffic and urban background stations for both Modena and Reggio Emilia [18], showing generally underestimation by the models.
A previous study [18] suggests that, at urban traffic sites, inaccuracy or omissions in the estimate of primary traffic emissions might have contributed to cause this underestimation by the models. A further, relevant, possible cause of underestimation of simulated concentrations was indicated in the large contribution of secondary NO2 at urban traffic sites, a contribution that was not simulated by the micro-scale model. Indeed MSS, based on its characteristics, is not able to account for chemical reactions but can consider only the dispersion of primary NO and NO2 [32], assuming them as inert.
4.1. Air Quality Observations and Traffic Emission Inventory
For the two cases studied, a very similar trend of NOx concentrations observed in urban traffic and in urban background sites during the survey was clearly shown (Pearson coefficient r = 0.80 for Reggio Emilia and r = 0.84 for the Modena case) [18]. This is mainly due to the prevailing local meteorology, affected by the morphological conformation of the Po Valley and by the low intensity wind regime, with recurrent calm episodes that favor air masses homogenization. It’s worth noting that during the measurement campaign in Modena, persistent atmospheric stability conditions occurred, occasionally causing higher NOx levels at the urban background than in the urban traffic site.
The NOx differences between measurements at the traffic and background stations respectively (hereafter ΔNOx) can be explained by the local traffic emissions, whose contribution to air quality was modelled (and underestimated) by MSS. This underestimation, in the present work, was initially ascribed only to an underestimation of primary NOx by the dispersion models. To verify this assumption, the ΔNO2/ΔNOx ratio (where ΔNO2 is the difference between the NO2 observations at urban traffic and at urban background sites), was compared with the primary NO2/NOx ratio in total vehicular emissions derived from literature [33,34] for the local vehicle fleet [30,31]. The NO2/NOx ratio in urban background observations is also considered in the comparison.
The test was performed using for each city the regulatory air quality observations from urban traffic and urban background sites collected during both the measurement campaigns, which were featured by very different weather conditions (Table 1).
The ratio in primary NO2/NOx by vehicular emissions had a very similar result for Modena and Reggio Emilia, due to the similarity between their fleet composition; nonetheless the ΔNO2/ΔNOx and the NO2/NOx ratios at urban background are quite different.
The 2014 campaign showed in Reggio Emilia similar figures for primary NO2/NOx emissions and ΔNO2/ΔNOx ratios, and both are in the order of one third of NO2/NOx urban background ratio. This may indicate that the extra secondary NO2 at the urban traffic site is negligible when compared to the urban background one, and also that the direct impact of vehicular emissions at the urban background site is little. Conversely over the same period of the campaign in Reggio Emilia, the ΔNO2/ΔNOx ratio in Modena was much larger (about 73% more) than the ratio in the emissions of primary NO2/NOx and is in the order of two thirds of the NO2/NOx at the urban background site.
The uncommon weather conditions, favorable to pollutant dispersion, occurred during the campaign of January 2014 and emphasized the differences between traffic and background sites as it is clearly shown mostly from Reggio Emilia case study.
During the 2016 campaign the ΔNO2/ΔNOx ratio in Modena was much larger than the ratio in primary emissions of NO2/NOx, while the NO2/NOx ratio at the urban background is the same of the ΔNO2/ΔNOx. This suggests similar pollution sources between the urban traffic and urban background site of Modena, although with different intensities, i.e., the larger concentration observed at the urban traffic site originates from a similar source mix of the concentration observed at the urban background site. This occurrence is amplified by the concurrent weather conditions, which favor air masses stagnation and homogenization of aged emissions, determining similar pollution facies across the whole urban area.
However, these same weather conditions had a different effect in Reggio Emilia, where the ΔNO2/ΔNOx ratio at the urban traffic site is larger (ca. 71% more) than primary NO2/NOx ratio in emissions, but it is much lower (just over half) than the NO2/NOx ratio at the urban background site.
This is also confirmed by the comparison among the ratio between urban and rural background NO2 concentrations for the 2016 campaign period in Modena and Reggio Emilia, with the yearly average values provided by the local environmental agency [35] for western-central Po valley. Over the full 2016 the ratio between the NO2 yearly average at the urban background and rural background sites in western-central Po valley was ca. 1.7 (170%), while the same ratio during the 2016 campaign period in Modena was 2.17 (217%) and in Reggio Emilia was about 1.37 (137%). NO2 levels observed at urban background in Modena during the 2016 campaign is comparable to the annual maximum among the average levels at all the urban background stations of the region: concurrent meteorological events particularly adverse for air quality in the whole region amplified the typical effects of autumn, occasionally leading to higher concentrations observed at the urban background than at the urban traffic site, as mentioned above.
The location of the monitoring sites of Reggio Emilia is probably better representative than for Modena of the different atmospheric pollution levels for the city, also in case of weather conditions unfavorable to pollutant dispersion in atmosphere. A large contribution of secondary NO2 at traffic site, as occurs mainly in Modena, may cause a considerable underestimation of MMS simulated concentrations.
4.2. Atmopsheric Modelling and Observations
Only for the 2016 campaign in Modena, the NO2 and NOx background concentrations were also estimated by the WRF-Chem model at 1 km resolution for the urban area of Modena. Two different simulations were performed in order to assess the contribution of different emission sources to the urban pollution level: Full WRF-Chem background and WRF-Chem background. For both these simulations, unlike for MSS, primary and secondary NO2 are included in NO2 evaluation by WRF-Chem.
Results from the modelling activity are presented in this section as follow. Firstly, the general WRF-Chem error in reproducing observations at urban background in Modena and at rural background sites is assessed. Secondly, simulated concentrations from the WRF-Chem background run are compared with observations and then with the full WRF-Chem background results (model-to-model inter-comparison). Finally, model results and observations are combined to deduce some additional considerations.
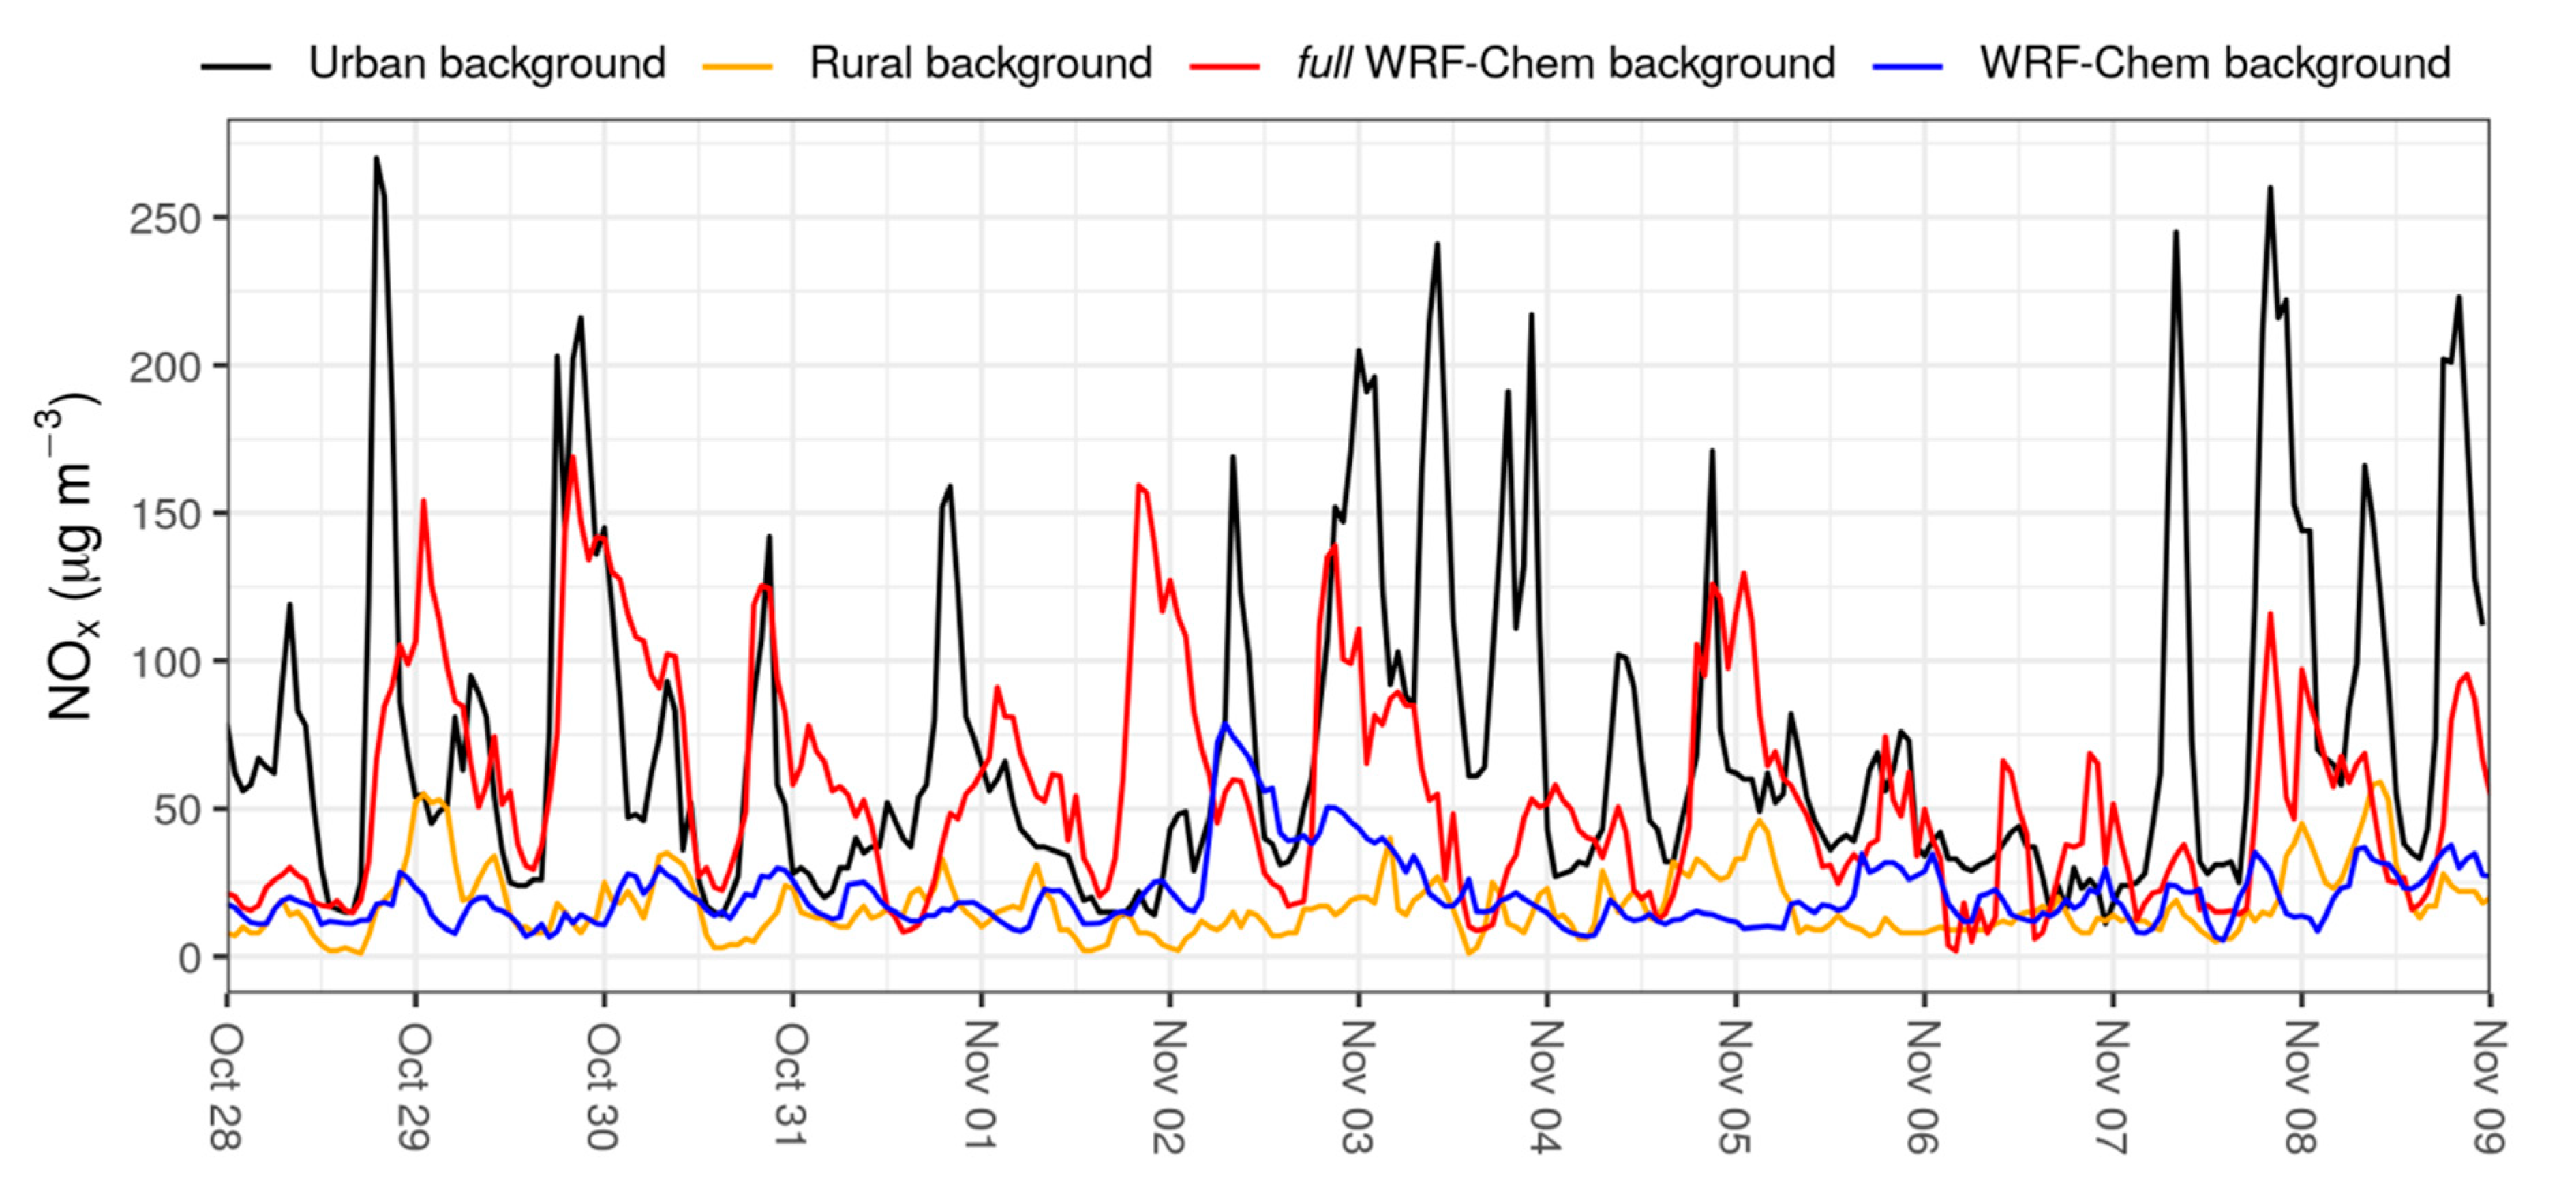
In Figure 3 the observed NOx concentrations at urban background site in Modena are depicted along with modelled NOx concentrations from the full WRF-Chem background and from the WRF-Chem background runs. In order to perform further comparisons and to support supplementary discussions, the observed rural background concentrations are also shown in the same figure.
The performances of the full WRF-Chem NOx background simulation show that despite a general underestimation (MB equal to −17 µg m−3, corresponding to −23% of NMB), modelled concentrations have a pattern similar to NOx observations. In addition, further statistical analysis was conducted following the metrics suggested by Hanna, S. and Chang, J. [36] for atmospheric dispersion. Table 2 summarizes the performance of the model in terms of FB, NMSE, FAC2 and NAD, along with respective benchmark values. Statistical scores show that WRF-Chem fulfills the acceptance criteria for almost all the metrics, also NAD (equal to 0.32) can be considered in line with the values suggested by Hanna, S. and Chang, J. [36] since the proposed reference benchmarks are not to be considered rigid thresholds, but rather a general indication derived from many evaluation exercises involving many models and many types of observations.
As far NO2 is concerned (not shown), full WRF-Chem background presents a fraction of predicted concentrations within a factor of two of observations (FAC2) equal to 60%, greater than the reference criteria (50%). Moreover, regarding NMSE the model expresses its best performance with score equal to 0.70, largely lower than the acceptance benchmark (6). Also NAD, which score is 0.31 is very close to the acceptance value (0.30) and thus, as for NOx, can be considered in line with the respective target. Notwithstanding the model seems to express good performances for the metrics defined by Hanna, S. and Chang, J. [36], it is worth noting that modelled NO2 concentrations are characterized by a pronounced positive bias equal to +15 µg m−3, corresponding to +50% of NMB; confirmed also by the FB with value equal to −0.40. This latter outcome may suggest that despite the overall sum of nitrogen oxides is simulated quite well, for this application the model tends to overestimate the amount of NO converted in NO2, causing an overestimation of NO2 and therefore also a strong underestimation in simulated NO.
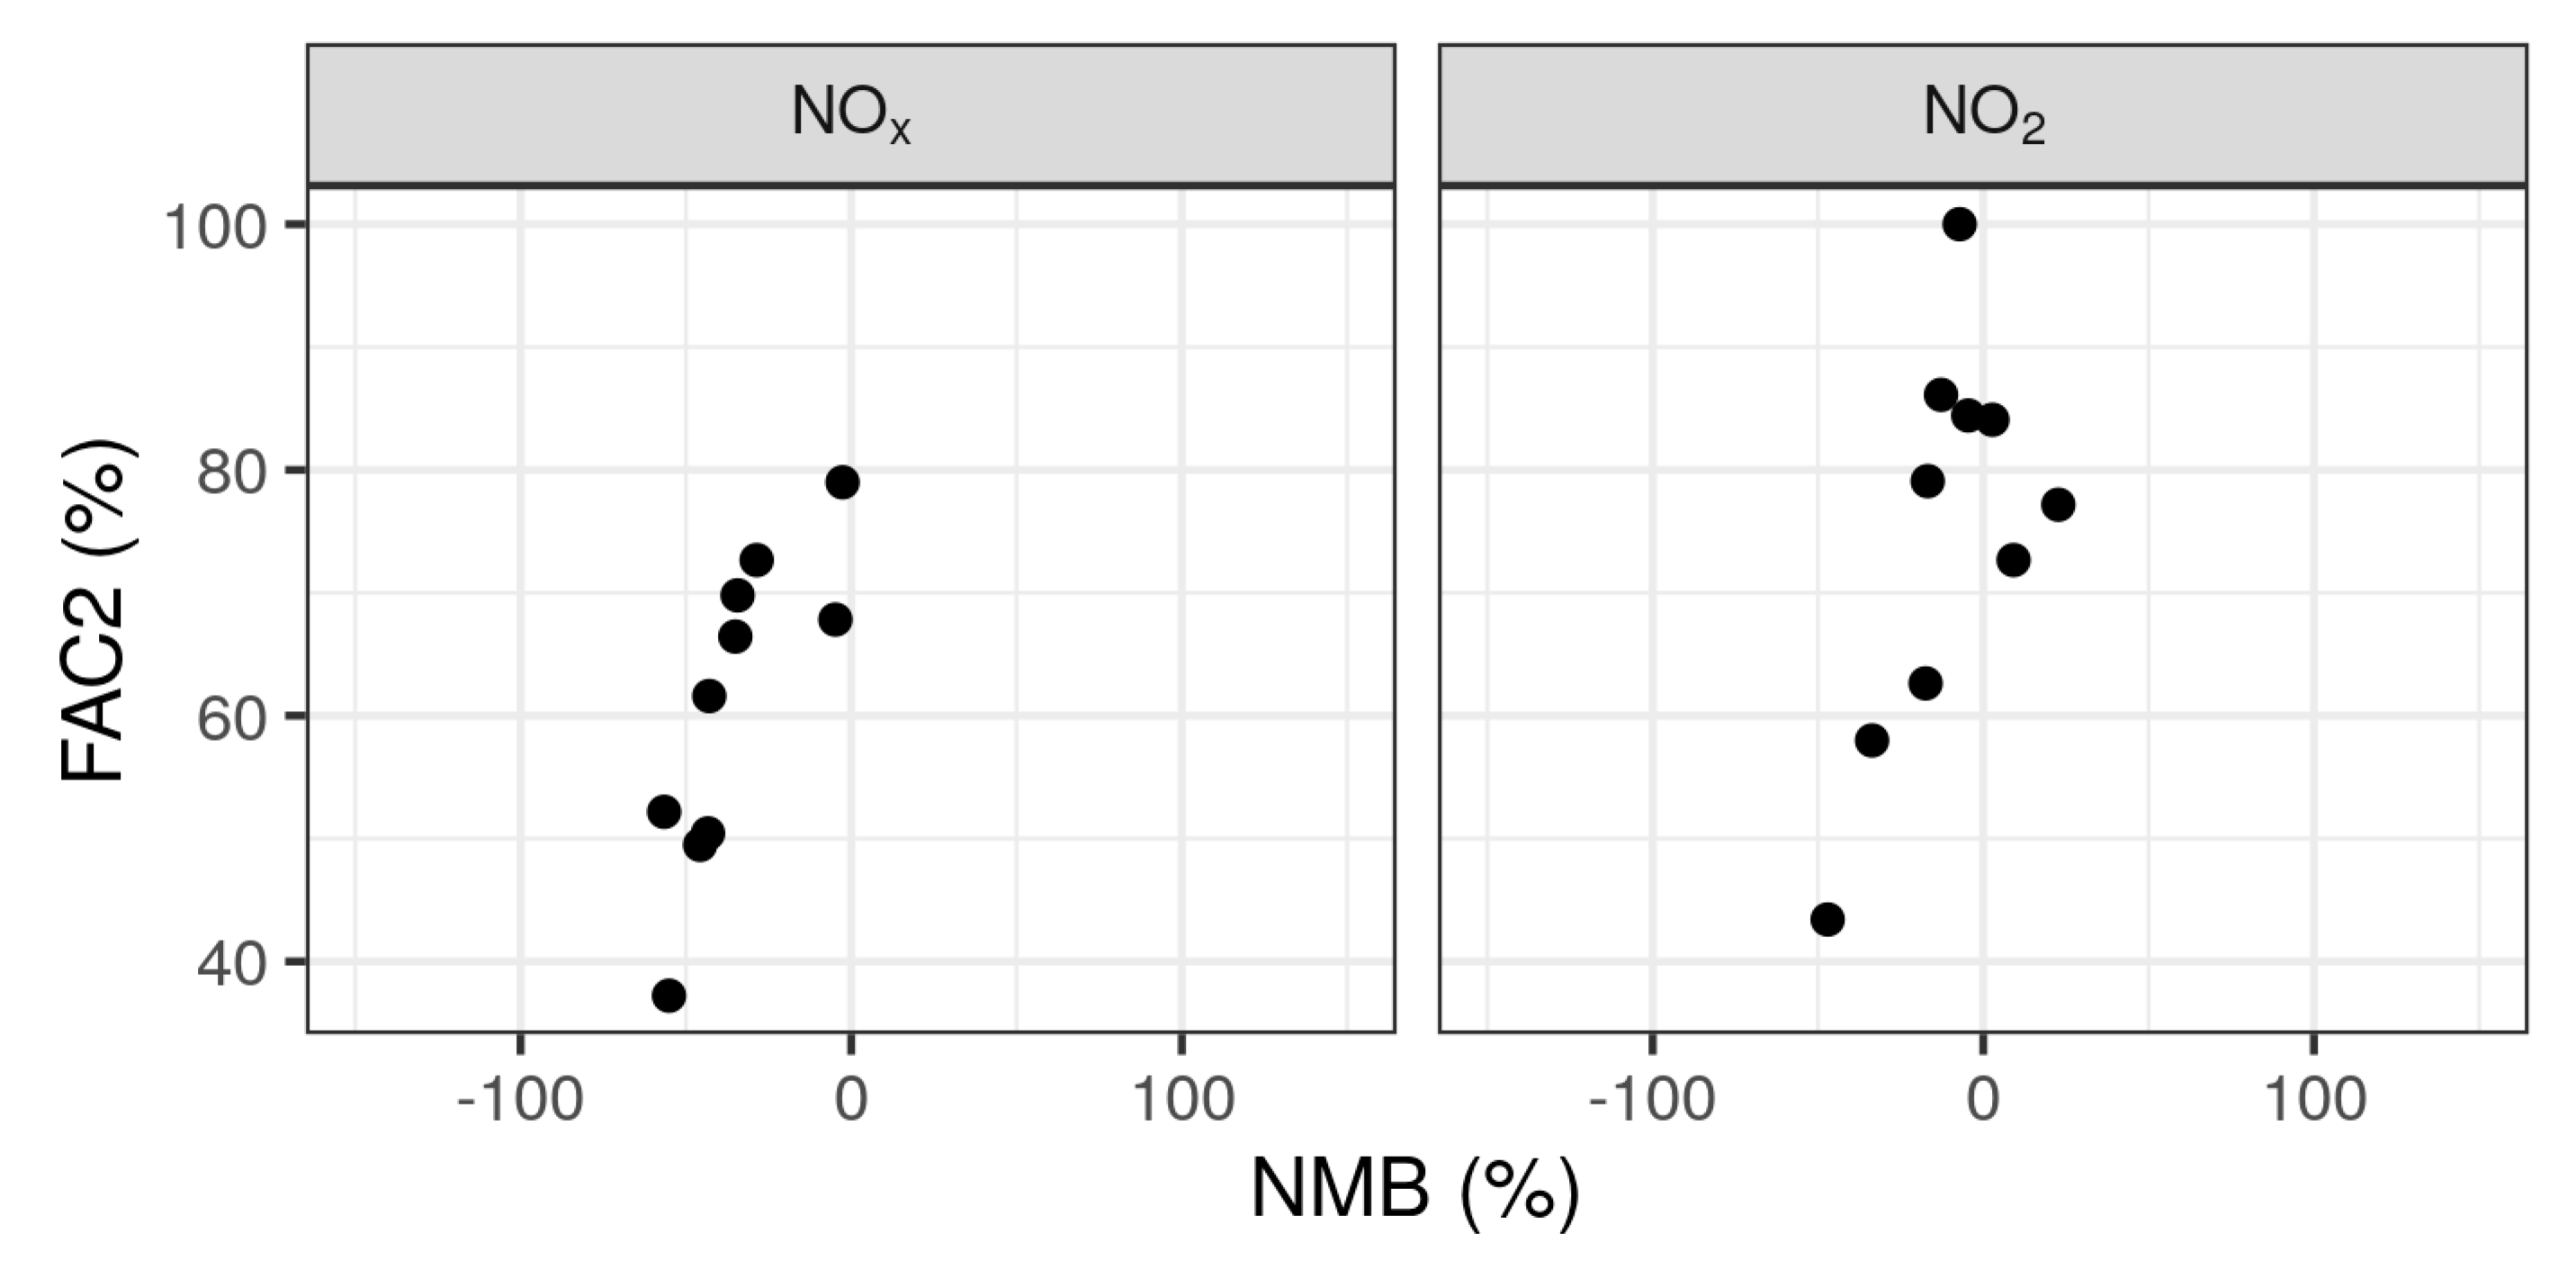
Since the goal of the WRF-Chem simulation was to estimate the pollution level in background areas, being this the most suitable application for this tool [27], modelled NO2 and NOx concentrations from the full emissions run were also compared against observations at 10 rural background stations located within the innermost WRF-Chem domain. Modelled NOx concentrations are negatively biased for all of the 10 stations, with a minimum MB equal to −10 µg m−3 (corresponding to −56% of NMB), nevertheless modelled NOx concentrations for two stations were biased for about 1 µg m−3 (respectively −3% and −5% of NMB). In addition, simulated NOx concentrations at 9 of the 10 stations present FAC2 equal or greater than 50% (Figure 4), which is the reference value suggested by Hanna, S. and Chang, J. [36] for “good” model performance. Average FAC2 over all the stations is 61%.
As for NOx, modelled NO2 concentrations at rural background sites tend to be negatively biased, with 7 of the 10 stations characterized by negative bias. The minimum MB between modelled and observed NO2 is equal to −11 µg m−3 (−47% of NMB) and maximum MB is +4 µg m−3 (+23% of NMB). It is also worth mentioning that for 4 measurement sites modelled concentrations present an absolute bias less than 2 µg m−3 (corresponding to +3%, +9%, −4% and −7% of NMB) (Figure 4). Average FAC2 over all the stations is 75%, with 9 of the 10 stations above 50% as suggested by Hanna, S. and Chang, J. [36].
In the comparison with 2016 campaign observations in Modena (Figure 3), the hourly NOx concentrations simulated in full WRF-Chem background were quite correlated with hourly NOx measured at Modena urban background site (Pearson correlation coefficient r = 0.34), on the other hand WRF-Chem background hourly NOx concentrations, obtained without accounting for traffic emissions in the urban area of Modena (Figure 3), showed a lower correlation with hourly NOx measured at Modena urban background site (Pearson correlation coefficient r = 0.23). Moreover, the cumulative sum of NOx simulated by full WRF-Chem background results in 76.8% of the observed values, conversely for WRF-Chem background this sum accounts for a small fraction (28.6%) of the observed urban background, and this is consistent with the exclusion of traffic emissions within the urban area (56% of the total NOx emissions in the province of Modena [37]) in this WRF-Chem simulation. This differences between full WRF-Chem background and WRF-Chem background confirms the outcome of the observation analysis (Table 1), i.e., that the NOx concentrations at urban background site in Modena are significantly impacted by traffic emissions.
Moreover, NOx WRF-Chem background was compared also with NOx rural background observations for the same 2016 campaign period (Figure 3): the NOx rural background observations represent about 81% of WRF-Chem background, i.e., NOx WRF-Chem background results closer to the order of rural rather than urban background intensity.
The ratio between NO2 and NOx concentrations simulated in the full WRF-Chem background and in the WRF-Chem background for the Modena urban area were compared with observed concentration ratio at urban background site for the 2016 campaign period. NO2/NOx in full WRF-Chem background is equal to 82.2% and in WRF-Chem background is equal to 91.5%, values that are twice or more than twice with respect to the observed NO2/NOx ratio at the urban background site (41.8%, Table 1) and are also higher than all the NO2/NOx urban background observed ratios evaluated in the present work (Table 1).
NO2/NOx in the full WRF-Chem background and in the WRF-Chem background for the Modena urban area were also compared with observed concentration ratio at the nearest rural background site for the studied monitoring period: NO2/NOx in the full WRF-Chem background resulted comparable, while NO2/NOx in the WRF-Chem background higher also than this ratio (ca. 82.7%), confirming the large uncertainty that WRF-Chem has in reproducing NO2 concentrations in the urban environment of Modena.
5. Conclusions
The study focuses on NOx and NO2 observations in Modena and Reggio Emilia, two cities of the western-central Po Valley (Northern Italy), a European hotspot for NOx, characterized by recurrent wind calm episodes [9] and high-pressure conditions leading to long-lasting high concentrations also at remote rural sites. For the Modena case study, local background NOx and NO2 concentrations were also simulated by the WRF-Chem model taking into account two different scenarios. The first one considered the full set of the emissions in the TNO-MACC III inventory and the second one did not account for the contribution of the vehicular emissions in the urban area of Modena. This latter case was assessed in order to estimate the contribution of urban traffic in Modena to atmospheric concentrations.
In the first part of the study an analysis of measured concentrations at urban background and urban traffic sites, combined with Lagrangian dispersion modelling output from previous study, has been carried out. Results showed that despite for the Reggio Emilia case study the formation of extra secondary NO2 at the urban traffic site is negligible with respect to the urban background, the situation for the urban area of Modena is completely different. More in detail the NO2/NOx measured ratio at urban background station in Modena is very similar with the ΔNO2/ΔNOx ratio obtained by differentiating measured concentrations at traffic and background sites, suggesting that observations at both the locations (background and traffic areas) originates from similar pollution sources. Furthermore, the same outcomes highlighted the role of local weather conditions in affecting large contribution of secondary NO2 also at the urban traffic sites, so much to determine complete pollutant homogenization in the whole urban area.
In the second section of the manuscript, modelled WRF-Chem concentrations accounting for the full set of emissions were compared with observations at urban and rural sites to test the capability of the model in reproducing the observed trend. At rural background stations, despite a general underestimation of the observations, modelled concentrations were on average simulated reasonably well for both NOx and NO2, with statistical metrics in line with reference benchmark values for rural dispersion modelling. At urban traffic site, hourly simulated NOx concentrations exhibited a good agreement with observation notwithstanding the latter tended to be underestimated (NMB equal to −23% and r = 0.34). Other statistical metrics such as FB, NMSE, NAD and FAC2 fulfilled the acceptance criteria proposed in literature for dispersion modelling in urban environment. As far modelled NO2 concentrations are concerned, even though the NMSE, NAD and FAC2 statistical scores fulfilled the reference acceptance criteria, simulated concentrations presented a significant positive bias corresponding to a NMB equal to +50%.
Due to the poor representativeness of modelled NO2 concentrations at urban environment, additional analyses were mainly conducted for NOx concentrations. In particular, the second evaluation focused on the inter-comparison between the two WRF-Chem simulations accounting for different set of emissions. NOx simulated without the contribution of traffic emissions in Modena, represented a very small fraction of the urban background observation (28.6%), in contrast with the 76.8% of the full emissions run for the same location, confirming as the difference between the two (48.2%) is consistent with local emission inventory for traffic emissions (56% of the total NOx emissions). In addition, the reduction of the Pearson correlation coefficient between modelled and measured time series between the two simulations (respectively r = 0.34 and r = 0.23) pointed out the relevance of traffic emissions also at the urban background station, confirming the findings of the observation analysis.
Finally, the bias in the modelling results for NO2 from both WRF-Chem simulations limits thorough considerations regarding origin and amount of secondary NO2 in Modena, and an improved application of this model is needed to better investigate the role of traffic emissions in this urban area.
Author Contributions
Conceptualization, G.G.; methodology, S.F. and G.V.; software, S.F. and G.V.; formal analysis, A.B.; validation, S.T.; writing—original draft preparation, G.G.; writing—review and editing, G.V., A.B. and S.T.; supervision, G.G. All authors have read and agreed to the published version of the manuscript.
Funding
This research received no external funding.
Conflicts of Interest
The authors declare no conflict of interest.
References
- Lenschow, P.; Abraham, H.-J.; Kutzner, K.; Lutz, M.; Preuß, J.-D.; Reichenbächer, W. Some ideas about the sources of PM10. Atmos. Environ. 2001, 35, S23–S33. [Google Scholar] [CrossRef]
- Thunis, P. On the validity of the incremental approach to estimate the impact of cities on air quality. Atmos. Environ. 2018, 173, 210–222. [Google Scholar] [CrossRef]
- Ryu, S.W.J.; Park, C.; Jeon, S.W. Mapping and Statistical Analysis of NO2 Concentration for Local Government Air Quality Regulation. Sustainability 2019, 11, 3809. [Google Scholar] [CrossRef] [Green Version]
- Gupta, S.; Pebesma, E.; Mateu, J.; Degbelo, A. Air Quality Monitoring Network Design Optimisation for Robust Land Use Regression Models. Sustainability 2018, 10, 1442. [Google Scholar] [CrossRef] [Green Version]
- Wang, C.F.; Peng, Y.; Jiang, C. Influence of Road Patterns on PM2.5 Concentrations and the Available Solutions: The Case of Beijing City, China. Sustainability 2017, 9, 217. [Google Scholar] [CrossRef] [Green Version]
- Hu, L.; Liu, J.; He, Z. Self-Adaptive Revised Land Use Regression Models for Estimating PM2.5 Concentrations in Beijing, China. Sustainability 2016, 8, 786. [Google Scholar] [CrossRef] [Green Version]
- Ghermandi, G.; Teggi, S.; Fabbi, S.; Bigi, A.; Zaccanti, M.M. Tri-generation power plant and conventional boilers: Pollutant flow rate and atmospheric impact of stack emissions. Int. J. Environ. Sci. Technol. 2014, 12, 693–704. [Google Scholar] [CrossRef] [Green Version]
- Gariazzo, C.; Papaleo, V.; Pelliccioni, A.; Calori, G.; Radice, P.; Tinarelli, G. Application of a Lagrangian particle model to assess the impact of harbour, industrial and urban activities on air quality in the Taranto area, Italy. Atmos. Environ. 2007, 41, 6432–6444. [Google Scholar] [CrossRef]
- Ghermandi, G.; Teggi, S.; Fabbi, S.; Bigi, A.; Cecchi, R. Model comparison in simulating the atmospheric dispersion of a pollutant plume in low wind conditions. Int. J. Environ. Pollut. 2012, 48, 69–77. [Google Scholar] [CrossRef]
- Ghermandi, G.; Fabbi, S.; Zaccanti, M.; Bigi, A.; Teggi, S. Micro–scale simulation of atmospheric emissions from power–plant stacks in the Po Valley. Atmos. Pollut. Res. 2015, 6, 382–388. [Google Scholar] [CrossRef] [Green Version]
- Santana, J.C.C.; Miranda, A.C.; Yamamura, C.L.K.; Silva Filho, S.C.; Tambourgi, E.B.; Lee Ho, L.; Berssaneti, F.T. Effects of Air Pollution on Human Health and Costs: Current Situation in São Paulo, Brazil. Sustainability 2020, 12, 4875. [Google Scholar] [CrossRef]
- Wang, H.S.; Hua, G.; Zhou, H. What Are the Key Factors Affecting Air Pollution? Research on Jiangsu, China from the Perspective of Spatial Differentiation. Sustainability 2020, 12, 2371. [Google Scholar] [CrossRef] [Green Version]
- Hilker, N.; Wang, J.M.; Jeong, C.-H.; Healy, R.M.; Sofowote, U.; Debosz, J.; Su, Y.; Noble, M.; Munoz, A.; Doerksen, G.; et al. Traffic-related air pollution near roadways: Discerning local impacts from background. Atmos. Meas. Tech. 2019, 12, 5247–5261. [Google Scholar] [CrossRef] [Green Version]
- Gómez-Losada, Á.; Pires, J.C.M.; Pino-Mejías, R. Modelling background air pollution exposure in urban environments: Implications for epidemiological research. Environ. Model. Softw. 2018, 106, 13–21. [Google Scholar] [CrossRef] [PubMed]
- Blanchard, C.L. Methods for attributing ambient air pollutants to emission sources. Annu. Rev. Energy Environ. 1999, 24, 329–365. [Google Scholar] [CrossRef]
- Thunis, P.; Clappier, A.; Tarrason, L.; Cuvelier, C.; Monteiro, A.; Pisoni, E.; Wesseling, J.; Belis, C.A.; Pirovano, G.; Janssen, S.; et al. Source apportionment to support air quality planning: Strengths and weaknesses of existing approaches. Environ. Int. 2019, 130, 104825. [Google Scholar] [CrossRef]
- Podrez, M. An update to the ambient ratio method for 1-h NO2 air quality standards dispersion modeling. Atmos. Environ. 2015, 103, 163–170. [Google Scholar] [CrossRef] [Green Version]
- Ghermandi, G.; Fabbi, S.; Bigi, A.; Veratti, G.; Despini, F.; Teggi, S.; Barbieri, C.; Torreggiani, L. Impact assessment of vehicular exhaust emissions by microscale simulation using automatic traffic flow measurements. Atmos. Pollut. Res. 2019, 10, 1473–1481. [Google Scholar] [CrossRef]
- Tinarelli, J.M.G.G.; Brusasca, O.; Oldrini, D.; Anfossi, S. Trini Castelli MicroSwift-Spray (MSS) a new modelling system for the simulation of dispersion at microscale, general description and validation. In Proceedings of the 27th CCMS-NATO Meeting, Banff, AB, Canada, 24–29 October 2004; pp. 25–29. [Google Scholar]
- Bigi, A.; Ghermandi, G. Trends and variability of atmospheric PMtextsubscript2.5 and PMtextsubscript10-2.5 concentration in the Po Valley, Italy. Atmos. Chem. Phys. 2016, 16, 15777–15788. [Google Scholar] [CrossRef] [Green Version]
- Bigi, A.; Ghermandi, G. Long-term trend and variability of atmospheric PMtextsubscript10 concentration in the Po Valley. Atmos. Chem. Phys. 2014, 14, 4895–4907. [Google Scholar] [CrossRef] [Green Version]
- Bigi, A.; Bianchi, F.; De Gennaro, G.; Di Gilio, A.; Fermo, P.; Ghermandi, G.; Prévôt, A.S.H.; Urbani, M.; Valli, G.; Vecchi, R.; et al. Hourly composition of gas and particle phase pollutants at a central urban background site in Milan, Italy. Atmos. Res. 2017, 186, 83–94. [Google Scholar] [CrossRef]
- Veratti, G.; Fabbi, S.; Bigi, A.; Lupascu, A.; Tinarelli, G.; Teggi, S.; Brusasca, G.; Butler, T.M.; Ghermandi, G. Towards the coupling of a chemical transport model with a micro-scale Lagrangian modelling system for evaluation of urban NOx levels in a European hotspot. Atmos. Environ. 2020, 223, 117285. [Google Scholar] [CrossRef]
- Oldrini, O.; Armand, P.; Duchenne, C.; Olry, C.; Moussafir, J.; Tinarelli, G. Description and preliminary validation of the PMSS fast response parallel atmospheric flow and dispersion solver in complex built-up areas. Environ. Fluid Mech. 2017, 17, 997–1014. [Google Scholar] [CrossRef]
- Trini Castelli, S.; Armand, P.; Tinarelli, G.; Duchenne, C.; Nibart, M. Validation of a Lagrangian particle dispersion model with wind tunnel and field experiments in urban environment. Atmos. Environ. 2018, 193, 273–289. [Google Scholar] [CrossRef]
- Grell, G.A.; Peckham, S.E.; Schmitz, R.; McKeen, S.A.; Frost, G.; Skamarock, W.C.; Eder, B. Fully coupled “online” chemistry within the WRF model. Atmos. Environ. 2005, 39, 6957–6975. [Google Scholar] [CrossRef]
- Tuccella, P.; Curci, G.; Visconti, G.; Bessagnet, B.; Menut, L.; Park, R.J. Modeling of gas and aerosol with WRF/Chem over Europe: Evaluation and sensitivity study. J. Geophys. Res. Atmos. 2012, 117. [Google Scholar] [CrossRef] [Green Version]
- Georgiou, G.K.; Christoudias, T.; Proestos, Y.; Kushta, J.; Hadjinicolaou, P.; Lelieveld, J. Air quality modelling in the summer over the eastern Mediterranean using WRF-Chem: Chemistry and aerosol mechanism intercomparison. Atmos. Chem. Phys. 2018, 18, 1555–1571. [Google Scholar] [CrossRef] [Green Version]
- Ntziachristos, L.; Samaras, Z.; Kouridis, C.; Samaras, C.; Hassel, D.; Mellios, G.; McCrae, I.; Hickman, J.; Zierock, K.-H.; Keller, M.; et al. EMEP/EEA Emission Inventory Guidebook 2013, Updated 2014; EMEP/EEA: 2013. Available online: https://www.eea.europa.eu/publications/emep-eea-guidebook-2013 (accessed on 22 September 2020).
- UCER. Report by the Union of Regional Chambres of Commerce. 2016. Available online: https://www.ucer.camcom.it/studi-ricerche/dati/bd/appendice-dati-comunali/trasporti-stradali.-consistenza-dei-veicoli (accessed on 22 September 2020).
- ACI. 2013. Available online: http://www.aci.it/laci/studi-e-ricerche/dati-e-statistiche/veicoli-e-mobilita.html (accessed on 22 September 2020).
- Air Quality Expert Group. Trends in Primary Nitrogen Dioxide in the UK; Department for the Environment, Food and Rural Affairs: London, UK, 2007. [Google Scholar]
- Grice, S.; Stedman, J.; Kent, A.; Hobson, M.; Norris, J.; Abbott, J.; Cooke, S. The Impact of Changes in Vehicle Fleet Composition and Exhaust Treatment Technology on the Attainment of the Ambient Air Quality Limit Value for Nitrogen Dioxide in 2010; AEA Energy & Environment: London, UK, 2007. [Google Scholar]
- Smit, R.; Ntziachristos, L.; Boulter, P. Validation of road vehicle and traffic emission models—A review and meta-analysis. Atmos. Environ. 2010, 44, 2943–2953. [Google Scholar] [CrossRef]
- Arpae. Environmental Data 2018. The Quality of the Environment in Emilia Romagna; Arpae: Ferrara, Italy, 2018. [Google Scholar]
- Hanna, S.; Chang, J. Acceptance criteria for urban dispersion model evaluation. Meteorol. Atmos. Phys. 2012, 116, 133–146. [Google Scholar] [CrossRef]
- Arpae. Update of the Regional Inventory of Atmospheric Emissions in Emilia-Romagna for Year 2015 (INEMAR-ER 2015); Arpae: Ferrara, Italy, 2019. [Google Scholar]
Figure 1.
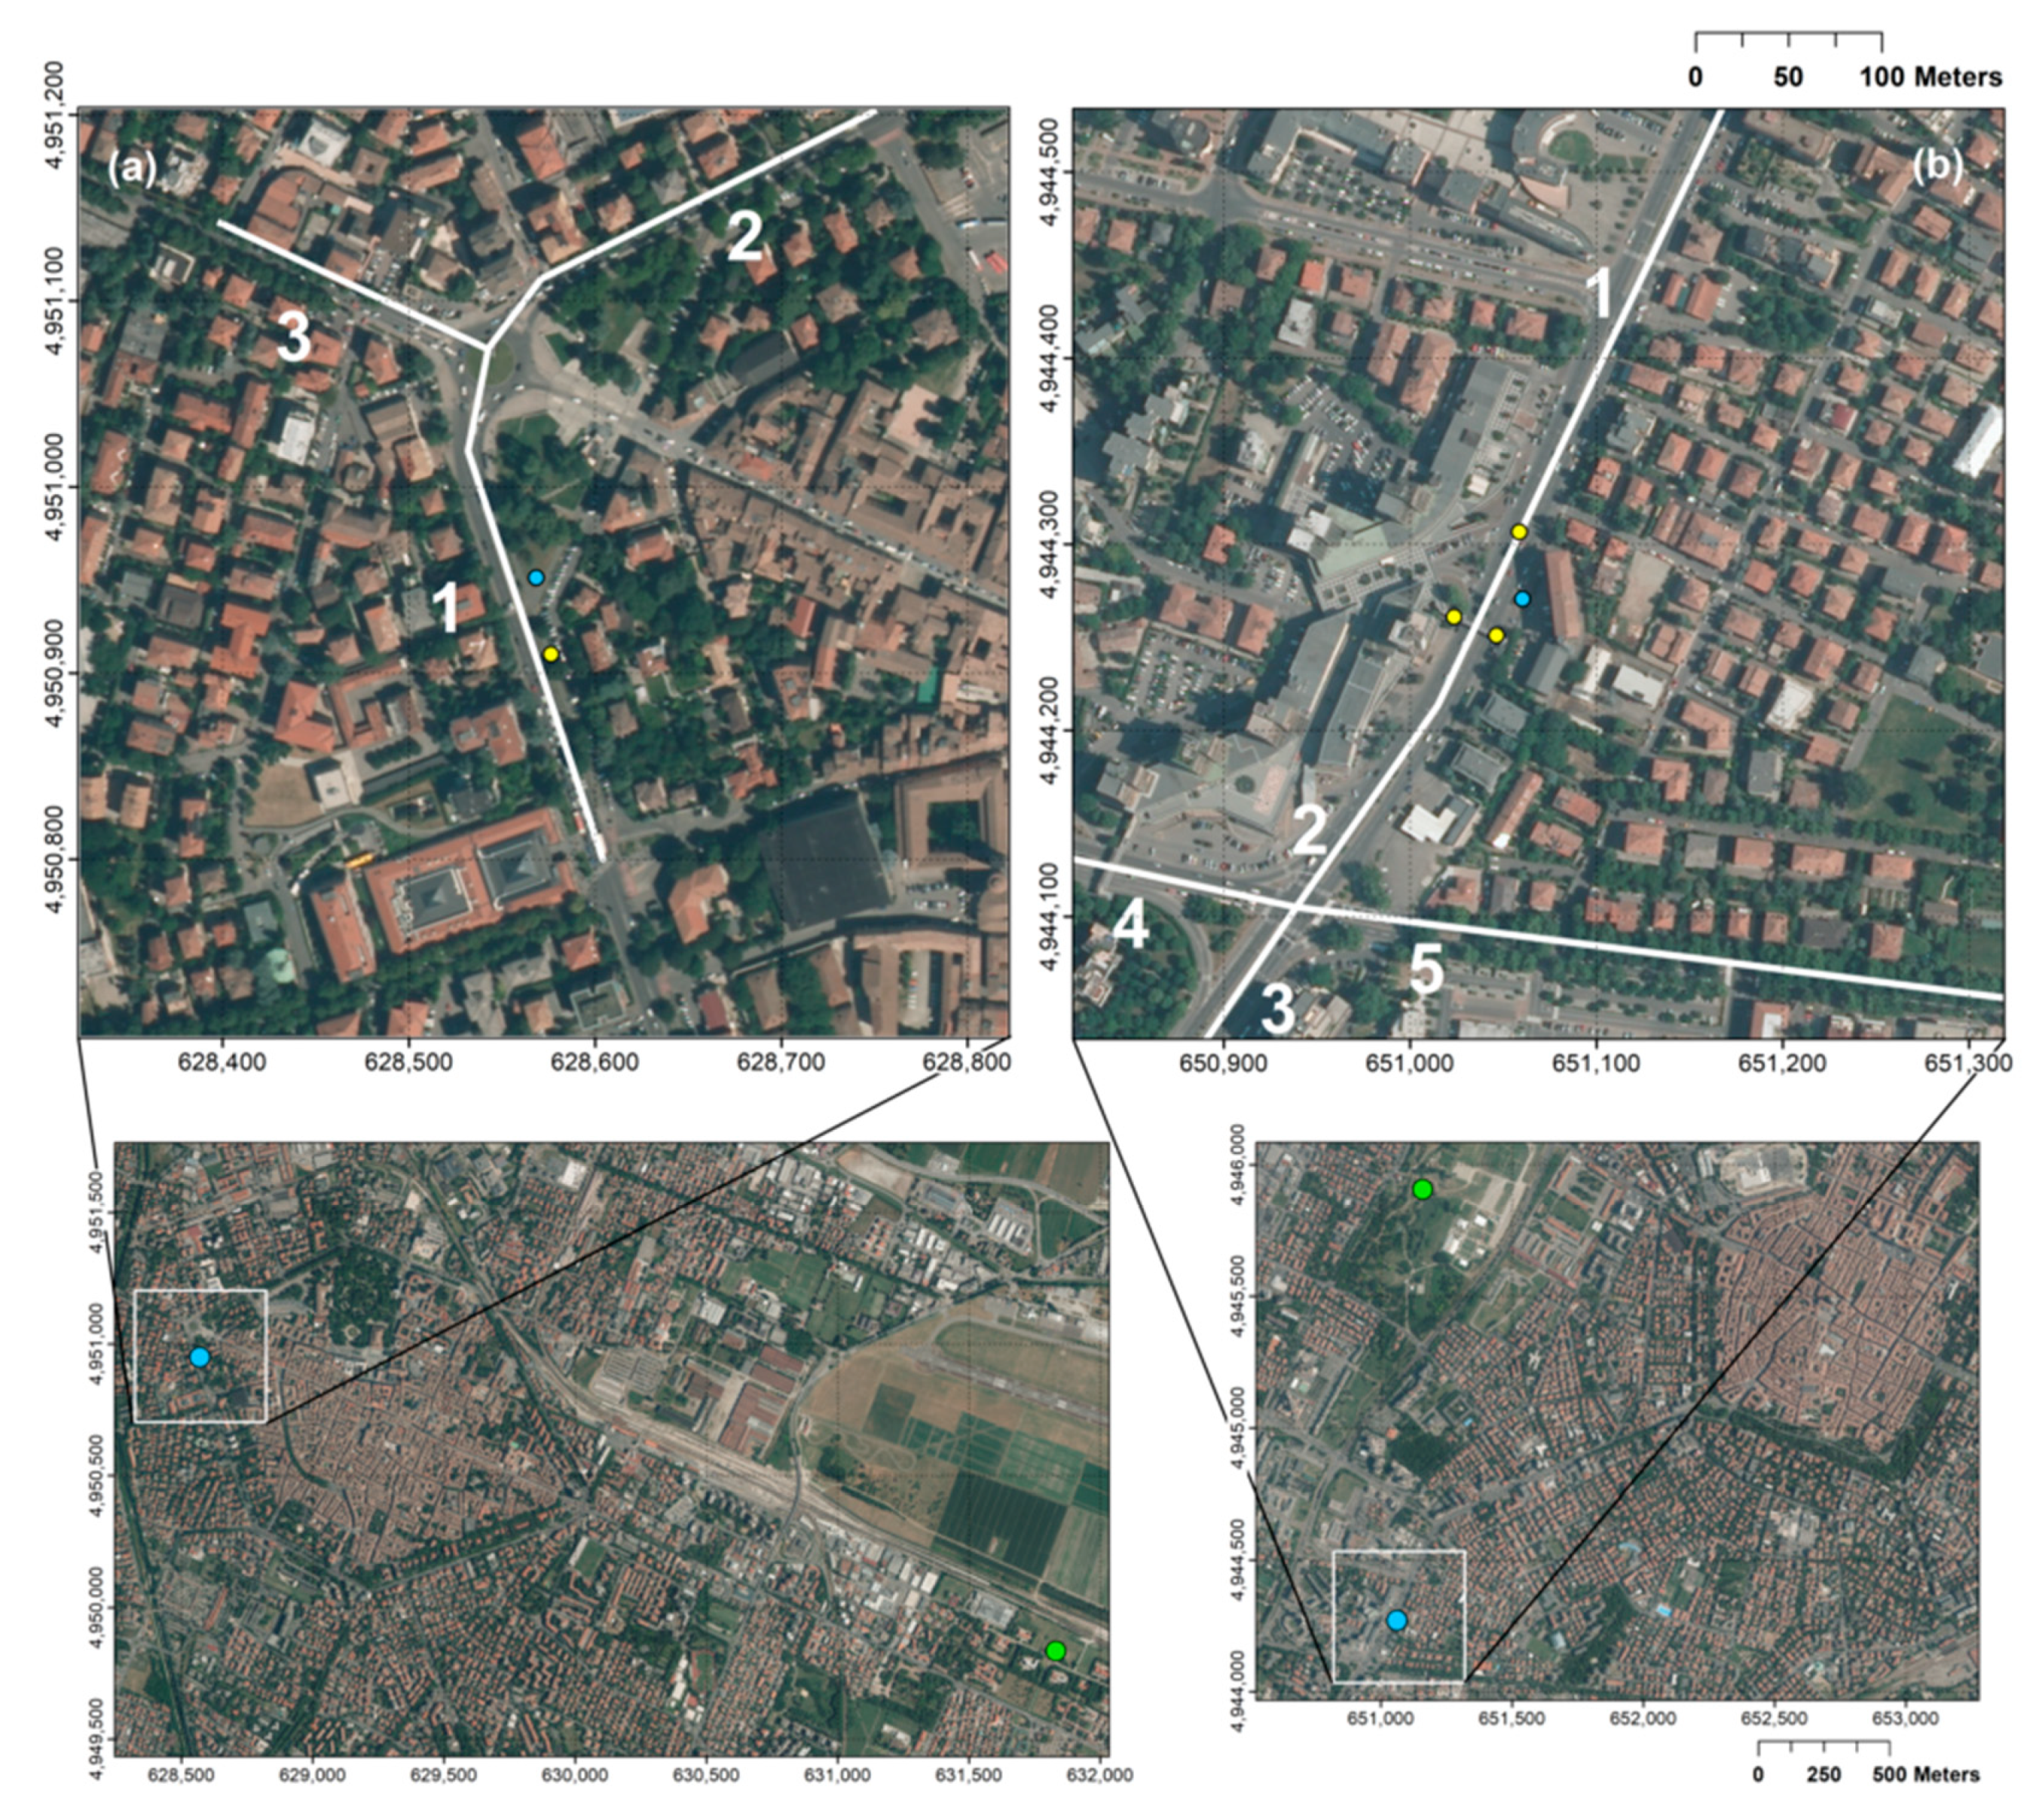
The investigated domains (UTM32-WGS84) for the cities of Reggio Emilia (a) and Modena (b). The locations of radar traffic counter (yellow dots), urban traffic (light blue dots) and urban background (green dots) air quality monitoring stations are reported. The road sections considered in the simulations as linear emission sources, 1–3 in Reggio Emilia and 1–5 in Modena are also reported (white lines) [18].
Figure 1.
The investigated domains (UTM32-WGS84) for the cities of Reggio Emilia (a) and Modena (b). The locations of radar traffic counter (yellow dots), urban traffic (light blue dots) and urban background (green dots) air quality monitoring stations are reported. The road sections considered in the simulations as linear emission sources, 1–3 in Reggio Emilia and 1–5 in Modena are also reported (white lines) [18].

Figure 2.
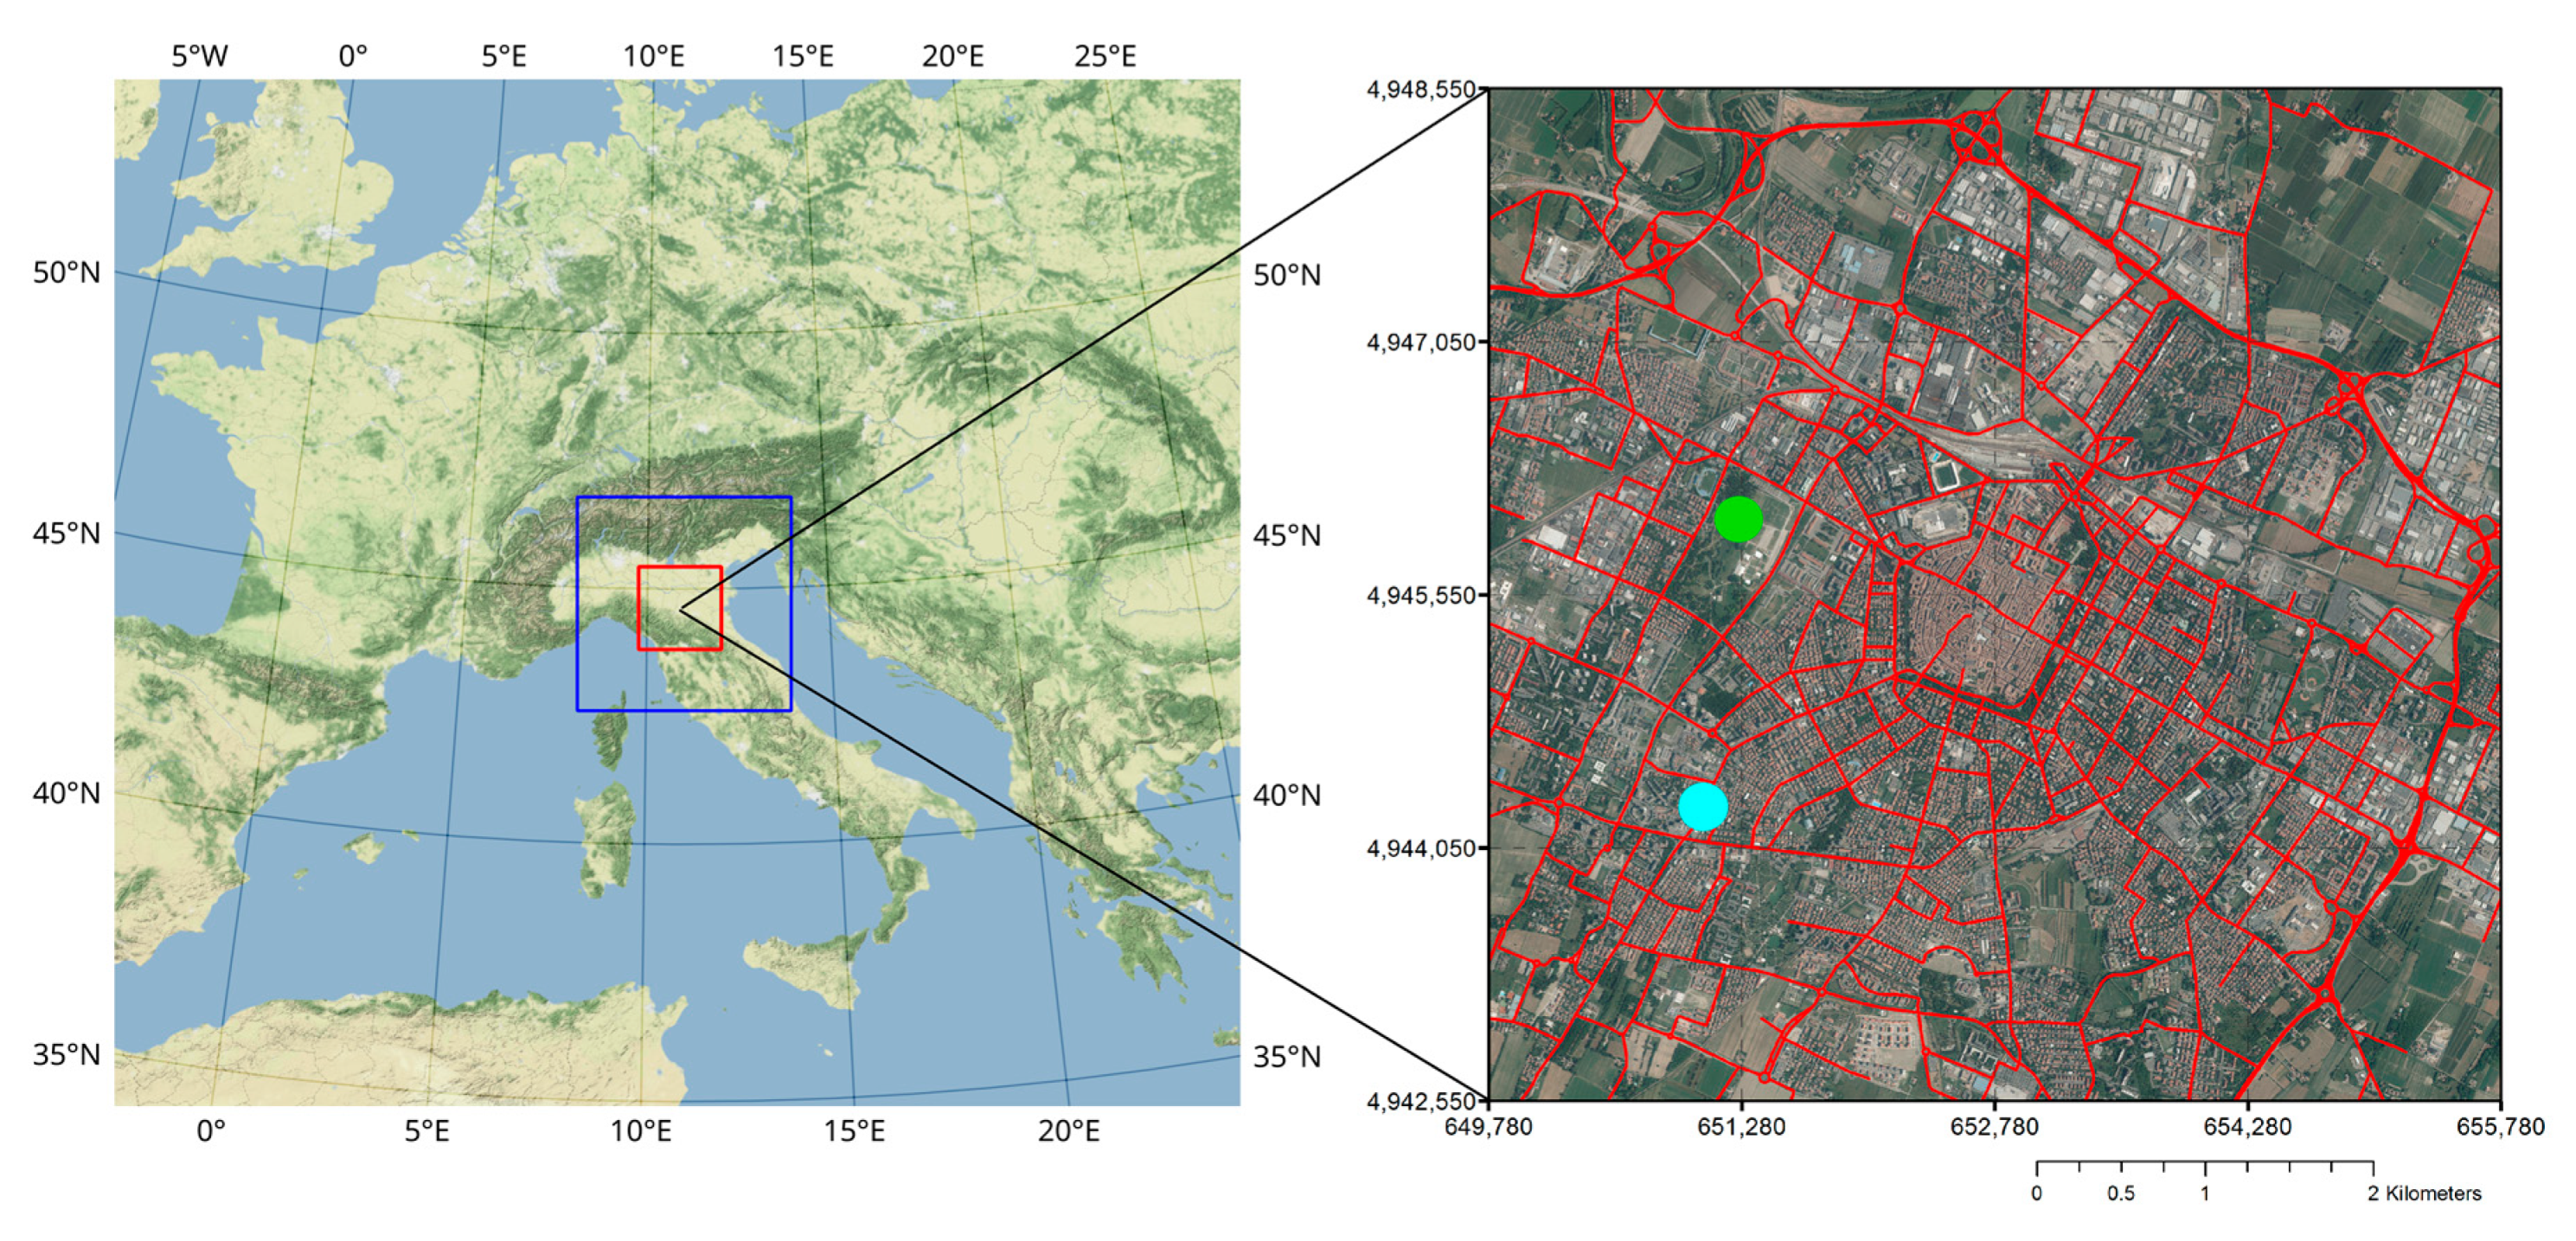
Overview of the computational WRF-Chem domains (on the left) and the urban area of Modena (on the right) where the TNO-MACC III traffic emissions have been excluded for the WRF-Chem simulation. In the figure on the right are depicted also the main road traffic network (as red lines) and the location of the urban background (green dot) and urban traffic (light blue dot) air quality stations.
Figure 2.
Overview of the computational WRF-Chem domains (on the left) and the urban area of Modena (on the right) where the TNO-MACC III traffic emissions have been excluded for the WRF-Chem simulation. In the figure on the right are depicted also the main road traffic network (as red lines) and the location of the urban background (green dot) and urban traffic (light blue dot) air quality stations.

Figure 3.
NOx hourly concentrations observed at urban and rural background sites and in WRF-Chem simulated background, accounting for all set of emissions (full WRF-Chem background) and without urban traffic emissions (WRF-Chem background), during the 2016 measurement campaign period for Modena case study.

Figure 4.
Normalized Mean Bias (NMB) and Factor of two (FAC2) statistic scores computed for hourly NOx and NO2 full WRF-Chem concentrations at 10 rural background sites within the inner most model domain.
Figure 4.
Normalized Mean Bias (NMB) and Factor of two (FAC2) statistic scores computed for hourly NOx and NO2 full WRF-Chem concentrations at 10 rural background sites within the inner most model domain.


Table 1.
Comparison among primary NO2/NOx ratio in vehicular emissions for the local vehicular fleets and ratios from observations: ΔNO2/ΔNOx (ratio of the difference in NO2 and NOx observations at the urban traffic and background sites), and NO2/NOx (ratio in urban background observations). All ratios as (%). The survey of traffic flow was held in 2014 in Reggio Emilia and in 2016 in Modena.
| Primary NO2/NOx (%) in Vehicular Emissions | NO2/NOx (%) | NO2/NOx (%) Urban Background | ||
|---|---|---|---|---|
| January 2014 | Modena | 15.0 | 26.0 | 36.5 |
| Reggio Emilia | 16.5 | 15.7 | 43.4 | |
| October–November 2016 | Modena | 15.0 | 41.7 | 41.8 |
| Reggio Emilia | 16.5 | 28.3 | 54.6 |
Table 2.
Statistical metrics for the full WRF-Chem background run at urban background site in Modena. Reference acceptance criteria as defined by Hanna and Chang (2012) are also reported in the first row.
Table 2.
Statistical metrics for the full WRF-Chem background run at urban background site in Modena. Reference acceptance criteria as defined by Hanna and Chang (2012) are also reported in the first row.
| Pollutant | FB |FB| ≤ 0.30 | NMSE NMSE ≤ 3 | FAC2 FAC2 ≥ 0.50 | NAD NAD ≤ 0.30 |
|---|---|---|---|---|
| NOx | 0.27 | 0.83 | 0.58 | 0.32 |
| NO2 | −0.40 | 0.70 | 0.60 | 0.31 |
© 2020 by the authors. Licensee MDPI, Basel, Switzerland. This article is an open access article distributed under the terms and conditions of the Creative Commons Attribution (CC BY) license (http://creativecommons.org/licenses/by/4.0/).
Share and Cite
MDPI and ACS Style
Ghermandi, G.; Fabbi, S.; Veratti, G.; Bigi, A.; Teggi, S. Estimate of Secondary NO2 Levels at Two Urban Traffic Sites Using Observations and Modelling. Sustainability 2020, 12, 7897. https://0-doi-org.brum.beds.ac.uk/10.3390/su12197897
AMA Style
Ghermandi G, Fabbi S, Veratti G, Bigi A, Teggi S. Estimate of Secondary NO2 Levels at Two Urban Traffic Sites Using Observations and Modelling. Sustainability. 2020; 12(19):7897. https://0-doi-org.brum.beds.ac.uk/10.3390/su12197897
Chicago/Turabian StyleGhermandi, Grazia, Sara Fabbi, Giorgio Veratti, Alessandro Bigi, and Sergio Teggi. 2020. "Estimate of Secondary NO2 Levels at Two Urban Traffic Sites Using Observations and Modelling" Sustainability 12, no. 19: 7897. https://0-doi-org.brum.beds.ac.uk/10.3390/su12197897
Note that from the first issue of 2016, this journal uses article numbers instead of page numbers. See further details here.