Cloud Data Scraping for the Assessment of Outflows from Dammed Rivers in the EU. A Case Study in South Eastern Europe


1
UNESCO Chair INWEB, Aristotle University of Thessaloniki, 54124 Thessaloniki, Greece
2
Department of Civil Engineering, Aristotle University of Thessaloniki, 54124 Thessaloniki, Greece
*
Author to whom correspondence should be addressed.
Sustainability 2020, 12(19), 7926; https://0-doi-org.brum.beds.ac.uk/10.3390/su12197926
Submission received: 31 August 2020
/
Revised: 18 September 2020
/
Accepted: 23 September 2020
/
Published: 24 September 2020
(This article belongs to the Section Environmental Sustainability and Applications)
Abstract
:The availability of environmentally related data is a crucial issue in simulating natural processes. The proposed research demonstrates that although currently there is a plethora of data published on the internet, by national and international official sources, their retrieval is sometimes hard to be achieved; hence smart programming tools/technologies could facilitate the automatic harvesting of these data in personal databases for the qualitative and quantitative assessment of hydrosystems that encompass hydropower schemes. The implemented methodology relies on the use of custom-made web scrapping tools to access dams’ hourly outflows in combination with water demand data in order to investigate the water balance, as modified by human intervention, in areas located downstream of dams. For this purpose, derivatives of the Electricity Market Directive and Water Framework Directive of the European Union (EU) have been regarded as web-based databases. The outcomes of the methodological approach demonstrate that the modelled net water discharges downstream—i.e., the river discharges after subtracting the water demands—are assessed with high simulation accuracy at a daily time scale. The reliability of the output estimates is further supported by the combination of measured data from gauge telemetry with the data derived by the proposed methodology. This research allows new insights, such as dams’ outflows and water demand retrieval and exploitation, into the sustainable management of water resources and contributes to the quantification of rivers’ outflows to the coastal zone.
1. Introduction
During the last decade the continuous demand on data collection, harnessing and allocation of different types of environmental data, i.e., row observations and/or bias-corrected and/or simulation data [1,2] has contributed to large scale scientific research initiatives, such as the World-wide Hydrogeological Mapping and Assessment Programme (WHYMAP) [3] and the Water Information Network System (IHP-WINS) [4] launched by UNESCO Intergovernmental Hydrological Programme (IHP). The asynchronous sharing of big data and the on the fly synchronous utilization of large volumes of data is considered a scientific revolution which may be put in force by the Information and Communication Technologies (ICTs) [5]. National data repositories, such as the USGS’ National Water Information System (NWIS) [6] and the Storage and Retrieval System (STORET) developed by the Environmental Protection Agency (EPA) in the United States [7] as well as the European Commission’s Water Information System for Europe (WISE) [8], offer important datasets for Research and Development (R&D) initiatives. Global coverage has been achieved through similar databases e.g., to retrieve observations from monitoring networks [9] and coverage data, such as land use, topographic relief and soil textures [10]. However, the aforementioned examples are just the tip of the iceberg when compared to the numerous environmental datasets that are produced daily and at the same time are not archived in suitable formats to be shared and accessed via the web.
Apart from data sharing via well-established methods, such as the file transfer protocol (FTP) and the more modern application programming interfaces (APIs), the use of web browsers for accessing cloud-based datasets offers a unique opportunity of exploiting the stored information in webpages. Web scraping is a technique that can be used when front end webpages exist and the included data in the webpage need to be exploited, i.e., to be downloaded and archived in local databases [11]. In other words, web scraping is a data acquisition method, where a custom-developed computer program is initially used to read the code of a website page, usually written in HTML, and thereafter decode it in order to extract the required data [12]. The literature presents limited research of that newly formed approach, i.e., the coupling of web scrapers and web-based environmental databases. Yu et al. [13], proposed tools for investigating the content of databases by querying the relevant metadata and thereafter to judge whether the data should be retrieved. Bonifacio et al. [14], demonstrate in their research a custom-made web scraper that was used to automate the download and collation of Canadian climate data. Budiarti et al. [15] developed an application for retrieving water quality data from monitoring networks by using Python programming. The proposed tool initially collects the data using web scraping tools and afterwards, the data are stored in a database system. A similar conceptual approach based on a large web scraped and geo-referenced dataset of 10,530 observations, is used to analyze the water proximity and water quality on residential housing prices in the province of Milan in Italy [16].
At the European Union scale, more than 200 directives, regulations and many other forms of legislation and amendments in the area of environmental policy and sustainable development have been adopted [17]. The Water Framework Directive (WFD), for example, is considered one of the most important pieces of legislation focusing on the protection of water resources. At the same time, the Electricity Market Directive (EMD) fostered the liberalization of energy and derived trade-offs among EU countries [18] and has set new standards in the electricity market. The newly formed EU electric stock market, for example, induced new parameters in the optimization of hydropower generation algorithms, which are based on demand and supply rules. Nevertheless, the implementation process of these directives is not an easy and straightforward procedure. Concerns about the problematic implementation and enforcement of EU environmental policies are still on the table, despite positive results in some policy fields [19,20,21].
Currently, dams have fragmented and transformed the world’s rivers. Europe has the smallest share, i.e., 12%, of unfragmented or flow regulated large river basins, with hydropower to be the main reason behind the modification of the rivers’ natural status [22]. According to data from the European Environment Agency, in 2007 there were more than 7000 large dams and thousands of smaller dams in Europe. More recent data of 2019, reveal that in addition to the current 21,387 hydropower plants in EU (including the Balkans, Belarus, Ukraine and Turkey), another 8785 are planned to be constructed in the near future, mainly in the Alps and the Balkan Peninsula [23]. In the Danube basin, for example, there are 636 hydropower plants, while there are plans for 1315 additional hydropower projects [24]. Hence, the interlinkage between water and energy is more than evident at the European scale with new hydropower development plans to be planned for the near future [25]. At the same time, the WFD explicitly designates the water bodies that are substantially altered, e.g., by canals and power generation, as heavily modified water bodies that need special attention.
The aim of the proposed research is to promote a new and straightforward procedure for the assessment of released downstream flows from hydropower plants (HPPs) through the coupling of freely and publicly available data derived from the EU Directives, such as the EMD and WFD. The proposed implementation processes, of the aforementioned Directives, are conceived as web-based databases and are semi-automatically exploited for (i) retrieving accurate water outflows from HPPs, (ii) water accounting for the different water uses, and (iii) estimating the water volumes reaching the estuaries. The developed methodology is tested on an EU River that is considered a typical multi-use water system since a cascade of dams exploits the water potential for power production, irrigation, water supply and environmental protection purposes. The research could further contribute to the management of water resources since accurate water flows of dammed rivers could be used for various applications such as calibration of hydrologic models, decision support systems application and assessment of downstream waters. Moreover, the methodology indicates solutions of the direct usage of the derivatives of EU policies in the field of integrated water resources management.
2. Materials and Methods
2.1. EU Directives and Data Exploitation
The Electricity Market Directive (EMD) 2009/72/EC can be summarized into three major pillars [18], the opening of the market, the third-party access, and the principle of separation of the network system operator and the power generators. The benefits of enlarging the geographical scope of power markets are very clear: increased economic efficiency, lower market concentration and higher security of supply [26]. The implementation of the EMD by the EU member states resulted in the creation of national Transmission System Operators (TSOs), which come under the umbrella of the European Network of Transmission System Operators for Electricity (ENTSO-E). In accordance with the EU transparency regulation (EU N°2013/543), both national TSOs and the ENTSO-E are obliged to publish the sources of the produced power, such as fossil gas, fossil coal, hydropower, biomass, on a daily basis as well as the predicted capacity needs for the next day. The reason for this is to promote auction transparency and facilitate participants’ involvement [27]. Hence, the Greek TSO publishes on the internet, on a daily basis, power hourly time scale data for each power station across the country and results on the long and short term auctions, the scheduling for the day ahead, as well as the results of the imbalance scheduling. The research develops a custom web scraper tool based on Visual Basic programming that is installed on a server to automatically download and store hourly data sets of produced hydropower at a national level. Thereafter, through the following Equation (1), power is converted to hourly discharges:
where P is the produced power (KW), n is the hydraulic efficiency of the turbine, ρ the density of water (kg/m3), g the acceleration due to gravity (m/s2), Q the discharge (m3/s), and h is the hydraulic head of water (m).
The Water Framework Directive has induced various levels of environmental management of aquatic resources and has triggered the re-organization of water management by hydrological catchments, rather than by administrative borders, with the ultimate goal to improve the quality of surface water bodies [28]. The main instruments for the implementation of the WFD are the River Basin Management Plans (RBMPs). These comprehensive plans contain extensive information for the EU Water Districts (WD). Maps and accompanying documentation in form of tabulated data and descriptive texts for all water types (rivers, lakes, groundwater, coastal and transitional waters) have been produced for each WD. Thus, the RBMPs can be conceived as the knowledge base on the current water status in which all the available information is stored. The RBMPs are publicly available on the internet, and in this research, the figures explicitly depicting water withdrawals for irrigated agriculture and water supply are used for the creation of a simplified water balance model.
2.2. The Aliakmonas River Basin Case Study
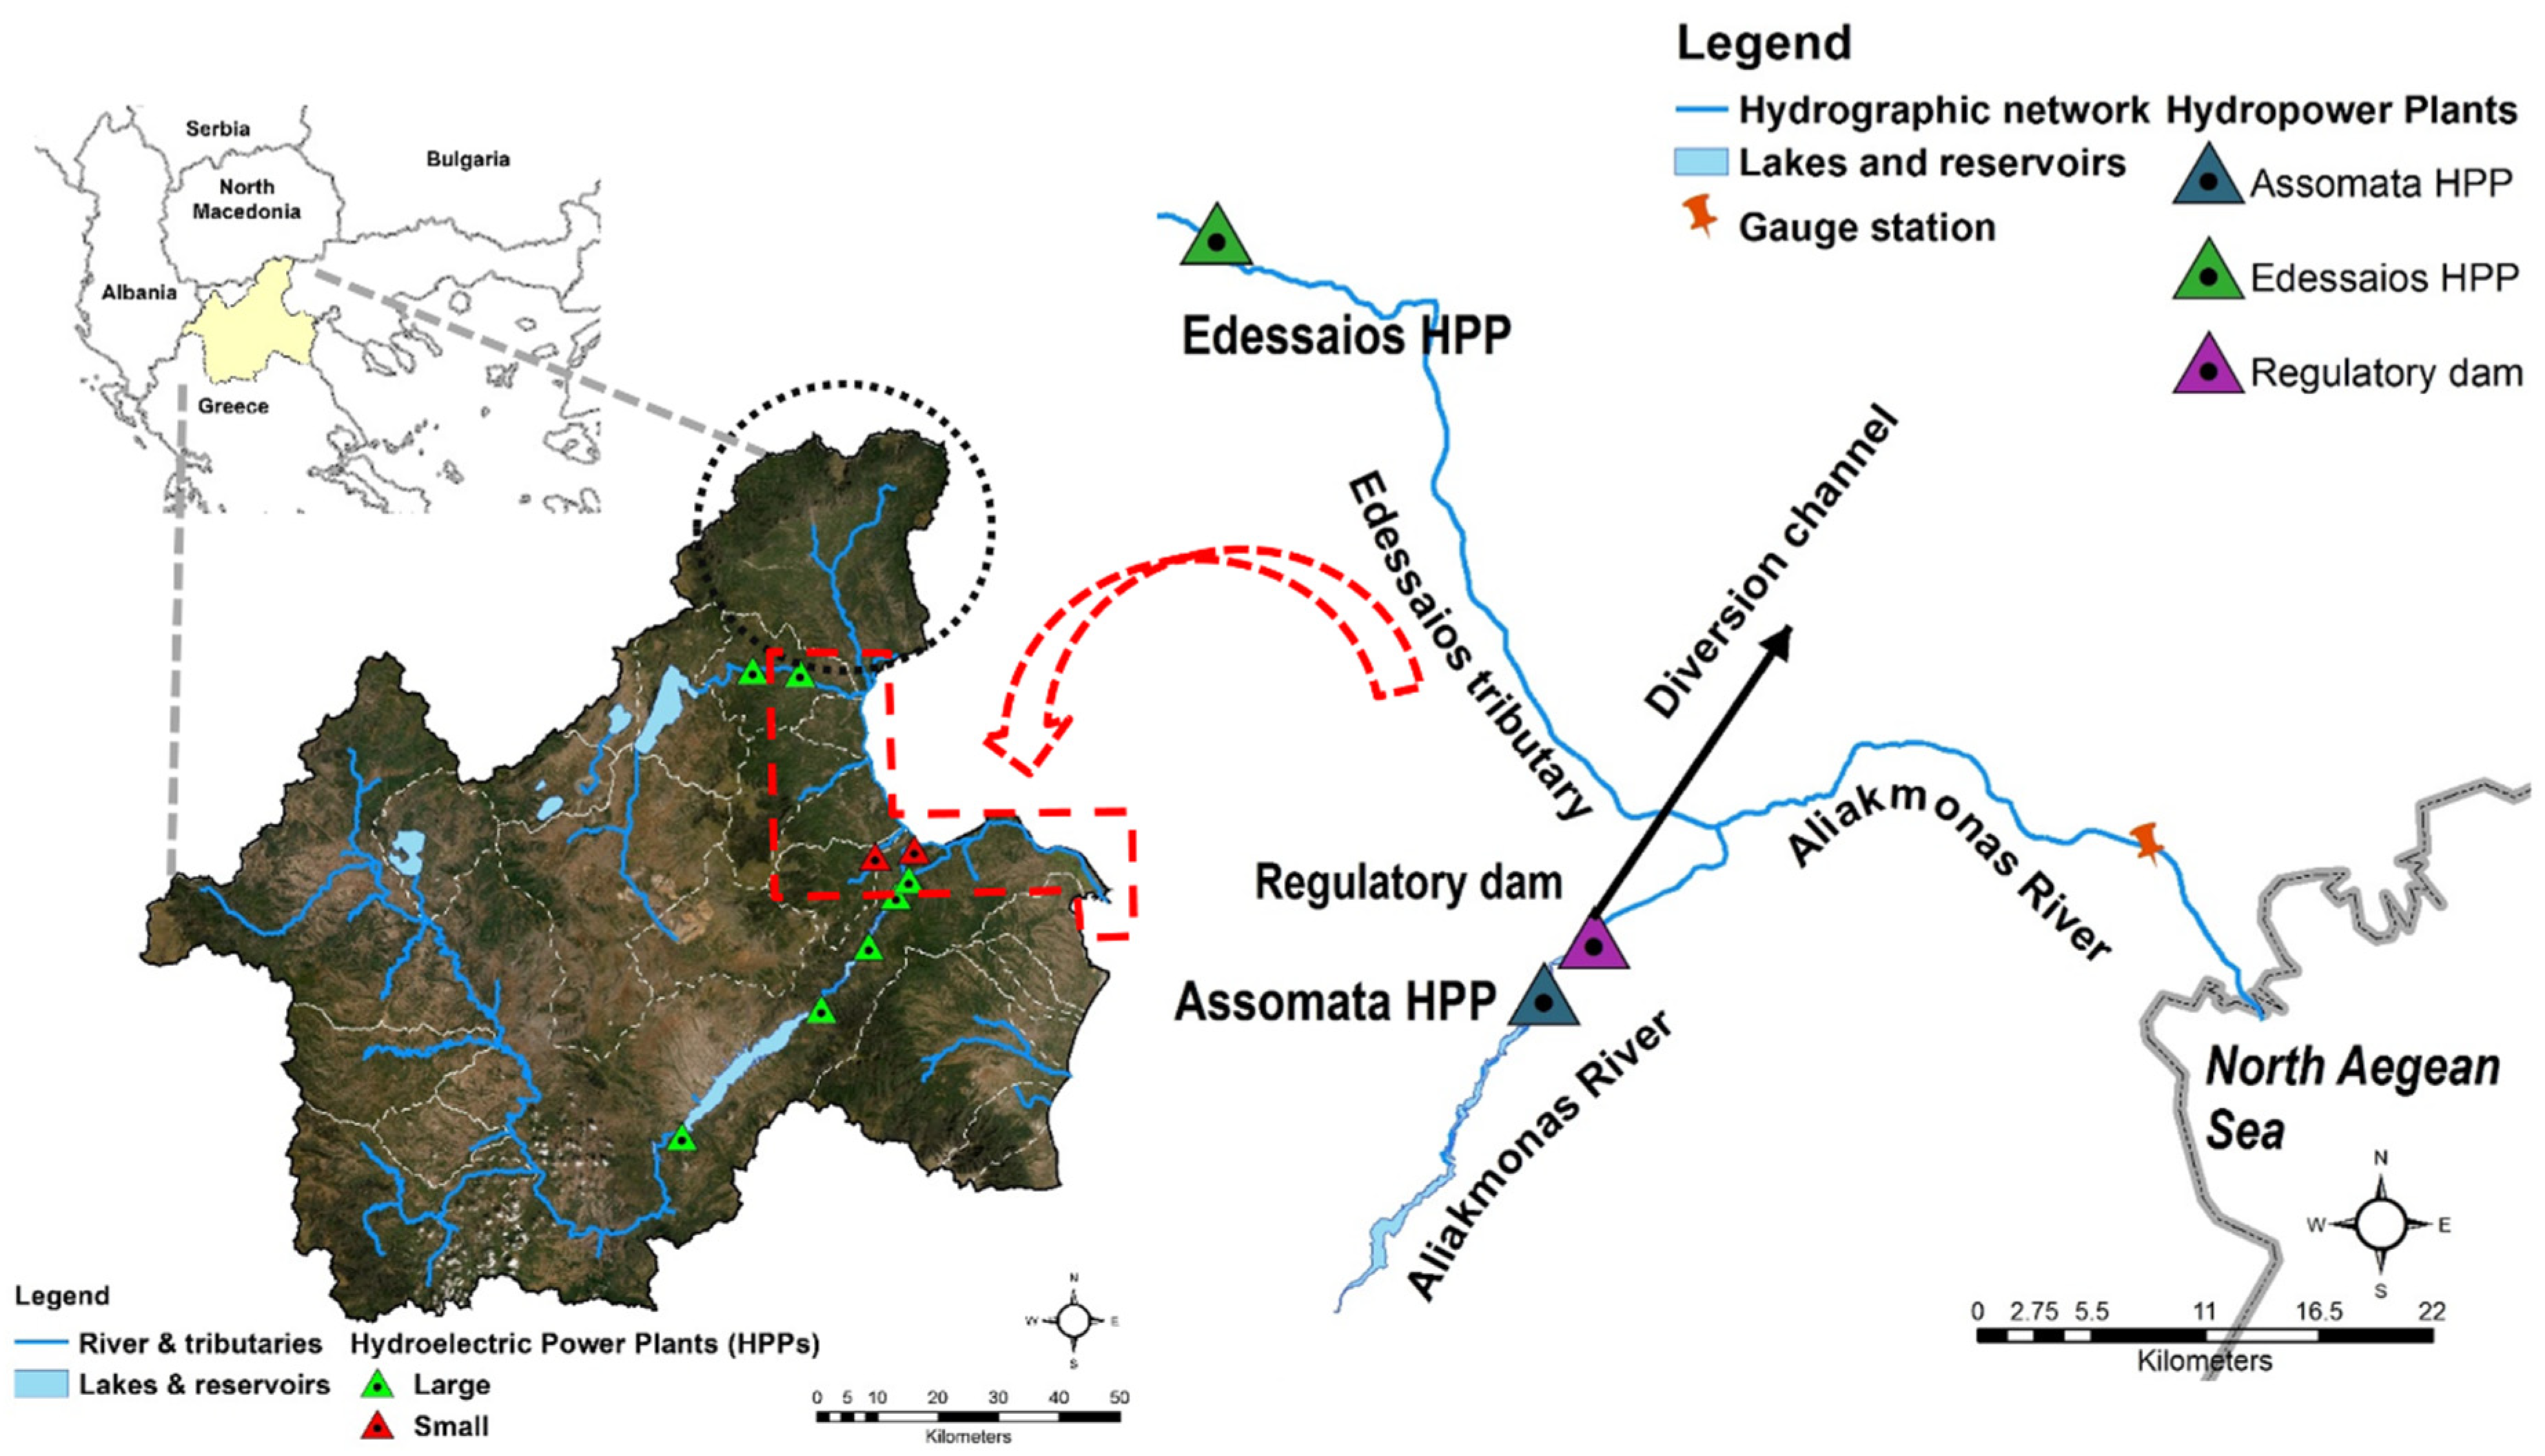
The Aliakmonas river basin belongs to the WD of Western Macedonia (GR09) in Greece. Its headwaters are located in the mountainous region near the Greek-Albanian border and it follows a southeasterly direction before outflowing into the North Aegean Sea, Figure 1. Aliakmonas is the largest national river with its main topographic and hydrological characteristics [29] to be presented in Table 1. The waters are used for hydropower production, irrigated agriculture, the water supply of the city of Thessaloniki, Greece’s second most important industrial centre after Athens, and for environmental purposes.
Regarding hydropower, seven large and two small HPPs, of a total installed capacity of about 1000.0 MW, have consecutively been constructed since the early 1970s on the river’s main course and its tributaries. The downstream dam of that hydropower complex, namely Assomata, Table 2 [30] is located on the main branch of the river at a distance of 43.0 km upstream of the estuaries, Figure 1. A small regulatory reservoir for diverting water through open channel structures for the coverage of the aforementioned water demands is located just downstream of the Assomata dam outlet. The characteristics of the Edessaios hydropower plant, which is the downstream HPP on the main tributary of the Aliakmonas River, Figure 1, are also presented in Table 2 [30]. The segment between the confluence of Aliakmonas River with the aforementioned tributary and the estuary is controlled by earthen levees and no additional inflows are conducted. All the downstream ephemeral streams discharge in the drainage channels of the plain. The reason behind the selection of the specific case study area lies on the fact that it is the largest national river basin, combines several dams in two of which the proposed methodology is implemented, and a real-time monitoring station is located downstream, which is used for validation purposes.
2.3. Validation of Methodology
For the assessment of the water that reaches the estuaries, the estimated dam outflows for the calendar year 2018 are considered as inputs in a simplified water balance model, with the irrigation demands on water and the water supply demands to be considered as the model’s water extractions, Table 3. The irrigation demands cover a period of 5.5 months, i.e., from the second half of April till the end of September, while the water supply demands are constant, i.e., 2.01 m3/s are continuously diverted from the downstream regulatory dam towards the city of Thessaloniki.
The losses due to infiltration and evapotranspiration in the river segment between the dam and the location of the observation station, which is used for the validation of the outputs, are not taken into account in the research. As for the infiltration, the fact that the irrigation demand in the specific area is satisfied by surface waters demonstrates a minimal decrease or even an upward tendency of the piezometric level at adjacent monitoring boreholes, while the maximum infiltration losses are estimated as being up to 11% of the yearly water volumes [31]. In terms of downstream riparian evapotranspiration (ET), ET along the river bed depends on climatic conditions and the vegetation type characteristics such as height, leaf area and density and the extent of the covered area [32]. A research conducted in a Mediterranean basin with similar climatic characteristics with our case study basin demonstrated that riparian ET has a small impact (~4.5%) to the annual catchment water budget [33]. Hence, in the downstream part of the Aliakmonas River, the fact that the corridor is both short in length and narrow in width (varying from 100 to 150 m) implies relatively small water losses due to infiltration and ET.
In regard to the irrigation demands, the figures of the RBMP are based on the Blaney-Criddle (BC) which is a widely used method for estimating the demands for water both at global and regional scales [34]. The monthly allocation of the irrigation water is based on a 10-year period (1995–2004) of data from 5 irrigation networks covering an area of 10,000 ha [35], Table 4. Thereafter, the assessment of the monthly water withdrawals are conducted by applying the derived percentages of Table 4 to the whole study area and then multiplying by the mean annual withdrawal value for irrigation i.e., 24.95 m3/s. The figures presented in Table 4 are considered valid both for the current period and the whole irrigated area, since the agriculture statistics for the years 2003 and 2016 from the Hellenic Statistical Authority (https://www.statistics.gr/en/statistics/-/publication/SPG32/) revealed that the cultivations in the area are maintained almost the same, in terms of arable land and agricultural holdings.
2.4. Data Scraping and Outputs Validation
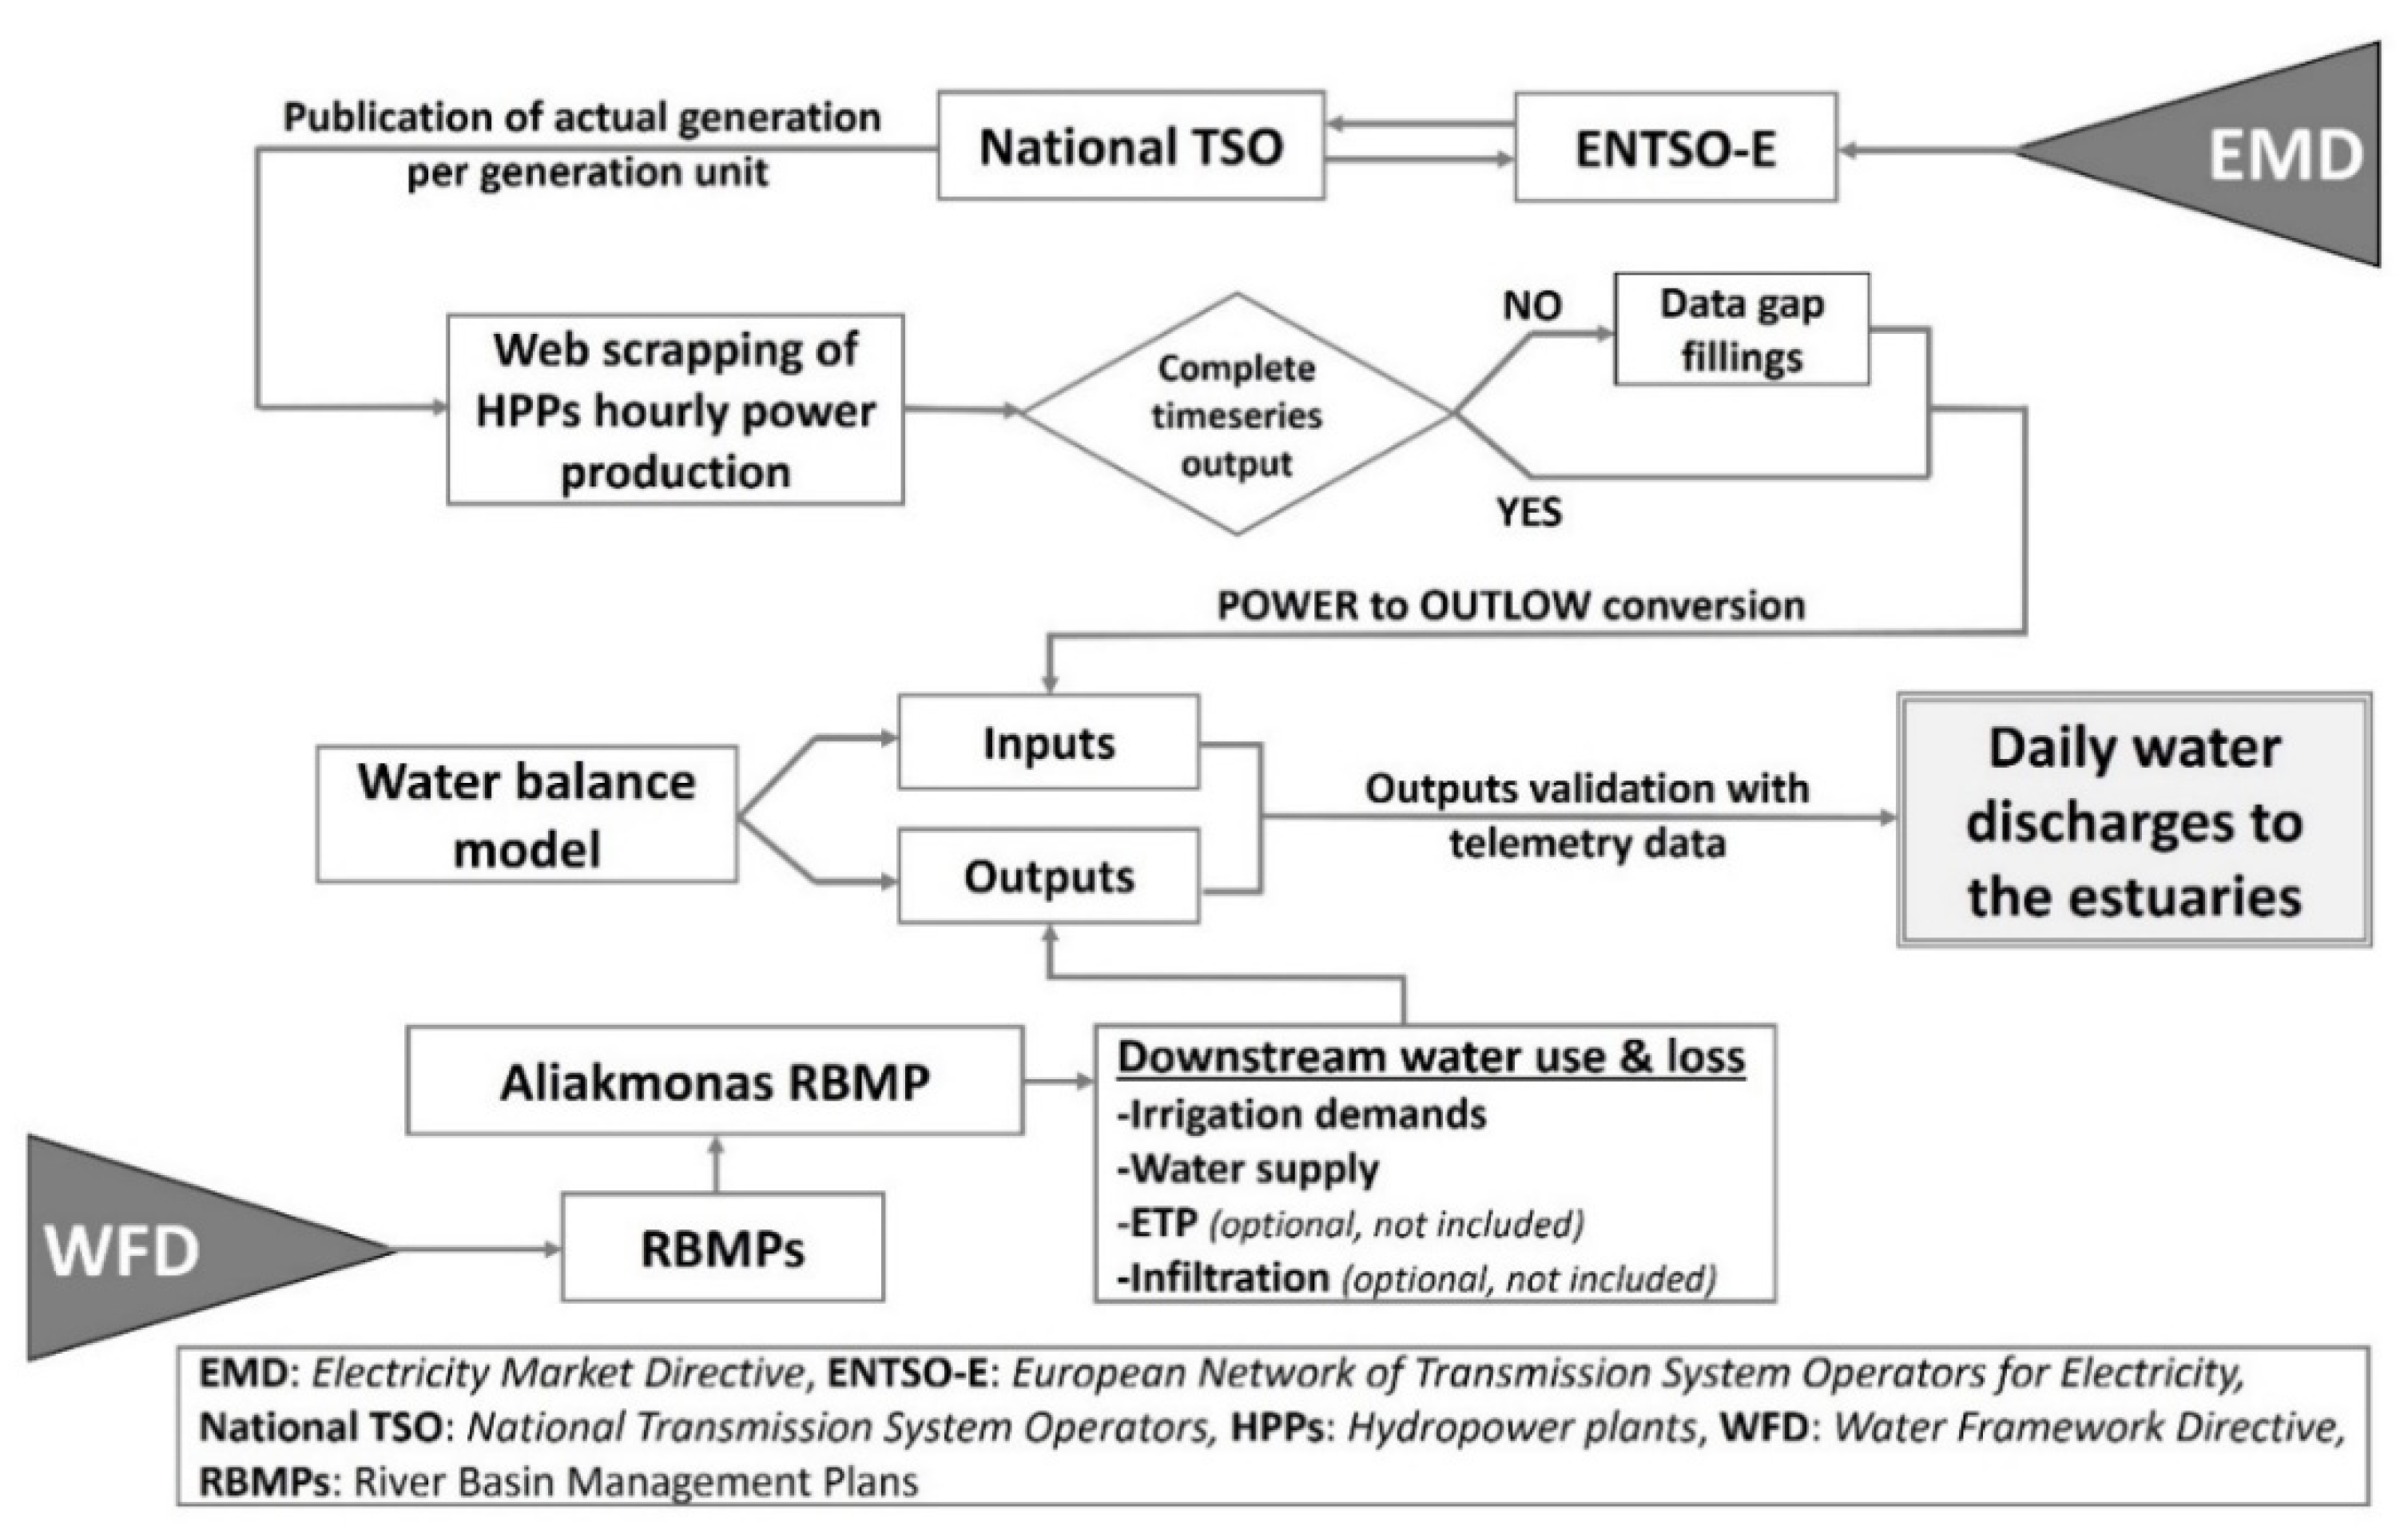
In order to perform web scraping, the visual basic’s imports statements of “System.Text.RegularExpressions” and “System.Net” were used to properly edit the HTML tags of the webpage being read and to support the object “HttpWebRequest” that creates the request to the webpage address respectively. The “DownloadFile” method was included in the scraper code to download the data (in the Greek TSO platform the data are stored in excel files at an hourly time step) to a local server. Finally, the “Range.Copy” and “Range.PasteSpecial” methods were used to copy the desired data of the excel file and paste in a new file. To exclude any inconsistencies introduced by the downloaded raw data series to the proposed methodology, the gap-filling in the power production time series was conducted as (a) data of up to 3 h were filled by average values of neighbouring hours, and (b) missing days of data were replaced with long-term averages. Moreover, the control of the discharges’ values was achieved with the use of thresholds that were derived by the dam’s mechanical equipment, i.e., the maximum outflows of the turbines. The synopsis of the applied methodology is illustrated in the flowchart of Figure 2.
Finally, data from a telemetric monitoring station that forms part of the national water monitoring network of the Ministry of Environment and Energy in Greece were used to validate the research outputs. The station is located under a highway bridge, approximately 9.5 km upstream of the river outlet, i.e., 33.5 km downstream of the Assomata dam, Figure 1. The station is a continuous-record stream gauge consisted of an Acoustic Doppler Current Profiler for the measurement of the velocity at various water levels, and a piezometer which facilitates the water level observation. Both instruments are fully automated and transmit data every half hour to a base station. For the purpose of our research, the half-hour observed discharges were aggregated to daily flows for the period of 1st January 2018 to 31 December 2018, and then they were compared to the outputs of the water balance model. The year 2018 was the fourth warmest year in the global temperature record, and in terms of precipitation, above-average precipitation amounts were observed in south-east Europe [36], i.e., in the broader area of the case study. Similar outputs, i.e., wetter year than average, are also concluded in the European State of the Climate 2018 annual report [37]. The selection of the year 2018 as the demonstration period is due to the fact that the telemetric gauge was not operational in earlier time periods.
3. Results
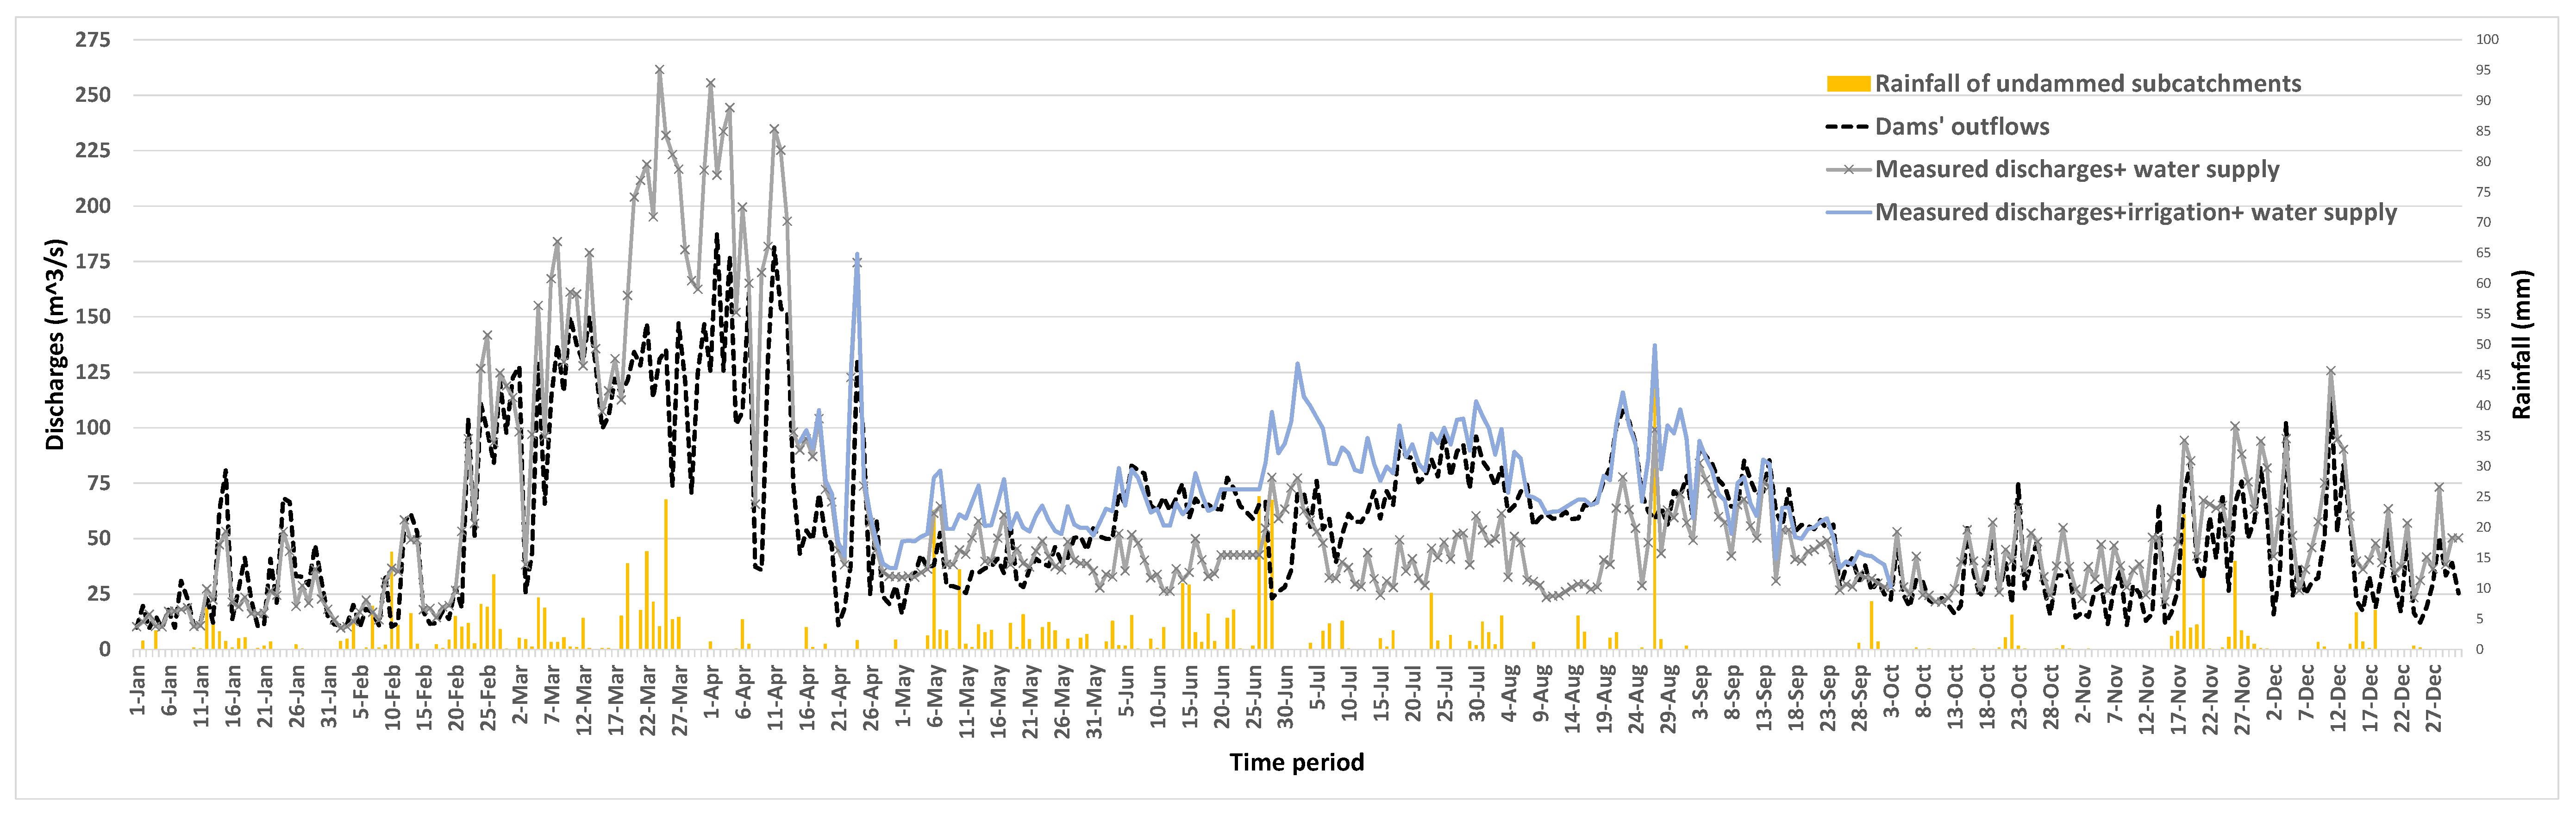
Hourly energy production data covering the period of 1st January 2018 to 31st December 2018 of the Assomata and Edessaios HPPs were converted to discharges, with the hydraulic efficiency of the turbines to be considered equal to 0.848 and 0.871 respectively. These figures were retrieved by the technical studies of the HPPs [30]. The daily average released discharges (expressed in cubic meters per second) are presented in Figure 3. At an annual level, the average dams’ outflows were 56.86 m3/s, with Assomata HPP accounting for 96% of the aforementioned figure. Regarding the same dam, the maximum hourly outflows of 312.2 m3/s are observed at the beginning of April and at the same time period, the maximum daily water releases of 185.2 m3/s occur. The maximum hourly and daily releases of 15.8 m3/s and of 6.1 m3/s from the Edessaios dam take place in mid-November and mid-April respectively. In Assomata, the minimum daily outflows of approximately 7.5 m3/s occurred at the beginning of January, while in the case of Edessaios, the dam didn’t produce power for 27 days, thus no outflows were derived, and for 79 days of the specific year, the released water was less than 1.0 m3/s.
To interpret any inconsistencies due to the runoff of the subbasins that are not drained into the two aforementioned dams (black dotted circled area in Figure 1) but confluence directly to the main river course, a qualitative assessment was conducted. Hence, the daily accumulated rainfall of four automatic precipitation stations that correspond to those subbasins was taken into account, Figure 3. The rainfall data come from the online database of the Institute for Environmental Research and Sustainable Development of the National Observatory of Athens, which has developed and operates a network of 355 automated weather stations across Greece [38]. The most severe rainfall event of 48.0 mm took place in the 27th of August 2018, while June is the rainiest month with 132.8 mm, followed by February, March, and May respectively with rainfalls to be around 90.0 mm per month. The driest months for the specific subbasins were September and October with the rainfall around 10.0 mm.
On an inter-monthly time scale, for the Assomata HPP, the average monthly maximum power production takes place during March, April, June and July with the water releases to be equivalent to 114.2 m3/s, 81.2 m3/s, 70.4 m3/s and 70.1 m3/s respectively. During the late spring and winter months, the dam discharges vary from 29.4 m3/s to 35.8 m3/s. In the case of the Edessaios HPP, apart from the summer period, the dam releases 1.4 m3/s to 2.4 m3/s, as an averaged monthly flow, while in summer the flows vary from 0.5 m3/s to 0.7 m3/s. The intraday analysis of the HPP data demonstrated that maximum outflows of 127.7 m3/s occur late in the evening, i.e., from 20:00 to 22:00 h, while the minimum water releases of 0.52 m3/s occur in the early morning, i.e., from 04:00 to 06:00 h. The fluctuation of the energy production coincides with those mentioned in the literature, where the primary energy consumption on a typical weekday is observed during the late evening [39]. Regarding the observation data, the interannual average discharge is equal to 58.2 m3/s. The daily maximum observed discharges of 259.6 m3/s take place in March while the minimum river runoff of 7.7 m3/s occurs in February. At a monthly level, March and January are the months with the higher and lower average flows of 157.9 m3/s and 20.8 m3/s respectively.
The comparison of the dams’ outflows with the observed discharges demonstrates a quite good correlation. The coefficient of determination (R2) and the root mean square error (RMSE), which is normalized with the higher daily observed runoff, are equal to 0.629 and 0.162 respectively. As mentioned before, the gauge station is installed downstream of the irrigation-water supply distribution structure, which means that the water volumes diverted to the irrigation canals are not measured by the monitoring instruments. Likewise, water supply volumes are not measured, thus they were artificially added in the observed discharges in order to proceed with the comparisons of the modelled dams outflows and the observed ones. By taking into account the irrigation water (the blue curve of Figure 3 corresponds to the runoff observations plus the water extractions for the irrigation demands and the water supply), R2 and RMSE are ameliorated and are equal to 0.754 and 0.117 respectively.
4. Discussion and Implications for Downstream Waters
In this study, a methodological guide is presented for the utilization of publicly accessible cloud-based data, through custom-developed data scrapers, for the assessment of dams’ outlets and the downstream water allocation. The cloud-based data regard descriptive information of water usage and tabulated data of hourly power production, obtained from the WFD and EMD implementation processes respectively, for the calculation of near-real-time (data of the previous day) hourly water releases at dammed rivers. After the liberalization of the energy market, the research on this field is focused on the optimization of the day-ahead hydropower production [40] of the water storage [41] and on methods for valuing irrigation water [42]. No relevant research on the combination of energy and water Directives, to the authors’ knowledge, has been conducted. Moreover, the provided methodology for treating the two aforementioned Directives as open access cloud-based databases in order to proceed with the management of dammed rivers is believed as the innovative aspect of the research, with potential operationality to other EU case studies. The promotion of data scraping for harvesting web-based environmental information is also considered an asset of the current research.
4.1. Technologies for Data Sharing
Currently, there are various ways of data harvesting from web databases such as the well-known file transfer protocol (FTP) or the more modern application programming interfaces (APIs). Beinarts et al. [43], for example, propose a monitoring system of multiple environmental parameters, where the sensors’ outputs are stocked to a data logger and thereafter they are transmitted to an FTP server using an internet connection. APIs are considered as the bridge that allows one software to communicate to another, thus it allows users to access specific features, data or services from an application or operating system, through their web-browsers. The Food and Agriculture Organization, for instance, makes its data available through the FAOSTAT API and related R-package [44], while several more useful nature science-related APIs are presented in the literature [45]. ENTSO-E has also created its own central transparency platform that allows machine-to-machine (M2M) queries for all the structured data stocked in its database [46]. Its structure is an open REST API interface through which the data on the platform can be fetched in XML format. The API supports both POST and GET methods, while a security token is required, with the latter to be obtained after registration to the ENTSO-E platform. A minor shortcoming of the API is that all requests are based on “dependency tables” whose attributes must be used to request the published data, e.g., the expression “/api?securityToken=XXX&documentType=A73&processType=A16” followed by the specific country and power plant codes corresponds to the actual generation output of that specific power plant.
Data extraction from the web belongs to the class of big data problems [47]. Vitolo et al. [48] present a comprehensive review on web-service-related technologies to manage, transfer and process big data and propose solutions, such as common protocols and standards for data encoding when dealing with web-based environmental data. However, the FTP and API technologies are domain-specific technologies with the data retrieval to be possible only if the data provider has created the proper infrastructure for sharing data or services, e.g., the data stocked in a server are attributed with permissions for being accessed. Moreover, APIs do not permit customization of the data requests and not all web-based databases offer a free to use API to download selected information. On the other hand, web scrapers offer the benefit of retrieving open access data that are published in the web in form of daily updated data such as hourly meteorological data, or data that are not disseminated through APIs. One additional advantage of web scrapers is the unlimited download potentiality while APIs are having limited usage policies [47].
In the current research, data scrapers proved to be important tools for the acquisition of freeware environmental and energy data. Data scrapers oriented for collecting data from databases of institutions or agencies may be considered as web service wrappers [49]. However, while accessible through a web browser, data from these sources cannot be directly used by models or analysis tools without human intervention [50]. Different input formats or syntaxes could make data elaboration a complex procedure. Screen scraper services, i.e., scrapers that retrieve daily datasets presented through a webpage in html or similar web programming formats, need to be programmed specifically for each data source. Moreover, the interpretation of the datasets requires the expertise of the scientists that use the data, since heterogeneity problems might occur.
4.2. Outputs’ Strength and Potential Biases
The produced results are considered highly accurate and realistic since they are based on a mix of real measurements and modelled outputs. At any case, they might incorporate the kind of uncertainties produced by simulation techniques, which may be due to (a) sub-optimal parameter values, (b) incomplete or biased model structure, (c) random or systematic errors in the model inputs or boundary condition data, and (d) random or systematic errors of recorded output data [51]. In particular, the potential biases induced in the specific methodology may come from (i) the accuracy of Blaney-Criddle (BC) to interpret the irrigation demands on water, and the non-taking into consideration of the (ii) evapotranspiration (ET) and (iii) infiltration losses into the river segment from the dam to the estuaries. Regarding the irrigation demands, the BC method is one of the four ET estimation models (Radiation balance (RB), Blaney-Criddle, Penman (PEN) and Pan-evaporation (PE)) that have been recommended by the Food and Agriculture Organization (FAO) of the United Nations for the estimation of ET for irrigation scheduling [52]. The performance of these methods has been widely evaluated under different climate conditions [34]. The BC method is also used in the River Basin Management Plan of the river basin under investigation. As far as infiltration is concerned, although the irrigation demands in the case study area are covered by surface irrigation networks, measured stream infiltration volume during model calibration would increase the likelihood of obtaining accurate modelled estimates of stream infiltration from natural flow events [53]. In terms of ET, Xu et al. [54] reveal that ET remain essentially unchanged before and after reservoir constructions and irrigation development. At the same time, research in 17 river basins in South Africa demonstrates that both the evaporation losses from the wetted channel surface and evapotranspiration losses from adjacent and underlying alluvium account for an averaged 7.9% of the mean annual runoff of the rivers under investigation [55].
The proposed methodology outputs demonstrate the increased correlation between the measured discharges and the dams’ outflows (R2 = 0.754, RMSE = 0.117) by also taking into account the irrigation and water supply water. The outputs, Figure 3, depict two periods of intense anomalies between the two data sets, such as from the 19th March to 9th April and from the 25th June to 15th of July 2018. In both cases, the water released from the HPP are much lower than the observed ones. The reason behind this is the typical Mediterranean regional spring-summer storms that occurred in the basin’s areas whose waters are discharged directly into the river mainstream. The rainfall time series of these areas, also integrated in Figure 3, support the proposed assumption, since intense rainfalls had occurred for a few days and during the two time periods. In the case of omitting these two short-time periods, there would be a modest improvement of the outputs (R2 = 0.779, RMSE = 0.074).
In terms of capacity factor (CF), i.e., the ratio of annual generation to total installed capacity (yearly CF = generation/(installed capacity × 8760 h), the CF for the Assomata dam was computed as being equal to 15.1%. This value is in the same range as the CF values of other Greek dams, i.e., approximately around 13% [56]. The maximum operation of the dams’ turbines mainly during early spring, as well as during the daily peak demand hours, is possibly the reason behind the low CF values. The fact that the global average CF is 44% [57] leaves wide margins for further exploitation of the dams for power production purposes. Particularly, CF values exceeding 30% can be conceived as a rather motivating financial efficiency indicator for energy production investments [58]. This issue may lead to different management policies for the operation of HPPs.
The multipurpose use of the basin’s water with the respective water supply, irrigation and environmental flow coverage demands necessitates the acknowledgement of the available water volumes both in near real-time and in short-term periods. The proposed methodology can facilitate the estimation of the downstream water releases, and consequently the water allocation to the end-users. Further development of the research could integrate longer time series of data where both dry and wet years are met. However, in the proposed approach the agricultural demand on water is based on static data, i.e., those derived by the RBMPs, hence, the excess water demands for agriculture cannot be evaluated. To do so, methods that incorporate escalating irrigation demands based on actual climatic conditions [59] should be assessed. The implementation of the methodology to other EU hydrosystems, which include HPPs and dam-fed irrigated agriculture, in order to evaluate the methodology’s sensitivity to dams of various scales and to different irrigation practices is planned to be applied soon.
4.3. Enforcement of EU Environmental Policies
The synergies among the EU environmental Directives is a matter of great concern since they constitute the backbone of the EU environmental policy. At the same time, the ‘Blueprint to Safeguard Europe’s Water Resources’ [60] emphasizes on the need for increased integration of WFD objectives with the common agriculture policy, the policies on renewable energy and the management of floods and droughts. Rouillard et al. [61], in their policy review, investigate the way that global accepted environmental approaches such as the Ecosystem-based management (EBM) are fostered by three environmental Directives, namely the Birds and Habitats Directives, Water Framework Directive and Marine Strategy Framework Directive. The authors concluded to the commonalities that represent opportunities for streamlining and coordinating between the Directives and support the implementation of EBM, as well as they identify potential gaps, e.g., the integration of planning processes and monitoring programmes or the integration of local knowledge in the decision-making process.
The complementarity of specific Directives is more obvious, such as the WFD and the Floods Directive that are implemented at the same basin scales and their regulations, various targets and instruments should be applied in parallel [62]. On the other hand, the linkage of EMD, i.e., electricity, and WFD, i.e., water, is rather controversial than apparent. However, modern concepts such as the Water-Energy-Food-Environment (WEFE) nexus deliberate water and energy as intercorrelated sectors [63] that are pivotal for sustainable development. Water is used in all phases of energy production and electricity generation, while energy is required to extract, convey and deliver water of required quantity and of appropriate quality for diverse human uses. The nexus approach recognizes the interdependencies of these sectors and aims to provide a framework for assessing the use of all resources and to manage trade-offs and synergies [64]. Towards this direction, the proposed concept of coupling hydropower production with water demands provides an important methodological approach for (i) enhancing EU policies by coupling two EU Directives that have a different nature, (ii) contributing to the implementation of the WEFE nexus by providing accurate datasets for water availability and demands, and (iii) providing water discharge data in ungauged dammed rivers, which can be used in the WFD implementation process. The assessment of the environmental flows, i.e., the water regime provided within a river to maintain healthy ecosystems in case of dammed rivers is proposed, among others, as the continuation of the current research; an issue that also highlighted in the WFD.
5. Conclusions
Overall, web service-related technologies and tools utilized to manage, transfer and process big data are emerging technologies that will facilitate environmental research. In the applied methodology, the use of web scrapers is proposed to integrate data from open cloud-based databanks created for the implementation of two EU Directives, namely EMD and WFD. The main pivotal outputs of the research could be summarized to:
- Web scrapers facilitate the retrieval of environmental data that are regularly published on web pages and are not accessible through other data-sharing technologies.
- Automated procedures, through custom, made web scrapers, to retrieve and download dams’ outflows can shed light on the real downstream water volumes of river’s that are controlled with barrages.
- Straightforward approaches can accurately translate HPPs’ power production data into released water discharges.
- The coupling with downstream water demands, which are available through the RBMPs, can demonstrate both potential water deficits in the downstream agricultural, water supply and environmental sectors and potential water excess situations. In both situations, further development plans could be initiated for the sound management of the waters.
- The proposed methodology together with relevant environmental information coming from static data sources, e.g., scientific articles and technical reports, could contribute to a holistic approach for the management of the water resources.
- Actual enforcement of synergies among EU Directives’ implementation processes, and contribution to innovative policy concepts, such as the WEFE nexus.
- Contribution to the investigation of other environmental thematic areas, such as management of the coastal zone or coastal prognoses (wave fields, circulation and sea level) conducted by sea hydrodynamic circulation models, or assessment of the quality of downstream waters.
Author Contributions
Conceptualization, C.S.; methodology, C.S. and Y.K.; validation, C.S. and Y.K.; investigation, C.S.; resources, C.S.; writing—original draft preparation, C.S.; writing—review and editing, C.S. and Y.K. All authors have read and agreed to the published version of the manuscript.
Funding
This research received no external funding.
Conflicts of Interest
The authors declare no conflict of interest.
References
- Skoulikaris, C.; Filali-Meknassi, Y.; Aureli, A.; Amani, A.; Jiménez-Cisneros, B.E. Information-Communication Technologies as an Integrated Water Resources Management (IWRM) tool for sustainable development. In Integrated River Basin Management for Sustainable Development of Regions; Komatina, D., Ed.; InTech Publications: London, UK, 2018. [Google Scholar]
- Skoulikaris, C.; Ganoulis, J.; Karapetsas, N.; Katsogiannos, F.; Zalidis, G. Cooperative WebGIS interactive information systems for water resources data management. In Hydrology in a Changing World: Environmental and Human Dimensions; Daniell, T., van Lanen, H.A.J., Demuth, S., Laaha, G., Servat, E., Mahe, G., Boyer, J.-F., Paturel, J.-E., Dezetter, A., Ruelland, D., Eds.; IAHS: Wallingford, UK, 2014; Volume 363, pp. 342–347. [Google Scholar]
- Richts, A.; Struckmeier, W.F.; Zaepke, M. WHYMAP and the Groundwater Resources Map of the World 1:25,000,000. In Sustaining Groundwater Resources. International Year of Planet Earth; Jones, J., Ed.; Springer: Dordrecht, The Netherlands, 2011. [Google Scholar]
- Makarigakis, A.K.; Jimenez-Cisneros, B.E. UNESCO’s Contribution to Face Global Water Challenges. Water 2019, 11, 388. [Google Scholar] [CrossRef] [Green Version]
- Ganoulis, J.; Skoulikaris, C. Interactive open source information systems for fostering transboundary water cooperation. In Free Flow—Reaching Water Security Through Cooperation; Griffiths, J., Lambert, R., Eds.; United Nations Educational, Scientific and Cultural Organization (UNESCO) & Tudor Rose: Paris, France, 2013; pp. 96–99. [Google Scholar]
- Goodall, J.L.; Horsburgh, J.S.; Whiteaker, T.L.; Maidment, D.R.; Zaslavsky, I. A first approach to web services for the National Water Information System. Environ. Model. Softw. 2008, 23, 404–411. [Google Scholar] [CrossRef]
- Beran, B.; Piasecki, M. Availability and coverage of hydrologic data in the US geological survey National Water Information System (NWIS) and US Environmental Protection Agency Storage and Retrieval System (STORET). Earth Sci. Inf. 2008, 1, 119. [Google Scholar] [CrossRef] [Green Version]
- Hannerz, F.; Langaas, S. Establishing a water information system for Europe: Constraints from spatial data heterogeneity. Water Environ. J. 2007, 21, 200–207. [Google Scholar] [CrossRef]
- Daly, C.; Taylor, G.H.; Gibson, W.P.; Parzybok, T.W.; Johnson, G.L.; Pasteris, P.A. High-quality spatial climate data sets for the United States and beyond. Trans. Am. Soc. Agric. Eng. 2000, 43, 1957–1962. [Google Scholar]
- Panagos, P.; Van Liedekerkz, M.; Jones, A.; Montanarella, L. European Soil Data Centre: Response to European policy support and public data requirements. Land Use Policy 2012, 29, 329–338. [Google Scholar] [CrossRef]
- Lawson, R. Web Scraping with Python; Pack Publishing: Birmingham, UK, 2015. [Google Scholar]
- Ginde, G.; Aedula, R.; Saha, S.; Mathur, A.; Dey, S.R.; Sampatrao, G.S.; Sagar, B.S.D. Big Data Acquisition, Preparation, and Analysis Using Apache Software Foundation Tools. In Big Data Analytics: Tools and Technology for Effective Planning; Somani, A., Deka, G., Eds.; Chapman and Hall/CRC: New York, NY, USA, 2017. [Google Scholar]
- Yu, J.; Leighton, B.; Car, N.; Seaton, S.; Hodge, J. The eReefs data brokering layer for hydrological and environmental data. J. Hydroinform. 2015, 18, 152–167. [Google Scholar] [CrossRef]
- Bonifacio, C.; Barchyn, T.E.; Hugenholtz, C.H.; Kienzle, S.W. CCDST: A free Canadian climate data scraping tool. Comput. Geosci. 2015, 75, 13–16. [Google Scholar] [CrossRef]
- Budiarti, R.P.N.; Widyatmoko, N.; Hariadi, M.; Purnomo, M.H. Web scraping for automated water quality monitoring system: A case study of PDAM Surabaya. In Proceedings of the 2016 International Seminar on Intelligent Technology and Its Applications (ISITIA), Lombok, Indonesia, 28–30 July 2016; pp. 641–648. [Google Scholar]
- Bonetti, F.; Corsi, S.; Orsi, L.; De Noni, I. Canals vs. Streams: To What Extent Do Water Quality and Proximity Affect Real Estate Values? A Hedonic Approach Analysis. Water 2016, 8, 577. [Google Scholar] [CrossRef]
- Beunen, R.; van der Knaap, W.G.M.; Biesbroek, G.R. Implementation and integration of EU environmental directives. Experiences from The Netherlands. Environ. Policy Gov. 2009, 19, 57–69. [Google Scholar] [CrossRef]
- Meeus, L.; Purchala, K.; Belmans, R. Development of the Internal Electricity Market in Europe. Electr. J. 2005, 18, 25–35. [Google Scholar] [CrossRef]
- Kallis, G.; Butler, D. The EU water framework directive: Measures and implications. Water Policy 2001, 3, 125–142. [Google Scholar] [CrossRef]
- Moss, B. The Water Framework Directive: Total environment or political compromise? Sci. Total Environ. 2008, 400, 32–41. [Google Scholar] [CrossRef] [PubMed]
- Voulvoulis, N.; Arpon, K.D.; Giakoumis, T. The EU Water Framework Directive: From great expectations to problems with implementation. Sci. Total Environ. 2017, 575, 358–366. [Google Scholar] [CrossRef] [Green Version]
- Nilsson, C.; Reidy, C.A.; Dynesius, M.; Revenga, C.L. Fragmentation and Flow Regulation of the World’s Large River Systems. Science 2005, 308, 405–408. [Google Scholar] [CrossRef] [Green Version]
- Schwarz, U. Hydropower Pressure on European Rivers: The Story in Numbers; FLUVIUS, WWF, RiverWatch, EuroNatur, GEOTA Technical Report; EU Publications: Luxembourg, 2019. [Google Scholar]
- Huđek, H.; Žganec, K.; Pusch, M.T. A review of hydropower dams in Southeast Europe—Distribution, trends and availability of monitoring data using the example of a multinational Danube catchment subarea. Renew. Sustain. Energy Rev. 2020, 117, 109434. [Google Scholar] [CrossRef]
- Wagner, B.; Hauer, C.; Habersack, H. Current hydropower developments in Europe. Curr. Opin. Environ. Sustain. 2019, 37, 41–49. [Google Scholar] [CrossRef]
- Creti, A.; Fumagalli, E.; Fumagalli, E. Integration of electricity markets in Europe: Relevant issues for Italy. Energy Policy 2010, 38, 6966–6976. [Google Scholar]
- Gephart, M.; Klessmann, C.; Wigand, F. Renewable energy auctions–When are they cost-effective? Energy Environ. 2017, 28, 145–165. [Google Scholar] [CrossRef]
- Hering, D.; Borja, A.; Carstensen, J.; Carvalho, L.; Elliott, M.; Feld, C.K.; Heiskanen, A.-S.; Johnson, R.K.; Moe, J.; Pont, D.; et al. The European Water Framework Directive at the age of 10: A critical review of the achievements with recommendations for the future. Sci. Total Environ. 2010, 408, 4007–4019. [Google Scholar] [CrossRef] [Green Version]
- RBMP-GR09. RBMP-GR09. River Basin Management Plan of Western Macedonia-Greece (GR09). Greek Central Water Agency (CWA) and the Special Water Secretariat of the Ministry of the Environment. Energy Clim. Chang. 2013. Available online: https://ec.europa.eu/environment/water/participation/map_mc/countries/greece_en.htm (accessed on 16 September 2020).
- Greek Committee of Large Dams—GCOLD. Dams in Greece; GCOLD Publications: Athens, Greece, 2013; p. 124, (In Greek and English). [Google Scholar]
- Veranis, N.; Chrysafi, A.; Makrovasili, K. Hydrogeological conditions of the lower reaches of Aliakmonas and Loudias rivers aquifer system, Region of Central Macedonia, Northern Greece. In Advances in the Research of Aquatic Environment; Lambrakis, N., Stournaras, G., Katsanou, K., Eds.; Springer: Berlin/Heidelberg, Germany, 2011; pp. 357–364. [Google Scholar]
- Choudhury, B.J.; Ahmed, N.U.; Idso, S.B.; Reginato, R.J.; Daughtry, C.S.T. Relations between evaporation coefficients and vegetation indices studied by model simulations. Remote Sens. Environ. 1994, 50, 1–17. [Google Scholar] [CrossRef]
- Lupon, A.; Bernal, S.; Poblador, S.; Martí, E.; Sabater, F. The influence of riparian evapotranspiration on stream hydrology and nitrogen retention in a subhumid Mediterranean catchment. Hydrol. Earth Syst. Sci. 2016, 20, 3831–3842. [Google Scholar] [CrossRef] [Green Version]
- Allen, R.G. Crop Evapotranspiration: Guidelines for Computing Crop Requirements; FAO: Rome, Italy, 1998. [Google Scholar]
- Arampatzis, G.; Evangelides, C.; Hatzigiannakis, Ε. Crop requirements and water losses in collective pressurized irrigation networks in northern Greece. Glob. Nest J. 2011, 13, 11–17. [Google Scholar]
- WMO. World Meteorological Organization Statement on the State of the Global Climate in 2018; WMO-No. 1233; WMO: Geneva, Switzerland, 2018; pp. 1–44. [Google Scholar]
- European State of the Climate 2018, Copernicus Climate Change Service. Available online: https://climate.copernicus.eu/sites/default/files/2019-12/Brochure_Final_Interactive_1.pdf (accessed on 16 September 2020).
- Lagouvardos, K.; Kotroni, V.; Bezes, A.; Koletsis, I.; Kopania, T.; Lykoudis, S.; Mazaraki, N.; Papagiannaki, K.; Vougioukas, S. The automatic weather stations NOANN network of the National Observatory of Athens: Operation and database. Geosci. Data J. 2017, 4, 4–16. [Google Scholar] [CrossRef]
- Quilumba, F.L.; Lee, W.-J.; Huang, H.; Wang, D.Y.; Szabados, R.L. Using smart meter data to improve the accuracy of intraday load forecasting considering customer behavior similarities. IEEE Trans. Smart Grid 2014, 6, 911–918. [Google Scholar] [CrossRef]
- Chazarra, M.; García-González, J.; Pérez-Díaz, J.I.; Arteseros, M. Stochastic optimization model for the weekly scheduling of a hydropower system in day-ahead and secondary regulation reserve markets. Electr. Power Syst. Res. 2016, 130, 67–77. [Google Scholar] [CrossRef]
- Braun, S. Hydropower Storage Optimization Considering Spot and Intraday Auction Market. Energy Procedia 2016, 87, 36–44. [Google Scholar] [CrossRef] [Green Version]
- Guisández, I.; Pérez-Díaz, J.I. Evaluating Approaches for Estimating the Water Value of a Hydropower Plant in the Day-Ahead Electricity Market. In Proceedings of the 6th International Workshop on Hydro Scheduling in Competitive Electricity Markets; Helseth, A., Ed.; Springer: Cham, Switzerland, 2019. [Google Scholar]
- Beinarts, I.; Grunde, U.; Jakovics, A. Distributed Multi-Sensor Real-Time Building Environmental Parameters Monitoring System with Remote Data Access. Electr. Control. Commun. Eng. 2014, 7, 41–46. [Google Scholar] [CrossRef]
- Kao, M.C.J.; Gesmann, M.; Gheri, F. Download Data from the FAOSTAT Database of the Food and Agricultural Organization (FAO) of the United Nations; FAO: Roma, Italy, 2015. [Google Scholar]
- Lehmann, A.; Chaplin-Kramer, R.; Lacayo, M.; Giuliani, G.; Thau, D.; Koy, K.; Sharp, R., Jr. Lifting the Information Barriers to Address Sustainability Challenges with Data from Physical Geography and Earth Observation. Sustainability 2017, 9, 858. [Google Scholar] [CrossRef] [Green Version]
- European Network of Transmission System Operators for Electricity (ENTSO-E) Transparency Platform Data Extraction Process Implementation Guide, Version 0.3—Technical Document; ENTSO-E: Brussel, Belgium, 2015.
- Upadhyay, S.; Pant, V.; Bhasin, S.; Pattanshetti, M.K. Articulating the construction of a web scraper for massive data extraction. In Proceedings of the 2nd IEEE International Conference on Electrical, Computer and Communication Technologies, Yogyakarta, Indonesia, 1–2 November 2017. [Google Scholar]
- Vitolo, C.; Elkhatib, Y.; Reusser, D.; Macleod, C.J.; Buytaert, W. Web technologies for environmental Big Data. Environ. Model. Softw. 2015, 63, 185–198. [Google Scholar] [CrossRef] [Green Version]
- Baumgartner, R.; Gatterbauer, W.; Gottlob, G. Web data extraction system. In Encyclopedia of Database Systems; Springer: Boston, MA, USA, 2019; pp. 3465–3471. [Google Scholar]
- Beran, B.; Goodall, J.; Valentine, D.; Zaslavsky, I.; Piasecki, M. Standardizing Access to Hydrologic Data Repositories through Web Services. In Proceedings of the 2009 International Conference on Advanced Geographic Information Systems & Web Services, Cancun, Mexico, 1–7 February 2009; pp. 64–67. [Google Scholar]
- Butts, M.B.; Payne, J.T.; Kristensen, M.; Madsen, H. An evaluation of the impact of model structure on hydrological modelling uncertainty for streamflow simulation. J. Hydrol. 2004, 298, 242–266. [Google Scholar] [CrossRef]
- Doorenbos, J.; Pruitt, W.O. Guidelines for Predicting Crop Water Requirements; FAO Irrigation and Drainage Paper 24; FAO: Rome, Italy, 1977. [Google Scholar]
- Batlle-Aguilar, J.; Xie, Y.; Cook, P.G. Importance of stream infiltration data for modelling surface water-groundwater interactions. J. Hydrol. 2015, 528, 683–693. [Google Scholar] [CrossRef]
- Xu, D.; Lyon, S.W.; Mao, J.; Dai, H.; Jarsjö, J. Impacts of multi-purpose reservoir construction, land-use change and climate change on runoff characteristics in the Poyang Lake basin, China. J. Hydrol. Reg. Stud. 2020, 29, 100694. [Google Scholar] [CrossRef]
- Hughes, D.A. A simple approach to estimating channel transmission losses in large South African river basins. J. Hydrol. Reg. Stud. 2019, 25, 100619. [Google Scholar] [CrossRef]
- Anagnostopoulos, J.S.; Papantonis, D.E. Study of pumped storage schemes to support high RES penetration in the electric power system of Greece. Energy 2012, 45, 416–423. [Google Scholar] [CrossRef]
- Kumar, A.; Edenhofer, O.; Pichs-Madruga, R.; Sokona, Y.; Seyboth, K.; Matschoss, P.; Kadner, S.; Zwickel, T.; Eickemeier, P.; Hansen, G.; et al. Hydropower. In IPCC Special Report on Renewable Energy Sources and Climate Change Mitigation; IPCC: Cambridge, UK; New York, NY, USA, 2011. [Google Scholar]
- Kaldellis, J.K.; Vlachou, D.S.; Korbakis, G. Techno-economic evaluation of small hydro power plants in Greece: A complete sensitivity analysis. Energy Policy 2005, 33, 1969–1985. [Google Scholar] [CrossRef]
- Wriedt, G.; Van der Velde, M.; Aloe, A.; Bouraoui, F. Estimating irrigation water requirements in Europe. J. Hydrol. 2009, 373, 527–544. [Google Scholar] [CrossRef]
- European Commission. A Blueprint to Safeguard Europe's Water Resources; Communication from the Commission to the European Parliament, the Council, the European Economic and Social Committee and the Committee of the Regions; European Commission: Brussels, Belgium, 2012. [Google Scholar]
- Rouillard, J.; Lago, M.; Abhold, K.; Röschel, L.; Kafyeke, T.; Mattheiß, V.; Klimmek, H. Protecting aquatic biodiversity in Europe: How much do EU environmental policies support ecosystem-based management? Ambio 2018, 47, 15–24. [Google Scholar] [CrossRef] [Green Version]
- Albrecht, J. Legal framework and criteria for effectively coordinating public participation under the Floods Directive and Water Framework Directive: European requirements and German transposition. Environ. Sci. Policy 2016, 55, 368–375. [Google Scholar] [CrossRef]
- Adamovic, M.; Bisselink, B.; De Felice, M.; De Roo, A.; Dorati, C.; Ganora, D.; Medarac, H.; Pistocchi, A.; Van De Bund, W.; Vanham, D. Water—Energy Nexus in Europe; Magagna, D., Bidoglio, G., Hidalgo Gonzalez, I., Peteves, E., Eds.; EUR 29743 EN; Publications Office of the European Union: Luxembourg, 2019; ISBN 978-92-76-03385-1. [Google Scholar]
- Hellegers, P.; Zilberman, D.; Steduto, P.; McCornick, P. Interactions between water, energy, food and environment: Evolving perspectives and policy issues. Water Policy 2008, 10, 1–10. [Google Scholar] [CrossRef]
Figure 1.
The Aliakmonas river basin with emphasis on the downstream hydropower plants (HPPs) and the river estuaries in the North Aegean Sea.
Figure 1.
The Aliakmonas river basin with emphasis on the downstream hydropower plants (HPPs) and the river estuaries in the North Aegean Sea.

Figure 2.
Flow chart of the implemented methodology for assessing the daily water discharges to the estuaries.
Figure 2.
Flow chart of the implemented methodology for assessing the daily water discharges to the estuaries.

Figure 3.
Daily average dams’ outflows (dotted black curve) versus measured discharges (grey starred curve) and sum of measurements, irrigation demands and water supply (blue curve) for the period from 1 January 2018 to 31 December 2018. The rainfall of the subbasins that are not drained in the dams’ reservoir is depicted in orange columns.


Table 1.
Characteristics of the terrestrial part of the study area.
| River | Catchment Area (km2) | River Length (km) | Mean Altitude (m) | Average Rainfall/Year (mm) | Annual Discharges at Estuaries(×109 m3) |
|---|---|---|---|---|---|
| Aliakmonas | 6016 | 290 | 1020 | 640 | 2.03 |
Table 2.
Technical characteristics of downstream HPPs of the Aliakmonas River.
| Dam | Reservoir Capacity (106 m3) | Reservoir Area (km2) | Dam Height (m) | Hydraulic Head (m) | Turbines | Turbine Types | Installed Capacity (MW) |
|---|---|---|---|---|---|---|---|
| ASSOMATA | 53 | 2.6 | 52 | 42 | 2 | Francis | 110 |
| EDESSAIOS | No reservoir | - | - | 125 | 1 | Francis | 19 |
Table 3.
Quantification and description of water demands from the Aliakmonas River.
| Water Use | Water Quantity | Comments | Data Source |
|---|---|---|---|
| Urban and industrial water supply | 2.01 m3/s | Freshwater from the Aliakmonas River is diverted through an open gravity channel of 42 km in length. | RBMP-GR09, 2013 |
| Irrigation | 24.95 m3/s | Irrigation demands (BC method). The irrigated area of 60,503 ha is covered by 14 surface networks. | RBMP-GR09, 2013 |
Table 4.
Irrigation water use (in %) per month during an interannual 10 year irrigation period.
| Month | 1995 | 1996 | 1997 | 1998 | 1999 | 2000 | 2001 | 2002 | 2003 | 2004 | Mean (%) | Dev (%) |
|---|---|---|---|---|---|---|---|---|---|---|---|---|
| Apr | 1.7 | 0 | 0.4 | 12.2 | 2.1 | 5.4 | 0 | 0 | 1 | 3.2 | 2.6 | 3.79 |
| May | 7.8 | 13.3 | 12.8 | 8.9 | 12.4 | 9.3 | 7.1 | 12.9 | 15.2 | 7.6 | 10.73 | 2.89 |
| June | 19.7 | 20.2 | 21.8 | 16.2 | 22 | 24.4 | 16.5 | 31.3 | 13.6 | 13.1 | 19.88 | 5.47 |
| July | 37.8 | 33.4 | 32.1 | 31.6 | 31.7 | 31.5 | 34.9 | 37.2 | 36.7 | 38.7 | 34.56 | 2.85 |
| Aug | 27.1 | 31 | 24.1 | 23.7 | 25.1 | 22.5 | 35.4 | 13.6 | 26.4 | 25.9 | 25.48 | 5.65 |
| Sept | 5.9 | 2.1 | 8.8 | 7.4 | 6.7 | 6.9 | 6.1 | 5 | 7.1 | 11.5 | 6.75 | 2.43 |
| SUM (%) | 100 | 100 | 100 | 100 | 100 | 100 | 100 | 100 | 100 | 100 |
© 2020 by the authors. Licensee MDPI, Basel, Switzerland. This article is an open access article distributed under the terms and conditions of the Creative Commons Attribution (CC BY) license (http://creativecommons.org/licenses/by/4.0/).
Share and Cite
MDPI and ACS Style
Skoulikaris, C.; Krestenitis, Y. Cloud Data Scraping for the Assessment of Outflows from Dammed Rivers in the EU. A Case Study in South Eastern Europe. Sustainability 2020, 12, 7926. https://0-doi-org.brum.beds.ac.uk/10.3390/su12197926
AMA Style
Skoulikaris C, Krestenitis Y. Cloud Data Scraping for the Assessment of Outflows from Dammed Rivers in the EU. A Case Study in South Eastern Europe. Sustainability. 2020; 12(19):7926. https://0-doi-org.brum.beds.ac.uk/10.3390/su12197926
Chicago/Turabian StyleSkoulikaris, Charalampos, and Yannis Krestenitis. 2020. "Cloud Data Scraping for the Assessment of Outflows from Dammed Rivers in the EU. A Case Study in South Eastern Europe" Sustainability 12, no. 19: 7926. https://0-doi-org.brum.beds.ac.uk/10.3390/su12197926
Note that from the first issue of 2016, this journal uses article numbers instead of page numbers. See further details here.