Effects of the Health Promotion Programs on Happiness


1
Department of Medical Device Management and Research, SAIHST, Sungkyunkwan University, Seoul 06355, Korea
2
Social Security Information Institute, Social Security Information Service, Seoul 04554, Korea
*
Author to whom correspondence should be addressed.
Sustainability 2020, 12(2), 528; https://0-doi-org.brum.beds.ac.uk/10.3390/su12020528
Submission received: 20 November 2019
/
Revised: 22 December 2019
/
Accepted: 7 January 2020
/
Published: 10 January 2020
(This article belongs to the Special Issue Sustainability of Public Policy and Health Economics)
Abstract
:The Healthy City program is a comprehensive health promotion program implemented by local governments to improve citizens’ health. The Healthy City program aims to improve citizens’ quality of life through health promotion activities in daily life. It also improves health by eliminating health risk factors and increasing citizens’ happiness. Therefore, this study investigated the effects of the Healthy City program on the happiness index of local residents and the correlation between the Healthy City program and the happiness index using quality of life as a parameter. We conducted a questionnaire survey of residents of Seoul, where Healthy City networks are actively promoted. A total of 392 responses were obtained. Structural equations were used to analyze the collected data. The Healthy City program had positive effects on the happiness index. In other words, it increased the happiness index by improving the health of the local residents. Relevant policy efforts are also being made to advance health services through Healthy City programs. For an effective Healthy City program, it is necessary to implement policies regarding health equity, to expand Healthy City programs based on a settings approach, and to implement a sustainable Healthy City program through the establishment of Healthy City governance.
1. Introduction
Since the mid-1970s, discussions on health promotion have diffused globally. At the “Healthy Toronto 2000” workshop, held in Canada in 1984, the “Healthy Community” model was established, pioneering the Healthy Cities movement. Consequentially, the respective movement began in Europe in 1986. The goal of Healthy Cities is to create a healthier urban environment for the members of the community by going beyond health approaches. The World Health Organization defines a Healthy City as a place where all members of the community mutually cooperate and continuously endeavor to improve the citizens’ health and quality of life by improving the physical and social environment. Currently, the Healthy City program is being promoted globally by the formation of a Healthy Cities network [1].
The Healthy City program is a local health movement based on the premise that living conditions, including physical, social, and economic conditions, may influence the health status of citizens. It intends to change the living environment into a health-friendly one by eliminating health risk factors. Since health and wellbeing are closely related to community activities, local government policies, citizens’ participation in government, and collaboration between the local government and the community enables citizens’ health promotion and a sustainable Healthy City program [2,3]. The local government is trying to enforce effective health policies by identifying various health determinants, in order to improve citizens’ health condition. A comprehensive health promotion program implemented from these viewpoints is the Healthy City program [4].
As health has been identified as an important factor to assess the quality of life, the quality of life related to health is being utilized as a notion to measure the degree of happiness in society. Citizens’ health promotion is closely related to the urban environment, which is directly connected to the improvement of the quality of life. Because an interaction between individual and community factors occurs in health-related life quality, in order to improve the life quality of the citizens, the will to improve is necessary at the community level as well as at the personal level [5]. To improve citizens’ health levels, local governments are providing governance to create Healthy Cities. As the action plan toward a Healthy City, the “plan to expand the living infrastructure to improve the quality of life” has been proposed, leading to the improvement of people’s health and living standards through the creation of living infrastructures, such as parks and green areas. As such, the importance of Healthy Cities, which aim to improve the quality of life of citizens through health promotion activities in daily life, is increasing [6].
The definition of happiness is very diverse, owing to its subjective and objective aspects. When considering happiness as a subjective feeling about one’s personal life, it may vary according to values, expected level of quality of life, and environment. In terms of objective standards, we may investigate national income, education level, and average life span, amongst others [7]. Positive changes in individuals’ health behaviors improve satisfaction of life and enable them to live happily [8]. Improving lifestyle through increased life expectancy and elimination of health risk factors enhances health and increases the happiness of citizens. Accordingly, since citizens’ health status is related to their happiness, the policies of the local government tend to concentrate on personal health promotion. Therefore, they are creating a better urban environment through the Healthy City program for health and happiness [9,10].
Recently, the proportion people who had “a feeling of happiness” in the local welfare level has been increasing, which leads to an improved quality of life. In addition, the measurement of life quality is used as an indicator for feelings of happiness, health, and so on, in the subjective dimension [11]. Therefore, quality of life and happiness are affected by health, and the Healthy City program seems to increase citizens’ feeling of happiness. In this study, we investigated the effect of the Healthy City program on citizens’ happiness and analyzed the structural relationship between the Healthy City program and happiness by using quality of life as a parameter. Moreover, we prepared basic data for improving the happiness index of local residents of Seoul, a city actively implementing the Healthy City program, by measuring health, quality of life, and happiness index.
2. Materials and Methods
2.1. Research Design
This study attempted to empirically analyze the structural causality between the Healthy City program and citizens’ happiness index through quality of life. To this end, the Healthy City program was used as an independent variable, and the happiness index was used as a dependent variable. Quality of life was selected as a parameter to mediate the Healthy City program and the happiness index.
2.2. Setting and Study Participants
The selection criteria for the subject area were as follows. First, the area was selected based on the regions that were registered as regular members of the Korea Healthy Cities Partnership (KHCP). In order to become a regular member of the KHCP, the relevant region must submit the status of departments and manpower for the creation of a Healthy City, the plans to promote the Healthy City program, and so forth. It can be considered, therefore, that being registered as a regular member of the KHCP means the foundation for the creation of a Healthy City has been established. Second, within these cities, we identified areas where the Healthy City network is actively working. Seoul is the first city to join the WHO’s curated list of Healthy Cities in Korea and has attracted attention because of its active promotion of the Healthy City program in Asia. It is also a city with many local governments that are currently conducting the Healthy City program. Currently, Seoul has 23 districts in which the Healthy City program has been implemented, including support for autonomous projects in autonomous districts, a project to create a healthy living space, and the creation of a base for a healthy ecosystem in the biotope. Third, we selected Gangdong-gu and Seocho-gu as the final research sites. These were selected based on the budget of the Healthy City project, operation of the website, and number of programs related to the Healthy City. Gangdong-gu holds a policy forum on the theme of urban design guidelines for the realization of a Healthy City and compares the health status of the residents with the health status of each resident to establish a sustainable Health City plan. In Seocho-gu, the Healthy City project is being implemented mainly in public health center counseling and smoking cessation interventions. Especially, in the case of the smoking cessation business, it is spreading to other local governments successfully. Based on such criteria, this study conducted a survey centered on Seoul (see Appendix A).
2.3. Research Instruments
2.3.1. The Healthy City Program
The Healthy City program intends to scientifically diagnose citizens’ health problems and systematically analyze the causes and factors of the problems in order to establish a city plan and implement a new health policy. In addition, since the Healthy City program is based in the community and is a citizen-led program, it must reflect the local reality and the citizens’ health level. Thus, in order to implement a systematic Healthy City program, the status and distribution of health resources in the region must be apprehended and reflected upon [12]. The planning and implementing processes of the Healthy City program are complicated; the more complicated the plan of the program is, the harder it is to evaluate. Furthermore, because the content of the program differs depending on the characteristics of each city and its development stage, it is not easy to evaluate the Healthy City program. In particular, it is difficult to grasp causal relationships in the Healthy City program. Since there are many factors that directly or indirectly affect city health, it is difficult to conclude that the cause of changes to citizens’ health could be one factor only (the Healthy City program). Although it may not be easy to verify a direct, causal relationship between health and the Healthy City program, systematic health promotion in the Healthy City program has strengthened the sustaining power for citizens’ health improvement [13].
The survey items of the Healthy City program were composed based on the monitoring, accountability, reporting, and impact assessment framework proposed [14]. With respect to the principles of the Healthy City program, this framework includes policy support, Healthy City-related organizations, health promotion programs and activities, participation in the community, partnerships, and environmental protection [15]. We also utilized the items used by Webster and Sanderson [16] and Duhl [1] to assess the effect of the Healthy City program (Table 1).
2.3.2. Happiness Index
Happiness is a feeling of sustainable wellbeing, but not momentary emotions or moods. Happiness is strongly subjective because it exists within an individuals’ experience and is an evaluation according to the individual’s thoughts about his or her life [17]. The theories and standards of happiness differ according to social and cultural characteristics that the individuals experience. Therefore, happiness may enable the successful maintenance of life in a good condition. Since the attributes of happiness are connected to the individual’s subjective and variable mental state, there are difficulties in implementing policies associated with citizens’ happiness. However, there are objective and universal attributes of happiness, as well as individual subjective and relative ones. In other words, common factors related to happiness could be extracted as quantifiable attributes [18].
Health and happiness have a mutual influence, and the presence of disease affects abstract emotions such as happiness. The goal of the Healthy City program is to promote the health of local residents; consequently, it is expected to bolster the happiness index of residents. Factors affecting happiness are roughly classified into income, personal attributes, social attributes, relationships with others, and political environment. Health is highly associated with psychological factors and social attributes. The survey items on the happiness index were composed based on the precedent studies that assessed whether the demographical and sociological factors, such as income level, marital status, education, and occupation, might influence happiness and health [19,20]. The measures of happiness index derived from previous studies included economic stability, family interaction, interpersonal relationships, and health; extensive validity tests were conducted. In addition, the scale utilized by Hervás and Vázquez [21], Kaczmarek, Bujacz, and Eid [22], and others was used to measure the relationship between individuals’ life satisfaction, psychological and social environments, and happiness (Table 1).
2.3.3. Quality of Life
Quality of life (QOL) is a relative concept that is altered according to the political, economic, and social environment of the society as well as the personal characteristics, living conditions, values, and customs of the members of society. As the relative feelings should be evaluated, which the members of society might feel on the environmental change in order to define the quality of life, most of them tend to have subjective characteristics [23]. Quality of life, related to health, means the subjective quality of life that may be directly or indirectly affected by an individual’s health status or physical or mental health recognition. It is mainly used to measure health care outcomes and health status.
Quality of life may be gratified according to personal ability, but the level may vary depending on the living environment provided by the government. Particularly, it is closely related to the administration of the local government, which is associated with the daily life of the residents. The ultimate goal of local administration lies in improving the quality of life of citizens, which should imply seeking a solution to enhance the quality of life for each individual. Accordingly, the Healthy City program is being actively implemented, which makes citizens fulfill all activities necessary for living by improving their health [24]. Therefore, the survey items regarding quality of life were composed based on the Activities of Daily Living, developed [25]. In addition, the Korean Activities of Daily Living was utilized, which has been developed by the Functional Status Assessment Research Group for the Aged in the Korean Geriatrics Society, tailoring Katz’s Activities of Daily Living measurement tools to the living environment in Korea. For the development of K-ADL questions, items were collected and categorized for patients with physical disabilities, such as patients at university hospitals, medium-sized hospitals, public health centers, and outpatient departments. Consequently, the validity and reliability of the questions were also verified [25,26]. Furthermore, we attempted to measure our own physical function, role activities, personal satisfaction with life, and health status by using EQ-5D, a measuring tool on the Health-Related Quality of Life scale [27] (Table 1).
2.3.4. Data Collection
In order to analyze the structural relationship between the Healthy City program and the happiness index centered on selected regions, a survey was conducted for residents living in the area where the Healthy City program was being implemented. The Healthy City program seeks to positively change peoples’ lifestyle by understanding the physical environment of the area and its impact on the health of the residents. To this end, a sustainable Healthy City is created by improving various environmental factors, such as the activation of local health institutions, park construction, support of walking and cycling facilities, public sports facilities, and atmospheric and noise environments. Thus, it is judged that the residents who live in the region in which the Healthy City program is enforced are likely to experience the Healthy City program in a living environment.
A face-to-face survey was carried out from 25 September to 10 October 2017 in areas implementing the Healthy City program. The participants of this study were residents who participated in the Healthy City program in Gangdong-gu and Seocho-gu, Seoul. In the case of Gangdong-gu, a 100-year-old health care counseling center was involved in this study, where a resident nurse was in charge of preventing and managing chronic diseases. It also encouraged the use of clubs to make health care a reality. We conducted surveys of residents visiting the residents’ centers and medical centers. In the case of Seocho-gu, Health City programs are implemented centering on public health centers. On Saturdays, health centers also operate to provide health care classes, smoking cessation clinics, and emergency situation education. Therefore, we visited a health center and conducted a survey with citizens who participated in the Health City program. Specific research methods were collected immediately after researchers and trained research assistants explained the purpose of the research and the questionnaire and distributed the self-administered questionnaire. In Gangdong-gu and Seocho-gu, of the 440 distributed questionnaires, 392 (89%) were collected and used for analysis, excluding 48 where participants refused to answer or had missing responses.
2.3.5. Data Collection
SPSS 25.0 (SPSS Inc., Chicago, IL, USA) and AMOS 18.0 (SPSS Inc., Chicago, IL, USA) programs were applied to the collected data; the statistical significance probability was set at 0.5. The specific analysis method was as follows.
First, frequency analysis was carried out to grasp the demographic characteristics of the subjects. Second, a factor analysis was conducted to verify the effectiveness of the Healthy City program, quality of life, and happiness index, through which the reliability was verified. Third, t-tests were performed to confirm the effect difference for the Healthy City program according to demographic characteristics. Fourth, the analysis was conducted through the AMOS program by using structural equation modeling in order to analyze the structural influencing relationship of Healthy City program on the happiness index of the citizens.
3. Results
3.1. Demographics
The demographic characteristics of the subjects were as follows. Half of Korea’s population lives in the metropolitan area. Specifically, Gangdong-gu and Seocho-gu, which were the subjects of this study, are integrating health with all relevant policies, such as that of environments, roads, and architectures, to secure a sustainable Health City program. In addition, since the Healthy City program is being implemented around community service centers, the local residents who are actively participating in the program present a representative sample. The total number of subjects was 392: 200 males and 192 females. The average age was 41.4, and the educational background appeared in the order of high school (168 people, 42.9%) and university or higher (128 people, 32.6%). Income levels varied widely, where less than 2–3 million won (94 people, 24.0%) accounted for the most common level. In addition, occupations were in the order of teachers and professionals (76 people, 19.4%), students (72 people, 18.4%), and service workers (66 people, 16.8%) (Table 2).
3.2. Reliability and Study Model Verification
Cronbach’s α was utilized to verify the reliability and validity of each variable in this study. Generally, it is considered to be reliable if alpha has a value of 0.6 or more. Table 3 shows the number of items for each variable and the corresponding reliability results. The Healthy City program, an independent variable, consisted of six questions. The dependent variables, quality of life and individual happiness index, were composed of six and nine questions, respectively. The Cronbach’s α value of each variable appeared to be more than 0.6, all of which satisfied the standard values.
The validity of this study was verified through a confirmatory factor analysis. As a result of the analysis, all six questions measuring the Healthy City program exceeded 0.5, the standard value of standard factor load. On the other hand, the standard factor loads of one question in the quality of life (six questions) and four questions in the happiness index (nine questions) did not exceed the standard value of 0.5. Therefore, the remaining questions, except for the items that did not exceed the standard value, were applied to the analysis. In order to test the discriminant validity, we confirmed whether the average variance extracted on each variable was larger than the square of the correlation coefficient between variables. As a result, it was found that the average variance extracted value of each variable appeared greater than the square number of the correlation coefficient between variables, through which we could confirm that there was discriminant validity.
3.3. Analysis of Average Difference
In order to analyze the effect differences of the Healthy City program depending on the demographic characteristics of the subjects, independent sample t-tests were conducted, and the results are shown in Table 4. The Healthy City program was found to have statistically significant differences according to educational background (t = 1.680, p < 0.1) and income (t = −2.609, p < 0.05). The effect of the Healthy City program was higher among those whose highest education level was high school graduation (3.10), rather than college or university graduation (2.93). Therefore, we could say that the lower the education background, the higher the performance of the Healthy City program. In addition, the effect of the Healthy City program also appeared relatively higher among those whose income was more than 3 million won (3.14), compared to those who earned 3 million won or less (2.88). Thus, it could be seen that the higher the income, the higher the performance of the Healthy City program.
3.4. Structural Equation Modeling Verification
As a result of analyzing the model used in this study, it showed χ2 = 171.889, DF = 100, p < 0.001, goodness-of-fit index (GFI) = 0.90, Tucker–Lewis index (TLI) = 0.94, comparative fit index (CFI) = 0.95, root-mean-square residual (RMR) = 0.06, and RMSEA = 0.06. The index values were found to be the general satisfaction level in the goodness of fit. The goodness of fits and path coefficients for the research model are as follows (Table 5).
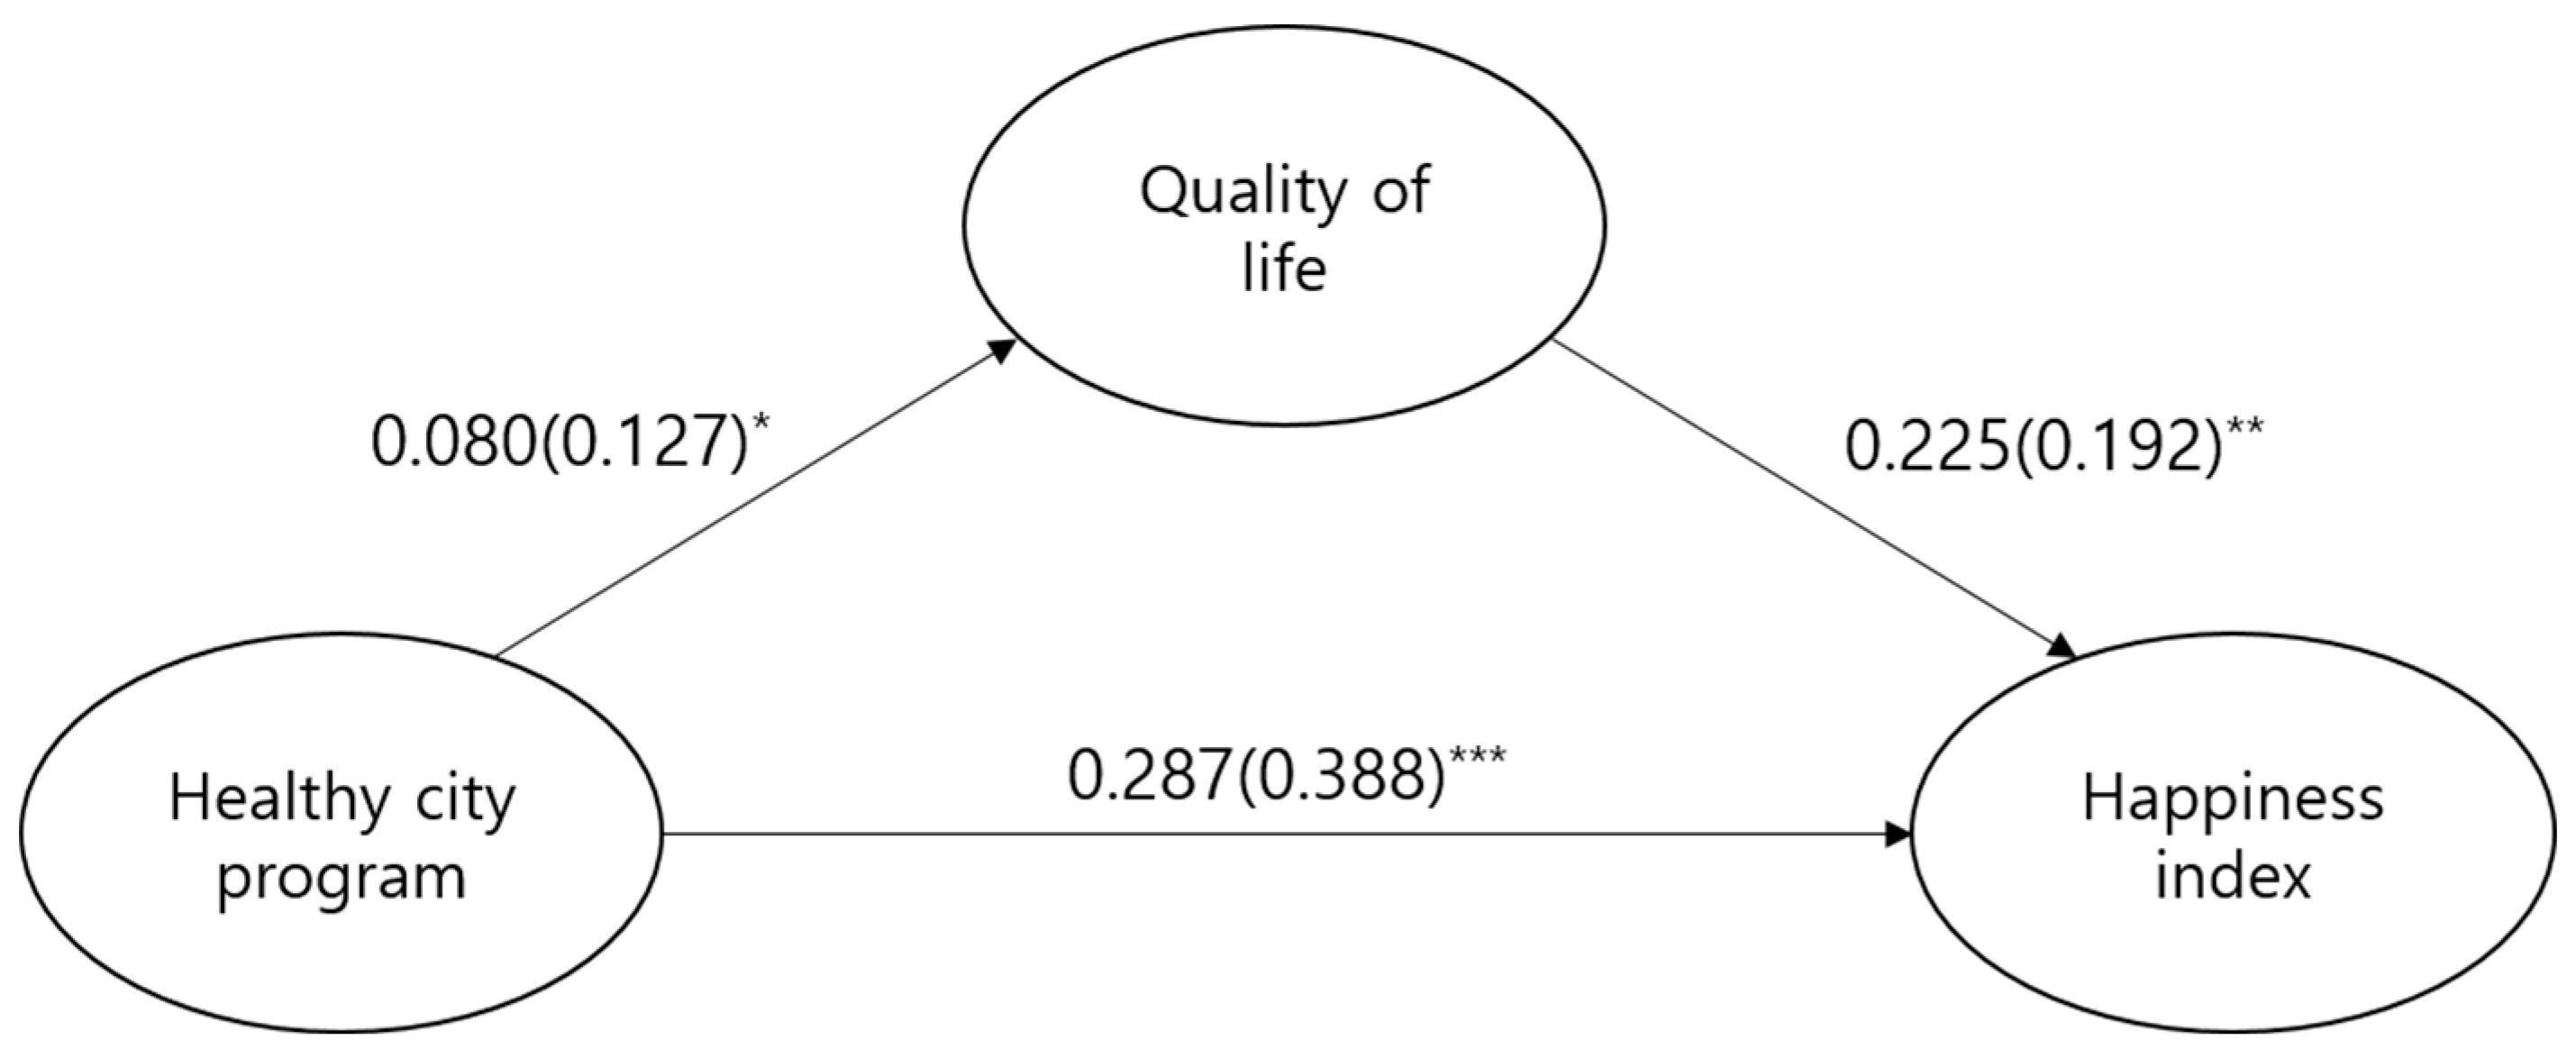
When investigating the coefficients of each path for the research model, the direct path of the Healthy City program had a significant statistical effect on the happiness index (β = 0.388, C.R. = 5.022, p < 0.001). In addition, the direct path from the Healthy City program to the quality of life (β = 0.127, C.R. = 1.562, p < 0.1) also had a significant statistical effect. The direct path from the quality of life to the happiness index (β = 0.192, C.R. = 2.461, p < 0.05) also had a significant statistical effect. Therefore, it can be seen that the Healthy City program had a positive effect on the happiness index of citizens (Table 6, Figure 1).
The bootstrapping method was utilized to verify the significance of the indirect effect. As a result, the mediating effect of the quality of life on the relationship between the Healthy City program and the happiness index was not statistically significant (B = 0.018, p = 0.177). Accordingly, it appeared that there was no mediating effect of the quality of life (Table 7).
4. Discussion
This study attempted to verify the structural influencing relationship of the Healthy City program on the citizens’ happiness index and the mediating effect of the quality of life on the relationships between them. First, we compared the effects of the Healthy City program according to demographic characteristics. The results showed significant differences in educational background and income. The lower the education background and the higher the income, the higher the effect of the Healthy City program appeared. These results differ from those of existing precedent studies, which found that the lower the socioeconomic status (education, income, occupational status, etc.), the higher the mortality and the prevalence rate of various illnesses including the chronic disease. A high education background is related to economic advantages; resulting in a higher health level because of better access to medical services due to better working conditions, income, and so forth. In addition, personal education level influences the ability to choose health behaviors and to solve problems, affecting participation in health promotion activities [28,29,30]. Since the resources for health promotion and health risk factors are not evenly distributed, they expect all citizens to be affected by the physical and social environments with the same conditions and to maintain a high healthy level, by institutional support through the Healthy City program [31]. However, the results of this study showed that the effects of the Healthy City program differed according to education background and income, which seems to suggest that health equity has not been achieved through the Healthy City program. The goal of the Healthy City program is to reduce the gap in the health level of citizens, and the fact that the effect of the Healthy City program differed according to educational background and income seems to show that the Healthy City program is not being implemented in a way that improves the health level of all citizens.
Next, structural equations were used to analyze the structural influencing relationships of the Healthy City program, quality of life, and happiness index, and the key focuses of the research results were as follows. First, the Healthy City program has been shown to increase citizens’ happiness index. This corresponds to the result of an existing study that found health promotion programs, such as sports activities, smoking-cessation classes, and so forth, may improve the health of residents and enhance subjective happiness [32]. Another study result found that the quality of social services provided by communities, such as parks, accessibility to public transportation, and health care services, may improve citizens’ health, and that health is closely related to happiness [33]. In other words, the Healthy City program seems to increase the happiness index through the health improvement of local residents. Therefore, through the Healthy City program, the accessibility of public transportation facilities, provision of various leisure facilities, expansion of bicycle and pedestrian paths, abundant green areas or parks, and so forth, may support individual physical activities and improve citizens’ health. Furthermore, the implementation of the Healthy City program will increase the number of facilities that citizens can use to exercise regularly, and it will stimulate citizens’ health promotion activities by providing health check-up services and health promotion programs provided by local governments.
Second, the Healthy City program had a statistically significant effect on the quality of life of citizens. This corresponds to a precedent study result that found when individuals are physically healthy and the welfare level provided by the community is high, their anxiety may decrease; thus, their quality of life appears higher [34]. The goal of the Healthy City program is to improve the quality of life and health of citizens by strengthening social, economic, and environmental health. This seems to imply that citizens’ health is determined not only by the accessibility of healthcare services, but also by the quality of life and the physical and socioeconomic environments. Therefore, the Healthy City program is improving the quality of life by addressing health-related problems by each health setting (school, workplace, residence, traditional market, etc.) and building a healthy environment.
Third, as a result of examining the mediating effect of the quality of life with respect to the causal relationship between the Healthy City program and happiness index, the Healthy City program did not affect happiness by mediating the quality of life. The reason for this result is due to frequent leadership changes and that the Healthy City program in Korea is limited to the single task of health promotion projects. The improvement of the quality of life for citizens through the Healthy City program may appear when resources are effectively used in an integrated way and is made sustainable. In addition, improved quality of life, coming from the sustainable development in the community, will increase the happiness index. Urban levels, including cleanliness, transportation accessibility, eco-friendly spaces, health, and crime rates in residential areas, affect the quality of life and happiness index, which want to achieve environmental improvement through the Healthy City program [35]. The European Healthy City program is improving the city environment by linking health with sustainable urban development and emphasizing the importance of locally centered activities and the role of local governments. On the other hand, because the Healthy City program in Korea is being promoted in a single project type, such as the improvement of individual health behaviors like health diet and smoking cessation or the creation of health village environment, it seems that there is a limitation in conducting sustainable policies for the Healthy City [36].
5. Conclusions
It is determined that the following efforts will be required for the Healthy City program to have positive effects.
First, health equity should be achieved through Healthy City programs based on socioeconomic characteristics. In order to be a Healthy City, it is not enough to simply create a pleasurable environment or a nature-friendly environment. After considering the various factors constituting citizens’ lives, an environment that could be actually helpful must be created. An individual’s health is determined by various factors, such as socioeconomic factors, cultural factors, environmental factors, educational background, community network, lifestyle, medical services, and genetic factors. As the gap in the health system appears to correlate with socioeconomic factors, health equity issues stem in the aftermath. Therefore, municipalities should implement the Healthy City program by linking health with policies in various sectors in order to improve health equity. Furthermore, a health profile should be systemized for cities to establish effective health policies. The health profile may provide information on the citizens’ health levels and health determinants by eliciting various health-oriented data from the region. Based on such evidence, they must understand the health determinants in the community and implement the Healthy City program effectively. It seems that Healthy City programs aimed at improving the health level of vulnerable groups are likely to improve health equity by directly addressing inequality. These Healthy City programs include improvements for the living conditions of the urban poor and health promotion education to reduce health inequality [37,38].
Second, the quality of life of citizens must be improved by expanding the Healthy City program based on living ground. Because quality of life is a subjective evaluation that citizens feel in a living environment, it is closely related to the level in daily life. Health is regained by citizens wherever they are residing, learning, and working. Hence, the living space centered Healthy City program, which changes the environments where citizens are living their daily lives (cities, villages, homes, schools, restaurants, hospitals, etc.) into a health-friendly place will improve citizens’ health and quality of life [39]. The living ground is a place where citizens can participate in the Healthy City program and where the community resources are invested. For large cities, living ground-based Healthy City programs are centered on schools and apartments; in the case of rural areas, they are centered on villages and senior citizen centers. Moreover, the living ground-based Healthy City program is being implemented through health promotion in schools, workplaces, and hospitals. However, living ground-based Healthy City programs are not operationalized effectively due to a lack of policies, systems, and strategies in the local community, and a lack of understanding about the living ground. In order to ensure the success of the Healthy City program, it is imperative that citizens are determined toward promoting health. Hence, in order to expand the living ground-based Healthy City program, citizen-centered participation in the community should be activated, and partnerships between the health sector and local governments should be created.
Third, the citizens’ happiness must be improved through a sustainable Healthy City program. The increased sustainability of a healthy environment may enhance the levels of happiness among the members of the community. Healthy City is a comprehensive health promotion program that improves the health of cities by eliminating health risk factors. However, it is not appropriate to include all health promotion programs within the framework of the Healthy City program. The scope of health promotion programs varies according to countries and cities. In the case of Korea, the Healthy City program exists within the health promotion program. On the other hand, European countries include their health promotion programs in the Healthy City program. Thus, in the process of approaching the physical and social environment of the community, the related health promotion program must be meticulously implemented through integration within the Healthy City program. Similarly, the health-related program should be linked with the Healthy City program, redundant projects should be integrated, and the sustainability of the Healthy City program must be secured by consistently promoting related projects. Additionally, for the Healthy City program to be sustainable, support from the local government is necessary to strengthen the program’s capabilities. It seems that an organic cooperation system is also needed between divisions. Since the factors affecting health are complicated, cooperation with other sectors is essential in order to implement the Healthy City program. Accordingly, a sustainable Healthy City program can only be implemented once intersectional cooperation is expanded and community participation is established through Healthy City governance.
Because the survey area was limited, it was not possible to analyze the influencing relationship of the Healthy City program according to region. Thus, in future studies, it is necessary to separate subjects into the influence of the Healthy City program according to the region, and the types of participation in the Healthy City program, before analyzing them. Currently, the Health City project is spreading globally, and the regions in which it is the most active are Europe and Asia. Therefore, studies in the future also need to compare the results with those in European countries, such as Denmark and the UK, and Asian countries, such as Australia and Japan. The scope and expansion of the Health City project can be determined for Korea by comparing its performance with that in other countries.
Author Contributions
Conceptualization, K.Y.; Methodology, M.L. and K.Y.; Project administration, M.L.; Software, K.Y.; Supervision, K.Y.; Writing—Original draft, M.L.; Writing—Review & editing, M.L. All authors have read and agreed to the published version of the manuscript.
Funding
This work was supported by the Ministry of Education of the Republic of Korea and the National Research Foundation of Korea (NRF-2019S1A5A2A03040304).
Conflicts of Interest
The authors declare no conflicts of interest.
Appendix A
Questionnaire

Table A1.
Outcome of the Healthy City program.
| Item | Strongly Disagree | Disagree | Undecided | Agree | Strongly Agree |
|---|---|---|---|---|---|
| Healthy City program created an environment for healthy living | ① | ② | ③ | ④ | ⑤ |
| Eco-friendly cars have increased due to the Healthy City program | ① | ② | ③ | ④ | ⑤ |
| There are many facilities and programs related to healthy cities | ① | ② | ③ | ④ | ⑤ |
| Local governments are interested in the health care of local residents | ① | ② | ③ | ④ | ⑤ |
| Local governments provide many health-related services | ① | ② | ③ | ④ | ⑤ |
| The number of programs related to healthy cities provided by local governments has increased | ① | ② | ③ | ④ | ⑤ |
Table A2.
Happiness Index.
| Item | Strongly Disagree | Disagree | Undecided | Agree | Strongly Agree |
|---|---|---|---|---|---|
| Psychological stability has increased due to the Healthy City program | ① | ② | ③ | ④ | ⑤ |
| I live with my spouse or family | ① | ② | ③ | ④ | ⑤ |
| I have a good personal relationship | ① | ② | ③ | ④ | ⑤ |
| I tend to adjust to my community | ① | ② | ③ | ④ | ⑤ |
| I am happy every day | ① | ② | ③ | ④ | ⑤ |
| I am economically stable | ① | ② | ③ | ④ | ⑤ |
| I have a job, and I am satisfied with my job | ① | ② | ③ | ④ | ⑤ |
| My health is on the good side | ① | ② | ③ | ④ | ⑤ |
| My residence is on the good side | ① | ② | ③ | ④ | ⑤ |
Table A3.
Quality of Life.
| Item | Strongly Disagree | Disagree | Undecided | Agree | Strongly Agree |
|---|---|---|---|---|---|
| I am satisfied with the overall quality of life in our area. | ① | ② | ③ | ④ | ⑤ |
| * It is hard to walk long | ① | ② | ③ | ④ | ⑤ |
| * I have a hard time doing physical work. | ① | ② | ③ | ④ | ⑤ |
| * I need someone’s help when getting dressed or washed | ① | ② | ③ | ④ | ⑤ |
| * I am short of breath sometimes | ① | ② | ③ | ④ | ⑤ |
| * I sometimes feel pain in my body | ① | ② | ③ | ④ | ⑤ |
| * I have vomited because of feeling sick in the stomach | ① | ② | ③ | ④ | ⑤ |
* Reverse Coding.
References
- Duhl, L.J. The healthy city: Its function and its future. Health Promot. Int. 1986, 1, 55–60. [Google Scholar] [CrossRef]
- Goldstein, G. Healthy cities: Overview of a WHO international program. Rev. Environ. Health 2000, 15, 207–214. [Google Scholar] [CrossRef] [PubMed]
- Lee, M.; Yoon, K. A Study on the Research Trend of Healthy City Project in Korea Using Social Network Analysis. Health Soc. Welf. Rev. 2018, 38, 459–488. [Google Scholar]
- Takano, T.; Nakamura, K. An analysis of health levels and various indicators of urban environments for Healthy Cities projects. J. Epidemiol. Community Health 2001, 55, 263–270. [Google Scholar] [CrossRef] [PubMed] [Green Version]
- Islam, M.K.; Merlo, J.; Kawachi, I.; Lindström, M.; Burström, K.; Gerdtham, U.-G. Does it really matter where you live? A panel data multilevel analysis of Swedish municipality-level social capital on individual health-related quality of life. Health Econ. Policy Law 2006, 1, 209–235. [Google Scholar] [CrossRef]
- Frumkin, H. Healthy places: Exploring the evidence. Am. J. Public Health 2003, 93, 1451–1456. [Google Scholar] [CrossRef]
- Cummins, R.A.; Eckersley, R.; Pallant, J.; Van Vugt, J.; Misajon, R. Developing a national index of subjective wellbeing: The Australian Unity Wellbeing Index. Soc. Indic. Res. 2003, 64, 159–190. [Google Scholar] [CrossRef]
- Steverink, N.; Westerhof, G.J.; Bode, C.; Dittmann-Kohli, F. The personal experience of aging, individual resources, and subjective well-being. J. Gerontol. Ser. B Psychol. Sci. Soc. Sci. 2001, 56, P364–P373. [Google Scholar] [CrossRef] [Green Version]
- Bjørnskov, C. Healthy and happy in Europe? On the association between happiness and life expectancy over time. Soc. Sci. Med. 2008, 66, 1750–1759. [Google Scholar] [CrossRef]
- Lee, M.; Park, S.; Yoon, K. Does Health Promotion Program Affect Local Resident’ Emotions? Int. J. Environ. Res. Public Health 2019, 16, 549. [Google Scholar] [CrossRef] [Green Version]
- Diener, E. Guidelines for national indicators of subjective well-being and ill-being. Appl. Res. Qual. Life 2006, 1, 151–157. [Google Scholar] [CrossRef]
- Heritage, Z.; Dooris, M. Community participation and empowerment in Healthy Cities. Health Promot. Int. 2009, 24, i45–i55. [Google Scholar] [CrossRef] [PubMed]
- Baum, F.; Jolley, G.; Hicks, R.; Saint, K.; Parker, S. What makes for sustainable Healthy Cities initiatives?—A review of the evidence from Noarlunga, Australia after 18 years. Health Promot. Int. 2006, 21, 259–265. [Google Scholar] [CrossRef] [PubMed] [Green Version]
- De Leeuw, E. MARI, Monitoring, Accountability, Reporting, Impact assessment. In Proceedings of the A Framework for Networks of Healthy Cities, presented to the WHO Network of European National Healthy Cities Networks Business Meeting, Turko, Finland, 18–21 October 2006. [Google Scholar]
- Kang, E.; Park, H.J.; Kim, J.E. Health impact assessment as a strategy for intersectoral collaboration. J. Prev. Med. Public Health 2011, 44, 201. [Google Scholar] [CrossRef] [PubMed]
- Webster, P.; Sanderson, D. Healthy cities indicators—A suitable instrument to measure health? J. Urban Health 2013, 90, 52–61. [Google Scholar] [CrossRef] [Green Version]
- McDowell, I. Measuring Health: A Guide to Rating Scales and Questionnaires; Oxford University Press: New York, NY, USA, 2006. [Google Scholar]
- Cloninger, C.R. What makes people healthy, happy, and fulfilled in the face of current world challenges? Mens Sana Monogr. 2013, 11, 16. [Google Scholar] [CrossRef]
- Johansson, S. The level of living survey: A presentation. Acta Sociol. 1973, 16, 211–219. [Google Scholar] [CrossRef]
- Dolan, P.; Peasgood, T.; White, M. Do we really know what makes us happy? A review of the economic literature on the factors associated with subjective well-being. J. Econ. Psychol. 2008, 29, 94–122. [Google Scholar] [CrossRef]
- Hervás, G.; Vázquez, C. Construction and validation of a measure of integrative well-being in seven languages: The Pemberton Happiness Index. Health Qual. Life Outcomes 2013, 11, 66. [Google Scholar] [CrossRef] [Green Version]
- Kaczmarek, L.D.; Bujacz, A.; Eid, M. Comparative latent state–trait analysis of satisfaction with life measures: The Steen Happiness Index and the Satisfaction with Life Scale. J. Happiness Stud. 2015, 16, 443–453. [Google Scholar] [CrossRef] [Green Version]
- Diener, E.; Scollon, C.N.; Lucas, R.E. The evolving concept of subjective well-being: The multifaceted nature of happiness. In Assessing Well-Being; Springer: Berlin/Heidelberg, Germany, 2009; pp. 67–100. [Google Scholar]
- Maggino, F.; Zumbo, B.D. Measuring the quality of life and the construction of social indicators. In Handbook of Social Indicators and Quality of Life Research; Springer: Berlin/Heidelberg, Germany, 2012; pp. 201–238. [Google Scholar]
- Katz, S.; Downs, T.D.; Cash, H.R.; Grotz, R.C. Progress in development of the index of ADL. Gerontol. 1970, 10, 20–30. [Google Scholar] [CrossRef] [PubMed]
- Kim, I.H. Age and gender differences in the relation of chronic diseases to activity of daily living (ADL) disability for elderly South Koreans: Based on representative data. J. Prev. Med. Public Health 2011, 44, 32–40. [Google Scholar] [CrossRef] [PubMed]
- Herdman, M.; Fox-Rushby, J.; Badia, X. A model of equivalence in the cultural adaptation of HRQoL instruments: The universalist approach. Qual. Life Res. 1998, 7, 323–335. [Google Scholar] [CrossRef] [PubMed]
- Petrovic, D.; de Mestral, C.; Bochud, M.; Bartley, M.; Kivimäki, M.; Vineis, P.; Mackenbach, J.; Stringhini, S. The contribution of health behaviors to socioeconomic inequalities in health: A systematic. Prev. Med. 2018, 113, 15–31. [Google Scholar] [CrossRef] [Green Version]
- Balia, S.; Jones, A.M. Mortality, lifestyle and socio-economic status. J. Health Econ. 2008, 27, 1–26. [Google Scholar] [CrossRef] [Green Version]
- Zajacova, A.; Hummer, R.A.; Rogers, R.G. Education and health among US working-age adults: A detailed portrait across the full educational attainment spectrum. Biodemography Soc. Biol. 2012, 58, 40–61. [Google Scholar] [CrossRef] [PubMed]
- Corburn, J. Toward the Healthy City: People, Places, and the Politics of Urban Planning; Guilford Press: New York, NY, USA, 2009. [Google Scholar]
- Veenhoven, R. Healthy happiness: Effects of happiness on physical health and the consequences for preventive health care. J. Happiness Stud. 2008, 9, 449–469. [Google Scholar] [CrossRef] [Green Version]
- Hogan, M.J.; Leyden, K.M.; Conway, R.; Goldberg, A.; Walsh, D.; McKenna-Plumley, P.E. Happiness and health across the lifespan in five major cities: The impact of place and government performance. Soc. Sci. Med. 2016, 162, 168–176. [Google Scholar] [CrossRef]
- Bradley, C. Importance of differentiating health status from quality of life. Lancet 2001, 357, 7–8. [Google Scholar] [CrossRef]
- Cloutier, S.; Larson, L.; Jambeck, J. Are sustainable cities “happy” cities? Associations between sustainable development and human well-being in urban areas of the United States. Environ. Dev. Sustain. 2014, 16, 633–647. [Google Scholar] [CrossRef]
- Norris, T.; Pittman, M. The healthy communities movement and the coalition for healthier cities and communities. Public Health Rep. 2000, 115, 118. [Google Scholar] [CrossRef] [PubMed]
- Ritsatakis, A. Equity and social determinants of health at a city level. Health Promot. Int. 2009, 24, i81–i90. [Google Scholar] [CrossRef] [PubMed] [Green Version]
- Mittelmark, M.B. Promoting social responsibility for health: Health impact assessment and healthy public policy at the community level. Health Promot. Int. 2001, 16, 269–274. [Google Scholar] [CrossRef] [PubMed] [Green Version]
- Dooris, M. Healthy settings: Challenges to generating evidence of effectiveness. Health Promot. Int. 2006, 21, 55–65. [Google Scholar] [CrossRef] [PubMed]
Figure 1.
Research model path coefficients. * p < 0.1, ** p < 0.05, *** p < 0.001.

Table 1.
Composition of the survey.
| Dimension | Variable | Item | Reference |
|---|---|---|---|
| Independent variable | Healthy City program | Development of health-promoting environment | [12,13,15,27,28,29] |
| Increase in number of eco-friendly vehicles | |||
| Extent of Healthy City facilities and projects | |||
| Municipality’s interest in health | |||
| Health-related municipal services | |||
| Increase in Healthy City-related programs | |||
| Dependent variables | Happiness index | Increase in psychological stability | [18,19,20,21,30] |
| Residence with a partner or family | |||
| Good interpersonal relations | |||
| Adaptation to local society | |||
| Joy and happiness in daily life | |||
| Financial stability | |||
| Job satisfaction | |||
| Health status | |||
| Residence status | |||
| Parameter | Quality of life | Difficulty walking a long distance | [24,26,31,32] |
| Difficulty with using force | |||
| Needing help with daily life | |||
| Difficulty breathing | |||
| Feeling pain in the body | |||
| Vomiting |
Table 2.
Participants’ demographic characteristics (n = 392).
| Characteristic | Type | Total (SD) | |
|---|---|---|---|
| N | % | ||
| Gender | Male | 200 | 51.0 |
| Female | 192 | 49.0 | |
| Age | Mean age | 41.4 (7.374) | |
| Education | No formal | 2 | 0.5 |
| Elementary school | 6 | 1.5 | |
| Middle school | 16 | 4.1 | |
| High school | 168 | 42.9 | |
| Junior college | 72 | 18.4 | |
| University or above | 128 | 32.6 | |
| Income level | Under 1 million won | 32 | 8.2 |
| 1–2 million won | 64 | 16.3 | |
| 2–3 million won | 98 | 24.0 | |
| 3–4 million won | 58 | 14.8 | |
| 4–5 million won | 70 | 17.9 | |
| 5 million won and over | 74 | 18.9 | |
| Occupation | Agriculture, Stock | 2 | 0.5 |
| breeding | 60 | 15.3 | |
| Self-employed | 8 | 2.0 | |
| Teacher, Professional | 76 | 19.4 | |
| Homemaker | 12 | 3.1 | |
| Civil servant | 40 | 10.2 | |
| Student | 72 | 18.4 | |
| Service | 66 | 16.8 | |
| Manufacturing | 4 | 1.0 | |
| Unemployed | 14 | 3.6 | |
| Other | 38 | 9.7 | |
Table 3.
Reliability verification.
| Variable | Items | Construct Reliability (Cronbach’s α) |
|---|---|---|
| Healthy City program | 6 | 0.857 |
| Quality of life | 6 | 0.763 |
| Happiness index | 9 | 0.796 |
Table 4.
Difference in Healthy City Program by Demographic Characteristics.
| Factor | Healthy City Program | |||
|---|---|---|---|---|
| N | M | SD | ||
| Gender | Male | 200 | 3.05 | 0.741 |
| Female | 192 | 2.97 | 0.661 | |
| t (p) | 0.826 (0.410) | |||
| Age | ≥ 41.4 | 202 | 3.02 | 0.765 |
| < 41.4 | 190 | 3.00 | 0.633 | |
| t (p) | 0.146 (0.884) | |||
| Education | ≥ High school | 199 | 3.10 | 0.702 |
| < High school | 193 | 2.93 | 0.707 | |
| t (p) | 1.680 (0.095) * | |||
| Income level | ≥ 300 | 190 | 2.88 | 0.769 |
| < 300 | 202 | 3.14 | 0.610 | |
| t (p) | −2.609 (0.010) ** | |||
Notes: * p < 0.1, ** p < 0.05.
Table 5.
Research model verification.
| χ2 | DF | p-Value | GFI | TLI | CFI | RMR | |
|---|---|---|---|---|---|---|---|
| Research model | 171.889 | 100 | 0.001 | 0.90 | 0.94 | 0.95 | 0.06 |
Notes: χ2 = chi-square statistic, DF = degrees of freedom, GFI = goodness-of-fit index, TLI = Tucker–Lewis index, CFI = comparative fit index, and RMR = root-mean-square residual.
Table 6.
Research model path coefficients.
| Path | B | β | S.E. | C.R. |
|---|---|---|---|---|
| Healthy City Program → QOL | 0.080 | 0.127 | 0.051 | 1.562 * |
| QOL → Happiness | 0.225 | 0.192 | 0.092 | 2.461 ** |
| Healthy City Program → Happiness | 0.287 | 0.388 | 0.057 | 5.022 *** |
| Healthy City Program → QOL → Happiness | 0.018 | 0.177 | 0.084 |
Notes: * p < 0.1, ** p < 0.05, *** p < 0.001, B = unstandardized coefficients, β = standardized coefficients, S.E. = Standard error, C.R. = Critical ratio.
Table 7.
Verification of the indirect effect.
| Path | B | P |
|---|---|---|
| Healthy City program → QOL → Happiness | 0.018 | 0.177 |
© 2020 by the authors. Licensee MDPI, Basel, Switzerland. This article is an open access article distributed under the terms and conditions of the Creative Commons Attribution (CC BY) license (http://creativecommons.org/licenses/by/4.0/).
Share and Cite
MDPI and ACS Style
Lee, M.; Yoon, K. Effects of the Health Promotion Programs on Happiness. Sustainability 2020, 12, 528. https://0-doi-org.brum.beds.ac.uk/10.3390/su12020528
AMA Style
Lee M, Yoon K. Effects of the Health Promotion Programs on Happiness. Sustainability. 2020; 12(2):528. https://0-doi-org.brum.beds.ac.uk/10.3390/su12020528
Chicago/Turabian StyleLee, Munjae, and Kichan Yoon. 2020. "Effects of the Health Promotion Programs on Happiness" Sustainability 12, no. 2: 528. https://0-doi-org.brum.beds.ac.uk/10.3390/su12020528
Note that from the first issue of 2016, this journal uses article numbers instead of page numbers. See further details here.