Mechanical and Processing Properties of Rice Grains

 , , ,
, , ,
Abstract
:
1. Introduction
2. Materials and Methods
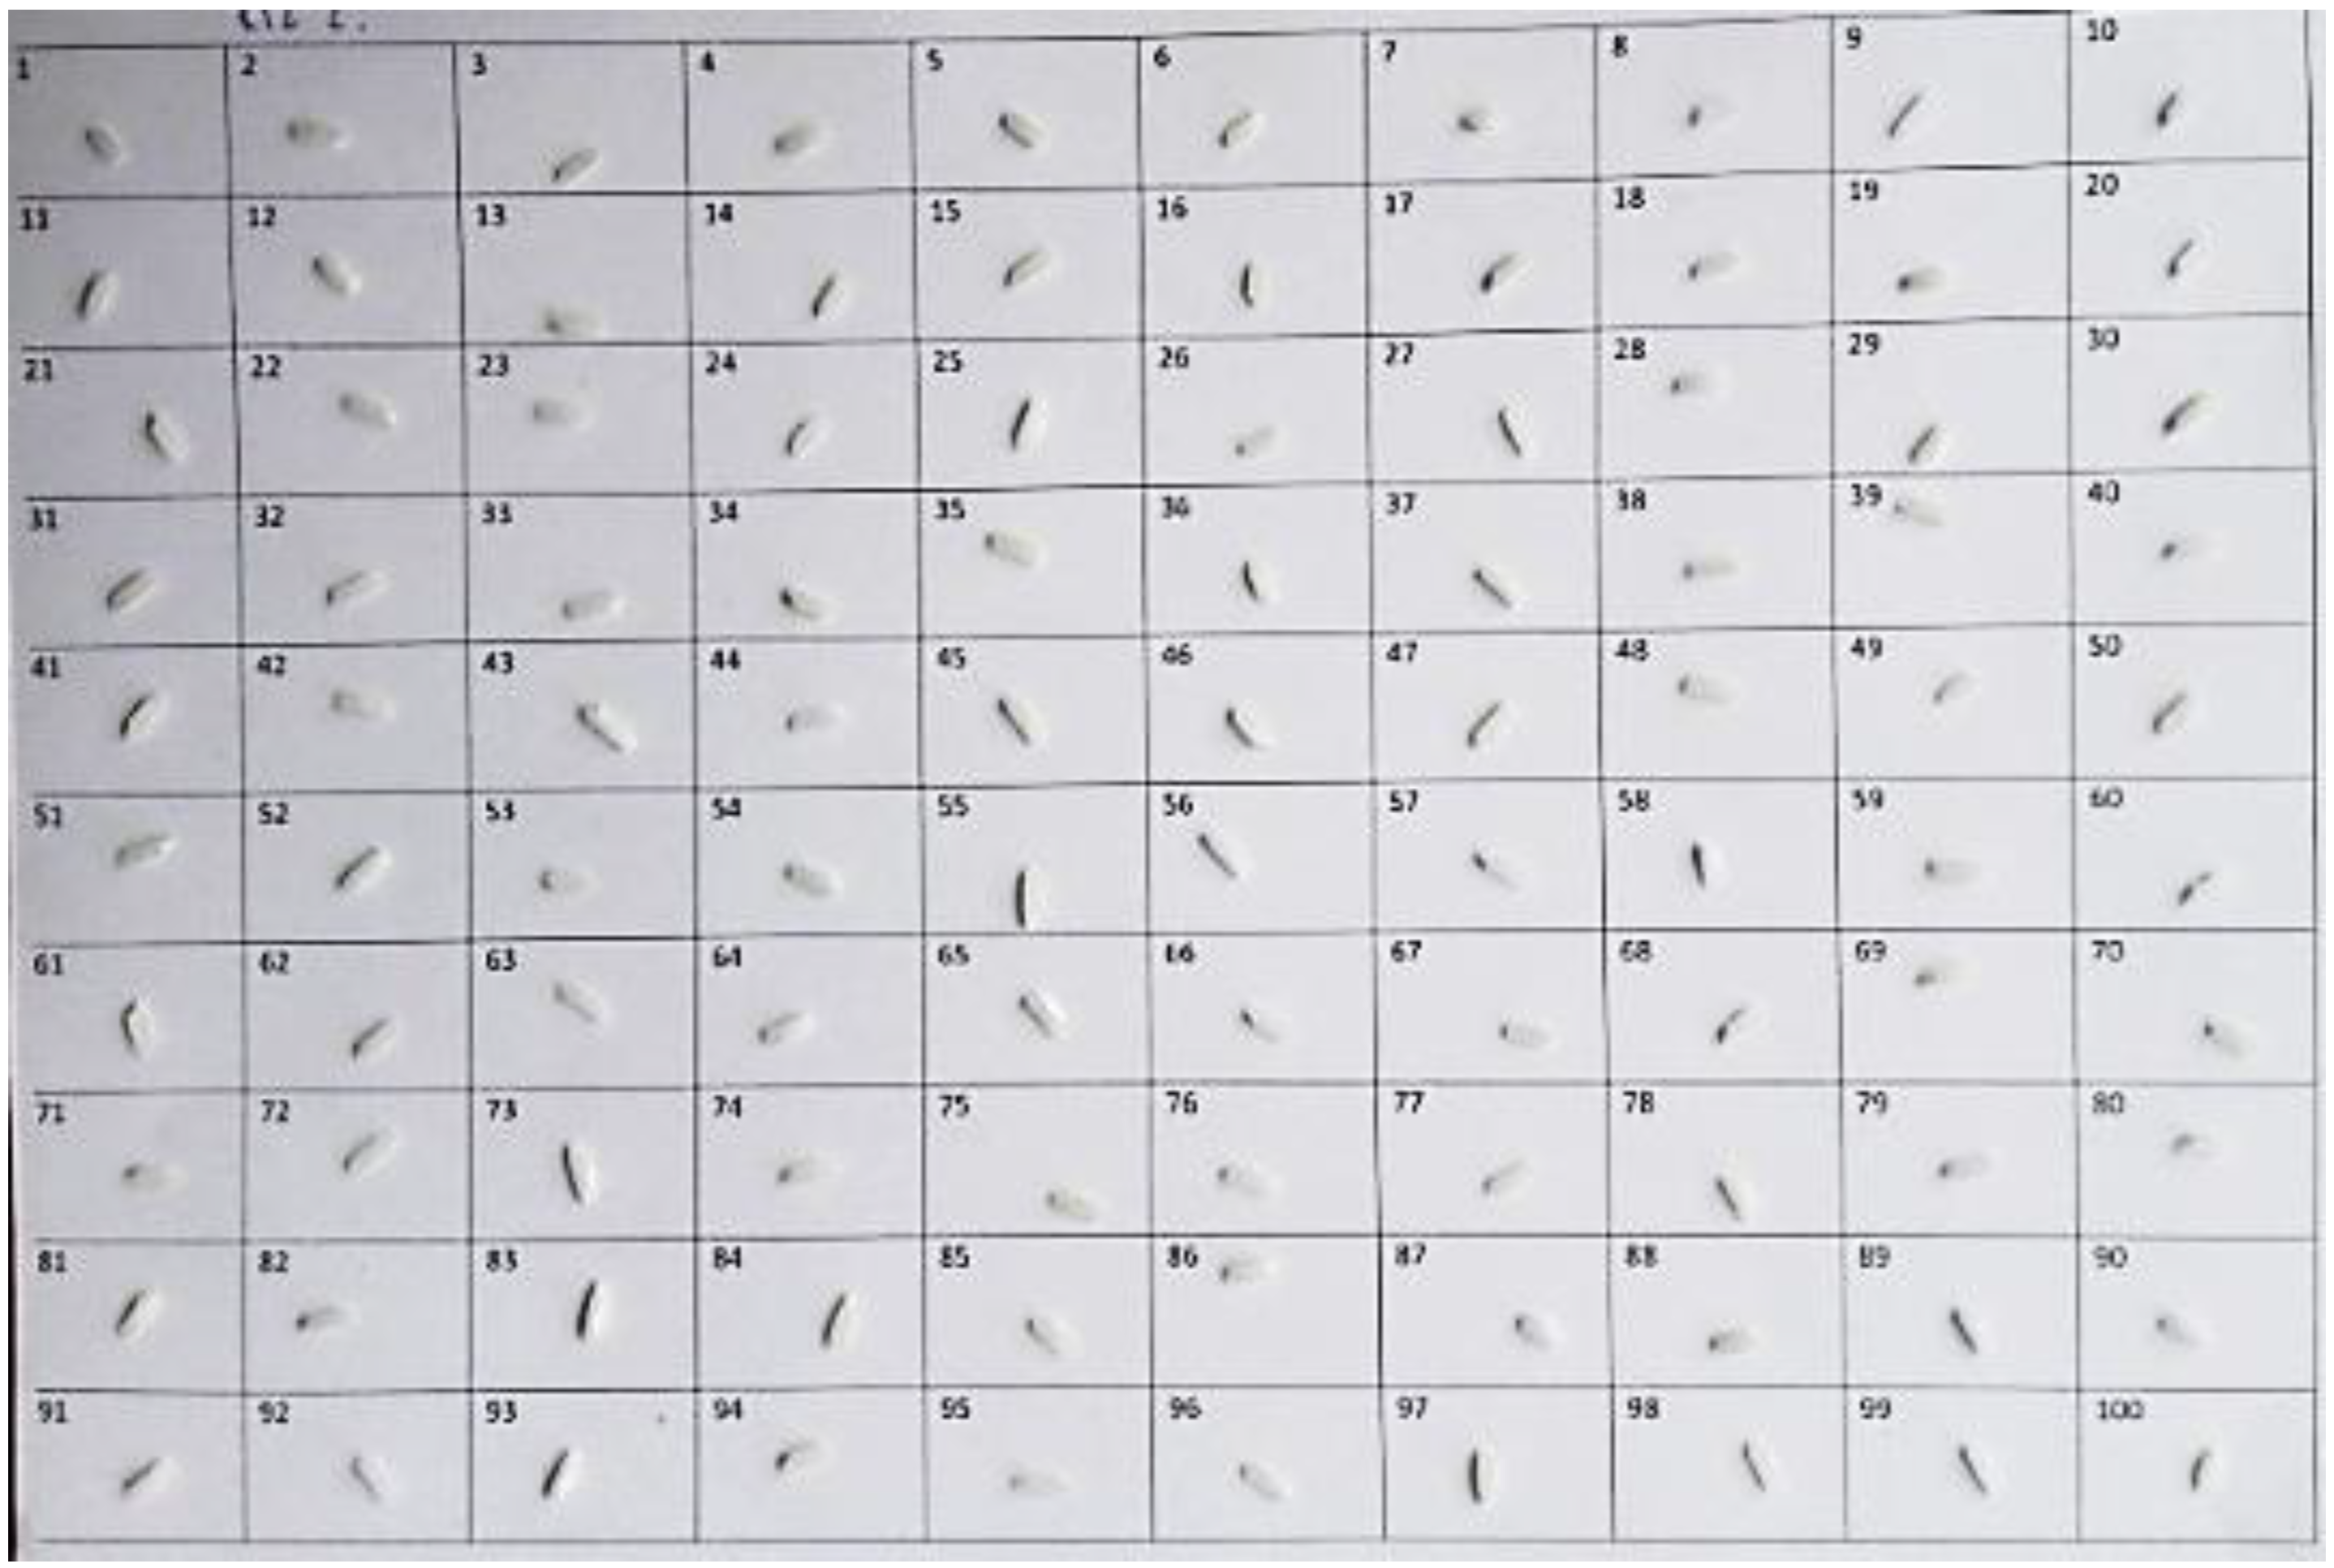
2.1. Rice Grains Preparation
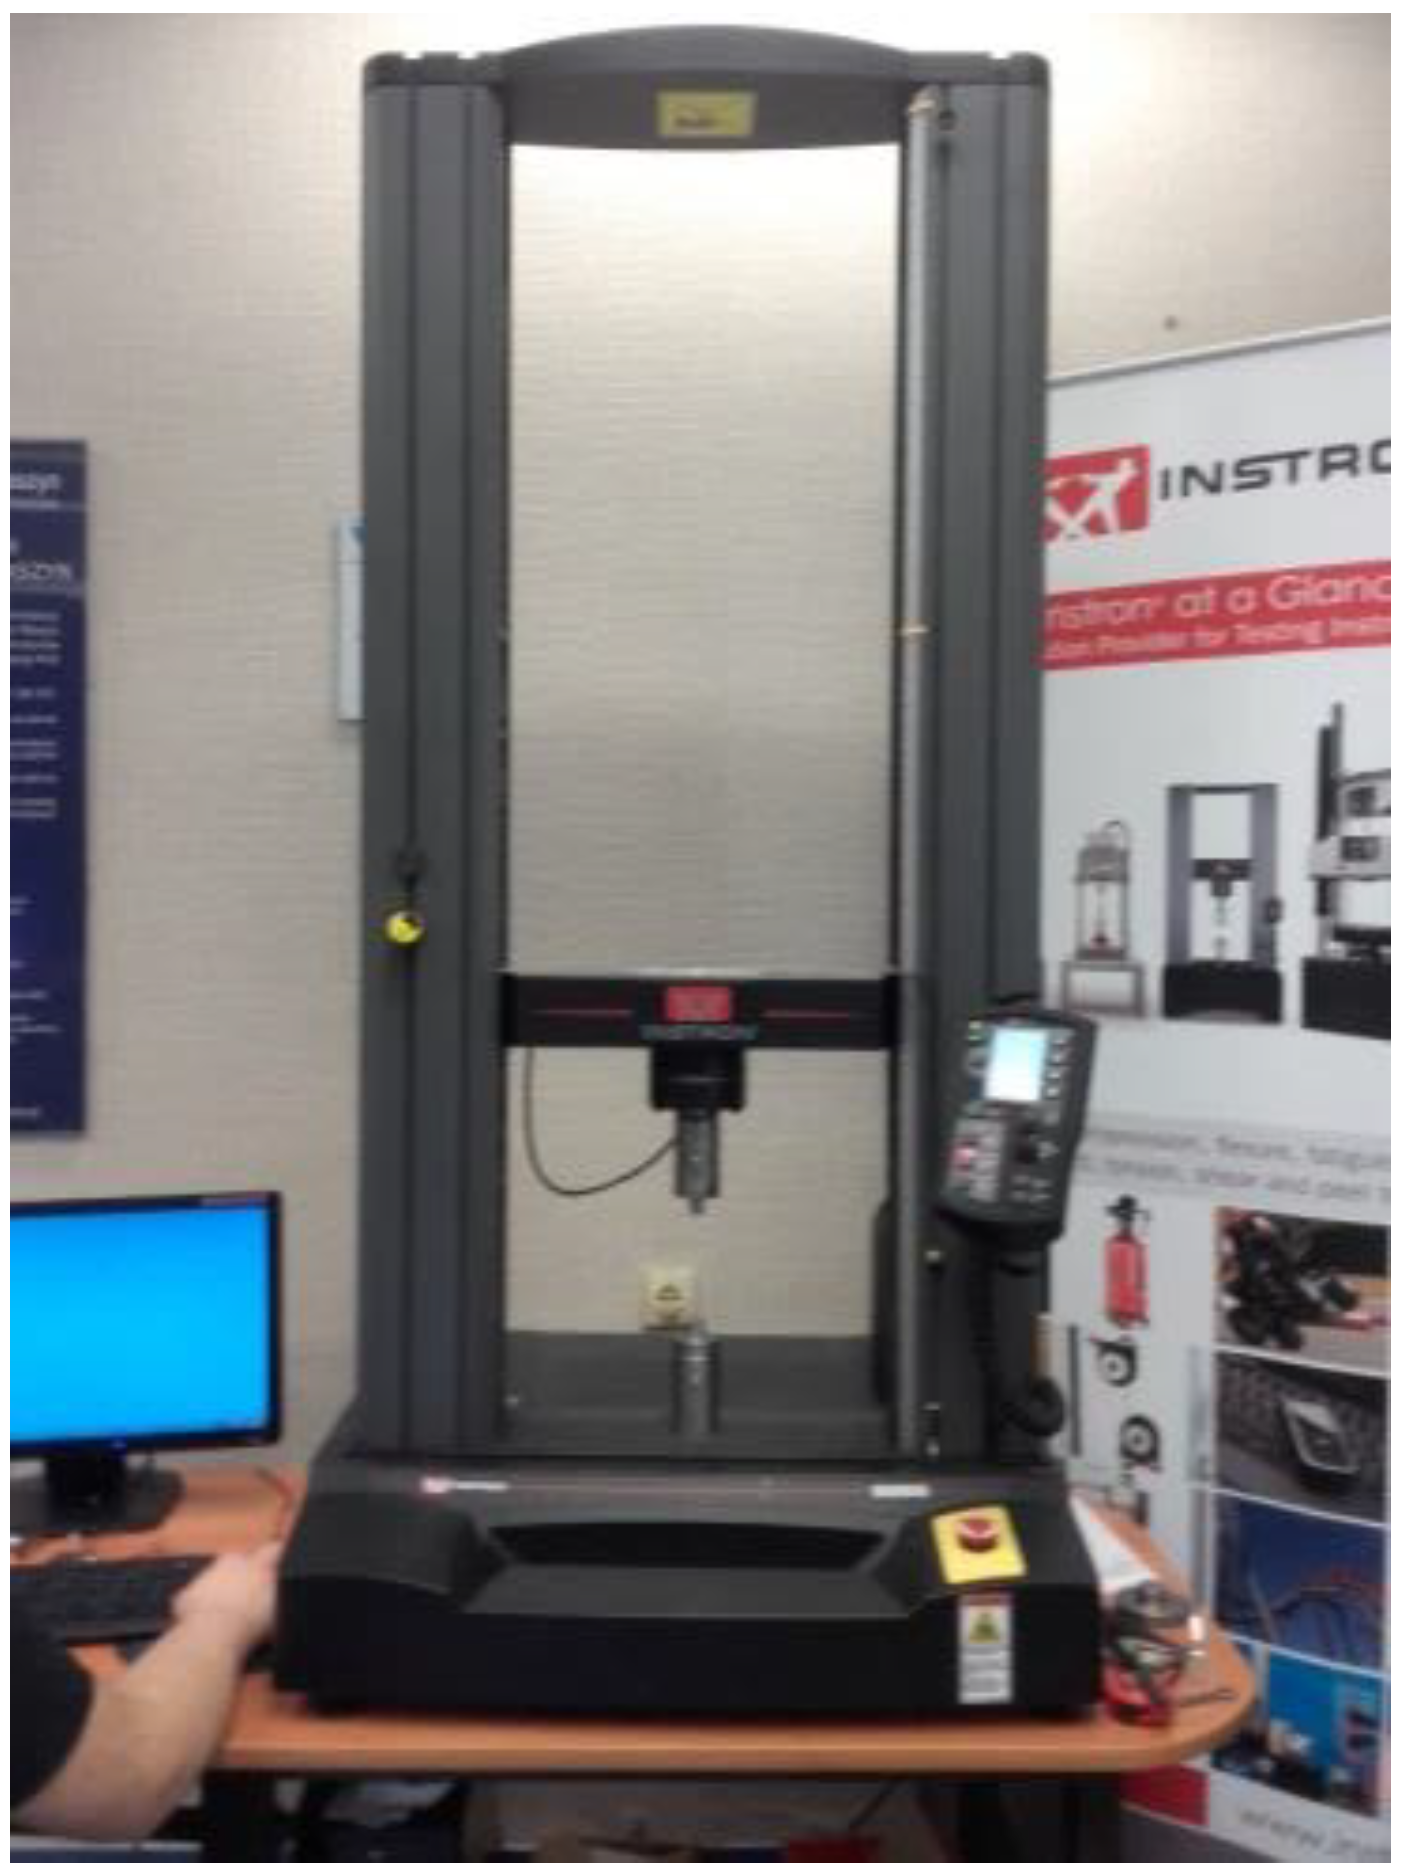
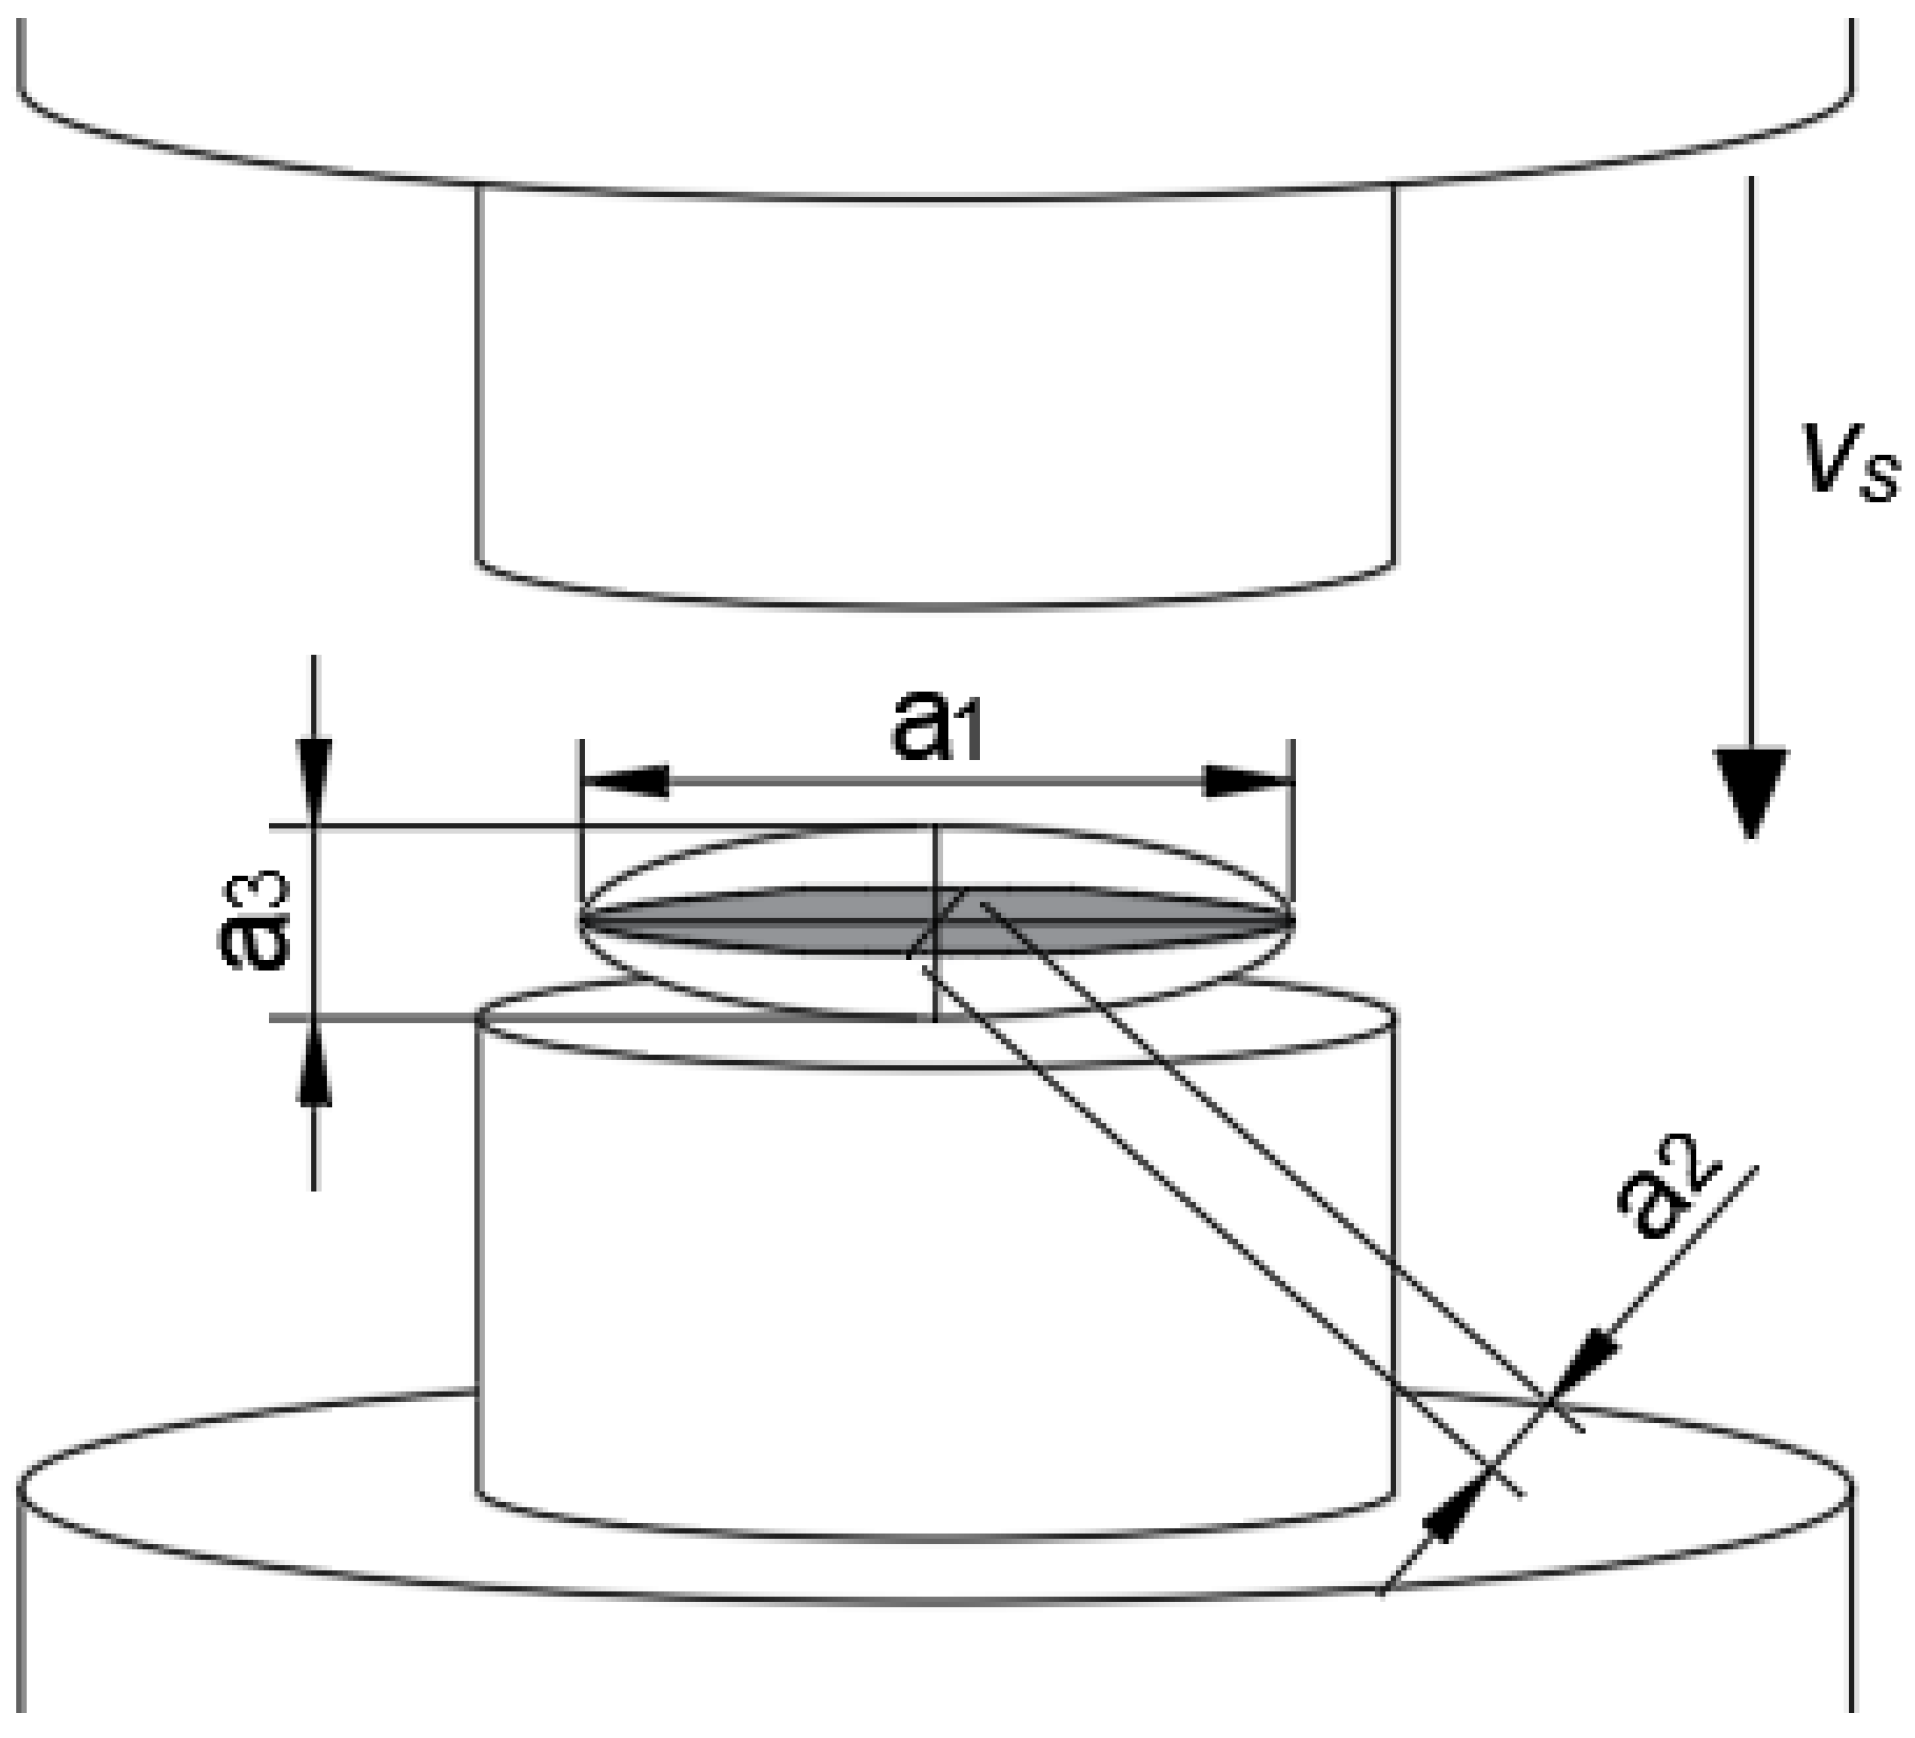
2.2. Test Stand
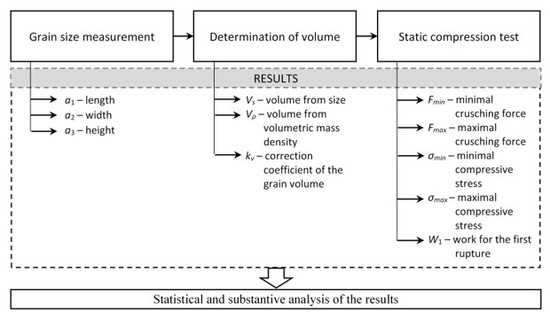
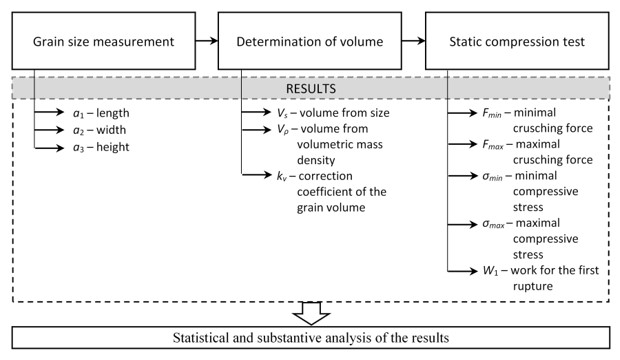
2.3. Research Methods
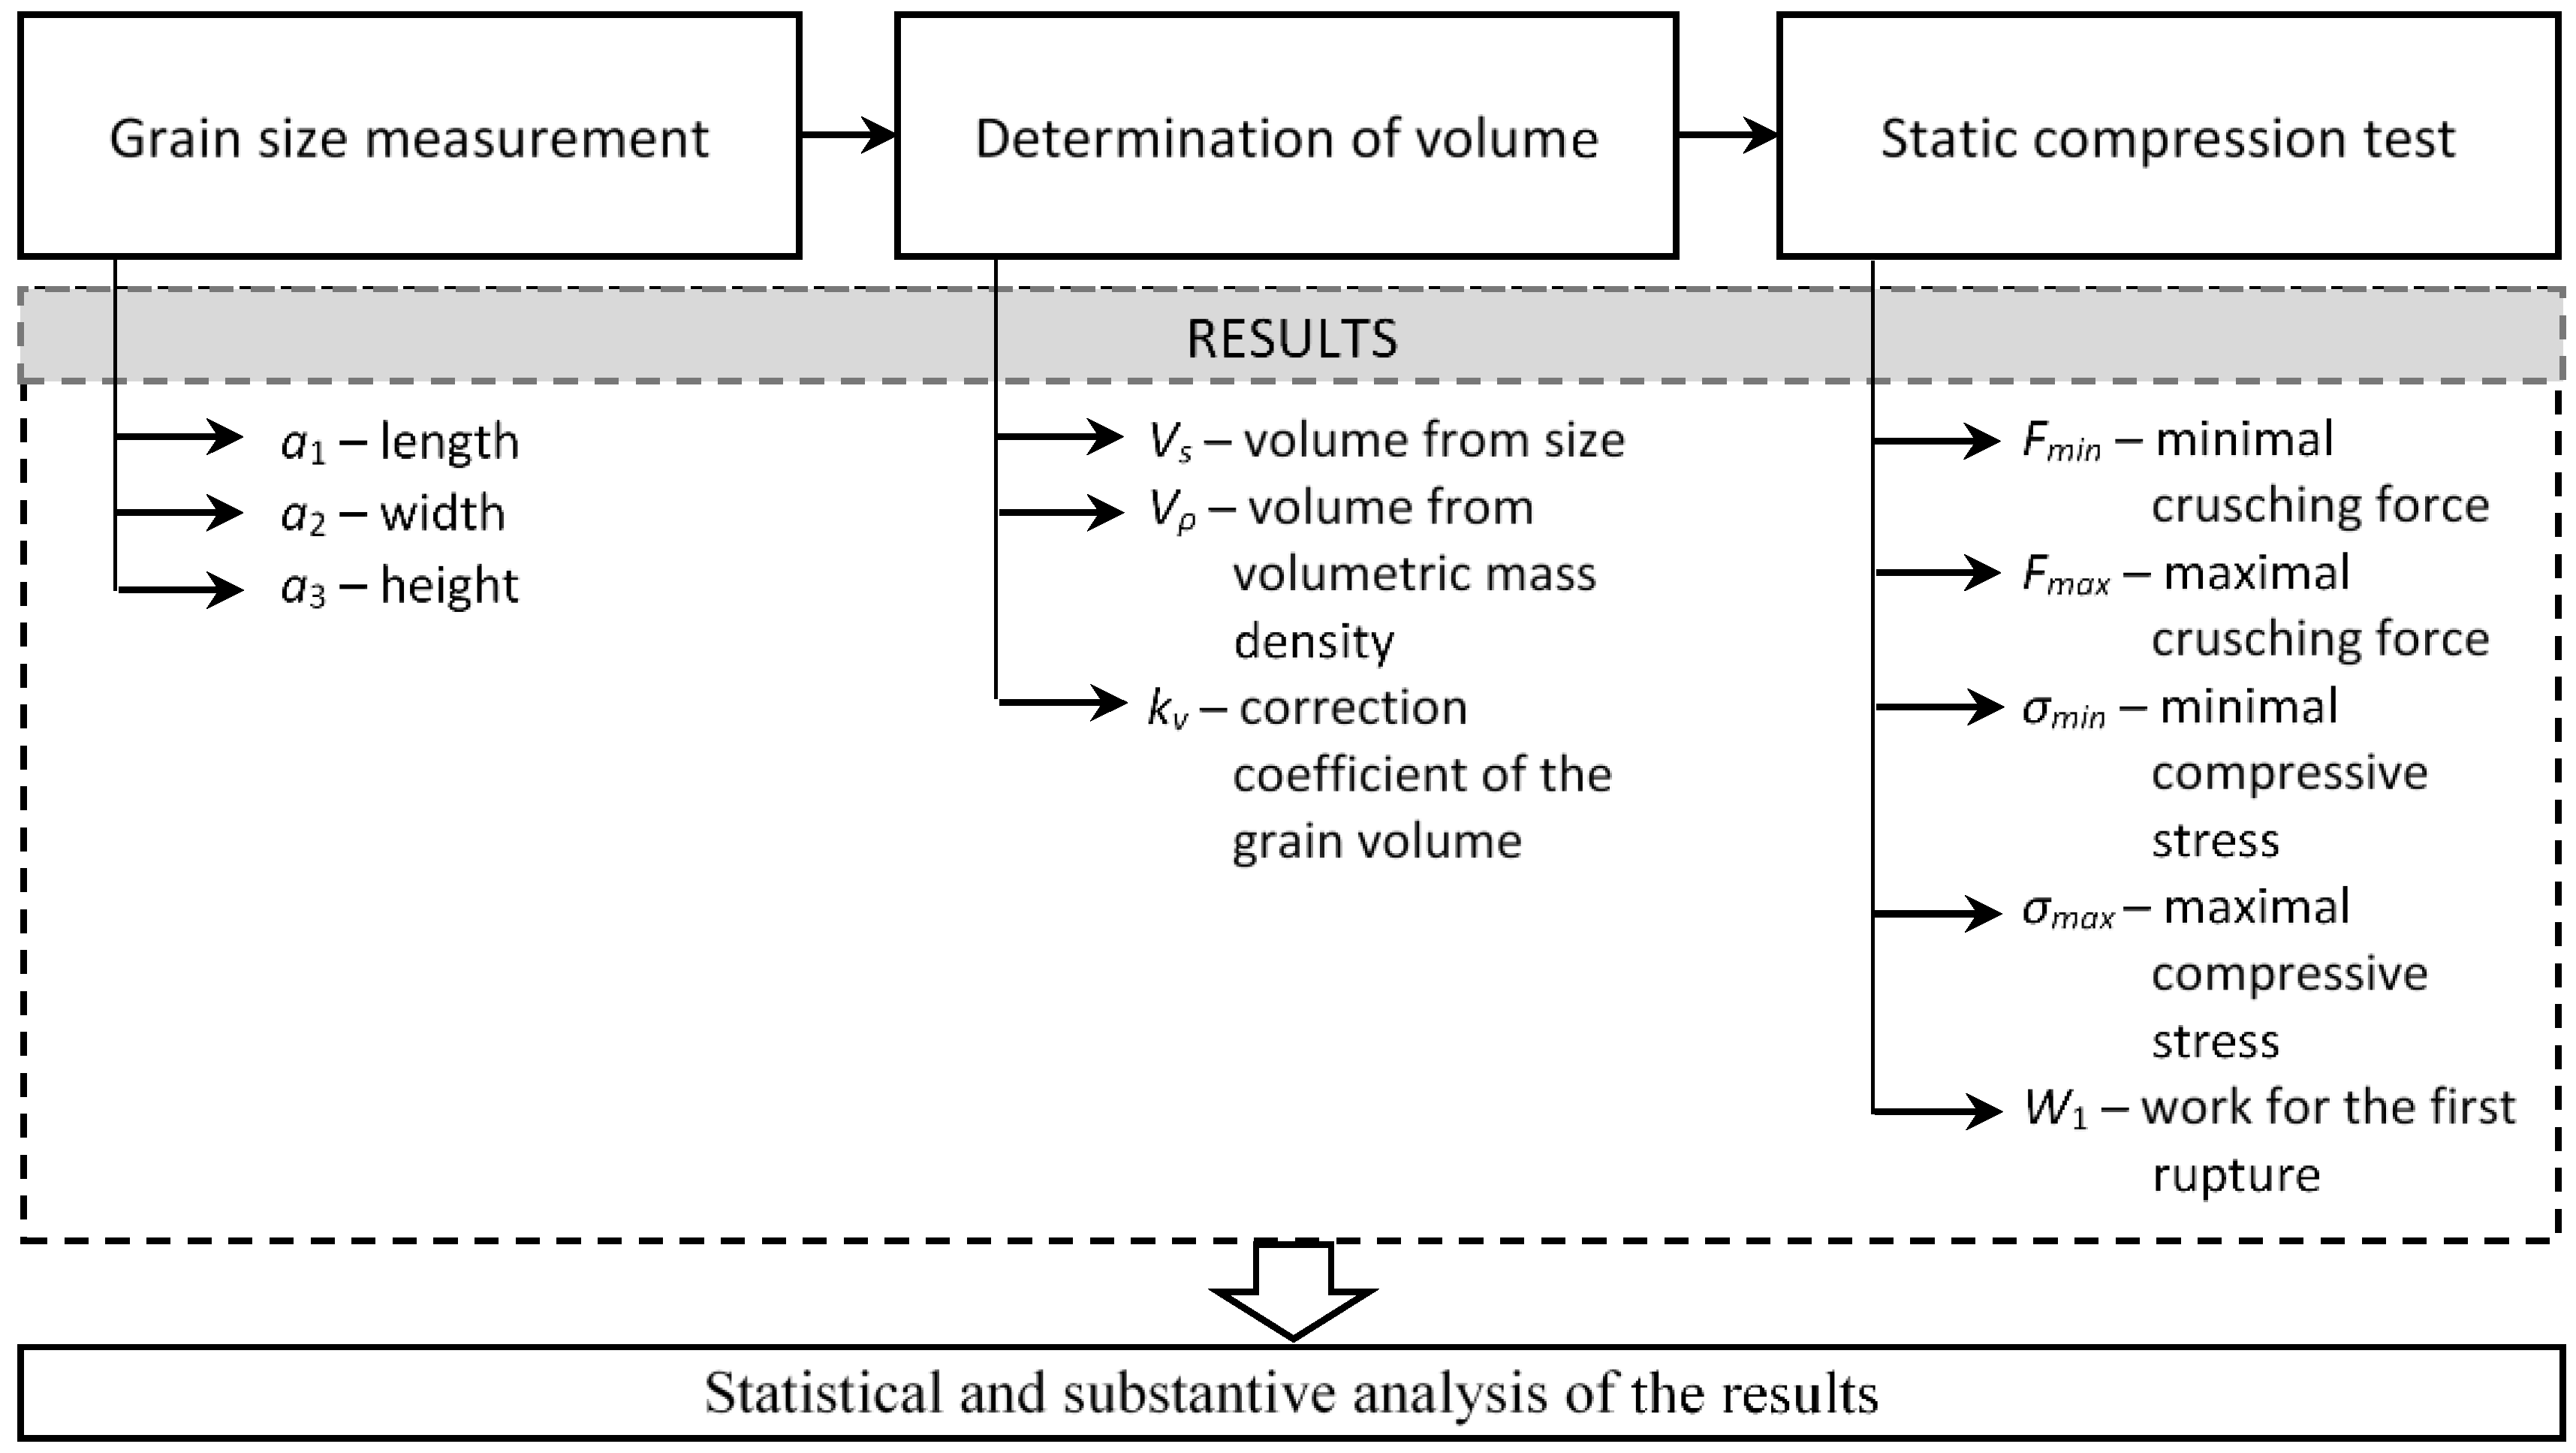
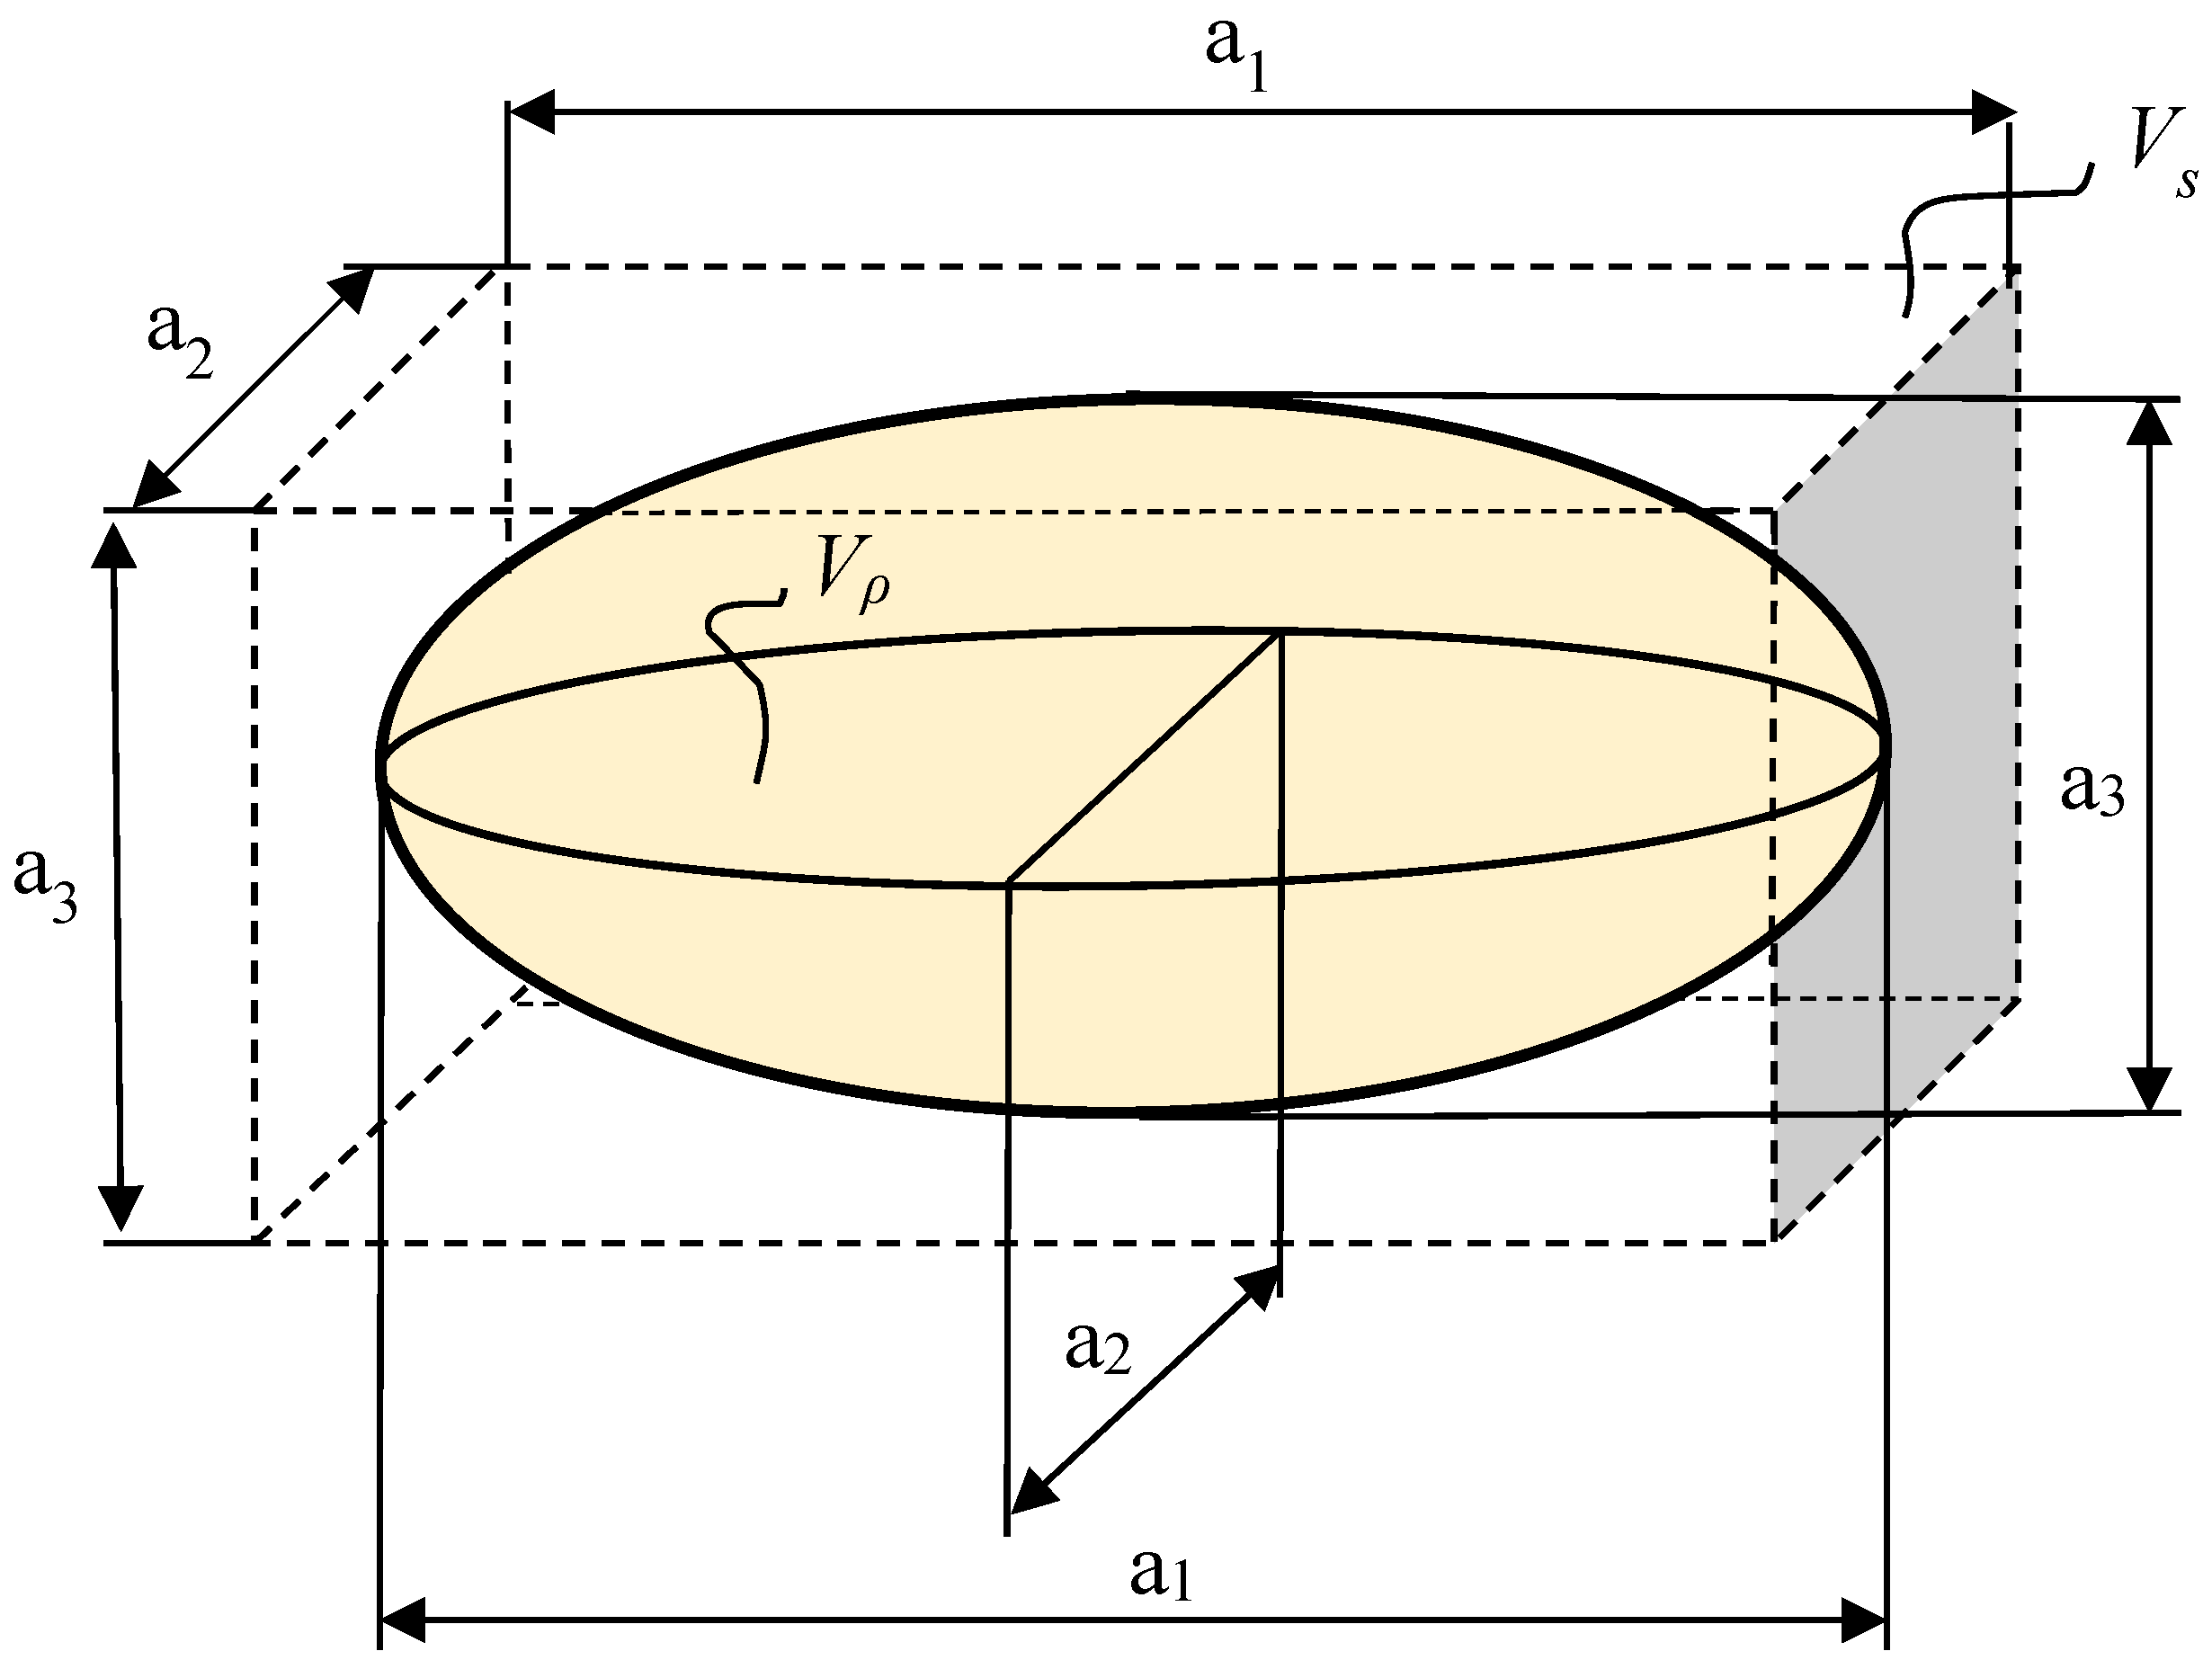
2.4. Analytical Methods
3. Results and Discussion
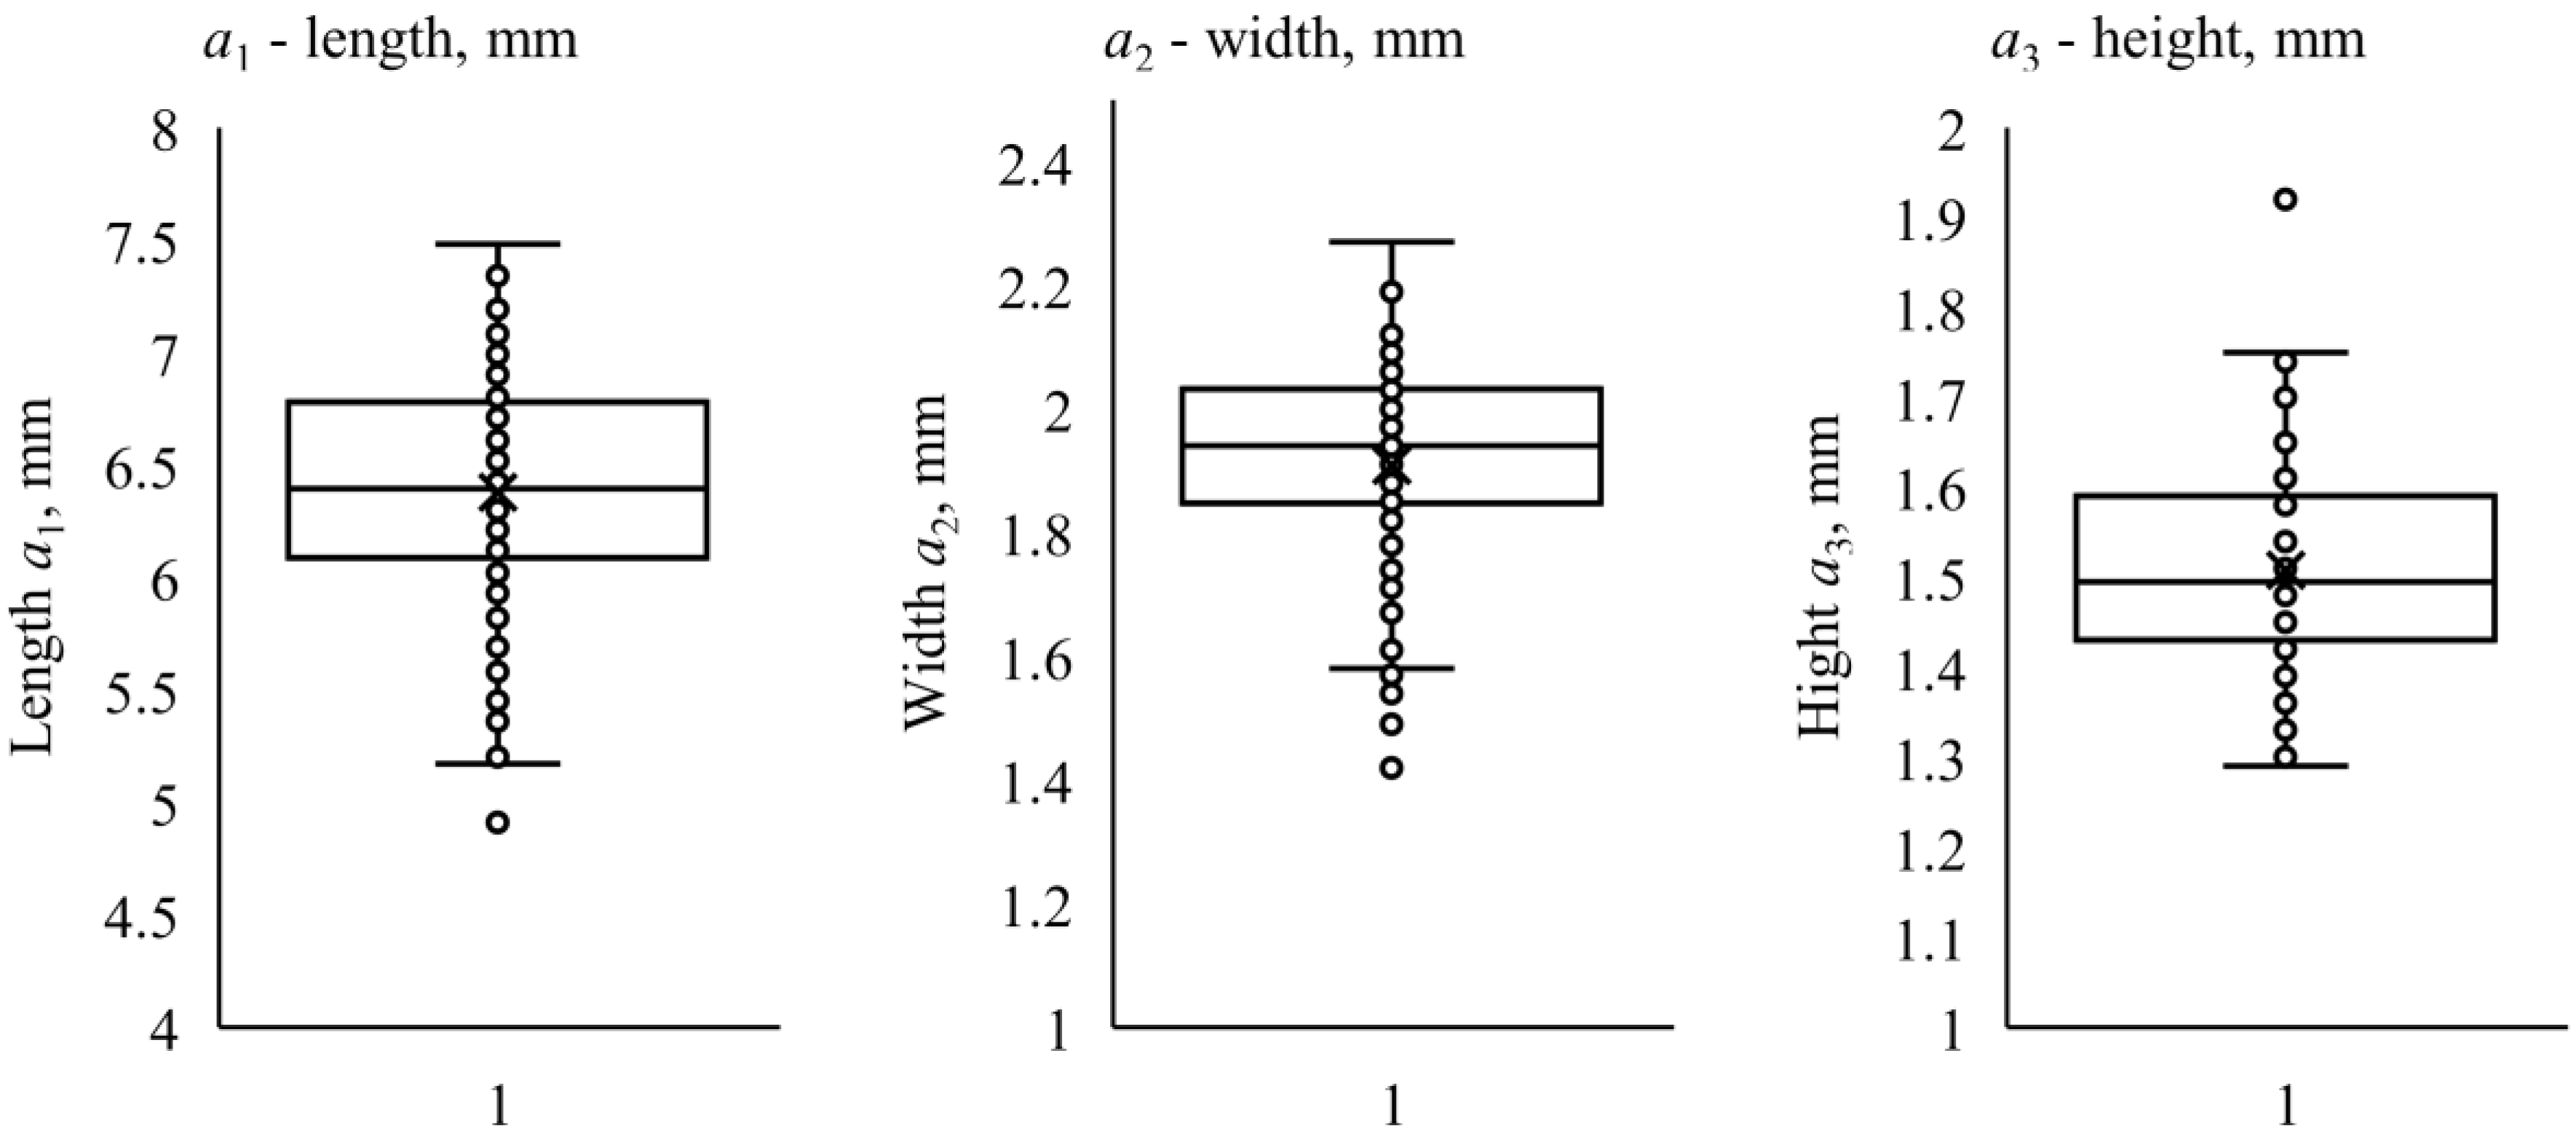
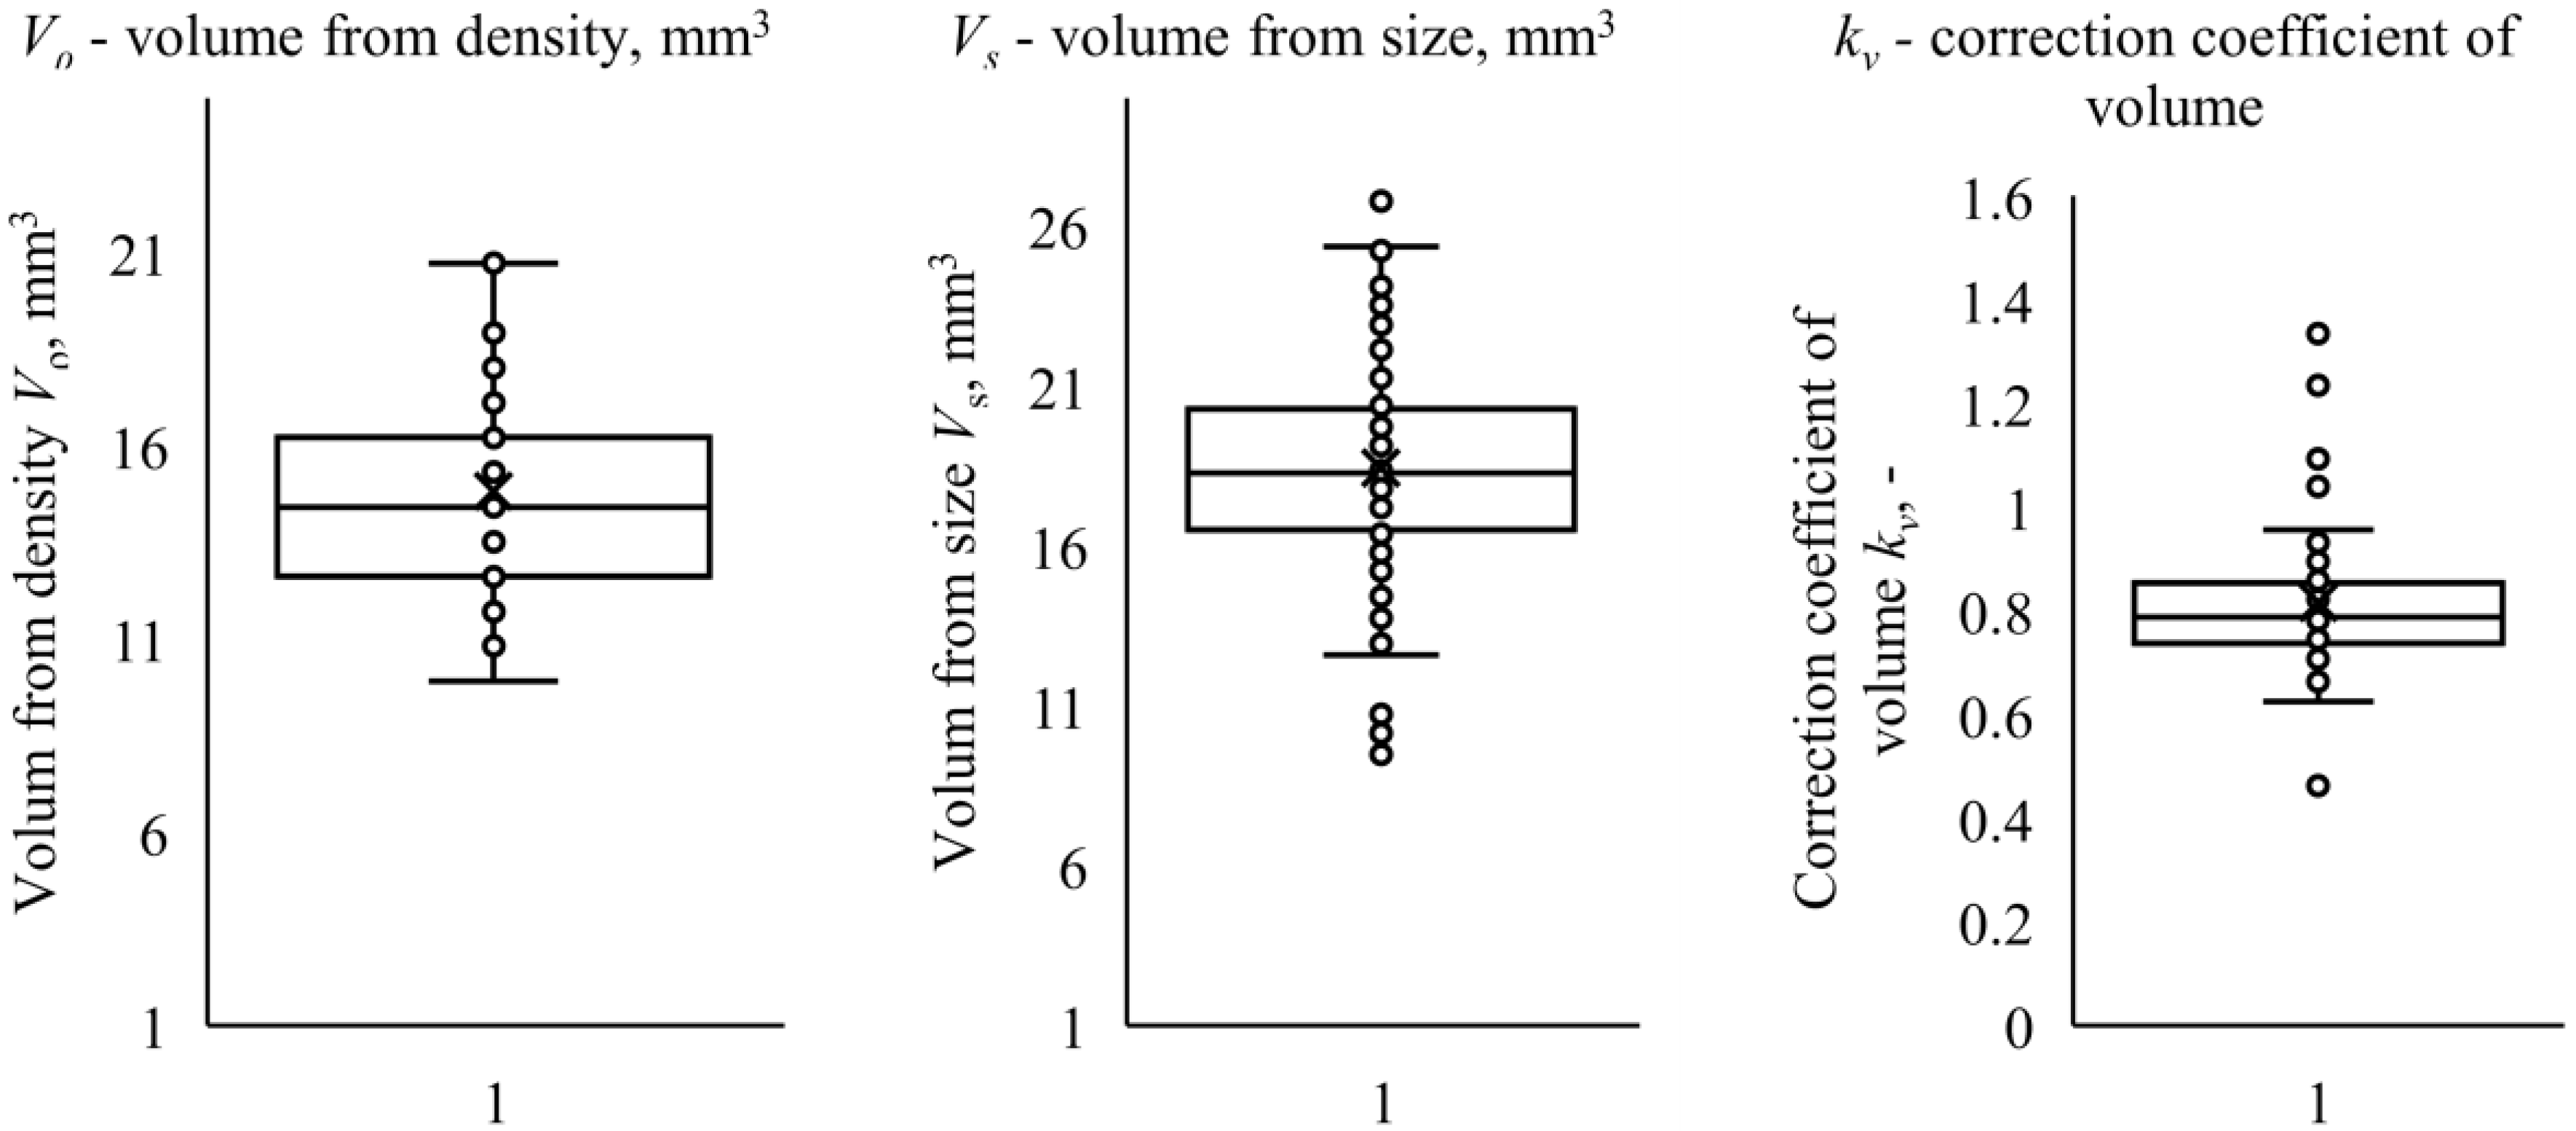
3.1. Results of Research on the Physical Properties of Rice Grains and Their Discussion
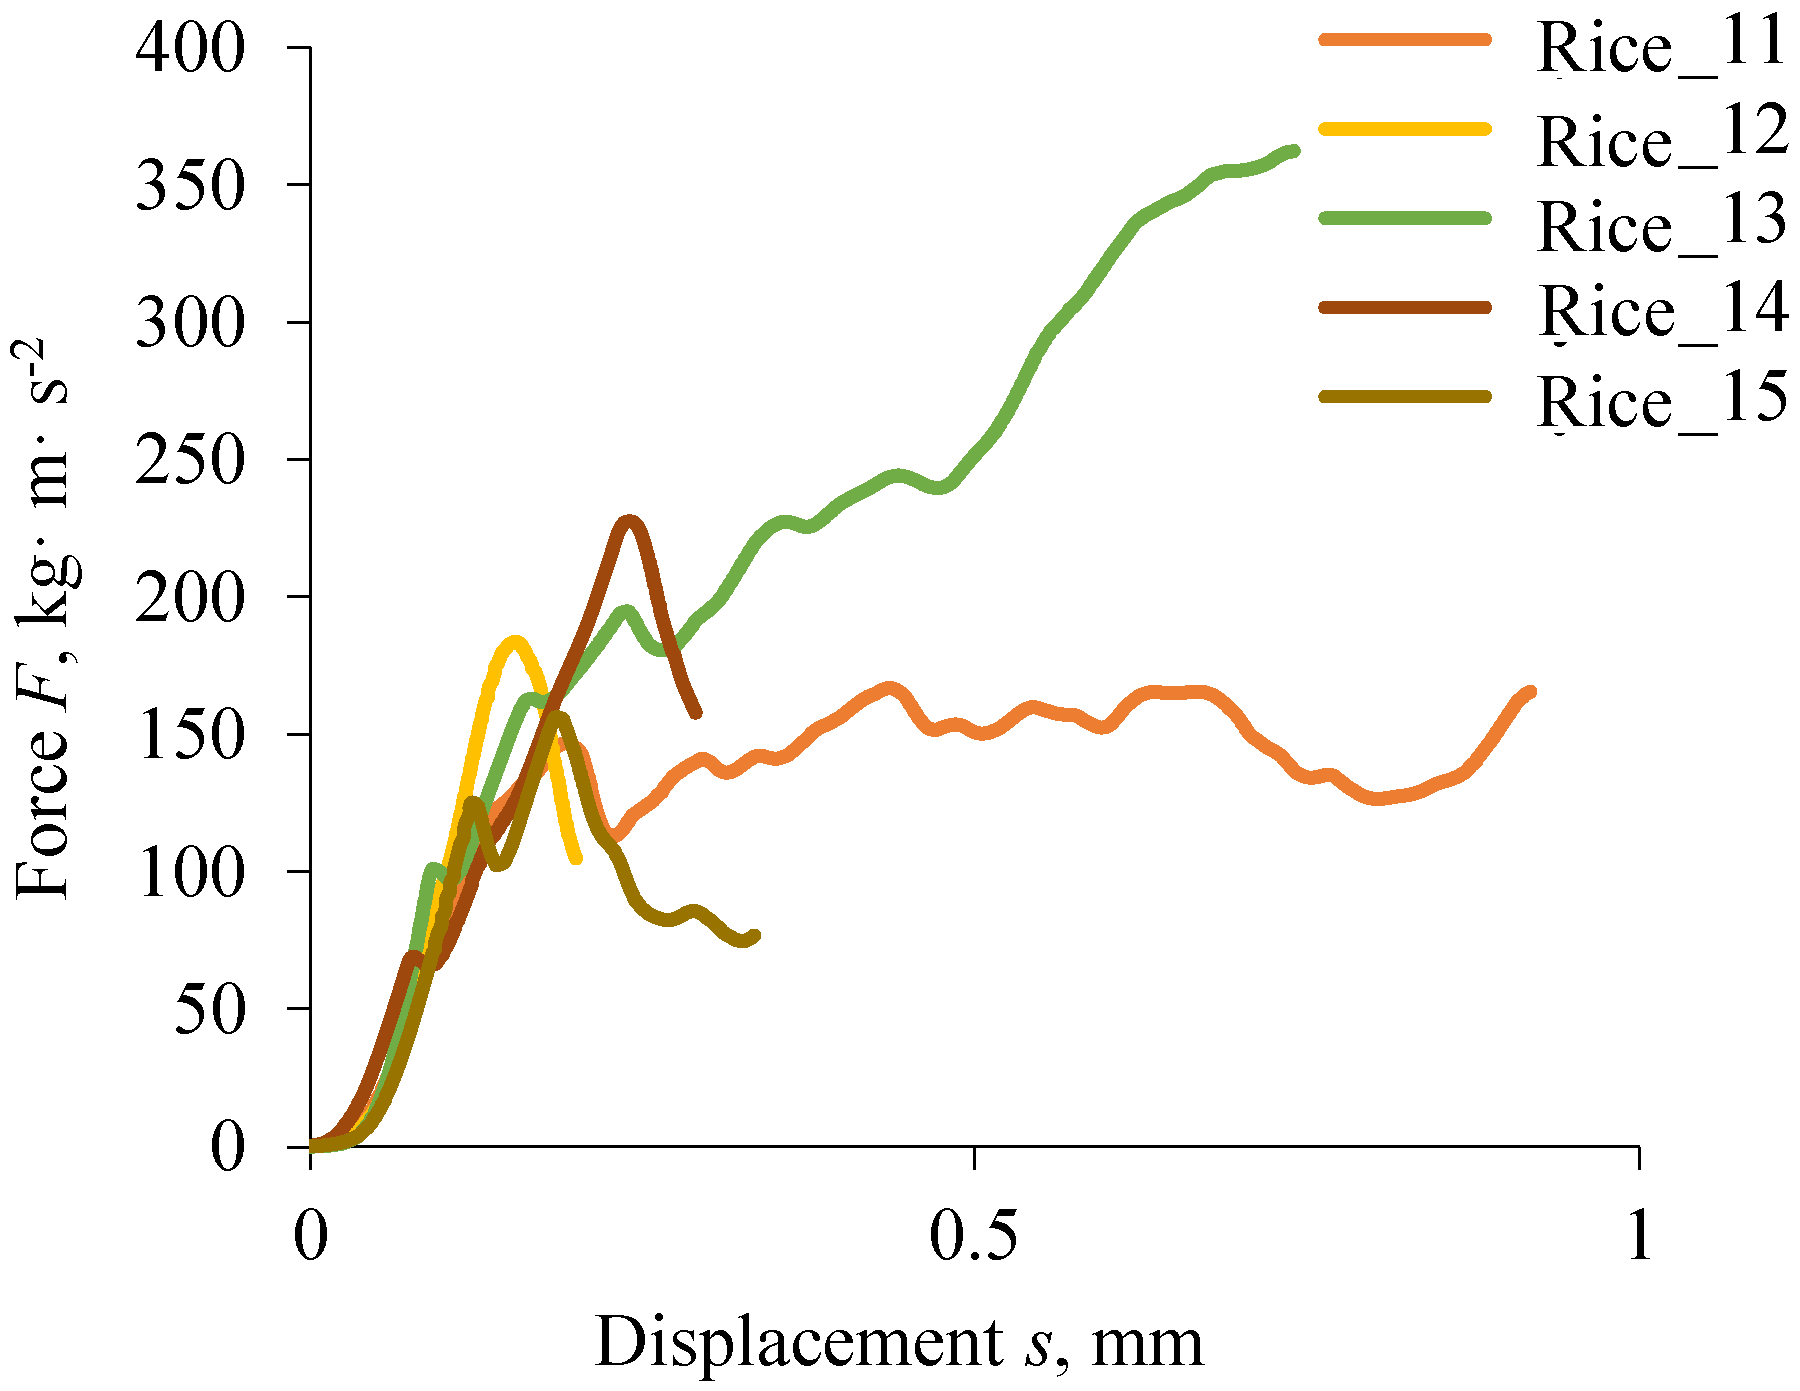
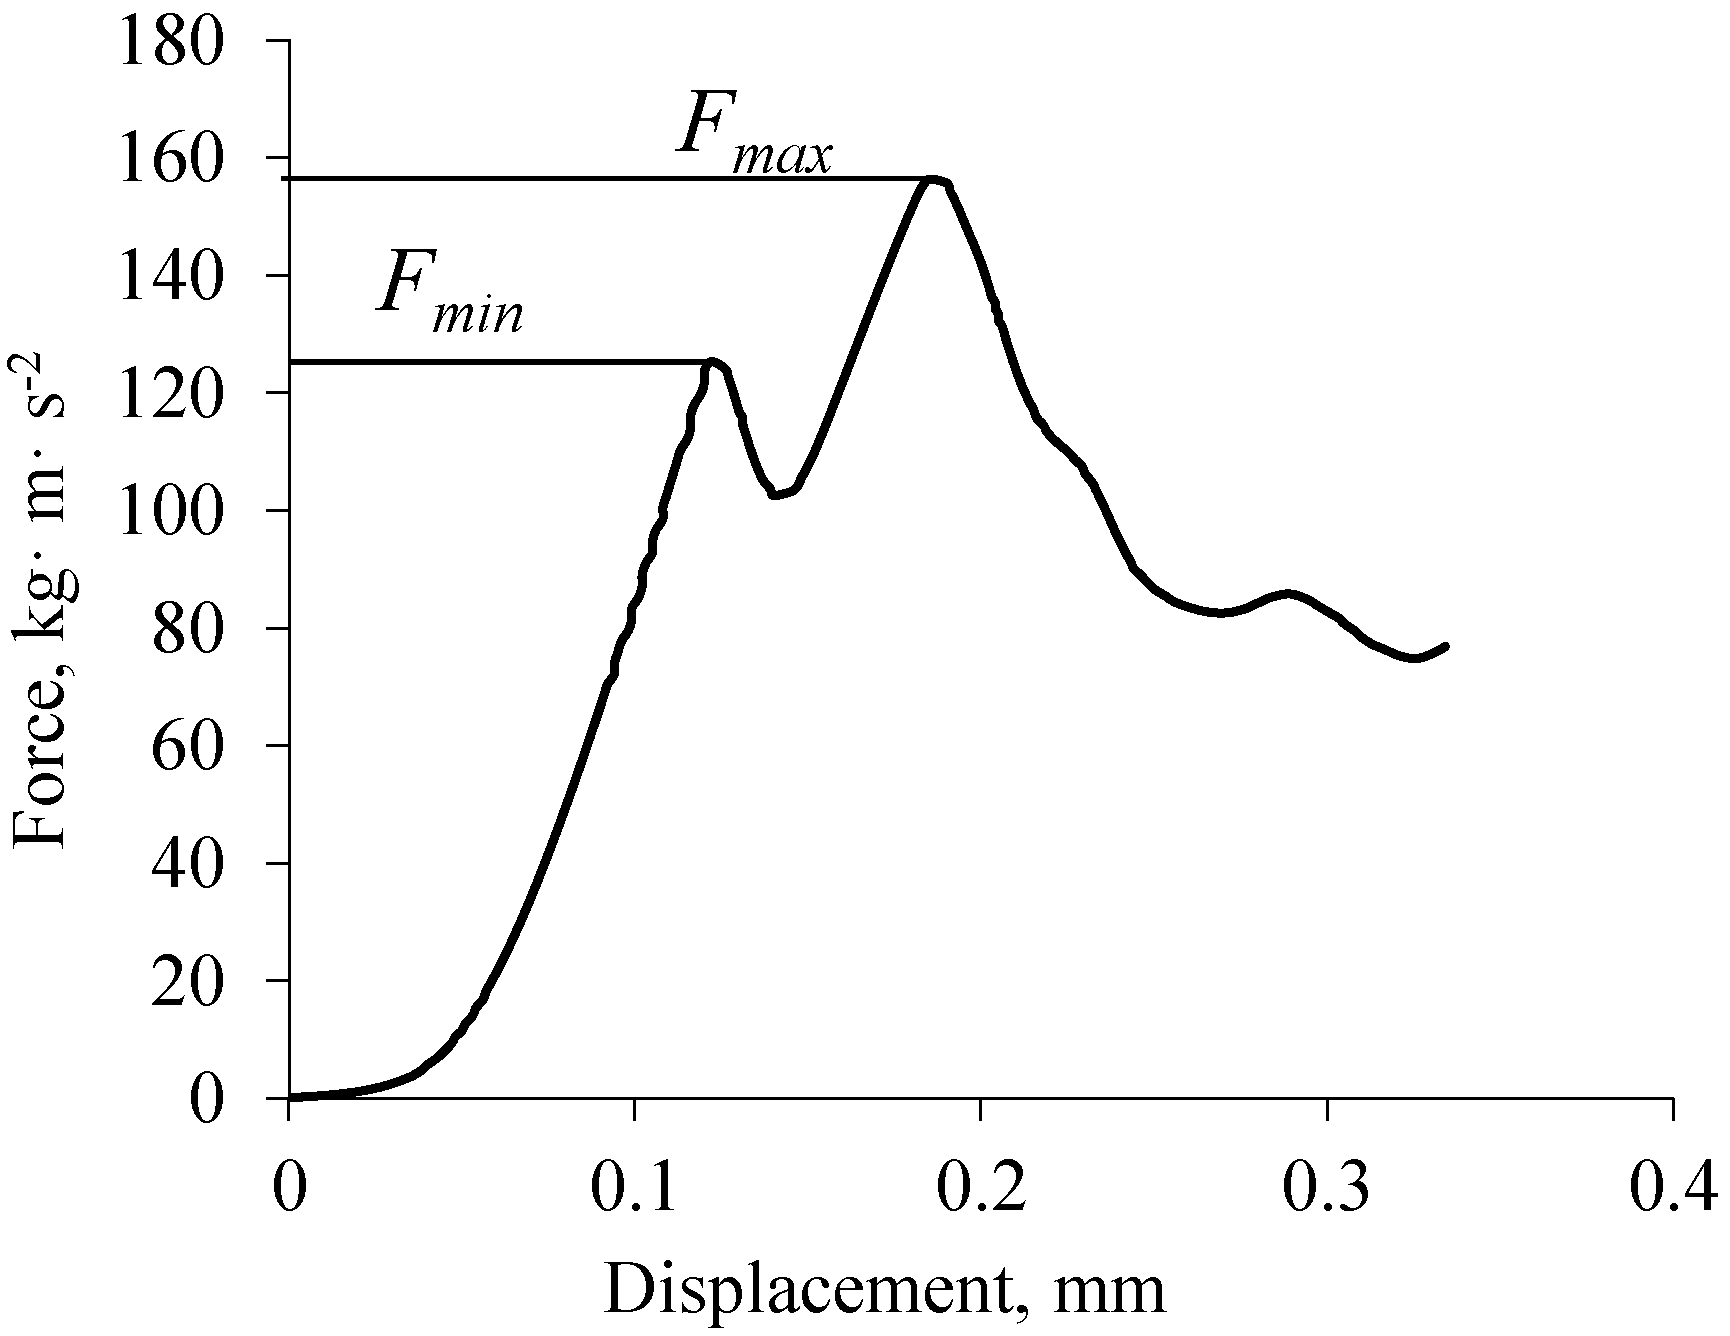
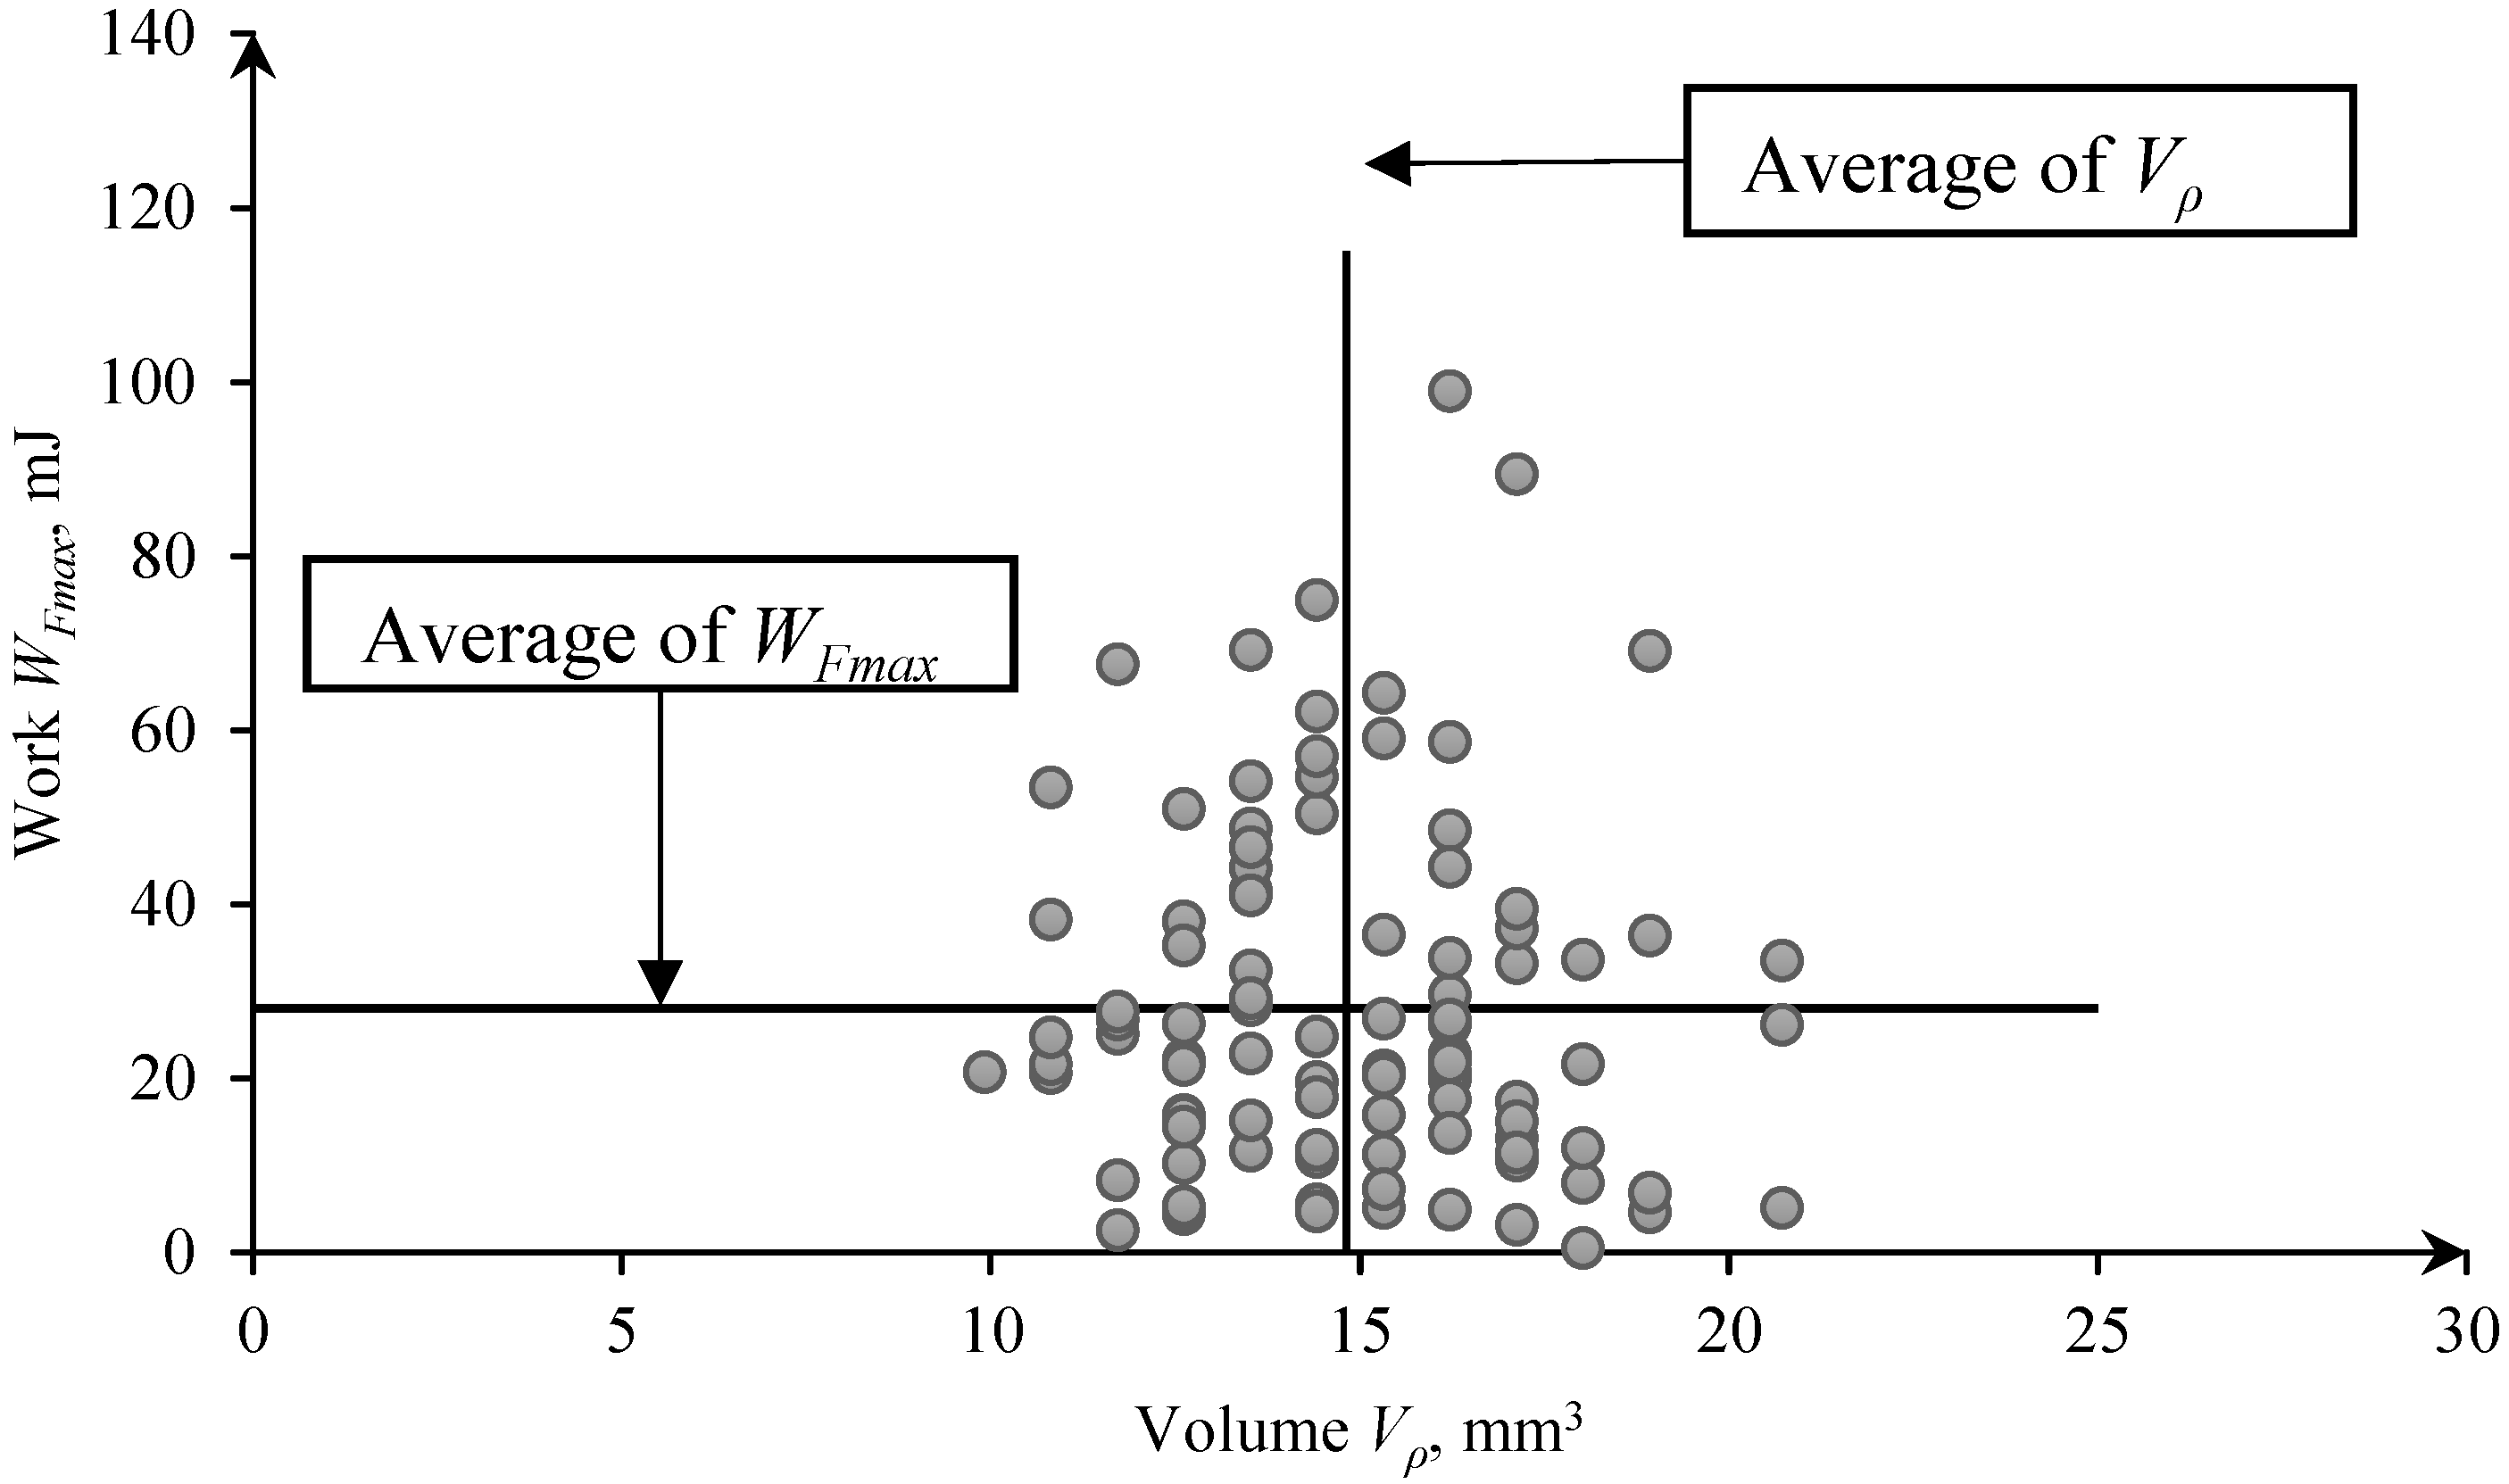
3.2. The Results of Testing the Strength Properties of Rice Grains and Their Discussion
4. Conclusions
Supplementary Materials
Author Contributions
Funding
Conflicts of Interest
List of Symbols
| a1 | length of the grain: mm |
| a2 | width of the grain, mm |
| a3 | height of the grain, mm |
| Vs | grain volume calculated based on three dimensions a1, a2, a3, mm3 |
| Vρ | grain volume calculated based on the volumetric mass density, mm3 |
| ρ | volumetric mass density, kg·m−3 |
| m | grain weight, g |
| kv | correction coefficient of the grain volume |
| Rc | compressive strength, MPa |
| Fc | the largest value of the compressive load at which the sample is crushed, kg·m·s−2 |
| A0 | the initial cross-section of the sample, m2 |
| F | compressive force, kg m·s−2 |
| Δl | sample shortening corresponding to force (F), m |
| l | the initial length of the sample, m |
| A0 | area of the initial sample cross-section, m2 |
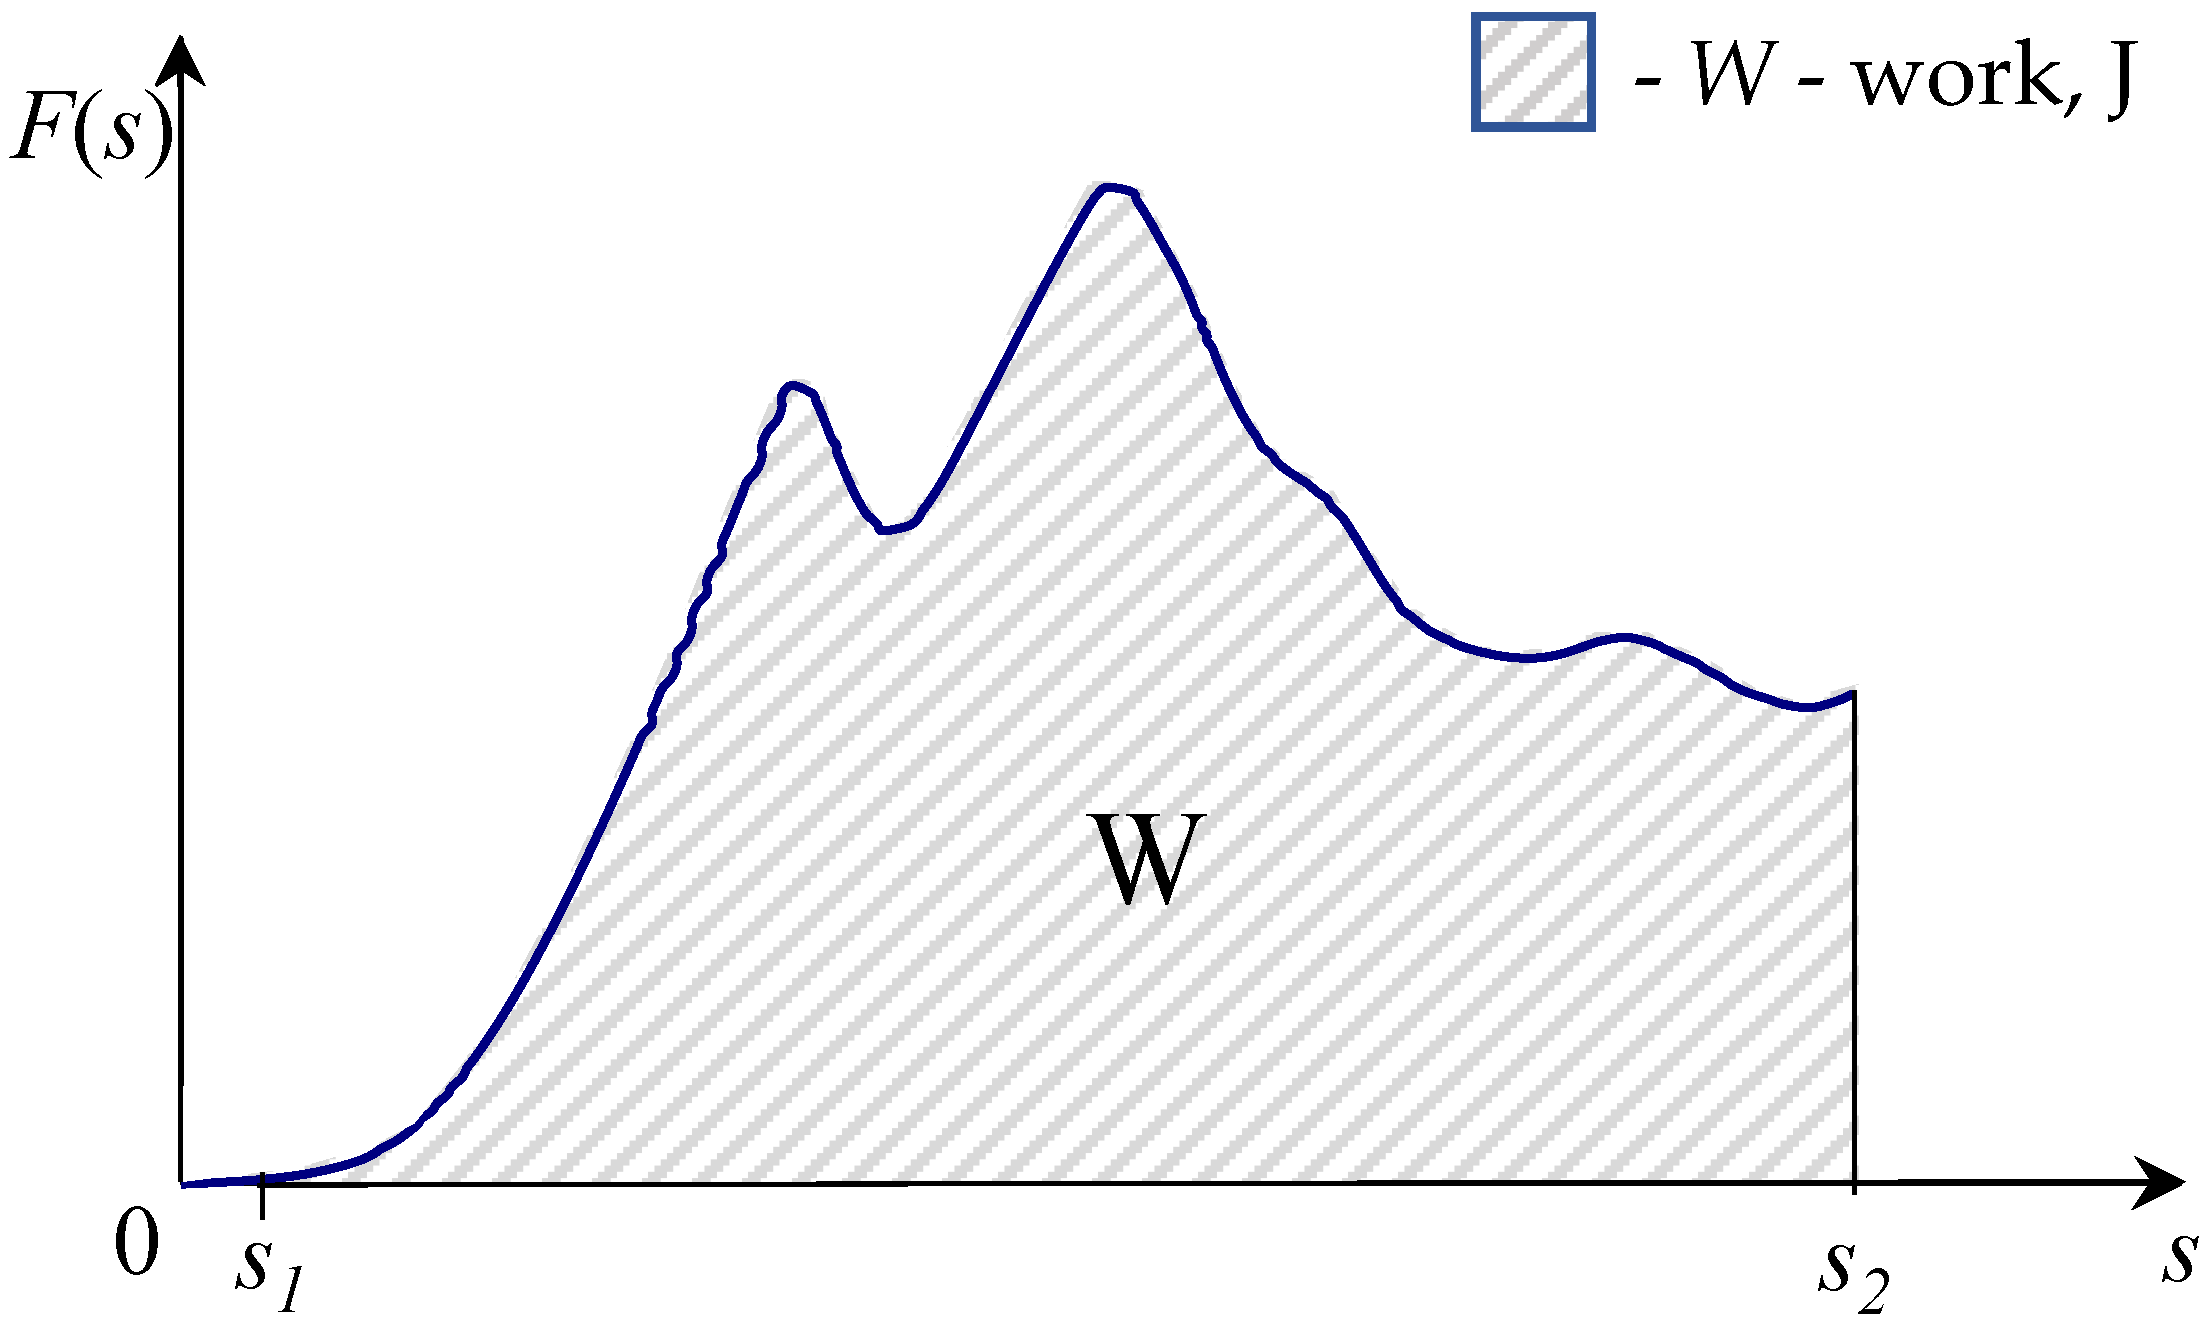
| s | displacement, m |
| W | work, J |
| dW | elementary work, J |
| ds | elementary displacement, m |
| Fmin | minimal crushing force, kg·m s−2 |
| Fmax | maximal crushing force, kg·m·s−2 |
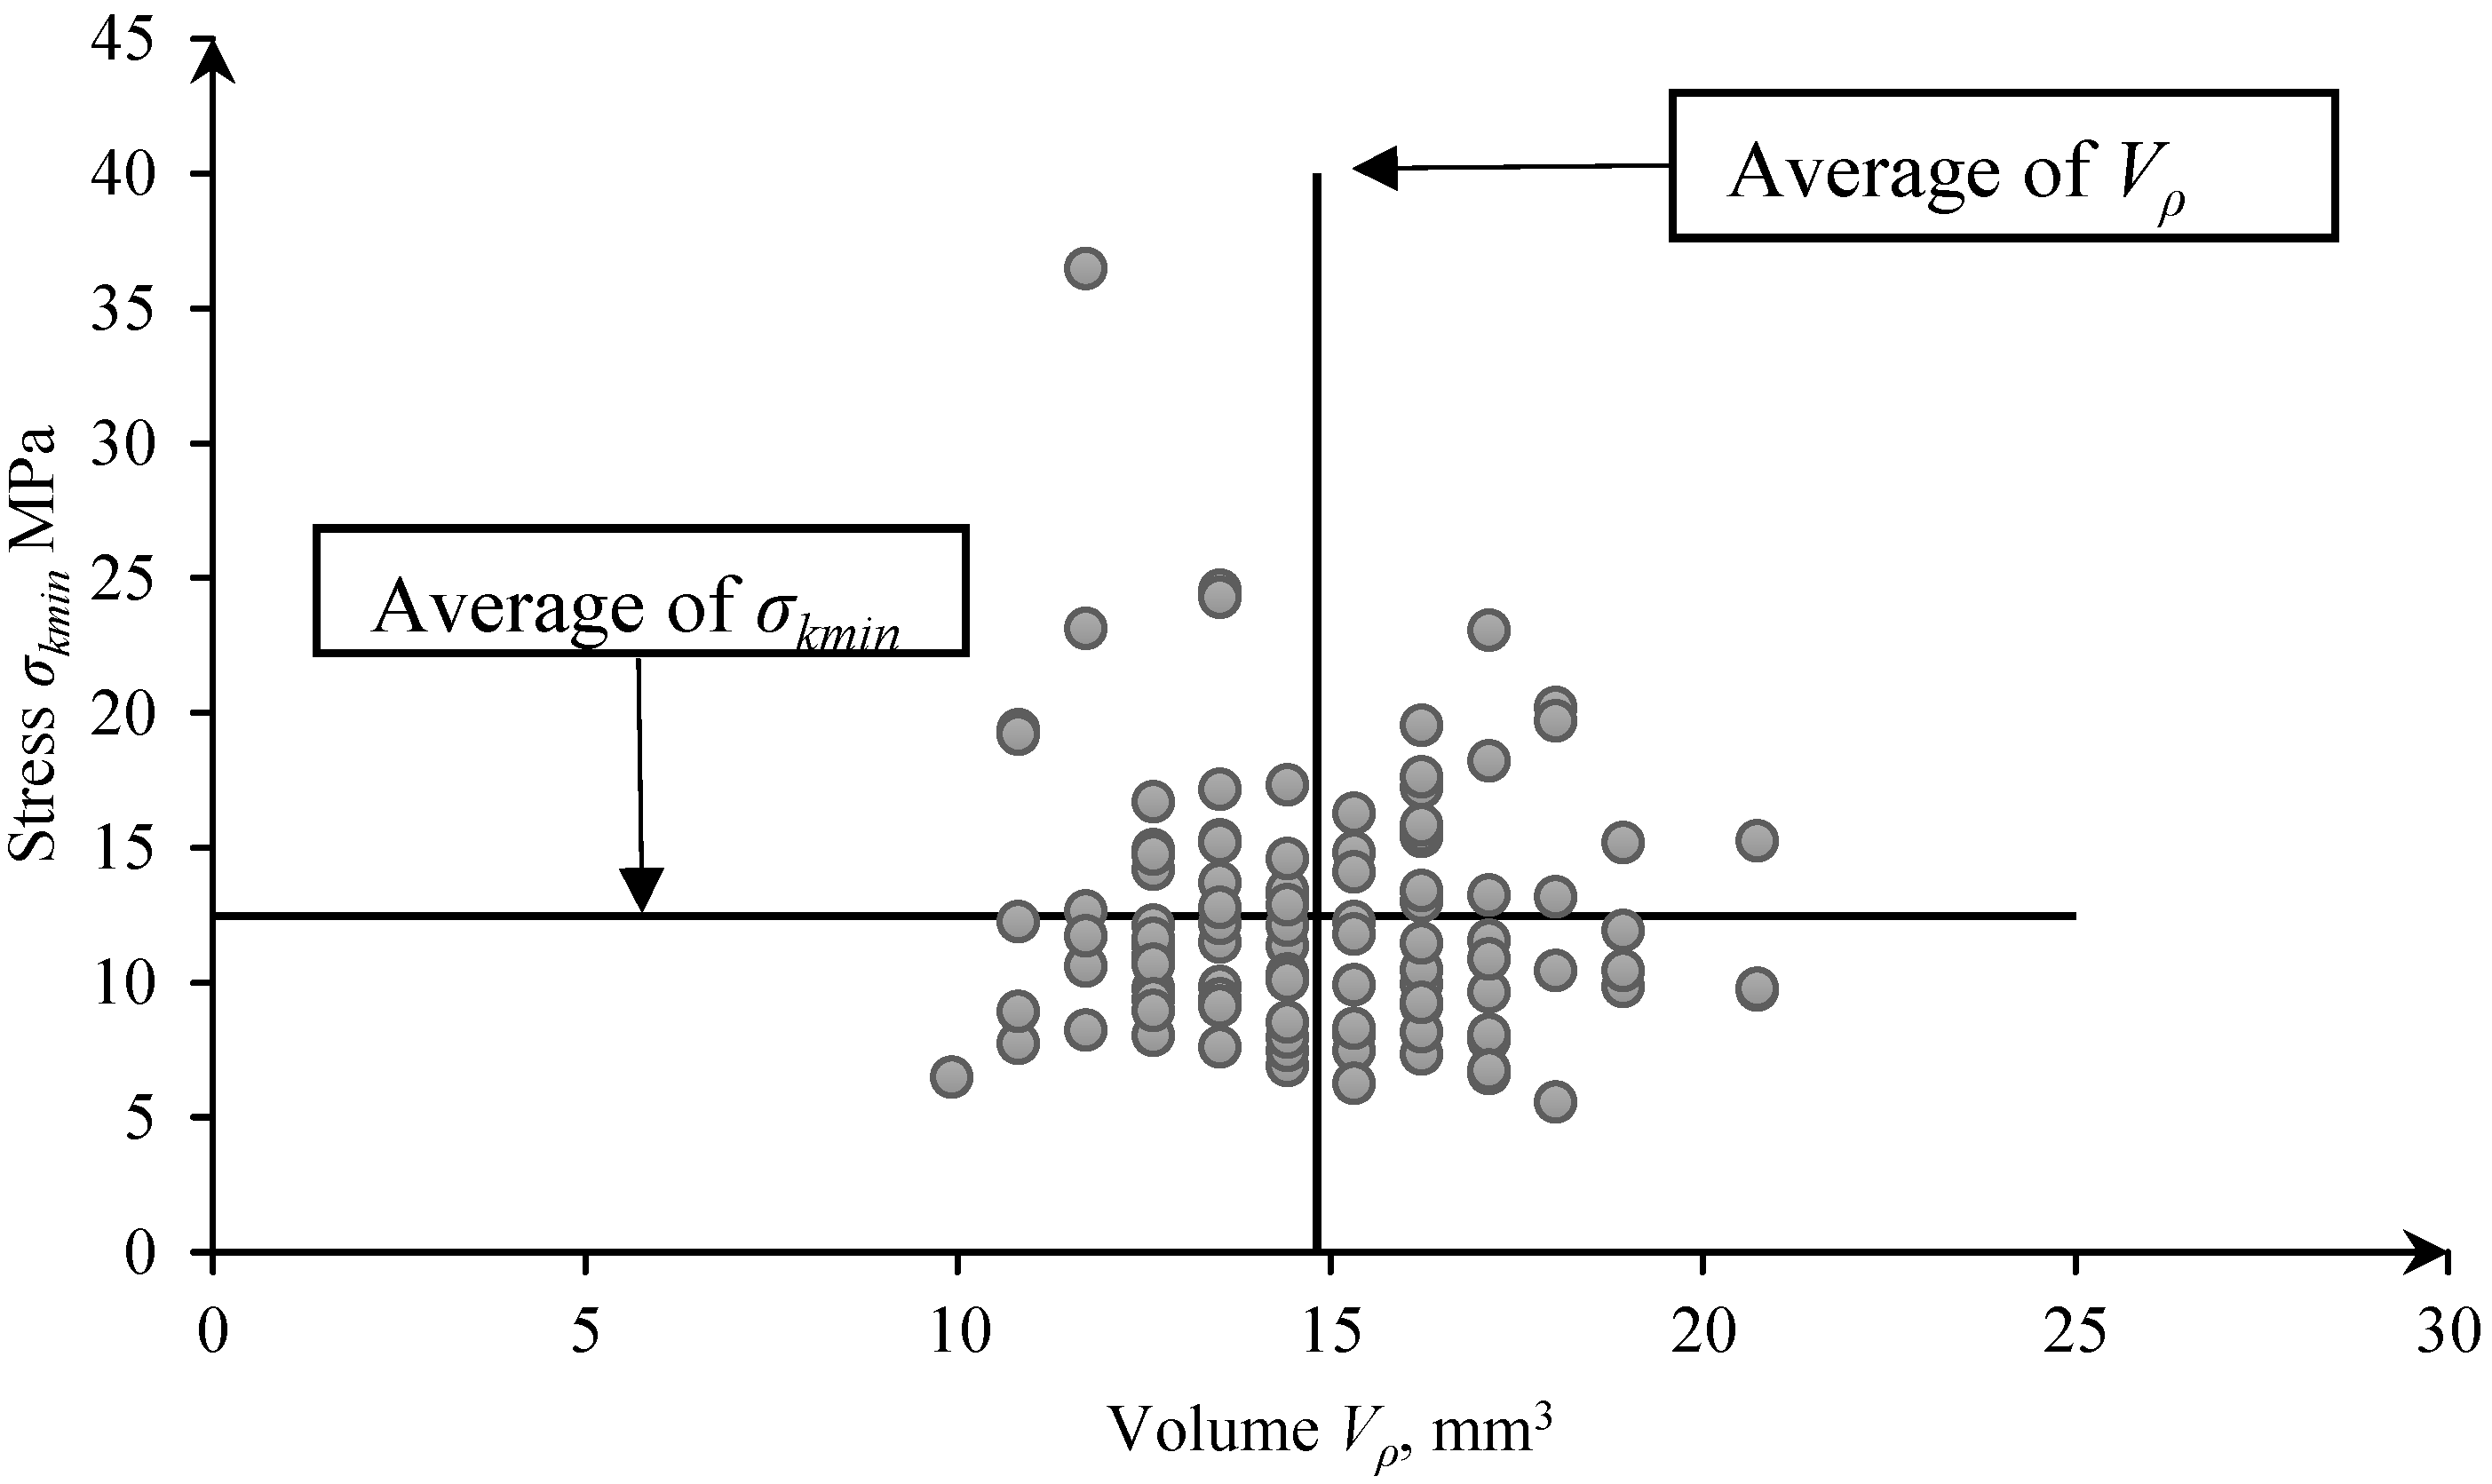
| σkmin | minimal compressive stress, MPa |
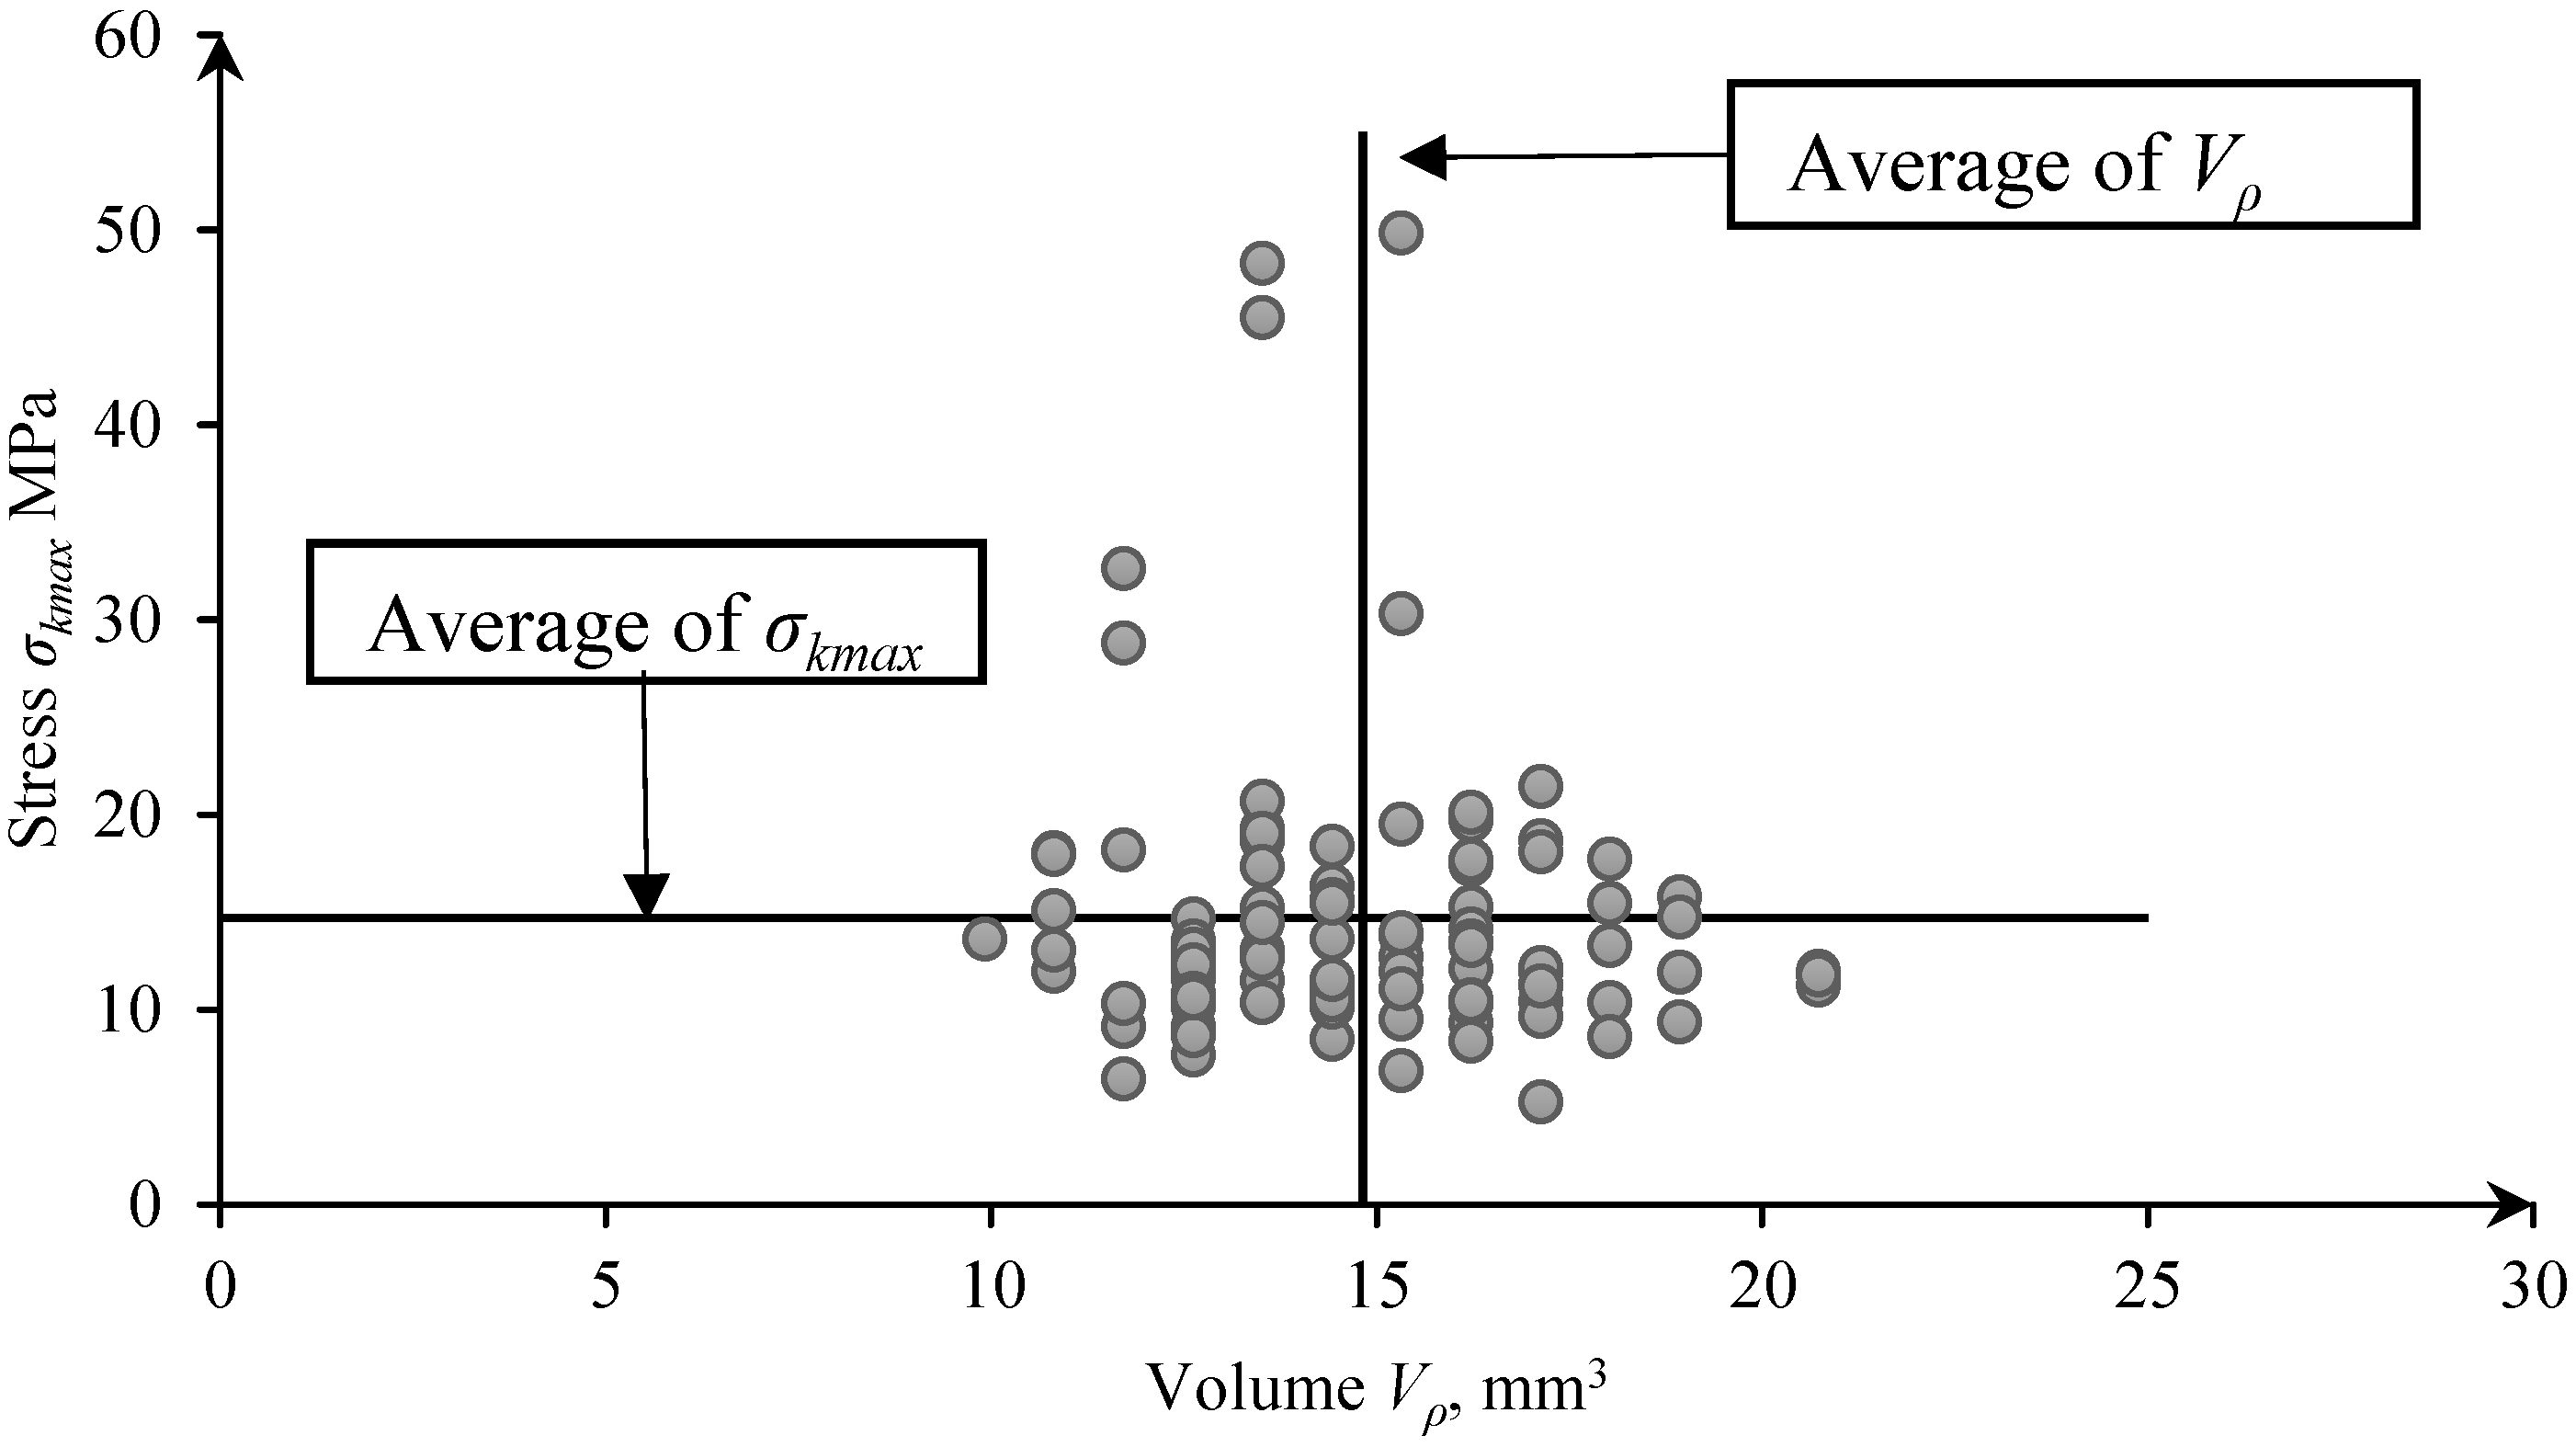
| σkmax | maximal compressive stress, MPa |
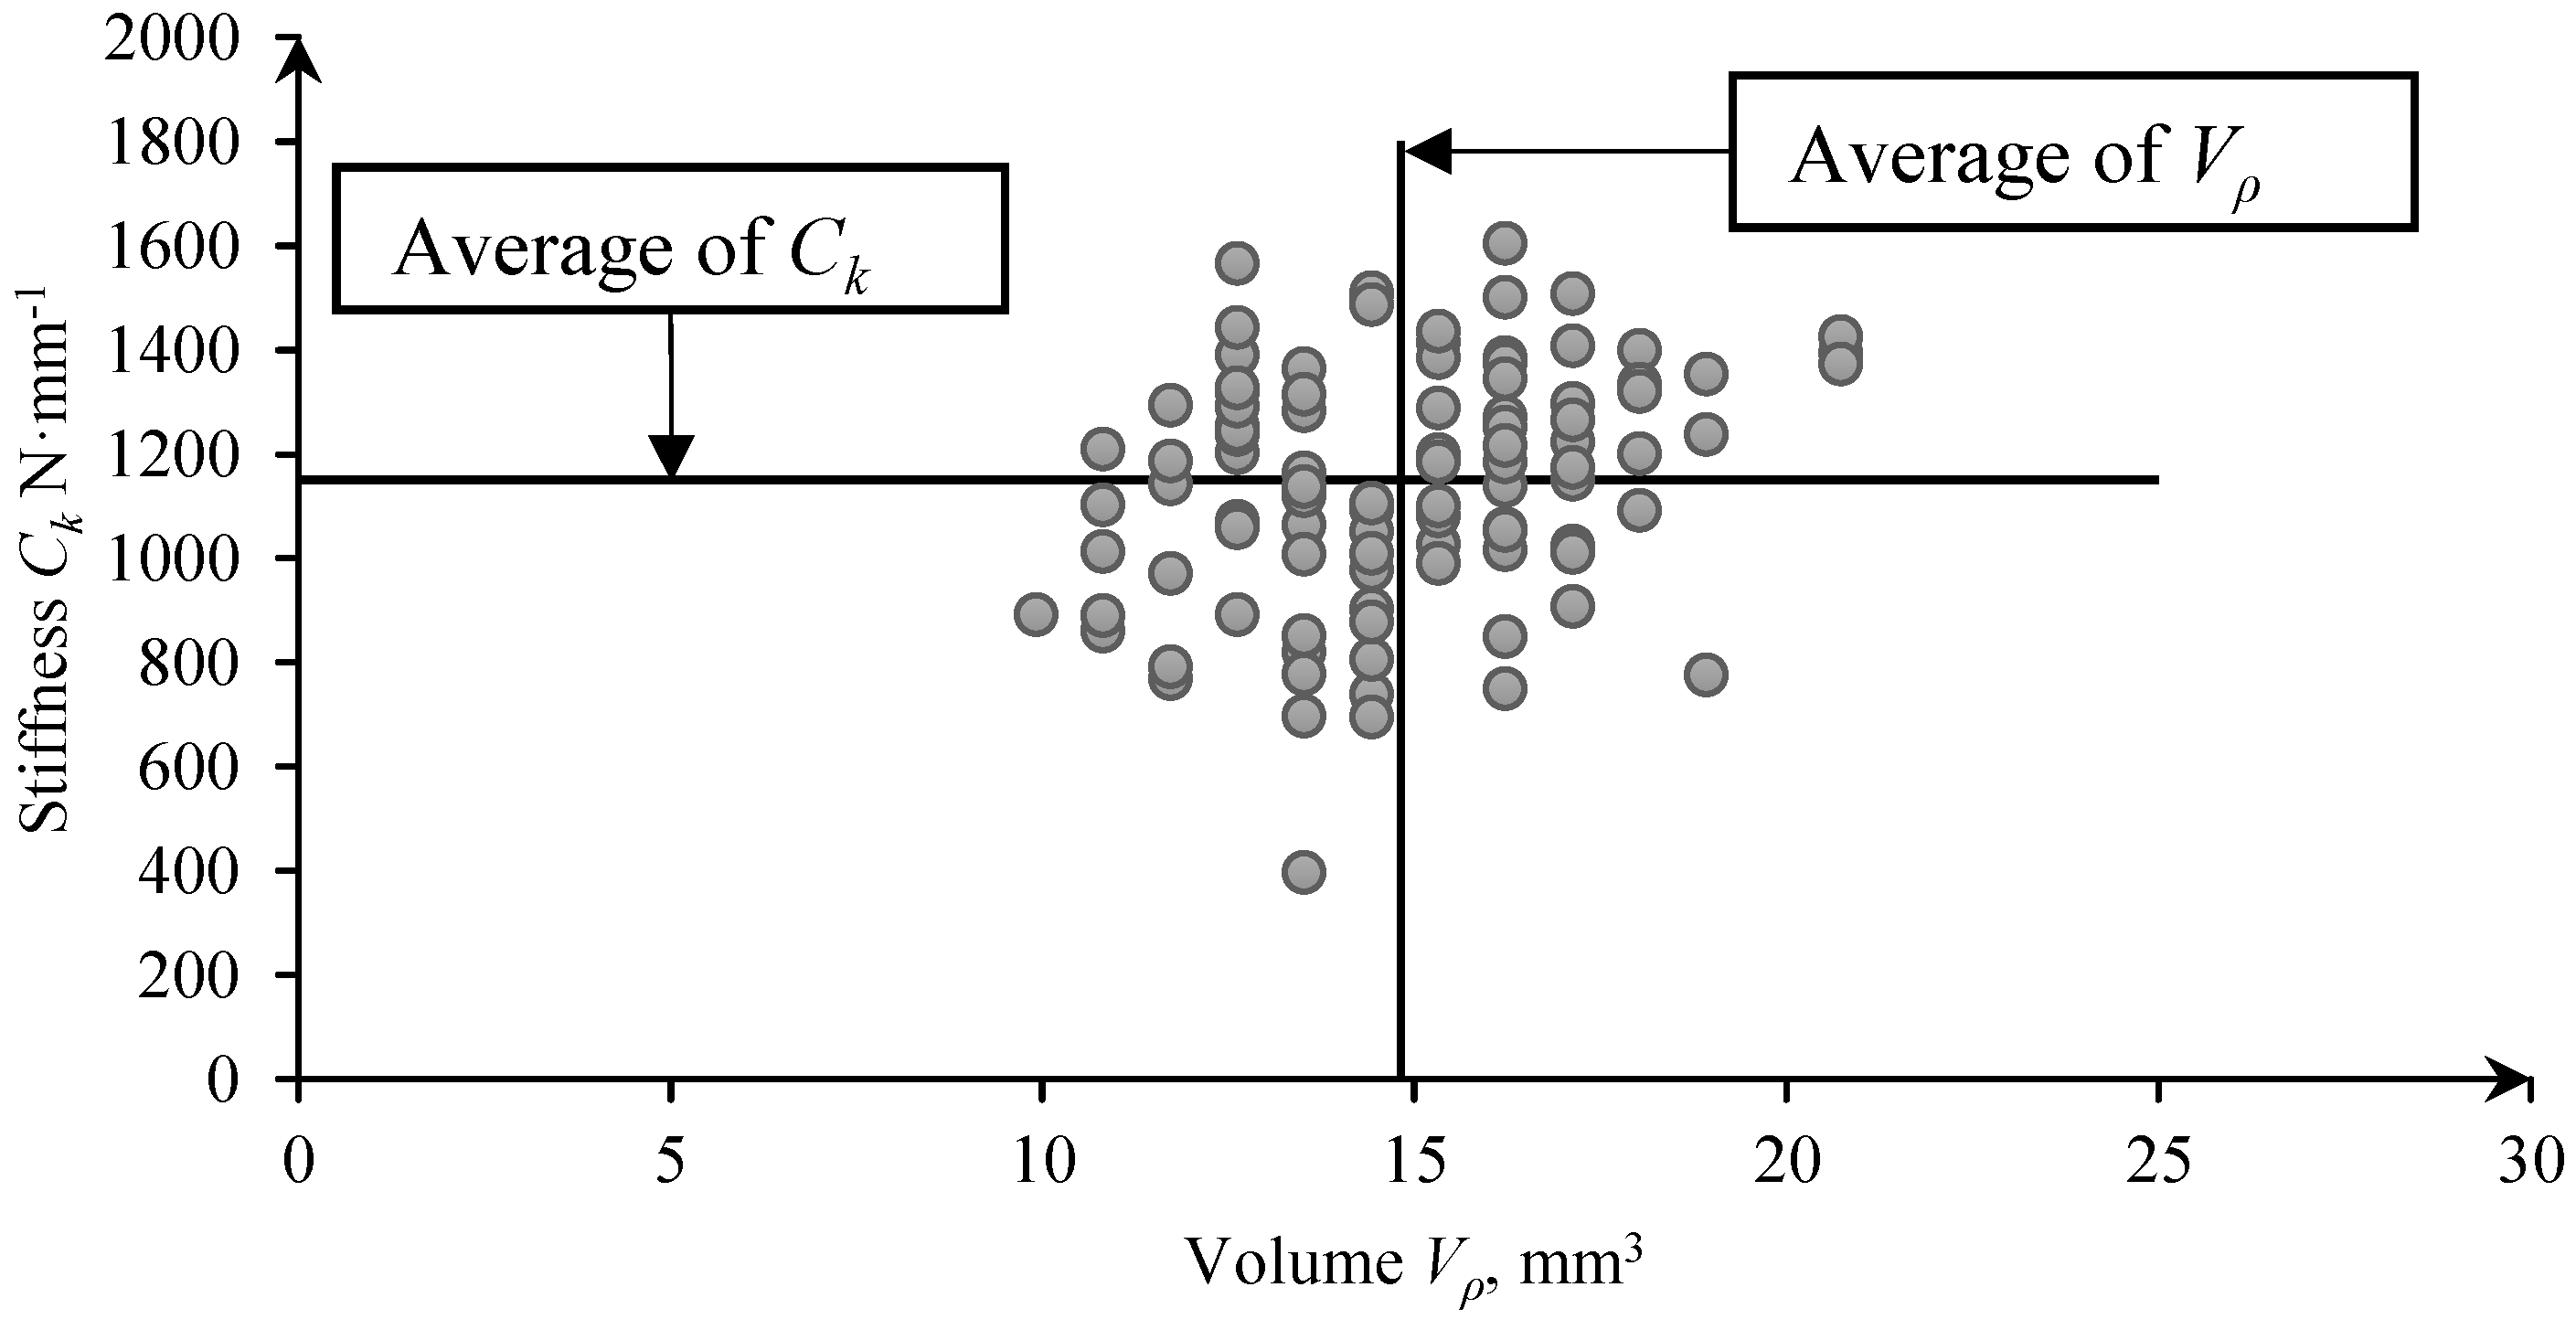
| Ck | stiffness, N·mm−1 |
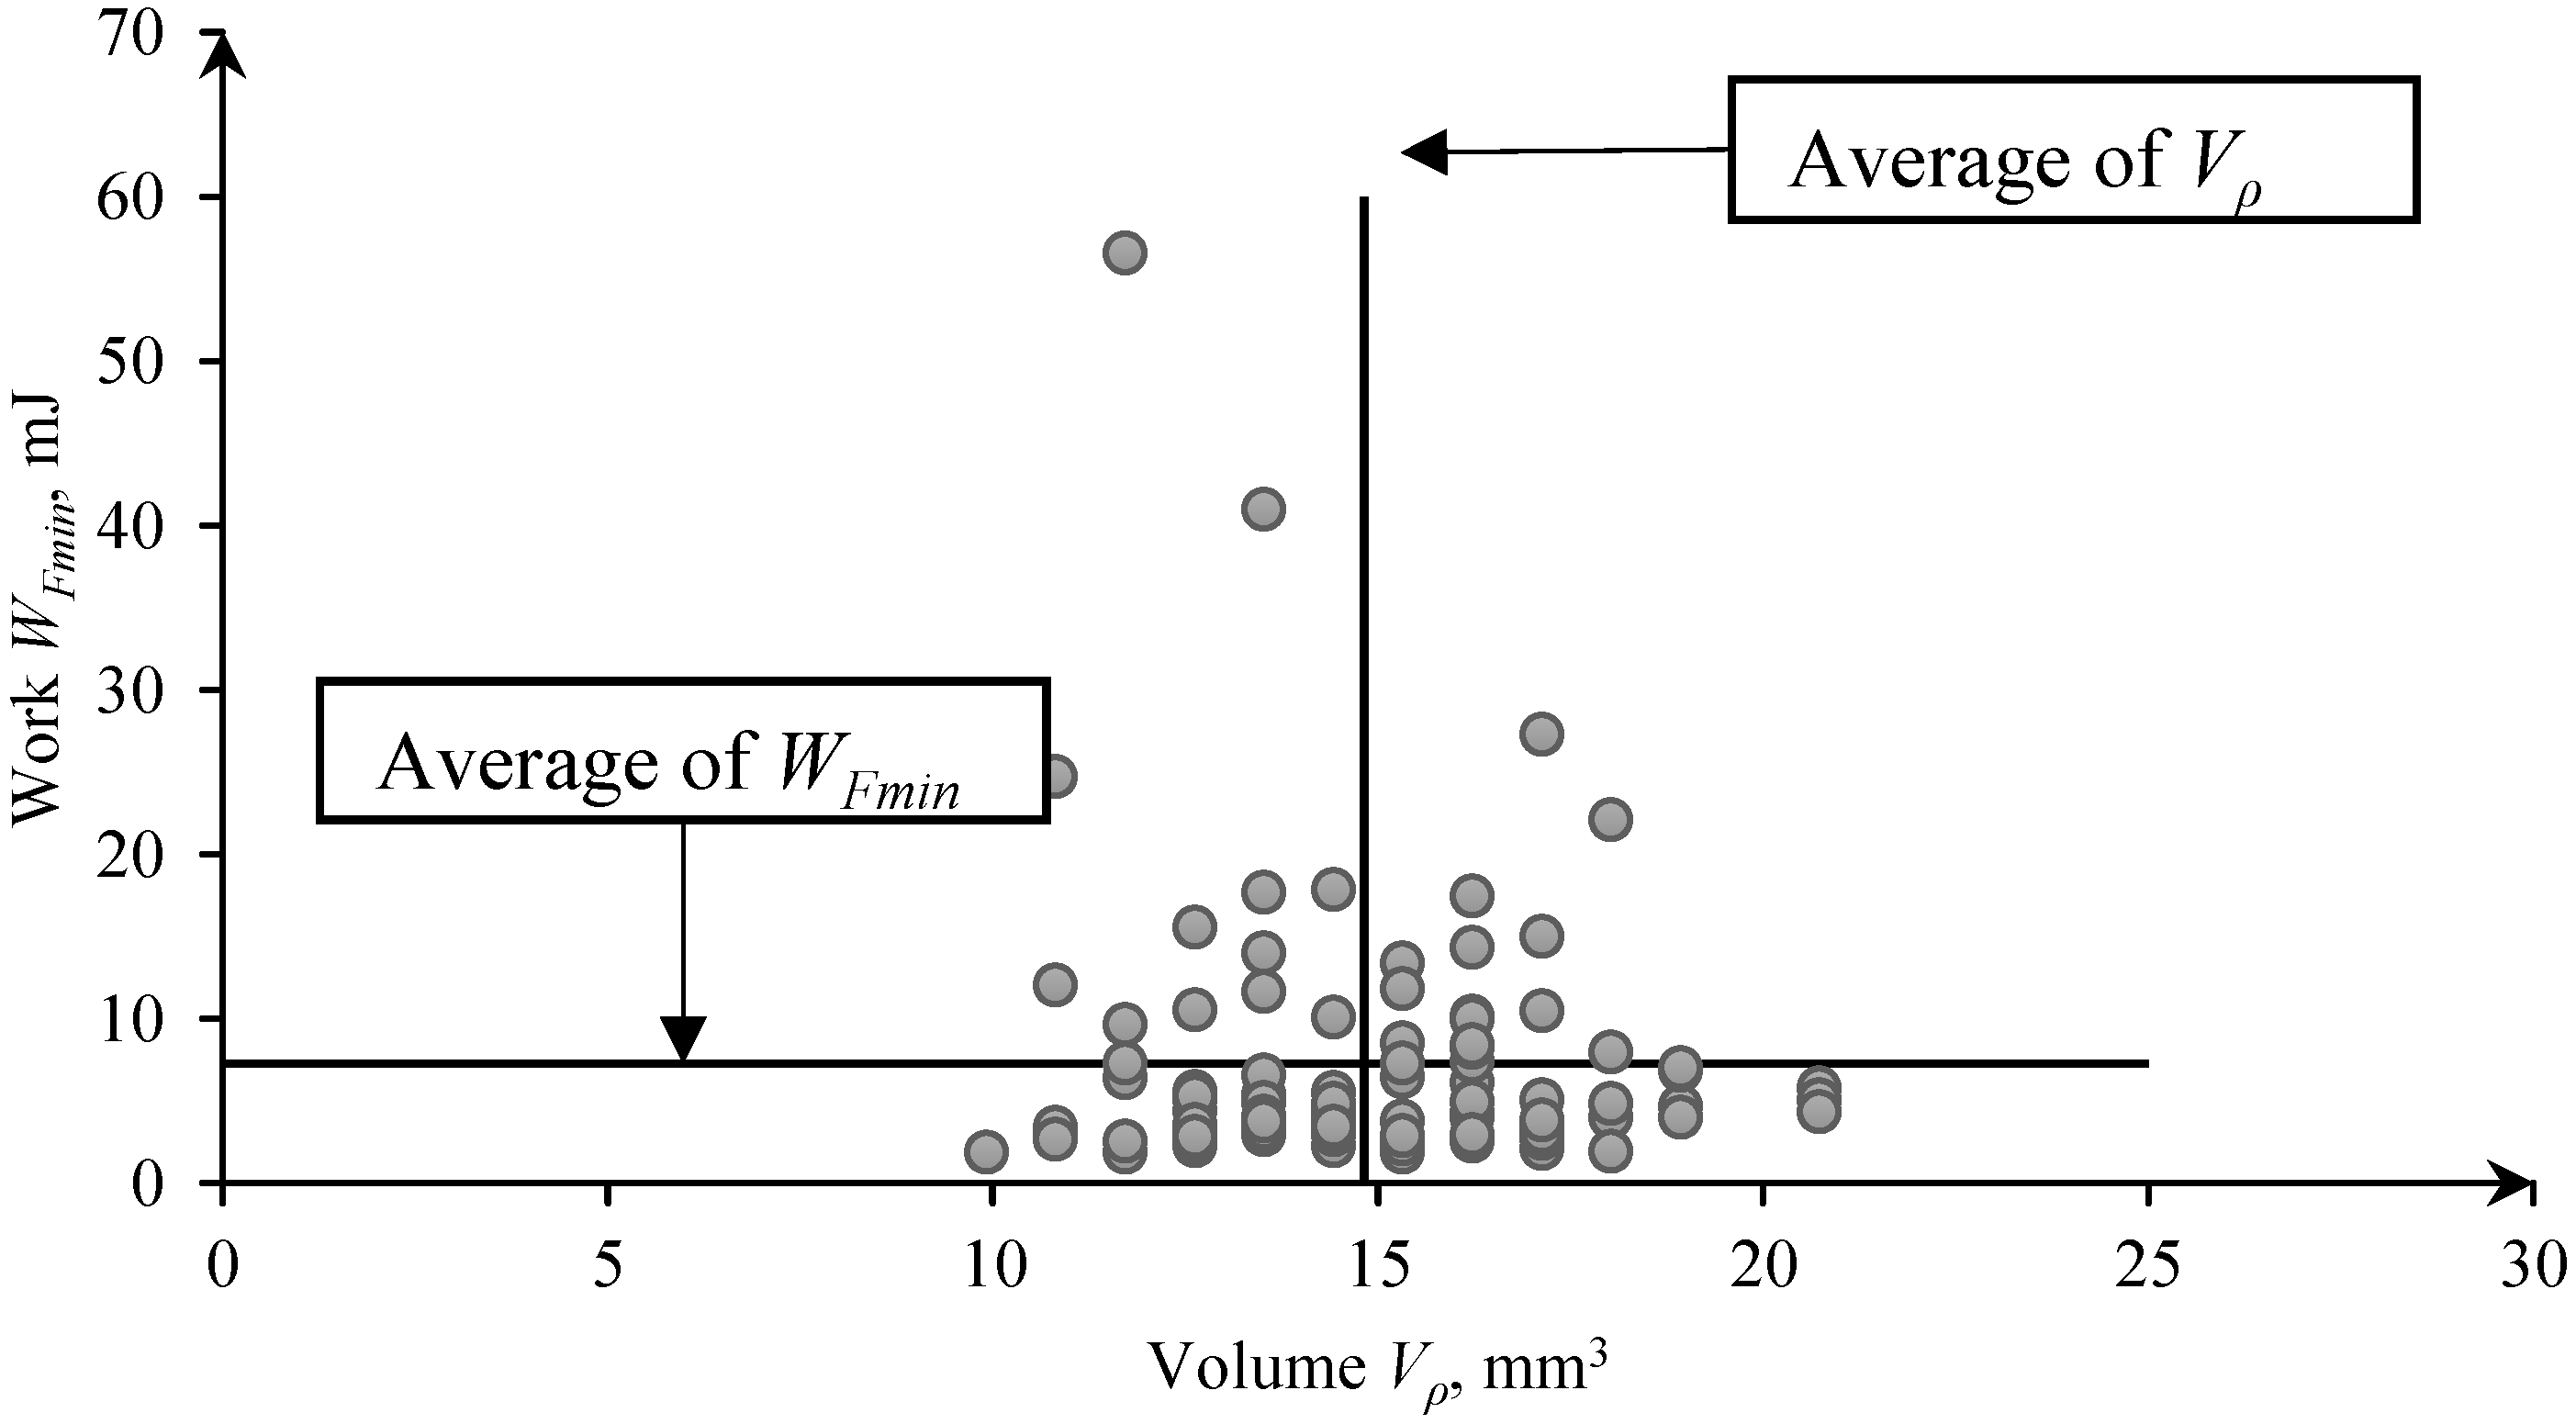
| WFmin | work for the first rupture, mJ |
| WFmax | rupture work, mJ |
References
- Tomporowski, A.; Flizikowski, J.; Kruszelnicka, W. A new concept of roller-plate mills. Przem. Chem. 2017, 96, 1750–1755. [Google Scholar]
- Tomporowski, A.; Flizikowski, J.; Wełnowski, J.; Najzarek, Z.; Topoliński, T.; Kruszelnicka, W.; Piasecka, I.; Śmigiel, S. Regeneration of rubber waste using an intelligent grinding system. Przem. Chem. 2018, 97, 1659–1665. [Google Scholar]
- Flizikowski, J.B.; Mrozinski, A.; Tomporowski, A. Active monitoring as cognitive control of grinders design. In AIP Conference Proceedings; AIP Publishing: Melville, NY, USA, 2017; Volume 1822, p. 020006. [Google Scholar]
- Marczuk, A.; Caban, J.; Savinykh, P.; Turubanov, N.; Zyryanov, D. Maintenance research of a horizontal ribbon mixer. Eksploat. Niezawodn. 2017, 19, 121–125. [Google Scholar] [CrossRef]
- Tomporowski, A.; Flizikowski, J. Motion characteristics of a multi-disc grinder of biomass grain. Przem. Chem. 2013, 92, 498–503. [Google Scholar]
- Bochat, A.; Zastempowski, M. Kinematics and dynamics of the movement of the selected constructions of the disc cutting assemblies. In Proceedings of the Engineering Mechanics 2017, Brno University of Technology, Faculty of Mechanical Engineering, Institute of Solid Mechanics, Mechatronics and Biomechanics, Brno-Svratka, Czech Republic, 15–18 May 2017; Volume 23, pp. 170–173. [Google Scholar]
- Zastempowski, M.; Bochat, A. Modeling of cutting process by the shear-finger cutting block. Appl. Eng. Agric. 2014, 30, 347–353. [Google Scholar]
- Flizikowski, J.; Macko, M. Method of estimation of efficiency of quasi-cutting of recycled opto-telecommunication pipes. Polimery 2001, 46, 53–59. [Google Scholar] [CrossRef]
- Kaczmarczyk, J.; Grajcar, A. Numerical simulation and experimental investigation of cold-rolled steel cutting. Materials 2018, 11, 1263. [Google Scholar] [CrossRef] [PubMed] [Green Version]
- Kruszelnicka, W.; Shchur, T. Study of rice and maize grains grinding energy. TEKA Comm. Mot. Energetics Agric. 2018, 18, 71–74. [Google Scholar]
- Szyszlak-Barglowicz, J.; Zajac, G. Distribution of heavy metals in waste streams during combustion of Sida hermaphrodita (L.) Rusby biomass. Przem. Chem. 2015, 94, 1723–1727. [Google Scholar]
- Szyszlak-Bargłowicz, J.; Zając, G.; Słowik, T. Hydrocarbon emissions during biomass combustion. Polish J. Environ. Stud. 2015, 24, 1349–1354. [Google Scholar] [CrossRef]
- Kowalczyk-Jusko, A.; Kowalczuk, J.; Szmigielski, M.; Marczuk, A.; Jozwiakowski, K.; Zarajczyk, K.; Maslowski, A.; Slaska-Grzywna, B.; Sagan, A.; Zarajczyk, J. Quality of biomass pellets used as fuel or raw material for syngas production. Przem. Chem. 2015, 94, 1835–1837. [Google Scholar]
- Rudnicki, J.; Zadrag, R. Technical state assessment of charge exchange system of self-ignition engine, based on the exhaust gas composition testing. Polish Marit. Res. 2017, 24, 203–212. [Google Scholar] [CrossRef] [Green Version]
- Nizamuddin, S.; Qureshi, S.S.; Baloch, H.A.; Siddiqui, M.T.H.; Takkalkar, P.; Mubarak, N.M.; Dumbre, D.K.; Griffin, G.J.; Madapusi, S.; Tanksale, A. Microwave hydrothermal carbonization of rice straw: Optimization of process parameters and upgrading of chemical, fuel, structural and thermal properties. Materials 2019, 12, 403. [Google Scholar] [CrossRef] [PubMed] [Green Version]
- Chang, K.-L.; Wang, X.-Q.; Han, Y.-J.; Deng, H.; Liu, J.; Lin, Y.-C. Enhanced enzymatic hydrolysis of rice straw pretreated by oxidants assisted with photocatalysis technology. Materials 2018, 11, 802. [Google Scholar] [CrossRef] [PubMed] [Green Version]
- Mannheim, V. Examination of thermic treatment and biogas processes by Lca. Ann. Fac. Eng. Hunedoara Int. J. Eng. 2014, 12, 225–234. [Google Scholar]
- Zeng, Y.; Jia, F.; Xiao, Y.; Han, Y.; Meng, X. Discrete element method modelling of impact breakage of ellipsoidal agglomerate. Powder Technol. 2019, 346, 57–69. [Google Scholar] [CrossRef]
- Sadeghi, M.; Araghi, H.A.; Hemmat, A. Physico-mechanical properties of rough rice (Oryza sativa L.) Grain as affected by variety and moisture content. Agric. Eng. Int. CIGR J. 2010, 12, 129–136. [Google Scholar]
- Cao, W.; Nishiyama, Y.; Koide, S. Physicochemical, mechanical and thermal properties of brown rice grain with various moisture contents. Int. J. Food Sci. Technol. 2004, 39, 899–906. [Google Scholar] [CrossRef]
- Chattopadhyay, P.K.; Hamann, D.D.; Hammerle, J.R. Effect of deformation rate and moisture content on rice grain stiffness1. J. Food Process Eng. 1980, 4, 117–121. [Google Scholar] [CrossRef]
- Buggenhout, J.; Brijs, K.; Celus, I.; Delcour, J.A. The breakage susceptibility of raw and parboiled rice: A review. J. Food Eng. 2013, 117, 304–315. [Google Scholar] [CrossRef]
- Esehaghbeygi, A.; Daeijavad, M.; Afkarisayyah, A.H. Breakage susceptibility of rice grains by impact loading. Appl. Eng. Agric. 2009, 25, 943–946. [Google Scholar] [CrossRef]
- Sarker, M.S.H.; Hasan, S.M.K.; Ibrahim, M.N.; Aziz, N.A.; Punan, M.S. Mechanical property and quality aspects of rice dried in industrial dryers. J. Food Sci. Technol. 2017, 54, 4129–4134. [Google Scholar] [CrossRef] [PubMed]
- Talab, K.T.; Ibrahim, M.N.; Spotar, S.; Talib, R.A.; Muhammad, K. Glass transition temperature, mechanical properties of rice and their relationships with milling quality. Int. J. Food Eng. 2012, 8. [Google Scholar]
- Nasirahmadi, A.; Abbaspour-Fard, M.H.; Emadi, B.; Khazaei, N.B. Modelling and analysis of compressive strength properties of parboiled paddy and milled rice. Int. Agrophysics 2014, 28, 73–83. [Google Scholar] [CrossRef] [Green Version]
- Bonazzi, C.; Courtois, F. Impact of drying on the mechanical properties and crack formation in rice. In Modern Drying Technology; John Wiley & Sons, Ltd.: Hoboken, NJ, USA, 2011; pp. 21–49. ISBN 978-3-527-63166-7. [Google Scholar]
- Li, Y.-N.; Li, K.; Ding, W.-M.; Chen, K.-J.; Ding, Q. Correlation between head rice yield and specific mechanical property differences between dorsal side and ventral side of rice kernels. J. Food Eng. 2014, 123, 60–66. [Google Scholar] [CrossRef]
- Shu, Y.-J.; Liou, N.-S.; Moonpa, N.; Topaiboul, S. Investigating damage properties of rice grain under compression load. In Proceedings of the International Conference on Experimental Mechanics 2013 and Twelfth Asian Conference on Experimental Mechanics, Bangkok, Thailand, 25–27 November 2013; International Society for Optics and Photonics: Bangkok, Thailand, 2014; Volume 9234, p. 923402. [Google Scholar]
- Zareiforoush, H.; Komarizadeh, M.H.; Alizadeh, M.R.; Tavakoli, H.; Masoumi, M. Effects of moisture content, loading rate, and grain orientation on fracture resistance of paddy (Oryza sativa L.) grain. Int. J. Food Prop. 2012, 15, 89–98. [Google Scholar] [CrossRef]
- Zareiforoush, H.; Komarizadeh, M.H.; Alizadeh, M.R. Mechanical properties of paddy grains under quasi-static compressive loading. N. Y. Sci. J. 2010, 3, 40–46. [Google Scholar]
- Pandiselvam, R.; Thirupathi, V.; Mohan, S. Engineering properties of rice. Agric. Eng. 2015, XL, 69–78. [Google Scholar]
- Ligaj, B.; Szala, G. Obliczanie zapotrzebowania energii w procesach rozdrabniania materiałów ziarnistych na przykładzie ziaren zbóż. Acta Mech. Autom. 2009, 3, 97–99. [Google Scholar]
- Tumuluru, J.S.; Tabil, L.G.; Song, Y.; Iroba, K.L.; Meda, V. Grinding energy and physical properties of chopped and hammer-milled barley, wheat, oat, and canola straws. Biomass Bioenergy 2014, 60, 58–67. [Google Scholar] [CrossRef]
- Wiercioch, M.; Niemiec, A.; Roma, L. The impact of wheat seeds size on energy consumption of their grinding process. Inzyneria Rol. 2008, 103, 367–372. [Google Scholar]
- Warechowska, M. Some physical properties of cereal grain and energy consumption of grinding. Agric. Eng. 2014, 1, 239–249. [Google Scholar]
- Dziki, D.; Laskowski, J. Influence of wheat kernel geometrical properties on the mechanical properties and grinding ability. Acta Agrophysica 2003, 2, 735–742. [Google Scholar]
- Warechowska, M.; Warechowski, J.; Skibniewska, K.A.; Siemianowska, E.; Tyburski, J.; Aljewicz, M.A. Environmental factors influence milling and physical properties and flour size distribution of organic spelt wheat. Tech. Sci. 2016, 19, 387–399. [Google Scholar]
- Dziki, D. Ocena energochłonności rozdrabniania ziarna pszenicy poddanego uprzednio zgniataniu. Inzyneria Rol. 2007, 11, 51–58. [Google Scholar]
- Dziki, D.; Cacak-Pietrzak, G.; Miś, A.; Jończyk, K.; Gawlik-Dziki, U. Influence of wheat kernel physical properties on the pulverizing process. J. Food Sci. Technol. 2014, 51, 2648–2655. [Google Scholar] [CrossRef] [PubMed] [Green Version]
- Greffeuille, V.; Mabille, F.; Rousset, M.; Oury, F.-X.; Abecassis, J.; Lullien-Pellerin, V. Mechanical properties of outer layers from near-isogenic lines of common wheat differing in hardness. J. Cereal Sci. 2007, 45, 227–235. [Google Scholar] [CrossRef]
- Greffeuille, V.; Abecassis, J.; Barouh, N.; Villeneuve, P.; Mabille, F.; Bar L’Helgouac’h, C.; Lullien-Pellerin, V. Analysis of the milling reduction of bread wheat farina: Physical and biochemical characterisation. J. Cereal Sci. 2007, 45, 97–105. [Google Scholar] [CrossRef]
- Yenge, G.B.; Kad, V.P.; Nalawade, S.M. Physical properties of maize (Zea mays L.) grain. J. Krishi Vigyan 2018, 7, 125–128. [Google Scholar] [CrossRef]
- Korczewski, Z.; Rudnicki, J. An energy approach to the fatigue life of ship propulsion systems marine 2015. In Proceedings of the VI International Conference on Computational Methods in Marine Engineering—The Conference Proceedings, Rome, Italy, 14–17 July 2015; Salvatore, F., Broglia, R., Muscari, R., Eds.; International Center Numerical Methods Engineering: Barcelona, Spain, 2015; pp. 490–501, ISBN 978-84-943928-6-3. [Google Scholar]
- Lu, R.; Siebenmorgen, T.J. Correlation of head rice yield to selected physical and mechanical properties of rice kernels. Trans. ASAE 1995, 38, 889–894. [Google Scholar] [CrossRef] [Green Version]


| Parameter | Average | Standard Deviation | Median |
|---|---|---|---|
| Minimal crushing force Fmin, kg m·s−2 | 117.29 | 40.71 | 111.23 |
| Maximal crushing force Fmax, kg·m·s−2 | 174.99 | 80.38 | 158.12 |
| Minimal compressive stress σkmin, MPa | 12.47 | 4.83 | 11.53 |
| Maximal compressive stress σkmax, MPa | 14.71 | 7.45 | 12.72 |
| Stiffness Ck, N·mm−1 | 1275.07 | 247.72 | 1322.11 |
| Work for the first rupture WFmin, mJ | 7.26 | 7.86 | 4.81 |
| Rupture work WFmax, mJ | 28.03 | 20.36 | 22.46 |
| Fmin1 | Fmax2 | Ck3 | σmin4 | σmax5 | WFmin6 | WFmax 7 | ||
|---|---|---|---|---|---|---|---|---|
| Vρ | rhoSpearman coefficient | 0.172 | 0.176 | 0.242 | −0.018 | −0.052 | 0.071 | −0.057 |
| Significance | 0.088 | 0.08 | 0.015 | 0.859 | 0.604 | 0.482 | 0.573 | |
| Number of samples n | 100 | 100 | 100 | 100 | 100 | 100 | 100 | |
| rhoSpearman coefficient | 0.220 | 0.062 | 0.005 | −0.280 | −0.104 | 0.185 | −0.138 | |
| Vs | Significance | 0.028 | 0.543 | 0.958 | 0.005 | 0.305 | 0.066 | 0.174 |
| Number of samples n | 100 | 100 | 100 | 100 | 100 | 100 | 100 |
© 2020 by the authors. Licensee MDPI, Basel, Switzerland. This article is an open access article distributed under the terms and conditions of the Creative Commons Attribution (CC BY) license (http://creativecommons.org/licenses/by/4.0/).
Share and Cite
Kruszelnicka, W.; Marczuk, A.; Kasner, R.; Bałdowska-Witos, P.; Piotrowska, K.; Flizikowski, J.; Tomporowski, A. Mechanical and Processing Properties of Rice Grains. Sustainability 2020, 12, 552. https://0-doi-org.brum.beds.ac.uk/10.3390/su12020552
Kruszelnicka W, Marczuk A, Kasner R, Bałdowska-Witos P, Piotrowska K, Flizikowski J, Tomporowski A. Mechanical and Processing Properties of Rice Grains. Sustainability. 2020; 12(2):552. https://0-doi-org.brum.beds.ac.uk/10.3390/su12020552
Chicago/Turabian StyleKruszelnicka, Weronika, Andrzej Marczuk, Robert Kasner, Patrycja Bałdowska-Witos, Katarzyna Piotrowska, Józef Flizikowski, and Andrzej Tomporowski. 2020. "Mechanical and Processing Properties of Rice Grains" Sustainability 12, no. 2: 552. https://0-doi-org.brum.beds.ac.uk/10.3390/su12020552