Adapting to Climate Change in Semi-Arid Rural Areas: A Case of the Limpopo Basin Part of Botswana


1
Biological Science Department, Faculty of Science, University of Botswana, Private Bag, Gaborone UB0022, Botswana
2
History Department, Faculty of Humanities, University of Botswana, Private Bag, Gaborone UB0022, Botswana
*
Author to whom correspondence should be addressed.
Sustainability 2020, 12(20), 8292; https://0-doi-org.brum.beds.ac.uk/10.3390/su12208292
Submission received: 30 July 2020
/
Revised: 26 August 2020
/
Accepted: 31 August 2020
/
Published: 9 October 2020
(This article belongs to the Special Issue Indigenous Resilience and Indigenous Knowledge Systems in the context of Climate Change)
Abstract
:Climate change and anthropogenic pressure are increasingly modifying and interfering with ecosystem functions and limiting the delivery of ecosystem products, livelihoods, and adaptive response capacity in many developing countries. We identify measures by which local people in the semi-arid Limpopo Basin part of Botswana are responding to climate change and fluctuations in ecosystem products and examine socio-economic attributes of households influencing their adoption and discuss their adequacy. Our study used a case study of Bobirwa sub-district and employed key informant and household interviews to collect qualitative and quantitative data. Thematic analysis was used to analyze textural data from key informant interviews while frequencies, proportions, and Chi-squared tests were used to analyze the adoption of different strategies. A multinomial logit (MNL) regression was used to analyze the influence of several social, demographic, and economic attributes of households on household adaptation choices. We attributed the high adoption of on-farm adaptations to the simultaneous influence of more severe droughts and the free input support through the government’s Integrated Support Programme for Arable Agriculture (ISPAAD). Our findings suggest that current adaptations were inadequate and implementation of the ISPAAD programme required fine-tuning to be more effective. Results of the MNL regression provide critical information on the barriers and enablers of adaptation in the sub-district yet offer important entry points for improving current adaptations. Therefore, the government needs to put measures that encourage investments in the processing of ecosystem products in rural areas to broaden the livelihood base and possibly reduce overdependence on rainfed agriculture. However, the extent to which this can be achieved depends on the level of government commitment to supporting local initiatives to addressing the climate change threat.
1. Introduction
Climate is a unique but important exogenous determinant of vegetation and crop productivity. Climate change threatens ecosystem products, food production, and food security in Bobirwa sub-district similar to what has been found in other parts of the world [1]. For developing countries, where resilience to changes in climate is weak, the consequences are even more pronounced and widespread [2]. Ecosystem products and subsistence agriculture are critical to alleviating extreme poverty and significantly contribute to rural livelihoods in many developing countries [3]. However, climate change impacts on local ecosystems threaten the adaptive capacity of poor people [4,5,6].
Previous studies have highlighted threats imposed by adverse climate on agricultural productivity and vegetation-based provisioning services as shown in studies elsewhere [7]. The impacts of adverse climate and human activities in Bobirwa sub-district which include fluctuations in biodiversity, ecosystems, and ecosystem products have been identified before [8]. The occurrence of extreme weather events such as droughts in Bobirwa sub-district could further limit the availability of ecosystem products such as Mopane caterpillars (Imbrasia belina) which were reported to significantly contribute to the income and food security among communities in Bobirwa sub-district and other areas elsewhere as also found by [9].
Studying current human adaptations may highlight challenges or inadequacies of human efforts which enable identification of more innovative ways of coping with climate change impacts [10,11]. Previous studies such as [12,13,14] found that human adaptations among the poor and marginalized in developing countries were sub-optimal and could easily surpass current performances. For ecological systems, biodiversity keeps adapting to the changing climate [15,16]. However, some species adapt faster than others and the less adaptable ones are increasingly threatened. Therefore, adaptations in natural systems can no longer be left to occur naturally given the increased interference from humans. This contrasts with human and semi-natural systems where adaptations are relatively easier to achieve. This is because measures often have shorter cycles than in natural systems which often have longer life cycles to achieve the same [17]. Therefore, measures that enforce certain regulations are required to help socio-ecological systems to adapt [18]. Botswana is already experiencing the adverse impacts of climate change as evident from the frequent droughts, erratic rainfall patterns, heatwaves, and warming temperatures [19]. With the high dependence of livelihoods in rural areas on agriculture and ecosystem products, the frequent exposure to climate change impacts threatens livelihoods, particularly of the poor who often have low adaptive capacities. Recent studies have shown the increased vulnerability of Botswana to climate change [20]. The most vulnerable livelihoods are those that depend on agriculture, biodiversity, water, and other natural products. This highlights an urgent need for these sectors to effectively adapt [19]. Though local communities in Botswana have a long experience with droughts, this could imply that they have in place measures to minimize or moderate these impacts. However, the vulnerability of agriculture, biodiversity, water, and other natural products which underpin livelihoods in many developing countries not only depends on the extent and magnitude of climate change but also on society’s adaptive capacity [21].
While the choice and extent of adaptation may highlight the capacity of humans to adapt to the multiple stresses caused by climate change, enhancing such capacities requires an understanding of the factors which influence adaptation decisions. This is a critical step towards seeking ways to improve the resilience to the incremental impacts caused by climate change. Despite several studies such as [21,22] agreeing that awareness of the changes in climate is critical to adaptation decisionmaking, the same cannot be said for semi-arid areas where indigenous people have experienced impacts similar to climate change for many years. As climate change adaptation is at a local scale, the present study uses a case study of Bobirwa sub-district in the Limpopo Basin part of Botswana to understand the adaptation behaviour of indigenous people. This is important for providing context-specific recommendations that can enhance local adaptations; hence, the findings from this study cannot be generalized for other similar areas, in Botswana, or elsewhere.
Previous studies that analyzed adaptation to climate as well as the factors influencing the choice of adaptation strategies in developing countries have mainly focused on single livelihood strategies and have often been done at the regional level or across several countries [12,23,24]. Findings from such studies are not only highly aggregated but too general and limited to be useful for local communities where the threats of climate change are highly localized. This study, therefore, examined the actual household-level responses including the factors enabling or limiting the adoption of various strategies at the disposal of households in the semi-arid Bobirwa sub-district. The study employed an established approach in examining the adaptation behaviour of individuals and households in rural farming communities in Africa [14,25,26]. Precisely, this study applied the multinomial logit (MNL) regression model to examine the determinants of households’ adaptation choices. This technique has been extensively employed to analyze adaptation decisions involving multiple options. The advantage of MNL is that it is simpler and more sound than other available options such as the multinomial probit (MNP) [23]. The analysis was guided by the following research questions:
- −
- What are the socio-economic attributes of the households in the semi-arid Bobirwa sub-district?
- −
- How are local people responding to differential impacts of adverse climate and fluctuations in key provisioning ecosystem services (ES) in Bobirwa sub-district?
- −
- What is the current extent of adaptation by households in Bobirwa sub-district?
- −
- Which socio-economic attributes and factors influence household adaptation choices and behaviour of households in Bobirwa sub-district?
2. Materials and Methods
2.1. Study Area
The Limpopo River Basin part of Botswana is ecologically and economically significant to indigenous people and surrounding communities. Our case study, Bobirwa sub-district is situated between 28°09′10″ E to 29°21′42″ E and 22°35′17″ S to 21°35′56″ S and lies entirely within the Limpopo River Basin part of Botswana. The sub-district has an altitude ranging between 590 and 886 m making it the lowest part of Botswana hence has a network of channels that drain into the Limpopo River [8]. The sub-district boundary forms the national boundary with Zimbabwe to the north-east and South Africa to the south-east where the Limpopo River marks the boundary. Figure 1 below shows the location map of Bobirwa sub-district in Botswana, the villages and settlements in Bobirwa sub-district, as well as the location of Botswana in Africa. Although local ecosystems in the Limpopo Basin are essential to livelihoods and human well-being, they are greatly threatened by adverse climatic conditions as well as anthropogenic pressure. According to the 2011 National Population and Housing Census report, the population of Bobirwa sub-district was 71,936, comprising of 34,247 males and 37,689 females from 19,213 households with an average household size of 3.74 and a population density of 5.05 people/km2 [27].
The study area is highly susceptible to droughts, erratic rainfall fluctuating well below 400 mm/year in most years [20]. The recent (2010–2016) average minimum and maximum winter temperatures were 7.1 °C and 24.5 °C while for summer they were 17.6 °C and 31.3 °C, respectively. Thus, the average winter and summer temperatures were 15.8 °C and 24.5 °C, respectively. However, summer temperatures have often exceeded 38 °C in the last 5 years with occurrence of heatwaves [20]. Average potential evapotranspiration of 1400 mm has been estimated in Bobirwa sub-district which reduces rainfall effectiveness. Bobirwa sub-district experiences frequent droughts (once every 2–4 years) and extreme weather events such as heatwaves, strong storms, strong winds, and flash floods; therefore, it is considered a semi-arid hotspot [20,28]. High variability in both rainfall amount and intensity and recurrence of extended droughts and dry spells is characteristic of the study area. Nonetheless, Bobirwa sub-district experiences a less severe climate than other parts of the country which allows crop and livestock production as well as supporting considerable biodiversity which supports local livelihoods through the delivery of several timber and non-timber forest products [8,29]. The main crops grown under rain-fed conditions are maize, sorghum, millet, cowpeas, groundnuts, round nuts, and watermelons. Subsistence livestock and poultry production, a mainstay of the local economy, is mainly characterized by the rearing of cattle, goats, and chickens under free-range [8].
2.2. Data Collection
We used a household survey to collect quantitative and qualitative data for this study. A total of 310 semi-structured questionnaires were administered to heads of households who had been pre-selected through stratified and random sampling procedures. Eight villages were selected randomly from the sub-district and village lists were then obtained from the Bobonong Sub-Land Board. A proportionally representative sample was drawn from each village list using random numbers generated using R studio. Each village sample had an excess of 50% of the potential participants to cater for cases where the household head or household was not available as reflected on the lists from the Sub-Land Board. A request and notification for actual interviews were sent at least 2 weeks in advance through the traditional leadership led by Chiefs who, together with the Village Development Committees (VDCs), helped identify and notify the pre-selected participants. Reminders for interviews were sent again four days and a day before the actual interview date through the VDCs who then reminded the participants and confirmed their availability for the interview. For those not available or who decided not to participate, the VDC then replaced them with the next available participant from the list with the 50% extra participants for each selected ward. The chances of not finding participants were therefore very minimal.
Each head of the 310 randomly selected households in Bobirwa sub-district who consented to be interviewed were asked about their household demography and to state their income and income sources, household assets, farming implements, livestock owned, arable land owned, access to climate information and channels used, input use, and crop production. They were also asked to state their farm and off-farm coping strategies and adaptative responses to climate change and variability. Specifically, households were asked to report actual practices implemented against climate change and/or more severe droughts within the last 5–10 years in order to capture climate change-induced adaptation strategies. The adaptation options in the household questionnaire were partly informed by the key informant interviews and participatory mapping process. In the absence of the head of household (De jure head), the most senior member of the household available (De facto head) was interviewed.
2.3. Data Analyses
Descriptive statistics such as frequencies, means, proportions, and standard deviations were used to characterize and summarize household demographic, socio-economic attributes, and adaptation strategies adopted. The Chi-square test (χ2) at p = 0.05 level of significance was used to assess the statistical differences between adopters and non-adopters of different adaptation strategies as well as the extent of adoption. These analyses were accomplished using the Statistical Package for Social Sciences (IBM SPSS ver. 20). Factors influencing the uptake of the various adaptations by households were analyzed using Multinomial Logit (MNL) regression in STATA ver. 14.2 software. The significance of the influence of the factors was assessed at p = 0.05 while the explanatory power of the regression model was assessed using the F-statistic (pseudo R2). The sections below specify the MNL model and describe the variables used in the model and their hypothesized direction of influence.
2.3.1. Adaptation Model Specification
Considering the multiple adaptation response measures implemented by some of the households, and to facilitate analyses, the higher-level adaptation strategies were categorized as follows: 0 = Off-farm adaptations; 1 = Crop management practices; 2 = Livestock management practices; 3 = Land and soil management practices; and 4 = Water management practices. Given adaptation decisions that involve multiple options, and similar to several related studies such as [23,30,31] the study employed the multinomial logit regression (MNL) techniques to evaluate choice decisions.
The study applied the MNL model as follows.
Let be a random variable representing the choice of climate-related adaptation strategy adopted by any household. The assumption is that each household is faced with a set of distinct, mutually exclusive choices of climate change-induced adaptation strategies. The study also assumed that these adaptation strategies are influenced by several socio-economic attributes, household demography, perceptions on climate change, and other factors . The MNL model for adaptation choice illustrated below is specified by the relationship between the probability of choosing adaptation option , and a set of explanatory variables , e.g., socio-economic attributes, household demography, perceptions on climate change [32].
where is a vector of coefficients on each of the predictor variables . Equation (1) was normalized to remove indeterminacy in the model and then approximated to produce the j log-odd ratios similar to other studies elsewhere [25,30].
The dependent variable was therefore the log of each adaptation strategy in relation to the reference category (off-farm adaptations). Although the MNL model is relatively easy to compute, the resulting coefficients are difficult to interpret and misleading [32]. Therefore, in order to understand and interpret the influence of explanatory variables on the probability of choosing a particular adaptation strategy, marginal effects (ME) were computed following other studies [30,31]. The ME predict the changes in probability of a particular adaptation strategy being adopted with respect to a unit change in a particular explanatory variable [32]. The signs of the ME may be different from that of their corresponding MNL model coefficients. This is because the sign of the ME depends on both the sign and the magnitude of all the MNL model coefficients.
2.3.2. Model Variables, Variable Description, and Expected Influence
The dependent variable in the empirical model approximation for this analysis was the type of adaptation strategy adopted and implemented by any single household and initially had 6 possible options only, i.e., 0 = No adaptation; 1 = Crop management practices only; 2 = Livestock management practices only; 3 = Land and soil management practices only; 4 = Water management practices only; and 5 = Off-farm adaptations. However, after preliminary analyses of the responses, options 3 and 4 were combined due to fewer responses in the latter. For this model only, the option for “No adaptation” was dropped from the analyses as it had 2 cases only, which did not allow the statistical modelling [32]. Notes that each option of the dependent variable must have at least 12 cases to allow MNL modelling.
The following adaptation options were finally used for the analysis, and these included different combinations of multiple practices: 0 = Off-farm adaptations; 1 = Crop management practices only; 2 = Livestock management practices only; 3 = Land, soil, and water management practices only; 4 = Crop + Livestock management practices combined; 5 = Crop + Land, soil, and water management practices combined; and 6 = Crop + Livestock + Land, soil, and water management practices combined. The off-farm adaptation was used as the reference category. The choice of explanatory variables and the hypothesized direction of influence was guided by empirical literature such as [25,26,31]. Table 1 summarizes the explanatory variables used for empirical estimation together with their expected direction of influence on farm-level adaptations.
The expected direction of influence shows the hypothesized influence of each explanatory variable on the uptake of adaptation measures to address the impacts of climate change in Bobirwa sub-district. A positive (+) (negative (−)) sign shows that a particular explanatory variable is expected to enable (hinder) the adoption of specific measures against climate change. Other explanatory variables could either enable or hinder (+/−) the uptake of climate change adaptation measures.
3. Results
3.1. Socio-Economic Attributes of Respondents
Table 2 below is a characterization of the study participants and summarizes the key social and economic attributes which are assumed to be critical determinants of household adaptive capacity. Table 2 shows the frequencies, associated proportions (%) or means (as appropriate) of these attributes and the p-values of the Chi-square tests of differences among different respondents.
Table 2 shows that there were significantly more female-headed (79.7%) than male-headed (20.3%) households. The majority of main decision-makers (de jure) at the household level were also female (55.8%). Regarding the marital status of the household heads, 47.1% were single (never married), 25.8% were married, and 20.3% were widowed. The majority of the household heads (41.3%) were adults (40–60 years), 40.3% of the heads of household were elderly (>60 years), and the remainder (18.4%) were young (<40 years). The average household size was 5.9, with more female members (3.3) of household than males (2.6). Household heads (decision-makers) who had primary education or higher (72.9%) were significantly higher (p < 0.05) than those who had no formal education (27.1%). A third (33.5%) of the household heads—46% of those who had formal education—had post-primary school education.
Among the households surveyed, 68% owned agricultural land either “privately” or as family land, 20% did not own any agricultural land while the rest either rented land privately (6.8%) or used communal land (5.2%). Just over two-thirds of the household heads (67.7) were part-time farmers and 32.3% were full-time farmers. The average total land holding per household was 8.85 ha. On average, only 2.25 ha was cropped. Regarding livestock, 61.3% of the households owned poultry (mainly chickens), 55.5% owned goats, 37.4% owned cattle, 26.1% owned donkeys, and 10.3% owned sheep. Some owned more than one type of livestock. On average, each household owned six cattle, one donkey, seven goats, one sheep, and seven chickens.
The major farm implements used by households differed among households with most households using hand-held implements such as hoes (65.8%) while others used animal drawn (using donkeys) ploughs (44.2%) and tractor-drawn implements (3.5%). There was no significant difference (p > 0.05) between households using hand-held implements and those using animal or tractor-drawn implements. At least half of the households (52.3%) received government input support under the Integrated Support Programme for Arable Agriculture (ISPAAD) although this was not significantly different (p > 0.05) from those who did not benefit during the 2016/2017 agricultural season. Although a higher proportion of the households (62.3%) had annual cash incomes below BWP5000 (US $450), the difference with those who had higher incomes was not significant (p > 0.05). Only 32.9% of the households received remittances which they also invested varying proportions in agricultural climate change adaptations.
The majority of the households (91.0%) had access to climate and agricultural information. However, there was no significant difference (p > 0.05) between those households which mainly relied on climate information from the Meteorological Services Department (58.4%) and those relying on traditional knowledge (41.3%). Regarding access to information, 63.5% of the households surveyed had at least one television set, 51.64% had at least one radio and 94.5% had at least one cellphone. At least 70% of the households reported that the adoption of new farming practices was influenced by radio or television programs, seasonal weather forecasts, and information from extension officers. The information which influenced adoption of new farming practices by surveyed households was received through village chiefs (Kgosi) (41.9%), observing other successful farmers (39.7%), farmer organizations (23.2%), and farmers’ magazines (8.4%).
3.2. Actual Household-Level Adaptation Responses
The sections below summarize the adoption and implementation of various actual adaptation measures: crop management, livestock management, land and soil management, water management, and off-farm adaptation practices by households. The results show the frequencies and associated proportions (%) of households that reported the different adaptation measures including the Chi-square test of difference between the households that reported using the measure and those that did not. The figures following each table allow visualization of the extent of the adoption of the different measures and practices under each broad strategy.
3.2.1. Crop Management Practices
Among the various crop management measures identified in the study area, Table 3 shows that most of the households adopted drought-tolerant crop varieties (72.6%) followed by early maturing crops (70.6%). Other crop management practices adopted by many households included sequencing their cropping (58.7%), changing planting times (51.0%), and introducing new crops not grown previously (40.0%). The least adopted crop management measures were conservation agricultural practices (24.5%) and having plots in other villages or geographical areas (21%).
Figure 2 below shows the extent of the adoption of different combinations of crop management measures by households in the study area.
A proportion of 17.8% of the households did not adopt any crop management practice while 82.2% adopted at least one crop management practice between 2006 and 2017. Most of the households (22%) adopted five different crop management measures which was followed by adoption of four different measures (16.2%). Those who adopted three and six different measures were 13.3% and 13.6%, respectively. A mere 2.9% adopted all the seven crop management measures identified in this study while 14.2% adopted at most two measures.
3.2.2. Livestock Management Practices
Table 4 shows the proportion of households which adopted the different livestock management practices leading to 2017. Selling livestock including destocking was practiced by most of the households (41.3%) followed by use of supplementary feeding (37.7%) and temporary migration of livestock in search of better pastures and water (36.5%). About 33% of the households sought grazing rights from other villages while about 26% bought improved breeds of the same livestock or changed the composition of their livestock. The least practiced measure among the livestock management practices was formation of associations such as grazing associations with only 14.2% of the households reporting adoption of this practice. Fewer households reported receiving livestock through government projects (19%) while others started animal rearing as a diversification of their livelihoods (18.7%).
Figure 3 below shows that those households which did not adopt any livestock management practice were the majority (30.6%). Of the 69.4% households that adopted at least one of the nine livestock management practices, 13.9% of the households adopted a single livestock management practice while 14.2% of the households which adopted two practices. Households which adopted three of more livestock management practices were 10% or less with only 1.3% of the households adopting all the nine practices identified in the study area.
3.2.3. Land and Soil Management Practices
Table 5 shows the different land and soil management practices including the proportion of households who actually practiced each of the measures during the decade. Between 2006 and 2017, 71.9% of the households sought advice from the extension service worker while 61% went on to use seasonal forecasts and drought early warning information provided through various channels and platforms within each village. About 49% of the households changed time of harvesting as a land or soil management strategy while close to 42% used various soil and water conservation techniques as well as clearing more agricultural land to grow more crops. The least adopted land and/or soil management practices were seeking agricultural land in other geographical areas (25.8%), changing fertilizer, pesticide or herbicide use (19.4%), and use of irrigation (8.1%).
Figure 4 shows that there was a very high level of adoption land and/or soil management practices with 86.4% of the households adopting one or more of the eight measures identified in the study area. Almost 17% of the households adopted three different measures in Table 5 while 16.2% adopted two different measures. Approximately 44% of the households adopted between four and eight different land and/or soil management measures inclusive of the 1.6% who adopted all the land and/or soil management measures identified in the study area. Less than 9% of the households implemented only one land and/or soil management practice in Table 5 while 14.6% of the households did not adopt any land and/or soil management practice.
3.2.4. Water Management Practices
From the seven water management practices identified in the study area and presented in Table 6, rainwater harvesting was practiced by most of the households (51.6%). The second most practiced measure was protecting some water sources for use during the dry season with 42.6% of the households reporting the practice. Some households (35.2%) reported making use of small earth dams around their village while another 33.2% resorted to drilling boreholes or wells to access groundwater especially at the "cattle posts". Up to 28% of the households reported rehabilitating water points such as deepening wells. Only 4.2% reported using drip irrigation although this was largely practiced in backyard gardens.
Figure 5 shows that the highest proportion of households (23.6%) in the study area did not adopt any of the water management practices followed by those who implemented just one practice (22.7%) among the seven measures at their disposal. A proportion of 19.1% and 11% implemented two and three different water management measures, respectively. At least four up to a maximum of seven different water management practices were implemented by a proportion ranging between 6 and 9% of the households within the last decade.
3.2.5. Off-Farm Adaptation and Management Practices
Table 7 shows the various off-farm adaptation measures some of which are related to provisioning ES. Up to seven different off-farm responses were identified in the study area. Among the measures involving the exploitation of provisioning ES were starting a small business, trading in at least one provisioning ES (31.9%), such as selling charcoal and/or firewood (45.2%). Some reported to forming committees to protect natural pastures and/or water for their livestock (14.5%) while others invested in grain storage (39%) or hired out grazing land to livestock owners (5.5%) to raise income. A significant proportion of the households (78.1%) reported the migration of some of the household members in search of employment in neighboring towns such as Selebi Phikwe or to major cities such as Francistown and Gaborone.
The extent of adoption of various combinations of the off-farm measures in Table 7 is shown in Figure 6.
Only 6.4% of the households did not have any off-farm adaptation measures indicating that there was a high proportion of households using ecosystem products and other off-farm livelihood options to cope with the adverse impacts of climate. Most of the households used two (27.7%) followed by three (22.3%) off-farm adaptations in Table 7. About 19% of the households were engaged in only one or four different off-farm activities to complement cultivated agriculture and livestock production as a livelihood source and a coping mechanism. The combined proportion of households engaged in at least five up to a maximum of seven different off-farm adaptation initiatives and coping mechanisms was 8.3%. Almost 85% of the households used up to four different off-farm adaptation initiatives in Table 7.
3.2.6. Aggregated Climate Change Adaptation and Management Practices
Table 8 shows that when all the above measures were combined to form five mutually exclusive adaptation strategies, i.e., crop management (82.3%), livestock management (64.5%), land and/or soil management (85.5), water management (76.5%), and off-farm adaptation initiatives (95.2%), less than 1% of all the households was not involved in any of the practices between 2006 and 2017. This indicates a very high level of at least 99% adoption of one or more adaptation and management strategy to the adverse effects of climate and fluctuating provisioning ES in Bobirwa sub-district.
It is important to note that the adaptation strategies and coping mechanisms in Table 8 were not implemented as mutually exclusive strategies. The different combinations of response strategies by households in Bobirwa sub-district are summarized in Figure 7. Approximately 49% of the households in Bobirwa sub-district implemented all the five adaptation strategies and coping mechanisms presented in Table 8. About 26% of the households implemented four strategies during the same period while 12.3% implemented three strategies. Those households which implemented either two or three strategies contributed a proportion of 5.8% apiece while less than 1% reported not implementing any adaptation initiative between 2006 and 2017.
Those who adopted water management practices were combined with those who adopted land and soil management practices to form a single category. Therefore, a total of seven categories (including combinations of strategies) were used for the multinomial logit analyses, i.e., the final adaptation options after considering all the actual combinations were 0 = Off-farm adaptations (reference category); 1 = Crop management practices only; 2 = Livestock management practices only; 3 = Land, soil and water management practices only; 4 = Crop + Livestock management practices combined; 5 = Crop + Land, soil and water management practices combined; and 6 = Crop + Livestock + Land, soil and water management practices combined.
3.3. Determinants of Adoption of Climate Change Adaptation Strategies
The estimation of the MNL model for the determinants of the choice of adaptation strategy mix to the variable but adverse impacts of climate was accomplished by normalizing the “Off-farm adaptation” category to become the reference category. This allowed analyses and comparisons of the different actual adaptation strategy mixes used by different households in Bobirwa sub-district. Table 9 presents the MNL model marginal errors together with their standard errors (in parentheses) and levels of significance.
The results in Table 9 show a p-value of the F-statistic (Prob > Chi2) of 0.000 indicating that the variables used in the model, including the model itself, are very significant (p < 0.05). The null hypothesis which states that the social and economic attributes considered in this study do not explain the adaptation choices by households in Bobirwa sub-district is rejected since the model F-statistic has an R2 greater than zero. Therefore, the attributes of households considered in this study significantly explain some of the variability in adaptation choices by households in the study area, i.e., with a pseudo R2 of 0.2503, about 25% of the choice of adaptation strategy mix by households in Bobirwa sub-district was due to variations in the different social and economic attributes in Table 9. Table 9 shows that several variables had a significant influence (p < 0.05) on the type of adaptation measure chosen by households.
Table 10 above gives a summary of the different adaptation strategies whose likelihood of adoption was positively or negatively influenced the different socio-economic attributes of the surveyed households. Whether a variable has a positive (negative) or a significant (non-significant) influence on the adoption of any adaptation strategy does not imply a “cause-effect” relationship although, in some instances, causality does exist. Table 11 below shows how the factors considered in explaining household adaptation choices (Table 9) influenced the extent of the adoption of the different strategies. The same explanatory variables revealed a lower inference power on the extent of the adoption of adaptation strategies as shown by a pseudo R2 value of 0.1578, i.e., only 15.78% of the variation in the extent of adoption by the surveyed households can be explained by those factors which influenced the choice of adaptation strategies by households in Bobirwa sub-district.
3.3.1. Gender of Main Decision-maker
Table 9 shows that the gender of main decision-maker in the household (De jure household head) had no significant effect (p > 0.05) on the adoption of any strategy. Results show that households with females as the main decision-maker were less likely to adopt Land, Soil, and Water + Livestock-related Adaptations; Crop Adaptations Only; Crop + Livestock-related Adaptations; and Crop + Livestock + Land, Soil, and Water Conservation Adaptations and more likely to adopt off-farm adaptations. Conversely, households with male decision-makers were more likely to adopt the four adaptation strategies compared than they would off-farm adaptations. On the contrary, households with females as main decision-makers had higher chances of adopting Livestock-related Adaptations Only; Land, Soil, and Water Conservation Adaptations Only; and Crop + Land, Soil, and Water Conservation Adaptations than off-farm adaptations. Similarly, households with male decision-makers were less likely to adopt the three adaptation strategies than they would off-farm adaptations. Gender had no significant influence on the adoption of any of the strategies.
3.3.2. Age of Household Head
The negative coefficient on age shows that elderly heads of households were less likely to adopt any of the seven on-farm adaptation strategies than off-farm adaptation strategies. This implies that households headed by younger people were more likely to adopt any of the on-farm adaptation strategies or combinations thereof, than they would off-farm adaptations. The influence of age was only significant (p < 0.05) on the adoption of two different adaptation strategies, i.e., of Land, Soil, and Water Conservation Adaptations as well as on the adoption of Crop + Land, Soil, and Water Conservation Adaptations. A unit increase in the age of the farmer was therefore expected to significantly (p < 0.05) reduce the chances of adopting these two adaptation strategies while chances of all the other remaining strategies decline but not significantly.
Adult heads of households (41–60 years) were more likely to adopt Land, Soil, and Water Conservation Adaptations Only; Land, Soil, and Water + Livestock-related adaptations; Crop Adaptations Only; Crop + Land, Soil, and Water Conservation Adaptations and Crop + Livestock + Land, Soil, and Water Conservation Adaptations than off-farm adaptations. The only adaptation that was more likely to be significantly adopted by adult heads of households (p < 0.05) was Crop + Land, Soil, and Water Conservation Adaptations. Adult heads of households were also less likely to adopt Livestock-related Adaptations Only and Crop + Livestock-related Adaptations compared to off-farm adaptations though not significantly (p > 0.05) while young heads of households were more likely to adopt these on-farm adaptations. Elderly heads of households (>60 years) were more likely to adopt all the on-farm adaptation strategies, except for Crop + Livestock-related Adaptations, compared to off-farm adaptations. The only adaptation that the elderly heads of households were more likely to adopt significantly (p < 0.05) compared to off-farm adaptations was Crop + Land, Soil, and Water Conservation Adaptations.
3.3.3. Occupation and Employment Status of Household Head
Table 9 indicates full-time farmers had more significant (p < 0.05) chances of adopting Crop Adaptations Only; Crop + Land, Soil, and Water Conservation Adaptations; and Crop + Livestock + Land, Soil, and Water Conservation Adaptations than they would off-farm adaptations. Conversely, part-time farmers were less likely to adopt the same adaptation strategies than off-farm adaptations. Full-time farmers were also more likely to adopt Livestock-related Adaptations Only; Land, Soil, and Water + Livestock-related adaptations and Crop + Livestock-related Adaptations than off-farm adaptations though not significantly (p > 0.05). Adoption of Land, Soil, and Water Conservation Adaptations Only by full-time farmers was less likely compared to off-farm adaptations but this was not significant (p > 0.05). Vice versa is true for part-time farmers.
Households with formally employed members had significantly higher chances of adopting Land, Soil, and Water Conservation Adaptations Only; Crop + Livestock-related Adaptations; and Crop + Livestock + Land, Soil, and Water Conservation Adaptations than they did off-farm adaptations. Those with no formally employed members were less likely to adopt these measures. Though not significant (p > 0.05), households with formally employed members were more likely to adopt the four remaining on-farm adaptation strategies, i.e., Livestock-related Adaptations Only; Land, Soil, and Water + Livestock-related adaptations; and Crop Adaptations Only; Crop + Land, Soil, and Water Conservation Adaptations compared to off-farm adaptation while households with no formally employed members had lesser chances. Thus, formally employed members enhanced adoption of all on-farm adaptations, and hindered off-farm adaptations, by their households.
3.3.4. Dry Land Cropped Area
Households with bigger dry land cropped areas were less likely to adopt six of the seven adaptation strategies compared to off-farm adaptations and those with smaller farm sizes. As cultivated dryland area increased, households in the study area were less likely to adopt of Land, Soil, and Water Conservation Adaptations Only; Land, Soil, and Water + Livestock-related adaptations; Crop Adaptations Only; Crop + Livestock-related Adaptations; Crop + Land, Soil, and Water Conservation Adaptations; and Crop + Livestock + Land, Soil, and Water Conservation Adaptations but also increase the adoption of Livestock-related Adaptations Only. This was only significant (p < 0.05) in the adoption of Land, Soil, and Water + Livestock-related adaptations and Land, Soil, and Water + Livestock-related adaptations. Increasing dryland cultivated area by households reduced the chances of adopting these adaptation strategies than it did for off-farm adaptations.
3.3.5. Household Size
Table 9 shows that larger households had fewer chances of adopting Livestock-related Adaptations Only; Land, Soil, and Water Conservation Adaptations Only; Land, Soil, and Water + Livestock-related adaptations; Crop Adaptations Only; Crop + Land, Soil, and Water Conservation Adaptations; and Crop + Livestock + Land, Soil, and Water Conservation Adaptations. This was only significant (p < 0.05) in the adoption of Land, Soil, and Water Conservation Adaptations Only; Land, Soil, and Water + Livestock-related adaptations; and Crop + Land, Soil, and Water Conservation Adaptations. Bigger households were only more likely, yet not significantly (p > 0.05), to adopt Crop + Livestock-related Adaptations. Thus, bigger household sizes discouraged adoption of all, except combinations of crop and livestock adaptations which were enhanced by larger households.
3.3.6. Climate Information
Access to climate information enhanced chances of adopting any of the on-farm adaptation strategies than it did to off-farm adaptations though none of the influence was significant (p > 0.05). Conversely, households with poor or no access to climate information were less likely to adopt on-farm adaptation strategies (Table 9). Therefore, access to traditional or scientific climate information encouraged the adoption of any the on-farm adaptations considered in this study.
3.3.7. Household Wealth
Several variables in the model indicated household wealth, i.e., remittances, annual income, remittances financing adaptations, and the number of rooms in the main house. Annual remittances non-significantly (p > 0.05) reduced the chances of adopting all on-farm adaptation strategies. Higher proportions of remittances meant for financing agricultural adaptations reduced the chances of households taking up any of the on-farm adaptations. The influence was only significant (p < 0.05) on the adoption of Land, Soil, and Water + Livestock-related adaptations. Households received lower agricultural remittances were more likely to use them for the intended purpose.
More household income reduced the chances of adopting Crop Adaptations Only and Crop + Livestock-related Adaptations but increased chances of households adopting Livestock-related Adaptations Only; Land, Soil, and Water Conservation Adaptations Only; Land, Soil, and Water + Livestock-related adaptations; Crop + Land, Soil, and Water Conservation Adaptations; and Crop + Livestock + Land, Soil, and Water Conservation Adaptations. Annual income had no significant influence on the chances of adopting any of the on-farm adaptation strategies (p < 0.05).
The number of rooms in the main house significantly (p < 0.05) reduced the chances of adopting Land, Soil, and Water + Livestock-related adaptations; Crop Adaptations Only; Crop + Land, Soil, and Water Conservation Adaptations; and Crop + Livestock + Land, Soil, and Water Conservation Adaptations than they did off-farm adaptations. More rooms in the main house non-significantly (p > 0.05) reduced the chances of adopting Livestock-related Adaptations Only; Land, Soil, and Water Conservation Adaptations Only and Crop + Livestock-related Adaptations. Households with bigger main houses were therefore less likely to adopt any on-farm adaptation strategy than off-farm strategies as well as compared to those with smaller main houses.
3.3.8. CBNRM Benefits
Table 9 shows that households that received any monetary or non-monetary benefits from CBNRM programs between 2006 and 2017 were more likely to adopt Livestock-related Adaptations Only; Land, Soil, and Water Conservation Adaptations Only; Land, Soil, and Water + Livestock-related adaptations; Crop Adaptations Only; Crop + Land, Soil, and Water Conservation Adaptations; and Crop + Livestock + Land, Soil, and Water Conservation Adaptations although they were less likely to adopt Crop + Livestock-related Adaptations. Those that did not were less likely to adopt any of these strategies. Receiving CBNRM benefits did not have any significant influence on the adoption of any of these strategies (p > 0.05).
3.3.9. Tropical Livestock Units (TLU)
The aggregated population size of different livestock species in Tropical Livestock Units (TLU) significantly enhanced the likelihood of adopting Livestock-related Adaptations Only; Land, Soil, and Water + Livestock-related adaptations; and Crop + Livestock + Land, Soil, and Water Conservation Adaptations. Higher TLU also increased chances of adopting Crop Adaptations Only; Crop + Livestock-related Adaptations; and Crop + Land, Soil, and Water Conservation Adaptations but the influence was not significant (p > 0.05). Households with higher TLU were less likely, and non-significantly (p > 0.05), to adopt Land, Soil, and Water Conservation Adaptations.
3.3.10. Agricultural Land Tenure Arrangements
Ownership of agricultural land had enhanced chances of adopting Land, Soil, and Water Conservation Adaptations Only; Land, Soil, and Water + Livestock-related adaptations; Crop Adaptations Only; Crop + Livestock-related Adaptations; Crop + Land, Soil, and Water Conservation Adaptations; Crop + Livestock + Land, Soil, and Water Conservation Adaptations. Adoption of Crop + Livestock + Land, Soil, and Water Conservation Adaptations was the only strategy significantly (p < 0.05) influenced by owning agricultural land. Households that owned agricultural land were less likely to adopt Livestock-related Adaptations Only though the influence was not significant (p > 0.05). Conversely, households that did not have full ownership of agricultural land were less likely to adopt any on-farm adaptation strategies.
4. Discussion
4.1. Households’ Adaptation Strategies to Climate Change
The findings show that communities in Bobirwa use both on-farm and off-farm strategies to respond to climate change impacts. The prevalence of livestock management and agronomic practices to manage crops, land, soil, and water indicate the importance of agriculture as a livelihood strategy in Bobirwa. Several studies have shown the importance of subsistence agriculture to rural livelihoods in southern Africa [13,34,35].
The adoption of agronomic practices such as growing drought-tolerant and early maturing crops, the use of seasonal forecasts, and consulting agricultural extension officers by the majority of the surveyed households could be attributed to the ISPAAD initiative by the Department of Crop Production in the Ministry of Agriculture. Under ISPAAD, poor farmers were provided with free improved seeds, fertilizers, agrochemicals, tillage, and access to credit and extension services [36]. The low usage of fertilizers, pesticides, and herbicides reported by most households could be due to drought-induced crop failure before farmers could apply agrochemicals issued under ISPAAD. The free inputs under the ISPAAD programme were also associated with the increase in the cropped area among the surveyed households. Several studies have shown increased uptake of agricultural adaptation initiatives that are promoted by governments and non-governmental organizations [37,38,39].
In addition to the input support and free tillage up to 5 ha under ISPAAD, encouraging households to expand their cropped area, the expansion of cultivated area to grow more crops reported by 42% of the households could also be attributed to the increasing severity of droughts. A study by [40] in the Gaborone dam catchment in Botswana, also found that farmers expanded their croplands in order to maximize yields given the rising drought-induced crop failure. The low adoption of practices such as conservation agriculture and in-field soil and water conservation by farmers may explain the low yields of major grain crops among smallholder farmers in Botswana [41]. A study by [42] in several southern African countries attributed the low adoption of conservation agriculture by smallholder farmers to limited knowledge and their huge labour requirements. Agricultural extension services need to increase farmer education and demonstrations to improve awareness and subsequent adoption of relevant practices by households [43].
The fewer households who had farms in different geographical areas could indicate the high demand for agricultural land in Bobirwa. This may also be due to the slow processing of new farms by the Land Board. The isolated cases of clearing of land for cultivating crops in communal grazing areas where crop production was prohibited provides further evidence that accessing new farmlands in Bobirwa sub-district was either difficult or a lengthy process.
The low adoption of livestock adaptations is attributed to the low ownership of livestock by households in Bobirwa sub-district. For instance, only less than 38% of the households owned cattle or donkeys while goats were owned by 56%. The low adoption of livestock adaptations was also found among smallholder farmers in southern Africa by [26]. With goat production shown to significantly contribute to the livelihoods of rural communities in Botswana, government programs such as Livestock Management and Infrastructure Development (LIMID) through the Department of Animal Production need to expand the programme [44]. This can allow more poor farmers to benefit from the programme; thereby, increasing livestock ownership in the sub-district. The high ownership of chickens by households owning chickens was attributed to the ability of free-range chickens to survive the harsh conditions [45].
The moderate adoption of livestock sales and destocking by livestock farmers is mainly attributed to the increasing severity of droughts. A study by [46] found that only 4% of livestock farmers in Bobonong and 23.7% of those in Kgalagadi in Botswana destocked their livestock through selling. Similar to findings from both studies, surveyed households in Bobirwa sub-district expressed reluctance to destock even with increasing severity of droughts as more livestock provided them with several subsistence needs, were a store of wealth and considered an adaptation to droughts, i.e., more tolerant than crops [43], also found low destocking levels by rural farmers in Amathole District Municipality, Eastern Cape Province of South Africa, partly because of similar reasons.
The adoption of livestock supplementary feeding was supported by the availability of crop residues and the ability of better-off households to purchase supplementary feeding. The low adoption of changing composition of livestock could be due to low annual incomes reported by most of the surveyed households [43,46]. Moving livestock to other geographical areas and seeking grazing rights from other traditional authorities were limited by the Foot-and-Mouth Disease (FMD) which restricted farmers from moving their livestock beyond the study area [47]. Even the formation of grazing associations was constrained by communal ownership of grazing land where individuals do not have exclusive rights. Despite grazing areas in Bobirwa sub-district being freely accessible to all community members, there was no strict control of grazing or grazing area [46].
The low adoption of livestock adaptations in Bobirwa sub-district including the few households who reported receiving livestock through government projects or those who started animal rearing as a diversification of their livelihoods may indicate that the LIMID programme only benefited few poor households. This may also show that the LIMID programme was ineffective as it failed to benefit many poor households in the study area [48]. There is a need for intensifying livestock production among poor households through increasing the capacity of initiatives such as LIMID through promoting livestock production systems, markets, and institutions that enhance sustainability [49].
The low adoption of off-farm adaptation strategies in Bobirwa sub-district could indicate that livelihood opportunities outside rain-fed agriculture were limited. The most dominant off-farm activity was the emigration of household members (78%) in search of economic opportunities in neighboring towns. This provides further evidence of the limited opportunities outside rain-fed agriculture in the study area. With about two-thirds (67%) of the households not receiving remittances from emigrated household members and annual income below BWP5000 (US $450), livelihoods in Bobirwa sub-district are heavily hinged on subsistence agriculture. Other off-farm adaptations included the exploitation of several timber and non-timber products such as selling of firewood (45.2%) and non-timber forest products such as Mopane caterpillars.
The surveyed households only reported a few ecosystem products among their adaptation responses. This is different from findings in a study by [43] in the Amathole District Municipality in South Africa, where rural farmers reported exploitation of several non-farm flora and fauna species among their climate change adaptation strategies. Several studies have shown the importance of wild fruits and wild foods towards household food and income requirements in Botswana [9,50,51]. Failure to recognize the importance of provisioning ES among climate change adaptation strategies by households in Bobirwa sub-district may explain the lack of measures to improve the sustainability of their delivery among the reported off-farm strategies.
The diversity of laborious agronomic practices (crop, land, soil, and water) adopted under crop adaptations could also be limiting the adoption and diversity of off-farm adaptation practices by households in Bobirwa sub-district. Overall, on-farm adaptations were adopted by most of the surveyed households. This may be due to households adopting at least one of the different practices. The findings also suggest that households in Bobirwa sub-district may have integrated crop adaptations as part of their livelihoods possibly due to crop production being one of the main livelihood strategies. The low adaptation of livestock adaptations is consistent and comparable with the fewer households owning livestock suggesting that increasing livestock ownership could also livestock adaptations. The lack of provisioning ES among off-farm adaptations may indicate a poor perception of these as adaptation strategies to climate change. In order to enhance the importance of provisioning ES as climate change adaptation strategies in Bobirwa sub-district, more awareness, investment, regulations, and policy are required to guide conservation and sustainable exploitation given the growing human population. Similarly, investments are required to diversify and enhance off-farm livelihood opportunities to reduce overreliance on rainfed agriculture which is risky.
4.2. Determinants of Adoption of Climate Change Adaptation Strategies
The R2 of 0.2503 for the overall model indicates that 25.03% of the variation in the choice of adaptation strategy mix (dependent variable) was due to the variations in the different social and economic factors of the households (explanatory variables). Though this value is low, the pseudo R2 for MNL models to explain social and behavioral outcomes, e.g., adaptation choices of households in Bobirwa sub-district, are usually low as shown by studies elsewhere [23,52]. The low R2 also suggests that there could be other relevant factors not included in the model which may explain the adaptation choices by households in the study. In the study area, these could include the mean annual temperature, mean annual precipitation, drought severity and recurrence, the extent of government programs such as Ipelegeng ("cash-for-labour") and ISPAAD, market development, migration and extent of human-wildlife conflicts. Those attributes with p-values below 0.05 significantly influence the adaptation choices of households in Bobirwa sub-district. Whether a variable has a positive (negative) or a significant (non-significant) influence on the adoption of any adaptation strategy should not imply a “cause-effect” relationship. However, where causality exists, this could be an important entry point for transforming current adaptation initiatives to be more effective and sustainable [53].
4.2.1. Gender of Household Head
The non-significant effect of the gender of the main decision-maker on the adoption of any strategy (p > 0.05) indicates that the differences in the adoption of any strategy were not statistically different between female and male decision-makers at the household level. Female decision-makers at the household level were less likely to take up Land, Soil, and Water + Livestock-related Adaptations; Crop Adaptations Only; Crop + Livestock-related Adaptations; and Crop + Livestock + Land, Soil, and Water Conservation Adaptations compared to male-headed households as shown by the negative coefficient. These findings contrast those from other studies which found gender of the main decision-maker to significantly influence their choice of adaptation strategies among farming communities [13,30,54].
Although female decision-makers in households in Bobirwa sub-district were more likely to adopt livestock production and management practices as the only adaptive response, women and young people mostly reared chickens and small livestock such as goats. This could be due to the low feed demands by chickens and small livestock compared to large livestock such as cattle [44,55]. Studies such as [26] also found that male-headed households in Southern Africa were more likely to diversify livestock and crop production including other off-farm activities to manage the impacts of climate change than their female counterparts. Therefore, female-headed households in Bobirwa sub-district could be limited by the numerous household chores, childcare as well as the demanding nature of many agricultural adaptations. Such multiple tasks reduce the time for women to take up diversified adaptations as revealed by the negative relationship between female decision-makers at the household level and the adoption of several adaptation strategies.
Considering that female decision-makers only had higher chances of adopting Livestock-related Adaptations Only; Land, Soil, and Water Conservation Adaptations Only; and Crop + Land, Soil, and Water Conservation Adaptations, it may suggest that women in Bobirwa sub-district still face challenges in accessing resources such as land, relevant information and capital compared to male-headed households. Despite the high ownership of information communication channels such as mobile phones, television sets, and radios among the surveyed households, information asymmetry between males and females is very high among many rural farming communities as shown by studies elsewhere in Africa [13,34,56]. This could suggest that less relevant or inadequate information is shared through these channels. In addition, with only 32.3% of female heads of households being full-time farmers, where most of the household heads were females (79.7%) in a rural farming community, this further highlights the limits imposed on rural women by the several roles they perform.
As most of the heads of households were part-time farmers, both men and women in Bobirwa were expected to have limited time to fully implement most of the agricultural practices despite being the main decision-makers. However, unlike in other studies where women and children were mostly implementers of adaptation practices and decisions made by males, in Bobirwa sub-district, it is important for decision-makers to make adaptation decisions and policies which resonate well with women and young people. Being the majority of the household decision-makers, women can easily influence and inform the type of adaptations that require government support for them to be more effective. With the Government of Botswana culture of participatory decision-making through consulting communities in a bottom-up approach [57], adaptation policy and planning can easily cater for the gendered challenges within communities.
4.2.2. Age of Household Head
The negative influence of age of the main decision-maker on all the seven adaptation strategies shows that aging hinders the adoption of any of the current adaptation strategies. However, aging only significantly reduced the adoption of Land, Soil, and Water Conservation Adaptations and that of Crop + Land, Soil, and Water Conservation Adaptations. These findings are different from previous studies like [25] where the age of the main decision-maker in the household was shown to significantly enhance adaptation to climate change by farmers in the Nile Basin of Ethiopia. The limitations imposed by aging in Bobirwa sub-district could be attributed to the reduced planning horizons and agility as people grow older. Therefore, elderly farmers were less likely to take up long-term adaptation decisions, particularly those involving demanding tasks. Despite the findings, elderly heads of households in Bobirwa sub-district could play a significant role in promoting successful adaptations by passing on the knowledge and experience acquired over the years to young people who are not only energetic but still have longer planning horizons. Young people are also more likely to integrate such knowledge with emerging adaptation measures.
With adult heads of households (41–60 years) more likely to adopt Land, Soil, and Water Conservation Adaptations Only; Land, Soil and Water + Livestock-related adaptations; Crop Adaptations Only; Crop + Land, Soil, and Water Conservation Adaptations and Crop + Livestock + Land, Soil, and Water Conservation Adaptations compared to young heads of households (<40 years), this shows that adult farmers were more experienced than young farmers [25]. Importantly, this could mean that the peak of adoption was reached in adulthood (41–60 years) and declined among the elderly. Studies by [23,34,58] also found age to be a proxy of, and correlated to, experience. Therefore, despite the declining adoption of adaptations with age, adult and elderly farmers in Bobirwa sub-district could be more knowledgeable and experienced about the dynamics of climate change adaptation than younger farmers.
4.2.3. Dry Land Cropped Area
The negative influence of increasing the cropped area on the adoption of all adaptation strategies except livestock adaptations could be influenced by the surveyed household heads being mostly part-time farmers. Bigger farms require more resources and time to implement the various agronomic practices which part-time farmers may not have. Since most of the households (62.3%) had annual incomes below BWP5000 (US $450), these could be inadequate for financing adaptation practices. Therefore, increasing the cropped area could be further limited by the low incomes. The emigration of at least two economically active household members in search of employment opportunities in neighboring towns and cities often results in households composed of more children and the elderly whose labour may not be available for farming. A high composition of children adds a strain on women—who usually have multiple household chores—through providing care which limits the time available to implement the numerous agronomic adaptation practices.
Although agricultural expansion was viewed by local communities as an adaptation to more severe droughts, the results suggest that bigger farms, which require more time and effort to implement various agronomic and adaptation practices, were a barrier to climate change adaptation in Bobirwa sub-district. Therefore, smaller farms require less time and effort for land preparation and implementing the various agronomic practices given the small household sizes (5) and low ownership of donkeys (26.1%), which are solely used for draft power in the study area. Despite the majority of households (63.8%) reporting that they owned agricultural land privately with papers, croplands in Bobirwa sub-district are communally owned and can be partitioned for other members as the human population grows [27]. Therefore, households could be reluctant to invest in meaningful and lasting adaptation strategies on their farms. This could be a barrier to the implementation of various adaptations on larger farms which may be targeted for partitioning than smaller farms.
The increased chances of the adoption of livestock-related adaptations with bigger cropped areas could be attributed to the complementarity between livestock and crop production. Livestock such as donkeys provide draft power for tillage while crop residues from crop production are increasingly used for feeding livestock during the dry season. Therefore, bigger farms encourage farmers to undertake livestock practices as an adaptation strategy as there exists a mutual relationship between the provision of draft power from livestock while residues from crops are used to supplement livestock feeds especially when pastures are scarce. A study by [46] reported that as part of the pre-drought preparations in Bobonong (village in Bobirwa), farmers stored crop residues of sorghum and maize for their livestock. Similarly, as a response to the declining availability of natural pastures, households could stock up and feed their livestock with crop residues from bigger farm sizes even with crop failure.
4.2.4. Household Size
The negative influence of bigger household sizes on the adoption of all the adaptation strategies, except one on crop and livestock adaptations in sub-district, could be attributed to the low composition of able-bodied and economically active members due to emigration. Although bigger household sizes have been shown to improve the adoption of adaptations by studies such as [59], the contrasting results from this study are likely due to the high composition of children, the elderly, and women. This is mainly due to the emigration of mostly young and adult members of the household who could be providing labour on the farms.
Young people living and working in neighboring towns and cities, particularly young women, often leave their children under the care of their parents or grandparents and return to the cities. This often leaves most households with many minors who require childcare which further limit time for working in the fields. As effective adaptations to climate change often require farmers to undertake several activities beyond their usual seasonal routines, this requires more labour and time resources which are limited by emigration of able-bodied household members. For instance, land, soil, and water conservation practices are usually labor-intensive. Therefore, households with several able-bodied members who are available to work on the farm may be able to take up several climate change adaptation measures than those households with fewer such members. There is a need for government programs to enhance livestock production, particularly donkeys which provide draft power for tillage. Government programs such as the ISPAAD, which assist poor farmers with free tillage and other inputs, also need to assist local communities to own tractors which they can control and schedule. This can increase the effectiveness of the programme and the timing of activities.
4.2.5. Climate Information
The very high access to climate and agricultural information (91%) by surveyed households in Bobirwa sub-district is attributed to the high ownership of cellular phones (94.5%), television sets (63.5%), and radios (51.6%). This is shown by the high proportion of households who were influenced or informed by radio or TV programme (78.1%) to adopt new farming practices. The high literacy level as shown by more than 72% of household heads with formal education further suggests that people were able to comprehend the messages sent through cell phones, radios, television sets, and print media. Therefore, the positive influence of access to climate information on the adoption of all the adaptation strategies could be attributed to the high ownership of communication gadgets and high literacy levels. High access to climate information by the surveyed households is also attributed to face-to-face interaction with extension officers (71%), village chiefs (DiKgosi) (41.9%), other successful farmers (39.7%), and farmer organizations (23.2%). [26] also reported a high uptake of adaptation measures among smallholder farmers who perceived changes in climate in southern Africa.
Although formal education was shown to enhance the adoption of Livestock-related Adaptations Only; Land, Soil, and Water + Livestock-related Adaptations; Crop + Land, Soil, and Water Conservation Adaptations; and Crop + Livestock + Land, Soil, and Water Conservation Adaptations, the effect was not significant. This may suggest that information on climate change and adaptation acquired through formal education could be inadequate to significantly enable effective adaptations in the study area. A study by [60] in 11 African countries noted that perceiving climate change was critical to decision-making and choosing the appropriate strategies to adopt. There may be need for improving the education curriculum to include climate change adaptation studies at all levels of formal education up to the tertiary level to enhance the adoption of adaptation practices that are more informed, effective and relatively inexpensive. The negative influence of formal education on the adoption Land, Soil, and Water Conservation Adaptations Only; Crop Adaptations Only; and Crop + Livestock-related Adaptations could therefore be due to less relevant information acquired over the years.
The quality and spatial resolution of climate information are also critical particularly for crop-related adaptations where the timing of certain operations is an important factor. The non-significant influence of climate information on the adoption of appropriate adaptation strategies could be due to the high spatial resolution of climate information by the Meteorological Services Department (MSD). For instance, weather information and seasonal forecasts in Botswana are often generalized and focus on the district levels to be of much relevance to decision-making at the sub-district, village, and farm levels. There is a need for the MSD to issue more localized weather and climate information which are more relevant at the farm level. With multiple information channels accessible to households (e.g., cellular phone, television, and radio) and the high literacy levels in Bobirwa sub-district, these could enhance the sharing of more localized, detailed, and relevant weather and climate information as well as climate change adaptation strategies.
With households depending mainly on traditional knowledge (41.3%) and meteorological services (58.4%) for climate information, the two climate information sources need to be complementary. The influence of non-formal and traditional knowledge on the adoption of agricultural adaptations among rural communities need to be well understood, validated, and synchronized with scientific information from formal institutions such as MSD. In addition to observing changes in vegetation, crop phenology, and growth patterns, information from the MSD, Ministry of Agriculture and other relevant institutions could significantly influence decisions at the household level and enhance the timely adoption of more appropriate adaptation measures.
Decentralized weather forecasting could allow more localized, relevant, and timely forecasting that can allow stakeholders and local communities to synchronize the traditional indicators with the scientific information from MSD. Extension information from the Ministry of Agriculture also needs to be current to enable farmers to adopt crops and practices suitable to the agroecological conditions in the study area that agricultural adaptations can be impactful [46].
4.2.6. Household Wealth
Several variables in the model were indicators of household wealth, i.e., remittances, annual income, the proportion of remittances financing adaptations, as well as the number of rooms in the main house. Nonetheless, it was important to examine their individual effects. The negative influence of remittances, annual income, and the number of rooms in the main house on the adoption of almost all the adaptation strategies suggests that wealthier households in Bobirwa sub-district had less direct dependence on agriculture and ecosystem products. This is consistent with previous studies which showed that poor households were more dependent on the ecosystem products than wealthier households [61,62]. Therefore, as household wealth increases, households in Bobirwa sub-district were more likely to buy household food requirements and pay for other requirements than producing themselves.
Other studies have shown a positive influence of wealth and higher incomes on the adoption of agricultural adaptation in South Africa [43], Niger [39], and Zimbabwe [13]. The surveyed households in Bobirwa sub-district were therefore less likely to depend on the ecosystem products, particularly from agriculture and woodlands, with increasing income. Higher incomes enable households to purchase their food requirements than produce it themselves given the severe droughts. Therefore, increasing opportunities for off-farm incomes could effectively reduce the dependence on natural ecosystems and help with conservation efforts. Reduced human dependence on ecosystem products can allow biodiversity regeneration, enhance the condition of local ecosystems and improve the delivery of provisioning ES.
4.2.7. Occupation and Employment Status of Household Head
The positive influence of being a full-time farmer on the adoption of all adaptation strategies except Land, Soil, and Water Conservation, unlike part-time farmers, is attributed to more disposable time resources to practice or implement these adaptations. Although formal employment is usually associated with sustained and reliable income, annual income and remittances have already been shown to have a negative influence on the adoption of almost all the adaptation strategies. However, other positive, non-monetary benefits of formal employment among household members in the study area are related to access to recent, up-to-date, and relevant climate and agricultural information which allows them to make informed decisions using experience gained in a formal setting. Other studies have shown that household members working outside their communities were not only bringing new information, ideas, and technologies but were also influential in the decision-making of their households [7,63].
4.2.8. CBNRM Benefits
Receiving monetary or non-monetary benefits from CBNRM programs increased the adoption of all the adaptation strategies in the model. Although the influence was not significant for all the adaptation strategies, the provision of CBNRM benefits to the community was likely to provide a source of livelihood. As an alternative source of income and incentive for conserving local resources, CBNRM benefits were likely to motivate farmers to take up agricultural adaptations and, in a way, reduce overexploitation and overdependence on other ecosystem products. Coordinated efforts by relevant departments such as National Parks and Wildlife, Forestry, and Range Resources and Tourism and Hospitality are needed to further enhance CBNRM benefits among communities in Bobirwa sub-district to encourage them to conserve the local ecosystems.
4.2.9. Tropical Livestock Units (TLU)
Higher Tropical Livestock Units (TLU) improved the likelihood of the adoption of all strategies in Bobirwa sub-district except Land, Soil, and Water Conservation Adaptations. Therefore, increasing livestock ownership by households in the study area encouraged the adoption of adaptation strategies. For instance, households with more livestock such as cattle, goats, and sheep were expected to easily take up livestock practices to safeguard them from climate change or drought-induced loss of pastures and disease outbreaks [46]. Donkeys are an important source of draft power in Bobirwa sub-district and facilitate the adoption of labor-intensive adaptation practices such as land and soil management which involve tilling the land. Draft power is critical for smallholder farmers in the study area since household labour was shown to be constrained by the emigration of able-bodied household members in search of economic opportunities as explained earlier. Enhancing livestock ownership, particularly donkeys, increases draft power which can facilitate the adoption of such agronomic practices as soil and water conservation, changing to new crops, varying planting dates as well as diversification of crop enterprises. These practices are labour intensive; therefore, less likely to be adopted in the absence of, or with inadequate, currently low ownership of tractors or draft animals, particularly donkeys.
As livestock are not only a source of income but also a form of wealth, previous studies have shown that being wealthy was associated with improved access to information [14,38,64]. Access to climate and agricultural information has already been shown in this study to remarkably improve the uptake of adaptation strategies. Several previous studies also showed that wealthy households had more access to information which in turn influence uptake of technologies and other innovations such as conservation agriculture and climate-smart agriculture more than poor farmers with less or no livestock [39,43,65]. However, the negative effect of TLU (livestock), which reduced the chances of taking up Land, Soil and Water Conservation as an adaptation strategy, could be because such sole adaptations have fewer welfare effects on the households. Therefore, smallholder farmers were more likely to adopt those strategies which have multiple benefits.
4.2.10. Agricultural Land Tenure Arrangements
The positive effect of officially owning agricultural land on the adoption of all the adaptation strategies except Livestock Adaptations is attributed to the relative security of tenure which allows farmers to invest in different adaptations. Several studies also found a positive correlation between ownership of agricultural land and adoption of adaptation strategies, improved technologies as well as farm investments and developments [37,43,65]. Conversely, those who did not own agricultural land were discouraged from investing on the land as they lacked security of tenure to make any significant investments on the land.
Although the ownership of agricultural land by households in the study area was reported as private ownership, this was different from the freehold tenure on privately-owned farms. Households in the study area did not have exclusive rights to their agricultural land as it was communal land. However, being issued certificates of occupation provides households with relative security compared to those who rent, occupy illegally, or have temporary use of family land. Expediting the issuance of agricultural land by the local Land Board and securing land ownership could encourage households to invest in long-lasting adaptations.
4.3. Implications of Current Adaptation Responses in Bobirwa Sub-Districts
How communities perceive climate change has implications on the adoption of strategies including the type of strategies implemented [46]. The socio-economic attributes, adaptation choices, and the determinants of these choices discussed in this study may have several implications for communities in Bobirwa sub-district. The semi-arid climate experienced in the sub-district highly exposes several economic sectors to the incremental impacts of climate change. Although local communities perceived a more adverse climate, their long experience of droughts appears to be causing household response strategies seem as part of their normal life. [46] also found that droughts had become a norm in Bobonong, such that local communities had become used to them. Therefore, the high adoption of different adaptation strategies by households in Bobirwa sub-district may suggest that current practices have been integrated as part of their livelihoods. However, failure to appreciate the incremental impacts of climate change by communities in Bobirwa could be limiting them from transforming and scaling up their adaptive responses.
The low crop yields during the study period given the free input support to farmers under ISPAAD suggest that current adaptation practices used in rain-fed crop production in the study area were inadequate. This could be partly due to the failure of the ISPAAD initiative to recognize the agroecology of the study area as a semi-arid area including issuing non-suitable crops and varieties for the prevailing climate. Less effective crop adaptations could mean that the production of food in Bobirwa sub-district will remain constrained and threaten household food security. The continued expansion of agricultural land in which households cannot fully implement effective adaptations may also indicate inadequate adaptations. Such less productive agricultural expansions are usually at the expense of biodiversity loss which underpins the delivery of provisioning ES.
Despite the devastating impacts of droughts, destocking and selling part of livestock remained low in the study area. With several uses of livestock such as food, draft power, source of income and a sign of wealth, households in Bobirwa sub-district seem reluctant to reduce their livestock even with severe droughts. Moreover, grazing at the communal grazing areas (cattle posts), including livestock ownership per household, was neither limited nor controlled. Under such circumstances, destocking remained an unpopular adaptation response [46]. The concentration of large livestock such as cattle threatens the sustainability of natural pastures at the cattle-posts. Livestock may end up moving longer distances in search of pastures which wastes their energy while also exposing them to theft and predation. In addition, farmers may eventually be forced to sell their livestock at much lower prices in the event that droughts are severe and prolonged.
While the surveyed households seemed reluctant to destock their livestock, the adoption of other strategies such as supplementary feeding, migrating livestock in search of pastures, and changing livestock composition by some households could indicate a desire to adapt their livestock production. While wealthy households may be able to purchase supplementary feed for their livestock, poor households may need to be assisted with subsidized feeds during severe droughts to avoid weight loss, reduced fertility, and deaths. Considering the smaller herds by poor households, it may be difficult for them to recover breeding stock that may be lost during droughts [46].
The failure to destock large livestock such as cattle which are susceptible to severe droughts despite receiving seasonal forecasts and drought early warning systems also highlight challenges faced by farmers in this regard. As highlighted before, the failure to destock is mainly be attributed to FMD. However, other challenges included limited markets (caused by FMD), the low prices at local markets may be better than drought-induced livestock deaths. Failure to adequately adapt livestock production may further limit the availability of draft power particularly from donkeys. Although draft power in the sub-district is provided by donkeys, livestock adaptations mainly focused on cattle and goats which provide subsistence benefits such as meat and milk. This could have serious implications on crop production and adaptations which depend on draft power provided by donkeys. The increasing demand for free tillage services under ISPAAD requires that farmers provide their own tillage using draft power to minimize delays; hence, the need to also target donkeys in livestock adaptations.
For poor households, their current vulnerabilities may increase due to loss of biodiversity caused by inadequate adaptations in agriculture such as unnecessary agricultural expansions [66]. With warming and drought severity in Bobirwa sub-district likely to continue rising in the near future, the threats on livelihoods could be huge under current adaptation regimes similar to findings in other studies [67]. Since none of the adaptation measures were aimed at conserving or improving biodiversity, there is an urgent need for measures to safeguard the basis of provisioning ES in the sub-district. Communities in Bobirwa sub-district need to be proactive and engage the government, traditional authorities, civil society, private sector, and NGOs for guidance and support in addressing challenges in agriculture (crops and livestock), water, tourism, health, and migration [1,68].
With a growing human population, low agricultural productivity, and biodiversity loss, further investments are required to improve agricultural productivity and conservation of natural ecosystems in Bobirwa sub-district [69]. Similar to concerns by [70], a rise in food imports caused by low investments in African agriculture could make food unaffordable for poor households in the sub-district. Therefore, the implementation of initiatives such as ISPAAD and LIMID needs to be more effective and enhance agricultural productivity while also limiting the unnecessary loss of biodiversity [71,72]. However, such planned adaptations need to consider the associated trade-offs so that addressing low agricultural productivity does not infringe on the delivery of ecosystem products.
5. Conclusions
The high level of adaptation of off-farm and on-farm adaptations shown in this study suggests improved knowledge of the adverse incremental impacts of climate change. The high-level of adoption and implementation of on-farm and off-farm adaptation strategies shown by the local communities was mainly attributed to the perceived increase in the frequency and severity of droughts together with warmer temperatures in recent years. Although the choice and mix of adaptation strategies adopted by communities in Bobirwa sub-district may also indicate a high receptiveness to government programs in the agricultural sector, they also reveal inadequate responses to effectively act against incremental climate change. In their current state, the adaptation strategies in the sub-district may soon become redundant as the impacts of climate change become more intense. There is a need for government programs such as ISPAAD to also educate smallholder farmers and provide them with more localized information on climate forecasts, climate change, droughts and relevant agronomic practices to improve the efficacy of current responses. This could improve awareness among farmers and allow more efficient adaptations through accepting input packages that suit the agroecology of their area and not just their preferences. The government also needs to promote the establishment of off-farm opportunities in rural areas by encouraging investments which encourage processing and value addition of ecosystem products to broaden the livelihood base and possibly reduce overreliance on rainfed and dryland agriculture. Among the social and economic attributes of households, which had a homogeneous influence across all the available adaptation strategies, were the age of the household head (negative), annual remittances to the household (negative), the proportion of remittances devoted to financing adaptations (negative), number of rooms in the main house (negative), climate information (positive), and formal employment (positive). Among those largely associated with a high uptake of adaptations were years of formal education, being a full-time farmer, tropical livestock units, annual income, CBNRM benefits, land tenure arrangements, and being an adult, or elderly head of household. Being a female head of household, bigger household sizes, and bigger cropped area were largely associated with low adoption of the different adaptation strategies. The influence of these socio-economic attributes of households provide critical information for adjusting government programs such as ISPAAD and provide important entry points for influencing uptake of more effective adaptations by local communities.
Author Contributions
Conceptualization, methodology, validation, formal analysis, investigation, writing—original draft preparation, E.M.; writing—review and editing, supervision, project administration, H.M. and M.B. All authors have read and agreed to the published version of the manuscript.
Funding
This research was carried out under the Adaptation at Scale in Semi-Arid Regions project (ASSAR). ASSAR is one of four research programs funded under the Collaborative Adaptation Research Initiative in Africa and Asia (CARIAA), with financial support from the UK Government’s Department for International Development (DfID), and the International Development Research Centre (IDRC), Canada. The views expressed in this work are those of the authors and do not necessarily represent those of DfID and IDRC or its Board of Governors.
Acknowledgments
We appreciate the Southern Africa ASSAR team for helping with the development of the household survey questionnaire, particularly those at the University of Botswana who helped with the localization of the questionnaire. Thanks to Chandapiwa Molefe for co-supervising the household survey, and to Metseotata Mafoko and Lerato Sebola for helping with planning of the household survey. All the traditional leaders and Village Development Committees who helped with mobilizing of study participants and the local communities in Bobirwa sub-district, particularly the participants in our study, are much appreciated. We also appreciate the assistance of the 10 enumerators who administered the household interviews and captured the data for analysis
Conflicts of Interest
The authors declare no conflict of interest. The funders had no role in the design of the study; in the collection, analyses, or interpretation of data; in the writing of the manuscript, or in the decision to publish the results.
References
- FAO; IFAD; UNICEF; WFP; WHO. The State of Food Security and Nutrition in the World 2018. Building Climate Resilience for Food Security and Nutrition; FAO: Rome, Italy, 2018; ISBN 9789251305713. [Google Scholar]
- IPCC. Managing the Risks of Extreme Events and Disasters to Advance Climate Change Adaptation: A Special Report of Working Groups I and II of the Intergovernmental Panel on Climate Change; Field, C.B., Barros, V., Stocker, T.F., Qin, D., Dokken, D.J., Ebi, K.L., Mastrandrea, M.D., Mach, K.J., Plattner, G.K., Allen, S.K., et al., Eds.; Cambridge University Press: Cambridge, UK, 2012. [Google Scholar]
- Akwetaireho, S.; Getzner, M. Livelihood dependence on ecosystem services of local residents: A case study from Mabamba Bay wetlands (Lake Victoria, Uganda). Int. J. Biodivers. Sci. Ecosyst. Serv. Manag. 2010, 6, 75–87. [Google Scholar] [CrossRef]
- Nash, D. Changes in Precipitation Over Southern Africa During Recent Centuries. Oxf. Res. Encycl. Clim. Sci. 2017, 1, 1–33. [Google Scholar] [CrossRef]
- Mberego, S. Temporal patterns of precipitation and vegetation variability over Botswana during extreme dry and wet rainfall seasons. Int. J. Climatol. 2017, 37, 2947–2960. [Google Scholar] [CrossRef]
- Mba, W.P.; Longandjo, G.-N.T.; Moufouma-Okia, W.; Bell, J.-P.; James, R.; Vondou, D.A.; Haensler, A.; Fotso-Nguemo, T.C.; Guenang, G.M.; Tchotchou, A.L.D.; et al. Consequences of 1.5 °C and 2 °C global warming levels for temperature and precipitation changes over Central Africa. Environ. Res. Lett. 2018, 13, 055011. [Google Scholar] [CrossRef] [Green Version]
- Serdeczny, O.; Adams, S.; Baarsch, F.; Coumou, D.; Robinson, A.; Hare, W.; Schaeffer, M.; Perrette, M.; Reinhardt, J. Climate change impacts in Sub-Saharan Africa: From physical changes to their social repercussions. Reg. Environ. Chang. 2017, 17, 1585–1600. [Google Scholar] [CrossRef]
- Dube, O.P.; Sekhwela, M.B.M. Community Coping Strategies in Semiarid Limpopo Basin Part of Botswana: Enhancing Adaptation Capacity to Climate Change; AIACC: Washington, DC, USA, 2007; Volume 47. [Google Scholar]
- Thomas, B. Sustainable harvesting and trading of mopane worms (Imbrasia belina) in Northern Namibia: An experience from the Uukwaluudhi area. Int. J. Environ. Stud. 2013, 70, 494–502. [Google Scholar] [CrossRef]
- Doswald, N.; Osti, M. Ecosystem-Based Approaches to Adaptation and Mitigation-Good Practice Examples and Lessons Learned in Europe; BfN, Federal Agency for Nature Conservation: Bonn, Germany, 2012; ISBN 9783896240330. [Google Scholar]
- Kimani, S.K.; Esilaba, A.O.; Njeru, P.N.M.; Miriti, J.M.; Lekasi, J.K.; Koala, S. Improving Livelihoods in Semi-arid Regions of Africa through Reduced Vulnerability to Climate Variability and Promotion of Climate Resilience. In Adapting African Agriculture to Climate Change; Filho, L.W., Ed.; Springer International Publishing Switzerland: Nairobi, Kenya, 2015; pp. 109–117. ISBN 978-3-319-12999-0. [Google Scholar]
- Kurukulasuriya, P.; Mendelsohn, R. A Ricardian analysis of the impact of climate change on African cropland. Afr. J. Agric. Resour. Econ. 2008, 2, 1–23. [Google Scholar]
- Makate, C.; Wang, R.; Makate, M.; Mango, N. Crop diversification and livelihoods of smallholder farmers in Zimbabwe: Adaptive management for environmental change. Springerplus 2016, 5, 1135. [Google Scholar] [CrossRef] [Green Version]
- Sharka, J.S.; Kahaka, Z.; Nathan, F.O. Farmers’ Perceptions and Adaptations to Climate Change in Sub-Sahara Africa: A Synthesis of Empirical Studies and Implications for Public Policy in African Agriculture. J. Agric. Sci. 2013, 5, 121–135. [Google Scholar] [CrossRef] [Green Version]
- Adger, W.N.; Dessai, S.; Goulden, M.; Hulme, M.; Lorenzoni, I.; Nelson, D.R. Integrated Solutions for Biodiversity, Climate Change and Poverty. Clim. Chang. 2009, 5, 1–100. [Google Scholar] [CrossRef]
- Smit, B.; Wandel, J. Adaptation, adaptive capacity and vulnerability. Glob. Environ. Chang. 2006, 16, 282–292. [Google Scholar] [CrossRef]
- Adger, N.W.; Nigel, A.W.; Tompkins, E.L. Successful adaptation to climate change across scales. Glob. Environ. Chang. 2005, 15, 77–86. [Google Scholar] [CrossRef]
- Parmesan, C. Ecological and Evolutionary Responses to Recent Climate Change. Annu. Rev. Ecol. Evol. Syst. 2006, 37, 637–669. [Google Scholar] [CrossRef] [Green Version]
- Ministry of Environment, Natural Resources Conservation and Tourism, Government of Botswana. National Adaptation Plan Framework for Botswana; Ministry of Environment, Natural Resources Conservation and Tourism, Government of Botswana: Gaborone, Botswana, 2020.
- Nkemelang, T.; New, M.; Zaroug, M. Temperature and precipitation extremes under current, 1.5 °C and 2.0 °C global warming above pre-industrial levels over Botswana, and implications for climate change vulnerability. Environ. Res. Lett. 2018, 13, 1–12. [Google Scholar] [CrossRef] [Green Version]
- Iheke, O.R.; Agodike, W.C. Analysis of Factors Influencing the Adoption of Climate Change Mitigating Measures by Smallholder Farmers in Imo State Nigeria. Econ. Eng. Agric. Rural Dev. 2018, 16, 213–220. [Google Scholar]
- Mugari, E.M.; Mwakiwa, E.; Mutambara, J.; Gwata, C.; Jiri, O. Evaluating Smallholder Farmers’ Perceptions of Climate Change The Case of Chiredzi District, Zimbabwe. Clim. Chang. Impacts Responses 2016, 9, 1–21. [Google Scholar] [CrossRef]
- Hassan, R.; Nhemachena, C. Determinants of African farmers’ strategies for adapting to climate change: Multinomial choice analysis Determinants of Demand for and Supply of Credit to Small-Scale Enterprises and Performance of Microcredit Markets in Sudan View project Agric finance V. Afr. J. Agric. Resour. Econ. 2008, 2, 83–104. [Google Scholar]
- Mendelsohn, R. The Impact of Climate Change on Agriculture in Developing Countries. J. Nat. Resour. Policy Res. 2008, 1, 5–19. [Google Scholar] [CrossRef] [Green Version]
- Deressa, T.T.; Hassan, R.M.; Ringler, C. Perception of and adaptation to climate change by farmers in the Nile basin of Ethiopia. J. Agric. Sci. 2011, 149, 23–31. [Google Scholar] [CrossRef] [Green Version]
- Nhemachena, C.; Hassan, R. Micro-Level Analysis of Farmers’ Adaptation to Climate Change in Southern Africa. In IFPRI Discussion Paper 00714; International Food Policy Research Institute: Washington, DC, USA, 2007. [Google Scholar]
- Statistics Botswana. Central Bobonong Sub-District Population and Housing Census 2011 Selected Indicators; Ministry of Finance and Development Planning: Gaborone, Botswana, 2015. [Google Scholar]
- Daron, J.D. Regional Climate Messages for Southern Africa. Scientific report from the CARIAA Adaptation at Scale in Semi-Arid Regions (ASSAR) Project; ASSAR: Cape Town, South Africa, 2014. [Google Scholar]
- Dube, O.P.; Sekhwela, M.B.M. Indigenous knowledge, institutions and practices for coping with variable climate in the Limpopo basin of Botswana. In Climate Change and Adaptation; Leary, N., Adejuwon, J., Barros, V., Burton, I., Kulkarni, J., Lasco, R., Eds.; Earthscan: Gaborone, Botswana, 2012; pp. 71–89. ISBN 9781849770750. [Google Scholar]
- van Edig, X.; Schwarze, S. Short-term poverty dynamics of rural households: Evidence from Central Sulawesi, Indonesia. J. Agric. Rural Dev. Trop. Subtrop. 2012, 112, 141–155. [Google Scholar]
- Joshi, G.R.; Bauer, S. Determinants of Rice Variety Diversity on Household Farms in the Terai Region of Nepal. In Proceedings of the IAAE Conference, Gold Coast, Australia, 12–18 August 2006. [Google Scholar]
- Green, W.H. Econometric Analysis, 5th ed.; Prentice Hall: Upper Saddle River, NJ, USA, 2003. [Google Scholar]
- FAO. Compendium of Agricultural–Environmental Indicators; FAO: Rome, Italy, 2003. [Google Scholar]
- Mango, N.; Zamasiya, B.; Makate, C.; Nyikahadzoi, K.; Siziba, S. Factors influencing household food security among smallholder farmers in the Mudzi district of Zimbabwe. Dev. S. Afr. 2014, 31, 625–640. [Google Scholar] [CrossRef]
- Chipanshi, A.C.; Chanda, R.; Totolo, O. Vulnerability Assessment of the Maize and Sorghum Crops to Climate Change in Botswana. Clim. Chang. 2003, 61, 339–360. [Google Scholar] [CrossRef]
- Government of Botswana. Guidelines for Integrated Support Programme for Arable Agriculture Development (ISPAAD); Ministry of Agriculture: Gaborone, Botswana, 2013.
- Shikuku, K.M.; Winowiecki, L.; Twyman, J.; Eitzinger, A.; Perez, J.G.; Mwongera, C.; Läderach, P. Smallholder farmers’ attitudes and determinants of adaptation to climate risks in East Africa. Clim. Risk Manag. 2017, 16, 234–245. [Google Scholar] [CrossRef]
- Katengeza, S.P.; Mangisoni, J.H.; Kassie, G.T.; Sutcliffe, C.; Langyintuo, A.; La Rovere, R.; Mwangi, W. Drivers of improved maize variety adoption in drought prone areas of Malawi. J. Dev. Agric. Econ. 2012, 4, 393–403. [Google Scholar] [CrossRef]
- Asfaw, S.; Di Battista, F.; Lipper, L. Agricultural Technology Adoption under Climate Change in the Sahel: Micro-evidence from Niger. J. Afr. Econ. 2016, 25, 637–669. [Google Scholar] [CrossRef]
- Matlhodi, B.; Kenabatho, P.K.; Parida, B.P.; Maphanyane, J.G. Evaluating land use and land cover change in the Gaborone dam catchment, Botswana, from 1984-2015 using GIS and remote sensing. Sustainability 2019, 11, 5174. [Google Scholar] [CrossRef] [Green Version]
- UNDP-UNEP PEI. Support to Smallholder Arable Farmers in Botswana: Agricultural Development or Social Protection? Results and Policy Implications from A Poverty and Social Impact Analysis; UNDP-UNEP PEI: Gaborone, Botswana, 2013. [Google Scholar]
- Mango, N.; Makate, C.; Mapemba, L.; Sopo, M. The role of crop diversification in improving household food security in central Malawi. Agric. Food Secur. 2018, 7, 7. [Google Scholar] [CrossRef]
- Taruvinga, A.; Visser, M.; Zhou, L. Determinants of Rural Farmers’ Adoption of Climate Change Adaptation Strategies: Evidence from the Amathole District Municipality, Eastern Cape Province, South Africa. Int. J. Environ. Sci. Dev. 2016, 7, 687–692. [Google Scholar] [CrossRef] [Green Version]
- Monau, P.I.; Visser, C.; Nsoso, S.J.; Van Marle-Köster, E. A survey analysis of indigenous goat production in communal farming systems of Botswana. Trop. Anim. Health Prod. 2017, 49, 1265–1271. [Google Scholar] [CrossRef]
- Bettencourt, E.M.V.; Tilman, M.; Narciso, V.; da Silva Carvalho, M.L.; de Sousa Henriques, P.D. The Livestock Roles in the Wellbeing of Rural Communities of Timor-Leste. Rev. Econ. Sociol. Rural 2015, 53, 63–80. [Google Scholar] [CrossRef]
- Mogotsi, K.; Nyangito, M.M.; Nyariki, D.M. The role of drought among agro-pastoral communities in a semi-arid environment: The case of Botswana. J. Arid Environ. 2013, 91, 38–44. [Google Scholar] [CrossRef]
- FAO. Adaptation to Climate Change in Semi-Arid Environment: Experiences and Lessons from Mozambique; FAO: Rome, Italy, 2012; ISBN 9789251071359. [Google Scholar]
- FANRPAN. Climate-Smart Agriculture in Botswana; FANRPAN: Gaborone, Botswana, 2017. [Google Scholar]
- Swanepoel, F.; Stroebel, A.; Moyo, S. The Role of Livestock in Developing Communities: Enhancing Multifunctionality in Developing Communities; Swanepoel, F.J.C., Stroebel, A., Moyo, S., Eds.; The Technical Centre for Agricultural and Rural Cooperation (CTA): Wageningen, The Netherlands; University of the Free State: Bloemfontein, South Africa, 2010. [Google Scholar]
- Motlhanka, D.M.; Makhabu, S.W. Medicinal and edible wild fruit plants of Botswana as emerging new crop opportunities. J. Med. Plants Res. 2011, 5, 1836–1842. [Google Scholar]
- DFRR; JICA. Economic Valuation of Forest and Range Resources in Botswana; DFRR: Gaborone, Botswana; JICA: Gaborone, Botswana, 2017. [Google Scholar]
- Kurukulasuriya, P.; Mendelsohn, R. Crop Selection: Adapting to Climate Change in Africa; World Bank Policy Research: Washington, DC, USA, 2007. [Google Scholar]
- Masundire, H.; Morchain, D.; Raditloaneng, N.; Hegga, S.; Ziervogel, G.; Molefe, C.; Angula, M.; Omari, K. About ASSAR Reports Vulnerability and Risk Assessment in Botswana’s Bobirwa Sub-District: Fostering People-Centred Adaptation to Climate Change; ASSAR: Gaborone, Botswana, 2016. [Google Scholar]
- Mwingira, C.E.; Pallangyo, M.E.; Felix, R.; Pima, N.; Meing’ataki, G.E.O.; Salum, S. Impacts of Climate Change on Biodiversity and Community Livelihoods in the Katavi Ecosystem; Institute of Resource Assessment: Dar es Salaam, Tanzania, 2011. [Google Scholar]
- Alary, V.; El Sheifa, M.; Abdelkrim, N.; Hamdon, H.; Metawi, H. Roles of small ruminants in the rural livelihood improvement—Comparative analysis in Egypt. Rev. Elev. Med. Vet. Pays Trop. 2016, 68, 79–85. [Google Scholar] [CrossRef]
- Doss, C.R. Analyzing technology adoption using microstudies: Limitations, challenges, and opportunities for improvement. Agric. Econ. 2006, 34, 207–219. [Google Scholar] [CrossRef]
- Mugari, E.; Masundire, H.; Bolaane, M.; New, M. Perceptions of ecosystem services provision performance in the face of climate change among communities in Bobirwa sub-district, Botswana. Int. J. Clim. Chang. Strateg. Manag. 2018, 11, 265–288. [Google Scholar] [CrossRef] [Green Version]
- Ahmed, M.H. Climate change adaptation strategies of maize producers of the Central Rift Valley of Ethiopia. J. Agric. Rural Dev. Trop. Subtrop. 2016, 117, 175–186. [Google Scholar]
- Ajao, A.; Ogunniyi, L. Farmers’ strategies for adapting to climate change in Ogbomoso agricultural zone of Oyo state. Agris On-Line Pap. Econ. Inform. 2011, 3, 3–13. [Google Scholar]
- Maddison, D. The Perception of And Adaptation To Climate Change In Africa; Policy Research Working Papers; The World Bank: Washington, DC, USA, 2007. [Google Scholar]
- Agarwala, M.; Atkinson, G.; Fry, B.; Homewood, K.; Mourato, S.; Rowcliffe, J.; Wallace, G.; Milner-Gulland, E. Assessing the Relationship Between Human Well-being and Ecosystem Services: A Review of Frameworks. Conserv. Soc. 2014, 12, 437–449. [Google Scholar] [CrossRef]
- UNEP. Ecosystem Services and Rural Livelihoods in the Sahel: Environmental Accounting and Wealth Surveys; UNEP: Nairobi, Kenya, 2012. [Google Scholar]
- Mertz, O.; Mbow, C.; Reenberg, A.; Genesio, L.; Lambin, E.F.; D’haen, S.; Zorom, M.; Rasmussen, K.; Diallo, D.; Barbier, B.; et al. Adaptation strategies and climate vulnerability in the Sudano-Sahelian region of West Africa. Atmos. Sci. Lett. 2011, 12, 104–108. [Google Scholar] [CrossRef]
- Chen, M.; Wichmann, B.; Luckert, M.; Winowiecki, L.; Förch, W.; Läderach, P. Diversification and intensification of agricultural adaptation from global to local scales. PLoS ONE 2018, 13, e0196392. [Google Scholar] [CrossRef]
- Berenger, D.T. Agricultural Technology Adoption and Adaptation under Climate Change: Microevidence from Niger. Master’s Theses, University of San Francisco, San Francisco, CA, USA, 2017. [Google Scholar]
- Akinyemi, F.O.; Mashame, G. Analysis of land change in the dryland agricultural landscapes of eastern Botswana. Land Use Policy 2018, 76, 798–811. [Google Scholar] [CrossRef]
- Osima, S.E.; Indasi, V.; Zaroug, M.A.H.; Edris, H.; Gudoshava, M.; Misiani, H.; Nimusiima, A.; Anyah, R.; Otieno, G.; Ogwang, B.; et al. Projected climate over the Greater Horn of Africa under 1.5 °C and 2 °C global warming. Environ. Res. Lett. 2018, 13, 1–11. [Google Scholar] [CrossRef]
- IPCC. Summary for Policymakers. In Global warming of 1.5 °C. An IPCC Special Report on the Impacts of Global Warming of 1.5 °C above Pre-Industrial Levels and Related Global Greenhouse Gas Emission Pathways, in the Context of Strengthening the Global Response to the Threat of Climate Change, Sustainable Development, and Efforts to Eradicate Poverty; Masson-Delmotte, V., Zhai, P., Pörtner, H.O., Roberts, D., Skea, J., Shukla, P.R., Pirani, A., Moufouma-Okia, W., Péan, C., Pidcock, R., et al., Eds.; World Meteorological Organization: Geneva, Switzerland, 2018. [Google Scholar]
- Heinke, J.; Müller, C.; Lannerstad, M.; Gerten, D.; Lucht, W. Freshwater resources under success and failure of the Paris climate agreement. Earth Syst. Dyn. Discuss. 2019, 10, 205–217. [Google Scholar] [CrossRef] [Green Version]
- De Pinto, A.; Ulimwengu, J.M. A Thriving Agricultural Sector in a Changing Climate: Meeting Malabo Declaration Goals through Climate-Smart Agriculture; De Pinto, A., Ulimwengu, J.M., Eds.; ReSAKSS: Washington, DC, USA, 2017. [Google Scholar]
- Janetos, A.; Kasperson, R. Synthesis: Condition and trends in systems and services, trade-offs for human well-being, and implications for the future. In Ecosystems and Human Well-being: Current State and Trends; Island Press: Washington, DC, USA, 2005; pp. 829–837. ISBN 1-55963-227-5. [Google Scholar]
- Polasky, S.; Nelson, E.; Pennington, D.; Johnson, K.A.; Polasky, S.; Pennington, D.; Johnson, K.A.; Nelson, E. The Impact of Land-Use Change on Ecosystem Services, Biodiversity and Returns to Landowners: A Case Study in the State of Minnesota. Env. Resour. Econ. 2011, 48, 219–242. [Google Scholar] [CrossRef]
Figure 1.
Map of Bobirwa sub-district showing study villages.

Figure 2.
Extent of adoption of crop management and adaptation measures (n = 310).

Figure 3.
Extent of adoption of livestock management and adaptation measures (n = 310).

Figure 4.
Extent of adoption of land and/or soil management measures (n = 310).

Figure 5.
Extent of adoption of water management and adaptation measures (n = 310).

Figure 6.
Extent of adoption of off-farm management and adaptation measures (n = 310).

Figure 7.
Adoption levels of different adaptation strategies (n = 310).


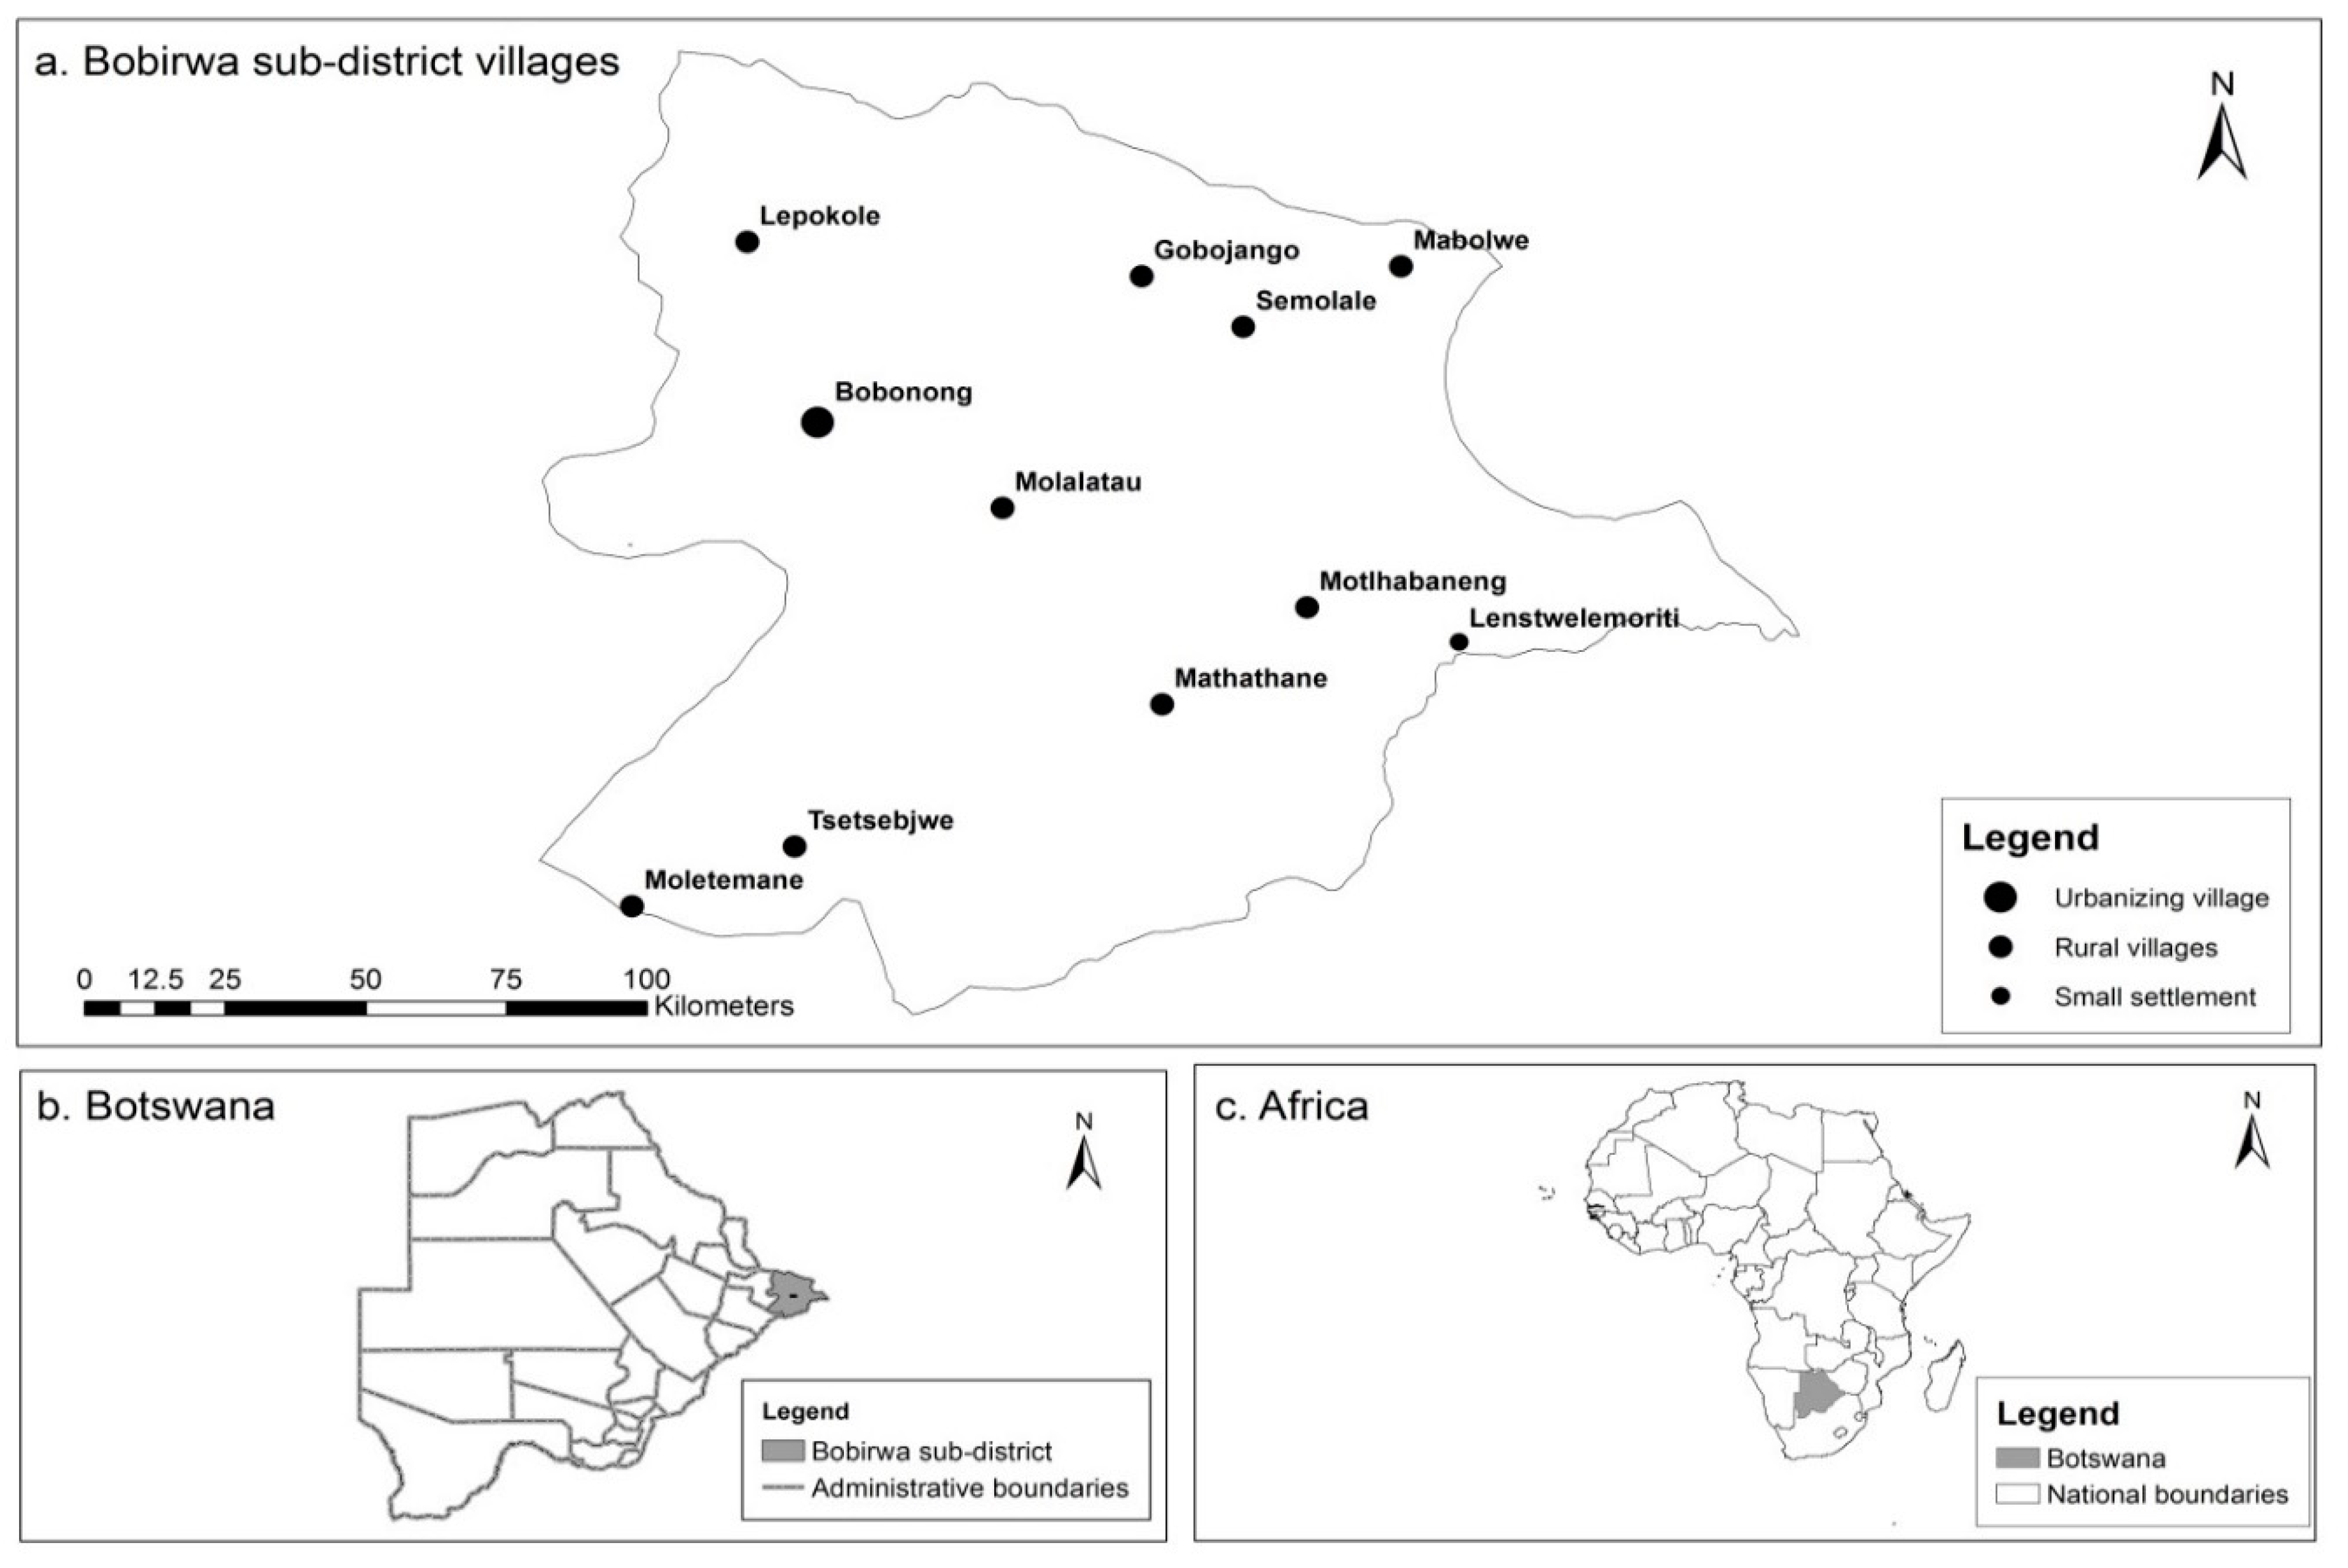
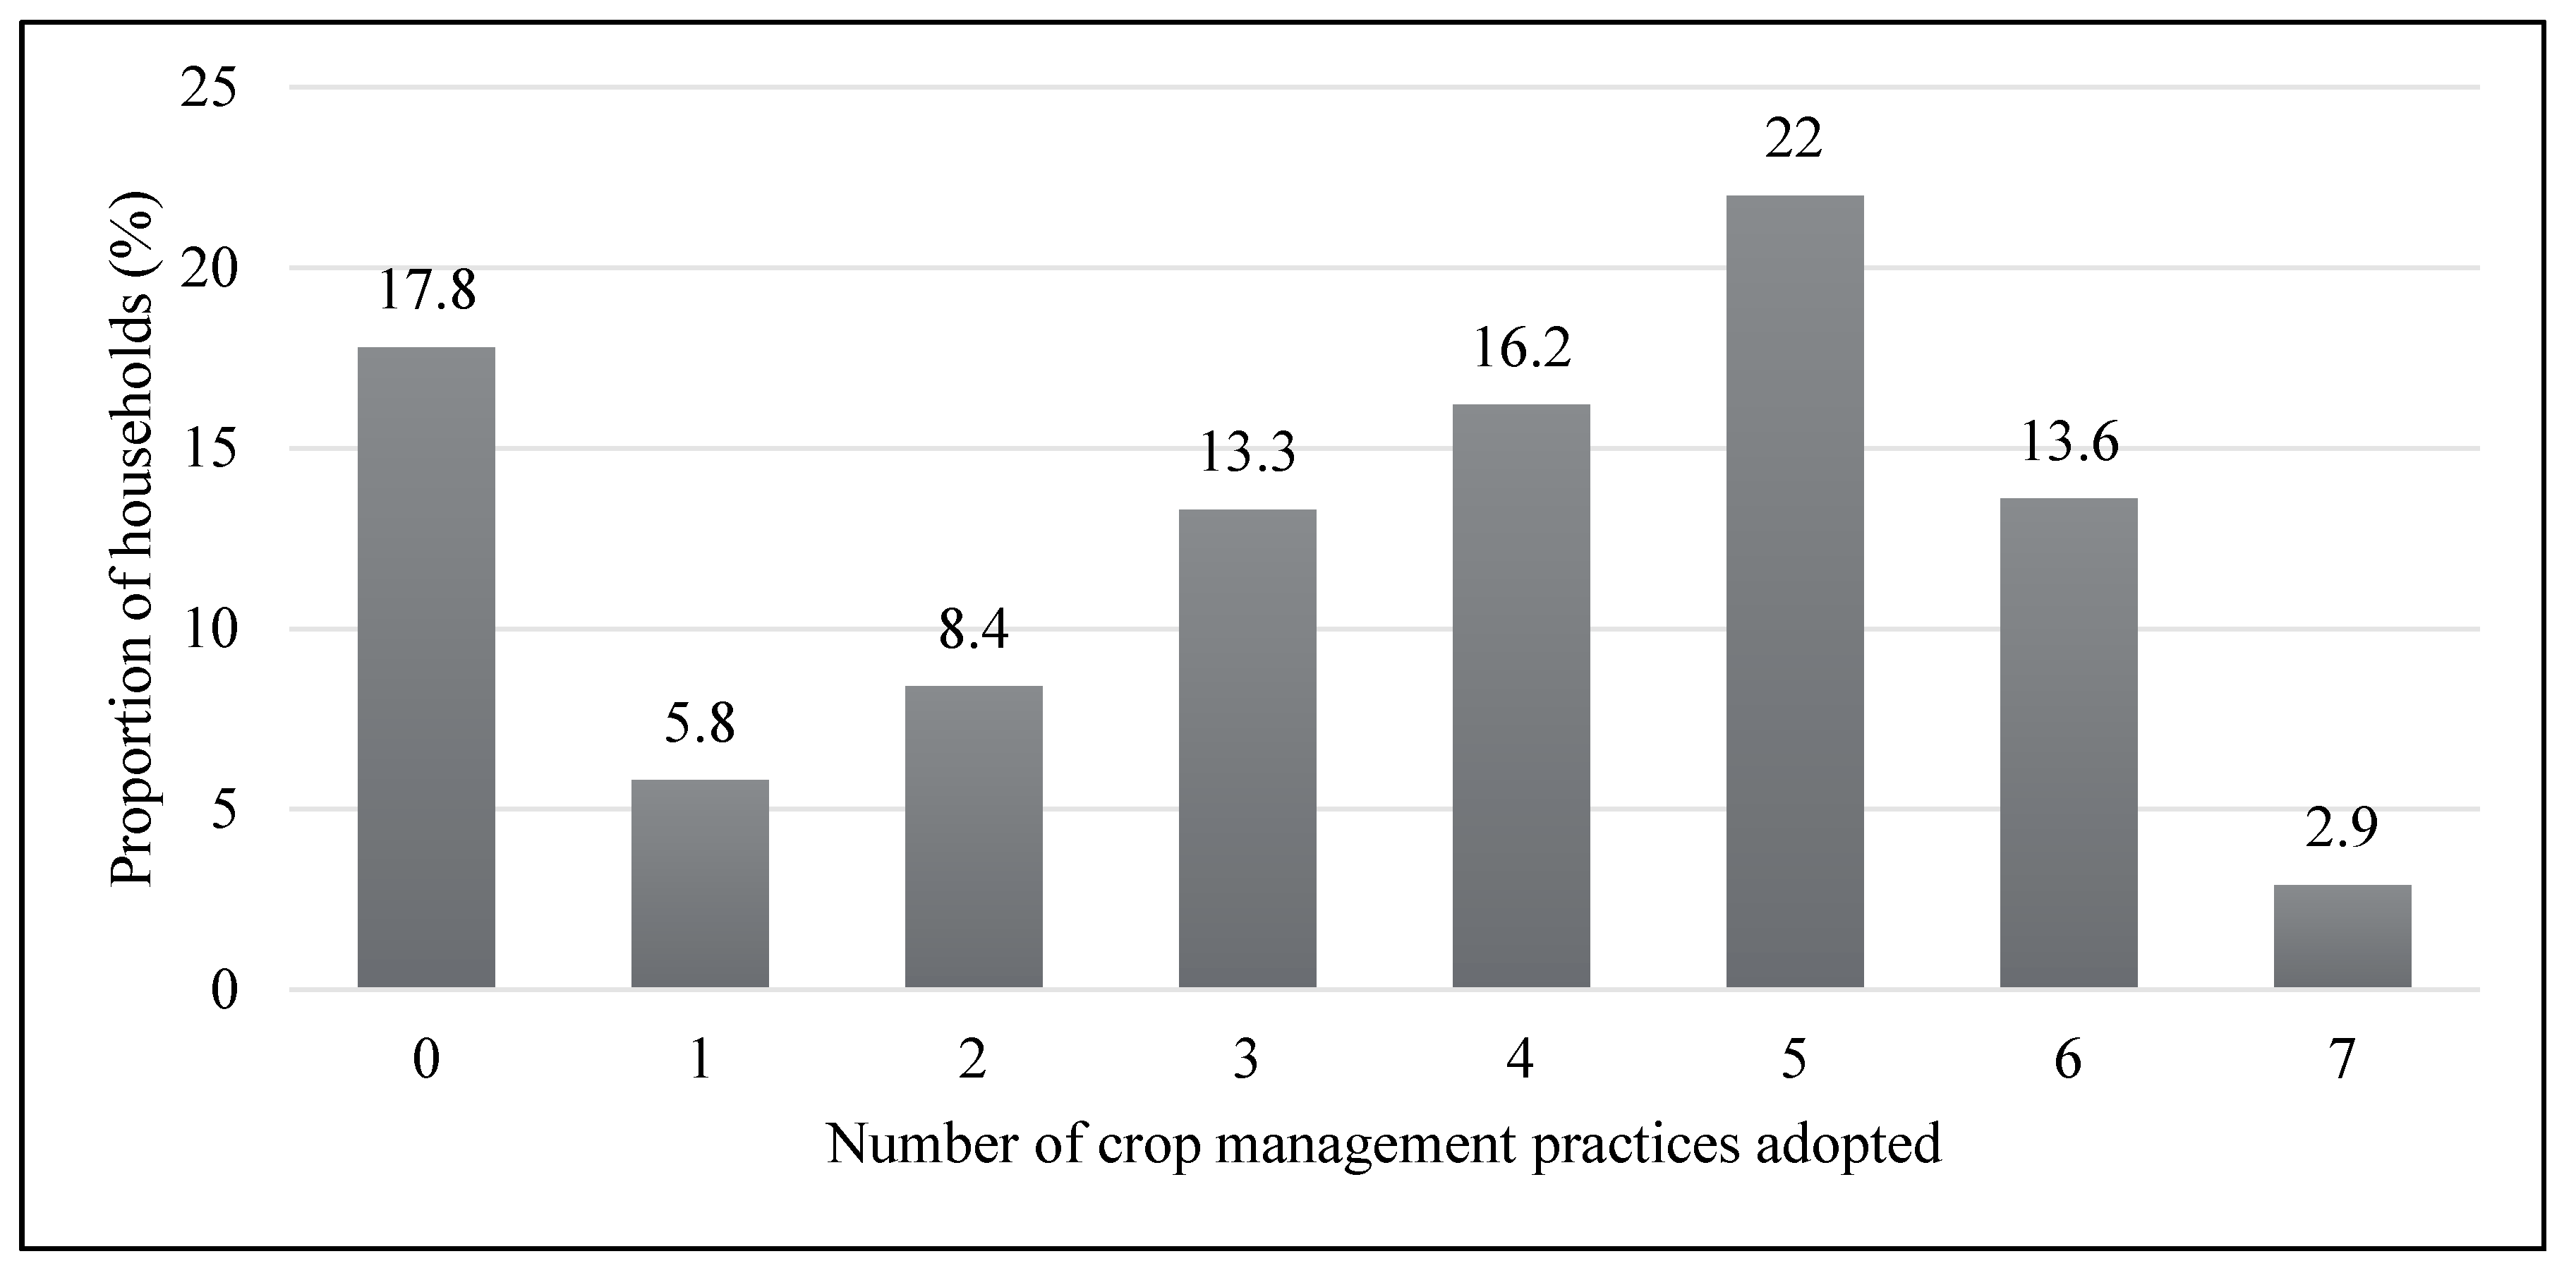
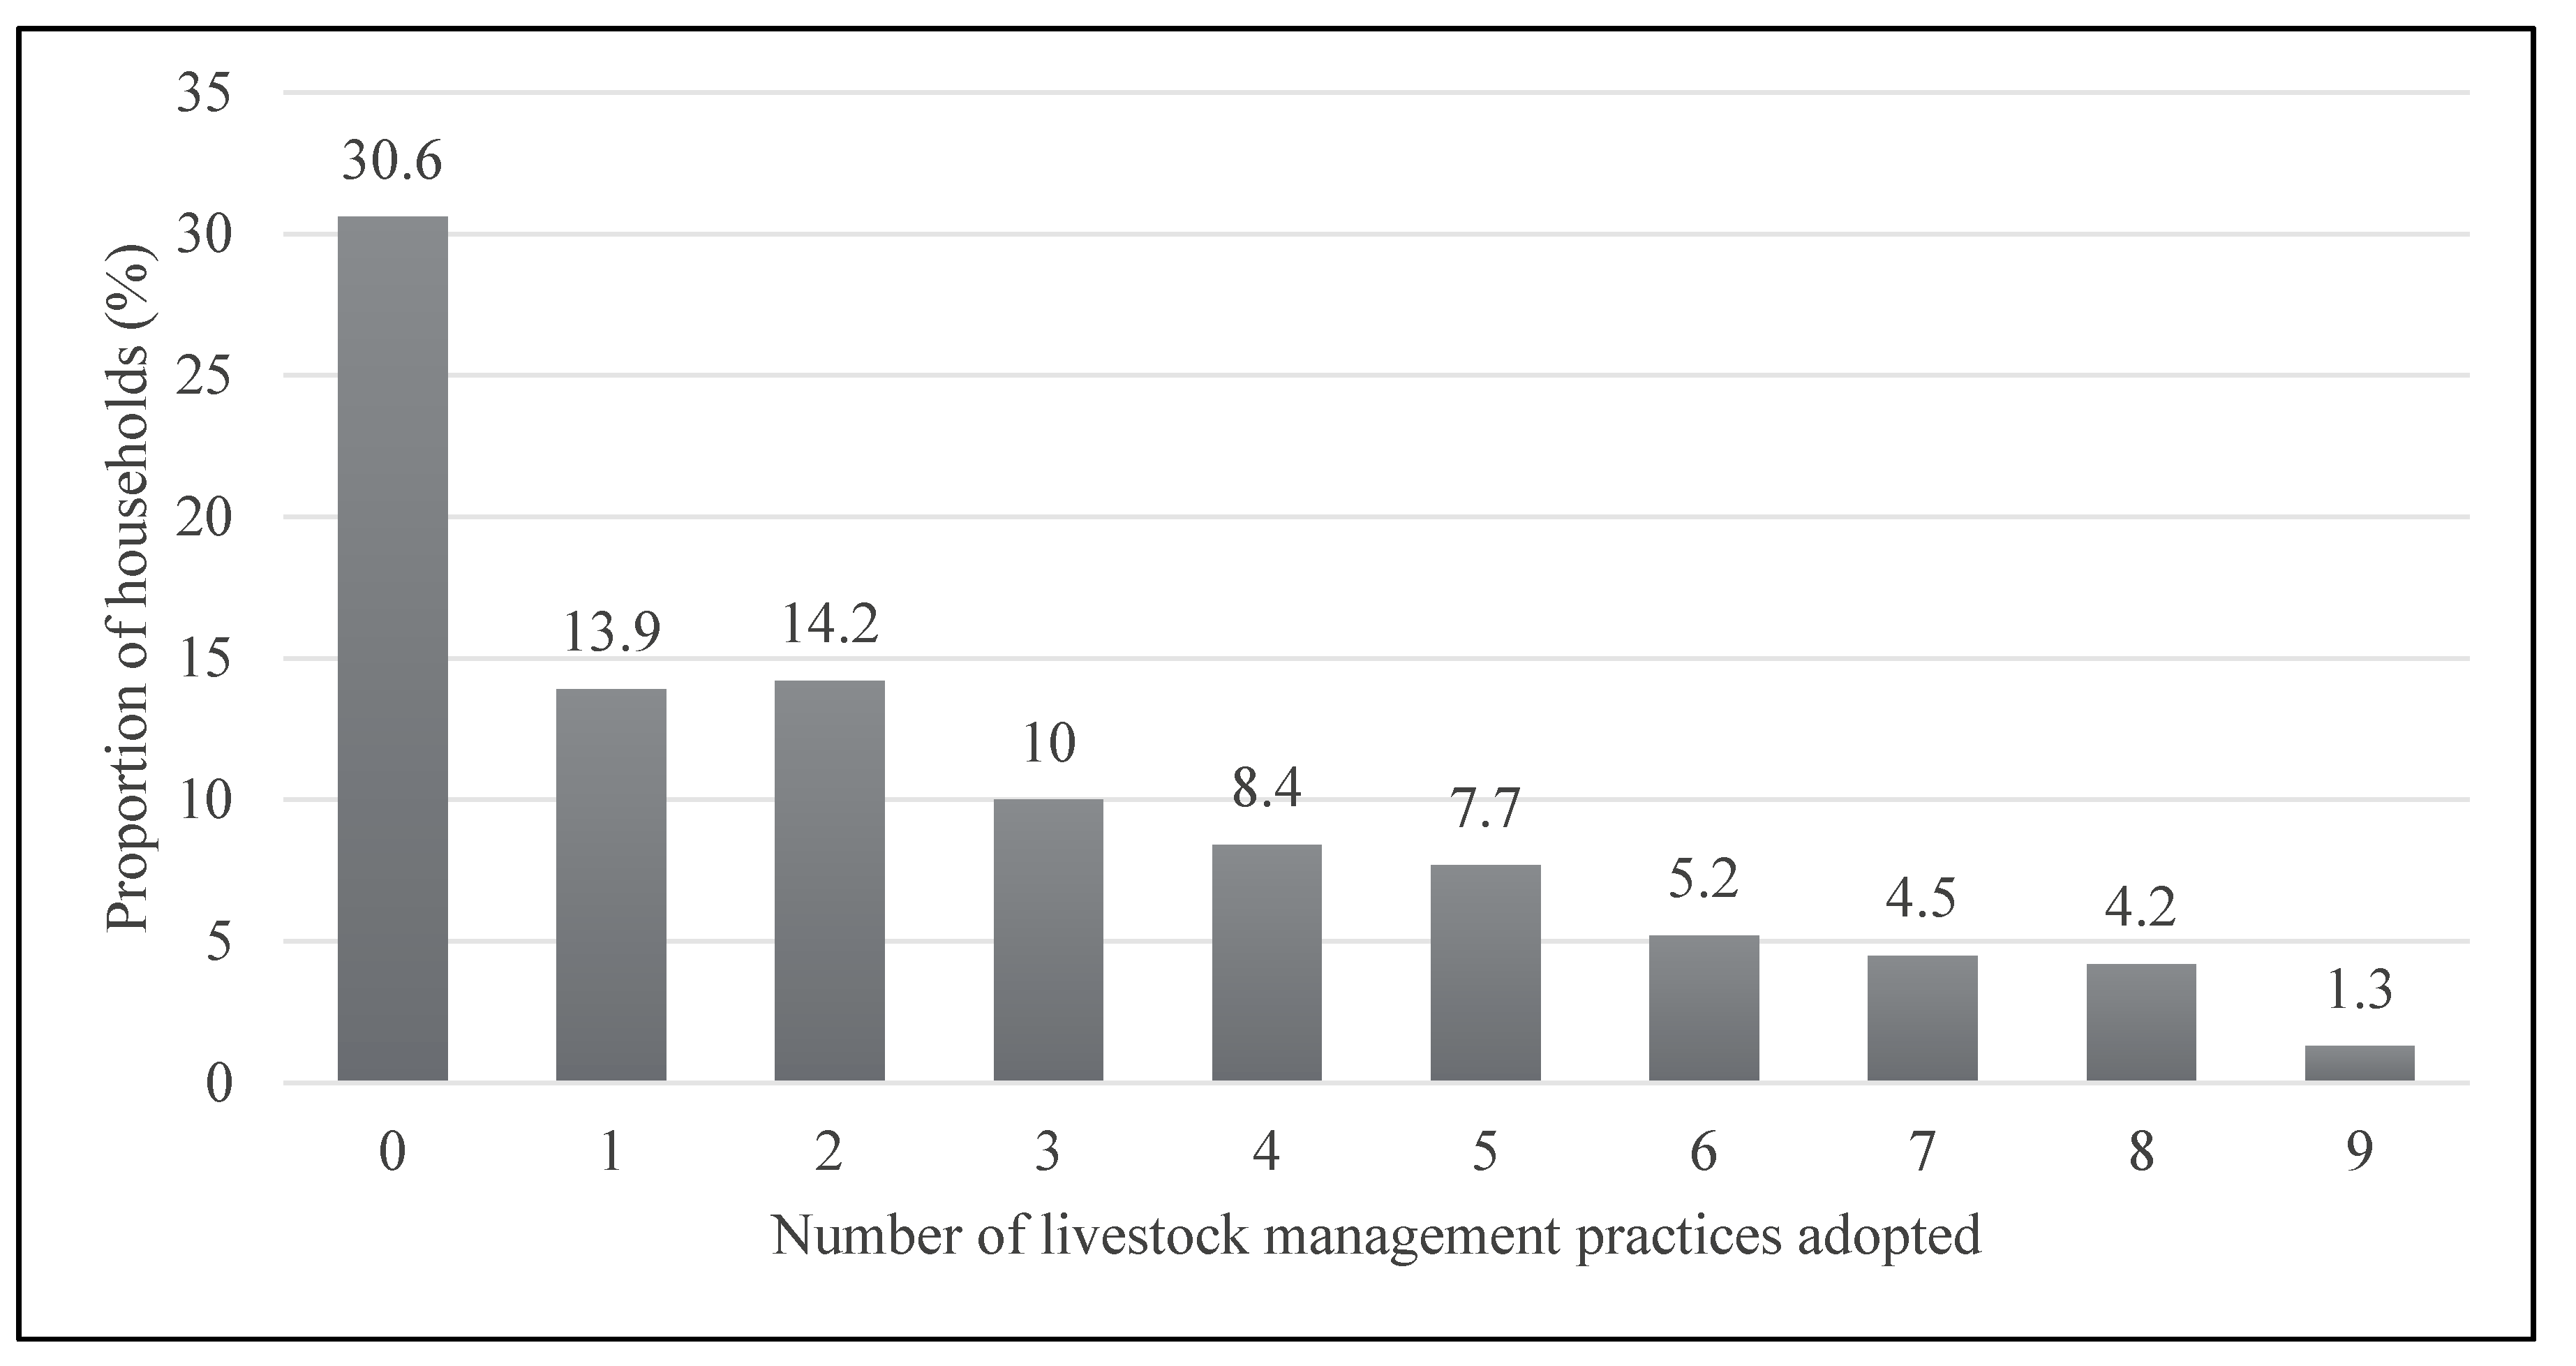
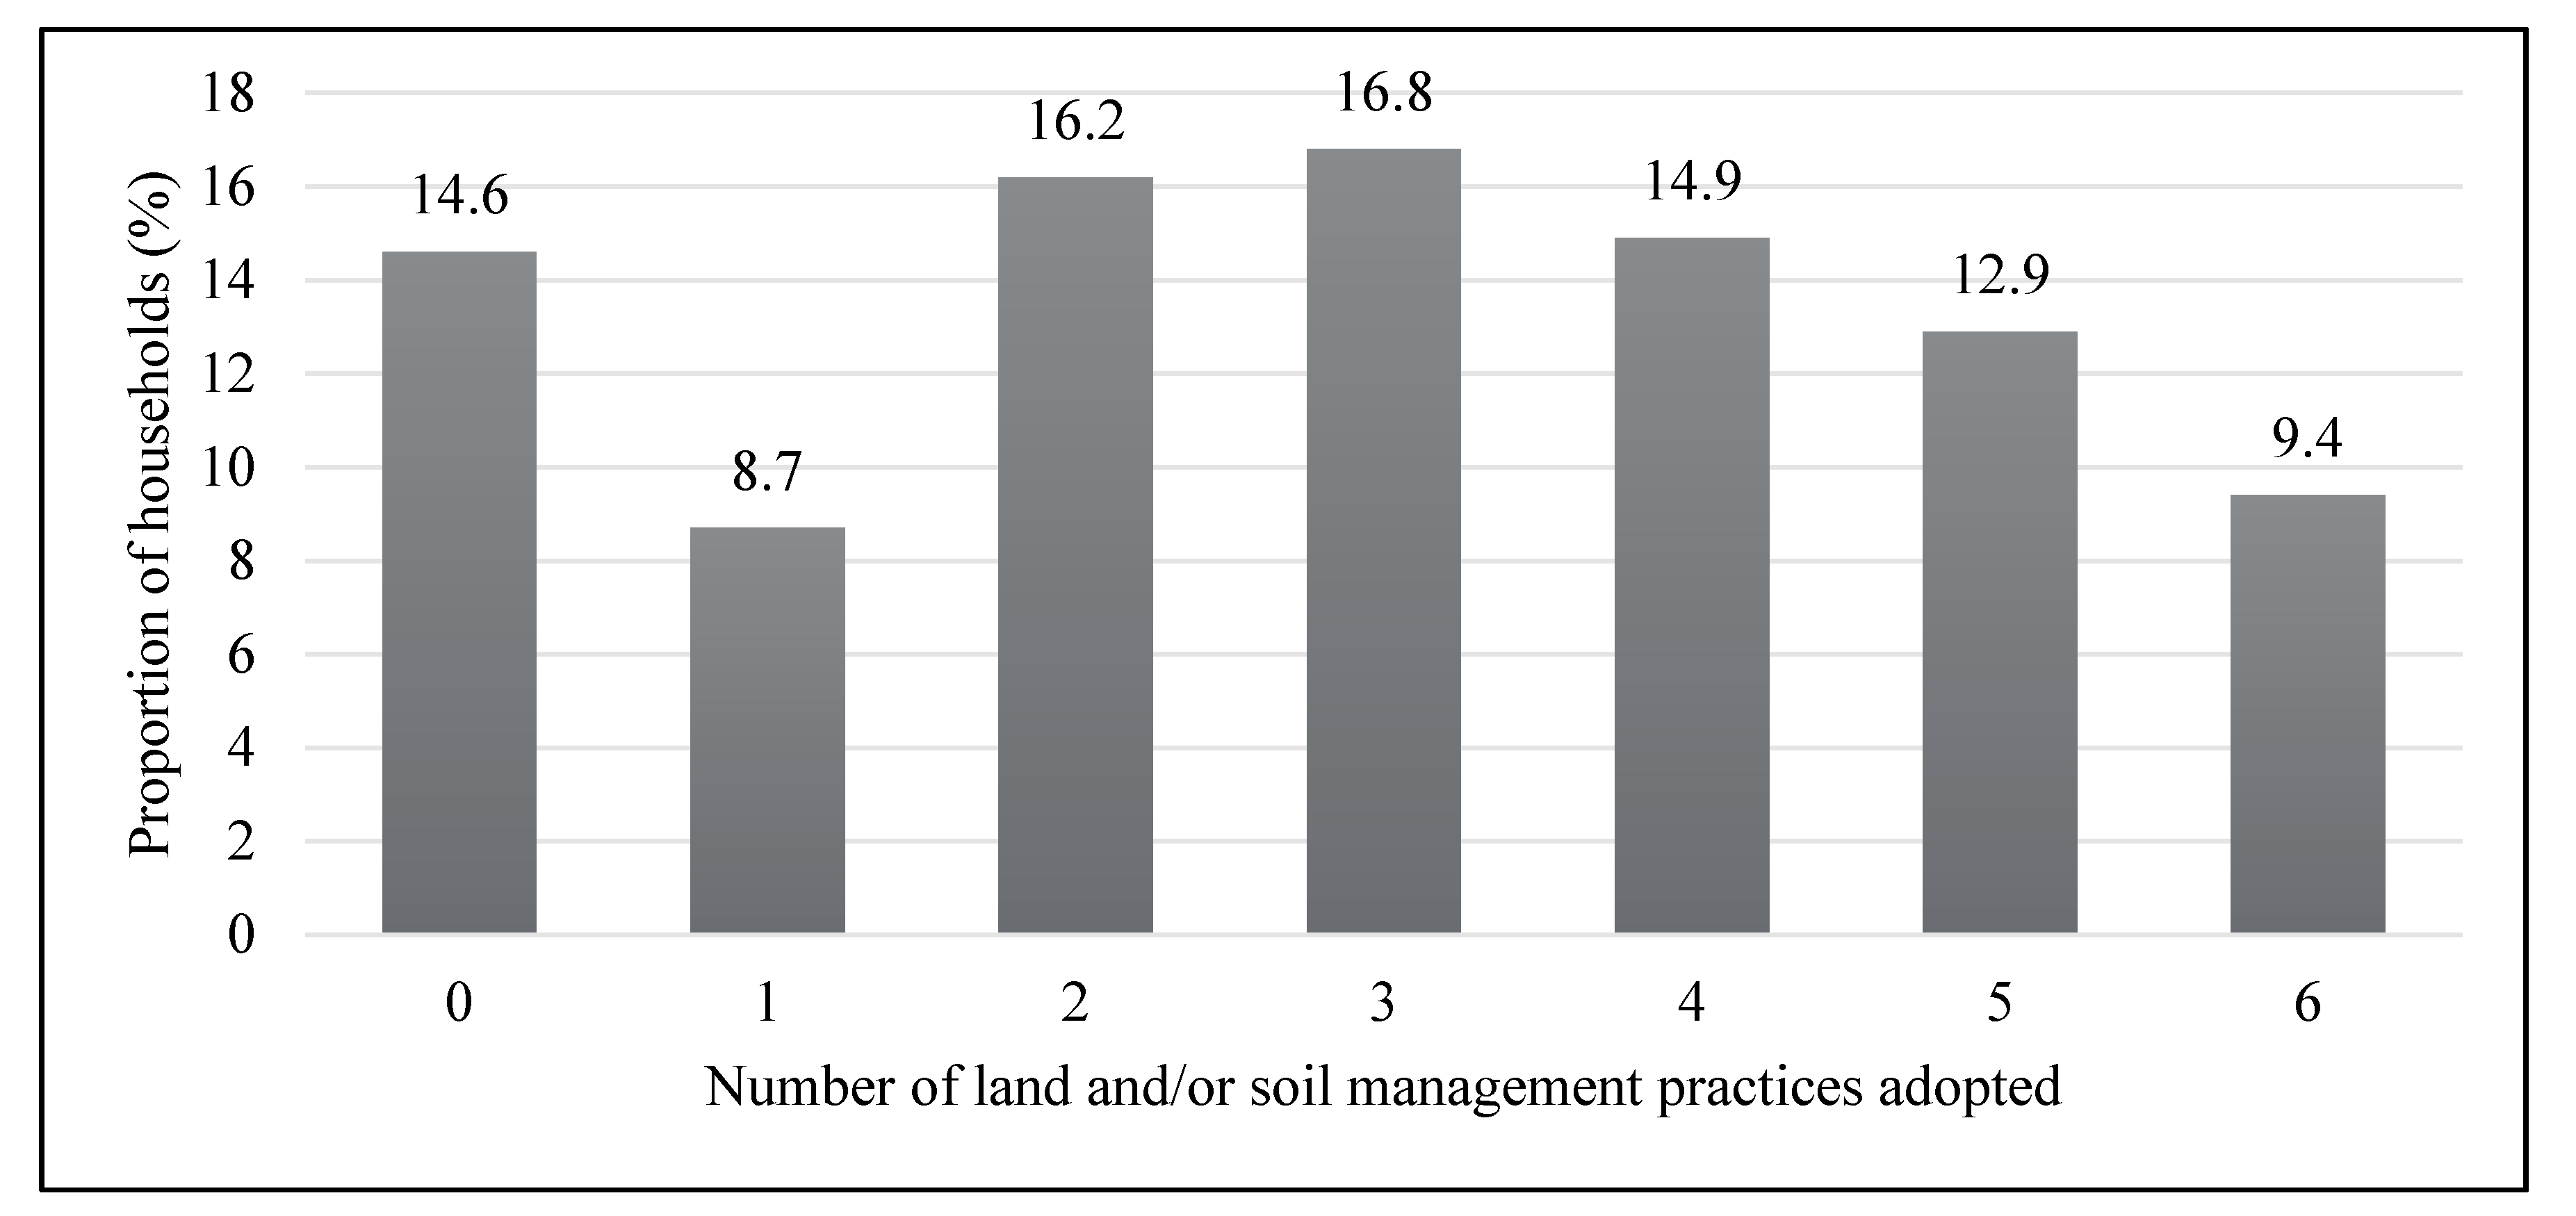
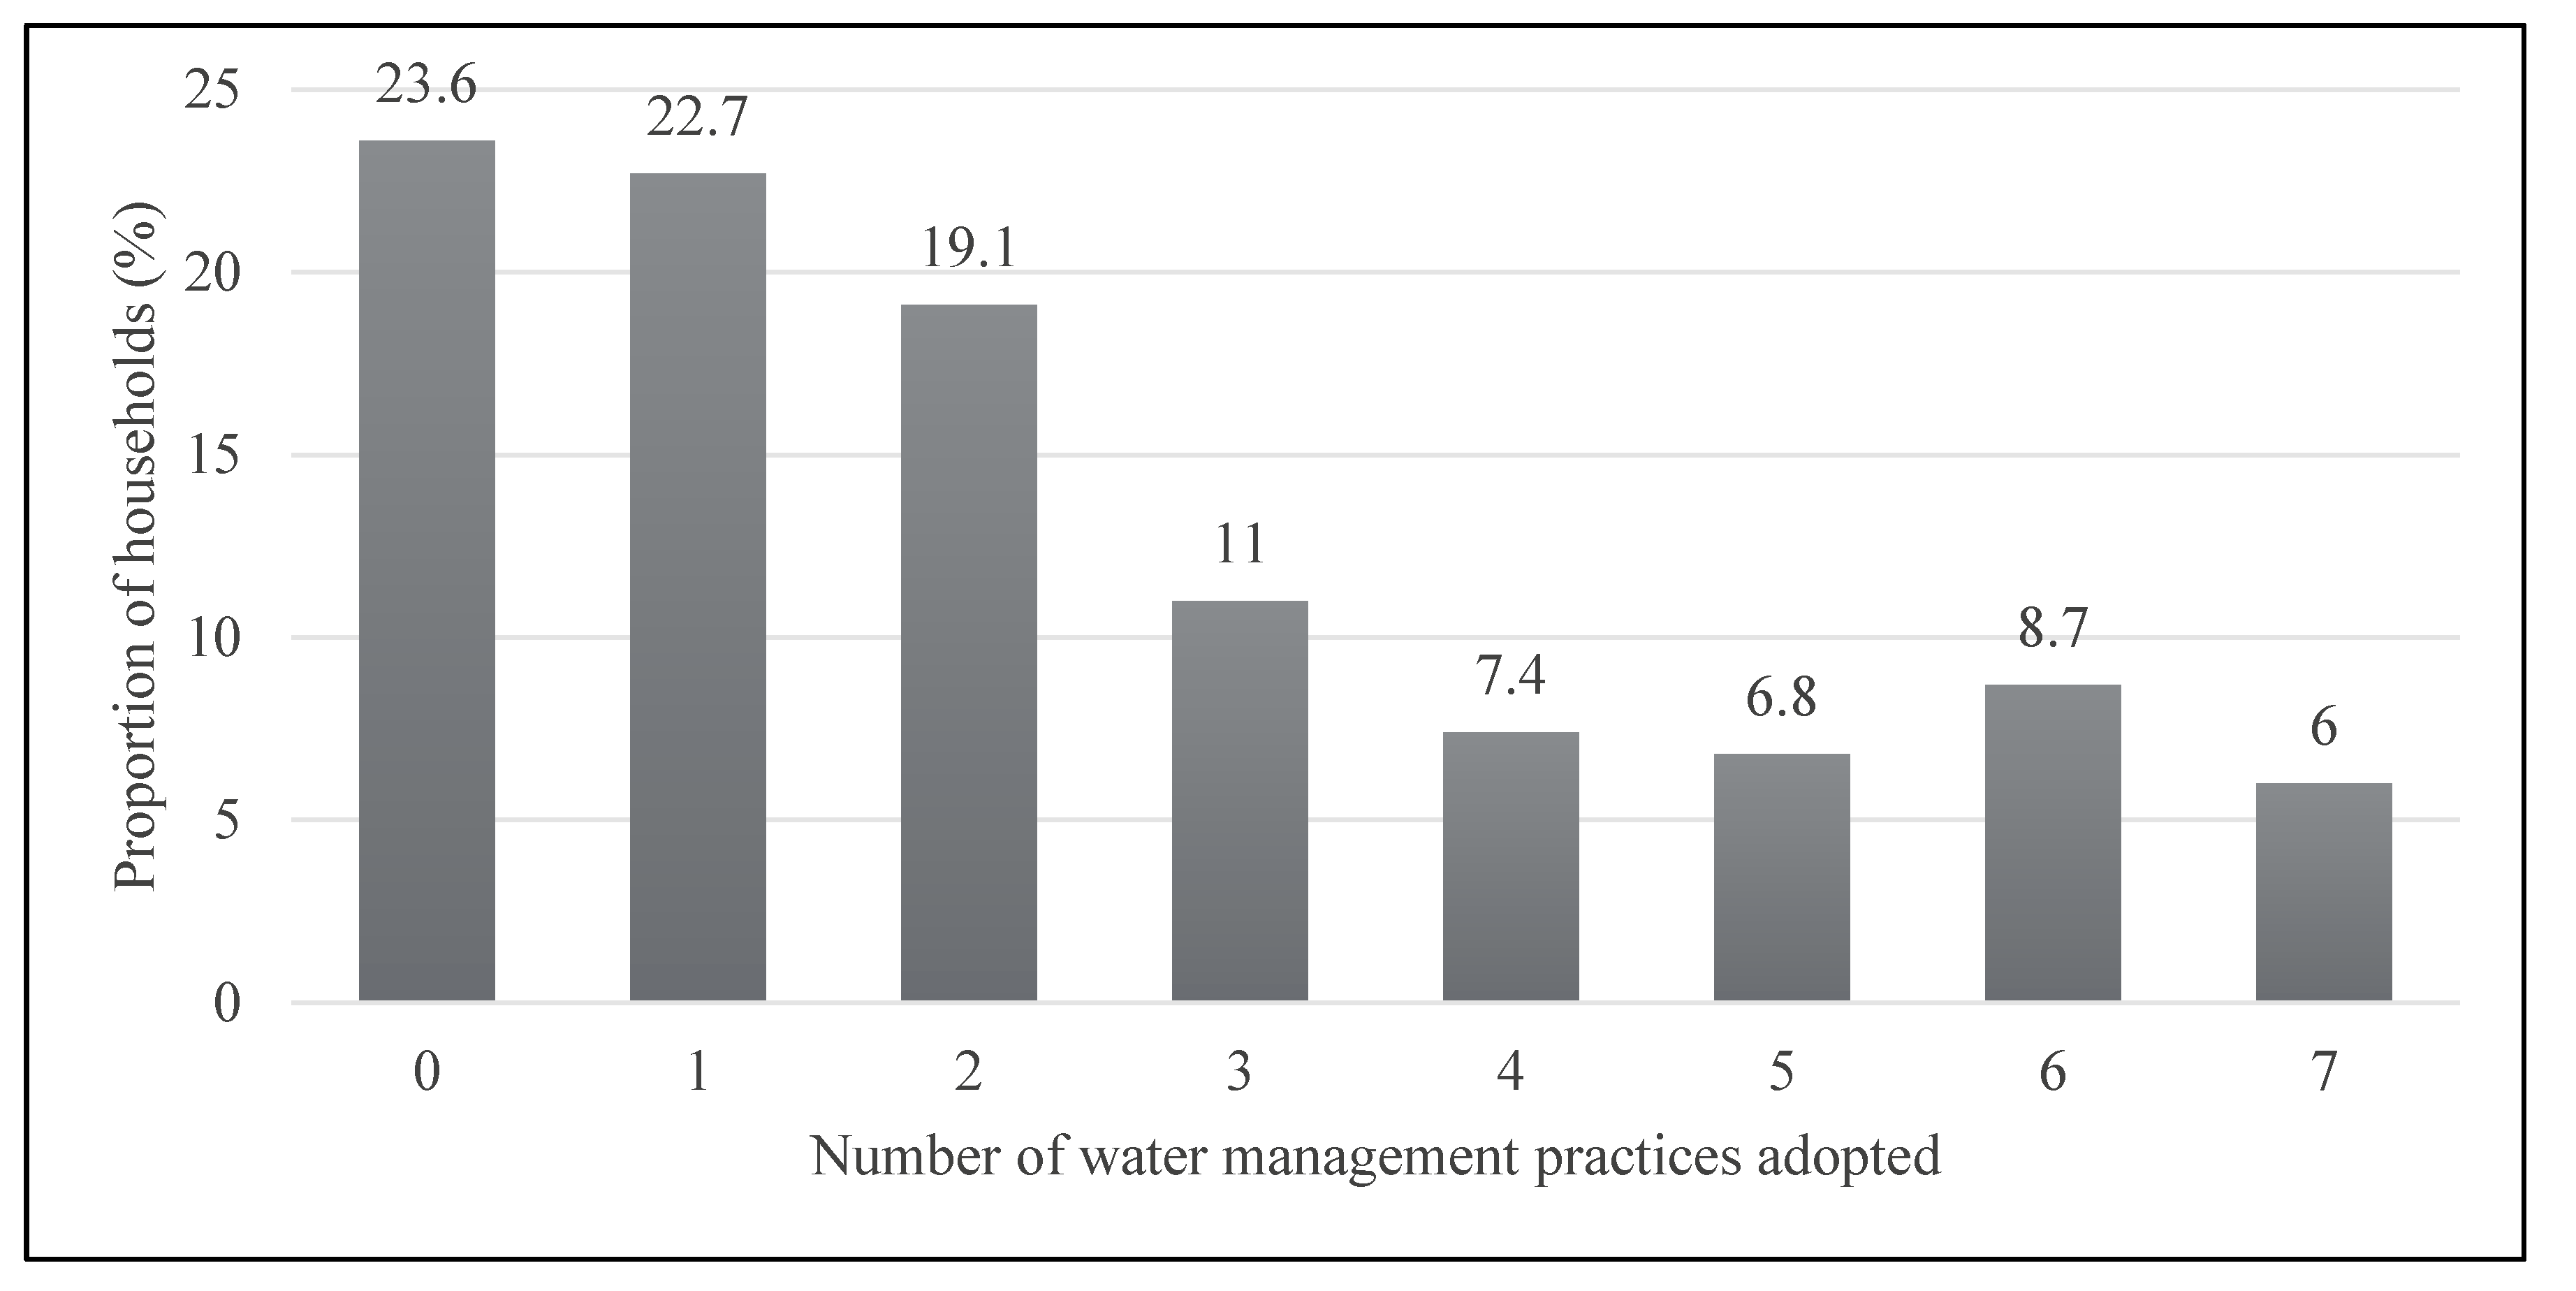
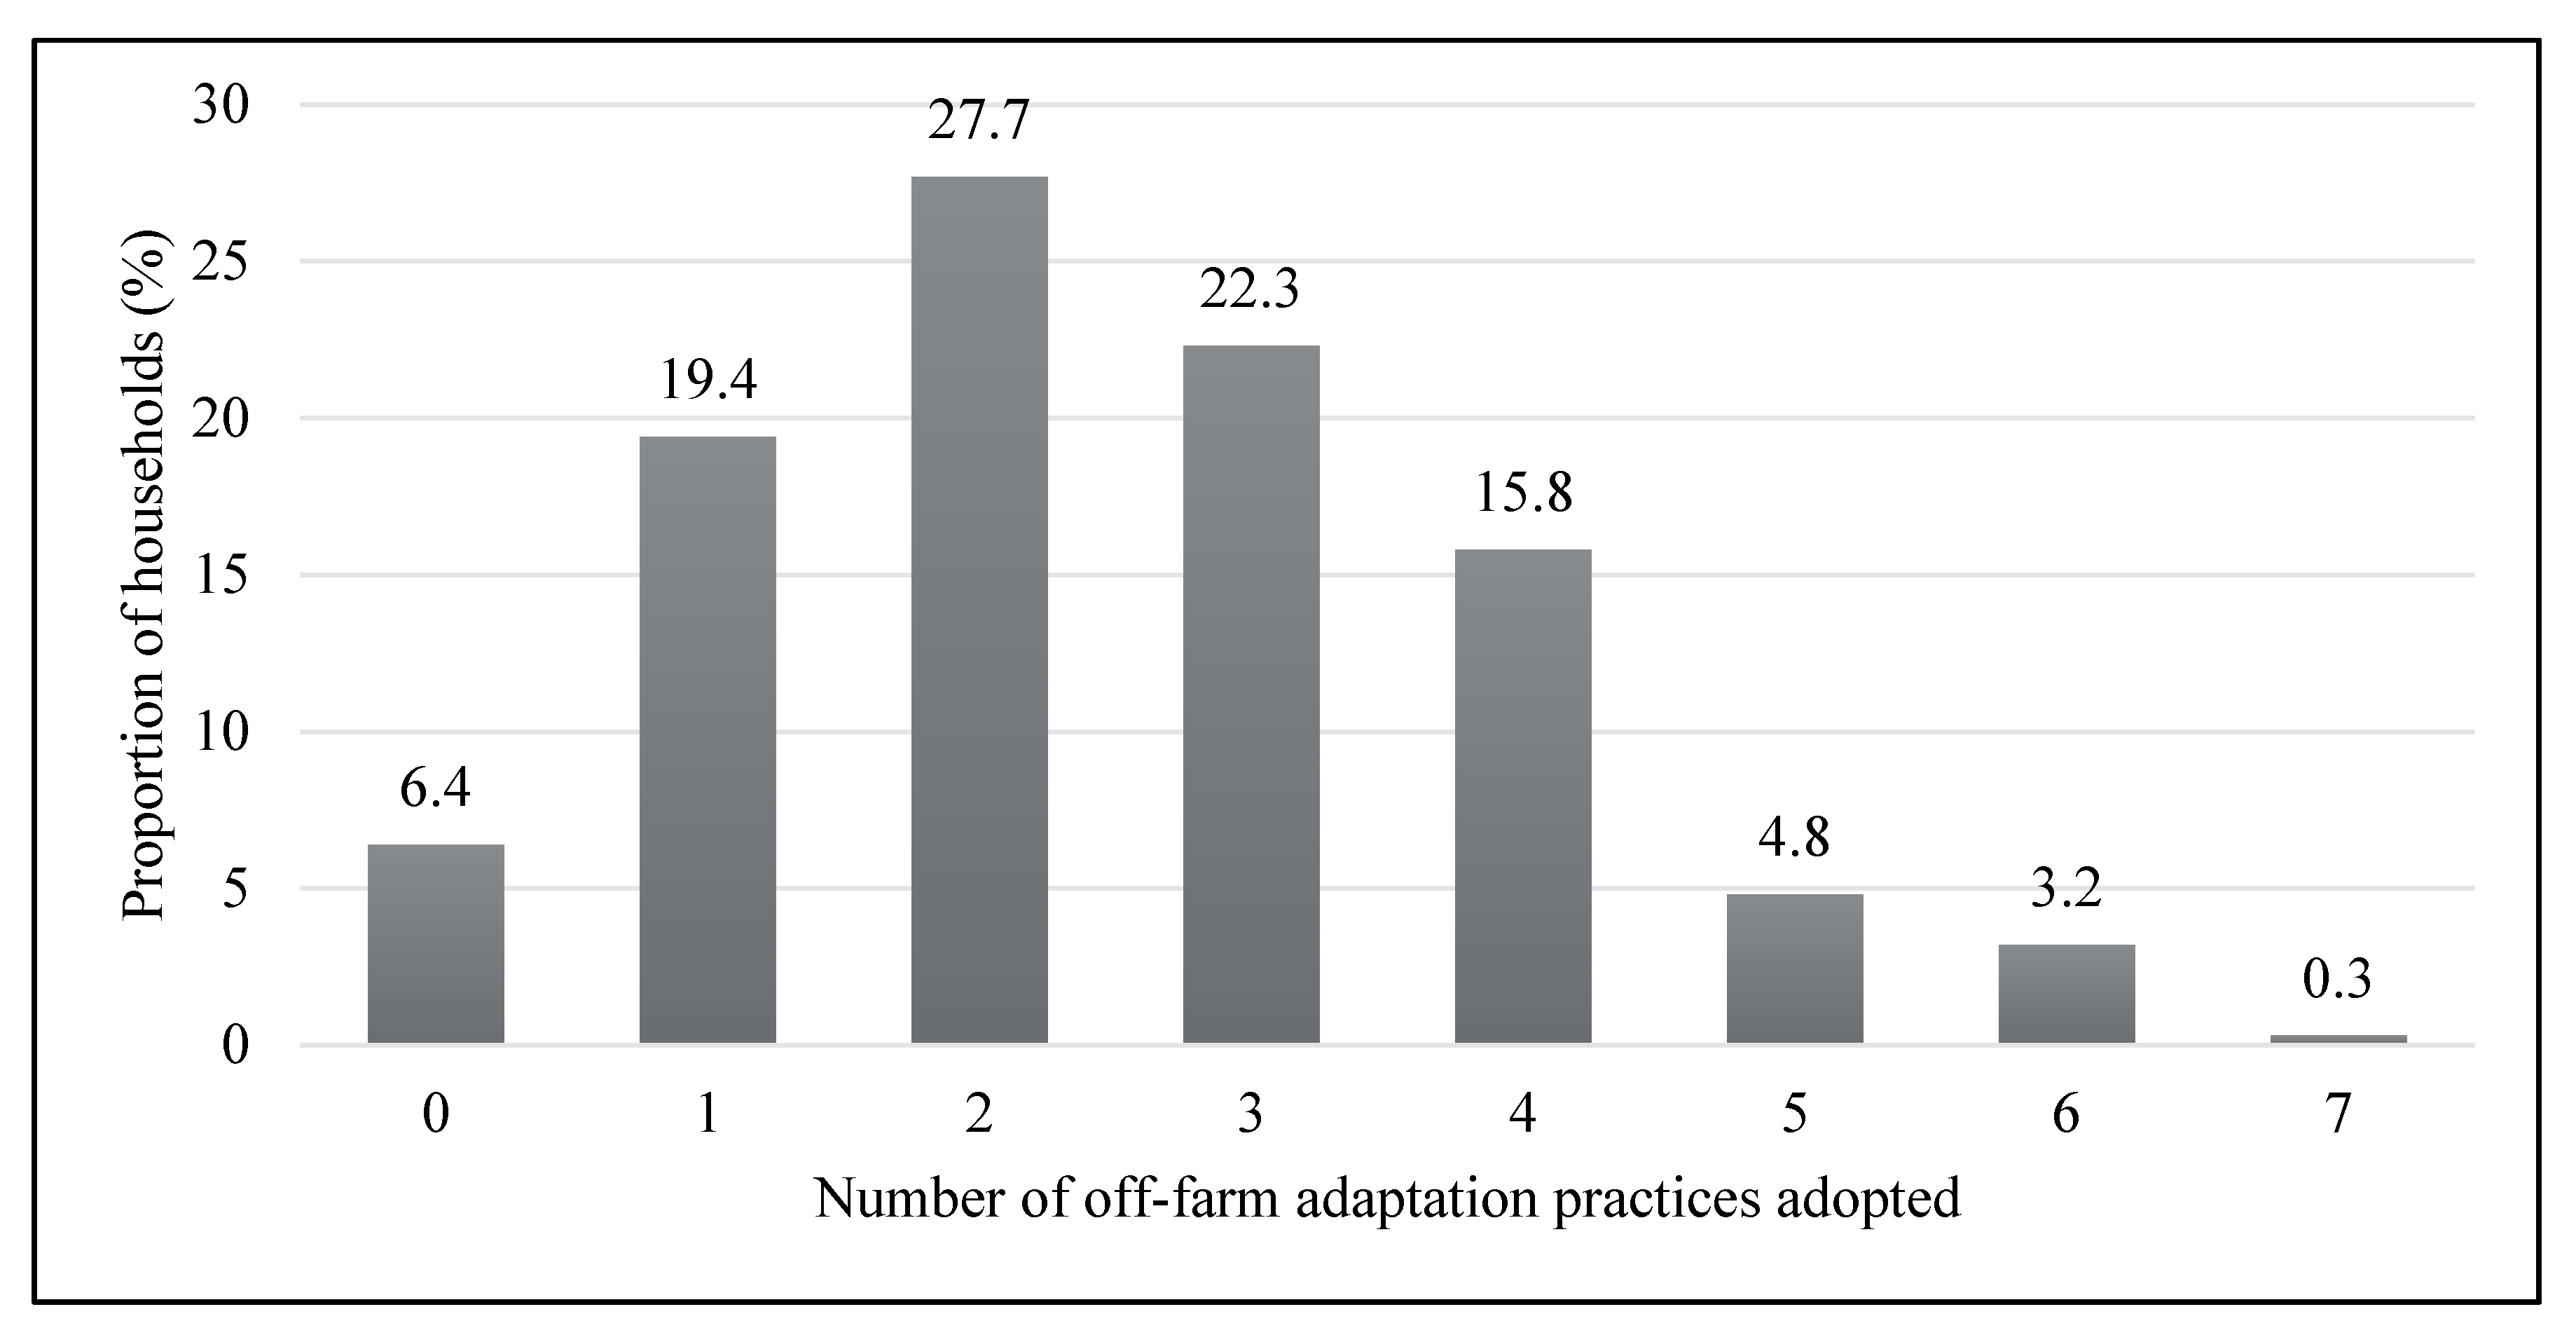
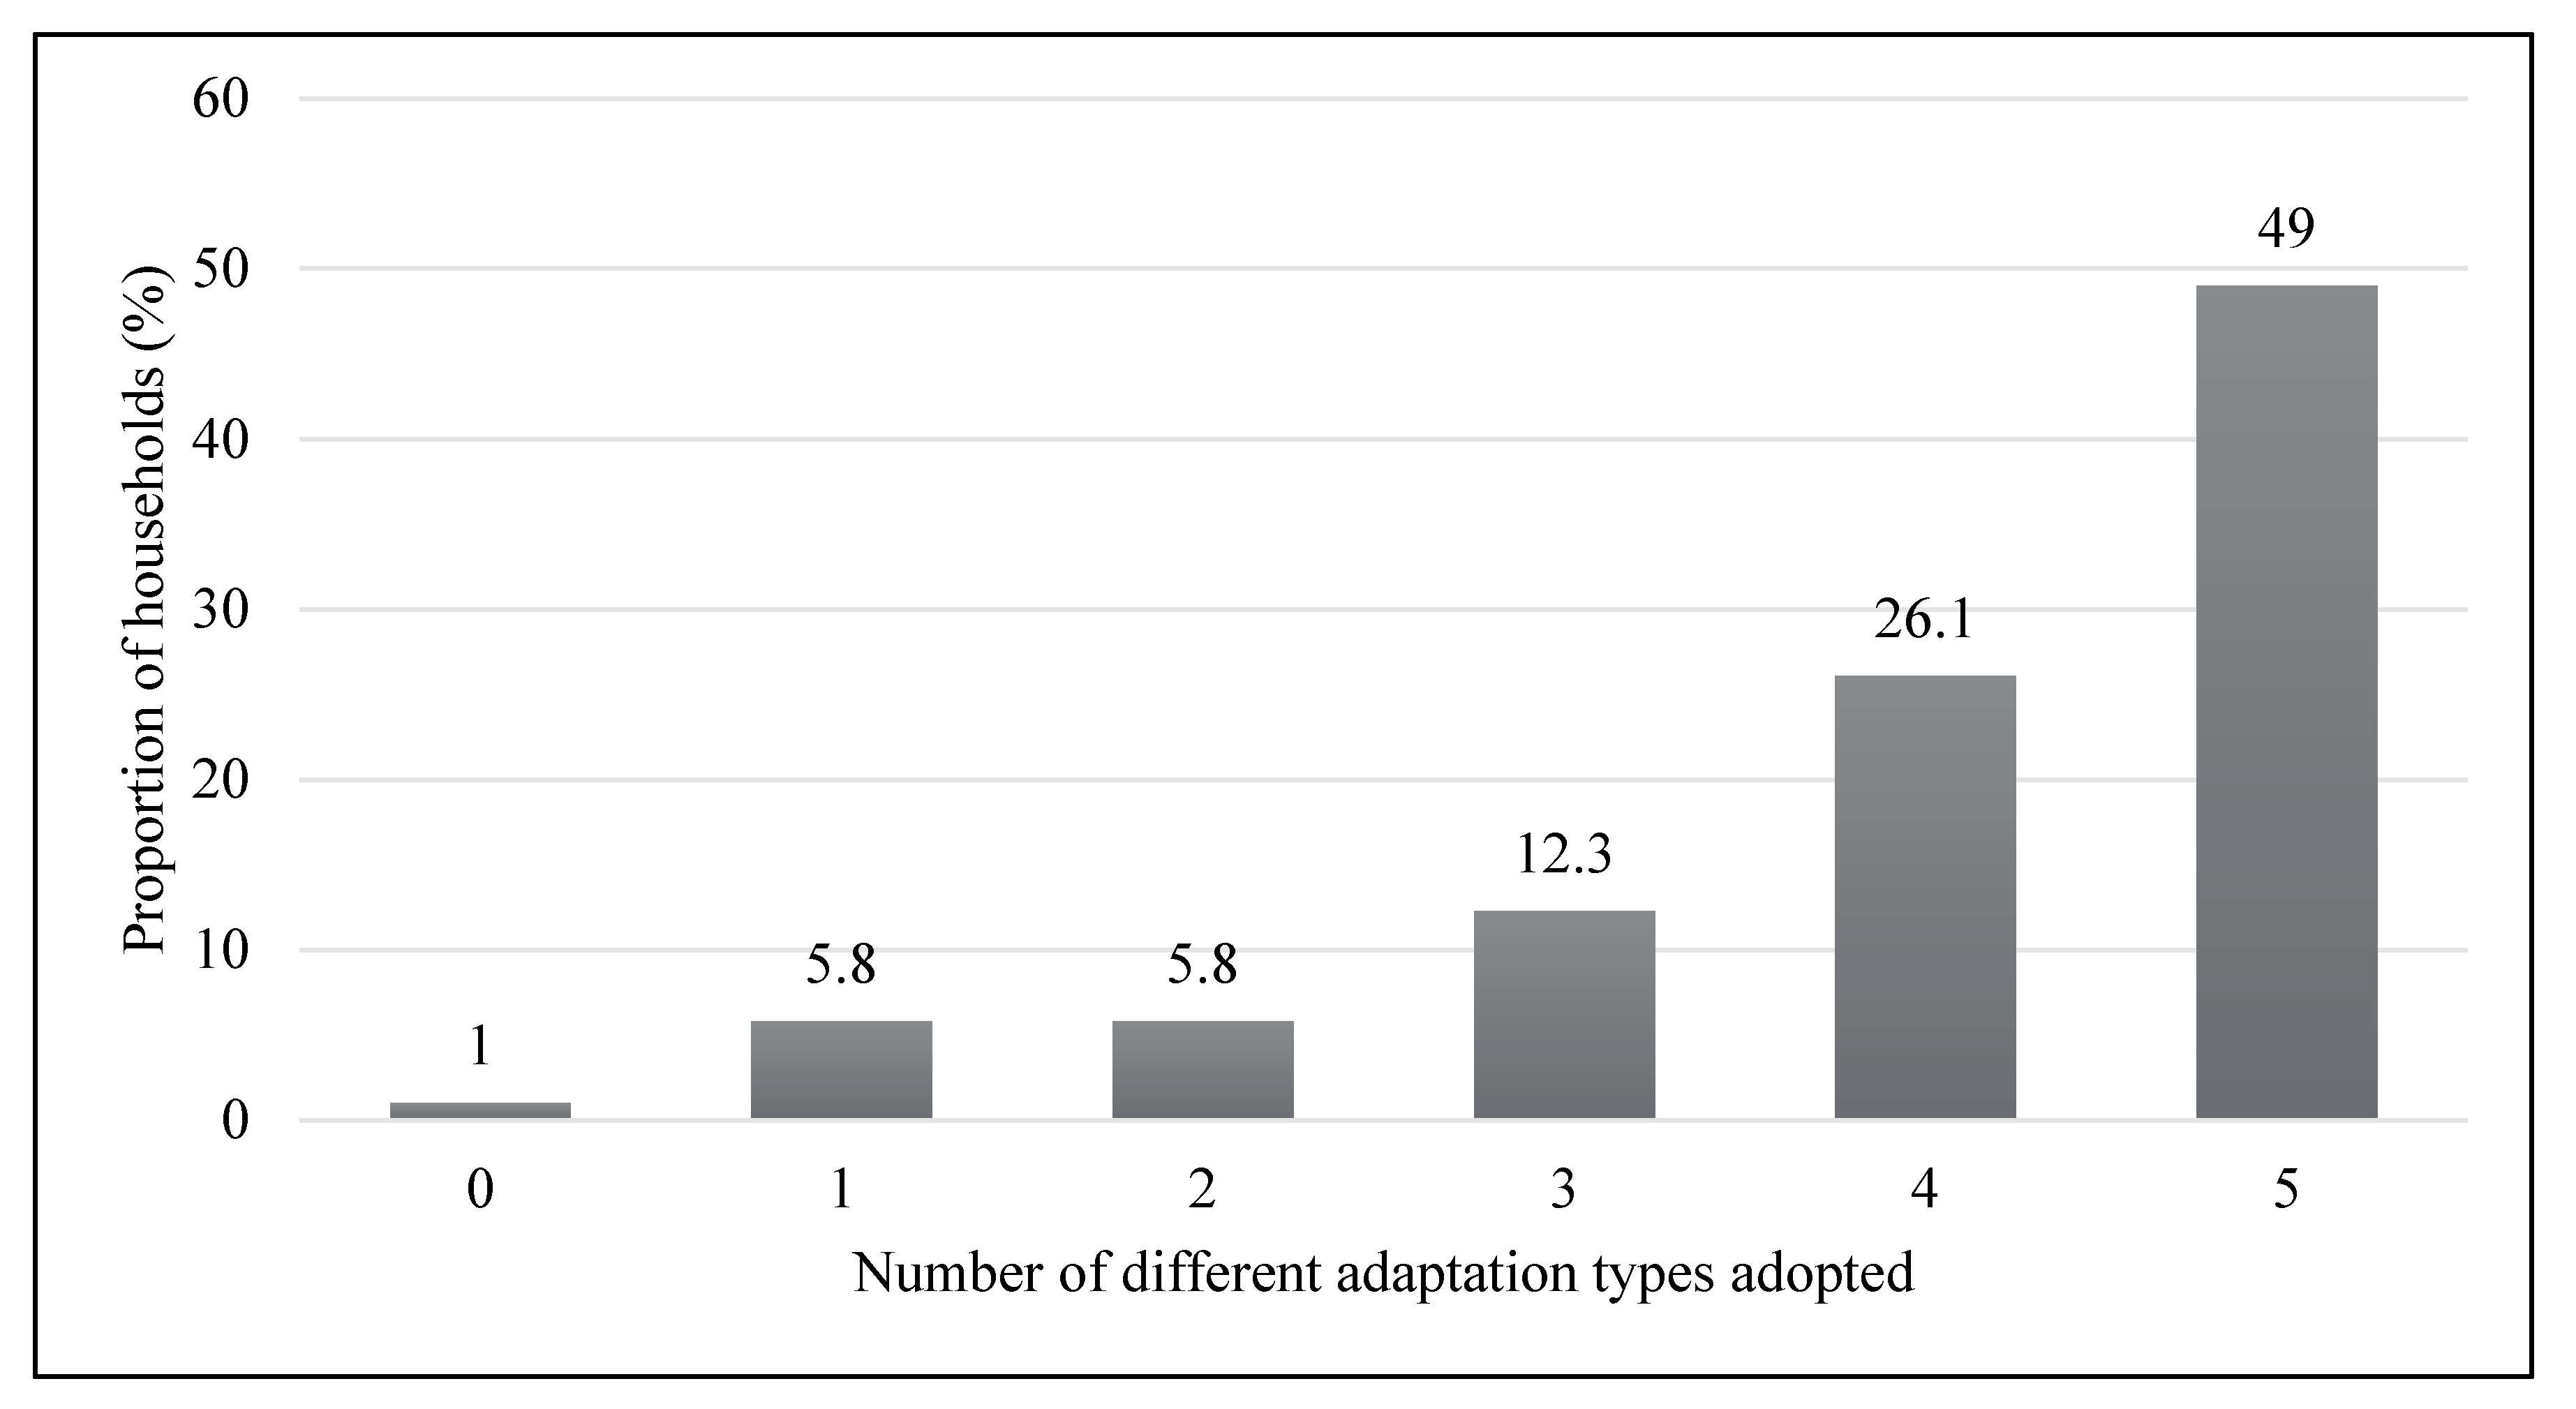
Table 1.
Summary of possible explanatory variables and hypothesized direction of influence.
| Explanatory Variable | Description | Expected Influence |
|---|---|---|
| Household head type | Type of household head (1 if De jure, 0 if De facto) | + |
| Age | Average age of household head (years) | +/− |
| Age group | (1 if young, 0 if adult or elderly) | + |
| Gender | Gender of main decision-maker (De jure head of household) (1 if female; 0 if otherwise) | − |
| Marital status | Marital status of the head of household (1 if married, 0 otherwise) | + |
| Formal education | Number of years in formal education | + |
| Primary occupation | Primary occupation of household head (1 if head is full-time farmer; 0 if part-time farmer) | + |
| Formal employment | Number of people formally employed in the household | + |
| Household size | All people actually staying and depending on the household size | + |
| Rooms in main house | Number of rooms in the main house | − |
| Arable land owned | Arable farm size in hectares | + |
| Annual income | Total annual income of household (BWP) | − |
| Annual remittances | Total remittances accruing to the household (BWP) | − |
| Remittances financing adaptations | Proportion of remittances used for financing adaptation (BWP) | + |
| Community-based Natural Resource Management (CBNRM) dividends | Dividends received from CBNRM in the past 10 years (BWP) | + |
| Land tenure arrangement | Ownership status of agricultural land (1 if household owns privately; 0 otherwise) | + |
| Tropical livestock units (TLU) | A factor representing the total livestock units owned based on dairy cow = 1 livestock unit [33] | + |
| Agricultural input subsidy | Receive agricultural inputs from government or other organizations (1 if full or partial input subsidy; 0 if otherwise) | + |
| Major farm implement | Major farm implements used for farming (1 if tractor or animal drawn, 0 if use hand-held implements) | + |
| Climate information | Access to climate and agricultural information (1 if access, 0 otherwise) | + |
| Type of climate information | Type of climate information mostly used (1 if mostly scientific/meteorological services; 0 if mostly traditional knowledge) | +/− |
| Knowledge of local climate | Knowledge of changes in local climate (1 if knowledgeable of changes in climate; 0 if not) | + |
Table 2.
Socio-economic attributes of households in Bobirwa Sub-district, Botswana.
| Socio-Economic Attributes | N/Mean | % of Cases | DF | χ2 | p-Value | |
|---|---|---|---|---|---|---|
| Average age of household head | Young (20–40) | 57 | 18.4 | |||
| Adult (40–60) | 128 | 41.3 | 2 | 9.332 | 0.009 ** | |
| Elderly (>60) | 125 | 40.3 | ||||
| Gender of household head | Female: (De jure) | 173 | 55.8 | |||
| (De facto) | 74 | 23.9 | ||||
| Male: (De jure) | 55 | 17.7 | 1 | 7.688 | 0.006 ** | |
| (De facto) | 8 | 2.6 | ||||
| Marital status of household head | Married | 80 | 25.8 | |||
| Divorced/Separated | 10 | 3.5 | ||||
| Widowed | 63 | 20.3 | 4 | 16.585 | 0.000 ** | |
| Single | 146 | 47.1 | ||||
| Partner (unmarried) | 10 | 3.2 | ||||
| Education level of household head | None | 84 | 27.1 | |||
| Primary | 122 | 39.4 | ||||
| Secondary | 71 | 22.9 | 4 | 0.014 * | ||
| Vocational | 21 | 6.8 | ||||
| Tertiary | 12 | 3.9 | ||||
| Employment status of household head | Full-time on-farm | 100 | 32.3 | 1 | 0.160 | 0.689 |
| Part-time on-farm | 210 | 67.7 | ||||
| Average household size [available during the last 12 months] | Female | 3.28 | 55.8 | |||
| Male | 2.60 | 44.2 | ||||
| Average emigrants per household | Female | 1.24 | 45.8 | |||
| Male | 1.48 | 54.2 | ||||
| Average arable farm size (ha) | Total land owned | 8.85 | - | |||
| Cultivated area | 2.32 | 26.2 | ||||
| Average annual income of household (BWP) | <5000 | 193 | 62.3 | |||
| 5000–10,000 | 39 | 12.6 | ||||
| 10,001–15,000 | 19 | 6.1 | 4 | 4.160 | 0.385 | |
| 15,001–20,000 | 15 | 4.8 | ||||
| >20,000 | 44 | 14.2 | ||||
| Proportion of remittances invested in climate change adaptation | <50% | 33 | 10.6 | |||
| 50% | 17 | 5.5 | ||||
| 75% | 34 | 11.0 | 4 | 9.956 | 0.996 | |
| 100% | 18 | 5.8 | ||||
| None | 208 | 67.1 | ||||
| Ownership status of agricultural land | Own privately | 198 | 63.8 | |||
| Family land | 13 | 4.2 | ||||
| Communal land | 16 | 5.2 | 4 | 7.300 | 0.132 | |
| Rent/lease privately | 21 | 6.8 | ||||
| No agricultural land | 62 | 20.0 | ||||
| Livestock owned | Cattle | 6.27 | 37.4 | 1 | 0.201 | 0.654 |
| Donkeys | 1.42 | 26.1 | 1 | 5.117 | 0.077 | |
| Goats | 7.77 | 55.5 | 1 | 9.633 | 0.008 ** | |
| Sheep | 1.02 | 10.3 | 1 | 0.649 | 0.421 | |
| Poultry | 7.47 | 61.3 | 1 | 0.389 | 0.533 | |
| Government agricultural input support received | Full subsidy | 145 | 46.8 | |||
| Partial subsidy | 17 | 5.5 | 3 | 1.145 | 0.887 | |
| Paid full cost | 33 | 10.6 | ||||
| None | 115 | 37.1 | ||||
| Major farm implements used | Hand-held | 204 | 65.8 | 1 | 3.514 | 0.037 * |
| Animal-drawn | 137 | 44.2 | 1 | 9.257 | 0.026 * | |
| Tractor-drawn | 11 | 3.5 | 1 | 0.004 | 0.950 | |
| Access to climate and agricultural information | Yes | 282 | 91.0 | 1 | 0.071 | 0.790 |
| No | 28 | 9.0 | ||||
| Information channels used | Cellphone | 293 | 94.5 | 1 | 12.515 | 0.003 ** |
| Radio | 160 | 51.6 | 1 | 7.667 | 0.105 | |
| Television set | 197 | 63.5 | 1 | 6.678 | 0.083 | |
| Adoption of new crops or farming practices informed/influenced by | Radio or TV programme | 242 | 78.1 | 1 | 3.940 | 0.047 * |
| Seasonal weather forecasts | 226 | 72.9 | 1 | 8.413 | 0.015 * | |
| Extension officers | 220 | 71.0 | 1 | 4.729 | 0.094 | |
| Village Chief (Kgosi) | 130 | 41.9 | 1 | 0.028 | 0.868 | |
| Observing other farmers | 123 | 39.7 | 1 | 334 | 0.248 | |
| Farmer organizations | 72 | 23.2 | 1 | 3.219 | 0.073 | |
| Farmers’ Magazines | 26 | 8.4 | 1 | 0.764 | 0.382 | |
| Major type of climate/weather information used frequently | Meteorological services | 181 | 58.4 | 1 | 4.270 | 0.039 * |
| Traditional knowledge | 129 | 41.6 | ||||
Significance level; * p < 0.05, ** p < 0.01, *** p < 0.001. Source: Household Survey Data, 2017.
Table 3.
Crop management adaptation strategies used by households in Bobirwa sub-district.
| Adaptation Measure | N | % of Cases | DF | χ2 | p-Value |
|---|---|---|---|---|---|
| Adopted drought-tolerant crops varieties | 225 | 72.6 | 1 | 0.610 | 0.435 |
| Sequential timings of cropping | 182 | 58.7 | 1 | 1.323 | 0.250 |
| Adopted early maturing crops | 219 | 70.6 | 1 | 0.214 | 0.643 |
| Introduced new crops not grown before | 124 | 40.0 | 1 | 1.199 | 0.274 |
| Using conservation agriculture | 76 | 24.5 | 1 | 3.522 | 0.172 |
| Had plots in different geographical areas | 65 | 21.0 | 1 | 2.759 | 0.097 * |
| Changed planting times (early planting) | 158 | 51.0 | 1 | 0.001 | 0.975 |
Significance levels: * p < 0.05, ** p < 0.01, *** p < 0.001. Source: Household Survey Data, 2017.
Table 4.
Livestock management adaptation strategies by households in Bobirwa sub-district.
| Adaptation Measure | N | % of Cases | DF | χ2 | p-Value |
|---|---|---|---|---|---|
| Used supplementary feeding | 117 | 37.7 | 1 | 8.860 | 0.003 ** |
| Changing the composition of livestock | 79 | 25.5 | 1 | 6.622 | 0.010 * |
| Got grazing rights from other traditional authorities | 102 | 32.9 | 1 | 0.845 | 0.358 |
| Livestock sale/destocking | 128 | 41.3 | 1 | 4.012 | 0.045 * |
| Moving livestock to other geographical areas | 113 | 36.5 | 1 | 4.257 | 0.039 * |
| Purchase of new types of the same animals | 81 | 26.1 | 1 | 5.866 | 0.015 * |
| Received livestock through government/NGO | 59 | 19.0 | 1 | 0.000 | 0.997 |
| Started animal rearing/feed lot | 58 | 18.7 | 1 | 1.352 | 0.245 |
| Formed associations/collectives, e.g., grazing | 44 | 14.2 | 1 | 2.694 | 0.101 |
Significance levels: * p < 0.05, ** p < 0.01, *** p < 0.001. Source: Household Survey Data, 2017.
Table 5.
Land and soil management adaptation measures by households in Bobirwa sub-district.
| Adaptation Measure | N | % of Cases | DF | χ2 | p-Value |
|---|---|---|---|---|---|
| Sought for planting land in better place | 80 | 25.8 | 1 | 0.782 | 0.376 |
| Increased cultivated area to go grow more | 130 | 41.9 | 1 | 0.028 | 0.868 |
| Introduced irrigation | 25 | 8.1 | 1 | 0.002 | 0.967 |
| Changed harvesting times | 151 | 48.7 | 1 | 0.137 | 0.711 |
| Changed use of fertilizers and agrochemicals | 60 | 19.4 | 1 | 1.005 | 0.316 |
| Used seasonal forecasts/drought early warning systems | 189 | 61.0 | 1 | 9.389 | 0.002 ** |
| Used extension services for advice on farming | 223 | 71.9 | 1 | 9.172 | 0.010 * |
| Used soil & water conservation methods | 128 | 41.3 | 1 | 1.306 | 0.253 |
Significance levels: * p < 0.05, ** p < 0.01, *** p < 0.001. Source: Household Survey Data, 2017.
Table 6.
Water management adaptation strategies used by households in Bobirwa sub-district.
| Adaptation Measure | N | % of Cases | DF | χ2 | p-Value |
|---|---|---|---|---|---|
| Rainwater harvesting | 160 | 51.6 | 1 | 2.399 | 0.121 |
| Using drip irrigation | 13 | 4.2 | 1 | 2.757 | 0.097 |
| Started pumping from rivers | 59 | 19.0 | 1 | 0.000 | 0.997 |
| Drilled a borehole/well (ground water) | 103 | 33.2 | 1 | 2.306 | 0.129 |
| Used earth dams | 109 | 35.2 | 1 | 2.054 | 0.152 |
| Rehabilitation of water points | 87 | 28.1 | 1 | 0.172 | 0.679 |
| Conserve/protect water sources for dry season | 132 | 42.6 | 1 | 0.112 | 0.737 |
Significance levels: * p < 0.05, ** p < 0.01, *** p < 0.001. Source: Household Survey Data, 2017.
Table 7.
Off-farm adaptation measure used by households in Bobirwa sub-district.
| Adaptation Measure | N | % of Cases | DF | χ2 | p-Value |
|---|---|---|---|---|---|
| Started a small business e.g. selling NTFPs | 99 | 31.9 | 1 | 0.001 | 0.550 |
| Hiring out grazing land | 17 | 5.5 | 1 | 1.160 | 0.560 |
| Charcoal production/firewood | 140 | 45.2 | 1 | 2.476 | 0.116 |
| Members migrate in search of employment | 242 | 78.1 | 1 | 2.033 | 0.015 ** |
| Joined/formed savings group/cooperative | 114 | 36.8 | 1 | 0.687 | 0.407 |
| Formed committee to protect pastures/water | 45 | 14.5 | 1 | 0.552 | 0.457 |
| Invested in grain storage | 121 | 39.0 | 1 | 0.212 | 0.645 |
Significance levels: * p < 0.05, ** p < 0.01, *** p < 0.001. Source: Household Survey Data, 2017.
Table 8.
Aggregated climate change adaptation strategies by households in Bobirwa sub-district.
| Adaptation Measure | N | % of Cases | DF | χ2 | p-Value |
|---|---|---|---|---|---|
| No adaptation at all | 2 | 0.64 | 1 | 0.773 | 0.379 |
| Crop management practices | 255 | 82.3 | 1 | 0.257 | 0.612 |
| Livestock management practices | 200 | 64.5 | 1 | 3.728 | 0.054 |
| Land and soil management practices | 265 | 85.5 | 1 | 0.869 | 0.351 |
| Water management practices | 237 | 76.5 | 1 | 1.012 | 0.314 |
| Off-farm adaptation practices | 295 | 95.2 | 1 | 0.001 | 0.975 |
Significance levels: * p < 0.05, ** p < 0.01, *** p < 0.001. Source: Household Survey Data, 2017.
Table 9.
Marginal effects of the determinants of adaptation strategy mix in Bobirwa sub-district.
| Actual Adaptation Strategies Implemented | |||||||
|---|---|---|---|---|---|---|---|
| 001 | 010 | 011 | 100 | 101 | 110 | 111 | |
| Age (years) | −0.126 | −0.095 | −0.079 | −0.091 | −0.072 | −0.091 * | −0.060 |
| (0.131) | (0.056) | (0.054) | (0.061) | (0.080) | (0.042) | (0.039) | |
| Formal education (years) | 0.149 | −0.610 | 0.405 | −0.286 | −2.494 | 0.808 | 0.613 |
| (1.966) | (0.941) | (0.909) | (1.039) | (1.596) | (0.743) | (0.700) | |
| Gender | 18.892 | 0.647 | −0.504 | −0.277 | −0.177 | 0.308 | −0.087 |
| (3614.380) | (1.103) | (0.931) | (1.137) | (1.383) | (0.810) | (0.754) | |
| Occupation | 2.910 | −0.056 | 1.126 | 2.506 * | 0.710 | 1.435 | 1.555 |
| (1.941) | (1.370) | (1.043) | (1.048) | (1.451) | (0.867) | (0.841) | |
| Household size | −0.138 | −0.260 * | −0.188 | −0.149 | 0.144 | −0.154 | −0.085 |
| (0.248) | (0.125) | (0.113) | (0.127) | (0.148) | (0.082) | (0.076) | |
| Cropped area (ha) | 0.143 | −0.523 | −1.328 ** | −0.136 | −0.250 | −0.004 | −0.038 |
| (0.490) | (0.299) | (0.407) | (0.208) | (0.340) | (0.129) | (0.122) | |
| Tropical Livestock Unit | 0.223 * | −0.099 | 0.200 * | 0.072 | 0.144 | 0.085 | 0.164 |
| (0.095) | (0.199) | (0.089) | (0.121) | (0.100) | (0.089) | (0.086) | |
| Annual remittances (BWP) | −0.000 | −0.000 | −0.000 | −0.000 | −0.000 | −0.000 | −0.000 |
| (0.000) | (0.000) | (0.000) | (0.000) | (0.000) | (0.000) | (0.000) | |
| Annual income (BWP) | 0.000 | 0.000 | 0.000 | −0.000 | −0.000 | 0.000 | 0.000 |
| (0.000) | (0.000) | (0.000) | (0.000) | (0.000) | (0.000) | (0.000) | |
| Remittances for adaptation | −0.031 | −0.003 | −0.024 * | −0.008 | −0.018 | −0.013 | −0.015 |
| (0.019) | (0.015) | (0.011) | (0.012) | (0.015) | (0.010) | (0.009) | |
| CBNRM dividends (BWP) | 0.002 | 0.017 | 0.017 | 0.003 | −0.000 | 0.017 | 0.017 |
| (5.793) | (1.902) | (1.902) | (3.289) | (4.309) | (1.902) | (1.902) | |
| Rooms in main house | −0.316 | −0.150 | −0.438 * | −0.455 | −0.011 | −0.298 * | −0.339 * |
| (0.415) | (0.184) | (0.198) | (0.236) | (0.271) | (0.148) | (0.140) | |
| Land tenure | −27.027 | 0.546 | 0.666 | 1.600 | 1.470 | 0.878 | 1.136 |
| (1249.241) | (0.932) | (0.869) | (0.986) | (1.317) | (0.688) | (0.652) | |
| Climate information | 19.233 | 0.050 | 0.049 | 1.224 | 19.170 | 1.064 | 1.163 |
| (11,173.577) | (0.938) | (0.963) | (1.353) | (9872.211) | (0.845) | (0.759) | |
| Formal employment | 0.706 | 1.564 | 1.485 | 0.902 | 1.589 | 1.124 | 1.581 |
| (1.548) | (0.933) | (0.955) | (1.442) | (0.935) | (0.975) | (0.932) | |
| Adult (41–60) | −1.137 | 0.696 | 0.712 | 0.307 | −1.892 | 1.988 | 0.891 |
| (2.772) | (1.172) | (1.291) | (1.437) | (1.894) | (1.023) | (0.945) | |
| Elderly (>60) | 1.212 | 1.422 | 2.469 | 2.155 | −0.455 | 3.638 * | 2.325 |
| (4.404) | (2.204) | (2.203) | (2.407) | (2.835) | (1.742) | (1.628) | |
| Constant | −30.058 | 6.418 * | 7.406 * | 4.994 | −13.467 | 4.162 | 3.983 |
| (11,743.619) | (3.251) | (2.962) | (3.530) | (9872.212) | (2.608) | (2.450) | |
| Observations | 308 | ||||||
| Base category | Off-farm adaptation | ||||||
| Prob > Chi2 | 0.0000 | ||||||
| Pseudo R2 | 0.2503 | ||||||
| Log likelihood | −330.212 | ||||||
| Likelihood Ratio Chi2 | 220.478 | ||||||
Standard errors in parentheses; * p < 0.05, ** p < 0.01, *** p < 0.001. Source: Household Survey Data, 2017. Key: 001 = Livestock-related Adaptations Only; 010 = Land, Soil and Water Conservation Adaptations Only; 011 = Land, Soil and Water + Livestock-related Adaptations; 100 = Crop Adaptations Only; 101 = Crop + Livestock-related Adaptations; 110 = Crop + Land, Soil and Water Conservation Adaptations; and 111 = Crop + Livestock + Land, Soil and Water Conservation Adaptations.
Table 10.
Summarized influence of determinants of adaptation in Bobirwa sub-district.
| Variable | Positive Influence | Negative Influence |
|---|---|---|
| Age (years) | 001, 010; 011; 100, 101; 110, 111 | |
| Formal education (years) | 001; 011; 110; 111 | 010; 100; 101 |
| Gender | 001; 010; 110 | 011; 100; 101; 111 |
| Occupation | 001; 011; 100; 101; 110; 111 | 010 |
| Household size | 101 | 001; 010; 011;100; 110; 111 |
| Cropped area | 001 | 010; 011; 100; 101; 110; 111 |
| Tropical Livestock Units | 001; 011; 100; 101; 110; 111 | |
| Annual Remittance (BWP) | 001; 010; 011; 100; 101; 110; 110 | |
| Annual income (BWP) | 001; 010; 011; 110; 111 | 100; 101 |
| Remittances for adaptation (BWP) | 001; 010; 011; 100; 101; 110; 110 | |
| CBNR dividends (BWP) | 001; 010; 011; 100; 110; 110 | 101 |
| Size of house (Affluence) | 001; 010; 011; 100; 101; 110; 110 | |
| Land tenure | 010; 011; 100; 101; 110; 110 | 001 |
| Access to climate information | 001; 010; 011; 100; 101; 110; 110 | |
| Formal employment | 001; 010; 011; 100; 101; 110; 110 | |
| Adults (40–60) | 010; 011; 100; 110; 110 | 001; 101 |
Key: 001 = Livestock-related Adaptations Only; 010 = Land, Soil and Water Conservation Adaptations Only; 011 = Land, Soil and Water + Livestock-related Adaptations; 100 = Crop Adaptations Only; 101 = Crop + Livestock-related Adaptations; 110 = Crop + Land, Soil and Water Conservation Adaptations; and 111 = Crop + Livestock + Land, Soil and Water Conservation Adaptations.
Table 11.
Marginal effects of determinants of the extent of adaptation in Bobirwa sub-district.
| Number of Simultaneous Adaptation Strategies Implemented | |||||
|---|---|---|---|---|---|
| One | Two | Three | Four | Five | |
| Age (years) | 0.000 | −0.032 | −0.022 | −0.024 | −0.013 |
| (.) | (0.024) | (0.019) | (0.018) | (0.017) | |
| Gender | 0.000 | 0.412 | −0.208 | 0.184 | −0.284 |
| (.) | (1.077) | (0.822) | (0.783) | (0.749) | |
| Occupation | 0.000 | 1.474 | 1.596 | 1.342 | 1.545 |
| (.) | (0.996) | (0.872) | (0.839) | (0.819) | |
| Household size | 0.000 | −0.099 | −0.126 | −0.089 | −0.055 |
| (.) | (0.104) | (0.088) | (0.077) | (0.073) | |
| Cropped area (ha) | 0.000 | −0.545 * | −0.046 | −0.227 | 0.001 |
| (.) | (0.241) | (0.127) | (0.123) | (0.109) | |
| Tropical Livestock Unit | 0.000 | 0.185 | 0.057 | 0.175 | 0.172 |
| (.) | (0.103) | (0.106) | (0.096) | (0.096) | |
| Annual remittances (BWP) | 0.000 | 0.000 | 0.000 | 0.000 | 0.000 |
| (.) | (0.000) | (0.000) | (0.000) | (0.000) | |
| Annual income (BWP) | 0.000 | 0.000 | 0.000 | 0.000 | 0.000 |
| (.) | (0.000) | (0.000) | (0.000) | (0.000) | |
| Remittances financing adaptation (%) | 0.000 | 0.007 | −0.012 | −0.016 | −0.014 |
| (.) | (0.014) | (0.009) | (0.009) | (0.009) | |
| CBNRM dividends (BWP) | 0.000 | 0.023 | 0.002 | 0.023 | 0.023 |
| (.) | (24.288) | (32.898) | (24.288) | (24.288) | |
| Rooms in main house | 0.000 | −0.455 * | −0.203 | −0.247 | −0.264 * |
| (.) | (0.199) | (0.147) | (0.135) | (0.131) | |
| Formal employment | 0.000 | −19.507 | 0.847 | 0.862 | 0.745 |
| (.) | (11,005.975) | (0.828) | (0.827) | (0.827) | |
| Constant | 0.000 | 2.573 | 3.494 | 4.340 * | 3.703 * |
| (.) | (2.260) | (1.814) | (1.711) | (1.665) | |
| Observations | 308 | ||||
| Base category | One | ||||
| Prob > Chi2 | 0.0000 | ||||
| Pseudo R2 | 0.1578 | ||||
| Log likelihood | −346.714 | ||||
| Likelihood Ratio Chi2 | 129.957 | ||||
Standard errors in parentheses; * p < 0.05, ** p < 0.01, *** p < 0.001.
© 2020 by the authors. Licensee MDPI, Basel, Switzerland. This article is an open access article distributed under the terms and conditions of the Creative Commons Attribution (CC BY) license (http://creativecommons.org/licenses/by/4.0/).
Share and Cite
MDPI and ACS Style
Mugari, E.; Masundire, H.; Bolaane, M. Adapting to Climate Change in Semi-Arid Rural Areas: A Case of the Limpopo Basin Part of Botswana. Sustainability 2020, 12, 8292. https://0-doi-org.brum.beds.ac.uk/10.3390/su12208292
AMA Style
Mugari E, Masundire H, Bolaane M. Adapting to Climate Change in Semi-Arid Rural Areas: A Case of the Limpopo Basin Part of Botswana. Sustainability. 2020; 12(20):8292. https://0-doi-org.brum.beds.ac.uk/10.3390/su12208292
Chicago/Turabian StyleMugari, Ephias, Hillary Masundire, and Maitseo Bolaane. 2020. "Adapting to Climate Change in Semi-Arid Rural Areas: A Case of the Limpopo Basin Part of Botswana" Sustainability 12, no. 20: 8292. https://0-doi-org.brum.beds.ac.uk/10.3390/su12208292
Note that from the first issue of 2016, this journal uses article numbers instead of page numbers. See further details here.