Article

Bio-Electrochemical Enhancement of Hydrogen and Methane Production in a Combined Anaerobic Digester (AD) and Microbial Electrolysis Cell (MEC) from Dairy Manure

1
Department of Environmental Science and Technology, University of Maryland, College Park, MD 20742, USA
2
College of Mechanical and Electrical Engineering, Northwest Agriculture and Forestry University, Yangling 712100, China
3
Department of Physical and Environmental Sciences, Colorado Mesa University, Grand Junction, CO 81501, USA
4
Guangxi Scientific Experiment Center of Mining, Metallurgy and Environment, Guilin University of Technology, Guilin 541004, China
*
Authors to whom correspondence should be addressed.
Sustainability 2020, 12(20), 8491; https://0-doi-org.brum.beds.ac.uk/10.3390/su12208491
Submission received: 15 September 2020 / Revised: 11 October 2020 / Accepted: 12 October 2020 / Published: 14 October 2020
(This article belongs to the Special Issue Wastewater Based Microbial Biorefinery for Bioenergy Production)

Abstract

:
Anaerobic digestion (AD) is a biological-based technology that generates methane-enriched biogas. A microbial electrolysis cell (MEC) uses electricity to initiate bacterial oxidization of organic matter to produce hydrogen. This study determined the effect of energy production and waste treatment when using dairy manure in a combined AD and MEC (AD-MEC) system compared to AD without MEC (AD-only). In the AD-MEC system, a single chamber MEC (150 mL) was placed inside a 10 L digester on day 20 of the digestion process and run for 272 h (11 days) to determine residual treatment and energy capacity with an MEC included. Cumulative H2 and CH4 production in the AD-MEC (2.43 L H2 and 23.6 L CH4) was higher than AD-only (0.00 L H2 and 10.9 L CH4). Hydrogen concentration during the first 24 h of MEC introduction constituted 20% of the produced biogas, after which time the H2 decreased as the CH4 concentration increased from 50% to 63%. The efficiency of electrical energy recovery (ηE) in the MEC was 73% (ηE min.) to 324% (ηE max.), with an average increase of 170% in total energy compared to AD-only. Chemical oxygen demand (COD) removal was higher in the AD-MEC (7.09 kJ/g COD removed) system compared to AD-only (6.19 kJ/g COD removed). This study showed that adding an MEC during the digestion process could increase overall energy production and organic removal from dairy manure.

1. Introduction

Microbial electrolysis cell (MEC) is a bioelectrochemical technology that uses concepts from microbial fuel cell (MFC) research. While MFCs use microbial decomposition of organic compounds to produce an electric current, in an MEC, an electric current is applied to reverse the reaction to convert organic material to hydrogen (H2) and/or methane (CH4). Recently, MECs have been explored as a clean energy source and a promising innovative technology for H2 production using bioelectrochemical properties. Hydrogen gas is formed in an MEC from two sources of energy: (1) bacterial oxidization of organic matter and (2) electric input [1,2,3,4]. Converting organic matter into H2 in an MEC requires: (1) exo-electrogenic anodal microbes to release electrons and protons from organic material (oxidation reaction), and (2) an external electricity input (voltage > 0.114 V) to push the reaction to be favorable, as the reaction may not be thermodynamically favorable without the electrical input [5].
Methane-enriched biogas is produced during anaerobic digestion (AD) by anaerobic bacteria decomposing organic material, such as manure, sewage, municipal waste, and/or food waste [6]. During AD, the waste is converted into biogas, a renewable energy source that consists of 55–75% CH4, 45–25% CO2, and small amounts of hydrogen sulfide (H2S), hydrogen (H2), and other gases [7,8]. The microbial process in the AD process is divided into two main phases: acidogenic and methanogenic [6,9].
In order to enrich H2, methanogenic bacterial growth should be decreased, as methanogens can use H2 as a pathway for CH4 production. While methanogenic production can be limited by low pH conditions, slightly acidified conditions (pH 5–6) were not effective in controlling methanogenesis in an MEC-only treatment in which H2 production was the desired product [10,11]. In most MEC studies, methanogens have been found to use the produced H2 for CH4 generation [11,12,13,14,15], with CH4 production continuing when the voltage was no longer applied. In an MEC study that washed methanogens from the MEC reactor using a low hydraulic retention time (5.3 h), CH4 production was still detected [15]. A recent experiment confirmed that methanogens are a preventive factor for H2 production from wastewater treatment plants using MEC [16], as CH4 production reduces H2 concentration and purity. Few MEC studies have been conducted using actual waste material [17,18]. Furthermore, MEC treatment volumes are often small (<0.3 L), with a high electrode surface area in the MEC, which would make scaling expensive. Liu et al. (2012) studied the effect of feeding an MEC with waste activated sludge fermentation liquid using bi-frequency ultrasonic and alkaline addition as a pre-treatment step to suppress methanogenic activity and increase H2 production, which eliminated CH4 production in favor of H2, but greatly increased the process complexity [18].
In our previous work [4], we evaluated incorporating an MEC with AD in the same reactor to digest food waste to first increase H2 production, and then use the H2 substrate to further increase the CH4 concentration. This work increased the energy production output, with >90% CH4, without an increase in the process complexity. In this previous work, three treatments were tested for 23 days: (1) a merged AD and MEC system with the MEC operating for the duration of the experiment; (2) a merged AD and MEC system with the MEC operating for only the first five days, followed by the AD for the remaining 18 days; and (3) an AD-only system operating for the entire 23-day experiment. Our previous results showed that, incorporating our unique MEC design within the AD reactor enhanced the biogas quantity and quality, total energy production, and food waste treatment. At this point, there has not been a study that incorporated an MEC with AD treatment at the end of dairy manure digestion to determine the effect of MEC inclusion to increase residual energy potential, nor has there been an MEC study focused on dairy manure, which is a readily available substrate used in AD systems worldwide.
In this research, an AD and MEC were combined to demonstrate the performance of using MEC during the last 11 days of digestion when biogas production had decreased but solids and chemical oxygen demand (COD) still persisted and could be further reduced given enough time. The current study aim was to determine the effect of a combined AD-MEC to enhance the treatment performance (i.e., COD and solids removal) and energy production (CH4 + H2) during the last 11 days of digestion of dairy manure. The MEC was designed to comprise a small volume compared to digester volume (0.0191 m3/m3). This study demonstrated a new application of MEC to increase both organic waste treatment and energy production performance.

2. Materials and Methods

2.1. Substrate and Inoculum
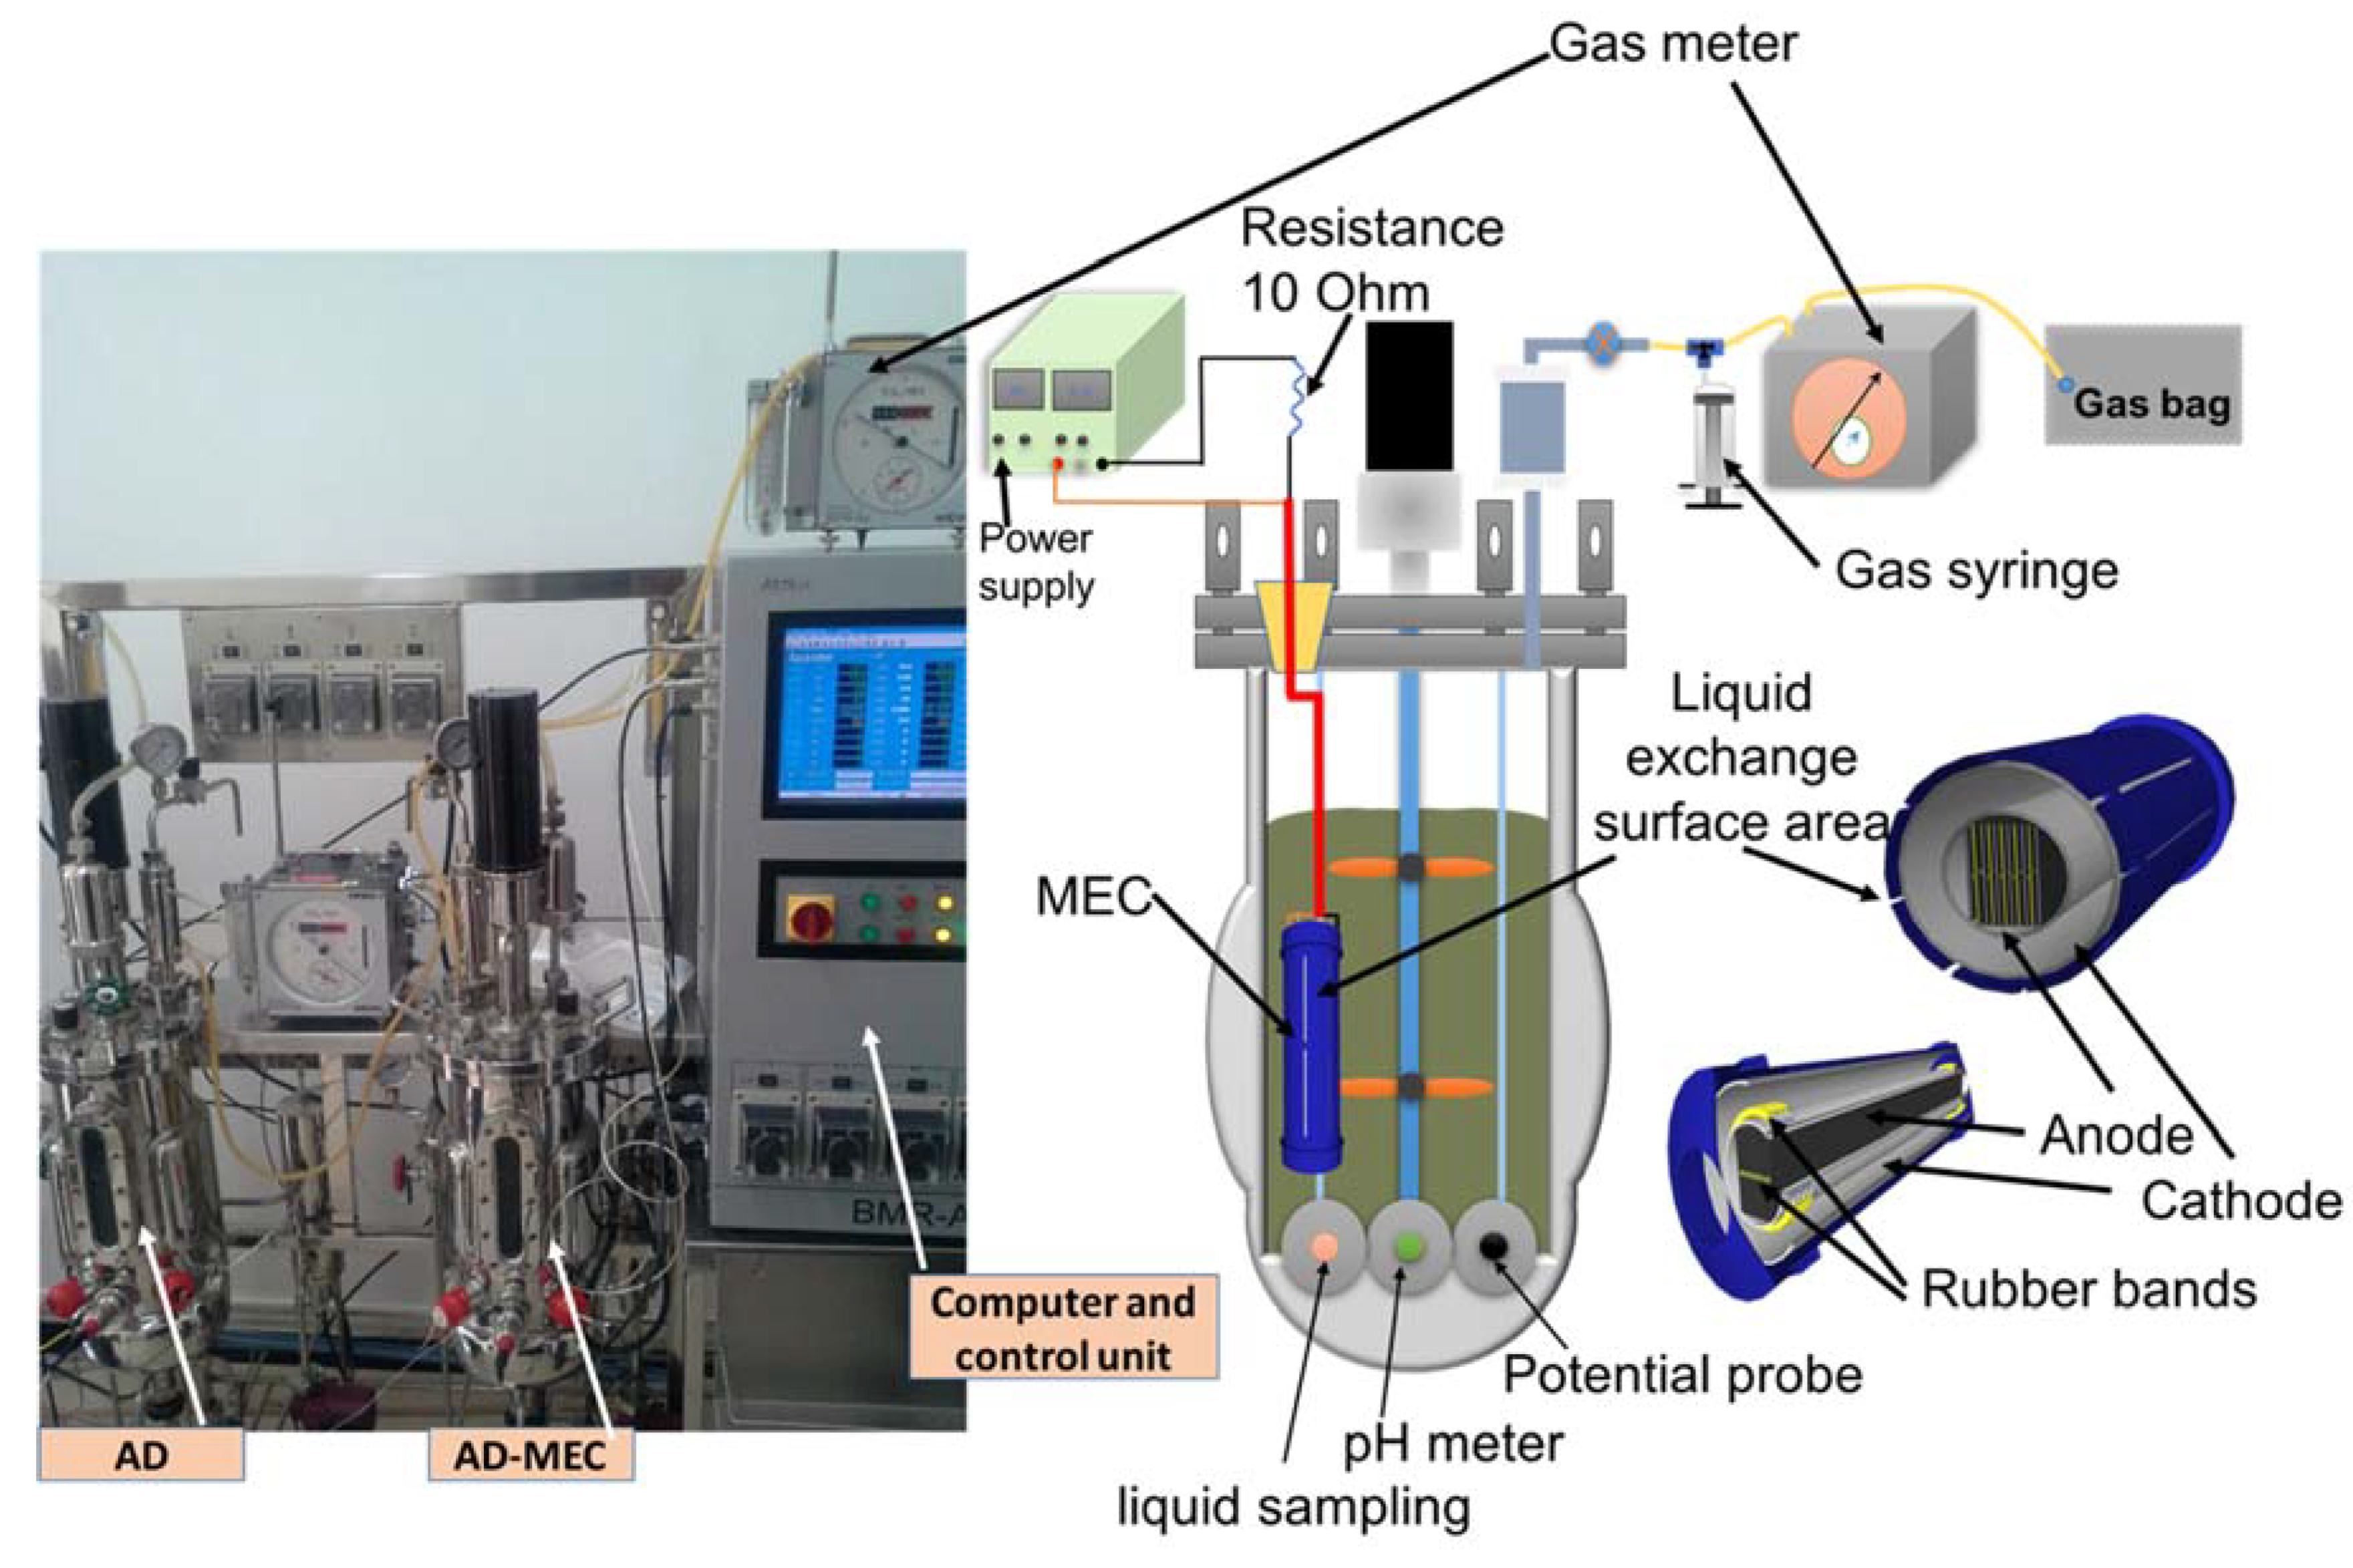
The dairy manure substrate was obtained from the Northwest Agriculture and Forestry University Dairy Farm, Yangling, Shaanxi, China. Prior to use, the dairy manure was stored for seven days at −4 °C. The total solids (TS) and volatile solids (VS) content of the dairy manure were 13.3% and 10.9% on a wet weight basis, respectively. An inoculum to substrate (ISR) VS ratio of 1:2 was used for the experiment. The inoculum was collected from the effluent of a previous AD-MEC experiment, with 5.6% TS and 3.3% VS, on a wet weight basis. After 20 days of digestion (before starting up the MEC), the contents of both treatment reactors were mixed together and distributed back to the digesters. The COD, TS, and VS concentrations of dairy manure and inoculum mixture after 20 days of digestion (before starting up the MEC) were 46.7 g/L, 6.89%, and 4.70%, respectively. The pH, ORP, and conductivity were 7.88, −374 mV, and 11.12 ms/cm, respectively. The total active volume of each digester (AD-MEC and AD-only) was 8 L.

2.2. Reactor Design

Two reactors were used in the experiment: (1) AD-MEC: a digester that contained an MEC connected to an electricity source, and (2) AD-only: a digester with an MEC included to provide equal surface area and reactor volume, but the MEC was not connected to an electricity source (substrate was treated using only the digestion process) (Figure 1). Both reactors were made of stainless steel, with each reactor having an inner diameter of 18 cm and length of 46 cm, resulting in a total volume of 11 L (8 L active volume, and 3 L head space) (Auzone BMR-A10L, Shanghai Auzone Bio-engineering Equipment CO., LTD., Shanghai, China). Each digester was digitally programmed for temperature and mixing speed. Heating of the digesters was conducted using water that was heated and pumped into water jackets surrounding the reactors. The temperature within the digester was maintained at 16 °C for the first 10 days of digestion, then increased to 35 °C. At day 20, the MEC was connected to the power supply in the AD-MEC treatment for 11 days (from days 20–31), while the AD-only treatment operated for 11 additional days (days 20–31) without MEC as an AD-only treatment. A pH probe was inserted into each reactor (Mettler Toledo 52003679, Beijing, China), as well as an Ag/AgCl reference electrode. There was an outlet (1 cm diameter) located 14 cm from the bottom of the reactor for collecting liquid samples.

2.3. Microbial Electrolysis Cell Design

The MEC was fabricated according to our previous research [4] and included a PVC pipe closed with PVC caps as the MEC sleeve, with a diameter of 3.49 cm and length of 15.50 cm, resulting in a total MEC volume of 0.153 L. To guarantee the flow of liquid between the inside and the outside of the MEC, ten vertical holes of approximately 5.5 cm in length and 0.35 cm in width were created on the sides of the PVC sleeve [4]. An additional hole with a diameter of 1.6 cm was created in the center of each PVC cap to allow gas produced within the MEC to escape (Figure 1).
Each anode was made of eleven graphite plates composed of ≥99.95% pure graphite with high electric resistivity (≤1000 μΩ·cm), with dimensions of 15.0 cm (length) × 1.50 cm (width) × 0.1 cm (thickness) per plate. Rubber bands were used to separate each graphite plate to create a space between the plates, which formed the first part of the anode [4]. The second part of the anode was made of a stainless-steel cylinder (grade 201) with 15.0 cm length, 1.85 cm diameter, and 0.05 cm thickness and low electric resistivity (≤68.5 μΩ·cm) [4]. The graphite plates (first part of the anode) were inserted into a stainless-steel cylinder (second part of the anode). The integration of a stainless-steel cylinder and graphite plates was used to increase the electric conductivity between the graphite plates and to reduce the ohmic resistance compared to a graphite-only anode [4,19,20]. Furthermore, the utilization of grade 201 stainless steel in the anode helped to decrease the distance between the electrode plates and increase the conductivity. Moreover, the stainless steel grade 201 contains manganese (5.5–7.5%), which has been shown to increase the electrical energy produced by a factor of 10 [21,22].
The anode was positioned inside the cathode (stainless-steel cylinder with a 3.13 cm diameter, 15.0 cm length, and 0.05 cm thickness) and rubber bands were used to isolate the anode and cathode to avoid short circuiting (Figure 1) [4]. Insulated wires were used to connect the anode and cathode to the circuit.

2.4. MEC Voltage

A programmed direct current power-supply (YH-305D, Yi Hua Inc., Shanghai, China) was used to apply the voltage (1.2 V) across the anode and the cathode. The anode with a 10 Ω resistor was connected serially to the power supply positive lead, while the cathode was connected to the negative lead. The voltage drops across the 10 Ω resistor were measured using a multi-meter (model ATW9205L; ATTEN Instruments Inc., Shanghai, China). Measurements of voltage drop were conducted approximately 7 times per day.
Ohm’s law was used to calculate the current (I = V/R, where V is the voltage drop measured across the resistor (R)). The energy recovery efficiency was based on electricity (ηe) (%) input based on the measured current compared to the energy difference in the usable gas production between the AD-MEC and AD-only reactors. The volume of CH4 and H2 produced daily were normalized to the reactor active volume (m3 gas/m3/d). The volumetric current density (IV, A/m3) was normalized by the MEC liquid volume (0.150 L), and the total volume of manure + inoculum (8 L). Following Call and Logan (2008), the energy dissipation in the 10 Ω resistor (WE) was accounted for in order to determine the actual energy supplied [23]. Gibbs’ free energy equation was used to calculate the energy production from CH4 (∆GCH4 = 890.4 kJ/mol) and H2 (∆GH2 = 237.1 kJ/mol) [4,24,25].

2.5. Analytical Methods

The dairy manure and inoculum TS and VS concentrations were measured using Standard Methods [26]. The COD was measured using colorimetry, using Method 410.4 [27]. Wet gas meters (W-NK-0.5, Shinagawa Co., Tokyo, Japan) were used to measure biogas production from both treatments (AD-MEC and AD). A gas bag was attached to the gas meter outlet to ensure air could not enter the gas meter while collecting the gas sample. A gas chromatograph (GC) (GC2014C, Shimadzu Co, Chiyoda-ku, Japan) was used to analyze the gas samples, which were collected from the reactor using a gas-tight syringe.
Scanning electron microscopy (SEM) (TM3000 Tabletop, HITACHI, Fukuoka, Japan) was used for scanning the electrodes, the biofilm, and the liquid between the electrodes. Prior to SEM, the samples were air dried for approximately 20 min inside a closed incubator, and then coated with gold for 20 s.

3. Results and Discussion

3.1. Organic Matter Reduction: COD, TS, and VS Removal

The COD concentration after 20 days of digestion and before MEC use was 46.7 g/L. The AD-MEC had 38.3% further reduction in COD (28.8 g/L) after the 272 h of the combined MEC and AD digestion (days 20–31) compared to 19.1% additional COD reduction in the AD-only treatment (37.8 g/L). The greater increase in COD reduction (50.1% higher) in the AD-MEC reactor compared to AD-only was higher than previous studies with AD-MECs, which showed increased COD reductions of 5% to 15% compared to AD-only [4,28,29]. Asztalos and Kim (2015) included three bioanodes and a stainless-steel mesh cathode to treat waste activated sludge at ambient temperature and found the VS and COD removal were only 5–10% higher than AD-only [30]. In our work, not only was the overall COD reduction higher, but the COD conversion efficiency to renewable energy was higher in the AD-MEC (7.09 kJ/g COD removed) compared to AD-only (6.19 kJ/g COD removed). The TS and VS concentrations in the reactors before MEC use were 6.89% and 4.70%, respectively. The additional TS reduction in the last 10 days of digestion was also higher in the AD-MEC treatment (35.2%) compared to AD-only (13.4%), and the additional VS reduction was 41.9% for AD-MEC treatment compared to 19.0% for AD-only. The results showed that the AD-MEC treatment increased the reduction of COD, TS, and VS concentrations during digestion compared to AD-only, with the additional organic matter removal likely occurring through oxidization of the organic material using exoelectrogenic bacteria attached to the anode and H2 production at the cathode [30].

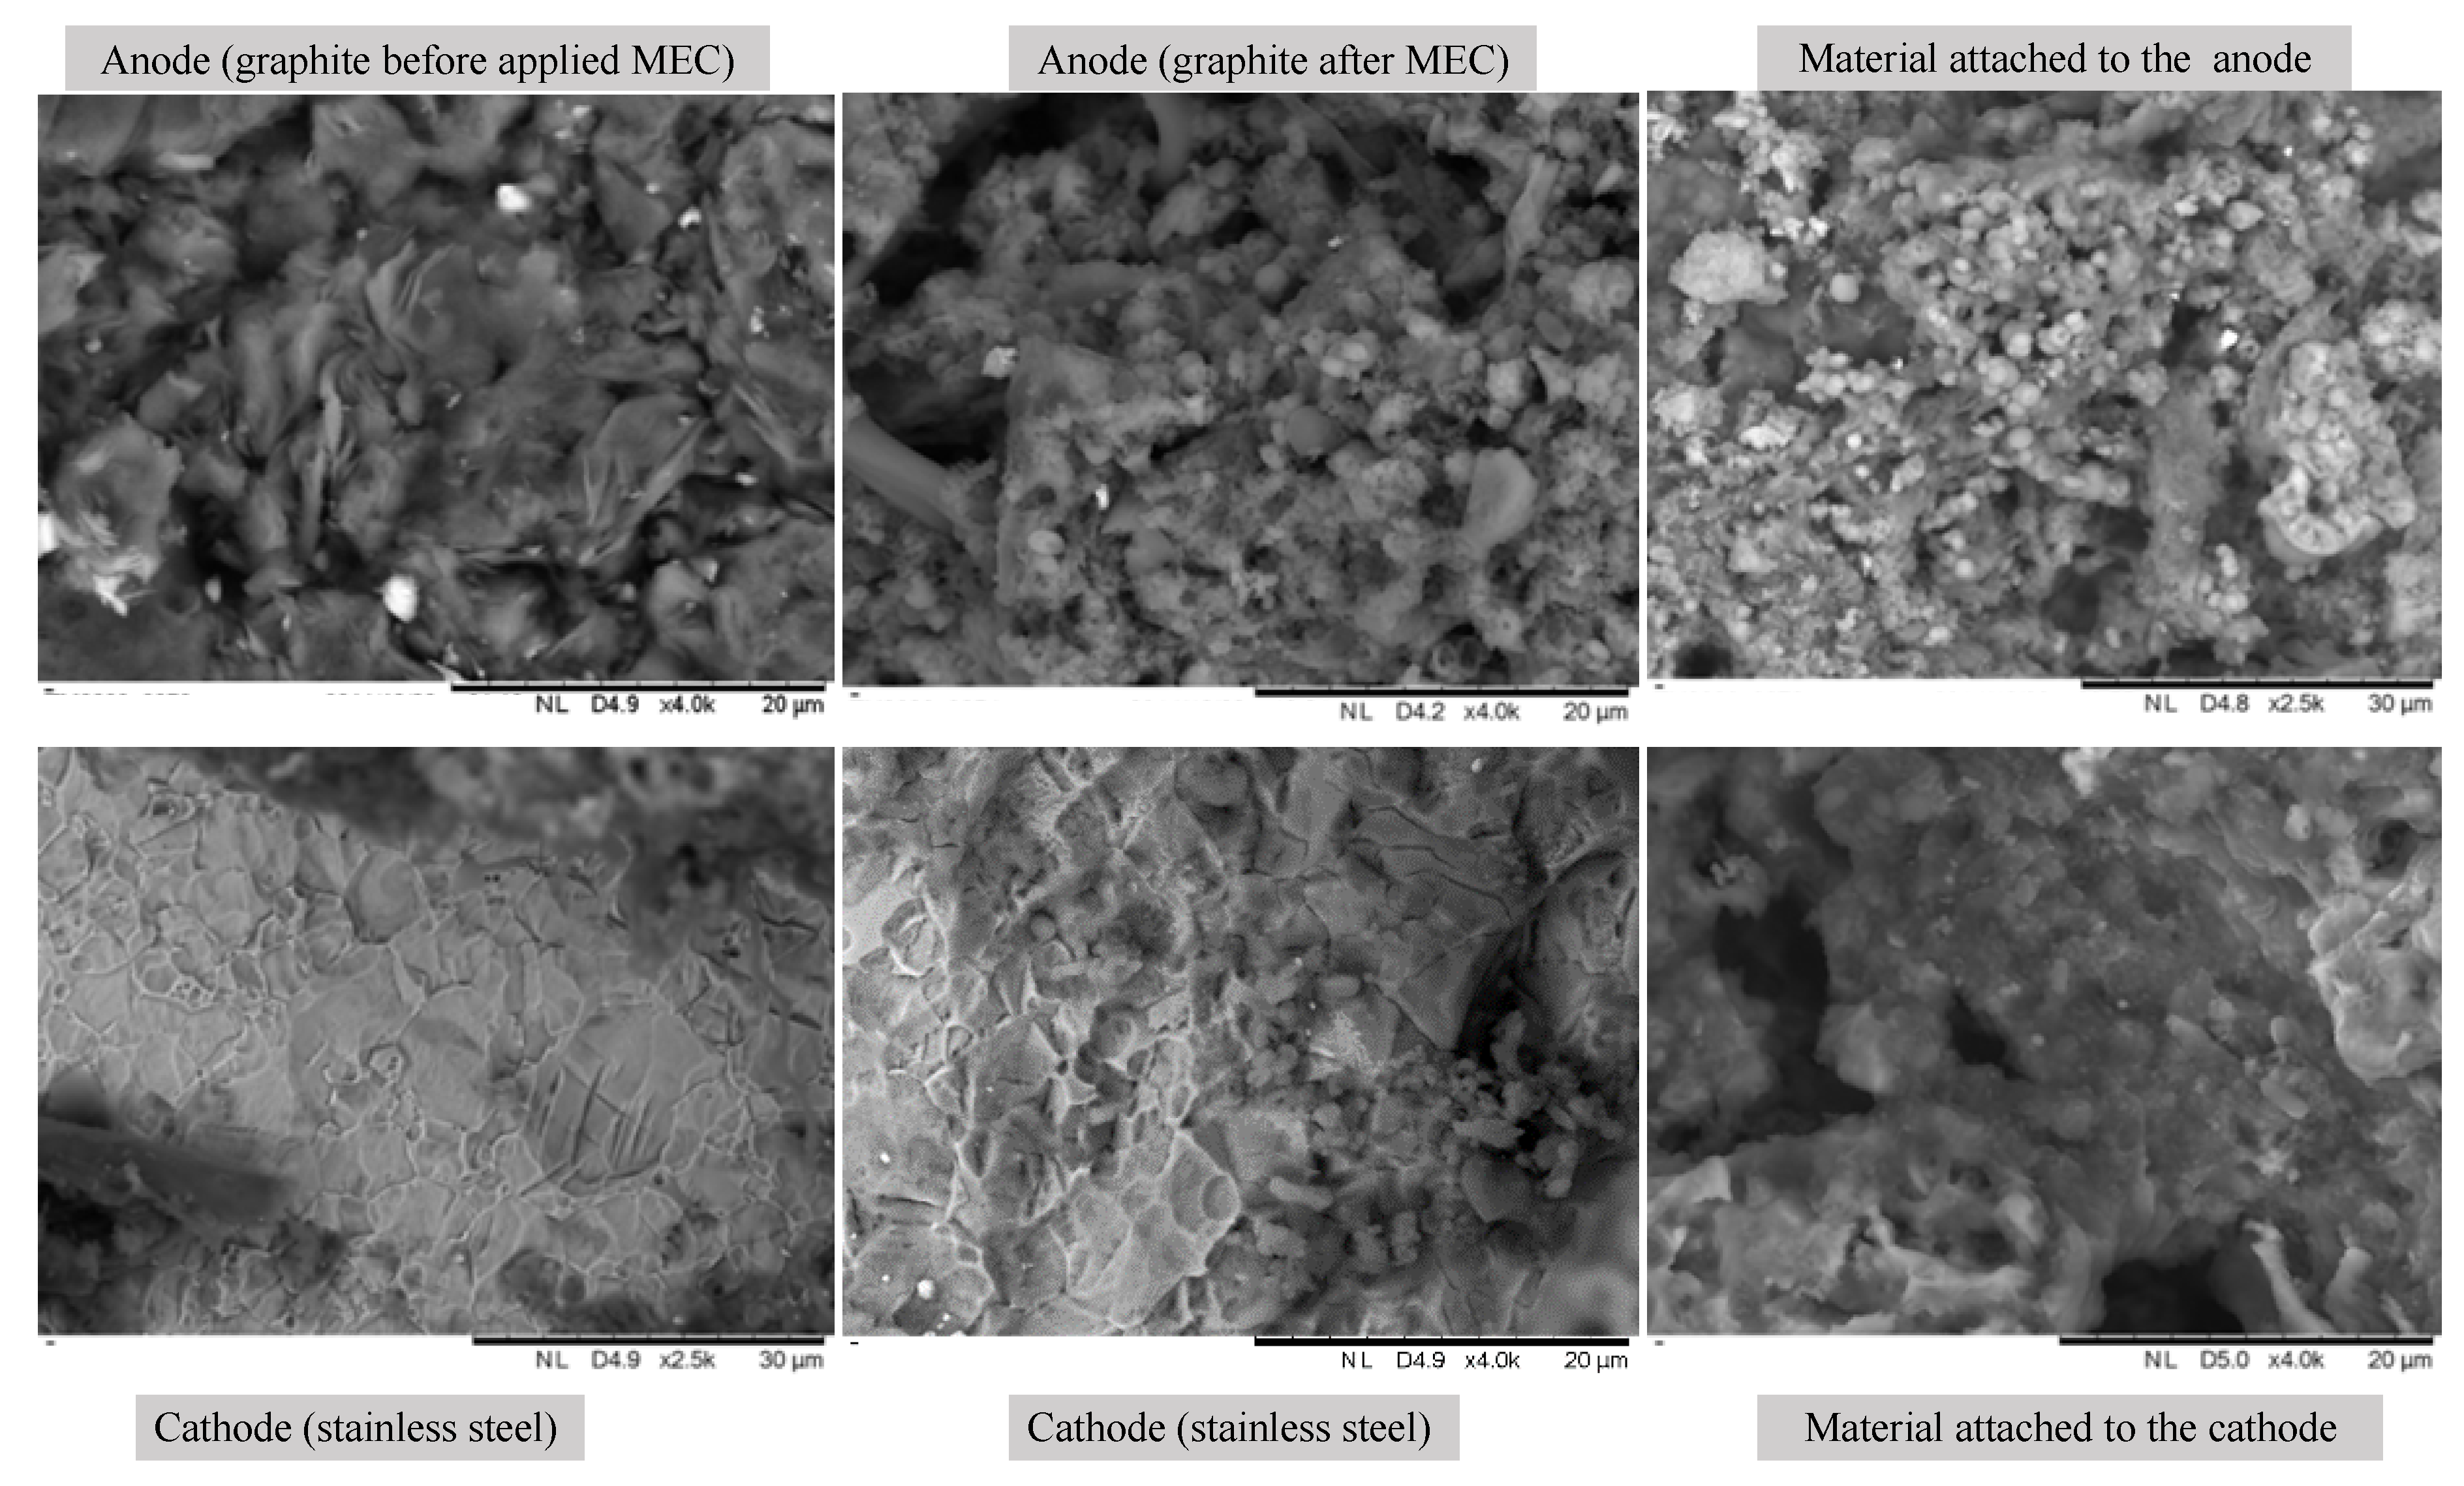
3.2. Anode Bacterial Attachment

The scanning electron microscopy (SEM) images on the anode surface showed bacterial cell colonization and growth. These cells were likely exoelectrogens, electricigens, and anodophilic bacteria that promoted substrate breakdown and electricity production (Figure 2) [31,32]. The anode (graphite) surface was completely covered with attached biofilm after the 11 days of the MEC inclusion, as confirmed by the SEM analysis. Coccoid and rod-shaped bacteria dominated the biofilm. It appears that 11 days were sufficient for the bacteria to colonize and acclimate to the anode graphite plates to form the biofilm needed to degrade the organic material (dairy manure). The SEM analysis also showed a denser microbial adherence on the graphite compared to stainless steel due to the porous structure of graphite materials [33].

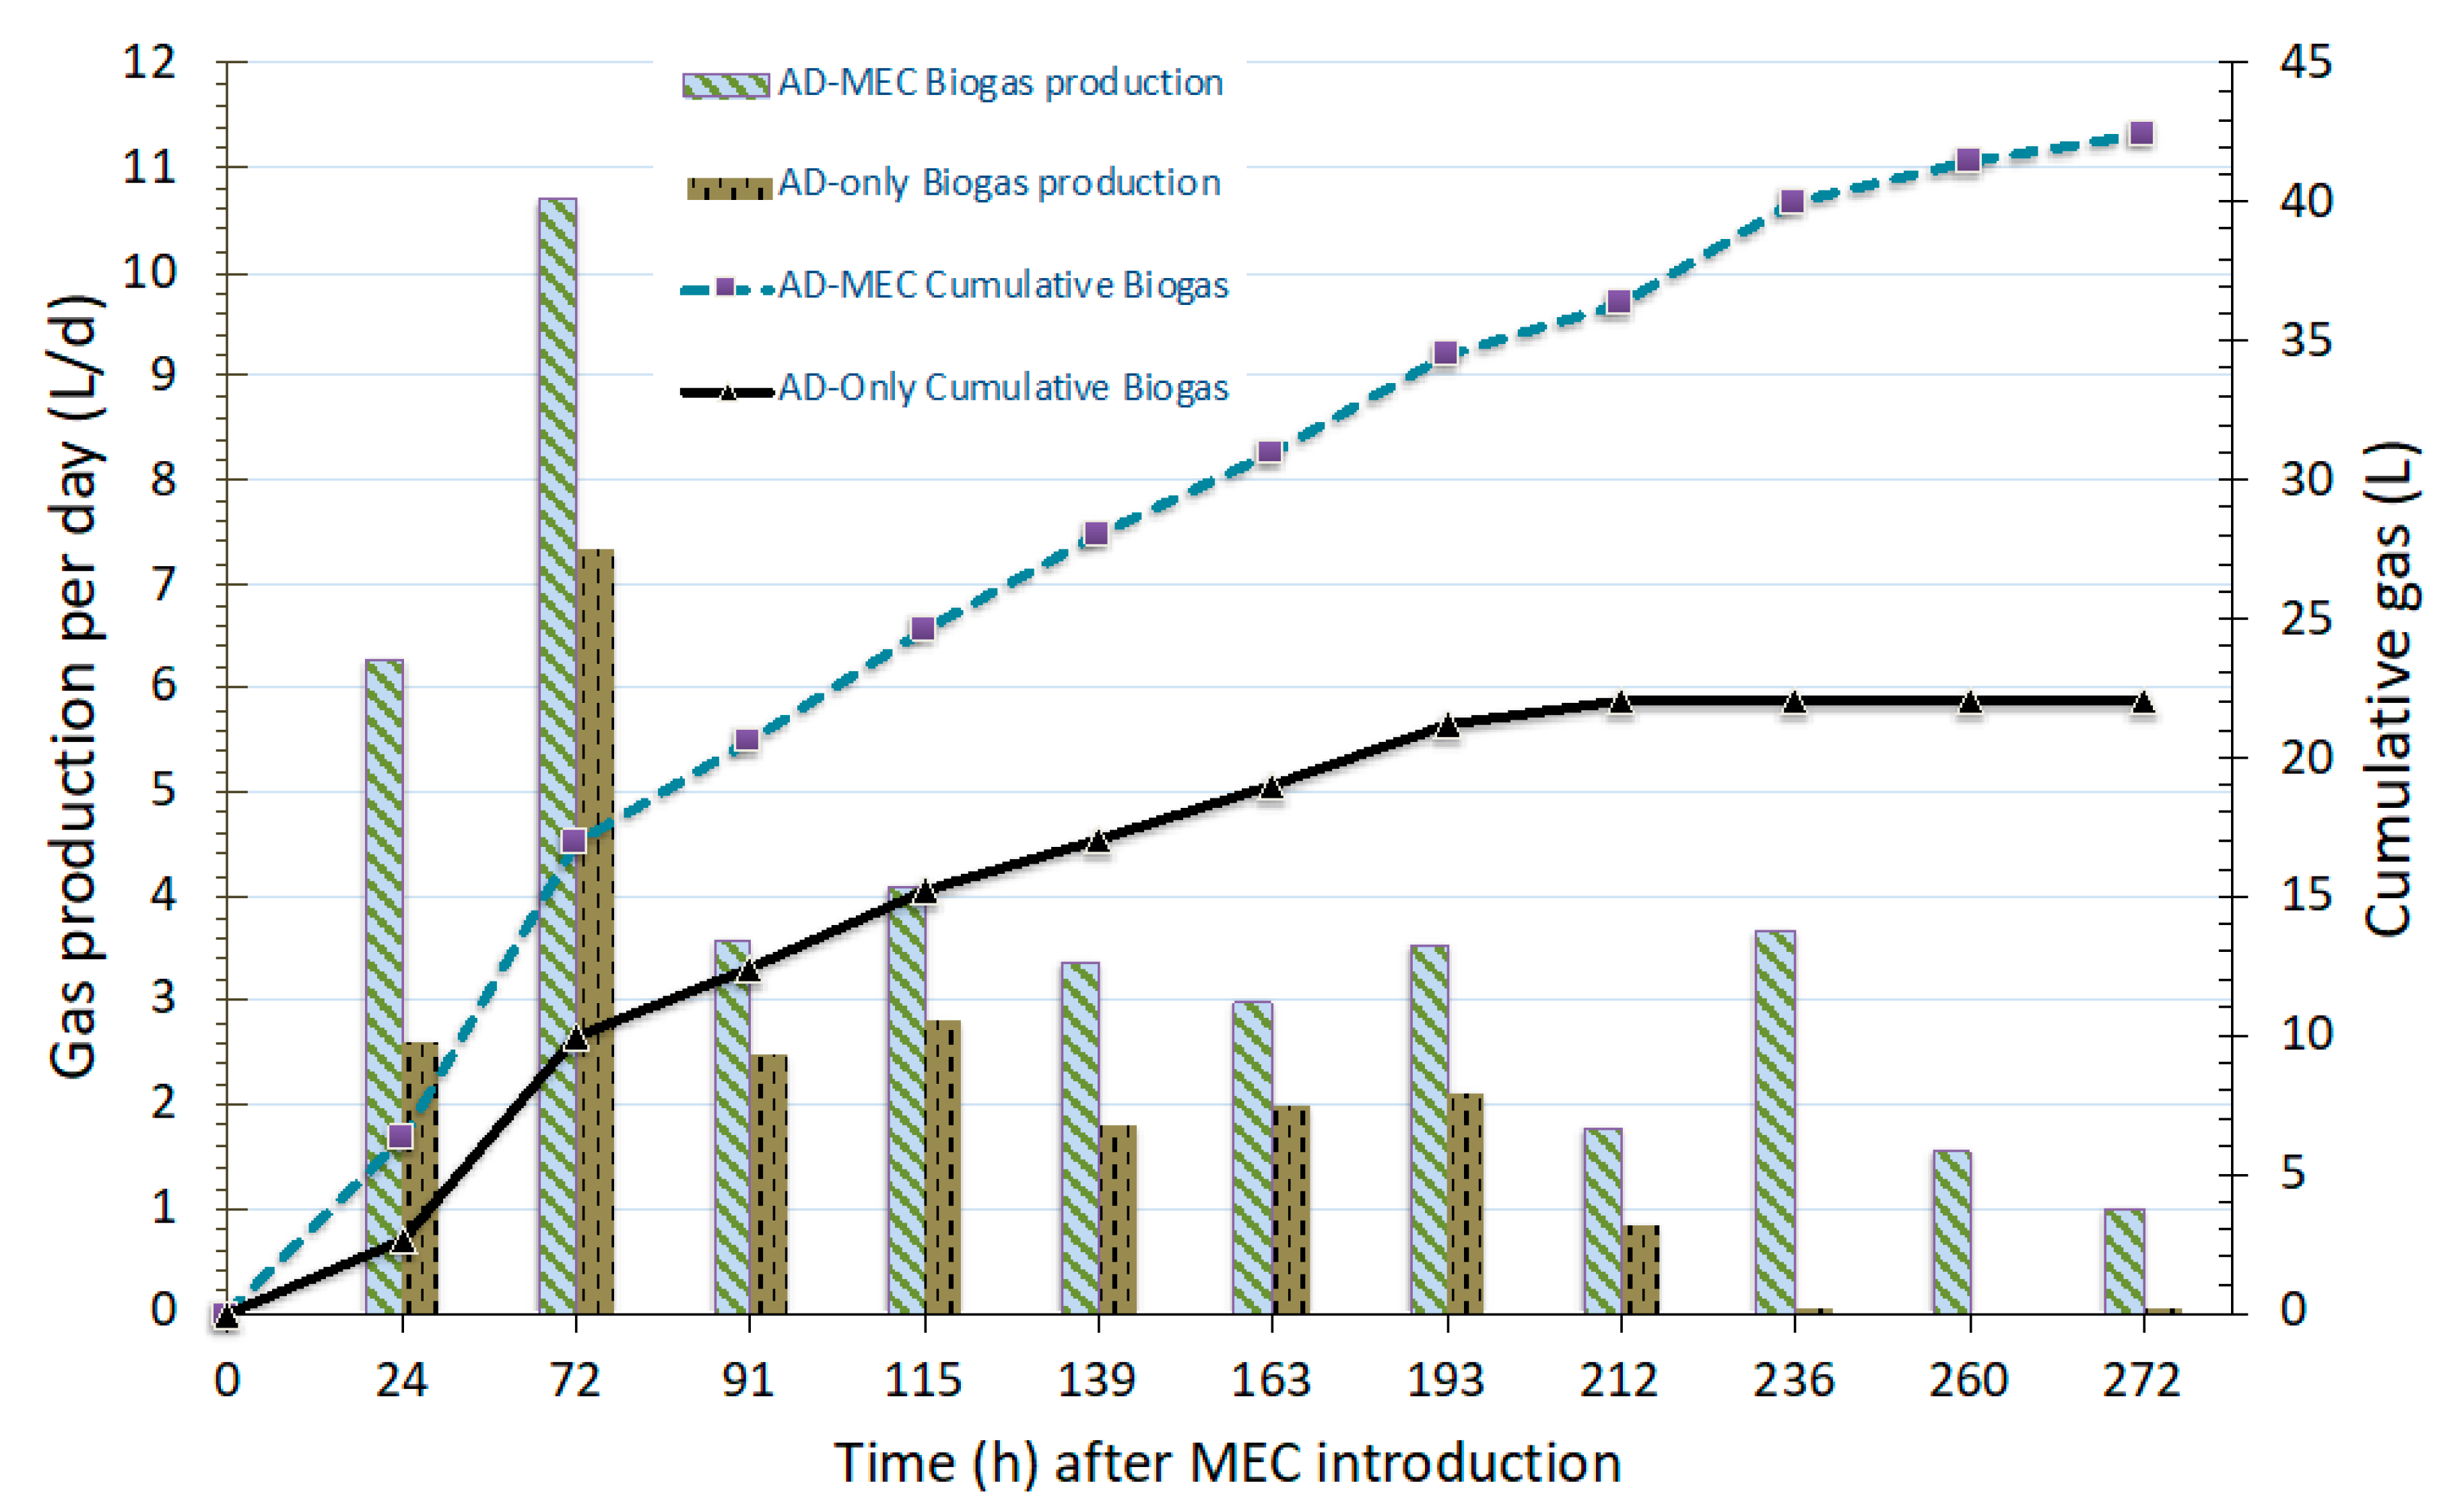
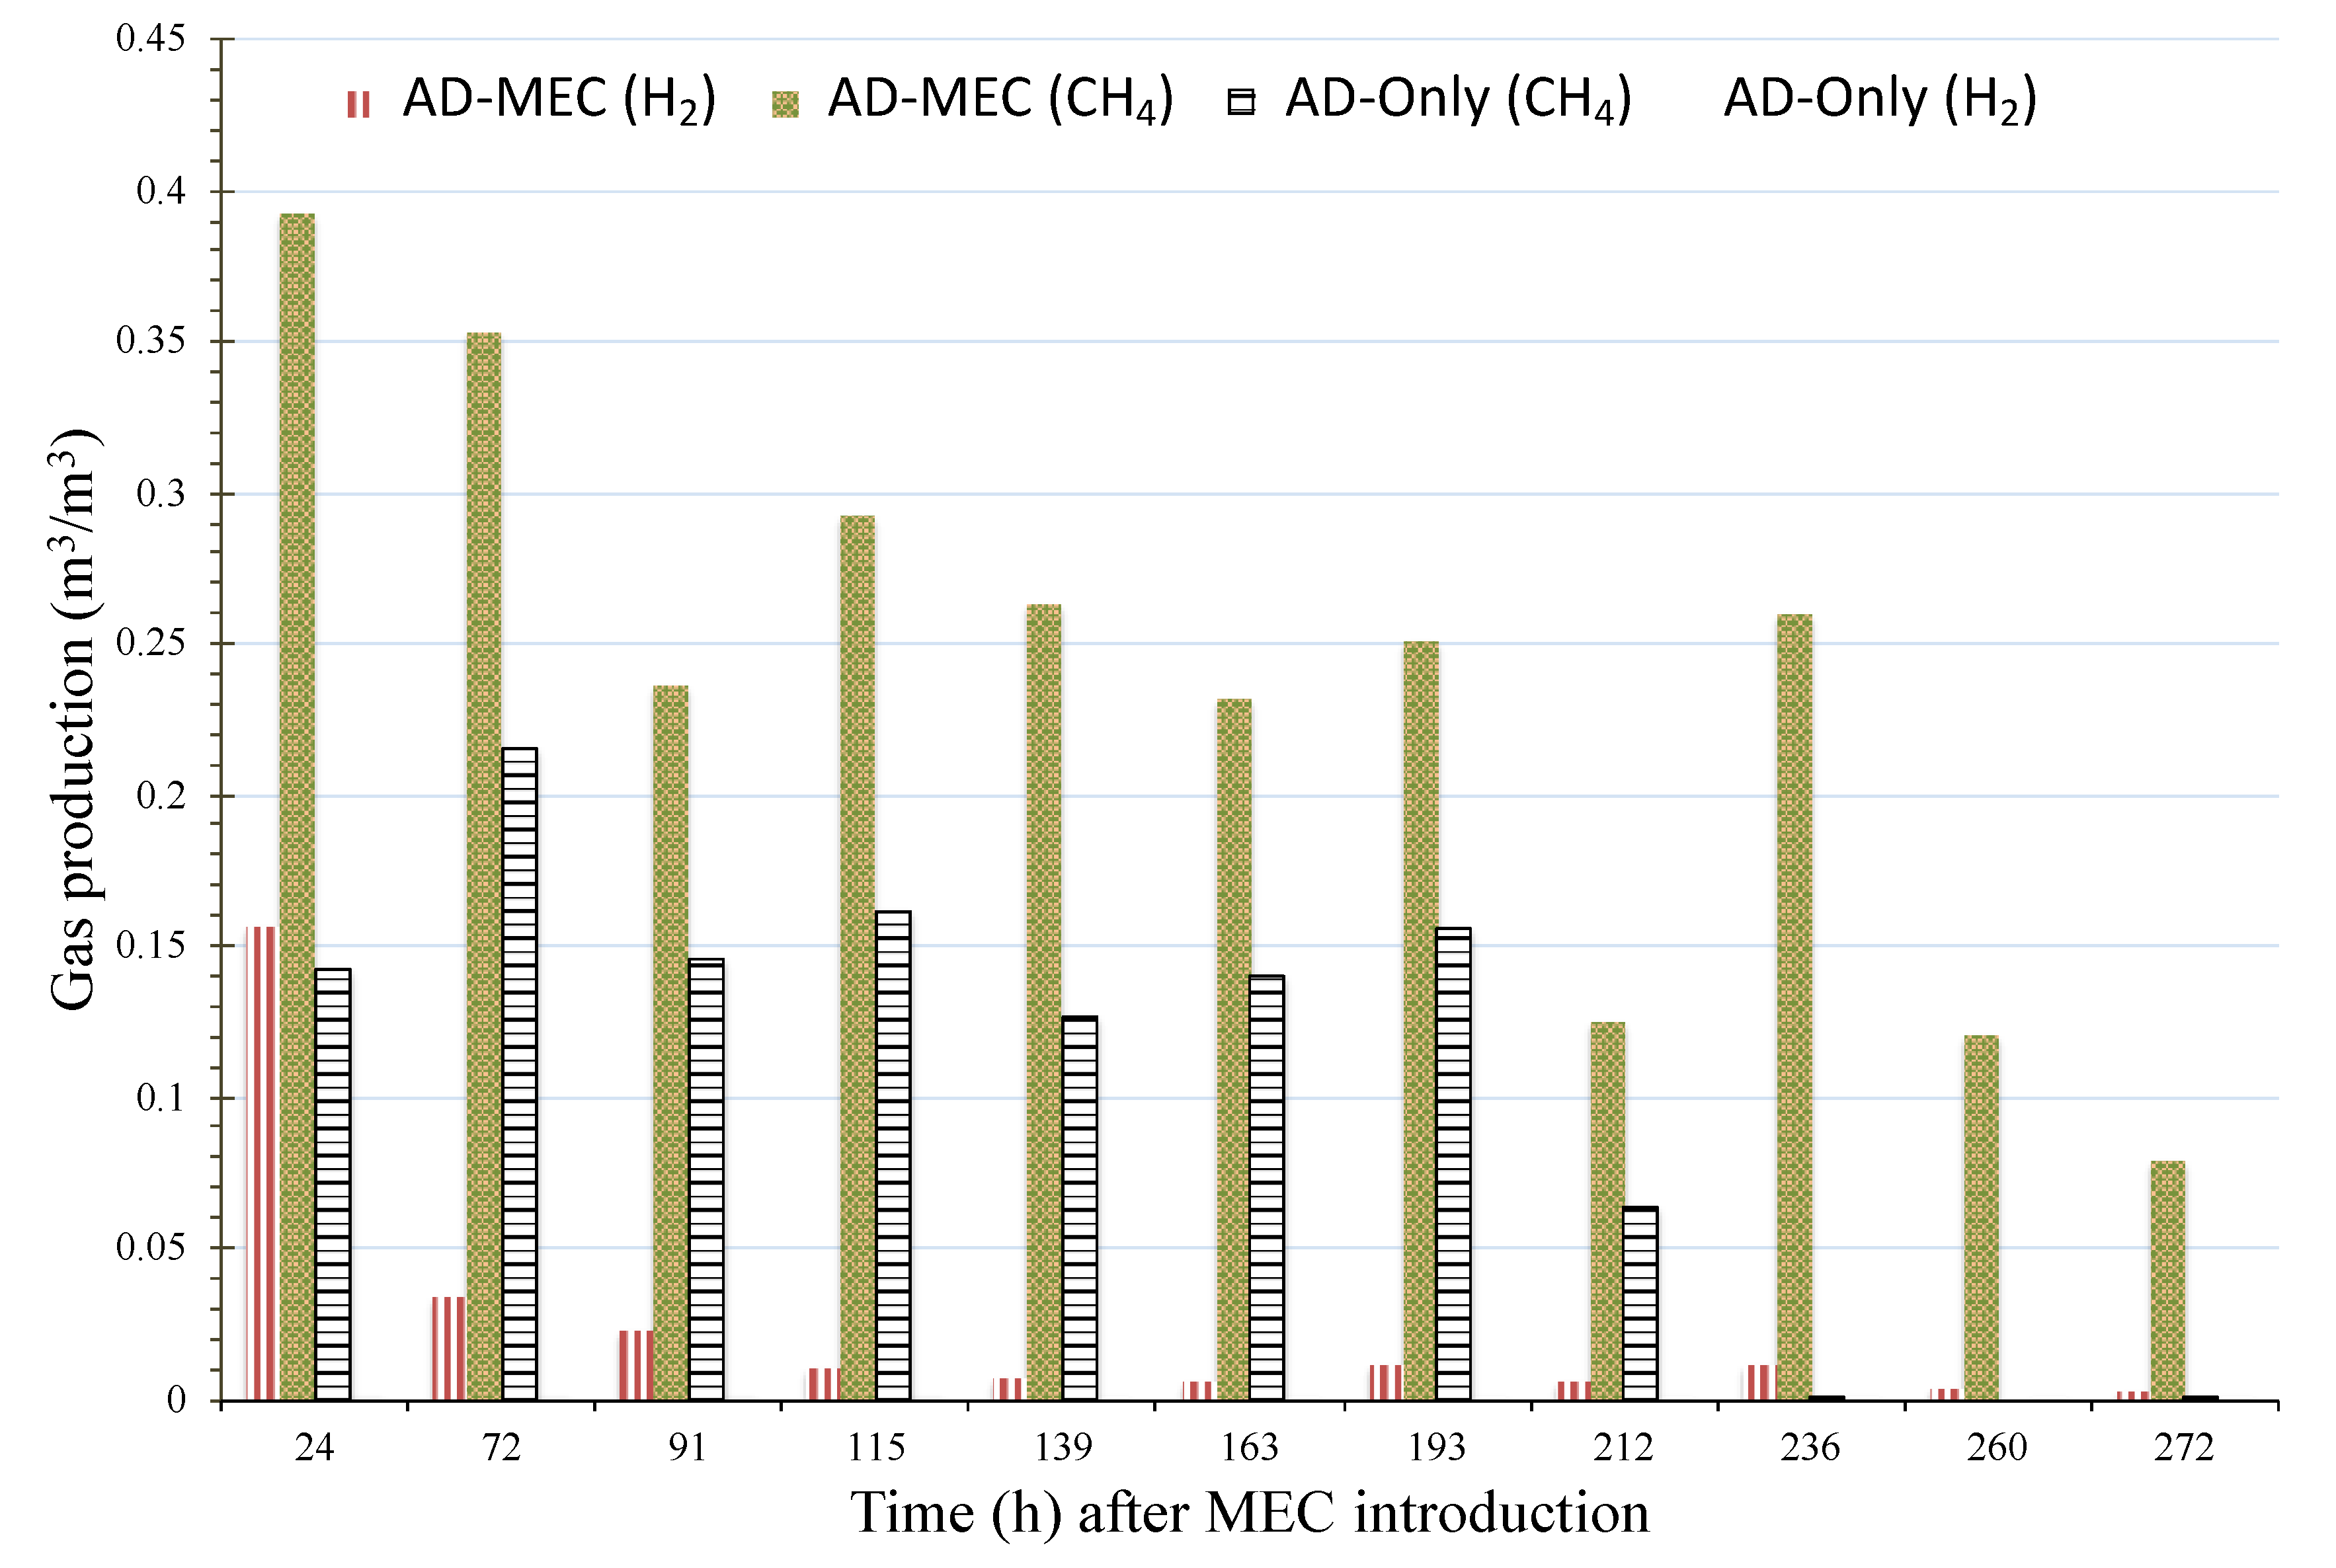
3.3. Biogas Production

Cumulative biogas production from the AD-MEC treatment was 93.0% higher than the AD-only treatment (Figure 3) during the MEC-inclusion period (days 20–31). The AD-MEC treatment produced 26.0 L of useful gases (CH4 + H2) over the additional 11-day digestion period, with 116% more CH4 (23.6 L) and 51,804% more H2 (2.43 L) than the AD-only treatment, which had 10.9 L CH4 and 0.04 L H2 (Figure 3 and Figure 4). These results are similar to previous studies [34,35] that have shown that MEC inclusion into AD increased biogas and CH4 production by 80–100%. The AD-MEC also reduced the CO2 concentration (37.9% of the total gas) compared to AD-only (40.2% of the total gas), illustrating how MEC incorporation can both decrease CO2 concentration and increase the generation of useful gases (CH4 and H2) in the biogas [4]. Our MEC novel design confined the cathode and the anode inside a single chamber, which reduced the cathode and anode distance, and thus, potential ohmic losses, but still allowed liquid to flow easily between the MEC and AD chambers. Recent studies [36,37,38] have reported that limiting the distance between the electrodes can increase the gas production, as large distances between the electrodes can inhibit electron flow between the anode and the cathode, increasing ohmic losses. Additionally, the manganese used in the stainless grade 201 could have increased the gas production, as Mg has been shown to enhance electrical energy produced in MFCs by a factor of ten [21,22].
Overall, the AD-MEC produced 149% more daily useful gases (H2 and CH4) (0.26 m3/m3/d) compared to AD-only (0.11 m3/m3/d) over the 11 additional days of digestion. The daily production rate of H2 and CH4 in the AD-MEC treatment reached a maximum of 0.16 m3H2/m3/d and 0.39 m3CH4/m3/d within the first 24 h. During the 11-day period, a cumulative H2 + CH4 production rate of 2.87 m3/m3 was observed for the AD-MEC treatment, compared to 1.15 m3/m3 observed for the AD-only treatment.
Hydrogen concentration recorded in the first 24 h of the MEC introduction reached 20% of biogas volume, but was then reduced to 2% H2, as CH4 increased from 50% to 56.9% after 5 days and to 63% CH4 after 11 days. Most MEC studies observed high H2 generation during experimental startup, which would gradually decrease while CH4 concentration increased [13,14,24,29,39]. Recent studies have shown that hydrogenotrophic methanogens can survive in harsh environmental conditions, with continued utilization of the produced H2 with CO2 to form CH4 [40,41,42]. It has also been shown that hydrogenotrophic methanogens can directly receive electrons from MEC electrodes [43] or H2 [14] to enhance CH4 production [44].

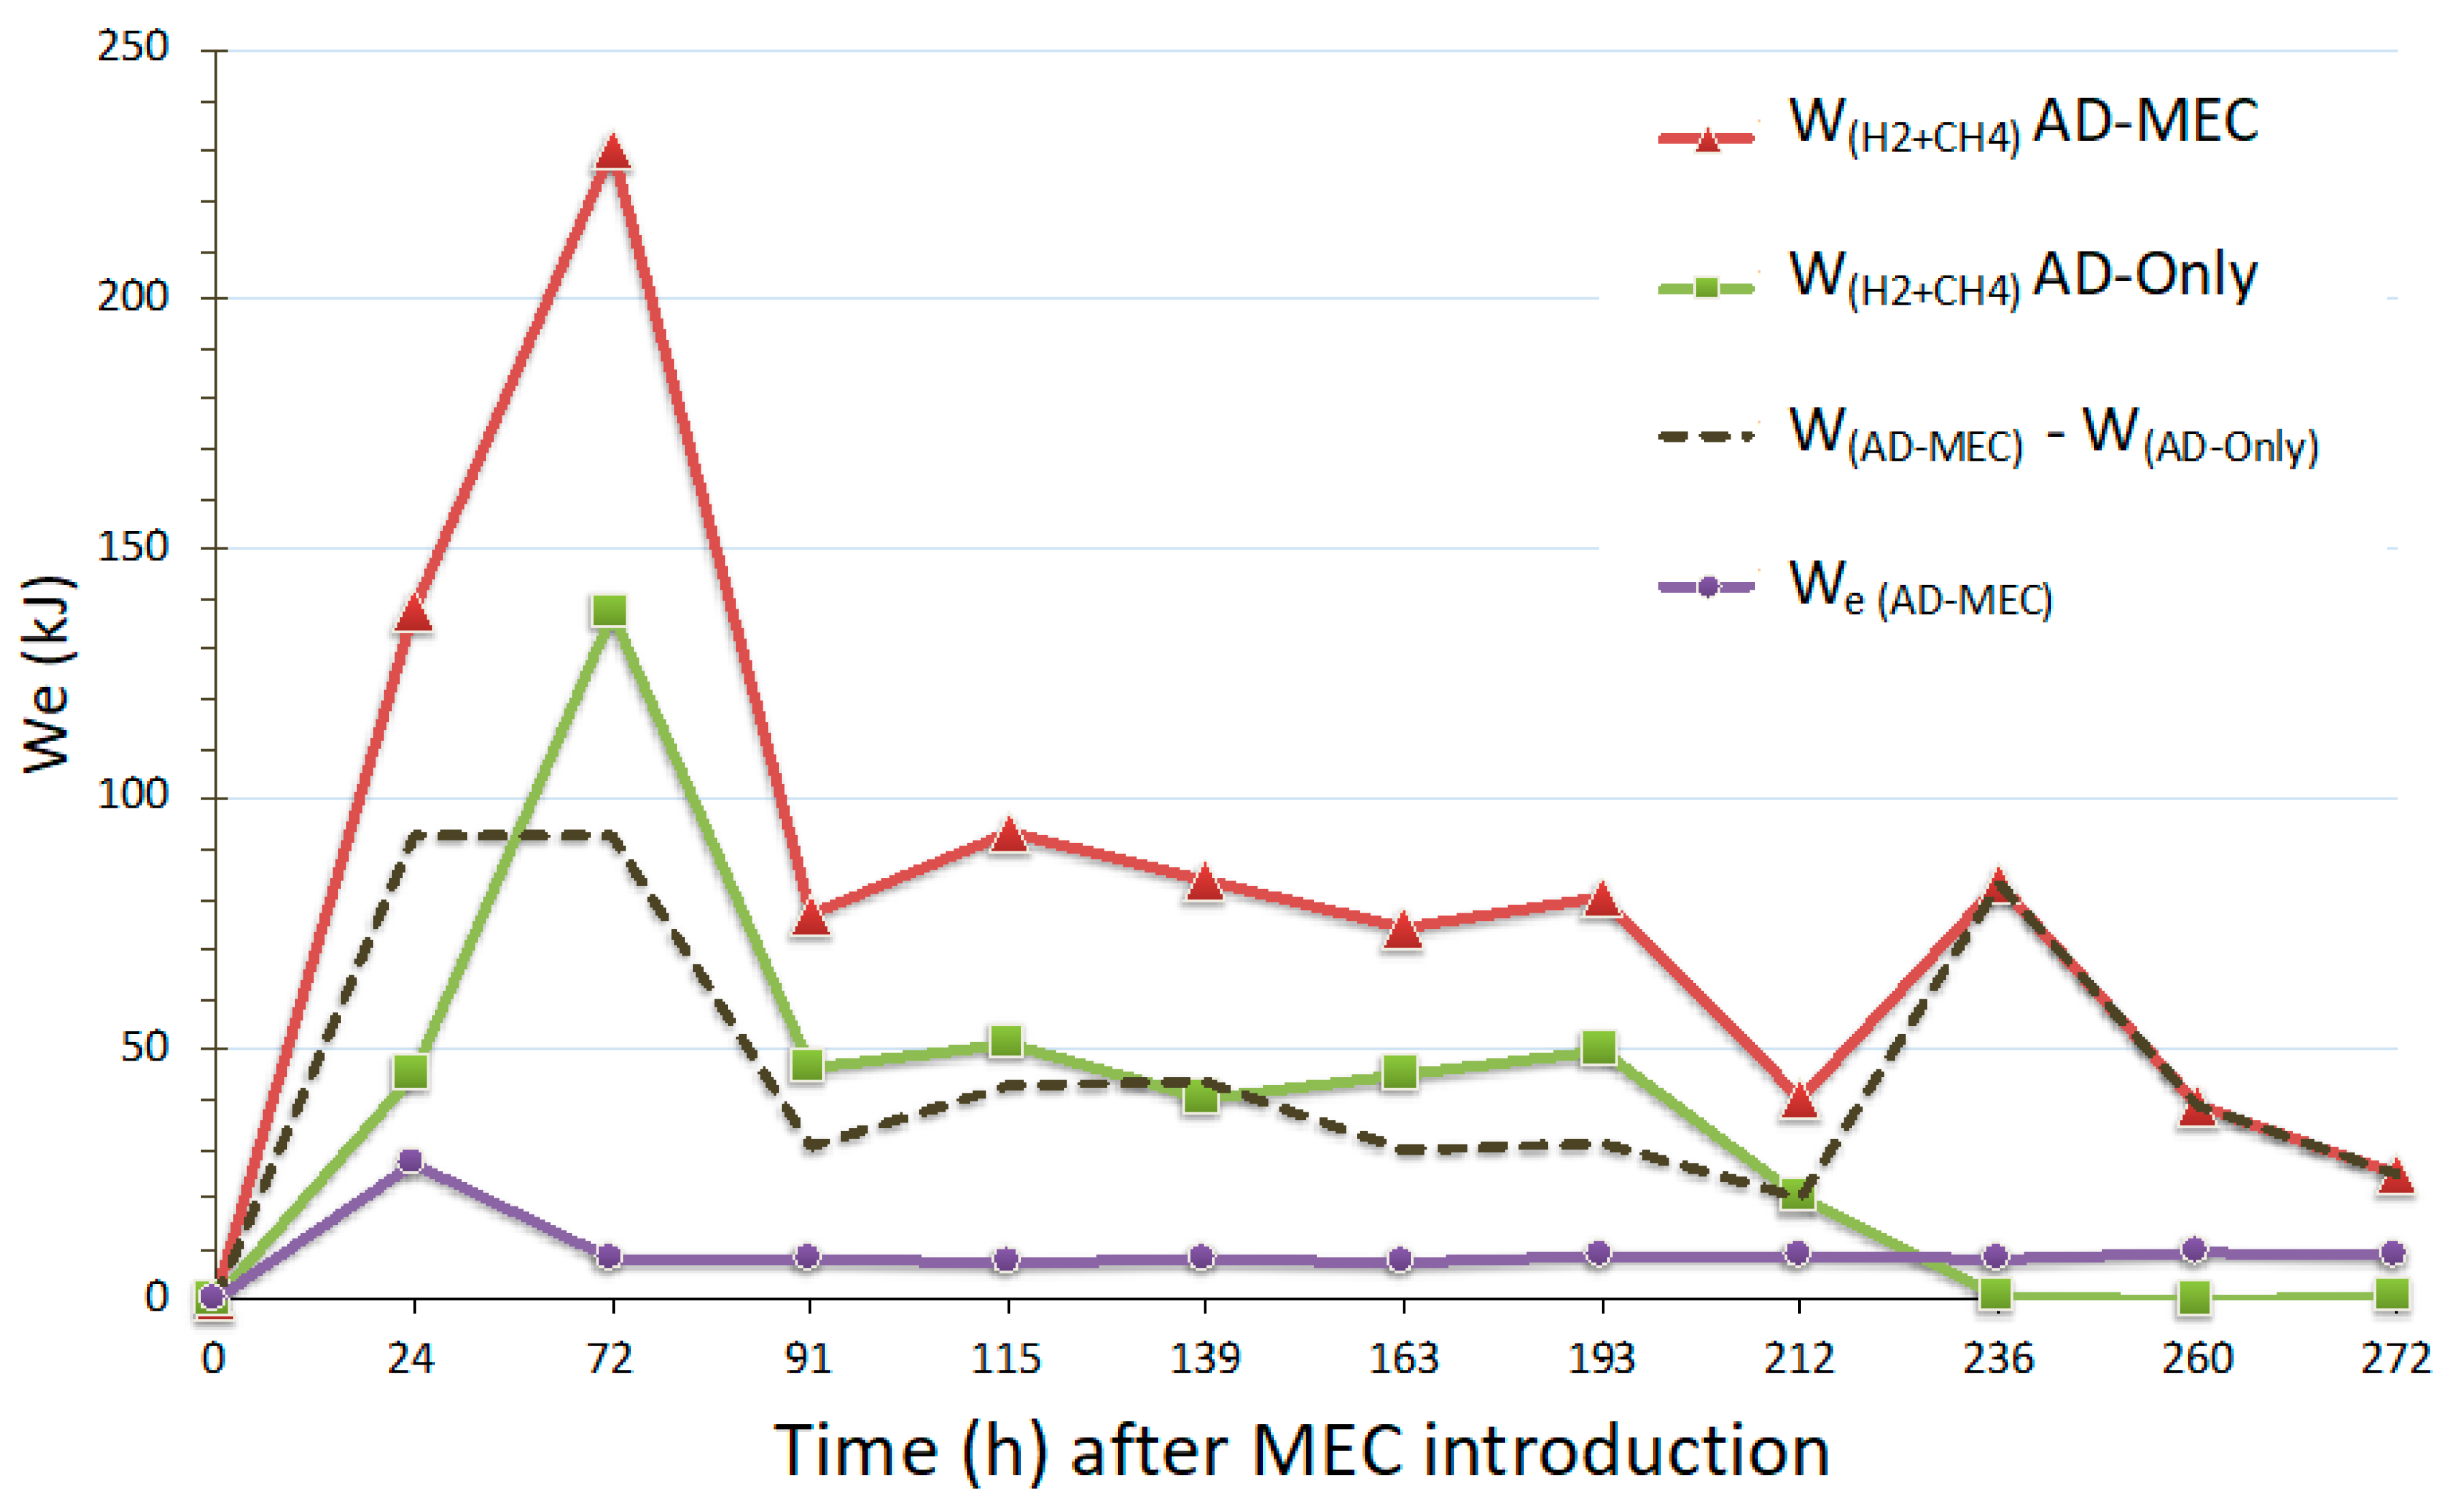
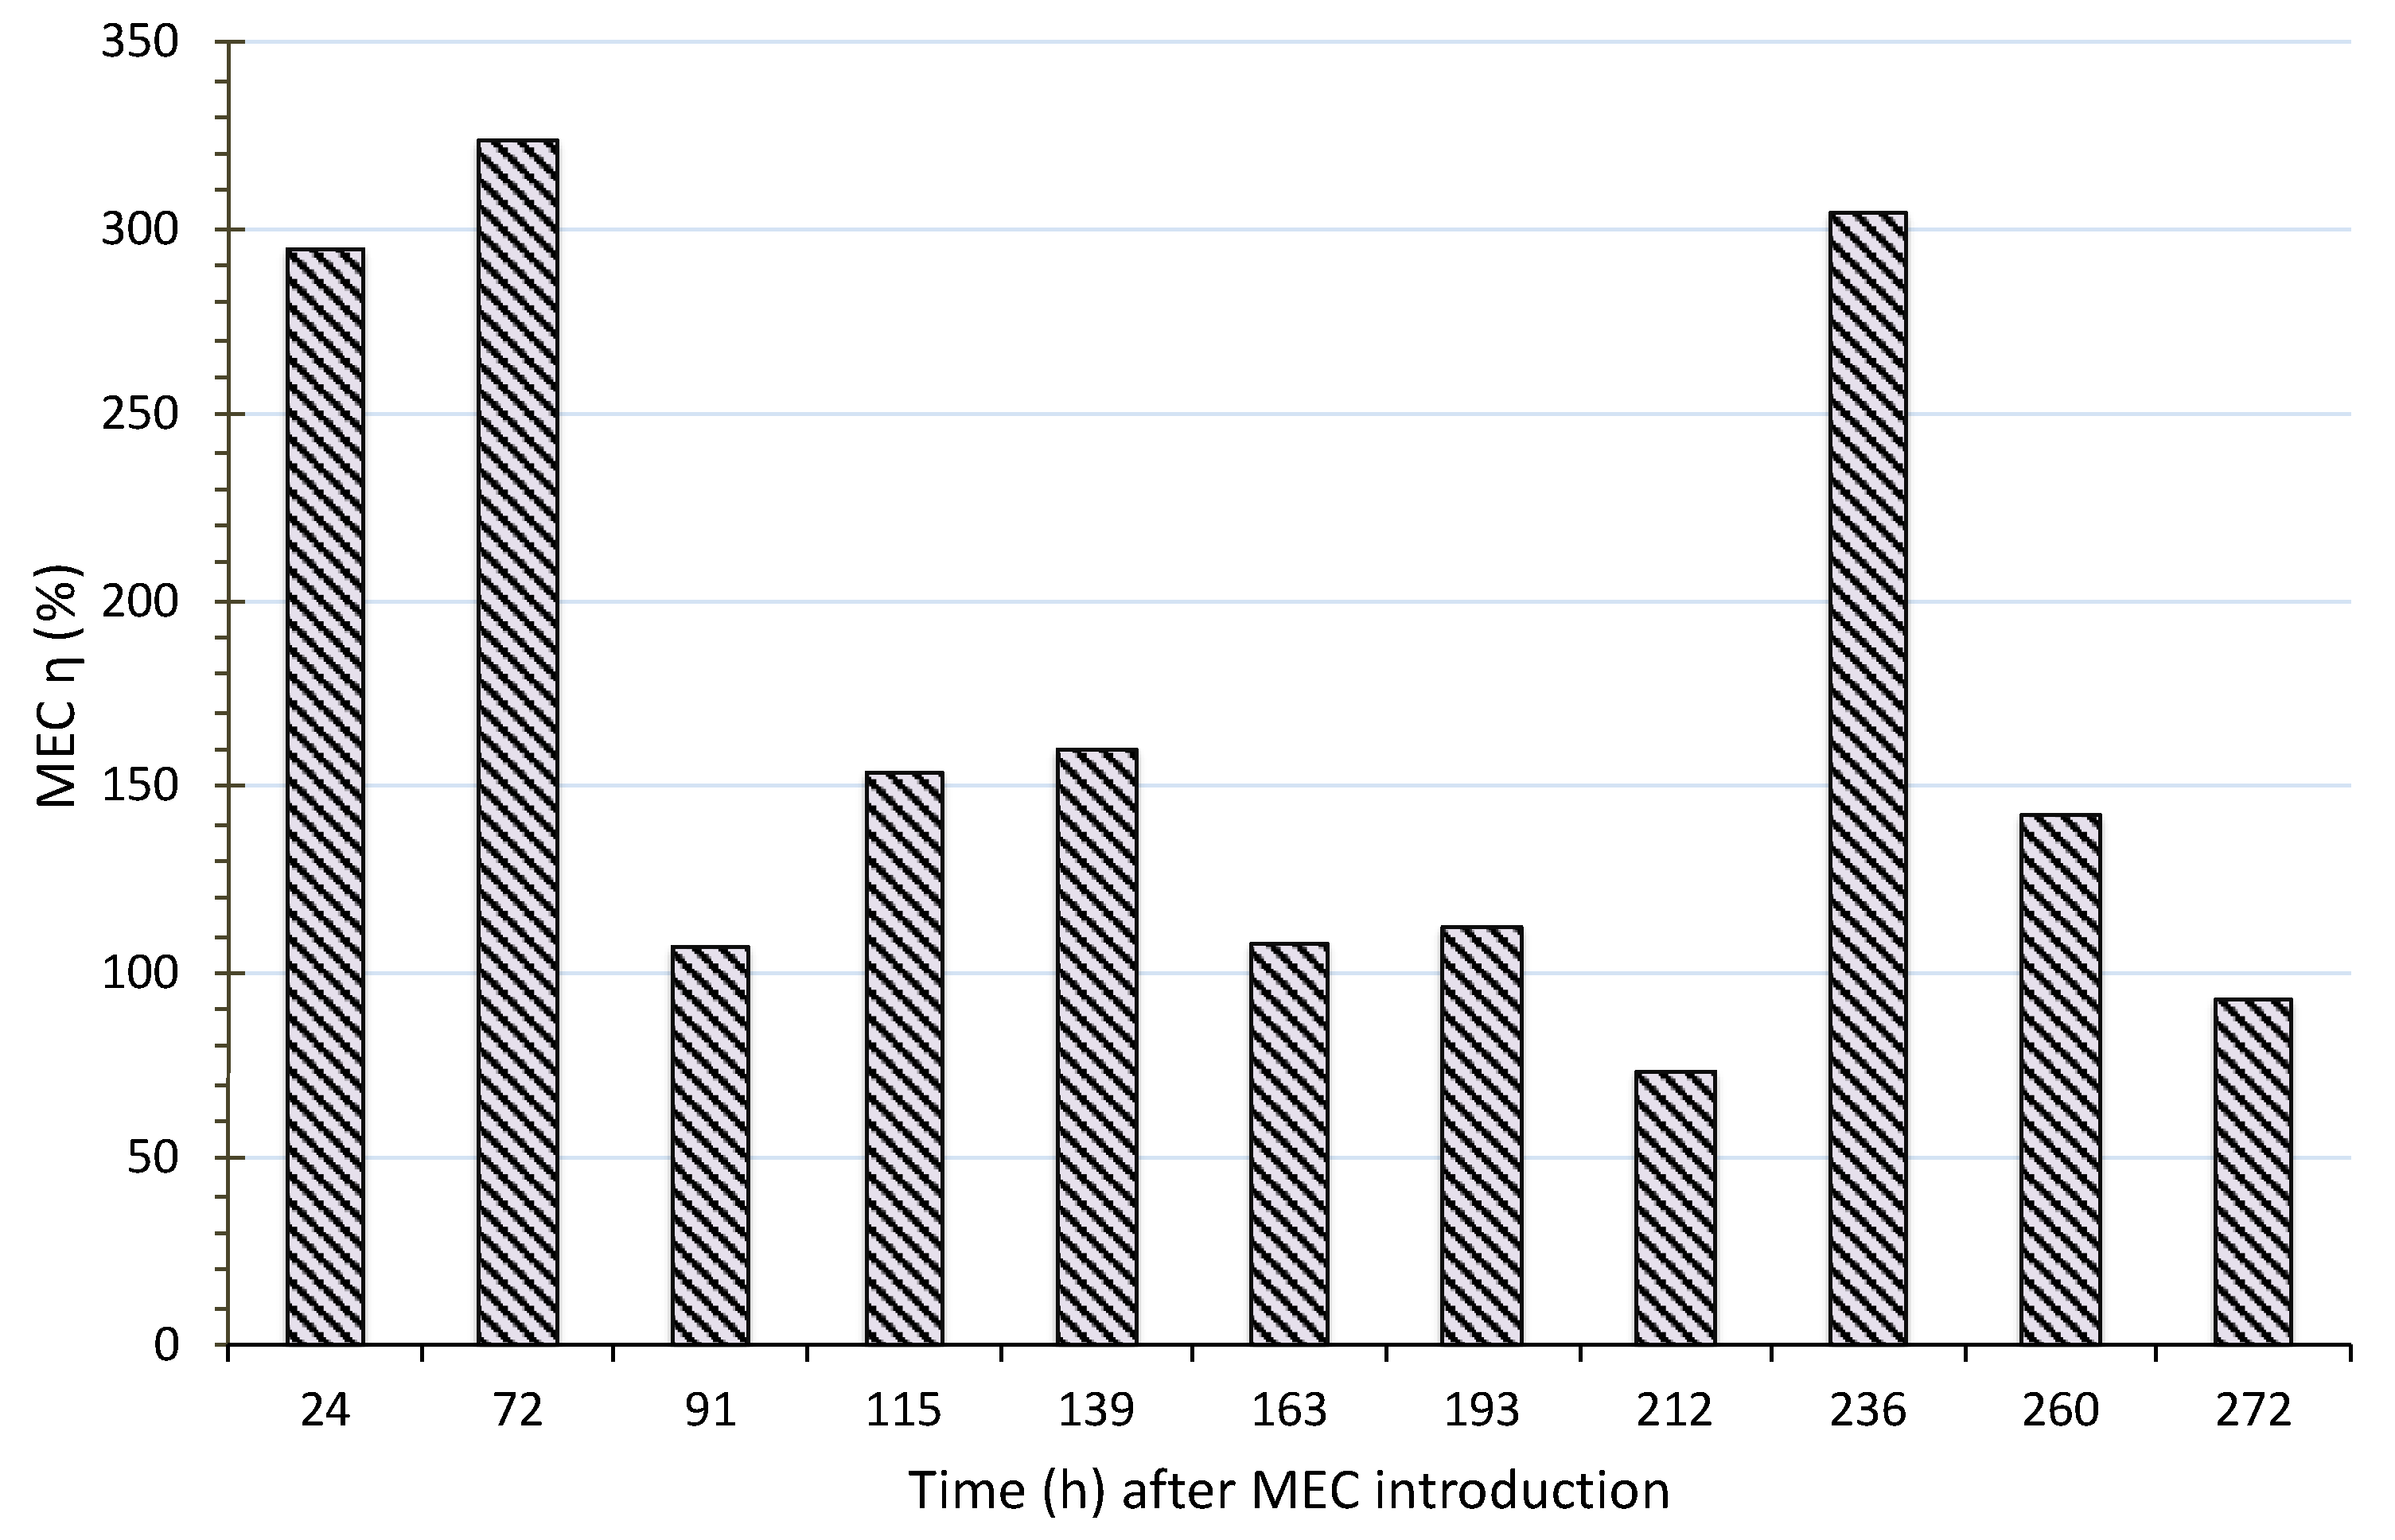
3.4. Energy Recovery

A relatively constant current, averaging at 111 mA, was recorded during the duration of the experiment, with a maximum of 383 mA recorded in the first 24 h. With an AD-MEC liquid volume of 8 L and a cathode surface area of 294 cm2, the volumetric current and current density were calculated to be 13 A/m3, and 7.4 A/m2, respectively. These results were 70.9% higher than the current density (4.33 A/m2) in a previous study [34] that resulted in 112% additional biogas with MEC inclusion. Biofilm on the electrodes also plays an important role (Figure 2) in increasing the current density [45,46].
Higher energy production was observed for the AD-MEC treatment (WAD-MEC = 964 kJ) compared to the AD-only treatment (WAD-only = 434 kJ). The total energy needed (electricity) to run the MEC (We(AD-MEC) = 107 kJ) was only 20.2% of the extra energy produced by the AD-MEC treatment, compared to the AD-only treatment (WAD-MEC – WAD-only), and 11.1% of the AD-MEC’s total energy production (WAD-MEC) (Figure 5).
The energy recovery efficiency, based on the extra energy produced (WAD-MEC – WAD-only) from the AD-MEC over the electrical energy needed to operate the MEC, ranged from 73.1% (ηE min.) to 324% (ηE max.), with an average increase of 170% over time (Figure 6). Huang et al. (2020) showed that coupling AD and MEC in the same chamber to treat food waste resulted in a 238% energy recovery efficiency when operated under negative pressure [47]. In the current study, the energy return was also greater than the input energy required to operate the MEC.

3.5. Biogas Utilization in a Fuel Cell or Combined Heat and Power (CHP) Generator

A combined heat and power (CHP) generator has a 30% electric conversion efficiency and 45% heat conversion efficiency [48], while a fuel cell has a 70% electric conversion efficiency [49]. The expected electricity production per m3 digester volume using the produced biogas from the AD-MEC (during the last 11 days of digestion) in a fuel cell is 1.5 kwh/m3/d, which is more than double the electricity production than AD-only (0.7 kwh/m3/d), due to the 149% higher daily CH4 and H2 production in the AD-MEC system (Table 1). Similarly, the calculated electricity and heat production from a CHP generator was more than double with MEC inclusion compared to AD-only. Previous studies have found the potential electricity production for dairy manure digestion to be between 0.08 and 1.8 kWh/m3/d over the entire digestion period [25,50]. By adding an MEC system to just the last 11 days of digestion, the dairy manure electric output went from the lower part of this range to the upper part of this range, while accounting for the electric input needed to operate the MEC. Overall, combining AD with an MEC greatly improved the biogas output during the last 11 days of digestion, allowing for a high electricity production when the biogas is used in a CHP or fuel cell (0.7 and 1.5 kWh/m3/d, respectively).

4. Conclusions

An MEC was combined with AD in a single chamber to increase organic matter removal and energy production. The AD-MEC treatment produced 137.9% more CH4 + H2 in the produced biogas compared to the AD-only treatment. Furthermore, COD conversion efficiency was 14.5% higher in AD-MEC compared to AD-only. The efficiency of electrical energy recovery for MECs reached a maximum of 324%, with an average of 170% over the 11-day period. Incorporating AD with MEC could increase overall energy production from dairy manure digestion, even if added as a polishing step after 20 days of digestion.

Author Contributions

Conceptualization: A.H., F.W., S.L., L.Q., and Y.L.; Methodology: A.H. and F.W.; Software: A.H.; Validation: A.H. and F.W.; Formal analysis: A.H., F.W. and Y.L.; Investigation: A.H.; Resources: A.H., S.L., and L.Q.; Data curation: A.H., F.W.; Writing—original draft preparation: A.H.; Writing—review and editing, A.H., F.W., S.L., L.Q., and Y.L.; Visualization: A.H., F.W., L.Q., and Y.L.; Supervision: L.Q.; Project Administration: A.H., S.L., and L.Q.; Funding acquisition: A.H. and L.Q. All authors have read and agreed to the published version of the manuscript.

Funding

This research was funded by the China Scholarship Council (CSC) PhD program.

Acknowledgments

The first author acknowledges support from CSC.

Conflicts of Interest

The authors declare no conflict of interest.

References

  1. Lu, L.; Xing, D.; Xie, T.; Ren, N.; Logan, B.E. Hydrogen production from proteins via electrohydrogenesis in microbial electrolysis cells. Biosens. Bioelectron. 2010, 25, 2690–2695. [Google Scholar] [CrossRef]
  2. Wrana, N.; Sparling, R.; Cicek, N.; Levin, D.B. Hydrogen gas production in a microbial electrolysis cell by electrohydrogenesis. J. Clean. Prod. 2010, 18, S105–S111. [Google Scholar] [CrossRef]
  3. Liu, H.; Grot, S.; Logan, B.E. Electrochemically assisted microbial production of hydrogen from acetate. Environ. Sci. Technol. 2005, 39, 4317–4320. [Google Scholar] [CrossRef] [PubMed]
  4. Hassanein, A.; Witarsa, F.; Guo, X.; Yong, L.; Lansing, S.; Qiu, L. Next generation digestion: Complementing anaerobic digestion (AD) with a novel microbial electrolysis cell (MEC) design. Int. J. Hydrogen Energy 2017, 42, 28681–28689. [Google Scholar] [CrossRef]
  5. Cheng, S.; Logan, B.E. Sustainable and efficient biohydrogen production via electrohydrogenesis. Proc. Natl. Acad. Sci. USA 2007, 104, 18871–18873. [Google Scholar] [CrossRef] [PubMed] [Green Version]
  6. Gujer, W.; Zehnder, A.J.B. Conversion processes in anaerobic digestion. Water Sci. Technol. 1983, 15, 127–167. [Google Scholar] [CrossRef]
  7. Gray, N.F. Biology of Wastewater Treatment; Oxford University Press: Oxford, UK, 1992; ISBN 0198563701. [Google Scholar]
  8. Mudrack, K.; Kunst, S. Biology of Sewage Treatment and Water Pollution Control; Ellis Horwood Limited: Hertfordshire, UK, 1986; ISBN 0853129126. [Google Scholar]
  9. Kim, J.; Park, C.; Kim, T.H.; Lee, M.; Kim, S.; Kim, S.W.; Lee, J. Effects of various pretreatments for enhanced anaerobic digestion with waste activated sludge. J. Biosci. Bioeng. 2003, 95, 271–275. [Google Scholar] [CrossRef]
  10. Chae, K.J.; Choi, M.J.; Kim, K.Y.; Ajayi, F.F.; Park, W.; Kim, C.W.; Kim, I.S. Methanogenesis control by employing various environmental stress conditions in two-chambered microbial fuel cells. Bioresour. Technol. 2010, 101, 5350–5357. [Google Scholar] [CrossRef]
  11. Hu, H.; Fan, Y.; Liu, H. Hydrogen production using single-chamber membrane-free microbial electrolysis cells. Water Res. 2008, 42, 4172–4178. [Google Scholar] [CrossRef]
  12. Lee, H.S.; Torres, C.I.; Parameswaran, P.; Rittmann, B.E. Fate of H2 in an upflow single-chamber microbial electrolysis cell using a metal-catalyst-free cathode. Environ. Sci. Technol. 2009, 43, 7971–7976. [Google Scholar] [CrossRef]
  13. Parameswaran, P.; Zhang, H.; Torres, C.I.; Rittmann, B.E.; Krajmalnik-Brown, R. Microbial community structure in a biofilm anode fed with a fermentable substrate: The significance of hydrogen scavengers. Biotechnol. Bioeng. 2010, 105, 69–78. [Google Scholar] [CrossRef] [PubMed]
  14. Wang, A.; Liu, W.; Cheng, S.; Xing, D.; Zhou, J.; Logan, B.E. Source of methane and methods to control its formation in single chamber microbial electrolysis cells. Int. J. Hydrogen Energy 2009, 34, 3653–3658. [Google Scholar] [CrossRef]
  15. Clauwaert, P.; Verstraete, W. Methanogenesis in membraneless microbial electrolysis cells. Appl. Microbiol. Biotechnol. 2009, 82, 829–836. [Google Scholar] [CrossRef] [PubMed]
  16. Cusick, R.D.; Bryan, B.; Parker, D.S.; Merrill, M.D.; Mehanna, M.; Kiely, P.D.; Liu, G.; Logan, B.E. Performance of a pilot-scale continuous flow microbial electrolysis cell fed winery wastewater. Appl. Microbiol. Biotechnol. 2011, 89, 2053–2063. [Google Scholar] [CrossRef] [PubMed]
  17. Wagner, R.C.; Regan, J.M.; Oh, S.E.; Zuo, Y.; Logan, B.E. Hydrogen and methane production from swine wastewater using microbial electrolysis cells. Water Res. 2009, 43, 1480–1488. [Google Scholar] [CrossRef]
  18. Liu, W.; Huang, S.; Zhou, A.; Zhou, G.; Ren, N.; Wang, A.; Zhuang, G. Hydrogen generation in microbial electrolysis cell feeding with fermentation liquid of waste activated sludge. Int. J. Hydrogen Energy 2012, 37, 13859–13864. [Google Scholar] [CrossRef]
  19. Logan, B.; Cheng, S.; Watson, V.; Estadt, G. Graphite fiber brush anodes for increased power production in air-cathode microbial fuel cells. Environ. Sci. Technol. 2007, 41, 3341–3346. [Google Scholar] [CrossRef]
  20. Wei, J.; Liang, P.; Huang, X. Recent progress in electrodes for microbial fuel cells. Bioresour. Technol. 2011, 102, 9335–9344. [Google Scholar] [CrossRef]
  21. Park, D.; Zeikus, J. Impact of electrode composition on electricity generation in a single-compartment fuel cell using Shewanella putrefaciens. Appl. Microbiol. Biotechnol. 2002, 59, 58–61. [Google Scholar] [CrossRef]
  22. Lowy, D.A.; Tender, L.M.; Zeikus, J.G.; Park, D.H.; Lovley, D.R. Harvesting energy from the marine sediment-water interface II. Kinetic activity of anode materials. Biosens. Bioelectron. 2006, 21, 2058–2063. [Google Scholar] [CrossRef]
  23. Call, D.; Logan, B.E. Hydrogen production in a single chamber microbial electrolysis cell lacking a membrane. Environ. Sci. Technol. 2008, 42, 3401–3406. [Google Scholar] [CrossRef]
  24. Rader, G.K.; Logan, B.E. Multi-electrode continuous flow microbial electrolysis cell for biogas production from acetate. Int. J. Hydrogen Energy 2010, 35, 8848–8854. [Google Scholar] [CrossRef]
  25. Achi, C.G.; Hassanein, A.; Lansing, S. Enhanced biogas production of cassava wastewater using zeolite and biochar additives and manure co-digestion. Energies 2020, 13, 491. [Google Scholar] [CrossRef] [Green Version]
  26. American Public Health Association (APHA). Standard Methods for the Examination of Water and Wastewater, 21st ed.; APHA: Washington, DC, USA, 2005; ISBN 0875532357. [Google Scholar]
  27. O’Dell, J.W. The Determination of Chemical Oxygen Demand by Semi-Automated Colorimetry; United States Environmental Protection Agency: Westlake, OH, USA, 1996.
  28. Gajaraj, S.; Huang, Y.; Zheng, P.; Hu, Z. Methane production improvement and associated methanogenic assemblages in bioelectrochemically assisted anaerobic digestion. Biochem. Eng. J. 2017, 117, 105–112. [Google Scholar] [CrossRef]
  29. Cai, W.; Han, T.; Guo, Z.; Varrone, C.; Wang, A.; Liu, W. Methane production enhancement by an independent cathode in integrated anaerobic reactor with microbial electrolysis. Bioresour. Technol. 2016, 208, 13–18. [Google Scholar] [CrossRef] [Green Version]
  30. Asztalos, J.R.; Kim, Y. Enhanced digestion of waste activated sludge using microbial electrolysis cells at ambient temperature. Water Res. 2015, 87, 503–512. [Google Scholar] [CrossRef] [PubMed]
  31. Logan, B.E.; Regan, J.M. Electricity-producing bacterial communities in microbial fuel cells. Trends Microbiol. 2006, 14, 512–518. [Google Scholar] [CrossRef] [PubMed]
  32. Khater, D.Z.; El-Khatib, K.M.; Hassan, H.M. Microbial diversity structure in acetate single chamber microbial fuel cell for electricity generation. J. Genet. Eng. Biotechnol. 2017, 15, 127–137. [Google Scholar] [CrossRef]
  33. Shornikova, O.N.; Kogan, E.V.; Sorokina, N.E.; Avdeev, V.V. The specific surface area and porous structure of graphite materials. Russ. J. Phys. Chem. A 2009, 83, 1022–1025. [Google Scholar] [CrossRef]
  34. Zhang, Y.; Angelidaki, I. Counteracting ammonia inhibition during anaerobic digestion by recovery using submersible microbial desalination cell. Biotechnol. Bioeng. 2015, 112, 1478–1482. [Google Scholar] [CrossRef]
  35. Xiao, B.; Chen, X.; Han, Y.; Liu, J.; Guo, X. Bioelectrochemical enhancement of the anaerobic digestion of thermal-alkaline pretreated sludge in microbial electrolysis cells. Renew. Energy 2018, 115, 1177–1183. [Google Scholar] [CrossRef]
  36. Kadier, A.; Simayi, Y.; Abdeshahian, P.; Azman, N.F.; Chandrasekhar, K.; Kalil, M.S. A comprehensive review of microbial electrolysis cells (MEC) reactor designs and configurations for sustainable hydrogen gas production. Alex. Eng. J. 2016, 55, 427–443. [Google Scholar] [CrossRef] [Green Version]
  37. An, J.; Lee, H.S. Implication of endogenous decay current and quantification of soluble microbial products (SMP) in microbial electrolysis cells. RSC Adv. 2013, 3, 14021–14028. [Google Scholar] [CrossRef]
  38. Fu, Q.; Wang, D.; Li, X.; Yang, Q.; Xu, Q.; Ni, B.J.; Wang, Q.; Liu, X. Towards hydrogen production from waste activated sludge: Principles, challenges and perspectives. Renew. Sustain. Energy Rev. 2021, 135, 110283. [Google Scholar] [CrossRef]
  39. Liu, W.; Cai, W.; Guo, Z.; Wang, L.; Yang, C.; Varrone, C.; Wang, A. Microbial electrolysis contribution to anaerobic digestion of waste activated sludge, leading to accelerated methane production. Renew. Energy 2016, 91, 334–339. [Google Scholar] [CrossRef] [Green Version]
  40. Cai, W.; Liu, W.; Zhang, Z.; Feng, K.; Ren, G.; Pu, C.; Sun, H.; Li, J.; Deng, Y.; Wang, A. mcrA sequencing reveals the role of basophilic methanogens in a cathodic methanogenic community. Water Res. 2018, 136, 192–199. [Google Scholar] [CrossRef]
  41. Jiang, Y.; Banks, C.; Zhang, Y.; Heaven, S.; Longhurst, P. Quantifying the percentage of methane formation via acetoclastic and syntrophic acetate oxidation pathways in anaerobic digesters. Waste Manag. 2018, 71, 749–756. [Google Scholar] [CrossRef]
  42. Zakaria, B.S.; Ranjan Dhar, B. An intermittent power supply scheme to minimize electrical energy input in a microbial electrolysis cell assisted anaerobic digester. Bioresour. Technol. 2020, 124109. [Google Scholar] [CrossRef]
  43. Lohner, S.T.; Deutzmann, J.S.; Logan, B.E.; Leigh, J.; Spormann, A.M. Hydrogenase-independent uptake and metabolism of electrons by the archaeon Methanococcus maripaludis. ISME J. 2014, 8, 1673–1681. [Google Scholar] [CrossRef] [Green Version]
  44. Villano, M.; Aulenta, F.; Ciucci, C.; Ferri, T.; Giuliano, A.; Majone, M. Bioelectrochemical reduction of CO2 to CH4 via direct and indirect extracellular electron transfer by a hydrogenophilic methanogenic culture. Bioresour. Technol. 2010, 101, 3085–3090. [Google Scholar] [CrossRef]
  45. Yin, Q.; Zhu, X.; Zhan, G.; Bo, T.; Yang, Y.; Tao, Y.; He, X.; Li, D.; Yan, Z. Enhanced methane production in an anaerobic digestion and microbial electrolysis cell coupled system with co-cultivation of Geobacter and Methanosarcina. J. Environ. Sci. (China) 2016, 42, 210–214. [Google Scholar] [CrossRef] [PubMed]
  46. Malvankar, N.S.; Tuominen, M.T.; Lovley, D.R. Biofilm conductivity is a decisive variable for high-current-density Geobacter sulfurreducens microbial fuel cells. Energy Environ. Sci. 2012, 5, 5790–5797. [Google Scholar] [CrossRef] [Green Version]
  47. Huang, J.; Feng, H.; Huang, L.; Ying, X.; Shen, D.; Chen, T.; Shen, X.; Zhou, Y.; Xu, Y. Continuous hydrogen production from food waste by anaerobic digestion (AD) coupled single-chamber microbial electrolysis cell (MEC) under negative pressure. Waste Manag. 2020, 103, 61–66. [Google Scholar] [CrossRef]
  48. Hampson, A.; Tidball, R.; Fucci, M.; Weston, R. Combined Heat and Power (CHP) Technical Potential in the United States; US Department of Energy: Washington, DC, USA, 2016. Available online: https://www.energy.gov/sites/prod/files/2016/04/f30/CHP%20Technical%20Potential%20Study%203-31-2016%20Final.pdf (accessed on 13 October 2020).
  49. Chuahy, F.D.; Kokjohn, S.L. Solid oxide fuel cell and advanced combustion engine combined cycle: A pathway to 70% electrical efficiency. Appl. Energy 2019, 235, 391–408. [Google Scholar] [CrossRef]
  50. Fan, X.; Li, Z.; Wang, T.; Yin, F.; Jin, X. Introduction to a Large-Scale Biogas Plant in a Dairy Farm. In Proceedings of the 2010 International Conference on Digital Manufacturing Automation, Changsha, China, 18–20 December 2010; Volume 1, pp. 863–866. [Google Scholar]
Figure 1. Photograph and schematic diagram of combined AD and MEC (AD-MEC) system compared to AD without MEC (AD-only) treatment.
Sustainability 12 08491 g001
Figure 2. Morphological characteristics of the anode and cathode as visualized by the scanning electron microscope (SEM).
Sustainability 12 08491 g002
Figure 3. Cumulative and daily biogas production for AD-MEC and AD-only for days 20–31 (272 cumulative h) after MEC introduction (days 0–20 not shown, as treatments acted as duplicate treatments).
Sustainability 12 08491 g003
Figure 4. Methane (CH4) and hydrogen (H2) production for AD-MEC and AD-only for days 20–31 (272 cumulative h) after MEC introduction (days 0–20 not shown, as reactors acted as duplicate reactors).
Sustainability 12 08491 g004
Figure 5. Energy from the CH4 and H2 produced by the AD-MEC and AD-only treatments from days 20–31 (272 cumulative h) after MEC introduction (days 0–20 not shown, as reactors acted as duplicate reactors).
Sustainability 12 08491 g005
Figure 6. Electric energy recovery efficiency for MEC inclusion.
Sustainability 12 08491 g006
Table 1. Biogas utilization in a fuel cell and combined heat and power (CHP) generator based on daily H2 and CH4 production per m3 digester.
H2 ProductionCH4 ProductionFuel Cell UtilizationCHP
Utilization
Unitm3 H2/m3/dm3 CH4/m3/dkWh/m3/dkWh/m3/dBTUs/m3/d
AD-MEC0.0250.241.50.73388
AD-only00.110.70.31515
Publisher’s Note: MDPI stays neutral with regard to jurisdictional claims in published maps and institutional affiliations.

