Article

Design a Semantic Scale for Passenger Perceived Quality Surveys of Urban Rail Transit: Within Attribute’s Service Condition and Rider’s Experience

Rail Data Research and Application Key Laboratory of Hunan Province, School of Traffic and Transportation Engineering, Central South University, Changsha 410075, China
*
Author to whom correspondence should be addressed.
Sustainability 2020, 12(20), 8626; https://0-doi-org.brum.beds.ac.uk/10.3390/su12208626
Submission received: 28 August 2020 / Revised: 14 October 2020 / Accepted: 15 October 2020 / Published: 18 October 2020
(This article belongs to the Collection Sustainable Rail and Metro Systems)

Abstract

:
A better understanding of passenger perceived quality helps urban rail transit managers adopt better strategies to improve the service quality of urban rail transit, which is beneficial to the sustainable development of an urban rail transit system itself and cities. This paper designs a semantic scale to survey passenger perceived quality of urban rail transit. The methodology is selecting specific features of an attribute and then describing the features to present the attribute’s service condition and the rider’s experience. The scale’s options can reduce cognitive steps and hesitation for riders to answer the survey questionnaire. Furthermore, it enables urban rail transit managers to understand passenger perceived quality more visually. After verifying the reliability and validity of the semantic scale, an empirical study was conducted to compare the evaluation results of the proposed semantic scale, Likert, and numeric scales. Compared to the Likert and numeric scales, the evaluation result of the semantic scale is fairer for attributes with homogeneous service conditions over operation periods from the transit agency perspective. Meanwhile, it is more homogeneous for attributes with homogeneous service conditions and is more heterogeneous for attributes with heterogeneous service conditions.

1. Introduction

Transit service quality is usually defined as the overall measured or perceived performance of transit service from the passenger’s point of view [1] (Chapter 4, p. 6). Improving service quality can help attract more riders, retain the current riders [2], and alleviate excessive use of private cars [3]. It helps to promote the sustainable development of cities. To have more targeted strategies for improving transit service quality and to allocate resources more reasonably, transit managers often need to know the current status of service quality. The primary method is to conduct passenger perceived quality surveys [4].
At present, self-administrated questionnaires serve as the primary form of passenger perceived quality surveys [5], and five-point Likert and numeric scales are the most used [6]. The Likert scale options are generally set to very satisfied, satisfied, normal, dissatisfied, and very dissatisfied, such as [7,8]; the numeric scale options are set to one, two, three, four, and five points, as in [4,5].
These two scales are practical tools to measure passenger perceived quality. However, based on the following three reasons, we aim to design a five-point semantic scale for passenger perceived quality surveys of urban rail transit. Compared with Likert and numeric scales, the options of the semantic scale describe the attribute’s service condition and rider’s experience more directly.
Initially, we aim to reduce the rider’s cognitive steps in answering. Tourangeau et al. [9] (pp. 1–22) illustrated cognitive steps in completing questionnaires: first, understanding the intent of the question; second, searching memories for information; third, integrating the information into a summary judgment (e.g., satisfied, dissatisfied, one point, and two points) [10] (p. 10); and fourth, translating the judgment onto the option. Thus, we hope to design a semantic scale that riders can directly match their attitudes in conceptual terms (e.g., a searched memory that the in-station guide sign is clear and conspicuous) with the closest option in the scale. Riders do not need to integrate their searched memories into a judgment before choosing an option.
Second, we aim to reduce the rider’s hesitation in answering. Brace [11] (p. 78) stated that measuring behaviors is easier than measuring attitudes for riders. Riders might not have a specific attitude towards the performance of some attributes. As Likert or numeric scales apply abstract categories of satisfaction levels, they feel the adjacent levels of Likert or numeric scales (e.g., very satisfied and satisfied; four points and three points) are similar to their searched experience or attitudes [10] (p. 11). In other words, it is hard for riders to map their attitudes onto a scale option, which makes riders hesitant to choose. Thus, riders need to be helped to express attitudes and describe images [11] (p. 78). We aim to design a semantic scale that describes the image of the service conditions to reduce the riders’ hesitation in answering. Taking “Ticket purchase and top-up service” as an example: one option may be “the operation is simple, and the number of machines is sufficient”; an adjacent option maybe “the operation is simple, and the number of machines is insufficient”. Terms like “sufficient” and “insufficient” show clear distinctions. Two options describe two different images of the service conditions, which makes riders feel easier to answer it.
Third, we aim to formulate more targeted strategies to improve service quality. A semantic scale can present a more visual status of service performance. For instance, if most riders choose the option “the operation is inconvenient, and the number of machines is insufficient”, transit managers can identify lacking machines is the main drawback of the ticket purchase and top-up service’s performance, rather than having an inconvenient operation. It suggests increasing the number of machines will be an effective strategy to improve the service quality of this attribute.
The work of this paper is twofold. First, we formed a semantic scale for passenger perceived quality surveys of urban rail transit and measured its reliability and validity. Second, we conducted an empirical study to compare the difference in evaluation results among the semantic, Likert, and numeric scales. It helps us understand the potential characteristics of the semantic scale and assists transit managers to understand the impact of the scale form on the evaluation results. The remainder of this paper is structured into four sections: Section 2 reviews related studies; Section 3 describes the methodology to form a semantic scale, followed by an application demonstrated in Section 4; Section 5 illustrates the plan and result of the empirical study; Section 6 concludes the paper with our work and discovery.

2. Literature Review

De Oña and De Oña [6] summarized the scale forms used for passenger perceived quality surveys in transit. They show that besides the five-point Likert and numeric scales, three- to seven-point Likert and three- to 11-point numeric scales are also adopted, and the scale forms do not differ in different modes of transportation. Barabino et al. [12] suggested an 11-point numeric scale would be easier for riders to provide judgments than a five- or seven-point numeric scale.
Some researchers also proposed other ways to measure passenger perceived quality. Marcucci and Gatta [13] and Eboli and Mazzulla [14] applied a stated preference survey where riders were asked to choose between their perceived experiences and hypothetical services set by researchers. Marcucci and Gatta [13] stated that it could alleviate the rider’s tendency to select the middle option. Due to the complexity of stated preference surveys, De Oña and De Oña [6] suggested such a method will probably not be used soon. Later, Beck and Rose [15] used a best–worst scale where riders only needed to select the best- and worst-performing, as well as the most- and least-important attributes from a set of attributes, until all attributes are covered. Thus, riders did not need to evaluate every attribute, and it saved time. However, this scale still has not been widely used [16].
Some scholars summarized the evaluation characteristics of different scales by comparing their evaluation results on the same object. On the one hand, the evaluation result of the Likert scale shows central tendency bias. Presser and Schuman [17] analyzed five data sets that involve social or political issues and found offering a middle alternative in the Likert scale increased the size of this category by 10–20%. Most of the increase came from declines in polar positions, and the size of “do not know” responses mostly remained the same. Whether a middle position was offered also did not affect univariate distributions. On the other hand, the derived importance of attributes from the best–worst scale matched previous studies better than the Likert scale for bus transit service [16].
Moreover, the semantic-differential scale seems to have higher reliability, internal validity, and model fit of the structural equations model than the Likert scale. Based on four data sets that evaluated stores, Ofir et al. [18] concluded that the semantic-differential and Likert scales were non-interchangeable. In most cases, the semantic-differential scale had higher reliability and internal validity than the Likert scale. Friborg et al. [19] tested human resilience, discovering the structural equations model in the semantic-differential version fit the data better than the Likert version. Bonera et al. [20] used the semantic-differential scale to investigate the factors (e.g., socio-economics) that affect the user’s perception of travel experience and the ease of doing several activities on the journey.
Nevertheless, the semantic-differential scale only has descriptive sentences at the two ends of the scale. The categorization of other satisfaction levels is still as abstract as the Likert and numeric scales. Therefore, the cognitive steps and hesitation of the semantic-differential scale are still as same as the Likert and numeric scales.
Table 1 summarizes some characteristics of the Likert, numeric, stated preference, best–worst, and semantic-differential scales.
Based on the above research and Table 1, it at least suggests three points. First, the two most currently used Likert and numeric scales in transit passenger perceived quality surveys have optimizing room and altering a scale form will be a feasible method. Second, the semantic-differential scale incorporates advantages in data quality, but the cognitive steps and real experience reflection can still be improved. Third, using different scales to evaluate the same object may have different results.

3. Methodology

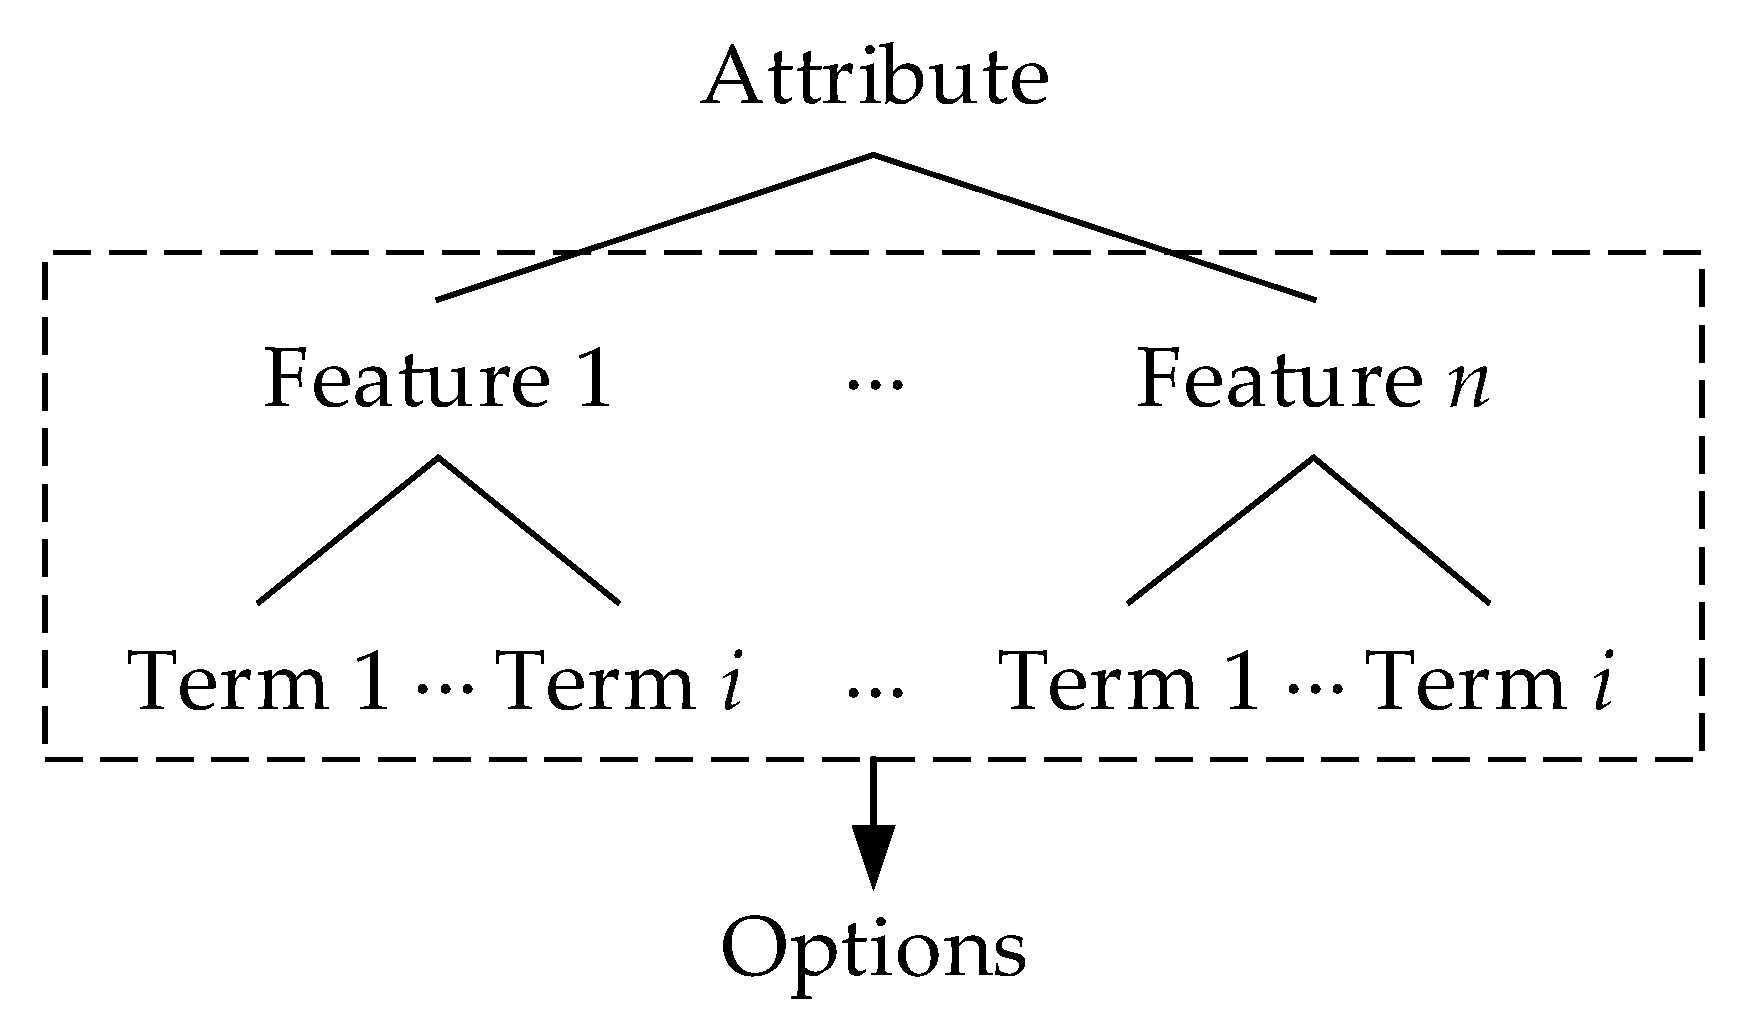
3.1. Design Concept and Framework
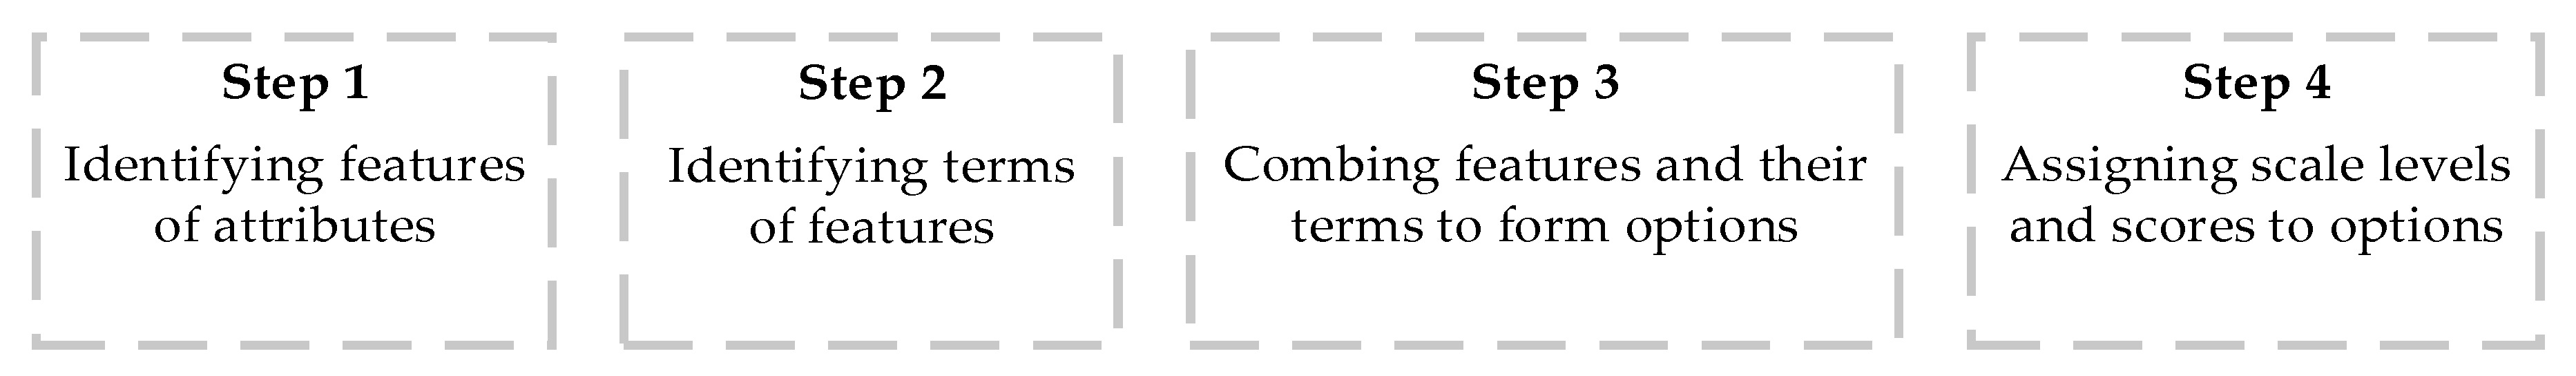
We aim to design a semantic scale with attributes and descriptive sentences in all options for each attribute. The attributes will be arranged based on the process of a ride in the questionnaire, which helps riders recall their riding experiences so that it facilitates them to answer. In each level’s option, the sentence describes the attribute’s service condition based on the rider’s experience. The descriptive subjects of an attribute are defined as features, and the adjectives or rider’s experience used to describe the features are defined as terms. Figure 1 depicts the hierarchical relationship between an attribute and its features, terms, and options.
For each level’s option, the semantic sentence could be expressed as Equation (1):
The   option   =   using   terms   to   describe   feature 1   +   using   terms   to   describe   feature 2   +   ,
For example, the “Ticket purchase and top-up service” can be described as “the operation is simple, and the number of machines is sufficient”. In this manner, “operational simplicity” and “the number of machines” work as features 1 and 2, respectively. Correspondingly, “simple” and “sufficient” are the terms of features 1 and 2, respectively.
Furthermore, features remain the same in every level’s option of an attribute, while terms are different. This is because terms define various service levels of features. For example, the “Ticket purchase and top-up service” can also be described as “the operation is inconvenient, and the number of machines is insufficient”. In this manner, features are still “operational simplicity” and “the number of machines”, while the terms have changed to “inconvenient” and “insufficient”. Therefore, we need fixed features but multiple terms to form a semantic scale of an attribute.
In summary, the establishment of options consists of four steps (Figure 2). The first and second steps are to identify the features and terms of all attributes, respectively. In the third step, we combine features and their terms to formulate options. Finally, scale levels and scores are assigned to the options.

3.2. Key Steps

3.2.1. First Step: Identifying Features of Attribute

The first step is to identify the features of all attributes. Attributes are extracted from previous studies based on the findings of attributes’ importance [8,21]. For each attribute, features can be obtained through a focus group. The focus group should include 8–10 people [22] (p. 41). During the focus group, a researcher asks riders what affects their perceived quality with attributes, and riders are allowed to discuss. Reasons that affect the rider’s perceived quality with attributes are recorded, and they serve as the features of attributes.

3.2.2. Second Step: Identifying Terms of Features

While riders answer the reasons that affect their perceived quality with attributes, some words that riders use to describe a feature would be detected. Those words can be adjectives that define the service condition or riders’ experiences, and they are selected as the terms of that feature.
Brace [11] (p. 51) suggested that spontaneity is more critical than prompt, and great care should be taken not to prompt. To capture the most spontaneous reaction from riders, the number of terms for each attribute is not fixed. Otherwise, it may prompt riders, and the proposed terms are not entirely consistent with their original perceptions of the features.
Then, the terms are coded to distinguish the service level of features. It also prepares for translating the options to scale levels and scores in the fourth step. Please note that the codes are only numerical labels of the scale levels of a feature, which are only ordinal variables instead of interval variables [22] (p. 105). To make the codes more common, we assumed a larger number indicates a higher service level, and set the codes to “equally spaced” numbers from 0 to 1 (Equation (2)). For instance, a two-level term is coded 1and 0, and a three-level term is coded 1, 0.5, and 0.
The   code   of   i - level   terms   =   { 0 , 0 + 1 i 1 , , 0 + ( i 2 ) 1 i 1 , 1 } ,   i N

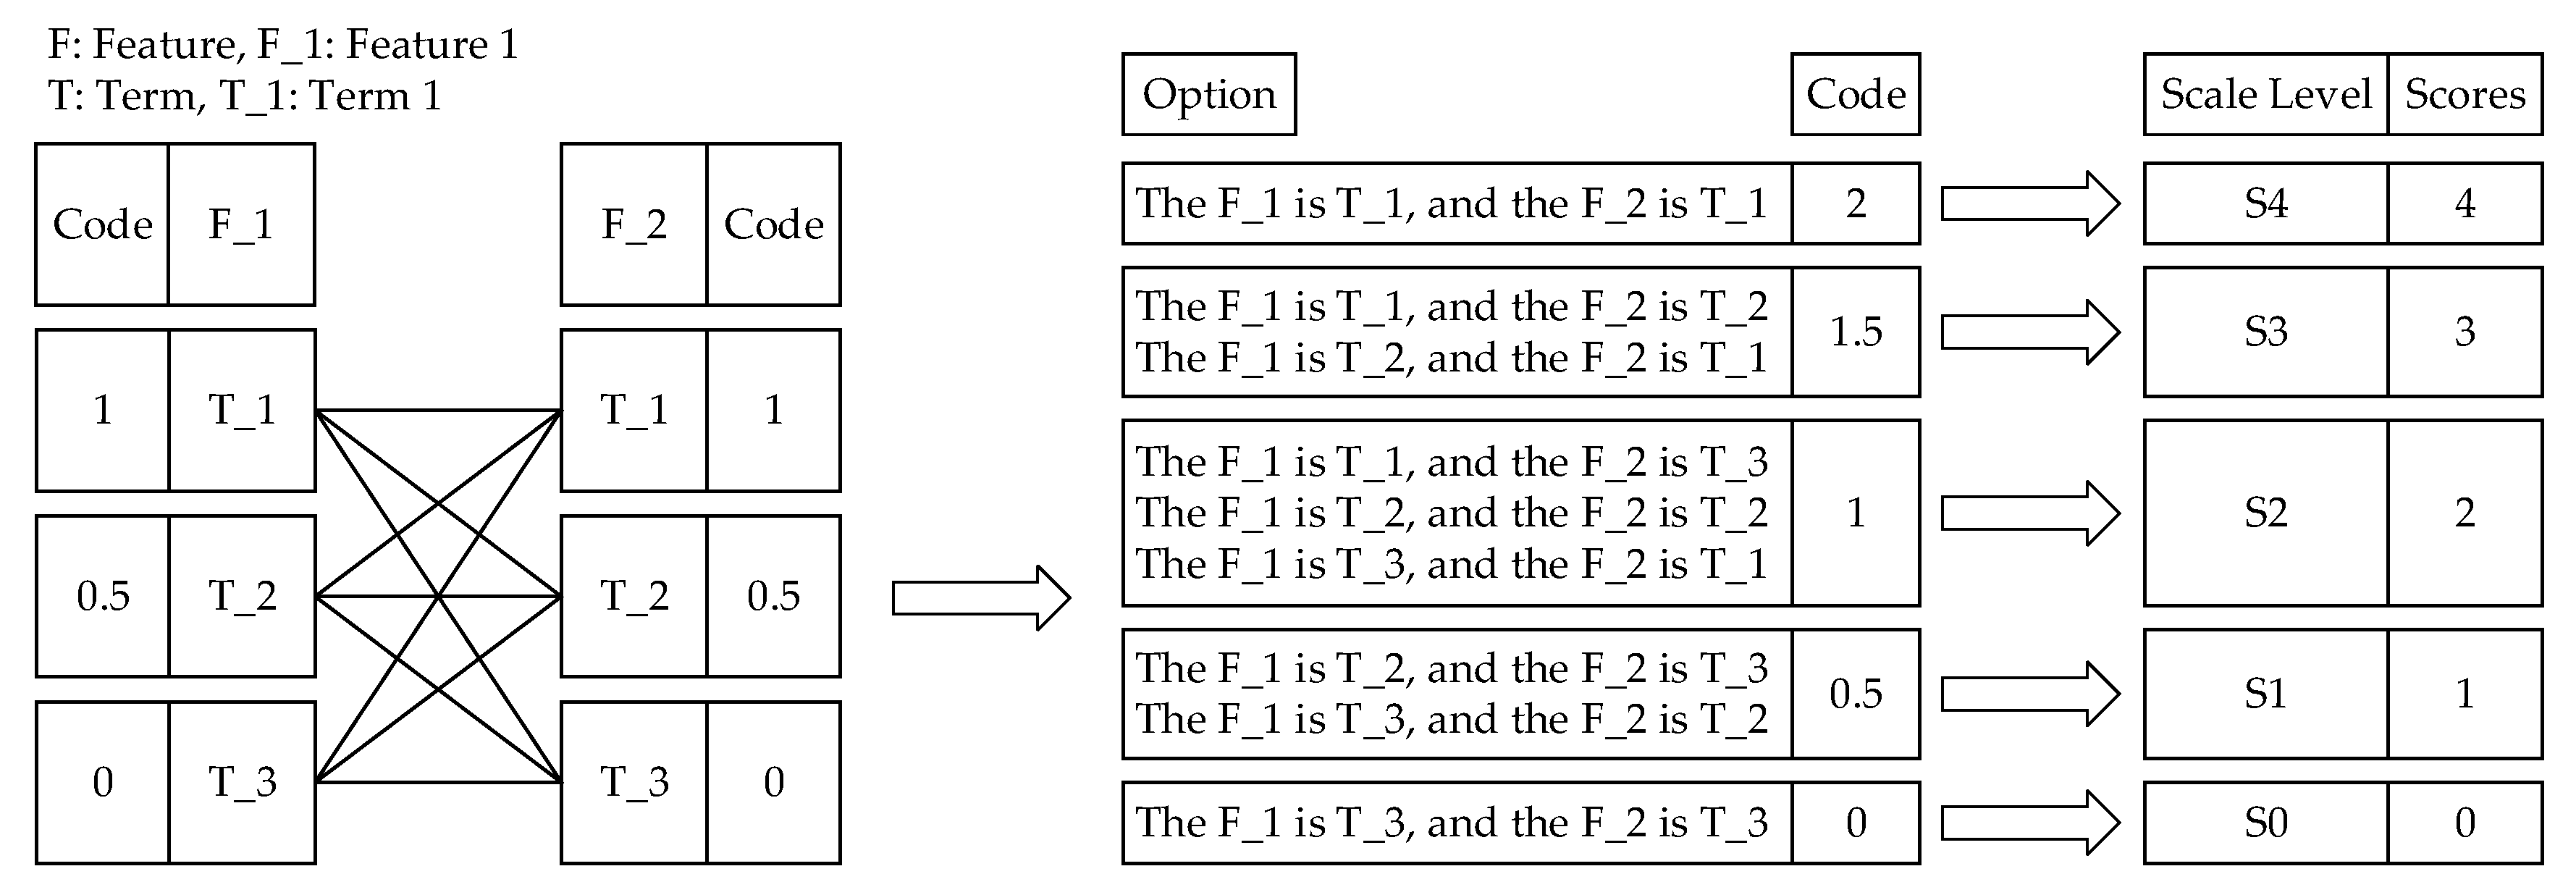
3.2.3. Third Step: Combing Features and Their Terms to Form Options

In the third step, we combine features and their terms to form options (Figure 2 is an example). Each level’s option is structured based on Equation (1). Since different attributes evaluate different service contents, the number of reasons (i.e., features) that affect the rider’s perception about attributes might differ. Meanwhile, as different features describe different aspects of its attribute, the number of terms that riders proposed to distinguish their perception of features may vary. Thus, there are maybe several kinds of combinations of features and their terms.
To define each kind of combination, we denoted the number of features as the number of digits, the number of terms as the value per digit, and * as the digits’ connection. For example, when an attribute has two features, and each feature has three terms, its combination can be denoted as 3 * 3 (Figure 3).
If the number of options is less than the scale’s required points, additional options can be added through a Delphi method or a focus group. The added options’ orders, which might vary among attributes, are also determined in this process based on the service level.

3.2.4. Fourth Step: Assigning Scale Levels and Scores to Options

Before the assignation, we need to define the option code. In this paper, we assume features of the same attribute have equal weights. Thus, one possible way to define the option code is the sum of the terms’ codes in this option (Equation (3)):
The   code   of   the   option   =   the   code   of   the   term   of   feature 1   +   the   code   of   the   term   of   feature 2   + ,
As the size of terms’ code can distinguish the service level of features, naturally, the size of the option code represents the service level of the option; the larger the option code is, the higher the service level of the option is. The scale levels and scores are then assigned to the options according to the size of the option codes. The option with the largest option code is assigned to the highest scale level and score; the option with the smallest option code is assigned to the lowest scale level and score; options that have the same size of the option code are assigned to the same scale level and scores.
Please note that the mathematical meaning of option codes and term codes are the same; they are ordinal variables instead of interval variables. Both of them only numeric labels that represent the service levels.
Figure 3 demonstrates relationships among option codes, scale levels, and scores of a 3 * 3 combination. As the number of option code types is five, this combination corresponds to a five-point scale. The first option is “The feature 1 is term 1, and feature 2 is term 1”. Both the codes of two “term 1” are 1. According to Equation (3), the code of this option is 2. This option code is the largest among all options, so it is then assigned to the largest scale level (i.e., S4) and scores (i.e., 4).

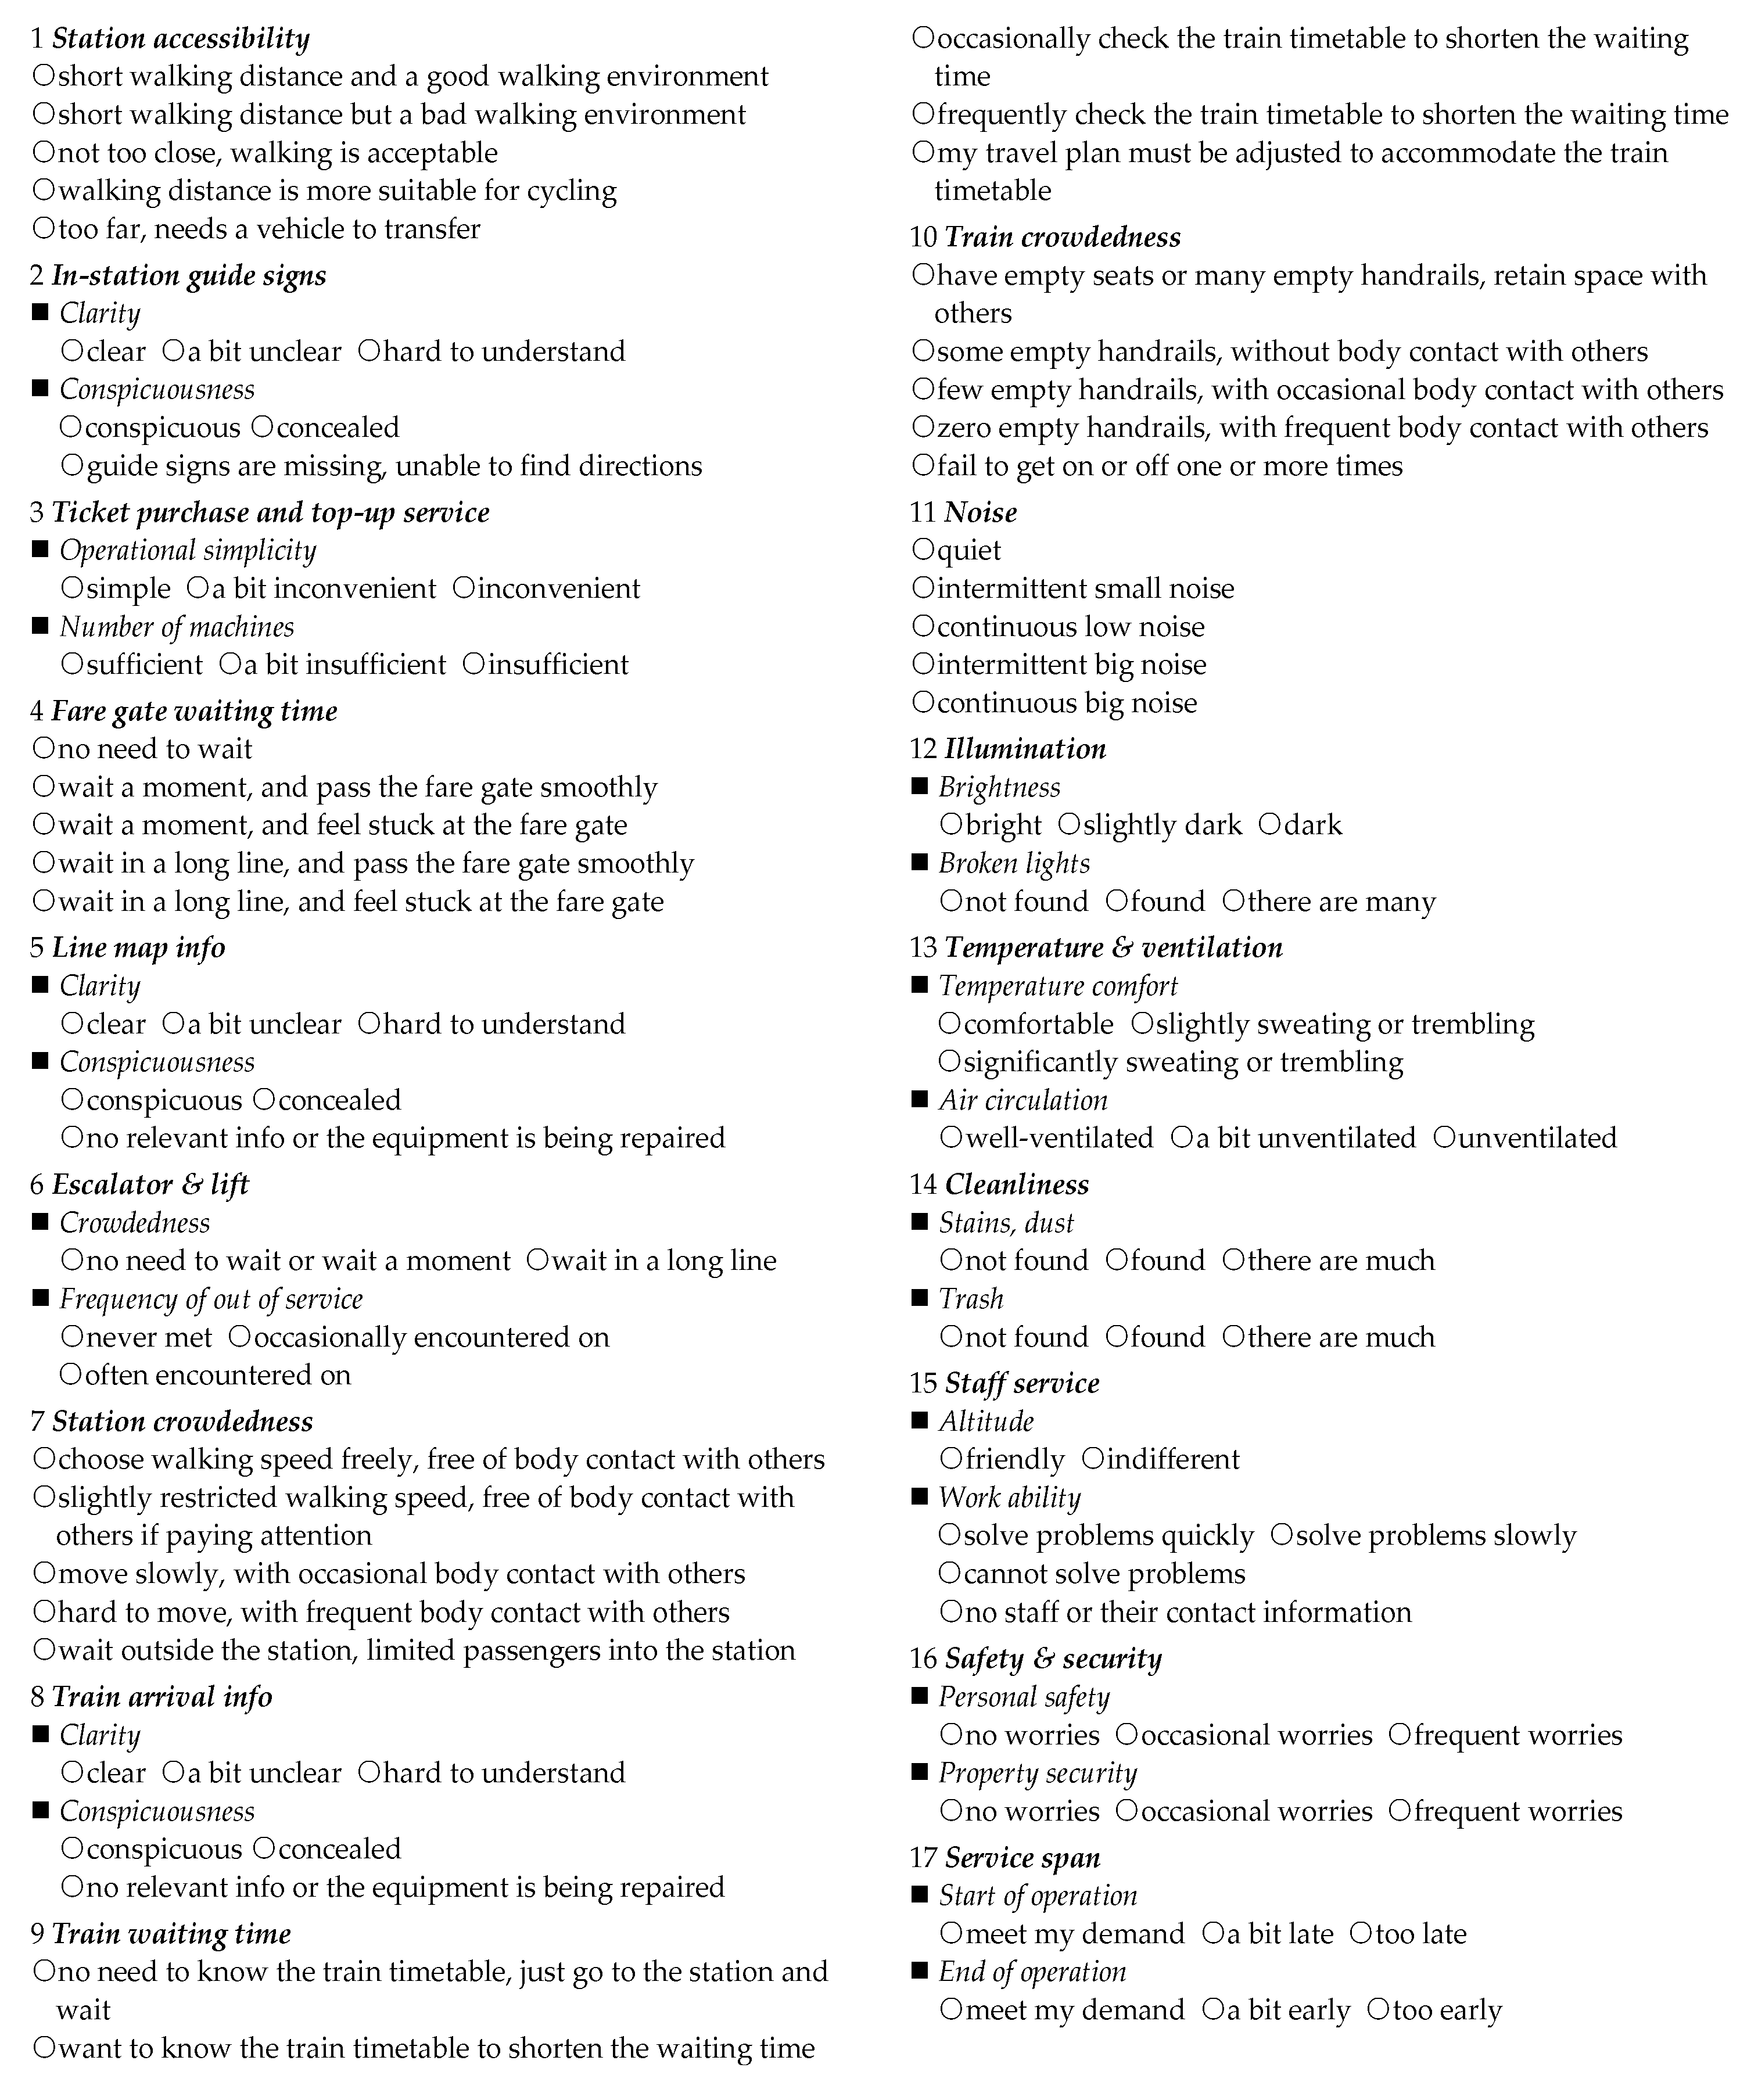
4. Application of Semantic Scale Design in Urban Rail Transit Service

4.1. First Step: Identifying Features of Attributes

The semantic scale was set to five points as the five-point scales are the most used in current transit passenger perceived quality surveys [6]. In total, 17 Attributes were extracted from the previous studies [23,24,25,26,27,28,29] based on the findings of attributes’ importance. Table 2 shows the selected attributes, which are arranged based on the process of a ride.
The features of attributes were obtained through a focus group. The focus group comprised of two researchers and eight riders [22] (p. 41). Table A1 (in Appendix A) shows the socio-economic and travel behavior information of all participants of the focus group. Two researchers served as the host and recorder, respectively. The host asked riders what affected their perceived quality with attributes, and riders were allowed to discuss. For instance, most riders believe the “clarity” and “conspicuousness” were the reasons affecting their perceived quality with “In-station guide signs”. Hence, the “clarity” and “conspicuousness” were used as the features of this attribute. Since the level of service of attributes from the TCRP Report 165 [1] has already stated the features of “Station crowdedness” (Chapter 10, p. 14), “Train waiting time” (Chapter 5, p. 4), and “Train crowdedness” (Chapter 5, p. 24), we directly utilized them instead of obtaining from the focus group.

4.2. Second Step: Identifying Terms of Features

While riders were answering, terms that defined the service condition or rider’s experience of features were collected. For example, when riders were talking about their perceptions of “clarity” of “In-station guide signs”, some of them directly used the adjectives “clear” or “a bit unclear” to describe their perception. Meanwhile, others used their specific experiences that the In-station guide signs are hard to understand to show their opinions. Thus, “clear”, “a bit unclear”, and “hard to understand” became the terms used to describe the feature “clarity”. According to Equation (2), “clear”, “a bit unclear” and “hard to understand” were coded 1, 0.5, and 0, respectively.
However, riders only used “conspicuous” or “concealed” to talk about their perception of “conspicuousness” of “In-station guide signs”. Interestingly, no rider proposed a middle term, such as “a bit conspicuous”. Perhaps it is because the service conditions that riders experienced were extreme, or it is natural for them to use such a two-level term to describe their perception of this feature. Thus, “conspicuous” and “concealed” served as the terms of the feature “conspicuousness”. According to Equation (2), “conspicuous” and “concealed” were coded 1 and 0, respectively.
Particularly, for the service of “In-station guide signs, Train arrival info, and Staff service”, the focus group also mentioned the experience where the corresponding service was missing. Thus, the case “no relevant info or the equipment is being repaired” was added to “Line map info” and “Train arrival info”, serving as the lowest service-level term (i.e., coded 0); the case “no staff or their contact information” was added to “Staff service”, serving as the lowest service-level term (i.e., coded 0).
Table 2 summarizes the features of all attributes, the terms used to describe the features, and the codes of the terms. The features obtained through the focus group are mostly consistent with the service requirements of the attributes stated in [1] (Chapter 4, pp. 17–36; Chapter 10, pp. 10–29).

4.3. Third Step: Combing Features and Their Terms to Form Options

We combined the features and terms to form options. Based on Table 2, all combinations can be denoted as 2 * 2, 2 * 3, 3 * 3, and 5 * 5. For the combination of 2 * 2, the number of options is less than five. According to the existing options, the focus group was asked to discuss again to propose more options. The most suitable option was then selected through scoring. Based on the service level, the added option’s order was identified by the focus group. The added options and their orders are as follows. The option “not too close, walking is acceptable” for “Station accessibility” was added. It was placed between the options “short walking distance but a bad walking environment” and “walking distance is more suitable for cycling”. The option “quiet” for “Noise” was added. It was placed before the option “intermittent small noise”. The option “no need to wait” for “Fare gate waiting time” was added. It was placed before the option “wait a moment, and pass the fare gate smoothly”. The note row of Table 2 also presents the relevant explanations.
The combination of attributes “Station crowdedness, Waiting time, and Train crowdedness” are 5 * 5. In each attribute, the service conditions of different features affect each other, causing the service levels of all features to change in the same direction. Hence, the number of features can be regarded as one. After the combination of features and their terms, the number of options equals five, which is known as the combination of 5.

4.4. Fourth Step: Assigning Scale Levels and Scores to Options

The scale levels are denoted as S4, S3, S2, S1, and S0, and their corresponding scores are four, three, two, one, and zero, respectively. The scores range from zero to four points based on [22] (p. 111) as they supposed it assured the effectiveness of the modeling analysis. Based on the option codes, the options were assigned to the corresponding scale levels and scores. In the questionnaire, the terms of attributes are displayed. Figure 4 illustrates the semantic scale designed in this paper.

4.5. The Validity and Reliability

We conducted a pilot survey to measure the content validity and reliability of the semantic scale. The content validity and reliability were calculated by two widely used indexes, the Lawshe’s content validity ratio (CVR) [30] and Cronbach’s α [31], respectively.
The pilot survey incorporates two parts. First, it was conducted on a content evaluation panel. Based on [32], a panel of 5–10 experts is suitable. Thus, the panel size was set to 8. The panelists incorporate four professors who major in the quality of urban rail transit service and four urban rail transit managers. The data were used to calculate the Lawshe’s CVR of every feature in our semantic scale. Equation (4) shows the equation of Lawshe’s CVR [33].
C V R = n e N 2 N 2
where n e is the number of panelists identifying the feature as “essential”, and N is the total number of panelists. When all panelists think the feature is “essential”, the Lawshe’s CVR adjusts to 0.99.
The second part of the pilot survey was conducted to riders to measure the reliability of the semantic scale. The riders were passengers of Metro Line 1 from Guangzhou, China. According to [8], the sample size was set to 36. The data were utilized to calculate Cronbach’s α.
Table 3 shows the results. The Lawshe’s CVR of every feature ranges from 0.75 to 0.99, which meets the threshold 0.75 calculated by [34]. Furthermore, Cronbach’s α is 0.84. Devon et al. [31] stated Cronbach’s α > 0.7 indicates an acceptable internal consistency among attributes for new scales. Therefore, the validity and reliability of the semantic scale are well supported.

5. Empirical Study

We launched an empirical study to test the difference in evaluation results among the semantic, Likert, and numeric scales. The comparison results help us understand the potential characteristics of the semantic scale and assist transit managers to understand the impact of the scale form on the evaluation result. Since transit managers usually refer to the relative frequency distribution, mean, and variance of attribute scores to understand the current passenger perceived service quality of the transit and the heterogeneity of passenger perceived service quality, the difference was analyzed from those three aspects. Moreover, hypothesis tests were conducted to explore whether the differences are accidental or statistically significant. The data collection, data processing, results, and discussion of the empirical study are illustrated from Section 5.1, Section 5.2 and Section 5.3, respectively.

5.1. Data Collection

The empirical study was conducted using an online survey panel (www.wjx.cn) [35], and Metro Line 1 from Guangzhou, China, was the evaluation object. Riders needed to complete three copies of questionnaires whose attributes are the same, but the scales of attributes are different, which are Likert, numeric, and semantic scales. The Likert scale was set to very satisfied, satisfied, normal, dissatisfied, and very dissatisfied, and they were assigned to four, three, two, one, and zero points, respectively. Meanwhile, the numeric scale was set to four, three, two, one, and zero points. Asking one rider to answer these three copies of questionnaires ensures the differences in evaluation results are not caused by the differences in rider perceptions.
For the answer sequence of questionnaires, the linguistic scale-type questionnaires appeared last because the first-appeared linguistic options may cause a priming effect that affects riders to answer the rest of the questionnaires [11] (p. 135). Therefore, the numeric scale-type questionnaire appeared first, followed by the Likert scale-type questionnaire, and lastly, the semantic scale-type questionnaire. After completing three questionnaires in turn, in the end, riders filled in information about their socio-economic and travel habits. Brace [11] (p. 53) believed questions about rider socio-economics and travel habits might violate riders’ privacy. If they are placed at the beginning of the survey, it may irritate riders, which can reduce the data quality or cause riders to withdraw halfway through.
Equation (5) proposed by Cochran [36] was utilized to compute the sample size of riders. Yannis and Georgia [37], Hassan et al. [38], Echaniz et al. [39], and Dell’Olio et al. [40] also used Equation (5) to compute the sample size of transit passenger perceived quality surveys.
n p ( 1 p ) ( e z α / 2 ) 2 + p ( 1 p ) N
where p is generally set to 0.5 where n can maximize; N is the population size; α is the significance level; e is the margin of error; and z α / 2 is a normal distribution quantile at the α significance level.
The passenger flow of the Guangzhou Metro Line 1 is about 1.1 million riders per day, hence, N = 1.1 × 10 7 . Furthermore, the significance level α and was set to 0.05, and the margin of error e was set to 5%, which is consistent with [37,38,39]. Finally, the calculation result is n 384 .

5.2. Data Processing

The data processing incorporates five steps.
  • In the first step, we excluded the invalid questionnaires.
Researchers compared the IP addresses of the received questionnaires. For the questionnaires with a repeated IP address, we only kept the first copy and marked the rest as invalid. Having repeated IP address questionnaires was probably because a rider submitted the questionnaire repeatedly. Furthermore, riders could only submit the questionnaires after answering all questions, thanks to the automatic missed question detected function provided by the online survey platform. Therefore, the received questionnaires have no missed questions. Ultimately, we obtained 408 valid questionnaires. The Cronbach’s α of the semantic scale is 0.84. According to [41], Cronbach’s α > 0.7 means a good internal consistency and reliability. Table A1 shows the information on the respondent socio-economics and travel habits and the evaluated operation periods. Respondent socio-economics and travel habits have a wide coverage with normal proportions, and the evaluated operation periods cover the peak and non-peak hours of weekdays and weekends, which enhances the representativeness of the sample.
  • In the second step, we converted the evaluation result of the semantic scale into scores.
Based on the codes of the terms in Table 2, researchers used Equation (3) to change the evaluation results into option codes (Figure 3 is an example). Then, they transferred option codes to scores based on Section 3.2.4.
  • In the third step, we compared the score’s relative frequency distributions in the three scales of each attribute and then conducted hypothesis tests.
As the same rider completed all three questionnaires, paired samples were collected. The scale level is over 2, indicating that the Bowker test is suitable. Take the comparison between Likert and semantic scales as an example. The null hypothesis is denoted as H 0 and means the score’s relative frequency distributions of this attribute between Likert and semantic scales have no difference. Whereas the alternative hypothesis is denoted as H 1 and means the score’s relative frequency distributions of this attribute between Likert and semantic scales are different. The null hypothesis and alternative hypothesis of other comparisons can be obtained similarly. The p-value, denoted as P L S and P S N , indicates the results of the Bowker test and their subscript letters are the initialisms of the two compared scales. Table 4 illustrates the results.
  • In the fourth step, we compared the means in the three scales of each attribute and then conducted hypothesis tests.
If the difference of the paired-sample data follows a normal distribution at a 95% confidence level, the paired-sample t-test is suitable; otherwise, we chose the paired-sample Wilcoxon signed-rank test. The Anderson–Darling test and Shapiro–Wilk test were selected as the normality test method for the difference of paired-sample data because the hypothesis’ normal distribution was unknown, and the sample size of the data did not exceed 2000. Under this condition, these two test results are more reliable than other feasible tests [42,43]. Take the comparison between Likert and semantic scales as an example. The H0 indicates the means of this attribute between Likert and semantic scales have no difference, whereas H 1 indicates the means of this attribute between Likert and semantic scales are different. H 0 and H 1 of other comparisons can be obtained similarly. The hypothesis test results are expressed in the same way as in step three. Figure 5 and Table 5 present the results.
  • In the fifth step, we compared the variances in the three scales of each attribute and then conducted hypothesis tests.
If each set of paired-sample data follows a normal distribution at a 95% confidence level, the paired-sample F-test is suitable; otherwise, we chose the paired-sample Levene’s test. The normality test method is the same as in step four. Take the comparison between Likert and semantic scales as an example. The H 0 means the variances of this attribute between Likert and semantic scales have no difference, whereas H 1 means the variances of this attribute between Likert and semantic scales are different. H 0 and H 1 of other comparisons can be obtained similarly. The hypothesis test results are expressed in the same way as in step three. Figure 6 and Table 6 show the results.

5.3. Results and Discussion

5.3.1. Comparisons of the Score’s Relative Frequency Distributions

Table 4 reflects the differences in the distribution of riders’ perceived quality caused by the scale form. Most Bowker test results are significant at a significance level of 1% or even 1‰. It indicates the score’s relative frequency distributions of most attributes significantly differ in the three scales, and these differences are less likely to be accidental phenomena.
Such phenomena occurred may be due to the range and content of scale levels. Firstly, neither the Likert scale nor the semantic scale is an interval scale [22] (p. 103), i.e., the distance between two adjacent levels of the scale varies. In contrast, the numeric scale is an interval scale [22] (p. 103). Secondly, both Likert and numeric scales apply abstract categorizations of scale levels. However, the semantic scale distinguishes scale levels more clearly by defining the service conditions and the rider’s experience at each scale level.
Interestingly, the differences have the following rule.
  • On the semantic scale, the four-point frequency of some attributes is around the sum of the three- and four-point frequencies on the other two scales.
For instance, the four-point frequency of “In-station guide signs” is 87.25%, and its corresponding semantic option is “clear and conspicuous”, i.e., 87.25% of the respondents believed the guide signs in the stations were clear and conspicuous (Table 2). 87.25% is close to the sum of the frequencies of very satisfied (42.65%) and satisfied (49.51%) levels of the Likert scale, or the sum of the frequencies of four points (57.60%) and three points (37.01%) of the numeric scale. It indicates about half of the respondents regarded the service of “clear and conspicuous guide signs” provided by this transit agency as satisfying or three points; in contrast, the rest thought it was very satisfying or four points.
This phenomenon not only reflects the rider heterogeneity of perceived quality but also may be related to hesitation in answering. Respondents needed to translate their attitudes in conceptual terms to options when using Likert or numeric scales (Section 1). However, they might not have had a specific or determined attitude towards the service performance of that attribute and felt the adjacent levels of Likert or numeric scales (e.g., very satisfied and satisfied, four and three points) were similar to their attitudes in conceptual terms, making them hesitant to map their attitudes onto a scale option. Thus, they might have been reluctant or lacked sufficient time to ponder the difference between the adjacent levels in these two scales before answering, especially in a hurry, which adhered to the satisficing behavior of questionnaires proposed by Krosnick [44].
However, “clear and conspicuous” should have reached the service goal set by transit managers for “In-station guide signs”, which is also reasonable. The evaluation results of Likert and numeric scales may underrate the performance of this attribute, which is unfair to the transit agency. If the semantic scale is used, transit managers will understand passenger perceived quality more visually by reading the semantic options. In this example, transit managers can think highly of the performance of “In-station guide signs”, and thus allocate resources to improve the service quality of other attributes.
Attributes with a similar phenomenon include “Line map info, Train arrival info, Illumination, Temperature and ventilation, Cleanliness, Staff service, Safety and security, and Service span” (Table 4). The service conditions of these attributes may commonly not change with operation periods (e.g., peak or non-peak periods).

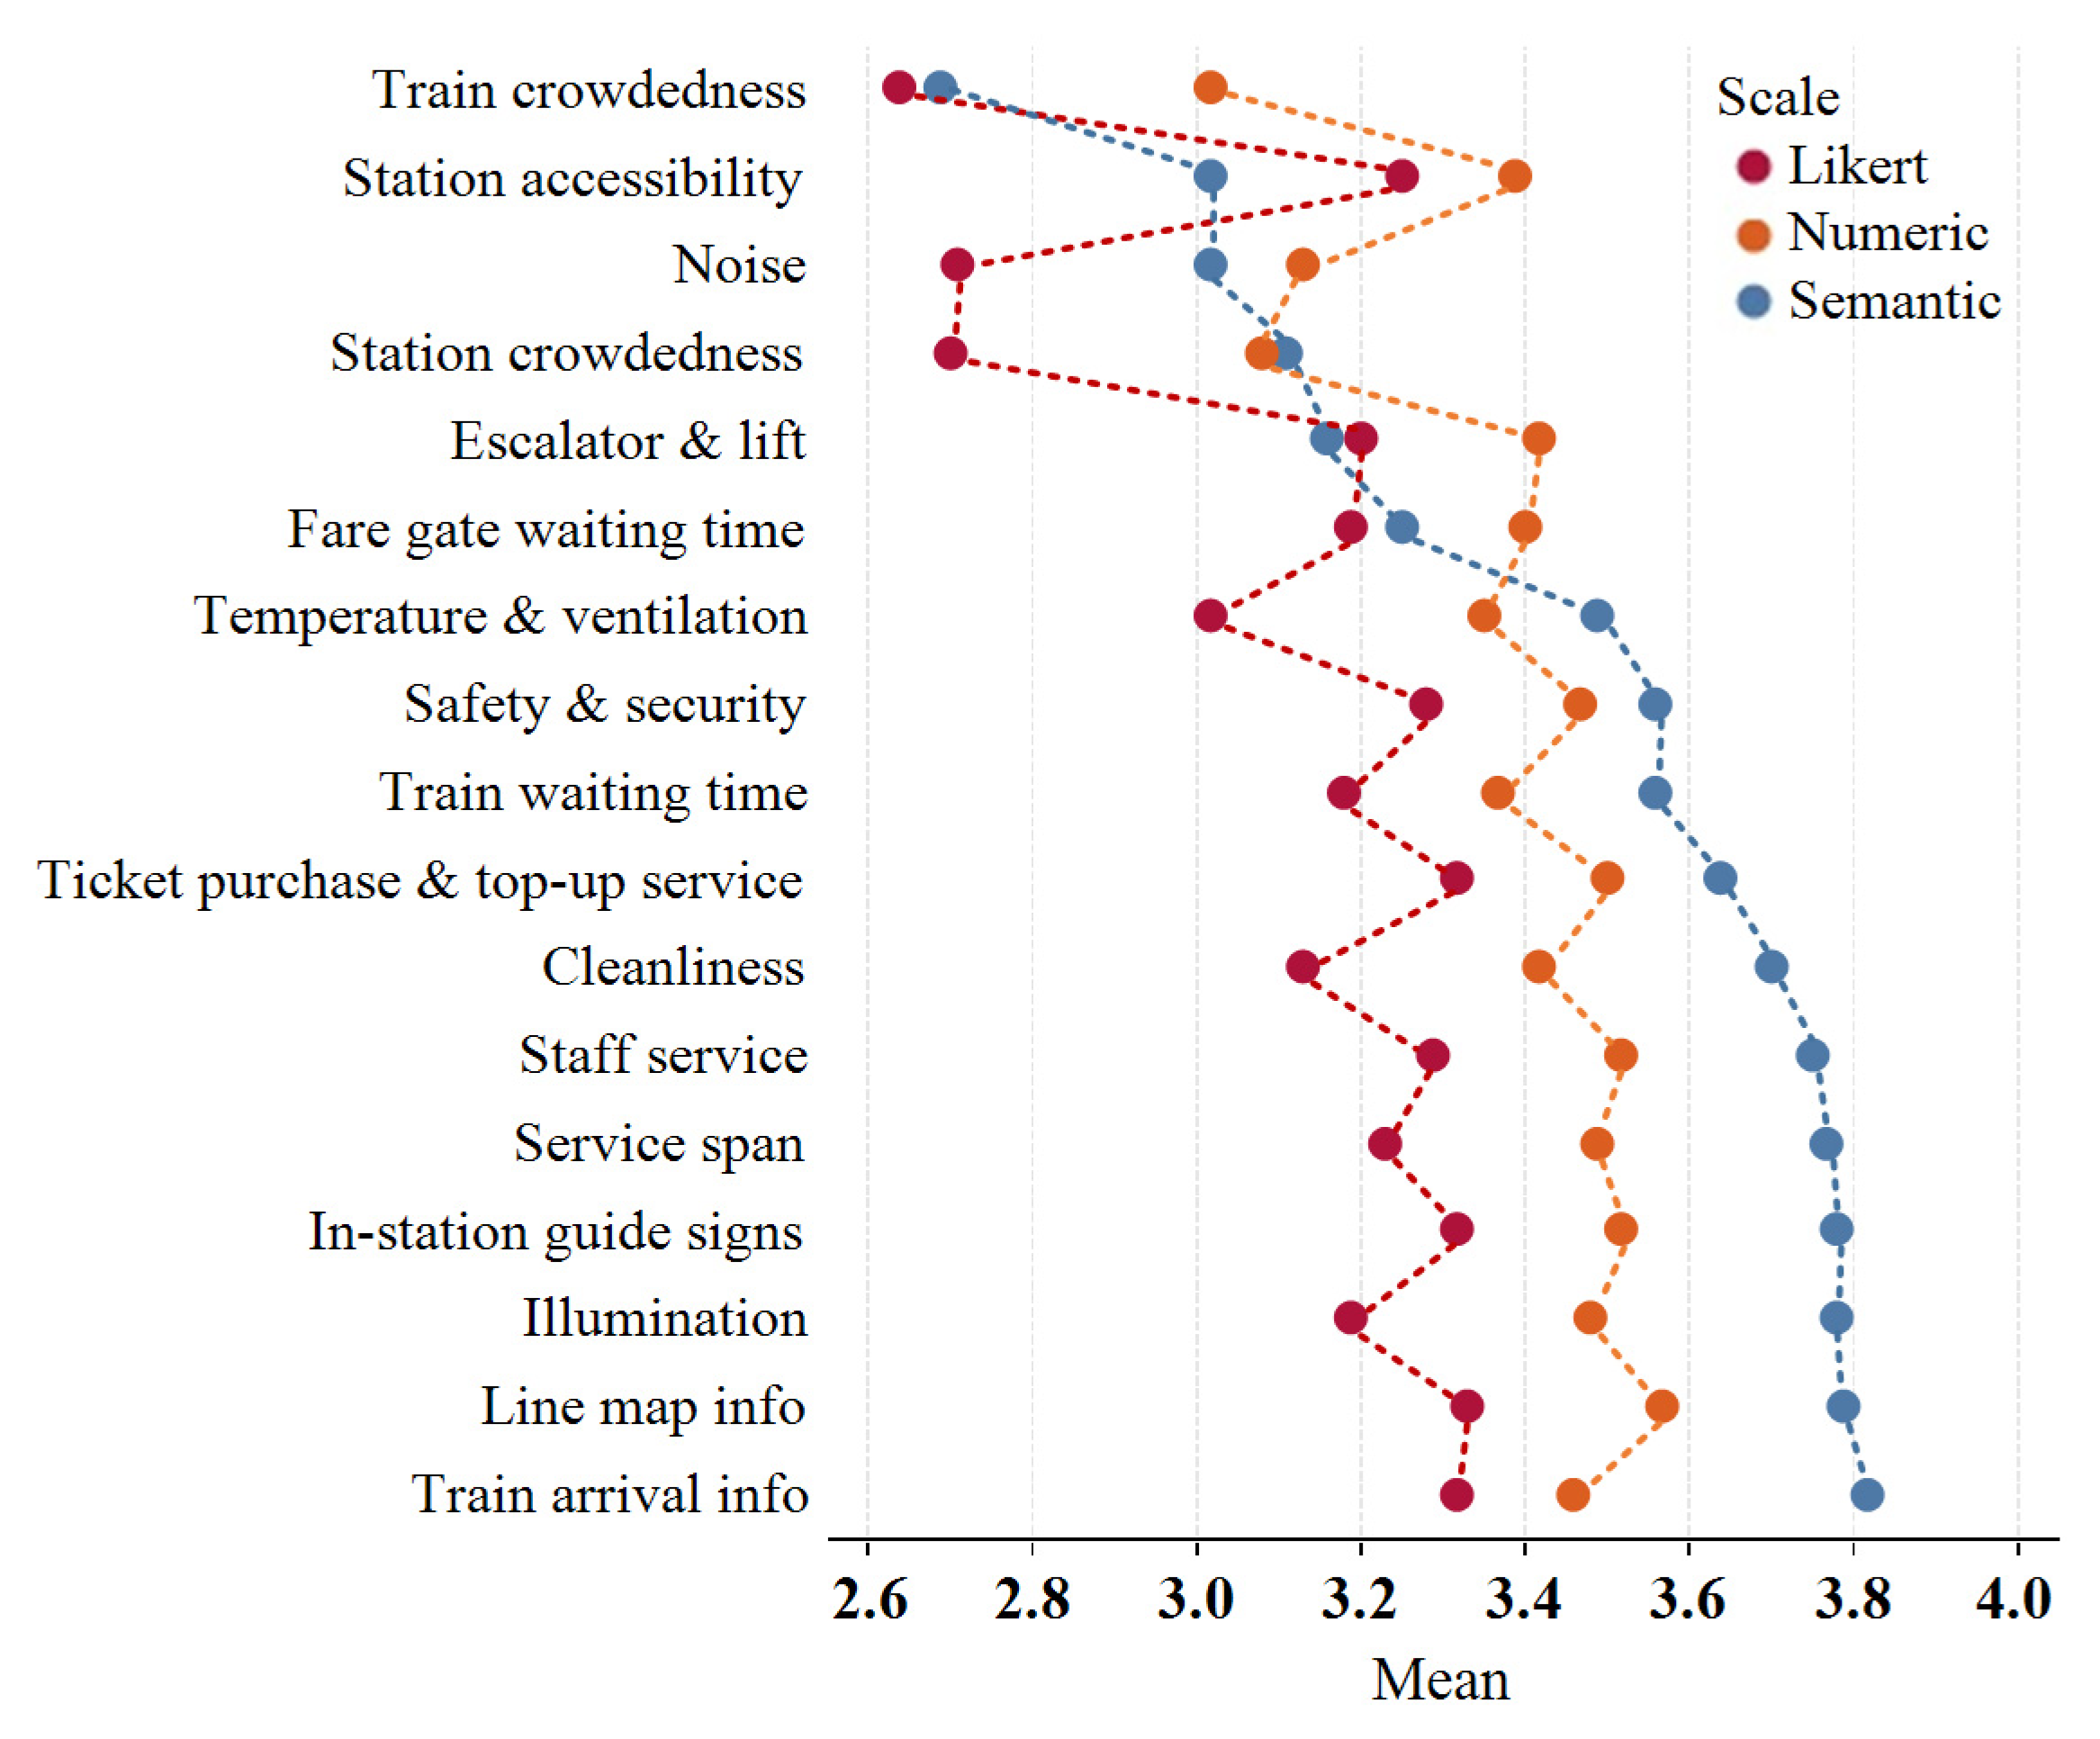
5.3.2. Mean Comparison

Figure 5 and Table 5 reflect the differences in the average of riders’ perceived quality caused by the scale form. In Figure 5, the ordinate represents attributes, which are arranged in ascending order according to the mean on the semantic scale; the abscissa represents mean value, and the red, orange, and blue dots represent the value from Likert, numeric, and semantic scales, respectively. Table 5 uses p-value to shows the hypothesis test results of the corresponding phenomena. For instance, PLS and PSN of “Train crowdedness” denote the results of its mean equivalence tests in Likert and semantic scales, semantic and numeric scales, and numeric and Likert scales, respectively.
Figure 5 indicates the following rule:
The central tendency bias of most attributes is alleviated on the semantic scale.
On the Likert scale, the mean of most attributes is the closest to the median of a five-point scale (i.e., two points). This phenomenon agrees with the discovery of [13,17,45] who observed the central tendency bias in the Likert scale. However, this phenomenon does not show up on the semantic scale of most attributes (14 out of 17). The reason can be that the Likert scale indicates abstract categories of satisfaction levels, while semantic options are less abstract—they provide more visualized service conditions of attributes. It enables riders to directly select the option that most closely matches their journey experiences.
However, the central tendency bias may not be effectively reduced on “Train crowdedness, Escalator and lift, and Station accessibility”. Table 5 shows the means of “Train crowdedness” and “Escalator and lift” on the semantic scale are not statistically different from the means on the Likert scale (PLS = 0.43 and 0.38, respectively). Figure 5 displays the mean of “Station accessibility” on the semantic scale (blue dot) is closer to the median than is means on the Likert scale (red dot). There may be two reasons. Firstly, the middle options (i.e., S2) of these attributes on the semantic scale match some respondents’ perceptions (Table 4). Secondly, the middle options describe a better service condition or rider’s experience than “normal” implies.
Finally, this rule is less likely to be an accidental phenomenon, as Table 5 demonstrates the means of most attributes significantly differ in the three scales (p < 0.05). Thus, we have statistical evidence to believe the semantic scale can usually reduce central tendency bias.

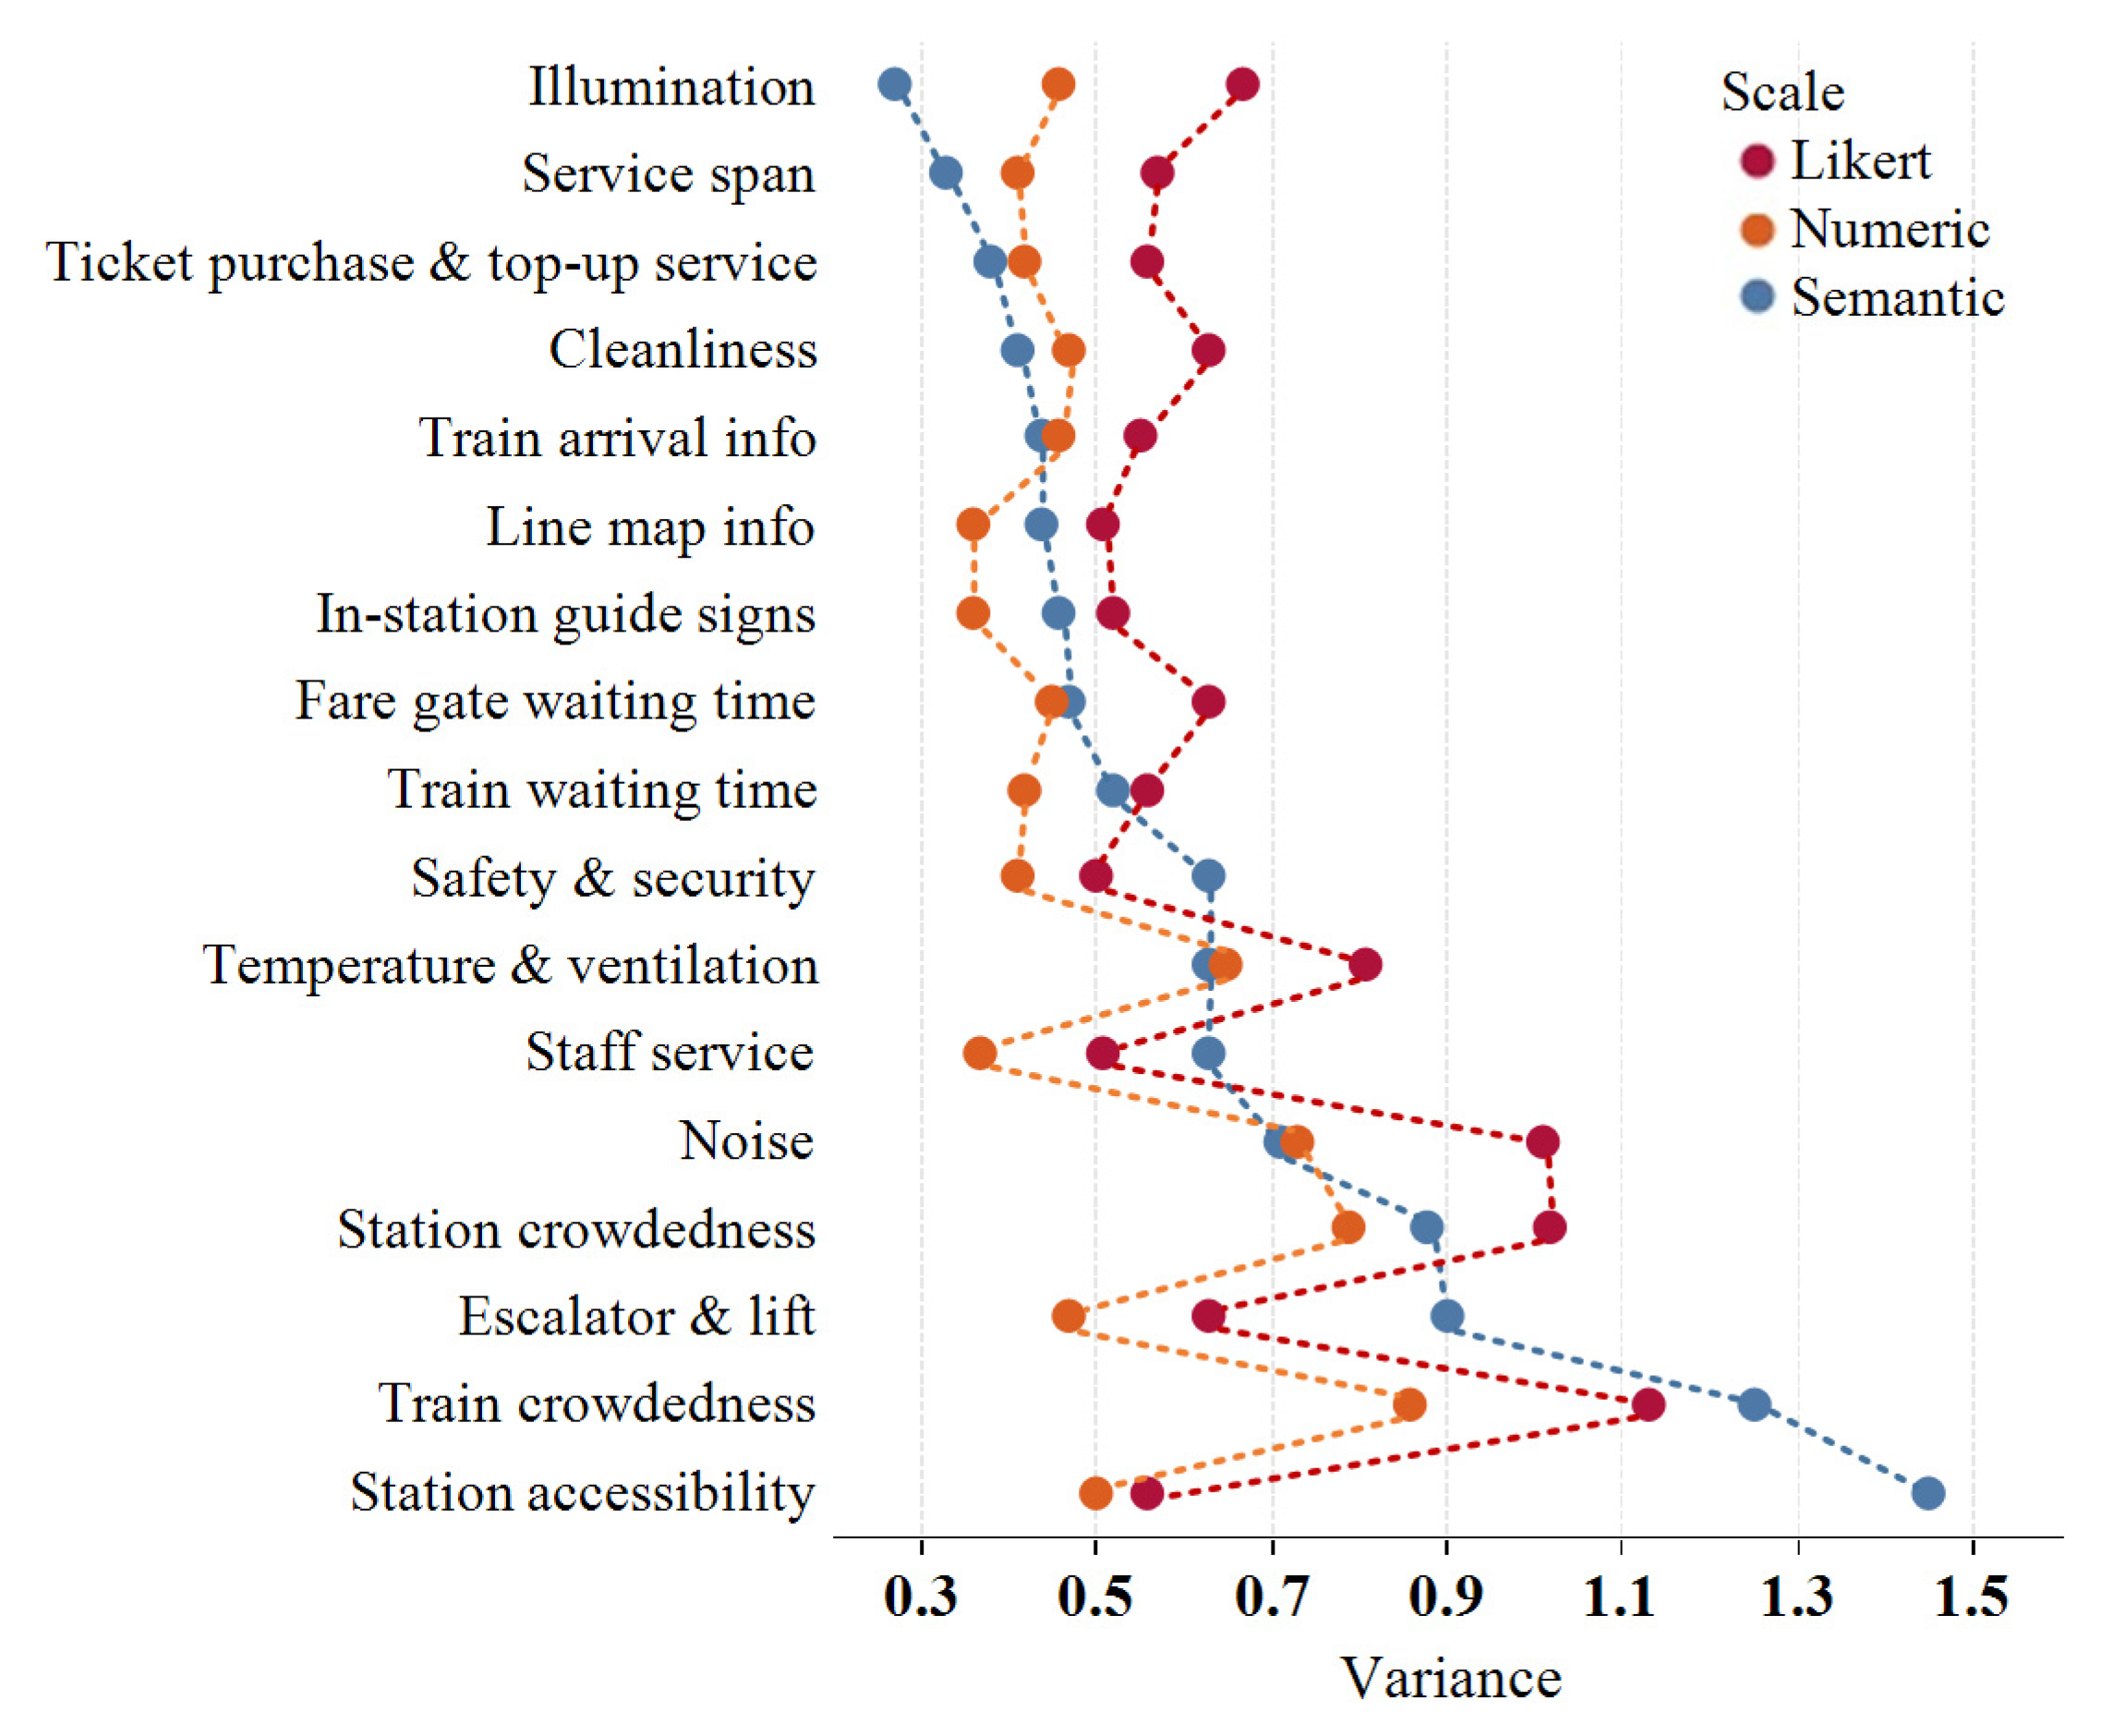
5.3.3. Variance Comparison

Figure 6 and Table 6 reflect the differences in the dispersion of riders’ perceived quality caused by the scale form. In Figure 6, the ordinate represents attributes, which are arranged in ascending order according to the variance on the semantic scale; the abscissa represents variance value, and the red, orange, and blue dots represent the values from Likert, numeric, and semantic scales, respectively. Table 6 uses p-value to show the hypothesis test results of the corresponding phenomena. For instance, PLS and PSN of “Illumination” denote the results of its variance equality tests in Likert and semantic scales, semantic and numeric scales, and numeric and Likert scales, respectively.
Figure 6 and Table 6 indicate the following rule:
On the semantic scale, the variances are or are close to the highest or lowest among the three scales.
Most test results are significant at a significance level of 5% or even 1‰ (the first two columns of Table 6). It indicates that the variances of most attributes significantly differ between the semantic scale and the other two scales; these differences are less likely to be accidental phenomena. Thus, we have statistical evidence that the semantic scale form can affect attribute variances, causing this rule.
This phenomenon may be because semantic scale options leave riders with less room for imagination than Likert and numeric scales do. While using numeric or Likert scales, riders needed to assess their attitudes in conceptual terms (e.g., a searched memory that the in-station guide sign is clear) and then found a number or a Likert term that most closely matches their attitudes. Due to the heterogeneity, riders may choose different options for the same service condition, and Section 5.3.1 manifests related examples; alternatively, they could choose the same option for different service conditions. In contrast, the semantic scale already presents service conditions or rider’s experience in the options. Riders did not need to translate their attitudes in conceptual terms to options; they could directly select the option that most closely matches their searched experience.
Therefore, if an attribute has homogeneous service conditions over periods, the semantic scale helps riders have a higher possibility to select the same option, so the evaluation results on the semantic scale are more homogeneous (i.e., smaller variance). “Service span” is an example because it has a small difference among various stations in the same line. Correspondingly, its variance on the semantic scale is the smallest among the three scales. In contrast, if an attribute has heterogeneous service conditions over periods or individuals, the semantic scale helps riders have a higher possibility to select different options. Thus, the evaluation results on the semantic scale are more heterogeneous (i.e., larger variance). “Station accessibility” and “Train crowdedness” serve as examples. The experiences of “Station accessibility” may differ in individuals due to their various origins; “Train crowdedness” may differ between peak and non-peak hours. Correspondingly, their variances on the semantic scale are the biggest among the three scales.
This phenomenon implies that if the evaluated operation period is singular (e.g., only peak hours), the evaluation results of attributes with heterogeneous service conditions will be more likely to be incomprehensive, and their variances may decline. Thus, having data from extensive operation periods would contribute to obtaining a more comprehensive evaluation result.

6. Conclusions

This research proposes a semantic scale for passenger perceived quality surveys of urban rail transit. The contents of the semantic scale were obtained through a focus group and TCRP 165 [1]. Then, we combined the content to form the options. A pilot survey was conducted to assess the validity and reliability of the semantic scale; the result indicates that the semantic scale meets the requirement. The semantic scale’s options contain the attribute’s service condition and the rider’s experience. It enables urban rail transit managers to understand passenger’s perception of the service quality more visually than only knowing the fixed terms “very satisfied, satisfied, normal, dissatisfied, and very dissatisfied” on a Likert scale or numbers on a numeric scale. Therefore, when the number of attributes remains unchanged, urban rail transit managers can formulate more targeted strategies to improve service quality. Furthermore, based on previous studies, the semantic scale can reduce cognitive steps and hesitation for riders when they fill in the questionnaire.
Then, we conducted an empirical study to explore the potential characteristics of the semantic scale by using paired-sample survey data to compare the difference in evaluation results among the semantic, Likert, and numeric scales. The empirical study uncovers the following three insights.
  • First, for attributes with homogeneous service conditions over operation periods, the semantic scale offers fairer evaluation results from the transit agency perspective than Likert and numeric scales. It can be because of lessened hesitation among riders when answering.
  • Second, the semantic scale can usually reduce central tendency bias. It may be because the semantic scale options depict visualized service conditions of attributes or rider’s experience.
  • Third, compared to Likert and numeric scales, the evaluation result of the semantic scale is more homogeneous for attributes with homogeneous service conditions and is more heterogeneous for attributes with heterogeneous service conditions. It can be due to fewer riders’ cognitive steps are required while applying the semantic scale to answer.
We proposed the following suggestions based on the above findings.
  • First, as the scale form can affect the evaluation results, we recommend transport authorities to unify a questionnaire of passenger perceived quality surveys of urban rail transit in a region or even the whole country. Hence, when the evaluation results of different times (e.g., different years) or spaces (e.g., different cities) are compared, the results are more reliable.
  • Second, the collected data should cover operation periods as fully as possible; otherwise, it may increase the measured deviation of riders’ perceived quality.
Some researchers have combined transit- and passenger-oriented data to measure the quality of transit service, such as [46,47], which produced less subjective results. For future work, we will apply the analytic hierarchy process analysis in the focus group to select features of each attribute and determine their weights, as the analytic hierarchy process analysis helps improve the capability of the semantic scale to handle uncertainty, ambiguity, and vagueness of passenger’s perception. Finally, the concept of the semantic scale can also be applied to different modes of public transit.

Author Contributions

Conceptualization, W.C.; methodology, W.C. and Z.K.; software, Z.K.; formal analysis, Z.K. and J.L.; investigation, Z.K. and J.L.; data curation, Z.K.; writing—original draft preparation, Z.K.; writing—review and editing, W.C. and X.F.; visualization, Z.K.; supervision, W.C. and X.F.; project administration, W.C.; funding acquisition, W.C. All authors have read and agreed to the published version of the manuscript.

Funding

This research was funded by the Natural Science Foundation of Hunan Province, China, grant number 2018JJ2537; Science Progress and Innovation Program of Hunan Province, China, grant number DOT201723; and National Natural Science Foundation of China, grant number 61203162.

Acknowledgments

The authors would like to thank every reviewer and respondent for providing valuable comments and data, respectively, to make this paper possible.

Conflicts of Interest

The authors declare no conflict of interest.

Appendix A

Table A1. Information about respondents’ socio-economic, travel habits, and evaluated operation periods.
Percentage (%)
Empirical Study
(n = 408)
Focus Group
(n = 10)
GenderMale39.7140
Female60.2960
Age (years old)<2021.0830
20–4055.8850
>4023.0420
Education backgroundUnder college27.4530
Bachelor49.0250
Master or Ph.D.23.5320
Driver licenseYes44.1250
No55.8850
Private car ownershipYes48.5340
No51.4760
Metro use frequency Daily31.3740
Weekly43.3840
Monthly or fewer25.2520
Travel purpose of metroCommute 54.9040
Entertainment (e.g., shopping, parks)41.1850
Others (e.g., see a doctor)3.9210
Ticket typesCash2.4510
Pass76.9650
Mobile phone19.3640
Free of charge1.230
Evaluated operation periods
WeekdaysBefore 07:005.66
07:00–10:0049.06
10:00–17:0026.89
17:00–20:3014.15
20:30–21:302.83
After 21:301.42
Total51.96
WeekendsBefore 09:004.59
09:00–15:0067.35
15:00–22:0025.00
After 22:003.06
Total48.04

References

  1. Transportation Research Board; The National Academies of Sciences, Engineering, and Medicine. Transit Capacity and Quality of Service Manual, 3rd ed.; Kittelson, &amp, Associates, Inc., Parsons Brinckerhoff, KFH Group, Texas A, &amp, M Transportation, Institute, Eds.; The National Academies Press: Washington, DC, USA, 2013; Chapter 4, p. 6, Chapter 5, pp. 4, 24, Chapter 10, p. 14, Chapter 4, pp. 17–36, Chapter 10, pp. 10–29. [Google Scholar]
  2. De Oña, J.; De Oña, R.; Eboli, L.; Mazzulla, G. Perceived service quality in bus transit service: A structural equation approach. Transp. Policy 2013, 29, 219–226. [Google Scholar] [CrossRef]
  3. Guirao, B.; García-Pastor, A.; López-Lambas, M.E. The importance of service quality attributes in public transportation: Narrowing the gap between scientific research and practitioners’ needs. Transp. Policy 2016, 49, 68–77. [Google Scholar] [CrossRef]
  4. De Oña, J.; De Oña, R.; Eboli, L.; Mazzulla, G. Index numbers for monitoring transit service quality. Transp. Res. Part A Policy Pract. 2016, 84, 18–30. [Google Scholar] [CrossRef]
  5. Rahman, F.; Das, T.; Hadiuzzaman, M.; Hossain, S. Perceived service quality of paratransit in developing countries: A structural equation approach. Transp. Res. Part A Policy Pract. 2015, 93, 23–38. [Google Scholar] [CrossRef]
  6. De Oña, J.; De Oña, R. Quality of service in public transport based on customer satisfaction surveys: A review and assessment of methodological approaches. Transp. Sci. 2015, 49, 605–622. [Google Scholar] [CrossRef]
  7. Zhang, C.; Liu, Y.; Lu, W.; Xiao, G. Evaluating passenger satisfaction index based on PLS-SEM model: Evidence from Chinese public transport service. Transp. Res. Part A Policy Pract. 2019, 120, 149–164. [Google Scholar] [CrossRef]
  8. Hernandez, S.; Monzon, A.; de Oña, R. Urban transport interchanges: A methodology for evaluating perceived quality. Transp. Res. Part A Policy Pract. 2016, 84, 31–43. [Google Scholar] [CrossRef]
  9. Tourangeau, R.; Rips, L.J.; Rasinski, K. The Psychology of Survey Response; Cambridge University Press: Cambridge, UK, 2000; pp. 1–22. ISBN 0521576296. [Google Scholar]
  10. Krosnick, J.A.; Presser, S. Question and Questionnaire Design; Standford University: Standford, CA, USA, 2010; pp. 10–11. [Google Scholar]
  11. Brace, I. Questionnaire Design: How to Plan, Structure and Write Survey Material for Effective Market Research; Kogan Page Publishers: London, UK, 2018; pp. 51, 53, 78, 135; ISBN 0749481986. [Google Scholar]
  12. Barabino, B.; Deiana, E.; Tilocca, P. Measuring service quality in urban bus transport: A modified SERVQUAL approach. Int. J. Qual. Serv. Sci. 2012, 4, 238–252. [Google Scholar] [CrossRef]
  13. Marcucci, E.; Gatta, V. Quality and public transport service contracts. Eur. Transp. 2007, 36, 92–106. [Google Scholar]
  14. Eboli, L.; Mazzulla, G. A stated preference experiment for measuring service quality in public transport. Transp. Plan. Technol. 2008, 31, 509–523. [Google Scholar] [CrossRef] [Green Version]
  15. Beck, M.J.; Rose, J.M. The best of times and the worst of times: A new best-worst measure of attitudes toward public transport experiences. Transp. Res. Part A Policy Pract. 2016, 86, 108–123. [Google Scholar] [CrossRef]
  16. Echaniz, E.; Ho, C.Q.; Rodriguez, A.; dell’Olio, L. Comparing best-worst and ordered logit approaches for user satisfaction in transit services. Transp. Res. Part A Policy Pract. 2019, 130, 752–769. [Google Scholar] [CrossRef]
  17. Presser, S.; Schuman, H. The Measurement of a Middle Position in Attitude Surveys. Public Opin. Q. 1980, 44, 70–85. [Google Scholar] [CrossRef]
  18. Ofir, C.; Reddy, S.K.; Bechtel, G.G. Are Semantic Response Scales Equivalent? Multivar. Behav. Res. 1987, 22, 21–38. [Google Scholar] [CrossRef]
  19. Friborg, O.; Martinussen, M.; Rosenvinge, J.H. Likert-based vs. semantic differential-based scorings of positive psychological constructs: A psychometric comparison of two versions of a scale measuring resilience. Pers. Individ. Diff. 2006, 40, 873–884. [Google Scholar] [CrossRef]
  20. Bonera, M.; Maternini, G.; Parkhurst, G.; Paddeu, D.; Clayton, W.; Vetturi, D. Travel experience on board urban buses: A comparison between Bristol and Brescia. Eur. Transp. Trasp. Eur. 2020, 1–12. [Google Scholar]
  21. Barabino, B.; Cabras, N.A.; Conversano, C.; Olivo, A. An Integrated Approach to Select Key Quality Indicators in Transit Services; Springer Netherlands: Berlin/Heidelberg, Germany, 2020; Volume 149, ISBN 0123456789. [Google Scholar]
  22. Dell’Olio, L.; Ibeas, A.; De Ona, J.; De Ona, R. Public Transportation Quality of Service: Factors, Models, and Applications; Elsevier: Amsterdam, The Netherlands, 2017; pp. 41, 105, 111, 115; ISBN 0081022794. [Google Scholar]
  23. De Oña, J.; De Oña, R.; Eboli, L.; Mazzulla, G. Heterogeneity in Perceptions of Service Quality among Groups of Railway Passengers. Int. J. Sustain. Transp. 2015, 9, 612–626. [Google Scholar] [CrossRef]
  24. De Oña, R.; Eboli, L.; Mazzulla, G. Key factors affecting rail service quality in the Northern Italy: A decision tree approach. Transport 2014, 29, 75–83. [Google Scholar] [CrossRef] [Green Version]
  25. Aydin, N. A fuzzy-based multi-dimensional and multi-period service quality evaluation outline for rail transit systems. Transp. Policy 2017, 55, 87–98. [Google Scholar] [CrossRef]
  26. Awasthi, A.; Chauhan, S.S.; Omrani, H.; Panahi, A. A hybrid approach based on SERVQUAL and fuzzy TOPSIS for evaluating transportation service quality. Comput. Ind. Eng. 2011, 61, 637–646. [Google Scholar] [CrossRef]
  27. Nathanail, E. Measuring the quality of service for passengers on the Hellenic railways. Transp. Res. Part A Policy Pract. 2008, 42, 48–66. [Google Scholar] [CrossRef]
  28. Eboli, L.; Mazzulla, G. Relationships between rail passengers’ satisfaction and service quality: A framework for identifying key service factors. Public Transp. 2015, 7, 185–201. [Google Scholar] [CrossRef]
  29. Shen, W.; Xiao, W.; Wang, X. Passenger satisfaction evaluation model for Urban rail transit: A structural equation modeling based on partial least squares. Transp. Policy 2016, 46, 20–31. [Google Scholar] [CrossRef]
  30. Wilson, F.R.; Pan, W.; Schumsky, D.A. Recalculation of the critical values for Lawshe’s content validity ratio. Meas. Eval. Couns. Dev. 2012, 45, 197–210. [Google Scholar] [CrossRef] [Green Version]
  31. Devon, H.A.; Block, M.E.; Moyle-Wright, P.; Ernst, D.M.; Hayden, S.J.; Lazzara, D.J.; Savoy, S.M.; Kostas-Polston, E. A psychometric toolbox for testing validity and reliability. J. Nurs. Scholarsh. 2007, 39, 155–164. [Google Scholar] [CrossRef] [PubMed]
  32. Gilbert, G.E.; Prion, S. Making Sense of Methods and Measurement: Lawshe’s Content Validity Index. Clin. Simul. Nurs. 2016, 12, 530–531. [Google Scholar] [CrossRef]
  33. Lawshe, C.H. A quantitative approach to content validity”.Personnel Psychology. Pers. Psychol. 1975, 28, 563–575. [Google Scholar] [CrossRef]
  34. Ayre, C.; Scally, A.J. Critical values for Lawshe’s content validity ratio: Revisiting the original methods of calculation. Meas. Eval. Couns. Dev. 2014, 47, 79–86. [Google Scholar] [CrossRef] [Green Version]
  35. Wenjuanxing Homepage. Available online: https://www.wjx.cn/ (accessed on 15 April 2020).
  36. Cochran, W.G. Sampling Techniques; John Wiley & Sons: Hoboken, NJ, USA, 2007; ISBN 8126515244. [Google Scholar]
  37. Yannis, T.; Georgia, A. A complete methodology for the quality control of passenger services in the public transport business. Eur. Transp. Eur. 2008, 38, 1–16. [Google Scholar]
  38. Hassan, M.N.; Hawas, Y.E.; Ahmed, K. A multi-dimensional framework for evaluating the transit service performance. Transp. Res. Part A Policy Pract. 2013, 50, 47–61. [Google Scholar] [CrossRef]
  39. Echaniz, E.; dell’Olio, L.; Ibeas, Á. Modelling perceived quality for urban public transport systems using weighted variables and random parameters. Transp. Policy 2018, 67, 31–39. [Google Scholar] [CrossRef]
  40. Dell’Olio, L.; Ibeas, A.; Cecin, P. The quality of service desired by public transport users. Transp. Policy 2011, 18, 217–227. [Google Scholar] [CrossRef]
  41. Li, L.; Cao, M.; Bai, Y.; Song, Z. Analysis of Public Transportation Competitiveness Based on Potential Passenger Travel Intentions: Case Study in Shanghai, China. Transp. Res. Rec. 2019, 2673, 823–832. [Google Scholar] [CrossRef]
  42. Yap, B.W.; Sim, C.H. Comparisons of various types of normality tests. J. Stat. Comput. Simul. 2011, 81, 2141–2155. [Google Scholar] [CrossRef]
  43. Stephens, M.A. EDF Statistics for Goodness of Fit and Some Comparisons. J. Am. Stat. Assoc. 1974, 69, 730–737. [Google Scholar] [CrossRef]
  44. Krosnick, J.A. Response strategies for coping with the cognitive demands of attitude measures in surveys. Appl. Cogn. Psychol. 1991, 5, 213–236. [Google Scholar] [CrossRef]
  45. Kalton, G.; Roberts, J.; Holt, D. The Effects of Offering a Middle Response Option with Opinion Questions. J. R. Stat. Soc. Ser. D Stat. 1980, 29, 65–78. [Google Scholar] [CrossRef]
  46. Barabino, B. Automatic Recognition of “Low-Quality” Vehicles and Bus Stops in Bus Services; Springer: Berlin/Heidelberg, Germany, 2018; Volume 10, ISBN 0123456789. [Google Scholar]
  47. Eboli, L.; Mazzulla, G. A methodology for evaluating transit service quality based on subjective and objective measures from the passenger’s point of view. Transp. Policy 2011, 18, 172–181. [Google Scholar] [CrossRef]
Figure 1. The hierarchical relationship between an attribute and its features, terms, and options.
Sustainability 12 08626 g001
Figure 2. A four-step methodological framework to form a semantic scale.
Sustainability 12 08626 g002
Figure 3. A 3 * 3 combination example of features and their terms.
Sustainability 12 08626 g003
Figure 4. The semantic scale.
Sustainability 12 08626 g004
Figure 5. The comparison results of means.
Sustainability 12 08626 g005
Figure 6. The comparison results of variances.
Sustainability 12 08626 g006
Table 1. Characteristics of some scales used in transit passenger perceived quality surveys.
ScalesCognitive Step Real Experience ReflectionData QualityData ProcessUsage Frequency
Likertfourvaguecentral tendency bias (respondents tend to choose the option near the middle level instead of the extreme levels)easypopular
Numericfourvague-easypopular
Stated preferencetwodetailed less central tendency biascomplexmoderate
Best–worstfourvaguebetter derived importance of attributescomplexlow
Semantic-differential fourless vaguehigh reliability, internal validity, and model fiteasylow
Table 2. Features of all attributes, the terms used to describe the features, and the codes of the terms.
AttributeFeatureThe Term Used to Describe the Feature (Code)
Station accessibilityDistanceWalking (1) cycling (0.5) vehicle transfer (0)
Walking environmentgood (1) bad (0)
In-station guide signs/Line map info/Train arrival infoClarityclear (1) a bit unclear (0.5) hard to understand (0)
Conspicuousnessconspicuous (1) concealed (0)
Ticket purchase and top-up serviceOperational simplicitysimple (1) a bit inconvenient (0.5) inconvenient (0)
Number of machinessufficient (1) a bit insufficient (0.5) insufficient (0)
Fare gate waiting timeLengthwait a moment (1) a long line (0)
Machine sensitivitysmooth (1) stuck (0)
Escalator and liftCrowdednessno need to wait or wait a moment (1) a long line (0)
Frequency of out of servicenever met (1) occasionally encountered on (0.5) often encountered on (0)
Station crowdednessWalking speedfreely selected (1) slightly restricted (0.75) slow move (0.5) hard to move (0.25) wait outside the station (0)
Frequency of physical contact with otherswithout(1) avoidable (0.75) occasional (0.5) frequent (0.25) wait outside the station (0)
Train waiting timeFrequency of checking train timetableno need (1) want to (0.75) occasional (0.5) frequent (0.25) must (0)
Train crowdednessNumber of available handrailsPlenty or have empty seats (1) some (0.75) few (0.5) zero (0.25) fail to get on and off one or more times (0)
Frequency of physical contact with othersretain space (1) without (0.75) occasional (0.5) frequent (0.25) fail to get on and off one or more times (0)
NoiseLevelsmall (1) big (0)
Continuityintermittent (1) continuous (0)
IlluminationBrightnessbright (1) slightly dark (0.5) Dark (0)
Broken lightsnot found (1) found (0.5) there are many (0)
Temperature and ventilationTemperature comfortcomfortable (1) slightly sweating or trembling (0.5) significantly sweating or trembling (0)
Air circulationwell-ventilated (1) a bit unventilated (0.5) unventilated (0)
CleanlinessStains, dustnot found (1) found (0.5) there are much (0)
Trashnot found (1) found (0.5) there are much (0)
Staff serviceAttitudefriendly (1) indifferent (0)
Work ability solve problems quickly (1) solve problems slowly (0.5) cannot solve problems (0)
Safety and securityPersonal safetyno worries (1) occasional worries (0.5) frequent worries (0)
Property securityno worries (1) occasional worries (0.5) frequent worries (0)
Service spanStart of operationmeet my demand (1) a bit late (0.5) too late (0)
End of operationmeet my demand (1) a bit early (0.5) too early (0)
Note: 1. Station accessibility: add “not too close, walking is acceptable” to describe the feature “distance” and then merge good (1) bad (0) “walking environment” to serve as the option S2; it belongs to the 2 * 2 combination. 2. In-station guide signs: add the case “guide signs are missing” to serve as the option S2. 3. Fare gate waiting time: add “no need to wait” to describe the feature “length” and serves as the option S4; ignore smooth (1) or stuck (0) due to the marginal effect on the time in this case. 4. Line map info and train arrival info: add the case “no relevant info or the equipment is being repaired” to serve as the option S0. 5. Noise: add “quiet” to describe the feature “level” and serves as the option S4. 6. Staff service: add the case “no staff or their contact information” to serve as the option as S0.
Table 3. The validity and reliability of the semantic scale.
AttributeFeatureContent ValidityReliability
Lawshe’s CVRCronbach’s α
Station accessibilityDistance0.990.84
Walking environment0.99
In-station guide signsClarity0.99
Conspicuousness0.99
Ticket purchase and top-up serviceOperational simplicity0.99
Number of machines0.99
Fare gate waiting timeLength0.75
Machine sensitivity0.75
Line map infoClarity0.99
Conspicuousness0.99
Escalator and liftCrowdedness0.75
Frequency of out of service0.75
Station crowdednessWalking speed0.99
Frequency of physical contact with others0.99
Train arrival infoClarity0.99
Conspicuousness0.99
Train waiting timeFrequency of checking train timetable0.99
Train crowdednessNumber of available handrails0.99
Frequency of physical contact with others0.99
NoiseLevel0.75
Continuity0.75
IlluminationBrightness0.75
Broken lights0.75
Temperature and ventilationTemperature comfort0.99
Air circulation0.99
CleanlinessStains, dust0.99
Trash0.99
Staff serviceAttitude0.99
Work ability 0.99
Safety and securityPersonal safety0.99
Property security0.99
Service spanStart of operation0.99
End of operation0.99
Table 4. Comparison results of the score’s relative frequency distributions.
AttributeScale FormScore’s Relative Frequency Distributionsp-Value of Bowker Test
43210 P L S P S N
Station accessibility Likert40.2047.7910.540.251.23******
Semantic55.394.6630.884.664.41
Numeric50.2540.697.111.960.00
In-station guide signs Likert42.6549.516.130.491.23******
Semantic87.258.091.232.450.98
Numeric57.6037.015.390.000.00
Ticket purchase and top-up serviceLikert43.8747.067.350.251.47***0.013 *
Semantic69.8525.004.410.490.25
Numeric57.1136.765.390.490.25
Fare gate waiting timeLikert37.2549.2610.541.471.470.005 *****
Semantic35.5456.864.662.700.25
Numeric49.2643.146.620.740.25
Line map infoLikert43.6348.536.370.251.23******
Semantic88.974.414.171.720.74
Numeric61.7633.584.170.490.00
Escalator and liftLikert36.7650.749.561.231.72******
Semantic43.3838.978.338.580.74
Numeric51.9639.467.600.740.25
Station crowdednessLikert24.5134.8028.6810.051.96***0.30
Semantic39.9539.7113.245.641.47
Numeric37.0140.2017.404.660.74
Train arrival infoLikert43.3849.754.171.231.47******
Semantic91.183.431.723.190.49
Numeric54.6638.245.880.980.25
Train waiting timeLikert35.0550.0013.480.490.98******
Semantic66.1825.746.131.470.49
Numeric46.0845.597.840.490.00
Train crowdednessLikert23.2835.2926.7211.273.430.03 ****
Semantic30.6425.4928.9212.012.94
Numeric34.3140.9318.634.411.72
NoiseLikert24.0236.7627.948.822.45***0.002 **
Semantic28.1952.7012.995.150.98
Numeric38.7341.1815.204.660.25
IlluminationLikert38.9745.8312.251.471.47******
Semantic82.8413.243.680.000.25
Numeric56.6237.014.661.470.25
Temperature and ventilationLikert33.3342.4019.123.681.47******
Semantic65.2020.3412.990.980.49
Numeric51.2336.529.072.450.74
CleanlinessLikert33.3350.4913.481.231.47******
Semantic78.9213.486.860.490.25
Numeric51.4740.696.620.980.25
Staff serviceLikert41.1849.028.580.250.98******
Semantic88.244.412.942.451.96
Numeric57.3537.504.660.490.00
Safety and securityLikert40.2050.258.330.250.98******
Semantic72.3013.7312.500.740.74
Numeric54.4138.486.620.490.00
Service spanLikert38.2449.759.561.470.98******
Semantic84.079.565.640.740.00
Numeric55.3939.224.171.230.00
Note: P L S and P S N are p - values of an attribute, respectively, denoting the test results of the equality of its score’s relative frequency distributions in Likert and semantic scales, and semantic and numeric scales. * p < 0.05; ** p < 0.01; *** p < 0.001.
Table 5. The equivalence test results of means.
Attributep-Value of Paired-Sample t-Test or Wilcoxon Signed-Rank Test
P L S P S N
Train crowdedness0.38***
Station accessibility******
Noise ***0.004 **
Station crowdedness***0.47
Escalator and lift0.43***
Fare gate waiting time0.27***
Temperature and ventilation******
Safety and security***0.004 **
Train waiting time******
Ticket purchase and top-up service******
Cleanliness******
Staff service******
Service span******
In-station guide signs******
Illumination******
Line map info******
Train arrival info******
Note: P L S and P S N are p - values , respectively, denoting the equivalence test results of means in Likert and semantic scales, and semantic and numeric scales. * p < 0.05; ** p < 0.01; *** p < 0.001.
Table 6. The equality test results of variances.
Attributep-Value of Paired-Sample F-test or Levene Test
P L S P S N
Illumination******
Service span******
Ticket purchase and top-up service***0.002**
Cleanliness******
Train arrival info******
Line map info******
In-station guide signs******
Fare gate waiting time0.03 *0.002 **
Train waiting time0.070.02 *
Safety and security0.09 *0.06
Temperature and ventilation0.010 **0.014 *
Staff service******
Noise***0.004 **
Station crowdedness0.03*0.50
Escalator and lift***0.005 **
Train crowdedness0.06***
Station accessibility******
Note: P L S and P S N are p - values , respectively, denoting the equivalence test results of means in Likert and semantic scales, and semantic and numeric scales. * p < 0.05; ** p < 0.01; *** p < 0.001.
Publisher’s Note: MDPI stays neutral with regard to jurisdictional claims in published maps and institutional affiliations.

