History and Trends in Ecological Stoichiometry Research from 1992 to 2019: A Scientometric Analysis


1
College of Resources and Environmental Sciences, Gansu Agricultural University, Lanzhou 730070, China
2
Wolfson College, Oxford University, Oxford OX2 6UD, UK
3
Institute of Biomedical and Environmental Science & Technology, University of Bedfordshire, Luton LU1 3JU, UK
4
School of Life Sciences, Shanxi University, Taiyuan 030006, China
5
School of Biological Science and Engineering, North Minzu University, Yinchuan 750021, China
*
Author to whom correspondence should be addressed.
Sustainability 2020, 12(21), 8909; https://0-doi-org.brum.beds.ac.uk/10.3390/su12218909
Submission received: 26 September 2020
/
Revised: 15 October 2020
/
Accepted: 23 October 2020
/
Published: 27 October 2020
Abstract
:Ecological stoichiometry (ES), as an ecological theory, provides a framework for studying various ecological processes, and it has been applied successfully in fields ranging from nutrient dynamics to biogeochemical cycling. Through the application of ES theory, researchers are beginning to understand many diverse ecological topics. The aim of this paper was to identify the main characteristics of ES, especially to clarify the evolution, and potential trends of this field for future ecological studies. We used CiteSpace software to conduct a bibliometric review of ES research publications from 1992 to 2019 extracted from the Web of Science. The results showed that the United States has been a major contributor to this field; approximately half of the top 15 academic institutions contributing to ES research were in the United States. Although the largest number of publications on ES were from China, the impact of these academic papers has thus far been less than that of the papers from other countries. Moreover, none of the top 15 authors or cited authors contributing to publications on ES from 1992 to 2019 were from China. ES research has developed rapidly and has changed from single-discipline ES studies to a multidisciplinary “auxiliary tool” used in different fields. Overall, ES shows great research potential and application value, especially for studies on nutrient cycling, ecosystem sustainability and biogeochemical cycling.
1. Introduction
Since the 20th century, biological research has occurred not only at different levels of biological organization (such as molecules, individuals, populations and ecosystems), but also in particular habitats [1]. However, due to knowledge fragmentation, nature has become more difficult to understand as a functional whole [2]. Do all creatures on Earth have uniform characteristics? Is there a theory that can connect various organizational levels (from the molecular to genetic levels and even to the ecosystem level) under the framework of modern biological science? For this purpose, the theory of ecological stoichiometry (ES) was put forward; it combines the laws of thermodynamics, the principles of natural selection in biological evolution and the central laws of molecular biology [3].
ES combines the basic principles and methods of ecology and stoichiometry and is an efficient tool that is widely used by ecologists to understand the nutrient dynamics and energy flow in an ecological system on the basis of chemical principles and the balance among different chemical elements (e.g., carbon, nitrogen, and phosphorus) [4,5]. ES theory can help us to better predict the dynamics characteristics of ecosystem processes [6]. Currently, researchers are focusing on C:N:P stoichiometry in studies on elemental stoichiometry in the ES framework, because these elements are mineral nutrients and comprise the Redfield ratio [7]. C:N:P stoichiometry is vital to understanding organismal nutrient dynamics, sustainability and biogeochemical cycling in ecosystems, and serves as a bridge between different disciplines. Additionally, it provides new insights into individual fitness and biogeochemical cycles in ecosystems [8].
ES studies were initially carried out in aquatic ecosystems [5], and researchers have applied the basic principles of stoichiometry to study nutrient limitation and nutrient cycling [9]. However, the rapid growth of ES research has introduced considerable challenges in identifying research trends and hotspots in this field. To date, there has been no bibliometric analysis to summarize the published research papers on ES or to assess the hotspots and frontiers in particular areas or trends. Therefore, we performed a bibliometric review of the literature data on ES to clarify the main characteristics, evolution characteristics, potential trends, hot topics and hotspots in the ES field for prospective studies.
In this paper, the Web of Science Core Collection database was used to find literature related to ES published from 1992 to 2019 and the visualization maps of the literature data were drawn by CiteSpace. This paper addresses four key themes: (a) clarification of the characteristics of research collaboration in ES; (b) identification of the most cited authors and inscriptions in this field; (c) identification of the major categories and their evolutionary trend in the field over the past decades; and (d) evaluation of hot topics and trends in ES research.
2. Data Acquisition and Methods
2.1. Data Collection
The literature data analyzed in this paper were collected via two steps. In step one, literature data were collected from the Thomson Reuters Web of Science (WoS). For most fields, WoS is one of the most frequently used scientific literature databases. Specifically, the WoSCC (Web of Science Core Collection), where all cited references for all publications are fully indexed and searchable, was searched; the WoSCC is one of the vital sources of scientific information [10]. The search term “ecological stoichiometry” was used to retrieve the literature data published from 1992/01/01 to 2019/12/31.
The period (1992–2019) was selected because after the theory of ES was first put forward [11], and many researchers, especially marine biologists, began to pay more attention to ES, many studies on the topic appeared in the 1990s to validate and suppltableement the theory of ES. The book “Ecological stoichiometry: the biology of elements from molecules to the biosphere” represents the perfection of this theory [5]. The search terms included the following: TS (Topic Search) = “stoichiometry” OR “stoichiometric” OR “ecological stoichiometry” OR “ecological stoichiometrics”. The language selected was “English”, and the document type selected was “Article”. “Plain Text” was selected as the file format, and “Full record and cited references” were selected as the record content.
In step two, to ensure the accuracy of the analysis results, the records that were not relevant to “ecological stoichiometry” were deleted with UltraEdit 25.10 software (IDM Computer Solutions, Inc. USA).
2.2. Bibliometric Analysis and Tools
CiteSpace is a software package that is often used to perform bibliometric visualization analysis. CiteSpace can be used to visualize academic references or authors or journals, and to create co-occurrence network maps of keywords, authors, countries/regions and institutions in a particular subject [10,12,13].
In this paper, we used the following CiteSpace parameters: time slicing (1992 through 2019), year per slice (1). According to the type of analysis conducted, we selected different node types. The selection criteria in CiteSpace were set as follows: g-index = 25, Top N = 50, Top N% = 10%/100. The thresholding parameters included citation (c), co-citation (cc), and cosine coefficient thresholds (ccv) and were set at 2/2/20, 4/3/20, and 3/3/20, respectively. Usage 180 = 50, Usage 2013 = 50, and no citations were selected; pruning (pruning sliced networks and pruning the merged network) and no visualization were selected.
In this paper, the literature data on ES were extracted from the WoSCC database, and the analysis was carried out from different perspectives, including keyword cluster analysis, citation burst detection, country/regions and institution analysis, and subject category analysis.
3. Results and Discussion
In this paper, the analysis results and discussion of ES research are listed in two stages: (1) a descriptive analysis and search to delineate the field of ES research, which included the distributions of countries/regions, institutions, authors/co-cited authors and co-cited journals; (2) an in-depth analysis of the theme to describe the thematic evolution of this field and point out the characteristics and trends of research on ES using both bibliometric and visualization analysis.
3.1. Descriptive Analysis
3.1.1. Distribution of Countries/Regions and Institutions in the ES Studies
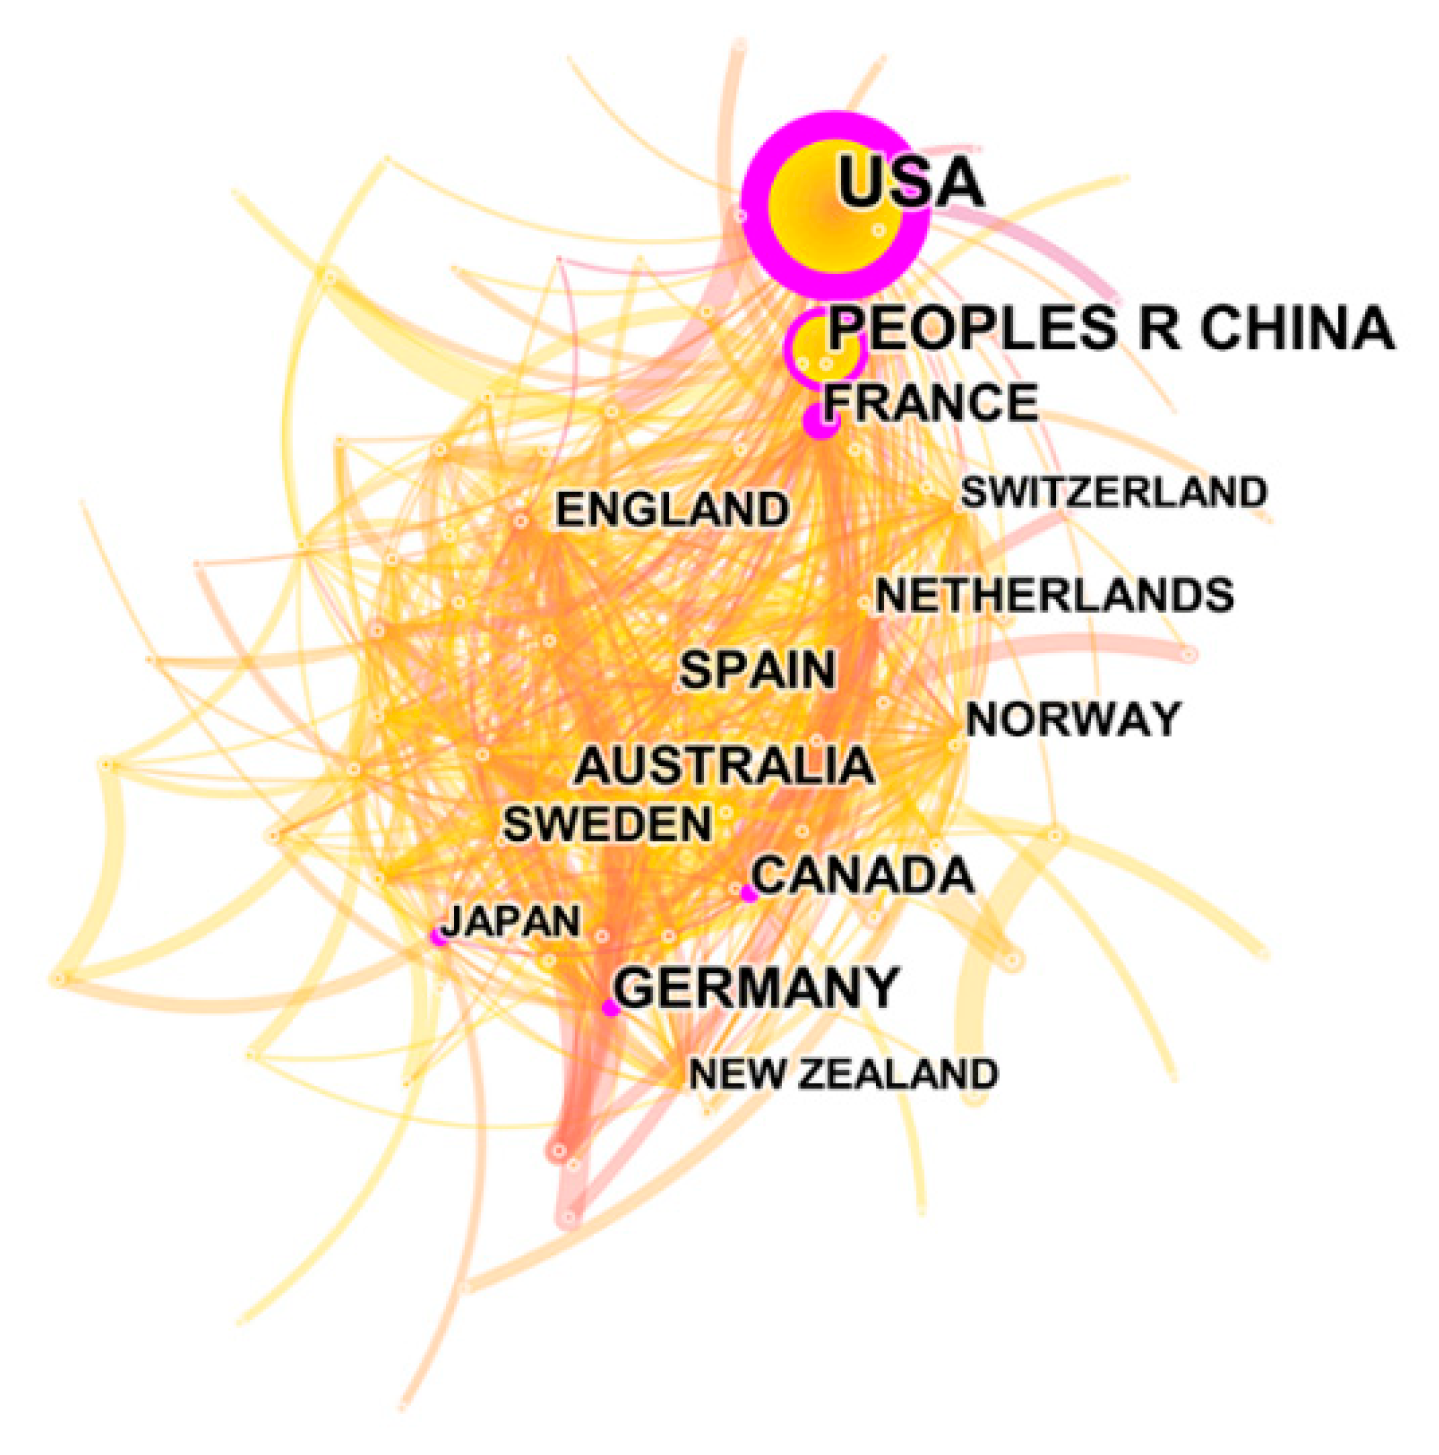
Figure 1 and Figure 2 and Table 1 present the number of publications, total papers, and centrality for the top 15 (of 100) countries/regions and institutions (of 574) that published papers on ES. Figure 1 and Figure 2 show the visualization maps of the research countries/regions and institutions that published literature on ES in WOS; we can see these countries/regions and institutions form a complex network of relationships, reveling a close cooperation among them. The centrality represents the importance of a specific node in a network [14]. Thus, the more central a country/region or institution, the greater is the number of its publications with others. In total, 2831 papers on ES research were obtained for the 1992–2019 period after performing the “remove duplicates” function in CiteSpace. The visualization map for countries where ES research has occurred was produced with the aid of the pruning parameter (pruning based on Pathfinder/Pruning sliced networks). After running the software, 100 nodes and 680 links were included in the network, and the density was 0.1374 (Figure 1). All the papers on ES research were contributed by 100 countries/regions (supplementary Table S1). The 15 most prolific countries/regions in ES research are presented in Table 1. Most of the top 15, whether ranked by study quantity or centrality, are in the United States, showing that US scientific institutions have made the most outstanding contributions to ES research. Moreover, although the centrality scores for China and Germany were lower than those of the United States, their respective numbers of publications were 617 and 310, indicating that their research results are worthy of reference by scholars worldwide.
Significantly, the United States ranked first in the number of publications and centrality score, which indicates that the USA was the top country in terms of technology and innovation in this field. Moreover, its great contribution to ES research makes the USA the indisputable leader in this field. It is worth noting that a node (country/region) with a high centrality metric may not necessarily have high “counts” (counts represents the number of publications). For example, China ranked second in number of publications (617) but had a low centrality score (0.1), indicating that China did not partner with other countries in publications.
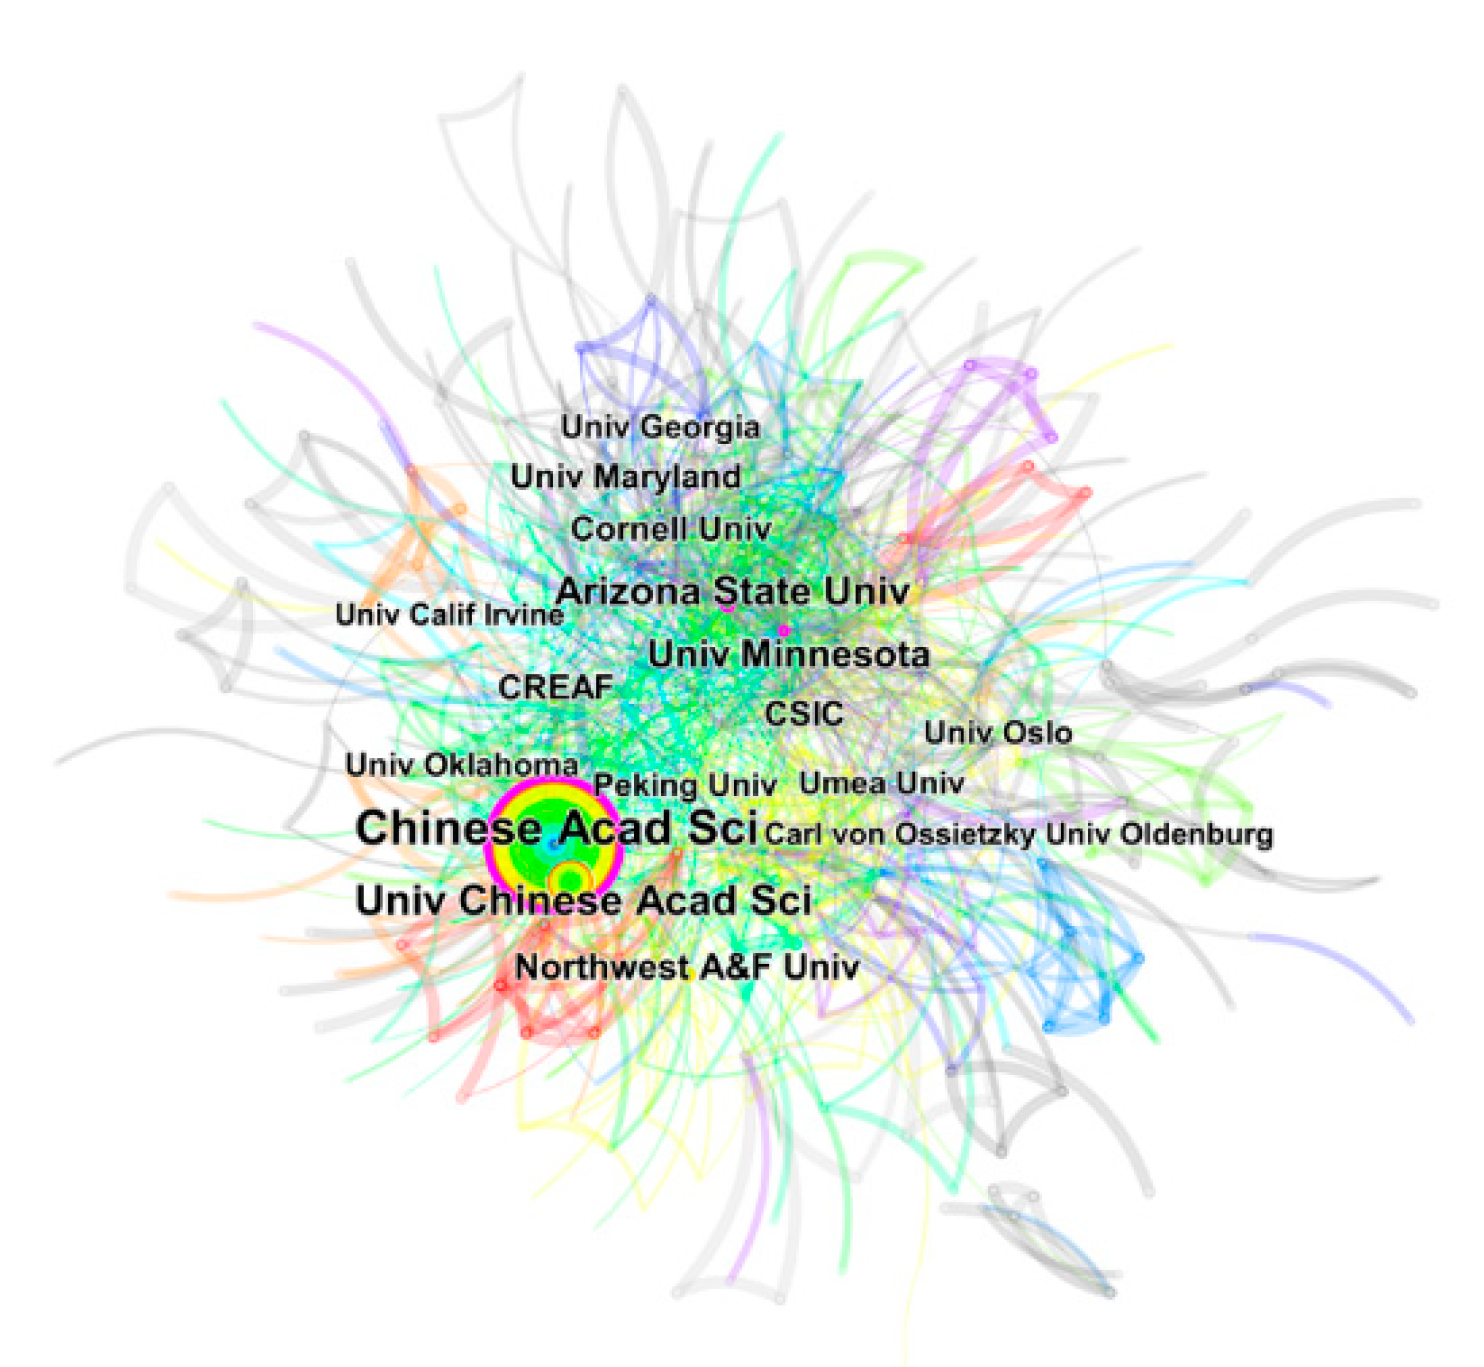
The visualization map of institutions participating in ES research was created by installing the pruning (pathfinder: none) parameter. After running the software, 575 nodes and 1900 links were included in the network, and the density was 0.0115 (Figure 2). The publications on ES were produced by 574 institutions. According to the list of the top 15 institutions engaged in ES research, the Chinese Academy of Sciences was connected to the most publications (312), followed by the University of the Chinese Academy of Sciences (128), Arizona State University (107), the University of Minnesota (89), and the Northwest Agriculture and Forestry University (62) (Table 1). Moreover, the highest importance indices (centrality) were for the Chinese Academy of Sciences (0.21), Arizona State University (0.19), the University of Minnesota (0.15), and Cornell University (0.1) (Table 1).
3.1.2. Distribution of Authors and Co-Cited Authors on ES Studies
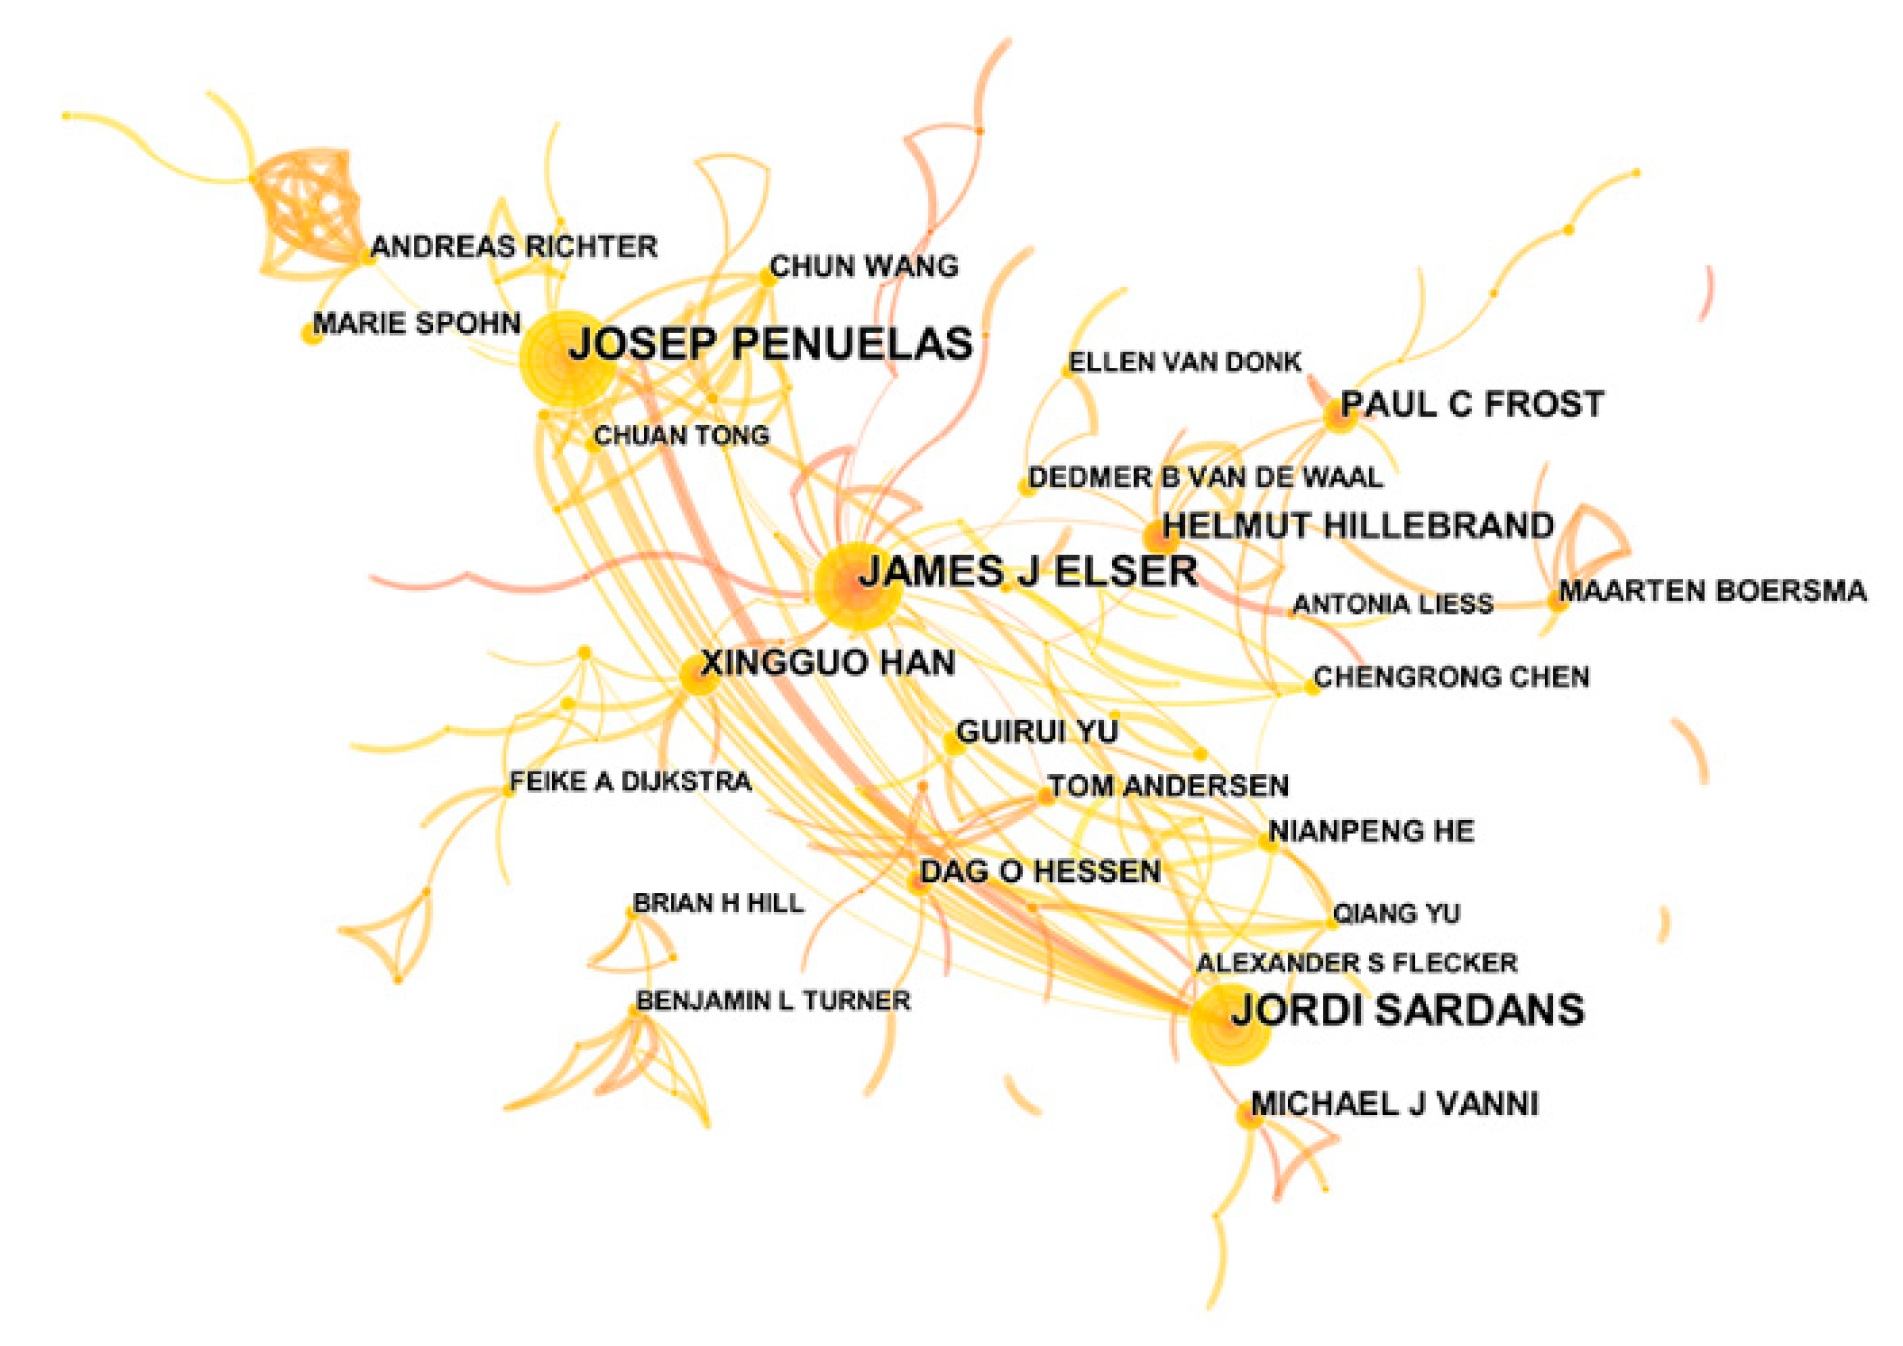
An author map was obtained using the pruning parameter (we chose “Pathfinder/Pruning sliced networks”): 845 nodes and 903 links were included in the network, and the density was 0.0025 (Figure 3). In total, 843 authors contributed to ES research (Table S2). The most productive author, whether by study quantity or centrality, was J.J. Elser (82), followed by J. Penuelas (45), J. Sardans (39) and J. Urabe (24).
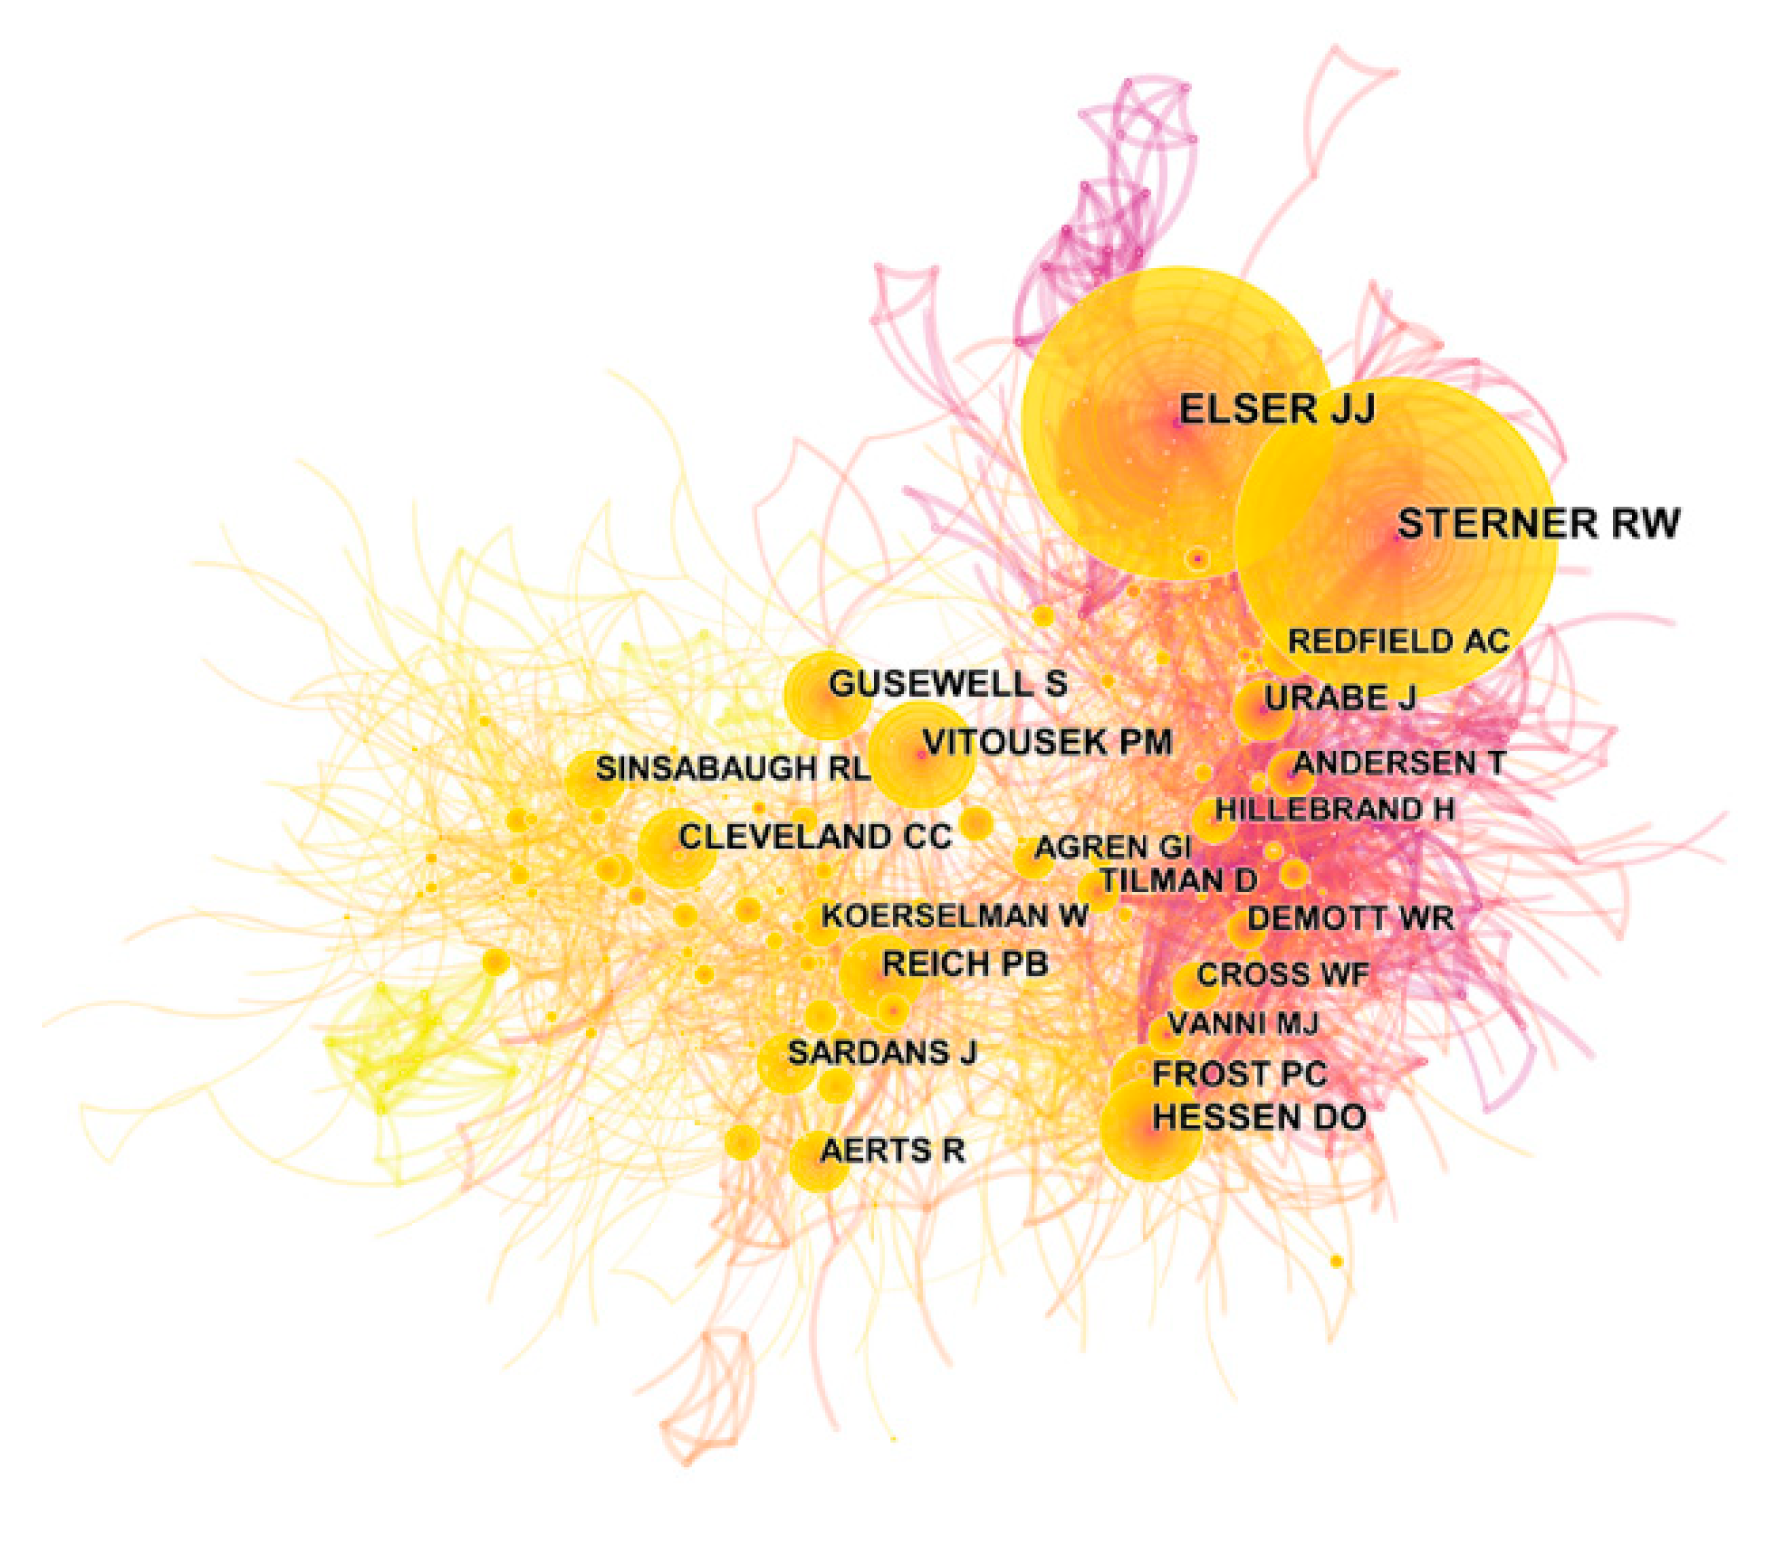
The cited author map of ES research was obtained via the pruning parameter (pruning based on pathfinder/pruning sliced networks): 1176 nodes and 4517 links were included in the network, and the density was 0.0065. Figure 4 shows the author co-citation network for ES research. In total, 1175 cited authors contributed to publications on ES research (Table S2). The distribution of cited authors is shown in Table 2. R.W. Sterner contributed the most (1289 counts) followed by J.J. Elser (1259), but the results for these two authors were not significantly different. Furthermore, from the angle of centrality (Table 2), the top author was P.M. Vitouserk (0.14), followed by J.J. Elser (0.1) and A.C. Redfield (0.1) (Table 2). In conclusion, J.J. Elser is currently recognized as the most active author in this field. Furthermore, we found very few authors and cited authors from China, which had few partners with other countries in the research area.
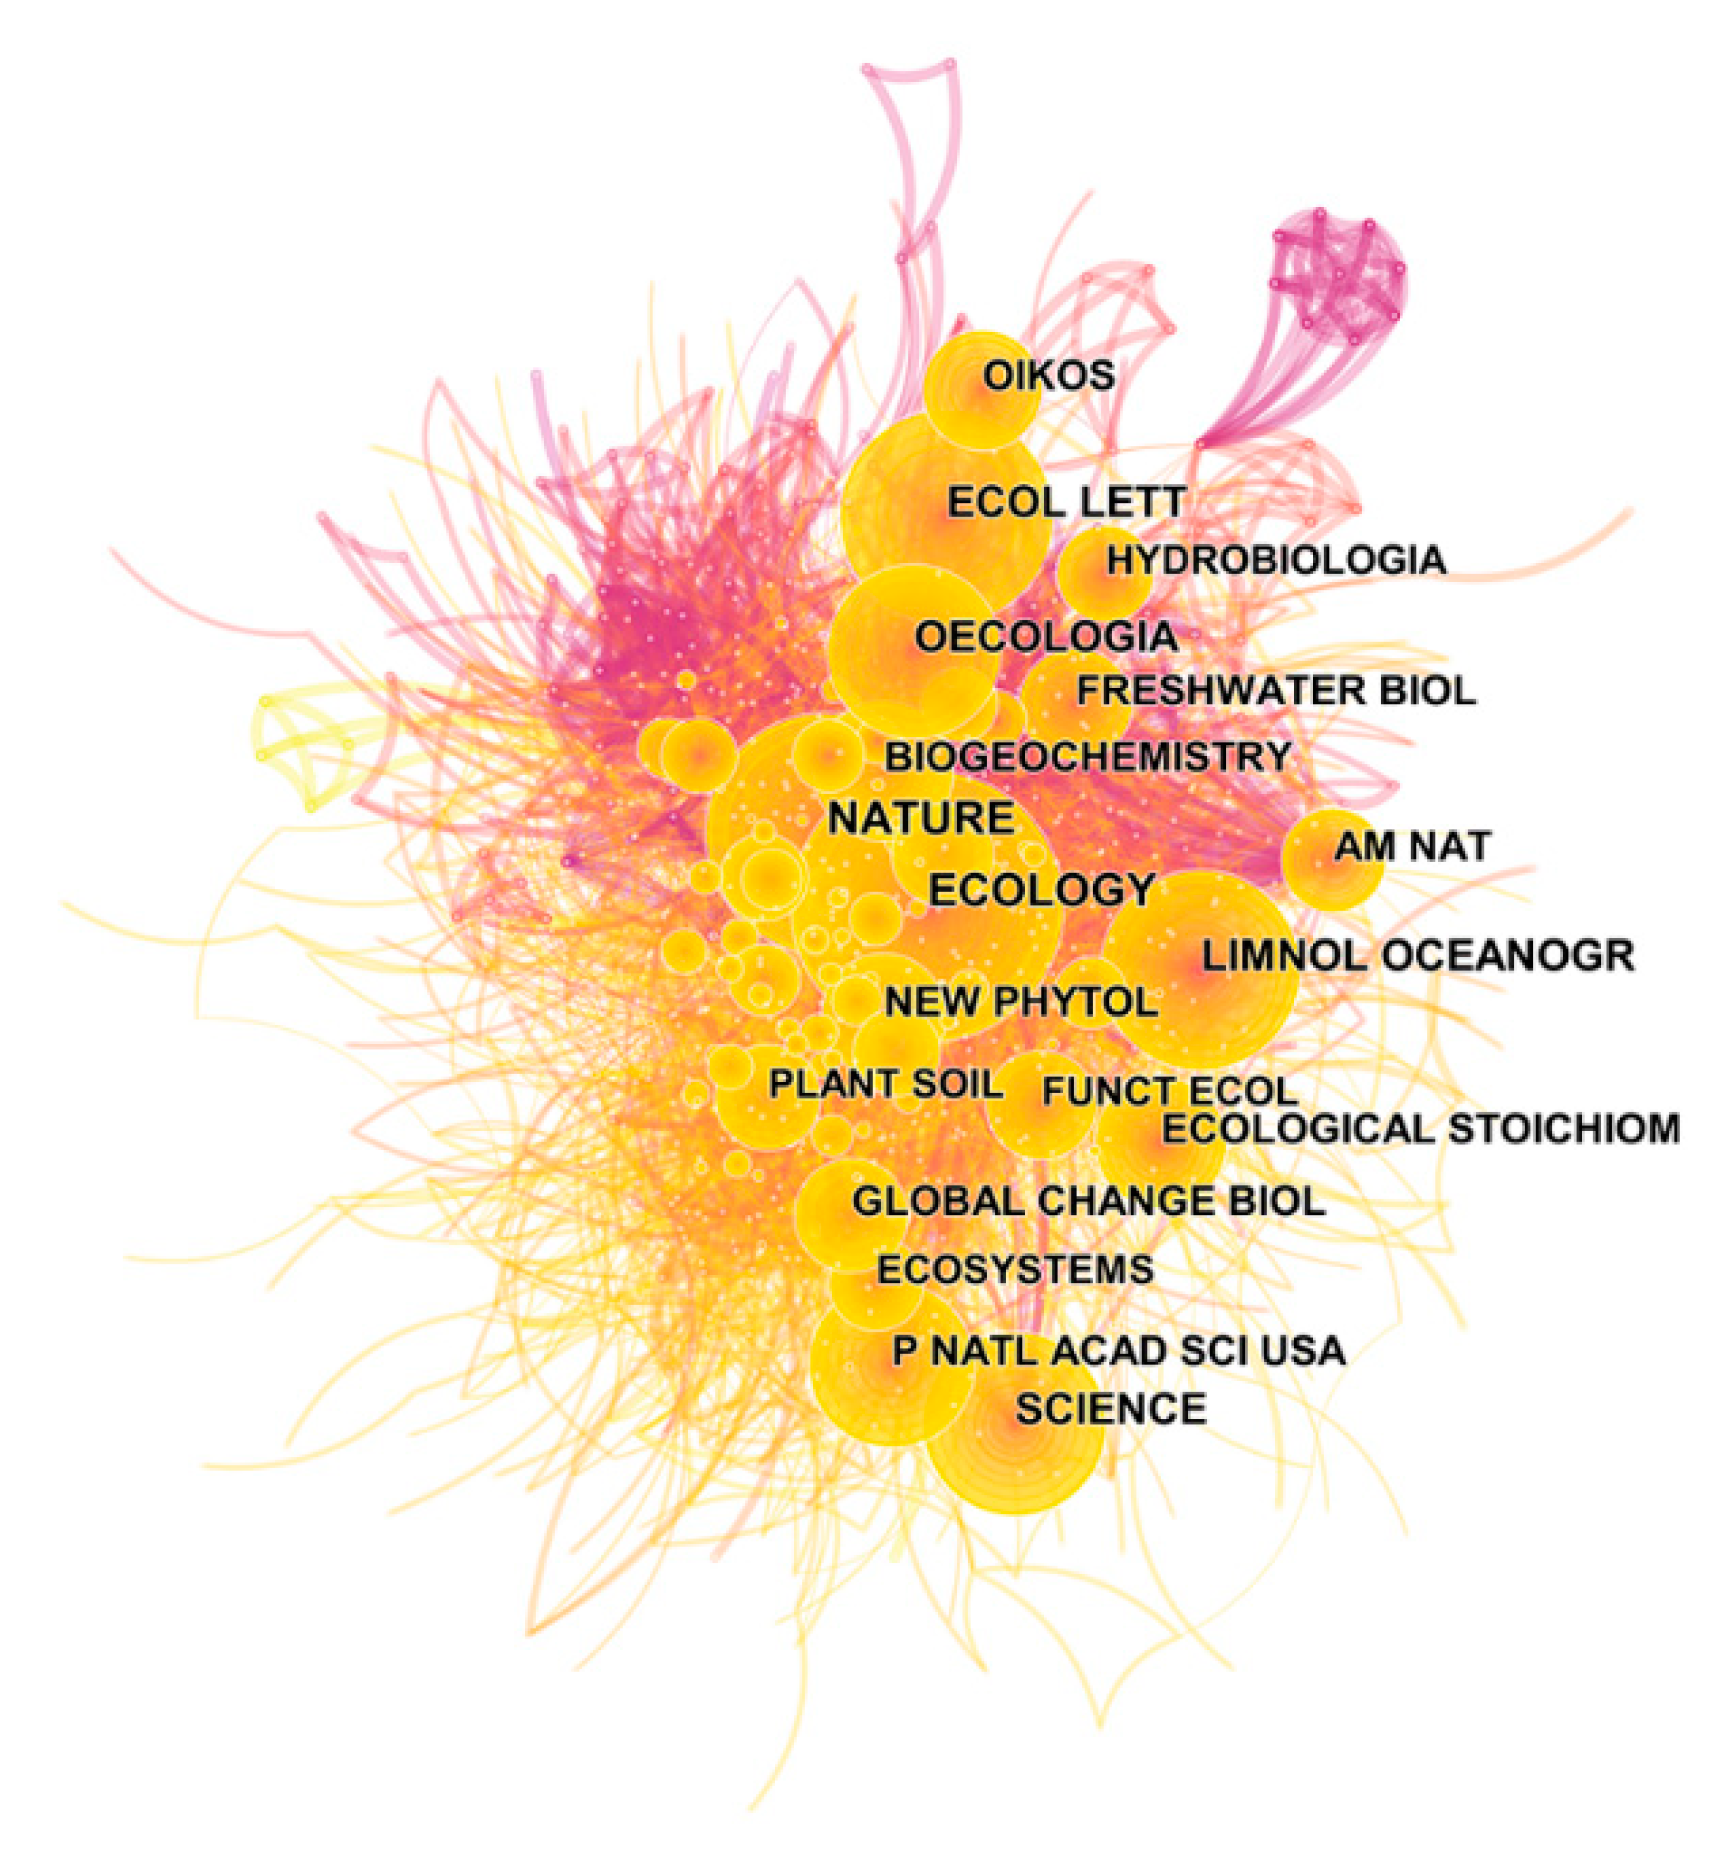
3.1.3. Distribution of Co-Cited Journals for ES Studies
The cited journal map for ES research was obtained via the pruning parameter (pruning based on pathfinder/pruning sliced networks): 1132 nodes and 5774 links were included in the network, and the density was 0.009 (Figure 5). Table 3 presents the number of publications and centrality for the top 15 (of 1122) cited journals that published papers on ES. Ecology (2014) was the most prominent for all co-citations, followed by Nature (1835), Ecology Letters (1627), Limnology and Oceanography (1598) and Science (1489). These findings suggest that a journal with a higher impact factor (IF) may have higher citation frequency. In terms of centrality (Table S3), the American Journal of Science (AM J SCI) (0.05) was the top, followed by Bioscience (BIOSCIENCE) (0.04), Analytica Chimica Acta (ANAL CHIM ACTA) (0.04), Journal of the Fisheries Research Board of Canada (J FISH RES BOARD CAN) (0.04), Analytical Chemistry (ANAL CHEM) (0.04), Ecoscience (ECOSCIENCE) (0.04), Arctic Antarctic and Alpine Research (ARCT ANTARCT ALP RES) (0.04) and Advances in Marine Biology (ADV MAR BIOL) (0.04). Notably, the American Journal of Science (0.05) had the highest centrality in this field (Table S3), which suggests that it was the “core journal” in this field. Interestingly, China had a potentially low number of co-cited journals in this field because there were few highly influential Chinese journals in the ES research field.
3.2. In-Depth Analysis
3.2.1. Distribution of Category Analysis in ES Studies
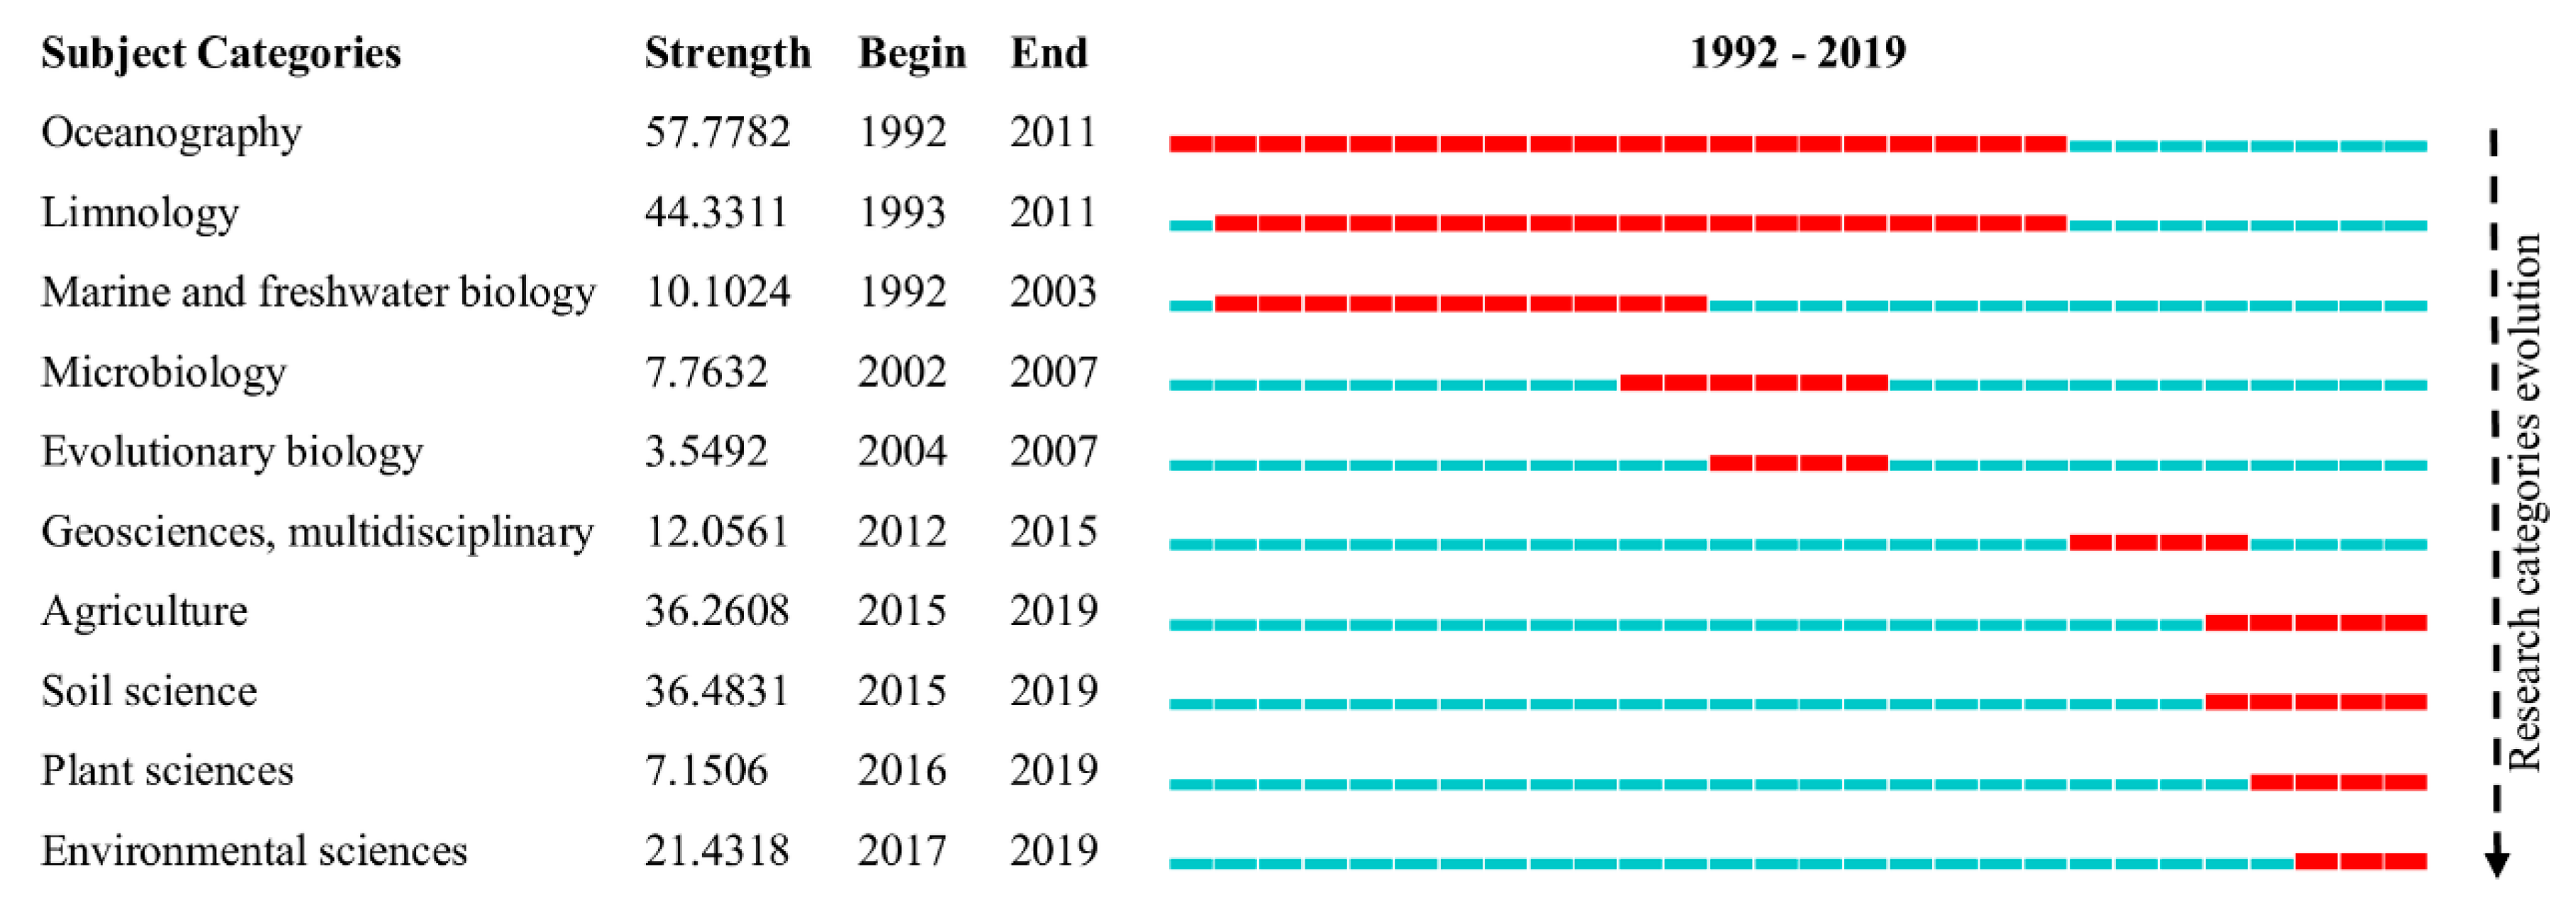
Generally, each article from WoS belongs to one or more categories. There were 54 categories involved (Table S4). Table 4 presents the top 15 categories of studies on ES. Among all the categories, “environmental science and ecology” and “ecology” were involved in the most productive publications (1692 and 1259, respectively), followed by marine and freshwater biology (797). Although the categories of evolutionary biology (94), forestry (93), biodiversity conservation (90) and water resources (72) had lower frequency counts, these categories may provide a new perspective in this field for researchers. In CiteSpace, a node with a high centrality metric in the network of categories is a major point connecting the different categories and may have great effects on the development of some research fields. As shown in Table 4, the “environmental science and ecology” category had the greatest productive centrality, corroborating the predominance of environmental science and ecology studies in the ES field.
Figure 6 shows the bursts of categories in literature on ES obtained from the WoS. Burst analysis is generally used to identify emergent research front in a research field [13]. According to the burst detection algorithm, the contents of ES research have changed recently, since from 2002 onwards, a burst of categories related to multiple disciplines in this field was observed. This burst not only reflects the evolution of ES research but also potential research trends in the ES field. As shown in Figure 6, the study fields shifted from multidisciplinary to pluridisciplinary; after 2002 applied studies on ES increasingly focused on pluridisciplinary aspects. In other words, pluridisciplinary fields have gradually become popular in ES studies. Thus, we hypothesize that the categories of oceanography, limnology and marine and freshwater biology have reached a degree of maturity. As both the theory and technology related to ES have developed, the application of ES has been extended to a wider range of fields.
As can be observed, ES was still mainly investigated in ecology studies, demonstrating a multidisciplinary application in this field’s knowledge development. Furthermore, four of the top 15 categories were related to water resource utilization and protection because the initial study of ES was carried out in the ocean. In 1958, A.C. Redfield demonstrated for the first time that the C:N:P molar ratio of marine plankton remains constant at approximately 106:16:1 [15]. To date, the Redfield ratio in this pioneering research has remained the cornerstone of the study of marine biogeochemical cycles and the foundation for the development of ES research.
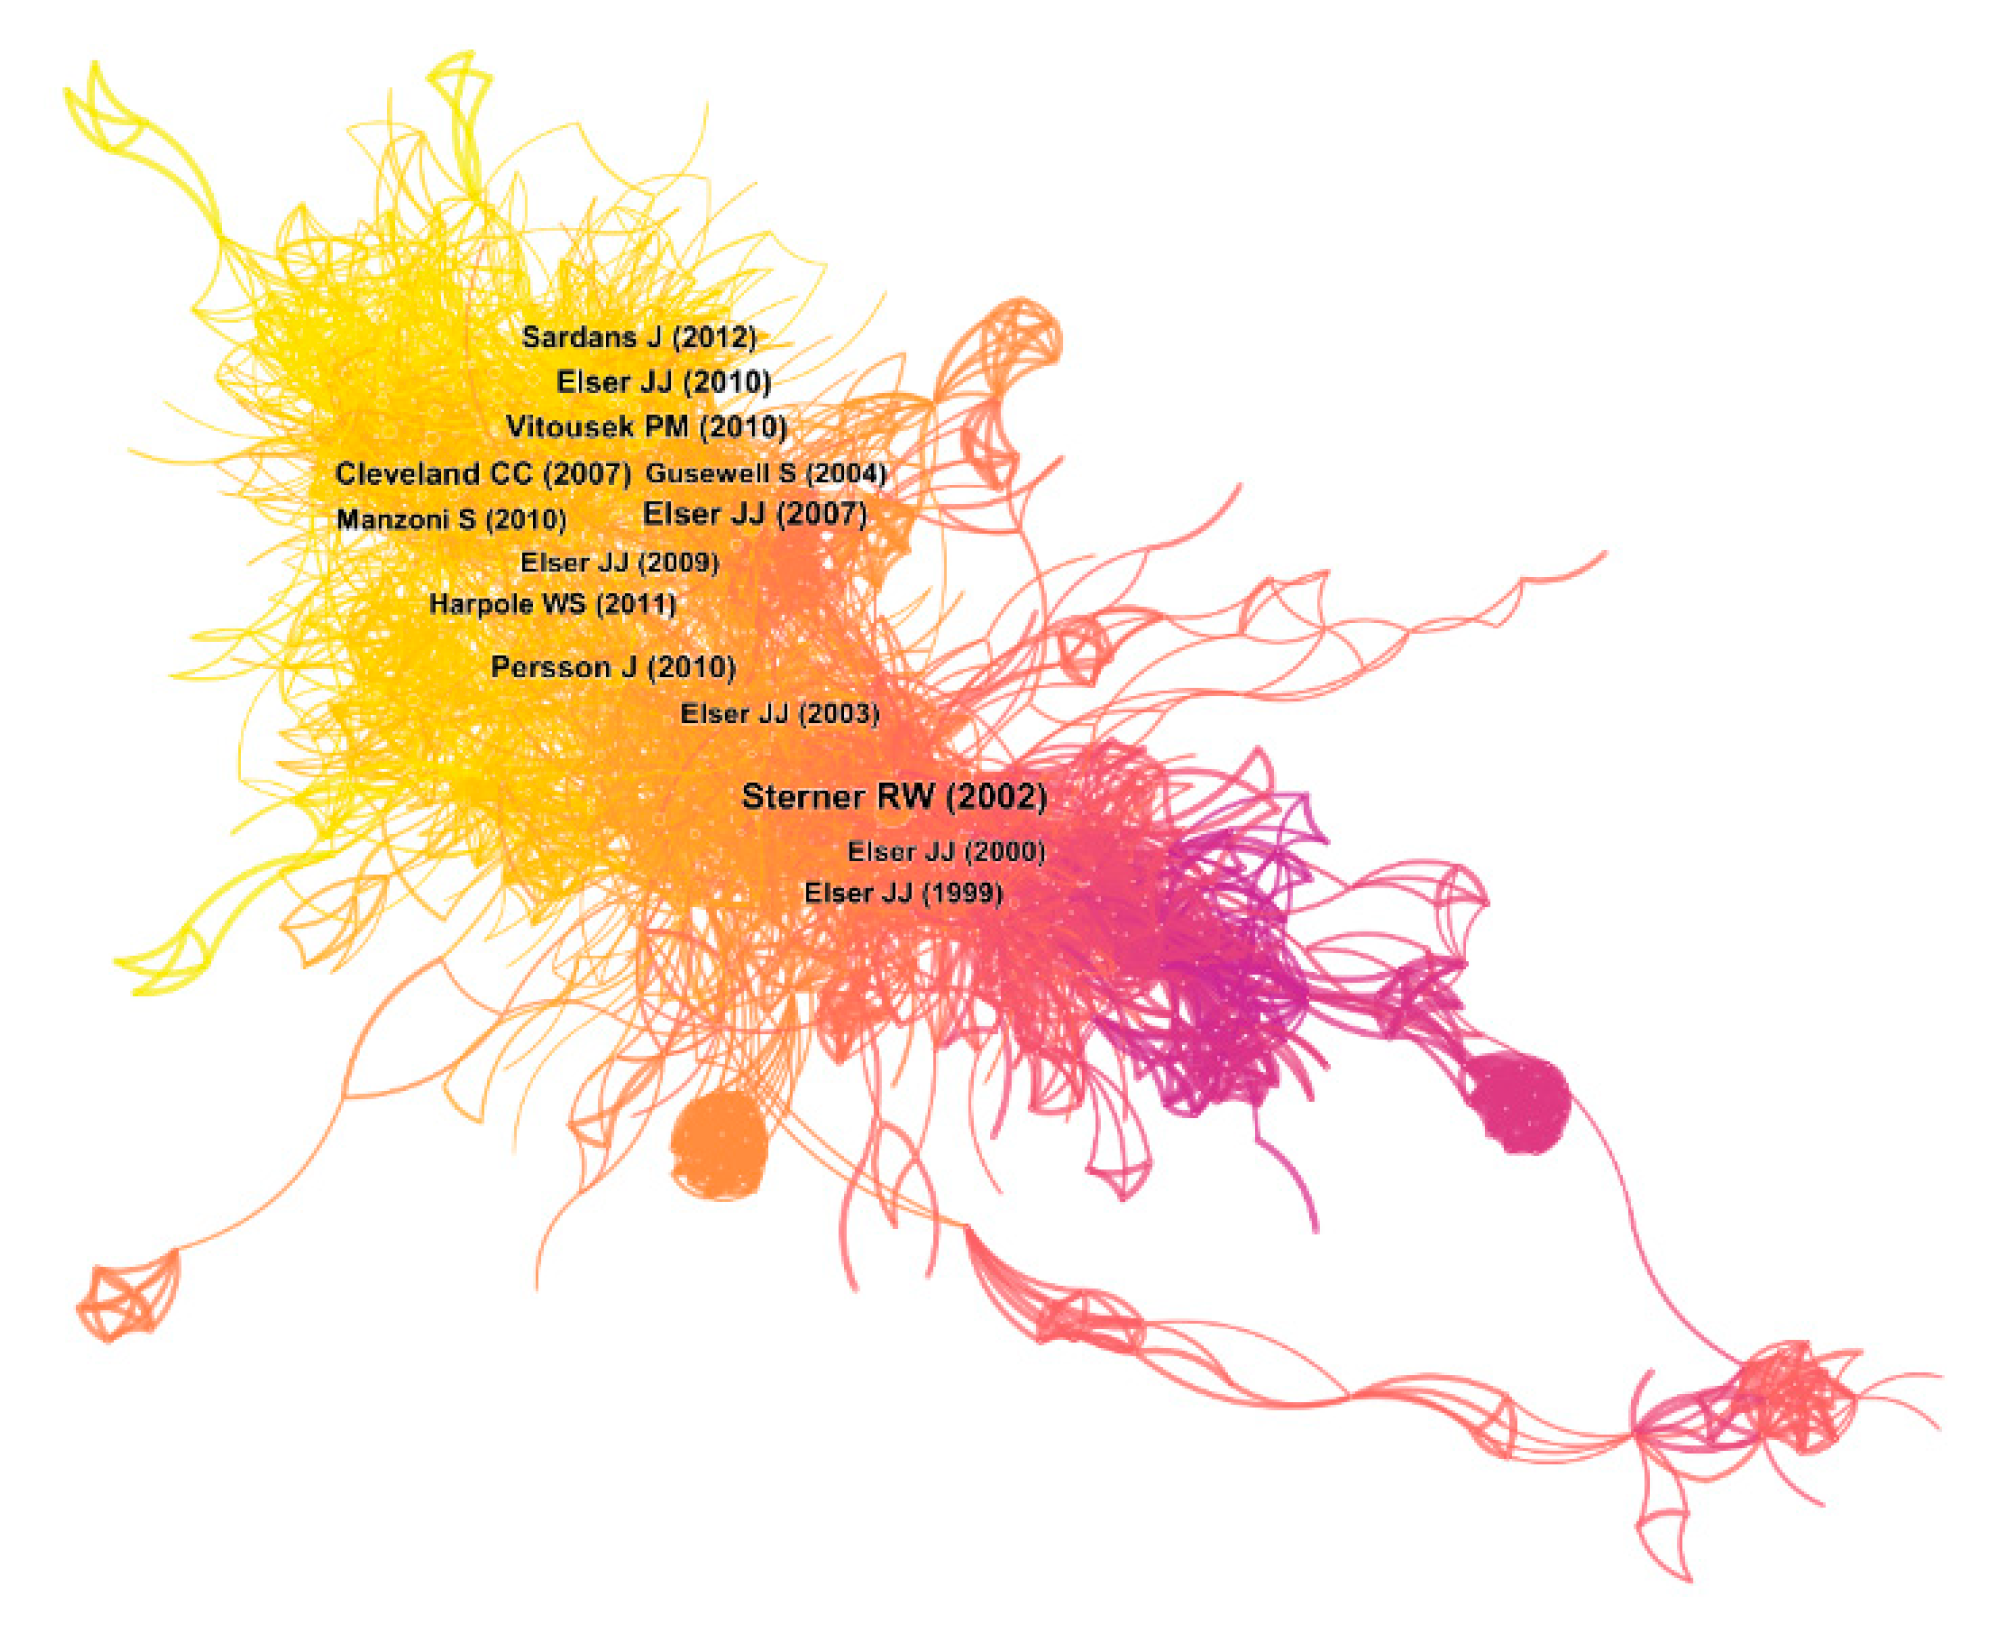
3.2.2. Distribution of Co-Cited References in ES Studies
For bibliometrics, co-cited references analysis is a key indicator. The top 15 (of 1405, Table S5) co-cited references from 1992 to 2019 ranked by count are shown in Table 5. The co-cited reference map for ES research was obtained via the pruning parameter (pruning: none): 1406 nodes and 7580 links were included in the network, and the density was 0.0077 (Figure 7). The most highly “co-cited reference” was a book written by R.W. Sterner and J.J. Elser in 2002 [5] (Table 5), which was cited 4616 times based on statistics from Google Scholar. In this field, the publication of this book marks the systematization and maturity of ES theory. It was followed by a paper written by Elser et al. in 2007. In that paper, according to the meta-analysis, the authors found that N and P limitation are equivalent in terrestrial and freshwater ecosystems [16]. Undoubtedly, these publications have been extremely significant in the development of ES research due to their high citation frequency. The paper with the highest centrality (0.09) was written by Persson et al. in 2010; these authors investigated the regulatory mechanism of stoichiometric homeostasis in autotrophs and heterotrophs, and analyzed food web interactions using the theory of stoichiometric homeostasis [17].
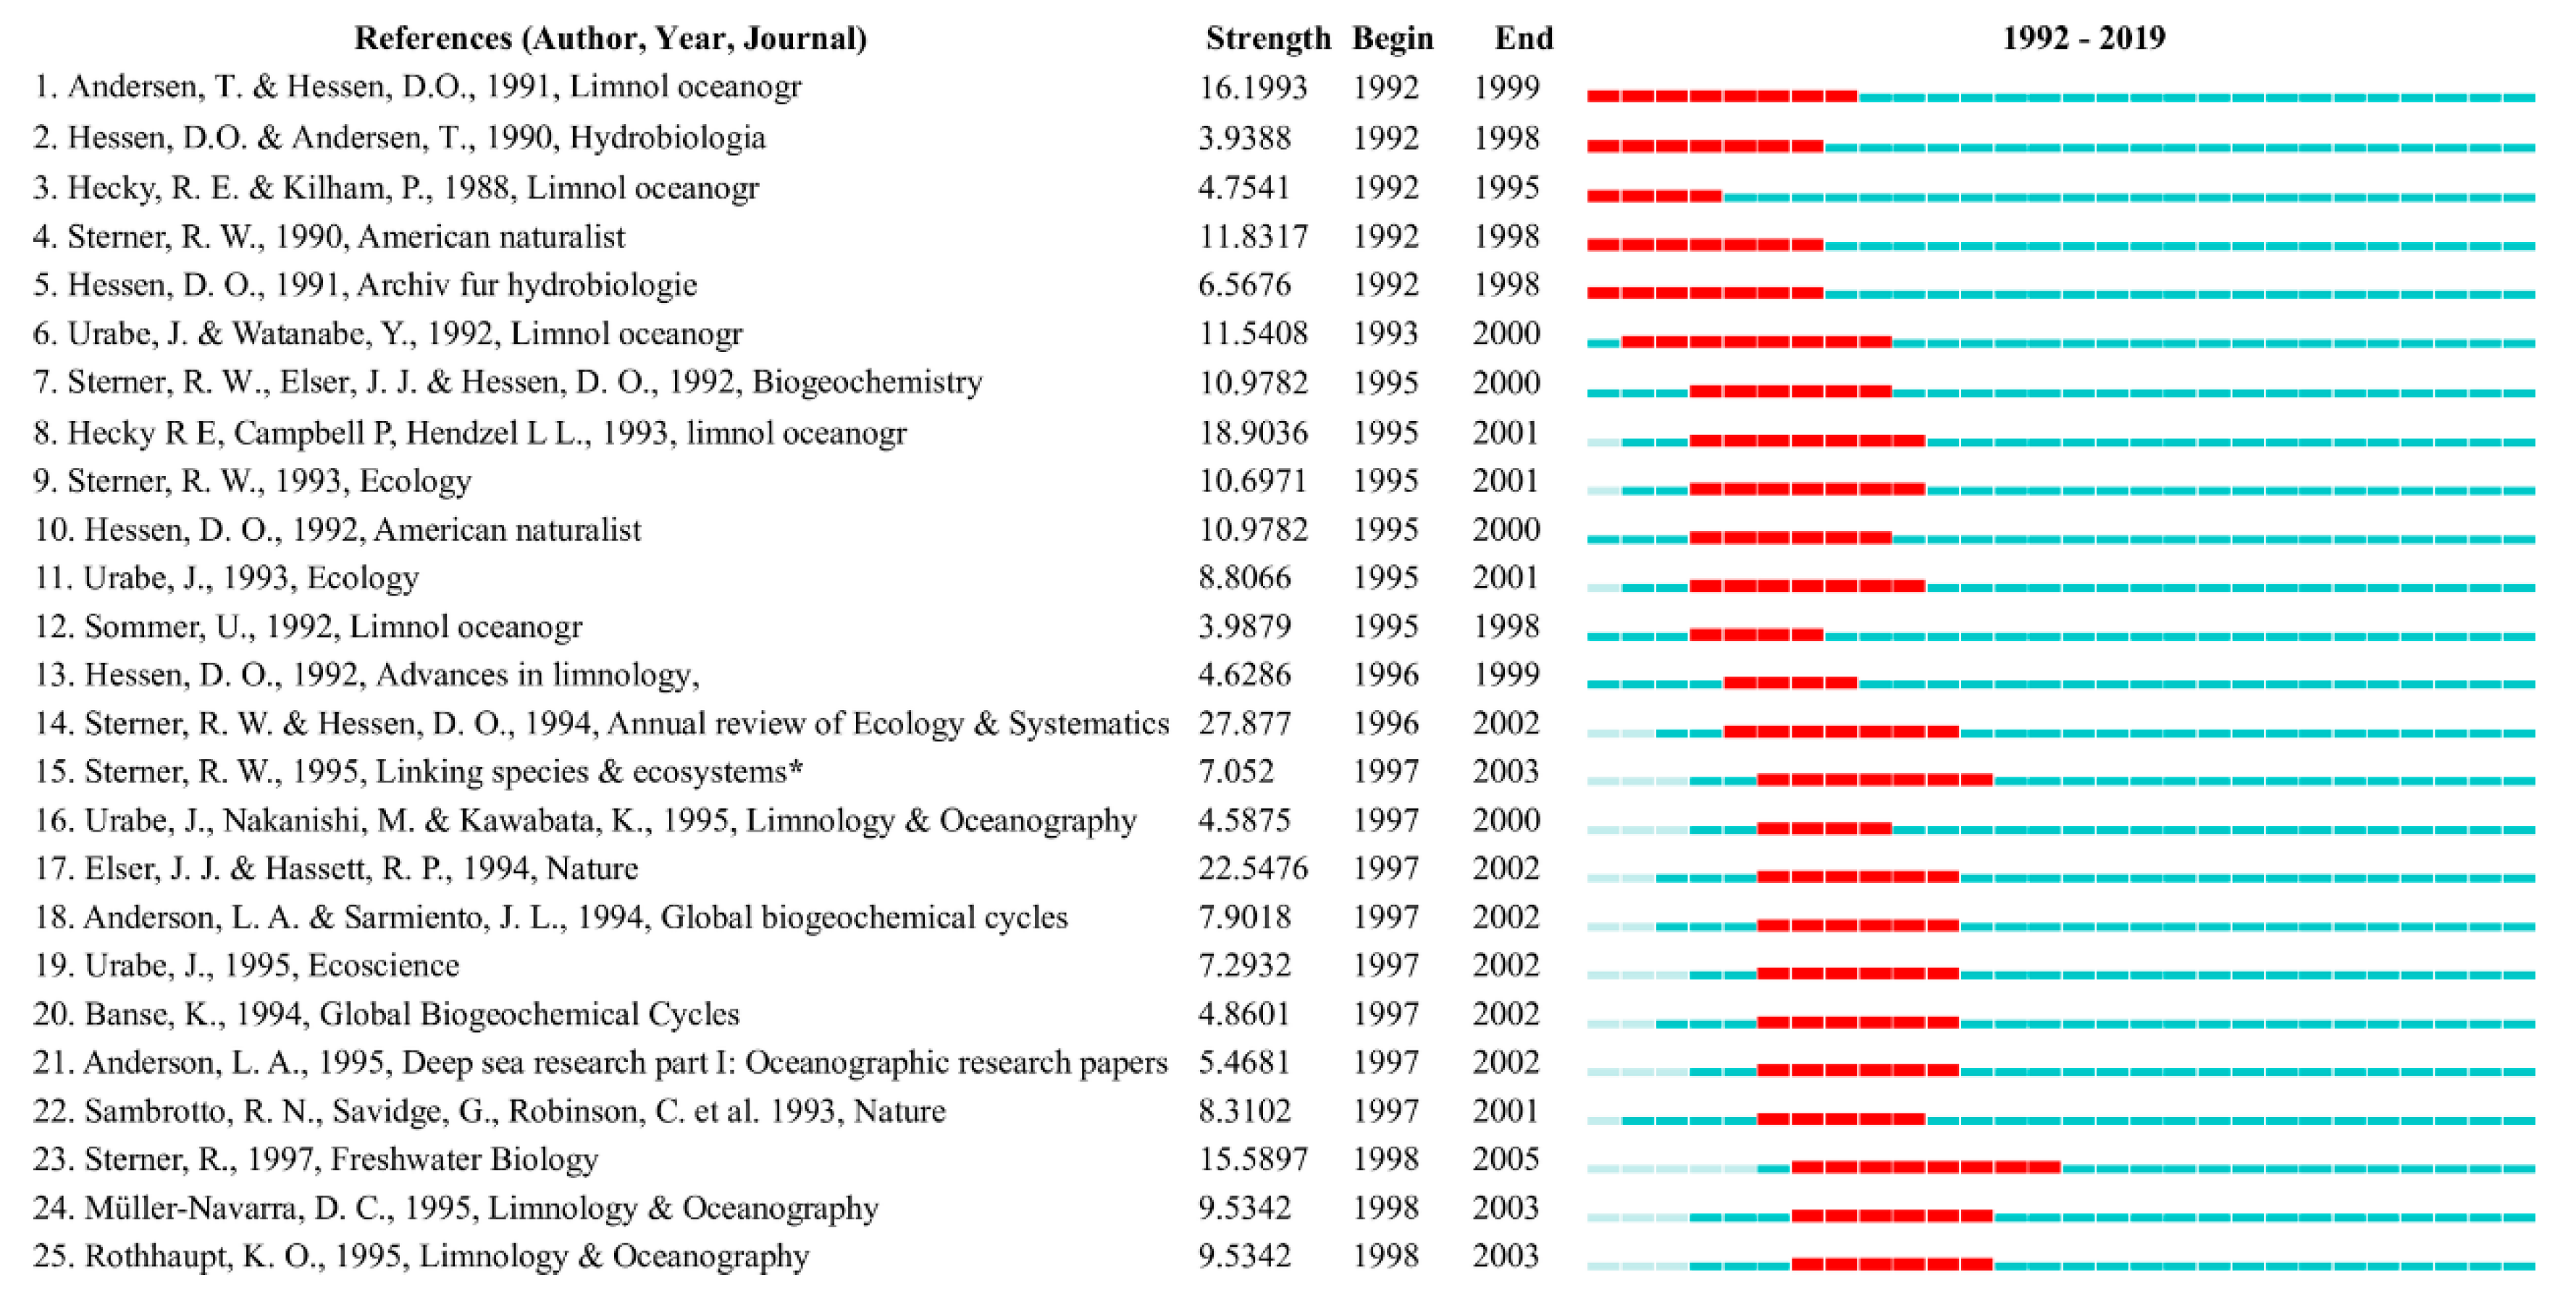
Figure 8 presents the top 25 (of 430, Table S7) co-cited references ranked by the strongest citation bursts. The top reference was written by Sterner and Hessen and published by the Annual Review of Ecology and Systematics in 1994 [18]. This was followed by articles 17 (22.5476), 8 (18.9036), and 1 (16.1993) [19,20,21]. Although these papers mainly focused on the stoichiometric characteristics of aquatic ecosystems, they provided interfaces with other disciplines and played an important role in guiding ES studies. Additionally, the burst of these papers lasted the longest time among the top 25 co-cited references (Figure 8) (see Table 5).
3.2.3. Analysis of Keywords
Keyword Co-Occurrence Knowledge Map
For a paper, the keywords both describe the core content and provide the briefest summary of the content [34]. Generally, keyword analysis is used to gain insights into the main characteristic of a field and can provide a reasonable description of research frontiers and future research orientation [10]. In this paper, we analyzed a keyword co-occurrence knowledge map to elucidate the main direction in the field’s evolution (keywords were extracted from 2831 records). In this paper, the keywords co-occurrence visualization map of publications on ES was obtained via the pruning parameter (pruning: pathfinder): 839 nodes and 1761 links were included in the network, and the density was 0.005 (Figure 9A). The top 15 (of 320) (Table S6) keywords sorted by co-citation counts and centrality from 1992 to 2019 are shown in Table 6. The keywords with the highest frequency count were nitrogen (849/0.05) and phosphorus (760/0.08), followed by carbon (460/0.11), growth (376/0.13), phytoplankton (355/0.05) and nutrient limitation (340/0.02).
According to Table 6, among these keywords, those related to C:N:P stoichiometry, especially N:P (including nitrogen, phosphorus, carbon and N:P stoichiometry) were the most commonly used. ES is a science of studying the balance of energy and various chemical elements (such as C, N and P) in biological systems. At present, researchers generally use this theory to analyze the effect of the mass balance of various chemical elements on ecological interactions [8,35]. Additionally, as the theory on C:N:P stoichiometry originated in studies on aquatic ecosystems, several common keywords were related to aquatic ecosystems, such as phytoplankton (355), fresh water (247) and zooplankton (204) (Table 6). On the one hand, this reflects the importance of ES theory in studies on aquatic ecosystems; on the other hand, it implies that aquatic ecosystems are a promising area for future practical research in this field.
Nutrient limitation, nutrient, limitation, and growth were also high frequency count keywords; these terms are related to the growth rate hypothesis (GRH), which describes the basic manner of ecological stoichiometry control of organisms and involves the basic framework of the evolution of life, cell biological properties, population dynamics, and ecosystem functional mechanisms. Furthermore, the GRH is associated with C:N:P, RNA allocation, and organism life history [1,11,36]. The GRH indicates that N:P is negatively correlated with the plant growth rate but positively correlated with C:N and C:P [24]. Additionally, the N:P ratio is used to determine potential limitation elements in plants, as an N:P ratio less than 14 indicates N limitation, and an N:P ratio greater than 16 indicates P limitation [27,37]. These are constant basic subjects in the ES field.
The keywords climate change, ecosystem, organic matter and dynamic are also important because the change in organism C:N:P is affected by changes in C, N, and P contents in organisms with different development rates, and individuals must change their C:N:P stoichiometry to adapt to changes in their growth rate [8]. In addition, human activities have greatly affected global material cycles, leading to large amounts of N and P and an increase in atmospheric CO2, resulting in climate change on a global scale [38]. Climate change causes a series of changes in the structure and function of different ecosystems [31,39]. For example, global warming leads to the rapid growth of soil microorganisms, which accelerates the decomposition of soil organic matter and provides plants with more available N, thereby promoting plant growth. Thus, C is absorbed from the soil C pool (low C:N) transfer to the plant C pool (high C:N) [40,41]. Furthermore, climate change alters the C:N:P characteristics of the ES of primary producers and changes microbial decomposer communities. Such changes then affect the decomposition, transformation, and recycling of organic matter in the ecosystem [42]. Therefore, the responses and adaptive mechanisms of life in different ecosystems under the background of climate change are the key focus of current research.
Keyword Cluster Analysis
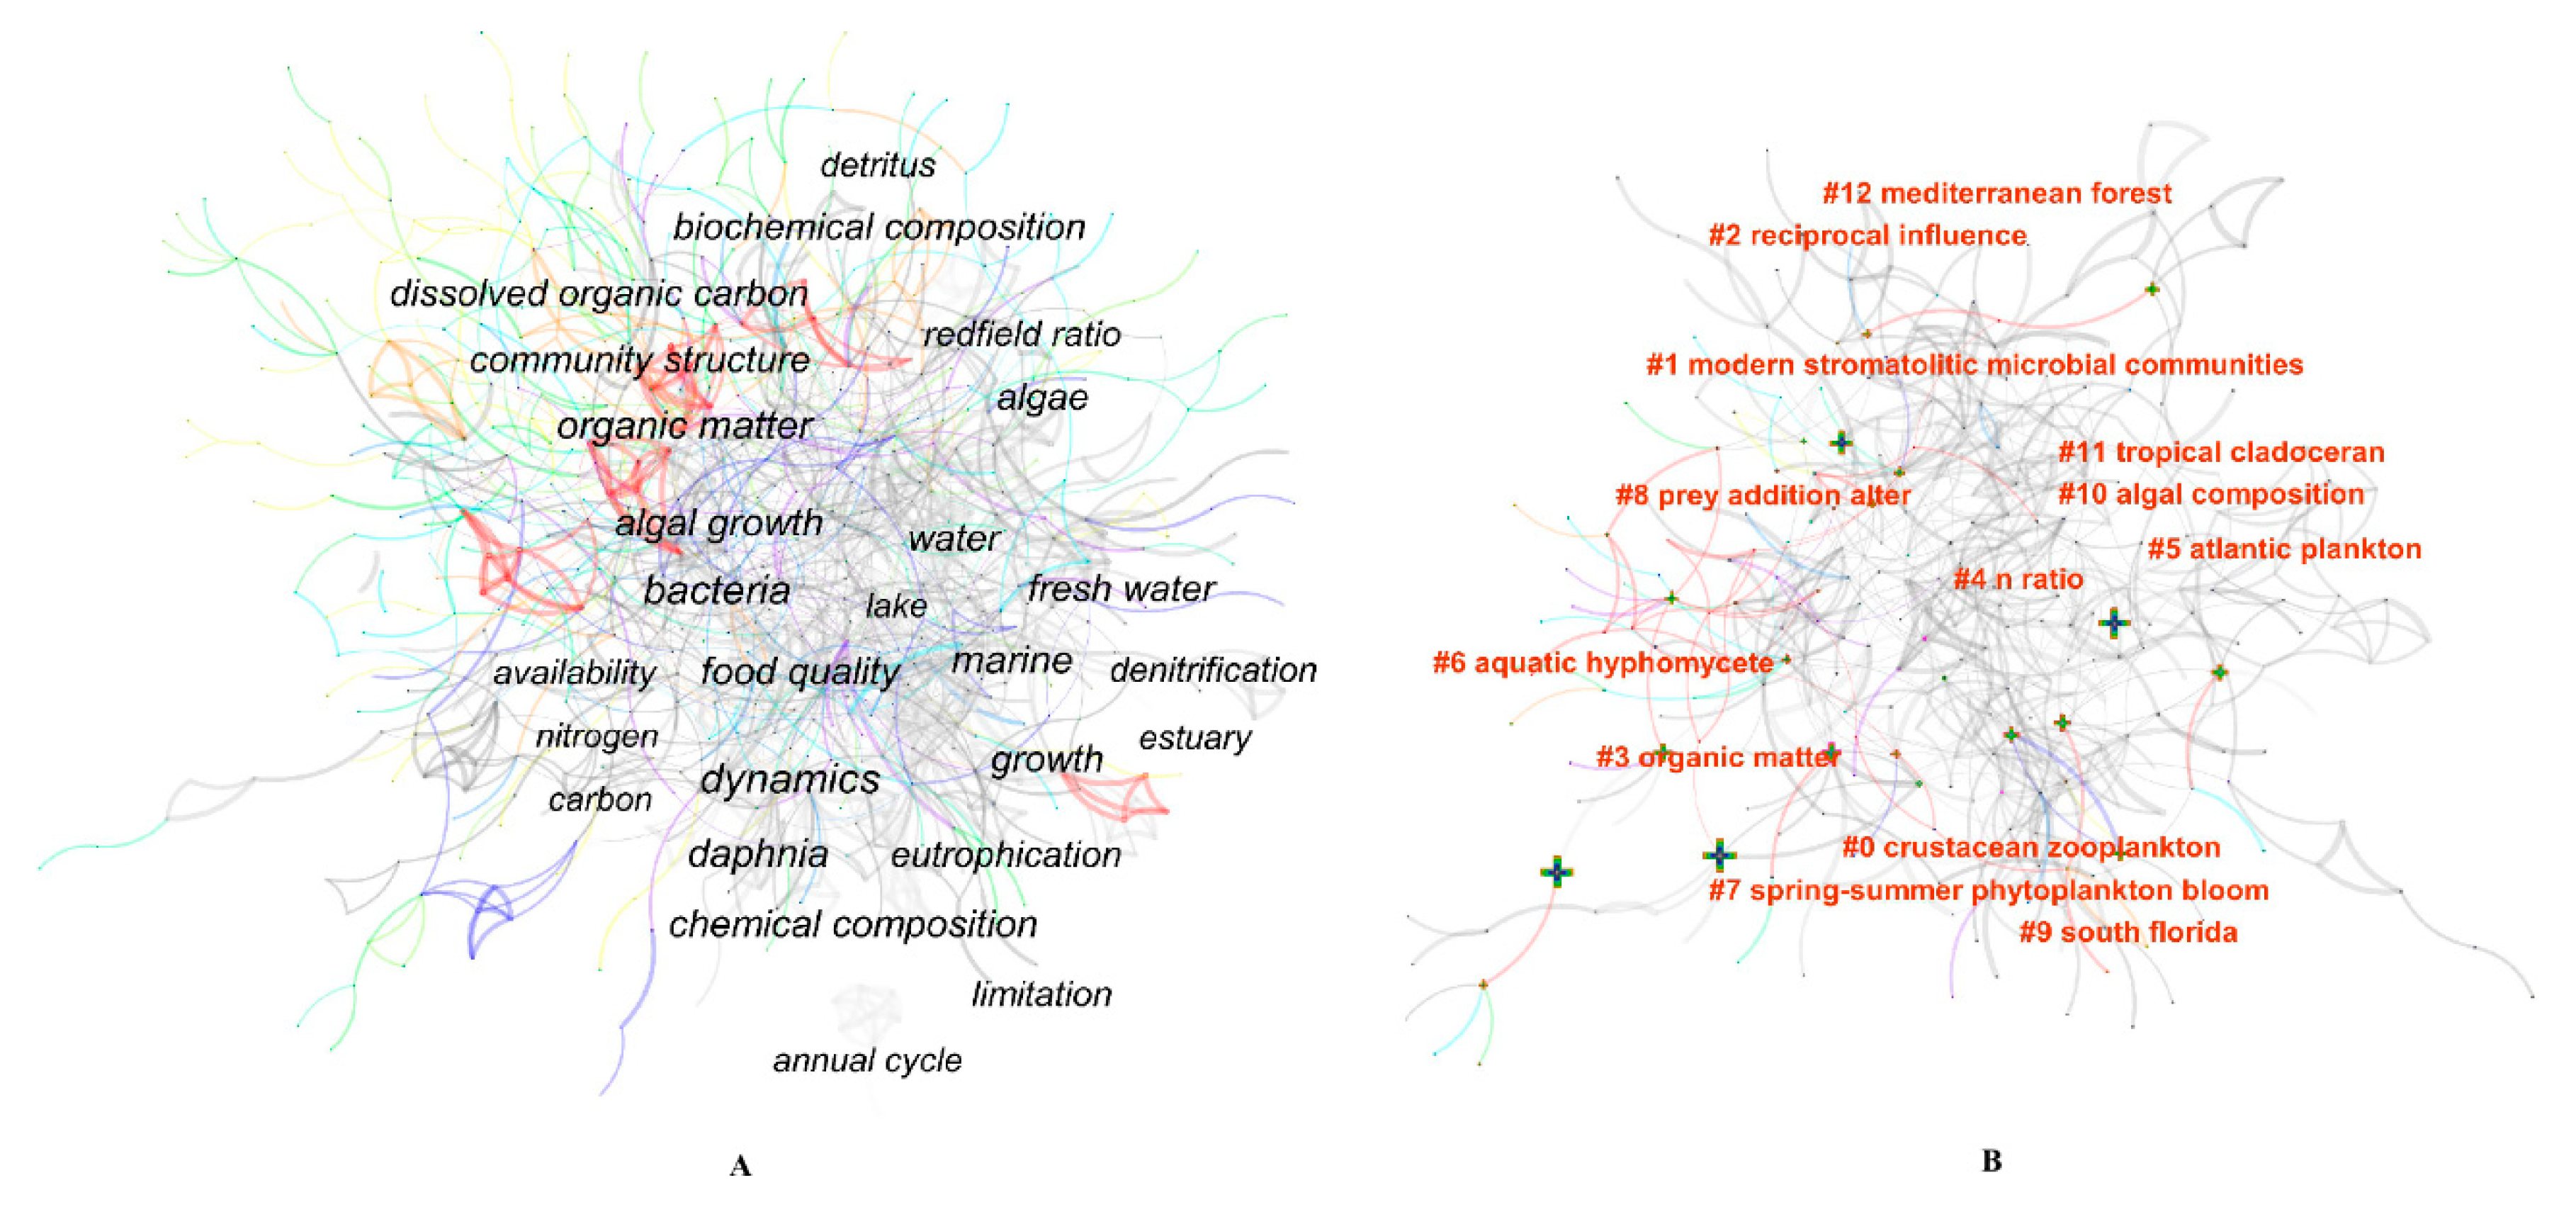
The keyword cluster is generated by CiteSpace and can reflect hot research fields in a discipline [43]. In this paper, keywords cluster analysis was performed using the CiteSpace clustering function. In the cluster analysis, the modularity Q and the mean silhouette were 0.6828 and 0.8134, respectively, indicating that the clustering structure was significant, and the clustering results were relatively accurate and convincing. The 13 main clusters are shown in Figure 9B, and the information about the 13 co-occurrence clusters of keywords is shown in Table 7. To understand the major research fields of ES research and to better understand the cluster analysis results, the 13 clusters were divided into three classes as follows:
- (1)
- Consumer stoichiometry and nutrient cycle. These include #0 crustacean zooplankton, #4 N ratio, #5 Atlantic plankton, #6 aquatic hyphomycete, #7 spring–summer phytoplankton, #9 South Florida, #10 algal composition and #11 tropical cladoceran. Consumer stoichiometry and nutrient cycles have been a hot topic in ES research in recent years. By applying ES to expound the nutrient cycling process, researchers can understand the roles of consumers in ecosystems. Ecosystem feedback between biological factors (such as consumer stoichiometry) and environmental factors (such as resource stoichiometry) in biological systems is under homeostatic regulation, and has effects through a reciprocal influence of the supply and demand balance of elements between organisms, and between the organism and the environment. From studies on marine life, for example plankton (phytoplankton and zooplankton) [44,45,46], aquatic hyphomycetes [47,48], algae [49,50] and daphnia [51], our understanding of consumer stoichiometry, consumer population stability and community organization structure has greatly increased. However, large variations have been observed in the nutrient content of autotrophic organisms in different life periods, leading to large variations in stoichiometric ratios (such as C:N:P). Generally, the nutrient content of consumers varies over a small range, meaning that the C:N:P of these organisms is usually maintained within a relatively fixed range.
When there is an imbalance in the stoichiometric ratio between consumers and their food, the growth and activity of consumers will change [52]. Studies have shown that low food quality (high C:N or C:P) significantly reduces the growth rate of consumers [32,53]. For example, the growth rate of daphnia fed algae with a high C:P is limited by P [32]. Previous studies have indicated that consumer stoichiometry balances have effects on both nutrient dynamics [54,55] and biogeochemical cycles in food webs [56]. Recently, the application of ES in studies on consumer-driven nutrient cycling has increased. The interaction of consumer stoichiometry and nutrient cycles in terrestrial ecosystems has also become a central topic in the ES field. Studies have shown that the stoichiometric relationships among elements can regulate the net mineralization rate and resorption of nutrient elements [57,58], and it can affect interactions among different organisms such as flagellates and bacteria [59].
The nutrient availability and supply affect productivity, biological composition, biodiversity, species dynamics, and interactions among different species (such as the interaction among plants, animals and microbes) in different ecosystems [60]. Therefore, the determination of limiting elements that affect organism growth, organism life history, community structure and community stability has become a prerequisite to determining the stability of a system. Generally, a change in C:N:P denotes a change in the limiting elements for autotrophic organisms. From the change in C:N:P, we can determine the limiting elements for organism growth, development, or reproduction [27]. For example, it was initially thought that N was the limiting element in the ocean [61]. However, due to global climate change, the increase in N in the atmosphere has altered the N balance in the marine ecosystem and led to an increase in N:P, thereby causing P to become the limiting element in the ocean [62].
- (2)
- Biogeochemical cycles of C, N and P. These include #1 modern stromatolitic microbial communities, #3 organic matter, #9 South Florida, and #12 Mediterranean forest. The biological C:N:P significantly influences the global C and nutrient cycles. The ratio of C (in biomass) to other nutrient elements can regulate the transport of organic matter in an ecosystem. At present, human activities significantly affect global biogeochemical cycles. It is necessary to quantitatively evaluate the effects of human activities on C:N:P in an ecosystem. ES theory has become a useful tool for researchers to understand the effects of human activities on biogeochemical cycles and the biosphere, and it allows better predictions of the coupling relationship of C, N, and P in different ecosystems [5]. Previous studies have indicated that global C:N:P in the natural process is maintained at a stable level of 20333:43:1. However, under human perturbations, it decreases to 667:12:1 [38]. This change indicates that the biogeochemical cycle process is highly variable on both temporal and spatial scales.
Moreover, to analyze biogeochemical cycles, researchers used microbial mats to study the evolution process of life because they can provide evidence that is representative of the early fossil record of Earth [63]. Stromatolites (modern stromatolitic microbial communities) are a primary system used to reconstruct Earth’s early environments [63,64].
In terrestrial ecosystems, C, N, and P cycles are primarily studied in forests to describe the absorption, release, and circulation of nutrients. Forests are the largest carbon pool in terrestrial ecosystems and tropical forests are predicted to account for the vast majority of primary production (approximately 70%) in terrestrial ecosystems [65]. Studies have shown that the ratio of C to nutrients in litter is greater than that in leaf, which indicates that nutrient resorption is a primary nutrient cycling mechanism for terrestrial vegetation [66]. In recent decades, due to the increasing human activities and forest degradation in the Mediterranean region and other regions worldwide, the ecological value and ecological role of the forests in these regions have decreased. Therefore, researchers have explored forest succession and degradation via ES theory [67,68]. However, the complexity of terrestrial ecosystems makes them difficult to understand [60,69]. Thus, further studies are required to clarify these queries.
- (3)
- Others. For example, the #2 reciprocal influence and #8 prey addition alter are generally common content and methods in ES research. For example, studies have indicated that prey addition shifted carnivorous plants from P limitation to N limitation under ambient conditions [70]. The “reciprocal influence” (interaction) is also a research focus in ES research. As mentioned above, the reciprocal influence of organism and organism, and of organism and environment, are affected by consumer stoichiometry and resource stoichiometry.
Keyword Burst Analysis
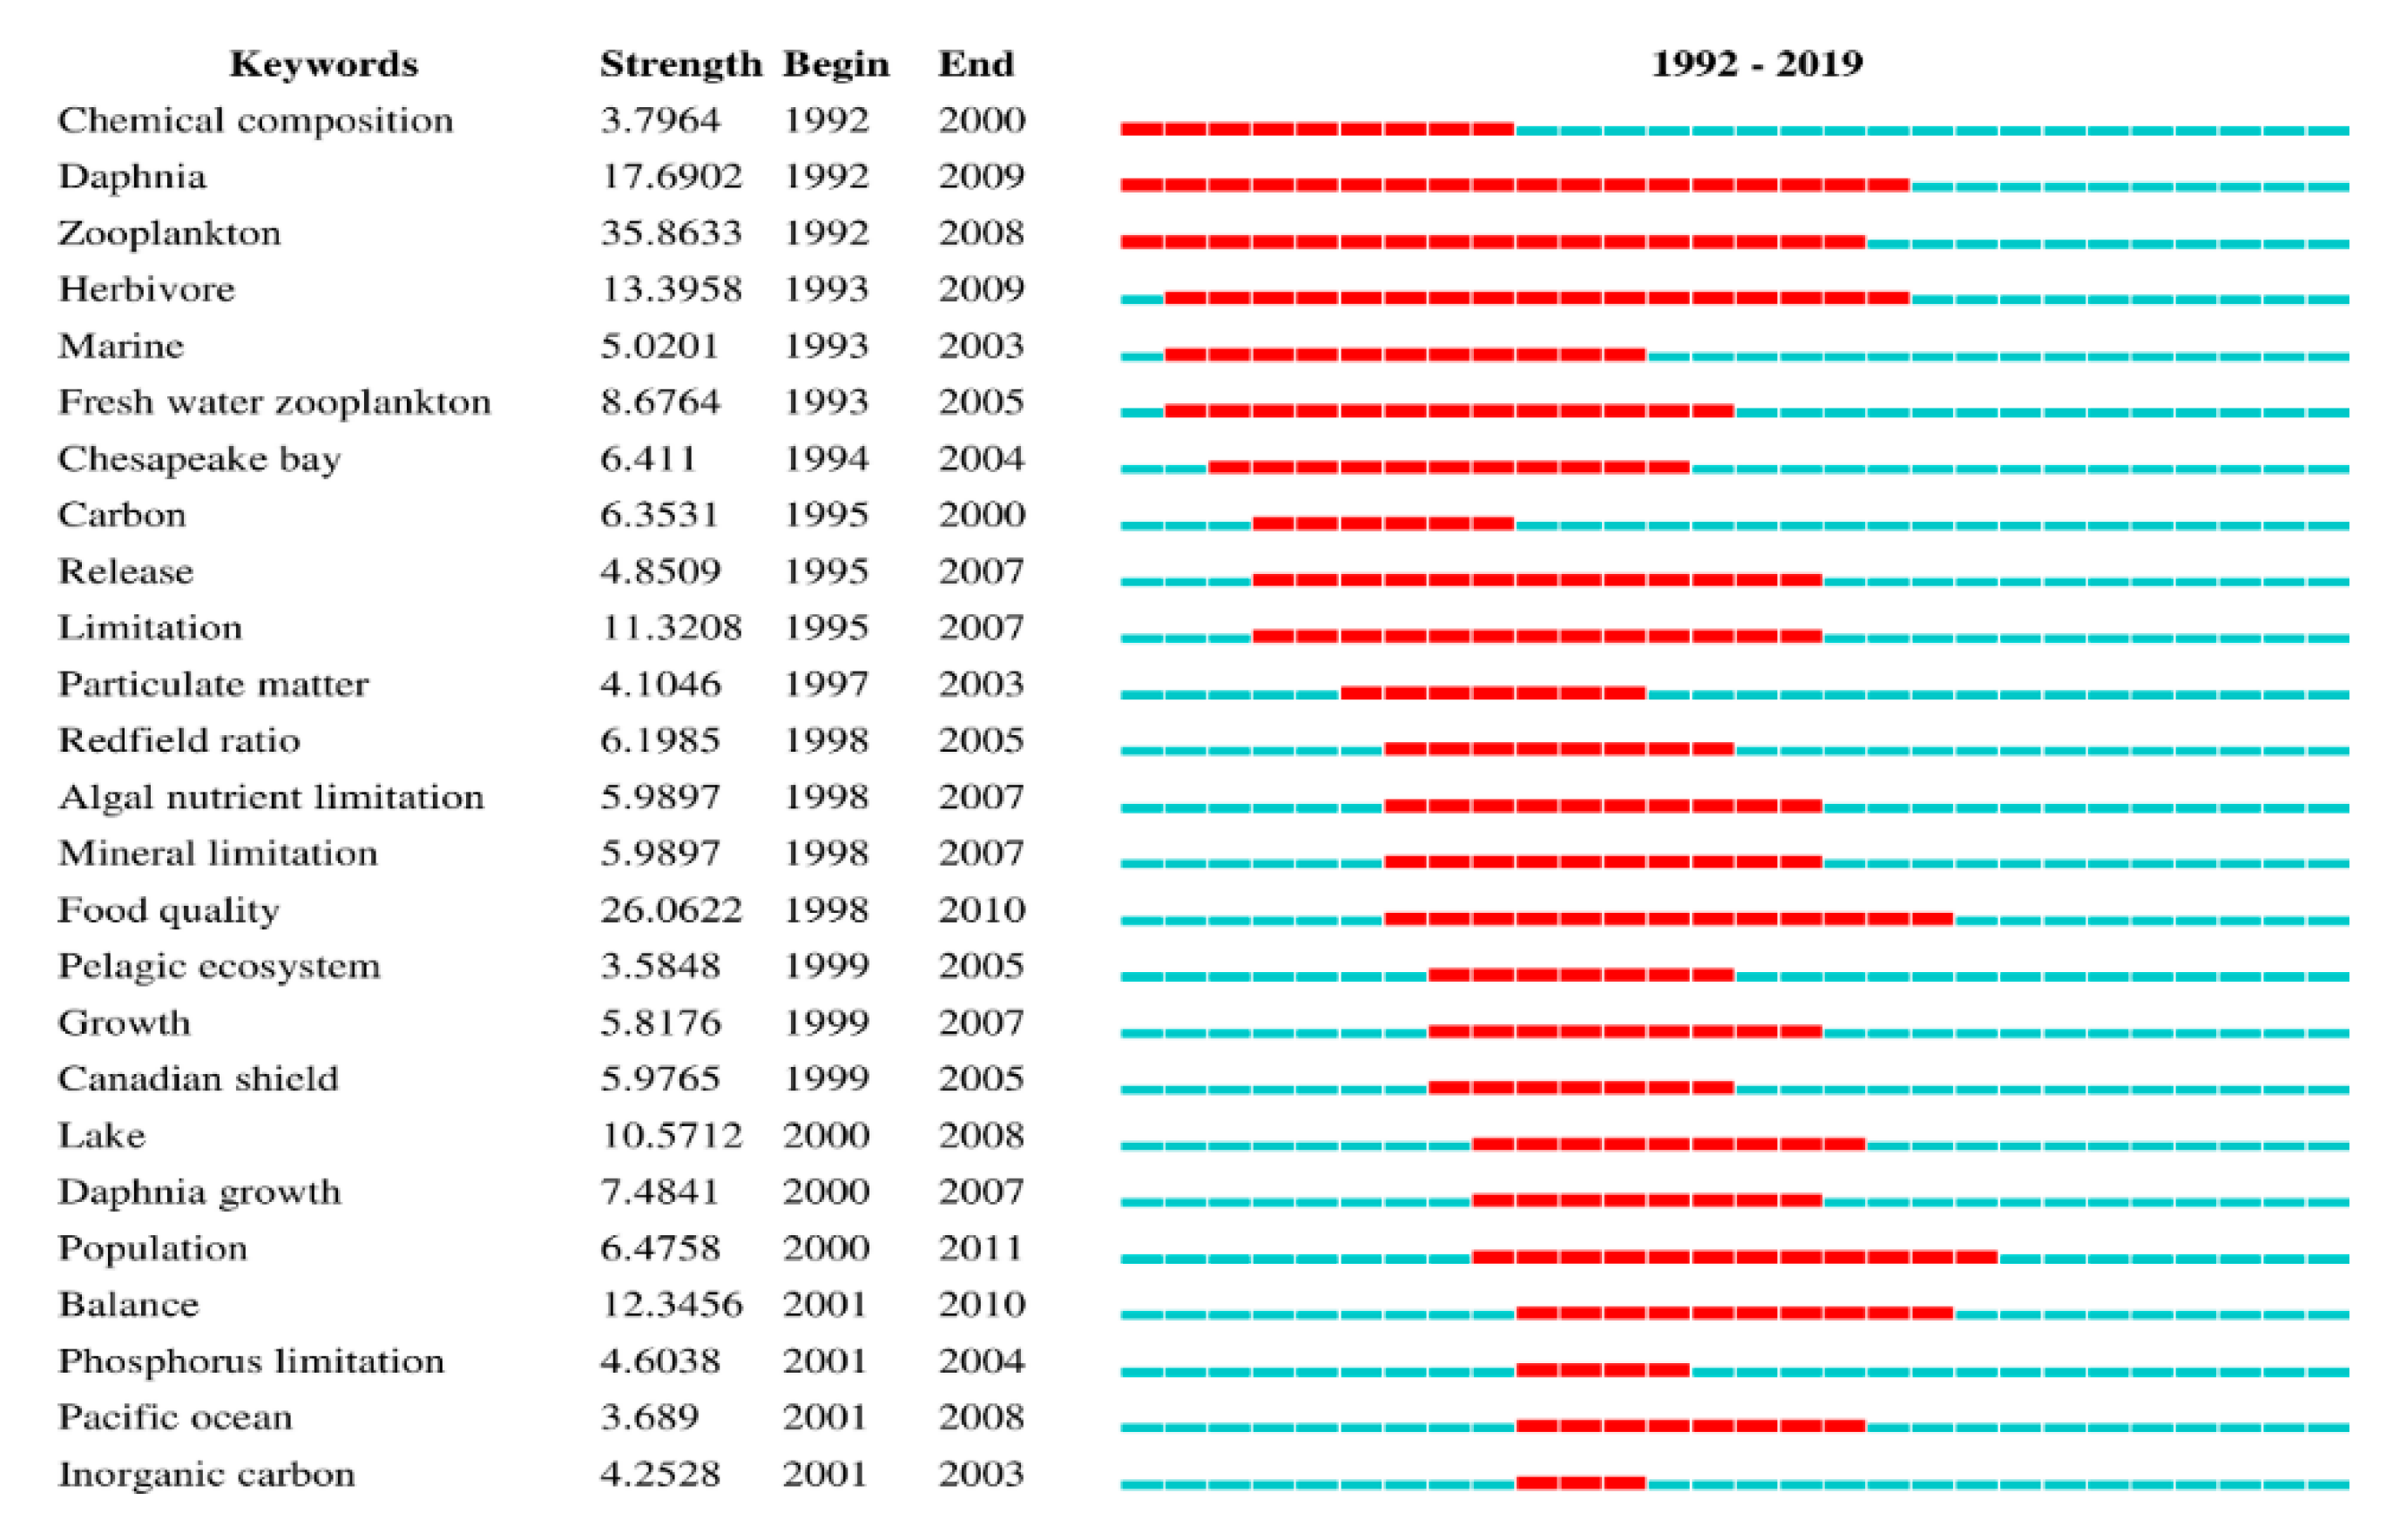
Keyword burst can be used as an indicator of the evolution of research hotspots. In this paper, keyword clustering was analyzed with CiteSpace. The top 25 keywords (of 144, Table S8) are presented in Figure 10. According to Figure 10, zooplankton (35.8633) had the strongest keyword burst, followed by food quality (26.0622), daphnia (17.6902), herbivore (13.3958), balance (12.3456), limitation (11.3208) and lake (10.5712). However, the longest period of a keyword burst was for daphnia (18), followed by zooplankton (17), herbivore (17), freshwater zooplankton (13) and release (13). In summary, we observed that the study of consumer stoichiometry and nutrient cycles has focused on aquatic ecosystems. With the development of ES theory, researchers have changed their focus from aquatic ecosystems to consumer stoichiometry and the nutrient cycle in other ecosystems. For example, researchers have used ES theory to examine the response of grassland ecosystems [71,72], forest ecosystems [73,74], and farmland ecosystems [75] to climate change. Through this research, our understanding of consumer stoichiometry and nutrient cycles in different ecosystems has gradually improved, and a deeper understanding of biogeochemical cycles has been achieved.
According to Table S8, we can observe that ES theory is applied to all aspects of ecology research and may make great contributions to interdisciplinary research fields, including nutrient dynamics [18], microbial nutrition [58], host–pathogen relationships [76], symbiosis [77], comparative ecosystem analysis [78], consumer-driven nutrient cycles [30], population dynamics [79], forest succession and recession [80], nutrient supply and demand balance [81], and nutrient limitation and carbon cycling [52]. Furthermore, in the analysis of species competition [82], top-down effects [83], nutrient reabsorption [84], interactions between primary producers and consumers, the N cycle, ecosystem feedback mechanisms [85,86], species invasion [87] and characteristic plant stoichiometric responses to climate change [88], ES theory has become an effective tool and provided new ideas for studying consumer stoichiometry, nutrient cycles and biogeochemical cycles. According to the timelines of the co-occurrence keyword bursts, the application of ES has also changed from a single-discipline and single-field research to multidiscipline and multifield research (Figure 10).
4. Conclusions
In conclusion, ES provides valuable information to understand nutrient cycles and exchange processes across all biological scales. Applying aspects of ES theory can help us understand the interactions between organism and organism, and between organisms and the environment, at multiple levels, including the ecosystem level.
This paper explored research on ES from 1992 to 2019 from a bibliometric perspective. In this paper, we used a bibliometric review to clarify the main characteristics of the ES field, elucidate potential trends, and identify potential hotspots for future studies. In comparison to traditional reviews, analysis based on bibliometric software provides better insight into the focus and trends of ES research. However, there are certain limitations to CiteSpace analysis. For example, several keywords in the result were similar and had to be merged together during the analysis. Moreover, some keywords used for retrieval may have been present in the literature that did not match the topic of interest, and these keywords had to be removed before analysis. Undoubtedly, visualization analysis offers valuable information to future researchers. To a certain extent, our understanding of ES was advanced by this visualization analysis, helping us to identify the potential research focus and trends in the ES field.
The descriptive analysis revealed that authorship was distributed in different fields, and the number of publications on ES increased in recent years. Furthermore, the topic of ES is still widely discussed in many conferences, which indicates that ES research has been far from exhausted. In addition, the influence of China, with a country rank indicating a high yield in terms of academic production, was very low due to the few partnerships of Chinese authors with authors in other countries and its few influential academic publications.
The in-depth analysis revealed that research on ES has developed rapidly from 1992 to 2019 and showed a tendency towards a multidisciplinary amalgamation of its contents and methods. According to the bibliometric analysis, ES has been applied mainly to aquatic ecosystems. However, with the development of ES theory, ES research in the fields of environmental science and ecology, agriculture, plant sciences, soil sciences, microbiology, evolutionary biology, and forestry has increased gradually in recent years. Furthermore, we observed a migration of the field from a single-discipline approach to multidisciplinary and interdisciplinary approaches. We believe that with the development of ES theory and its increasing application in different fields, our understanding of the biological origins, evolution, life-processes, and balancing mechanisms of nutrient supply and demand at the ecosystem level will be greatly improved.
However, several questions still exist in ES research:
- (1)
- Studies on plant ecological stoichiometric characteristics have mostly focused on N and P, as their stoichiometric ratio is generally used as an indicator to determine limiting factors for plant growth, and few studies have evaluated C along with N and P.
- (2)
- Macroelements (C, N, and P) have typically been the focus of ES research, with few studies on the stoichiometric characteristics of essential trace elements for plant growth.
- (3)
- Our understanding of many ecological processes is poor. For example, how do the stoichiometric characteristics of ecosystems respond to global climate change? What are the regulatory mechanisms underlying the stoichiometric characteristics of ecosystems?
Supplementary Materials
The following are available online at https://0-www-mdpi-com.brum.beds.ac.uk/2071-1050/12/21/8909/s1, Table S1: Countries/regions and institutions involved in ES research that were extracted from the WoSCC (xlsx), Table S2: Authors and cited authors involved in ES research extracted from the WoSCC(xlsx), Table S3: The involved cited journals that were extracted from the WoSCC (xlsx), Table S4: Categories that were identified by CiteSpace (xlsx), Table S5: The Co-cited references that were identified by CiteSpace (xlsx), Table S6: Keywords that were identified by CiteSpace (xlsx), Table S7: Top 430 references that were identified by CiteSpace (DOC), Table S8: Top 144 keywords that were identified by CiteSpace (DOC).
Author Contributions
Conceptualization and writing—original draft: H.L.; contributed analysis tools: H.C.; wrote the manuscript: H.L., M.J.C.C. All authors have read and agreed to the published version of the manuscript.
Funding
This work was supported by the scientific research start-up funds for openly-recuited doctors of Gansu Agricultural University (NO. GAU-KYQD-2018-18).
Conflicts of Interest
All authors declare there are no conflict of interest.
References
- Elser, J.; Sterner, R.W.; Gorokhova, E.A.; Fagan, W.; Markow, T.; Cotner, J.B.; Harrison, J.; Hobbie, S.E.; Odell, G.; Weider, L. Biological stoichiometry from genes to ecosystems. Ecol. Lett. 2000, 3, 540–550. [Google Scholar] [CrossRef] [Green Version]
- Vogel, S. Macroscope: Academically Correct Biological Science. Am. Sci. 1998, 86, 504–506. [Google Scholar] [CrossRef]
- Michaels, A.F. The Ratios of Life. Science 2003, 300, 906–907. [Google Scholar] [CrossRef]
- Hessen, D.O.; Elser, J.J.; Sterner, R.W.; Urabe, J. Ecological stoichiometry: An elementary approach using basic principles. Limnol. Oceanogr. 2013, 58, 2219–2236. [Google Scholar] [CrossRef]
- Sterner, R.W.; Elser, J.J. Ecological Stoichiometry: The Biology of Elements from Molecules to the Biosphere; Princeton University Press: Princeton, NJ, USA, 2002. [Google Scholar]
- Leal, M.C.; Seehausen, O.; Matthews, B. The ecology and evolution of stoichiometric phenotypes. Trends Ecol. Evol. 2017, 32, 108–117. [Google Scholar] [CrossRef] [PubMed]
- Redfield, A.C. The influence of organisms on the composition of seawater. Sea 1963, 2, 26–77. [Google Scholar]
- Elser, J.J.; Dobberfuhl, D.R.; MacKay, N.A.; Schampel, J.H. Organism size, life history, and N: P stoichiometry: Toward a unified view of cellular and ecosystem processes. BioScience 1996, 46, 674–684. [Google Scholar] [CrossRef] [Green Version]
- Schindler, D.W. Balancing planets and molecules. Nature 2003, 423, 225–226. [Google Scholar] [CrossRef]
- Chen, C.; Hu, Z.; Liu, S.; Tseng, H. Emerging trends in regenerative medicine: A scientometric analysis in CiteSpace. Expert Opin. Biol. Ther. 2012, 12, 593–608. [Google Scholar] [CrossRef]
- Reiners, W.A. Complementary models for ecosystems. Am. Nat. 1986, 127, 59–73. [Google Scholar] [CrossRef]
- Wei, F.; Grubesic, T.H.; Bishop, B.W. Exploring the GIS knowledge domain using CiteSpace. Prof. Geogr. 2015, 67, 374–384. [Google Scholar] [CrossRef]
- Chen, C. CiteSpace II: Detecting and visualizing emerging trends and transient patterns in scientific literature. J. Am. Soc. Inf. Sci. Technol. 2006, 57, 359–377. [Google Scholar] [CrossRef] [Green Version]
- Chen, C.; Leydesdorff, L. Patterns of connections and movements in dual-map overlays: A new method of publication portfolio analysis. J. Assoc. Inf. Sci. Technol. 2014, 65, 334–351. [Google Scholar] [CrossRef] [Green Version]
- Redfield, A.C. The biological control of chemical factors in the environment. Am. Sci. 1958, 46, 230A, 205–221. [Google Scholar]
- Elser, J.J.; Bracken, M.E.; Cleland, E.E.; Gruner, D.S.; Harpole, W.S.; Hillebrand, H.; Ngai, J.T.; Seabloom, E.W.; Shurin, J.B.; Smith, J.E. Global analysis of nitrogen and phosphorus limitation of primary producers in freshwater, marine and terrestrial ecosystems. Ecol. Lett. 2007, 10, 1135–1142. [Google Scholar] [CrossRef] [PubMed] [Green Version]
- Persson, J.; Fink, P.; Goto, A.; Hood, J.M.; Jonas, J.; Kato, S. To be or not to be what you eat: Regulation of stoichiometric homeostasis among autotrophs and heterotrophs. Oikos 2010, 119, 741–751. [Google Scholar] [CrossRef]
- Sterner, R.W.; Hessen, D.O. Algal nutrient limitation and the nutrition of aquatic herbivores. Annu. Rev. Ecol. Syst. 1994, 25, 1–29. [Google Scholar] [CrossRef]
- Elser, J.J.; Hassett, R.P. A stoichiometric analysis of the zooplankton–phytoplankton interaction in marine and freshwater ecosystems. Nature 1994, 370, 211–213. [Google Scholar] [CrossRef]
- Hecky, R.; Campbell, P.; Hendzel, L. The stoichiometry of carbon, nitrogen, and phosphorus in particulate matter of lakes and oceans. Limnol. Oceanogr. 1993, 38, 709–724. [Google Scholar] [CrossRef]
- Andersen, T.; Hessen, D.O. Carbon, nitrogen, and phosphorus content of freshwater zooplankton. Limnol. Oceanogr. 1991, 36, 807–814. [Google Scholar] [CrossRef]
- Vitousek, P.M.; Porder, S.; Houlton, B.Z.; Chadwick, O.A. Terrestrial phosphorus limitation: Mechanisms, implications, and nitrogen–phosphorus interactions. Ecol. Appl. 2010, 20, 5–15. [Google Scholar] [CrossRef] [Green Version]
- Cleveland, C.C.; Liptzin, D. C: N: P stoichiometry in soil: Is there a “Redfield ratio” for the microbial biomass? Biogeochemistry 2007, 85, 235–252. [Google Scholar] [CrossRef]
- Elser, J.; Fagan, W.; Kerkhoff, A.; Swenson, N.; Enquist, B. Biological stoichiometry of plant production: Metabolism, scaling and ecological response to global change. New Phytol. 2010, 186, 593–608. [Google Scholar] [CrossRef] [PubMed] [Green Version]
- Sardans, J.; Rivas-Ubach, A.; Peñuelas, J. The C: N: P stoichiometry of organisms and ecosystems in a changing world: A review and perspectives. Perspect. Plant Ecol. Evol. Syst. 2012, 14, 33–47. [Google Scholar] [CrossRef]
- Elser, J.; Fagan, W.; Denno, R.; Dobberfuhl, D.; Folarin, A.; Huberty, A.; Interlandi, S.; Kilham, S.; McCauley, E.; Schulz, K. Nutritional constraints in freshwater and terrestrial food webs. Nature 2000, 408, 578–580. [Google Scholar] [CrossRef]
- Güsewell, S. N: P ratios in terrestrial plants: Variation and functional significance. New Phytol. 2004, 164, 243–266. [Google Scholar] [CrossRef]
- Manzoni, S.; Trofymow, J.A.; Jackson, R.B.; Porporato, A. Stoichiometric controls on carbon, nitrogen, and phosphorus dynamics in decomposing litter. Ecol. Monogr. 2010, 80, 89–106. [Google Scholar] [CrossRef]
- Elser, J.J.; Andersen, T.; Baron, J.S.; Bergström, A.K.; Jansson, M.; Kyle, M.; Nydick, K.R.; Steger, L.; Hessen, D.O. Shifts in lake N: P stoichiometry and nutrient limitation driven by atmospheric nitrogen deposition. Science 2009, 326, 835–837. [Google Scholar] [CrossRef]
- Elser, J.J.; Urabe, J. The stoichiometry of consumer-driven nutrient recycling: Theory, observations, and consequences. Ecology 1999, 80, 735–751. [Google Scholar] [CrossRef]
- Harpole, W.S.; Ngai, J.T.; Cleland, E.E.; Seabloom, E.W.; Borer, E.T.; Bracken, M.E.; Elser, J.J.; Gruner, D.S.; Hillebrand, H.; Shurin, J.B. Nutrient co-limitation of primary producer communities. Ecol. Lett. 2011, 14, 852–862. [Google Scholar] [CrossRef]
- Elser, J.; Acharya, K.; Kyle, M.; Cotner, J.; Makino, W.; Markow, T.; Watts, T.; Hobbie, S.; Fagan, W.; Schade, J. Growth rate–stoichiometry couplings in diverse biota. Ecol. Lett. 2003, 6, 936–943. [Google Scholar] [CrossRef] [Green Version]
- Manzoni, S.; Taylor, P.; Richter, A.; Porporato, A.; Ågren, G.I. Environmental and stoichiometric controls on microbial carbon-use efficiency in soils. New Phytol. 2012, 196, 79–91. [Google Scholar] [CrossRef]
- Ji, Z.; Pei, Y. Bibliographic and visualized analysis of geopolymer research and its application in heavy metal immobilization: A review. J. Environ. Manag. 2019, 231, 256–267. [Google Scholar] [CrossRef] [PubMed]
- Hessen, D.O. Stoichiometry in food webs: Lotka revisited. Oikos 1997, 79, 195–200. [Google Scholar] [CrossRef]
- Vanni, M.J.; Flecker, A.S.; Hood, J.M.; Headworth, J.L. Stoichiometry of nutrient recycling by vertebrates in a tropical stream: Linking species identity and ecosystem processes. Ecol. Lett. 2002, 5, 285–293. [Google Scholar] [CrossRef] [Green Version]
- Koerselman, W.; Meuleman, A.F. The vegetation N: P ratio: A new tool to detect the nature of nutrient limitation. J. Appl. Ecol. 1996, 33, 1441–1450. [Google Scholar] [CrossRef]
- Falkowski, P.; Scholes, R.; Boyle, E.; Canadell, J.; Canfield, D.; Elser, J.; Gruber, N.; Hibbard, K.; Högberg, P.; Linder, S. The global carbon cycle: A test of our knowledge of earth as a system. Science 2000, 290, 291–296. [Google Scholar] [CrossRef] [PubMed] [Green Version]
- Marklein, A.R.; Houlton, B.Z. Nitrogen inputs accelerate phosphorus cycling rates across a wide variety of terrestrial ecosystems. New Phytol. 2012, 193, 696–704. [Google Scholar] [CrossRef]
- Schimel, D.S.; Braswell, B.; Holland, E.A.; McKeown, R.; Ojima, D.S.; Painter, T.H.; Parton, W.J.; Townsend, A.R. Climatic, edaphic, and biotic controls over storage and turnover of carbon in soils. Glob. Biogeochem. Cycles. 1994, 8, 279–293. [Google Scholar] [CrossRef] [Green Version]
- Guo, G.; Zhang, C.; Xu, Y. Effects of climate change on soil organic carbon storage in terrestrial ecosystem. Chin. J. Ecol. 2006, 25, 435. [Google Scholar]
- Aneja, M.K.; Sharma, S.; Fleischmann, F.; Stich, S.; Heller, W.; Bahnweg, G.; Munch, J.C.; Schloter, M. Microbial colonization of beech and spruce litter—Influence of decomposition site and plant litter species on the diversity of microbial community. Microb. Ecol. 2006, 52, 127–135. [Google Scholar] [CrossRef] [PubMed]
- Xiang, C.; Wang, Y.; Liu, H. A scientometrics review on nonpoint source pollution research. Ecol. Eng. 2017, 99, 400–408. [Google Scholar] [CrossRef]
- Schulhof, M.A.; Shurin, J.B.; Declerck, S.A.; Van de Waal, D.B. Phytoplankton growth and stoichiometric responses to warming, nutrient addition and grazing depend on lake productivity and cell size. Glob. Chang. Biol. 2019, 25, 2751–2762. [Google Scholar] [CrossRef] [PubMed] [Green Version]
- Karpowicz, M.; Feniova, I.; Gladyshev, M.I.; Ejsmont-Karabin, J.; Górniak, A.; Zieliński, P.; Dawidowicz, P.; Kolmakova, A.A.; Dzialowski, A.R. The stoichiometric ratios (C: N: P) in a pelagic food web under experimental conditions. Limnologica 2019, 77, 125690. [Google Scholar] [CrossRef] [Green Version]
- Hassett, R.; Cardinale, B.; Stabler, L.; Elser, J. Ecological stoichiometry of N and P in pelagic ecosystems: Comparison of lakes and oceans with emphasis on the zooplankton-phytoplankton interaction. Limnol. Oceanogr. 1997, 42, 648–662. [Google Scholar] [CrossRef] [Green Version]
- Pazianoto, L.H.; Solla, A.; Ferreira, V. Leaf litter decomposition of sweet chestnut is affected more by oomycte infection of trees than by water temperature. Fungal Ecol. 2019, 41, 269–278. [Google Scholar] [CrossRef]
- Gulis, V.; Su, R.; Kuehn, K.A. Fungal decomposers in freshwater environments. In The Structure and Function of Aquatic Microbial Communities; Hurst, C.J., Ed.; Springer: Cham, Switzerland, 2019; pp. 122–155. [Google Scholar]
- Cai, J.; Bai, C.; Tang, X.; Dai, J.; Jiang, X.; Hu, Y.; Shao, K.; Gao, G. Spatiotemporal Variations in Seston C: N: P Stoichiometry in a Large Eutrophic Floodplain Lake (Lake Taihu): Do the Sources of Seston Explain Stoichiometric Flexibility? Water 2020, 12, 36. [Google Scholar] [CrossRef] [Green Version]
- Peace, A.; Wang, H. Compensatory Foraging in Stoichiometric Producer–Grazer Models. Bull. Math. Biol. 2019, 81, 4932–4950. [Google Scholar] [CrossRef]
- Bell, A.T.; Murray, D.L.; Prater, C.; Frost, P.C. Fear and food: Effects of predator-derived chemical cues and stoichiometric food quality on Daphnia. Limnol. Oceanogr. 2019, 64, 1706–1715. [Google Scholar] [CrossRef] [Green Version]
- Hessen, D.O.; Ågren, G.I.; Anderson, T.R.; Elser, J.J.; De Ruiter, P.C. Carbon sequestration in ecosystems: The role of stoichiometry. Ecology 2004, 85, 1179–1192. [Google Scholar] [CrossRef]
- Stelzer, R.S.; Lamberti, G.A. Ecological stoichiometry in running waters: Periphyton chemical composition and snail growth. Ecology 2002, 83, 1039–1051. [Google Scholar] [CrossRef]
- Urabe, J.; Sterner, R.W. Regulation of herbivore growth by the balance of light and nutrients. Proc. Natl. Acad. Sci. USA. 1996, 93, 8465–8469. [Google Scholar] [CrossRef] [Green Version]
- Sterner, R.W.; Clasen, J.; Lampert, W.; Weisse, T. Carbon: Phosphorus stoichiometry and food chain production. Ecol. Lett. 1998, 1, 146–150. [Google Scholar] [CrossRef]
- Urabe, J.; Nakanishi, M.; Kawabata, K. Contribution of metazoan plankton to the cycling of nitrogen and phosphorus in Lake Biwa. Limnol. Oceanogr. 1995, 40, 232–241. [Google Scholar] [CrossRef]
- Tezuka, Y. The C: N: P ratio of phytoplankton determines the relative amounts of dissolved inorganic nitrogen and phosphorus released during aerobic decomposition. Hydrobiologia 1989, 173, 55–62. [Google Scholar] [CrossRef]
- Chrzanowski, T.H.; Kyle, M.; Elser, J.J.; Sterner, R.W. Element ratios and growth dynamics of bacteria in an oligotrophic Canadian shield lake. Aquat. Microb. Ecol. 1996, 11, 119–125. [Google Scholar] [CrossRef]
- Caron, D.A.; Porter, K.G.; Sanders, R.W. Carbon, nitrogen, and phosphorus budgets for the mixotrophic phytoflagellate Poterioochromonas malhamensis (Chrysophyceae) during bacterial ingestion. Limnol. Oceanogr. 1990, 35, 433–443. [Google Scholar] [CrossRef]
- Vitousek, P.M. Nutrient Cycling and Limitation: Hawai’i as a Model System; Princeton University Press: Princeton, NJ, USA, 2004. [Google Scholar]
- Boynton, W.R.; Kemp, W.M.; Keefe, C. A comparative analysis of nutrients and other factors influencing estuarine phytoplankton production. In Estuarine Comparisons; Kennedy, V.S., Ed.; Academic Press: New York, NY, USA, 1982; pp. 69–90. [Google Scholar]
- Meybeck, M. Carbon, nitrogen, and phosphorus transport by world rivers. Am. J. Sci. 1982, 282, 401–450. [Google Scholar] [CrossRef]
- Elser, J.J.; Schampel, J.H.; Kyle, M.; Watts, J.; Carson, E.W.; Dowling, T.E.; Tang, C.; Roopnarine, P.D. Response of grazing snails to phosphorus enrichment of modern stromatolitic microbial communities. Freshw. Biol. 2005, 50, 1826–1835. [Google Scholar] [CrossRef]
- Elser, J.J.; Schampel, J.H.; Garcia-Pichel, F.; Wade, B.D.; Souza, V.; Eguiarte, L.; Escalante, A.; Farmer, J.D. Effects of phosphorus enrichment and grazing snails on modern stromatolitic microbial communities. Freshw. Biol. 2005, 50, 1808–1825. [Google Scholar] [CrossRef]
- Leavit, S.W. Biogeochemistry, an analysis of global change. Eos Trans. Am. Geophys. Union 1998, 79, 20. [Google Scholar] [CrossRef] [Green Version]
- Jackson, R.B.; Mooney, H.A.; Schulze, E.D. A global budget for fine root biomass, surface area, and nutrient contents. Proc. Natl. Acad. Sci. USA. 1997, 94, 7362–7366. [Google Scholar] [CrossRef] [PubMed] [Green Version]
- Fan, H.; Wu, J.; Liu, W.; Yuan, Y.; Hu, L.; Cai, Q. Linkages of plant and soil C: N: P stoichiometry and their relationships to forest growth in subtropical plantations. Plant Soil 2015, 392, 127–138. [Google Scholar] [CrossRef]
- Bihn, J.H.; Verhaagh, M.; Brandl, R. Ecological stoichiometry along a gradient of forest succession: Bait preferences of litter ants. Biotropica 2008, 40, 597–599. [Google Scholar] [CrossRef]
- Vitousek, P. Stoichiometry and Flexibility in the Hawaiian Model System. In Scope 61: Interactions of the Major Biogeochemical Cycle; Melillo, J.M., Field, C.B., Moldan, B., Eds.; Island Press: Washington, DC, USA, 2003; pp. 117–134. [Google Scholar]
- Wakefield, A.E.; Gotelli, N.J.; Wittman, S.E.; Ellison, A.M. Prey addition alters nutrient stoichiometry of the carnivorous plant Sarracenia purpurea. Ecology 2005, 86, 1737–1743. [Google Scholar] [CrossRef]
- Mulder, C.; Elser, J.J. Soil acidity, ecological stoichiometry and allometric scaling in grassland food webs. Glob. Chang. Biol. 2009, 15, 2730–2738. [Google Scholar] [CrossRef] [Green Version]
- Song, Z.; Liu, H.; Zhao, F.; Xu, C. Ecological stoichiometry of N: P: Si in China’s grasslands. Plant Soil 2014, 380, 165–179. [Google Scholar] [CrossRef]
- Zhang, J.; Zhao, N.; Liu, C.; Yang, H.; Li, M.; Yu, G.; Wilcox, K.; Yu, Q.; He, N. C: N: P stoichiometry in China’s forests: From organs to ecosystems. Funct. Ecol. 2018, 32, 50–60. [Google Scholar] [CrossRef]
- Li, H.; Crabbe, C.M.J.; Xu, F.; Wang, W.; Ma, L.; Niu, R.; Gao, X.; Li, X.; Zhang, P.; Ma, X. Seasonal variations in carbon, nitrogen and phosphorus concentrations and C: N: P stoichiometry in different organs of a Larix principis-rupprechtii Mayr. plantation in the Qinling Mountains, China. PLoS ONE 2017, 12, e0185163. [Google Scholar] [CrossRef] [Green Version]
- Guo, X.; Jiang, Y. Spatial characteristics of ecological stoichiometry and their driving factors in farmland soils in Poyang Lake Plain, Southeast China. J. Soils Sediments 2019, 19, 263–274. [Google Scholar] [CrossRef]
- Smith, V.H. Applicability of resource-ratio theory to microbial ecology. Limnol. Oceanogr. 1993, 38, 239–249. [Google Scholar]
- Smith, V.H. Implications of resource-ratio theory for microbial ecology. In Advances in Microbial Ecology; Jones, J.G., Ed.; Springer: New York, NY, USA, 1993; pp. 1–37. [Google Scholar]
- Jaenike, J.; Markow, T. Comparative elemental stoichiometry of ecologically diverse Drosophila. Funct. Ecol. 2003, 17, 115–120. [Google Scholar] [CrossRef] [Green Version]
- Andersen, T.; Elser, J.J.; Hessen, D.O. Stoichiometry and population dynamics. Ecol. Lett. 2004, 7, 884–900. [Google Scholar] [CrossRef]
- Wardle, D.A.; Walker, L.R.; Bardgett, R.D. Ecosystem properties and forest decline in contrasting long-term chronosequences. Science 2004, 305, 509–513. [Google Scholar] [CrossRef] [PubMed] [Green Version]
- Schade, J.D.; Espeleta, J.F.; Klausmeier, C.A.; McGroddy, M.E.; Thomas, S.A.; Zhang, L. A conceptual framework for ecosystem stoichiometry: Balancing resource supply and demand. Oikos 2005, 109, 40–51. [Google Scholar] [CrossRef]
- Venterink, H.O.; Güsewell, S. Competitive interactions between two meadow grasses under nitrogen and phosphorus limitation. Funct. Ecol. 2010, 24, 877–886. [Google Scholar] [CrossRef]
- Stelzer, R.S. Ecological Stoichiometry in Streams: Linkages among Nutrients, Periphyton, and Grazers. Ph.D. Thesis, University of Notre Dame, Notre Dame, IN, USA, 1999. [Google Scholar]
- Lü, X.T.; Reed, S.; Yu, Q.; He, N.P.; Wang, Z.W.; Han, X.G. Convergent responses of nitrogen and phosphorus resorption to nitrogen inputs in a semiarid grassland. Glob. Chang. Biol. 2013, 19, 2775–2784. [Google Scholar] [CrossRef]
- DeLuca, T.H.; Zackrisson, O.; Gundale, M.J.; Nilsson, M.C. Ecosystem feedbacks and nitrogen fixation in boreal forests. Science 2008, 320, 1181. [Google Scholar] [CrossRef]
- Cease, A.J.; Elser, J.J.; Ford, C.F.; Hao, S.; Kang, L.; Harrison, J.F. Heavy livestock grazing promotes locust outbreaks by lowering plant nitrogen content. Science 2012, 335, 467–469. [Google Scholar] [CrossRef]
- Lannes, L.S.; Bustamante, M.M.; Edwards, P.J.; Venterink, H.O. Alien and endangered plants in the Brazilian Cerrado exhibit contrasting relationships with vegetation biomass and N: P stoichiometry. New Phytol. 2012, 196, 816–823. [Google Scholar] [CrossRef]
- Liu, J.; Huang, W.; Zhou, G.; Zhang, D.; Liu, S.; Li, Y. Nitrogen to phosphorus ratios of tree species in response to elevated carbon dioxide and nitrogen addition in subtropical forests. Glob. Chang. Biol. 2013, 19, 208–216. [Google Scholar] [CrossRef] [PubMed]
Figure 1.
Collaboration network map of countries/regions. The circle represents the frequency, and the circle size is positively correlated with the frequency count. The lines between different nodes indicate that different nodes appear in the same literature simultaneously.
Figure 1.
Collaboration network map of countries/regions. The circle represents the frequency, and the circle size is positively correlated with the frequency count. The lines between different nodes indicate that different nodes appear in the same literature simultaneously.

Figure 2.
Collaboration network map of institutions. The circle represents the frequency, and the circle size is positively correlated with the frequency count. The lines between different nodes indicate that different nodes appear in the same literature simultaneously.
Figure 2.
Collaboration network map of institutions. The circle represents the frequency, and the circle size is positively correlated with the frequency count. The lines between different nodes indicate that different nodes appear in the same literature simultaneously.

Figure 3.
Collaboration network map of authors. The circle represents the frequency, and the circle size is positively correlated with the frequency count. The lines between different nodes indicate that different nodes appear in the same literature simultaneously.
Figure 3.
Collaboration network map of authors. The circle represents the frequency, and the circle size is positively correlated with the frequency count. The lines between different nodes indicate that different nodes appear in the same literature simultaneously.

Figure 4.
Co-citation network map of cited authors. The circle represents the frequency, and the circle size is positively correlated with the frequency count. The lines between different nodes indicate that different nodes appear in the same literature simultaneously.
Figure 4.
Co-citation network map of cited authors. The circle represents the frequency, and the circle size is positively correlated with the frequency count. The lines between different nodes indicate that different nodes appear in the same literature simultaneously.

Figure 5.
Network map of co-occurring journals. The circle represents the frequency, and the circle size is positively correlated with the frequency count. The lines between different nodes indicate that different nodes appear in the same literature simultaneously.
Figure 5.
Network map of co-occurring journals. The circle represents the frequency, and the circle size is positively correlated with the frequency count. The lines between different nodes indicate that different nodes appear in the same literature simultaneously.

Figure 6.
Category burst detection based on WoS data. The lines (blue and red lines) represent the start and end. Times of a category (from 1992 to 2019) and the red lines represent the duration of the category burst.
Figure 6.
Category burst detection based on WoS data. The lines (blue and red lines) represent the start and end. Times of a category (from 1992 to 2019) and the red lines represent the duration of the category burst.

Figure 7.
Co-citation network map of cited references. The circle represents the frequency, and the circle size is positively correlated with the frequency count. The lines between different nodes indicate that different nodes appear in the same literature simultaneously.
Figure 7.
Co-citation network map of cited references. The circle represents the frequency, and the circle size is positively correlated with the frequency count. The lines between different nodes indicate that different nodes appear in the same literature simultaneously.

Figure 8.
The top 25 co-cited references with the strongest citation burst. The lines (blue and red lines) represent the start and end times (from 1992 to 2019), and the red lines represent the duration of the burst.
Figure 8.
The top 25 co-cited references with the strongest citation burst. The lines (blue and red lines) represent the start and end times (from 1992 to 2019), and the red lines represent the duration of the burst.

Figure 9.
(A): Keyword co-occurrence visualization map of publications on ES from 1992 to 2019. The circle represents the frequency, and the circle size is positively correlated with the frequency count. The lines between different nodes indicate that different nodes appear in the same literature simultaneously. (B): Cluster map of keywords.

Figure 10.
The top 25 burst-detection keywords based on WoS data. The lines (blue and red lines) represent the start and end times. (from 1992 to 2019), and the red lines represent the duration of the burst.
Figure 10.
The top 25 burst-detection keywords based on WoS data. The lines (blue and red lines) represent the start and end times. (from 1992 to 2019), and the red lines represent the duration of the burst.


Table 1.
The top 15 countries and institutions contributing to publications on ES from 1992 to 2019.
Table 1.
The top 15 countries and institutions contributing to publications on ES from 1992 to 2019.
| Rank | Country | Counts | Centrality | Institution | Counts | Centrality |
|---|---|---|---|---|---|---|
| 1 | USA | 1136 | 0.42 | Chinese Academy of Sciences, China | 312 | 0.21 |
| 2 | China | 617 | 0.1 | University of the Chinese Academy of Sciences, China | 128 | 0.03 |
| 3 | Germany | 310 | 0.19 | Arizona State University, USA | 107 | 0.19 |
| 4 | Canada | 225 | 0.12 | University of Minnesota, USA | 89 | 0.15 |
| 5 | Australia | 180 | 0.05 | Northwest Agriculture and Forestry University, China | 62 | 0.03 |
| 6 | Spain | 179 | 0.04 | Spanish National Research Council, Spain | 54 | 0.07 |
| 7 | France | 152 | 0.34 | Cornell University, USA | 51 | 0.1 |
| 8 | England | 136 | 0.05 | University of Maryland, USA | 50 | 0.05 |
| 9 | Sweden | 130 | 0.06 | Centre for Ecological Research and Forestry Applications, Spain | 45 | 0.06 |
| 10 | Netherlands | 125 | 0.04 | Peking University, China | 41 | 0.03 |
| 11 | Norway | 96 | 0.05 | University of Georgia, USA | 41 | 0.02 |
| 12 | Japan | 84 | 0.18 | Universitetet i Oslo, Norway | 39 | 0.06 |
| 13 | Switzerland | 78 | 0.06 | University of Oklahoma, USA | 36 | 0.02 |
| 14 | New Zealand | 61 | 0.02 | University of Umea, Sweden | 34 | 0.04 |
| 15 | Brazil | 52 | 0.03 | University of California, Irvine, USA | 32 | 0.03 |
Table 2.
The top 15 authors and cited authors contributing to publications on ES from 1992 to 2019.
| Rank | Author | Count | Centrality | Co-Cited Author | Count | Centrality |
|---|---|---|---|---|---|---|
| 1 | Elser J.J. | 82 | 0.05 | Sterner R.W. | 1289 | 0.04 |
| 2 | Penuelas J. | 45 | 0.02 | Elser J.J. | 1259 | 0.1 |
| 3 | Sardans J. | 39 | 0.01 | Hessen D.O. | 499 | 0.05 |
| 4 | Urabe J. | 24 | 0.01 | Vitouserk P.M. | 489 | 0.14 |
| 5 | Han X.G. | 20 | 0.01 | Redfield A.C. | 465 | 0.1 |
| 6 | Hillebrand H. | 19 | 0.02 | Güsewell S. | 404 | 0.04 |
| 7 | Frost P.C. | 19 | 0.01 | Reich P.B. | 387 | 0.04 |
| 8 | Vanni M.J. | 16 | 0 | Frost P.C. | 355 | 0.02 |
| 9 | Rosemond A.D. | 15 | 0 | Cleveland C.C. | 345 | 0.06 |
| 10 | Hessen D.O. | 14 | 0 | Urabe J. | 326 | 0.03 |
| 11 | Yu G.R. | 14 | 0 | Aerts R. | 285 | 0.02 |
| 12 | Martiny A.C. | 12 | 0 | Andersen T. | 270 | 0.07 |
| 13 | Boersma M. | 12 | 0 | Sardans J. | 259 | 0.02 |
| 14 | Hessen D. | 12 | 0 | Sinsabaugh R.L. | 257 | 0.02 |
| 15 | Richter A. | 11 | 0.01 | DeMott W.R. | 255 | 0.02 |
Table 3.
The top 15 cited journal and the importance index (centrality value) of the ES literature from 1992 to 2019.
Table 3.
The top 15 cited journal and the importance index (centrality value) of the ES literature from 1992 to 2019.
| Rank | Cited Journal | Frequency Count | Centrality | Publishing Country/Region | IF |
|---|---|---|---|---|---|
| 1 | Ecology | 2014 | 0.02 | USA | 4.285 |
| 2 | Nature | 1835 | 0.01 | England | 43.070 |
| 3 | Ecology Letters | 1627 | 0 | England | 8.699 |
| 4 | Limnology and Oceanography | 1598 | 0 | USA | 4.325 |
| 5 | Science | 1489 | 0 | USA | 41.037 |
| 6 | Oecologia | 1402 | 0.01 | Germany | 2.915 |
| 7 | Proceedings of the National Academy of Sciences of the United States of America | 1268 | 0.01 | USA | 9.580 |
| 8 | Biogeochemistry | 1208 | 0.02 | Netherlands | 3.406 |
| 9 | Oikos | 1046 | 0.01 | Denmark | 3.468 |
| 10 | New Phytologist | 993 | 0.01 | England | 7.299 |
| 11 | Freshwater Biology | 954 | 0.01 | England | 3.404 |
| 12 | American Naturalist | 947 | 0.01 | USA | 3.855 |
| 13 | Global Change Biology | 940 | 0.01 | England | 8.880 |
| 14 | Functional Ecology | 918 | 0 | England | 5.037 |
| 15 | Hydrobiologia | 886 | 0 | Netherlands | 2.325 |
Each journal’s impact factor (IF) was obtained from the 2018–2019 Journal Citation Reports Science Edition, accessed on 1 March 2020.
Table 4.
Top 15 categories of ES research.
| Rank | Category | Frequency Count | Centrality |
|---|---|---|---|
| 1 | Environmental science and ecology | 1692 | 0.52 |
| 2 | Ecology | 1259 | 0.22 |
| 3 | Marine and freshwater biology | 797 | 0.07 |
| 4 | Oceanography | 373 | 0.02 |
| 5 | Agriculture | 357 | 0.29 |
| 6 | Plant sciences | 306 | 0.07 |
| 7 | Soil science | 305 | 0.04 |
| 8 | Geosciences, multidisciplinary | 254 | 0.12 |
| 9 | Limnology | 234 | 0.01 |
| 10 | Microbiology | 117 | 0.09 |
| 11 | Agronomy | 112 | 0.02 |
| 12 | Evolutionary biology | 94 | 0.04 |
| 13 | Forestry | 93 | 0 |
| 14 | Biodiversity conservation | 90 | 0.01 |
| 15 | Water resources | 72 | 0.05 |
Table 5.
Top 15 most-cited references from 1992 to 2019.
| Rank | Cited Frequency | Centrality | References | Source |
|---|---|---|---|---|
| 1 * | 291 | 0.03 | Sterner, R.W.; Elser, J.J. (2002) [5] | Princeton University Press |
| 2 | 159 | 0.03 | Elser, J.J.; Bracken, M.E.S.; Cleland, E.E., et al. (2007) [16] | Ecology Letters |
| 3 | 133 | 0.03 | Vitousek, P.M.; S. Porder, S.; Houlton, B.Z., et al. (2010) [22] | Ecological Applications |
| 4 | 132 | 0.04 | Cleveland, C.; Liptzin, D. (2007) [23] | Biogeochem |
| 5 | 131 | 0.04 | Elser, J.J.; Fagan, W.F.; Kerkhoff, A.J., et al. (2010) [24] | New Phytologist |
| 6 | 113 | 0.09 | Persson, J.; Fink, P.; Goto, A., et al. (2010) [17] | Oikos |
| 7 | 95 | 0.02 | Sardans, J.; Rivas-Ubach, A.; Peñuelas, J. (2012) [25] | Perspectives in Plant Ecology Evolution and Systematics |
| 8 | 89 | 0.01 | Elser, J.J.; Fagan, W.F.; Denno, R.F., et al. (2000) [26] | Nature |
| 9 | 85 | 0.04 | Güsewell, S. (2004) [27] | New Phytologist |
| 10 | 85 | 0.02 | Manzoni, S.; Trofymow, J.A.; Jackson, R.B., et al. (2010) [28] | Ecological Monographs |
| 11 | 84 | 0.02 | Elser, J.J.; Andersen, T.; Baron, J.S., et al. (2009) [29] | Science |
| 12 | 82 | 0.04 | Elser, J.J.; Urabe, J. (1999) [30] | Ecology |
| 13 | 81 | 0.01 | Harpole, W.S.; Ngai, J.T.; Cleland, E.E., et al. (2011) [31] | Ecology Letters |
| 14 | 80 | 0.07 | Elser, J.J.; Acharya, K.; Kyle, M., et al. (2003) [32] | Ecology Letters |
| 15 | 72 | 0.03 | Manzoni, S.; Taylor, P.; Richter, A., et al. (2012) [33] | New Phytologist |
* This is a book. The others are journal articles.
Table 6.
Top 15 keywords in terms of citation counts and centrality for ES research.
| Rank | Keywords | Frequency Count | Centrality |
|---|---|---|---|
| 1 | Nitrogen | 849 | 0.05 |
| 2 | Phosphorus | 760 | 0.08 |
| 3 | Carbon | 460 | 0.11 |
| 4 | Growth | 376 | 0.13 |
| 5 | Phytoplankton | 355 | 0.05 |
| 6 | Nutrient limitation | 340 | 0.02 |
| 7 | Ecosystem | 317 | 0.2 |
| 8 | Nutrient | 253 | 0.03 |
| 9 | Fresh water | 247 | 0.16 |
| 10 | Limitation | 231 | 0.11 |
| 11 | Organic matter | 214 | 0.19 |
| 12 | Zooplankton | 204 | 0 |
| 13 | N:P stoichiometry | 202 | 0.12 |
| 14 | Climate change | 201 | 0.04 |
| 15 | Dynamics | 187 | 0.05 |
Table 7.
Information on the largest 13 co-occurrence clusters of keywords.
| Cluster ID | Size a | Silhoustte | Mean (Cite Year) | Label (LLR) b |
|---|---|---|---|---|
| #0 | 34 | 0.849 | 2002 | Crustacean zooplankton |
| #1 | 33 | 0.824 | 2004 | Modern stromatolitic microbial communities |
| #2 | 31 | 0.924 | 2004 | Reciprocal influence |
| #3 | 31 | 0.838 | 2003 | Organic matter |
| #4 | 30 | 0.888 | 2002 | N ratio |
| #5 | 29 | 0.932 | 2002 | Atlantic plankton |
| #6 | 26 | 0.845 | 2011 | Aquatic hyphomycete |
| #7 | 26 | 0.730 | 2002 | Spring-summer phytoplankton |
| #8 | 23 | 0.876 | 2005 | Prey addition alter |
| #9 | 22 | 0.887 | 2005 | South florida |
| #10 | 13 | 0.920 | 2001 | Algal composition |
| #11 | 12 | 0.883 | 2004 | Tropical cladoceran |
| #12 | 11 | 0.991 | 2005 | Mediterranean forest |
a Size: the number of references that a cluster contains; b Label: obtained by the log likelihood ratio.
Publisher’s Note: MDPI stays neutral with regard to jurisdictional claims in published maps and institutional affiliations. |
© 2020 by the authors. Licensee MDPI, Basel, Switzerland. This article is an open access article distributed under the terms and conditions of the Creative Commons Attribution (CC BY) license (http://creativecommons.org/licenses/by/4.0/).
Share and Cite
MDPI and ACS Style
Li, H.; C. Crabbe, M.J.; Chen, H. History and Trends in Ecological Stoichiometry Research from 1992 to 2019: A Scientometric Analysis. Sustainability 2020, 12, 8909. https://0-doi-org.brum.beds.ac.uk/10.3390/su12218909
AMA Style
Li H, C. Crabbe MJ, Chen H. History and Trends in Ecological Stoichiometry Research from 1992 to 2019: A Scientometric Analysis. Sustainability. 2020; 12(21):8909. https://0-doi-org.brum.beds.ac.uk/10.3390/su12218909
Chicago/Turabian StyleLi, Hailiang, M. James C. Crabbe, and Haikui Chen. 2020. "History and Trends in Ecological Stoichiometry Research from 1992 to 2019: A Scientometric Analysis" Sustainability 12, no. 21: 8909. https://0-doi-org.brum.beds.ac.uk/10.3390/su12218909
Note that from the first issue of 2016, this journal uses article numbers instead of page numbers. See further details here.