Article

Characterization and Prediction of Fecal Sludge Parameters and Settling Behavior in Informal Settlements in Nairobi, Kenya

1
Mortenson Center in Global Engineering, University of Colorado-Boulder, Boulder, CO 80309, USA
2
Sanergy, Inc., Nairobi 00100, Kenya
3
Swiss Federal Institute of Aquatic Science and Technology (Eawag), 8600 Dübendorf, Switzerland
*
Author to whom correspondence should be addressed.
Sustainability 2020, 12(21), 9040; https://0-doi-org.brum.beds.ac.uk/10.3390/su12219040
Submission received: 27 September 2020 / Revised: 20 October 2020 / Accepted: 28 October 2020 / Published: 30 October 2020
(This article belongs to the Special Issue Global Engineering and Sustainable Development)

Abstract

:
The safe management of fecal sludge (FS) relies on different treatments, processes, and disposal options in different contexts. Waste transfer stations can improve FS management particularly in resource-constrained areas, including low-income urban informal settlements, by providing a safe discharge and treatment location. Low-footprint options for FS treatment are sensitive to the characteristics of incoming FS, which are typically highly variable, difficult to predict, and differ significantly from the characteristics of traditional wastewater. The success of low-footprint technologies relies on the monitoring of incoming FS characteristics, such as total solids (TS), total suspended solids (TSS), chemical oxygen demand (COD), ammonia, electrical conductivity (EC), and pH. Monitoring the characteristics of incoming FS typically relies on the use of a laboratory, which can be expensive and time-consuming, particularly in resource-constrained areas. Useful correlations between easy to measure parameters and difficult to measure parameters may provide useful information related to the monitoring of FS, while reducing the need for laboratory analysis. In this paper, we describe a sampling campaign at a waste transfer station in Nairobi, Kenya managed by Sanergy Inc., to characterize and observe settling behavior of FS collected from manually emptied pit latrines. The investigation found that easy to measure parameters (e.g., TS, turbidity) could be used to approximate difficult to measure parameters (COD, TSS). Additionally, rapid measurements (turbidity) could be used to approximate time-intensive parameters (TS, COD, TSS) to aid in the design, operation and monitoring of FS treatment facilities in resource and space-constrained areas.

1. Introduction

One-third of the world’s population relies on onsite sanitation, producing fecal sludge (FS) that should require safe disposal in-situ or transport and treatment offsite [1]. FS includes a mixture of solid and liquid waste that contains human excreta collected in onsite sanitation systems such as pit latrines and septic tanks and not conveyed through a sewer system [2,3]. It often contains garbage, sand, or soil, and groundwater, rainwater or greywater, depending on localized conditions [4,5]. The safe management of FS is especially challenging in resource-constrained areas, including low-income urban informal settlements, where population density is high, and space is often limited.
Infrastructure and service extension has often not been able to keep pace with urban population growth in low- and middle-income cities, resulting in the formation of these informal settlements that lack coverage of basic water, sanitation, or electrical services. The lack of formalized sanitation services in these informal settlements, which often exist in a legal limbo, poses health and safety risks, and responsibility and authority to provide sanitation services are often unclear, resulting in correspondingly informal or absent FS management. Often, community members rely on household or public pit latrines. When pit latrines fill up, the sludge must be removed if there is limited room to build a new one. Inadequate space for exhauster trucks contributes to reliance on dangerous manual emptying practices, which often lack a safe disposal option for the FS [6,7].
Waste transfer stations seek to address these issues by providing a safe discharge location for FS in densely populated informal settlements. A subsequent challenge is the need to safely treat or dispose of the incoming FS, which relies on different treatments, processes and disposal options in different contexts. Processes include the containment, transport, solid-liquid separation, treatment, and/or conversion of FS into other resources [2,3]. Space constraints often limit the use of conventional processes, such as drying beds [8]. FS is typically delivered from one sanitation containment at a time, resulting in highly variable and unpredictable loads of FS. The success of low-footprint treatment facilities relies on an understanding of FS characteristics and the monitoring of incoming FS. Laboratory analysis for FS characterization in low-income settings may be limited, time-consuming and cost-prohibitive. Establishing ways to predict FS characteristics and settling behavior may be helpful in the planning and design of treatment processes and facilities [9,10]. Access to FS characterization in real time is especially helpful for monitoring and adjusting onsite operations such as flocculant dosing [11].
As with traditional wastewater treatment, the operation of FS treatment processes requires an understanding of FS characteristics. This is especially critical compared to traditional wastewater treatment due to the variability of FS and in order to effectively utilize low-footprint technologies, such as geotextiles and screw presses [12]. Typical parameters used for the characterization of FS include total solids (TS), total suspended solids (TSS), chemical oxygen demand (COD), ammonia and pH. Previous studies have found that FS varies widely across contexts and differs significantly from traditional wastewater [3,9]. Easy to measure parameters include pH, EC, TS, and turbidity. TS measurements are easy to measure in that they rely on a relatively simple laboratory procedure, but are time-intensive due to required drying times for samples. In contrast, turbidity measurements are instantaneous and can be collected with affordable and portable instruments. Difficult to measure parameters, including COD, ammonia, and TSS, require time, chemicals, and equipment [13].
FS characterization is required to appropriately size and configure treatment processes. Influent solids loading rates can be determined using TS and TSS measurements and are important for sizing treatment phases, such as settling tanks and drying beds. Undersized tanks require more frequent maintenance and removal of solids to sustain treatment performance but oversized tanks place an unnecessary burden on land where space may be severely limited [3,9]. COD is an indicator of the organic matter content and degree of stabilization of FS, which are important determinates for optimizing treatment methods. High-strength sludge from frequently emptied onsite sanitation systems is poorly stabilized, has poor dewaterability, and responds more favorably to digestion than stabilized FS. Low strength, stabilized FS generally has higher dewaterability and can be treated using settling tanks or drying beds [14]. Ammonia and pH can limit or disrupt biological and chemical processes and may reduce the efficacy of treatment [3,9]. Operational processes, such as conditioner dosing, could be improved with the ability to provide real time estimates of TS and TSS to accommodate the variability of incoming sludge [11]. Measures of TS and TSS can aid in the monitoring of solids accumulation in tanks, which is especially important with FS treatment, as solids accumulate faster than with wastewater treatment. Settling performance can be measured by the TS, TSS, and/or COD of the supernatant liquid after settling. The efficacy of treatment processes can be monitored using estimates of turbidity, TS, TSS, and COD of incoming sludge, effluent liquids and residual solids [3,10].
Extensive literature is available that summarizes the typical characteristics of wastewater [15]. Mixing that occurs in sewers contributes to the homogeneity and consistency of wastewater [16]. However, previous studies have found that FS varies widely across contexts and differs significantly from traditional wastewater. As such, the existing body of knowledge of wastewater cannot be directly applied to FS treatment [3,9]. Limited research has been published that investigates the relationship between FS parameters. Several studies have attempted to correlate measured FS characteristics with operationally useful parameters [17,18], and examined low cost and accessible measures to predict dewatering performance [19]. A study in Zambia found that FS parameters, including TS and ammonium and settling performance, could be predicted by measurements of EC and pH, observations of color and texture and containment type [20]. Previous studies did not specifically target applications for low-footprint treatment technologies, which are critical for the safe management of FS in densely populated areas, nor were the studies performed in Kenya, or in urban informal settlements. Further, previous studies did not specifically target understanding real time estimates of FS parameters, another useful tool for operating low-footprint treatment facilities where laboratory access may be difficult or time-consuming.
In this study, we examine influent FS at a waste transfer station, owned and operated by Sanergy Inc., a sanitation social enterprise operating in informal settlements in Nairobi, Kenya, where an estimated 66% of fecal waste is not safely managed and up to 80% of onsite containments are pit latrines [4,21]. This study aims to contribute to the body of knowledge of FS characterization and identify if difficult to measure parameters (e.g., COD, TSS, ammonia) pertinent to designing, operating and/or monitoring treatment facilities can be approximated by easy to measure parameters (e.g., pH, EC, turbidity, TS). This study also aims to identify if time-consuming parameters (e.g., TS, TSS, ammonia, COD) can be approximated by rapidly measured parameters (e.g., turbidity). Further, this study investigates if measured parameters (pH, EC, turbidity, TS, TSS, COD, ammonia) can help predict the settling behavior of FS. Such knowledge could aid in the design, operation and monitoring of FS treatment plants in resource-constrained areas by reducing the quantity and cost of required laboratory analysis necessary to understand FS characteristics.

2. Materials and Methods

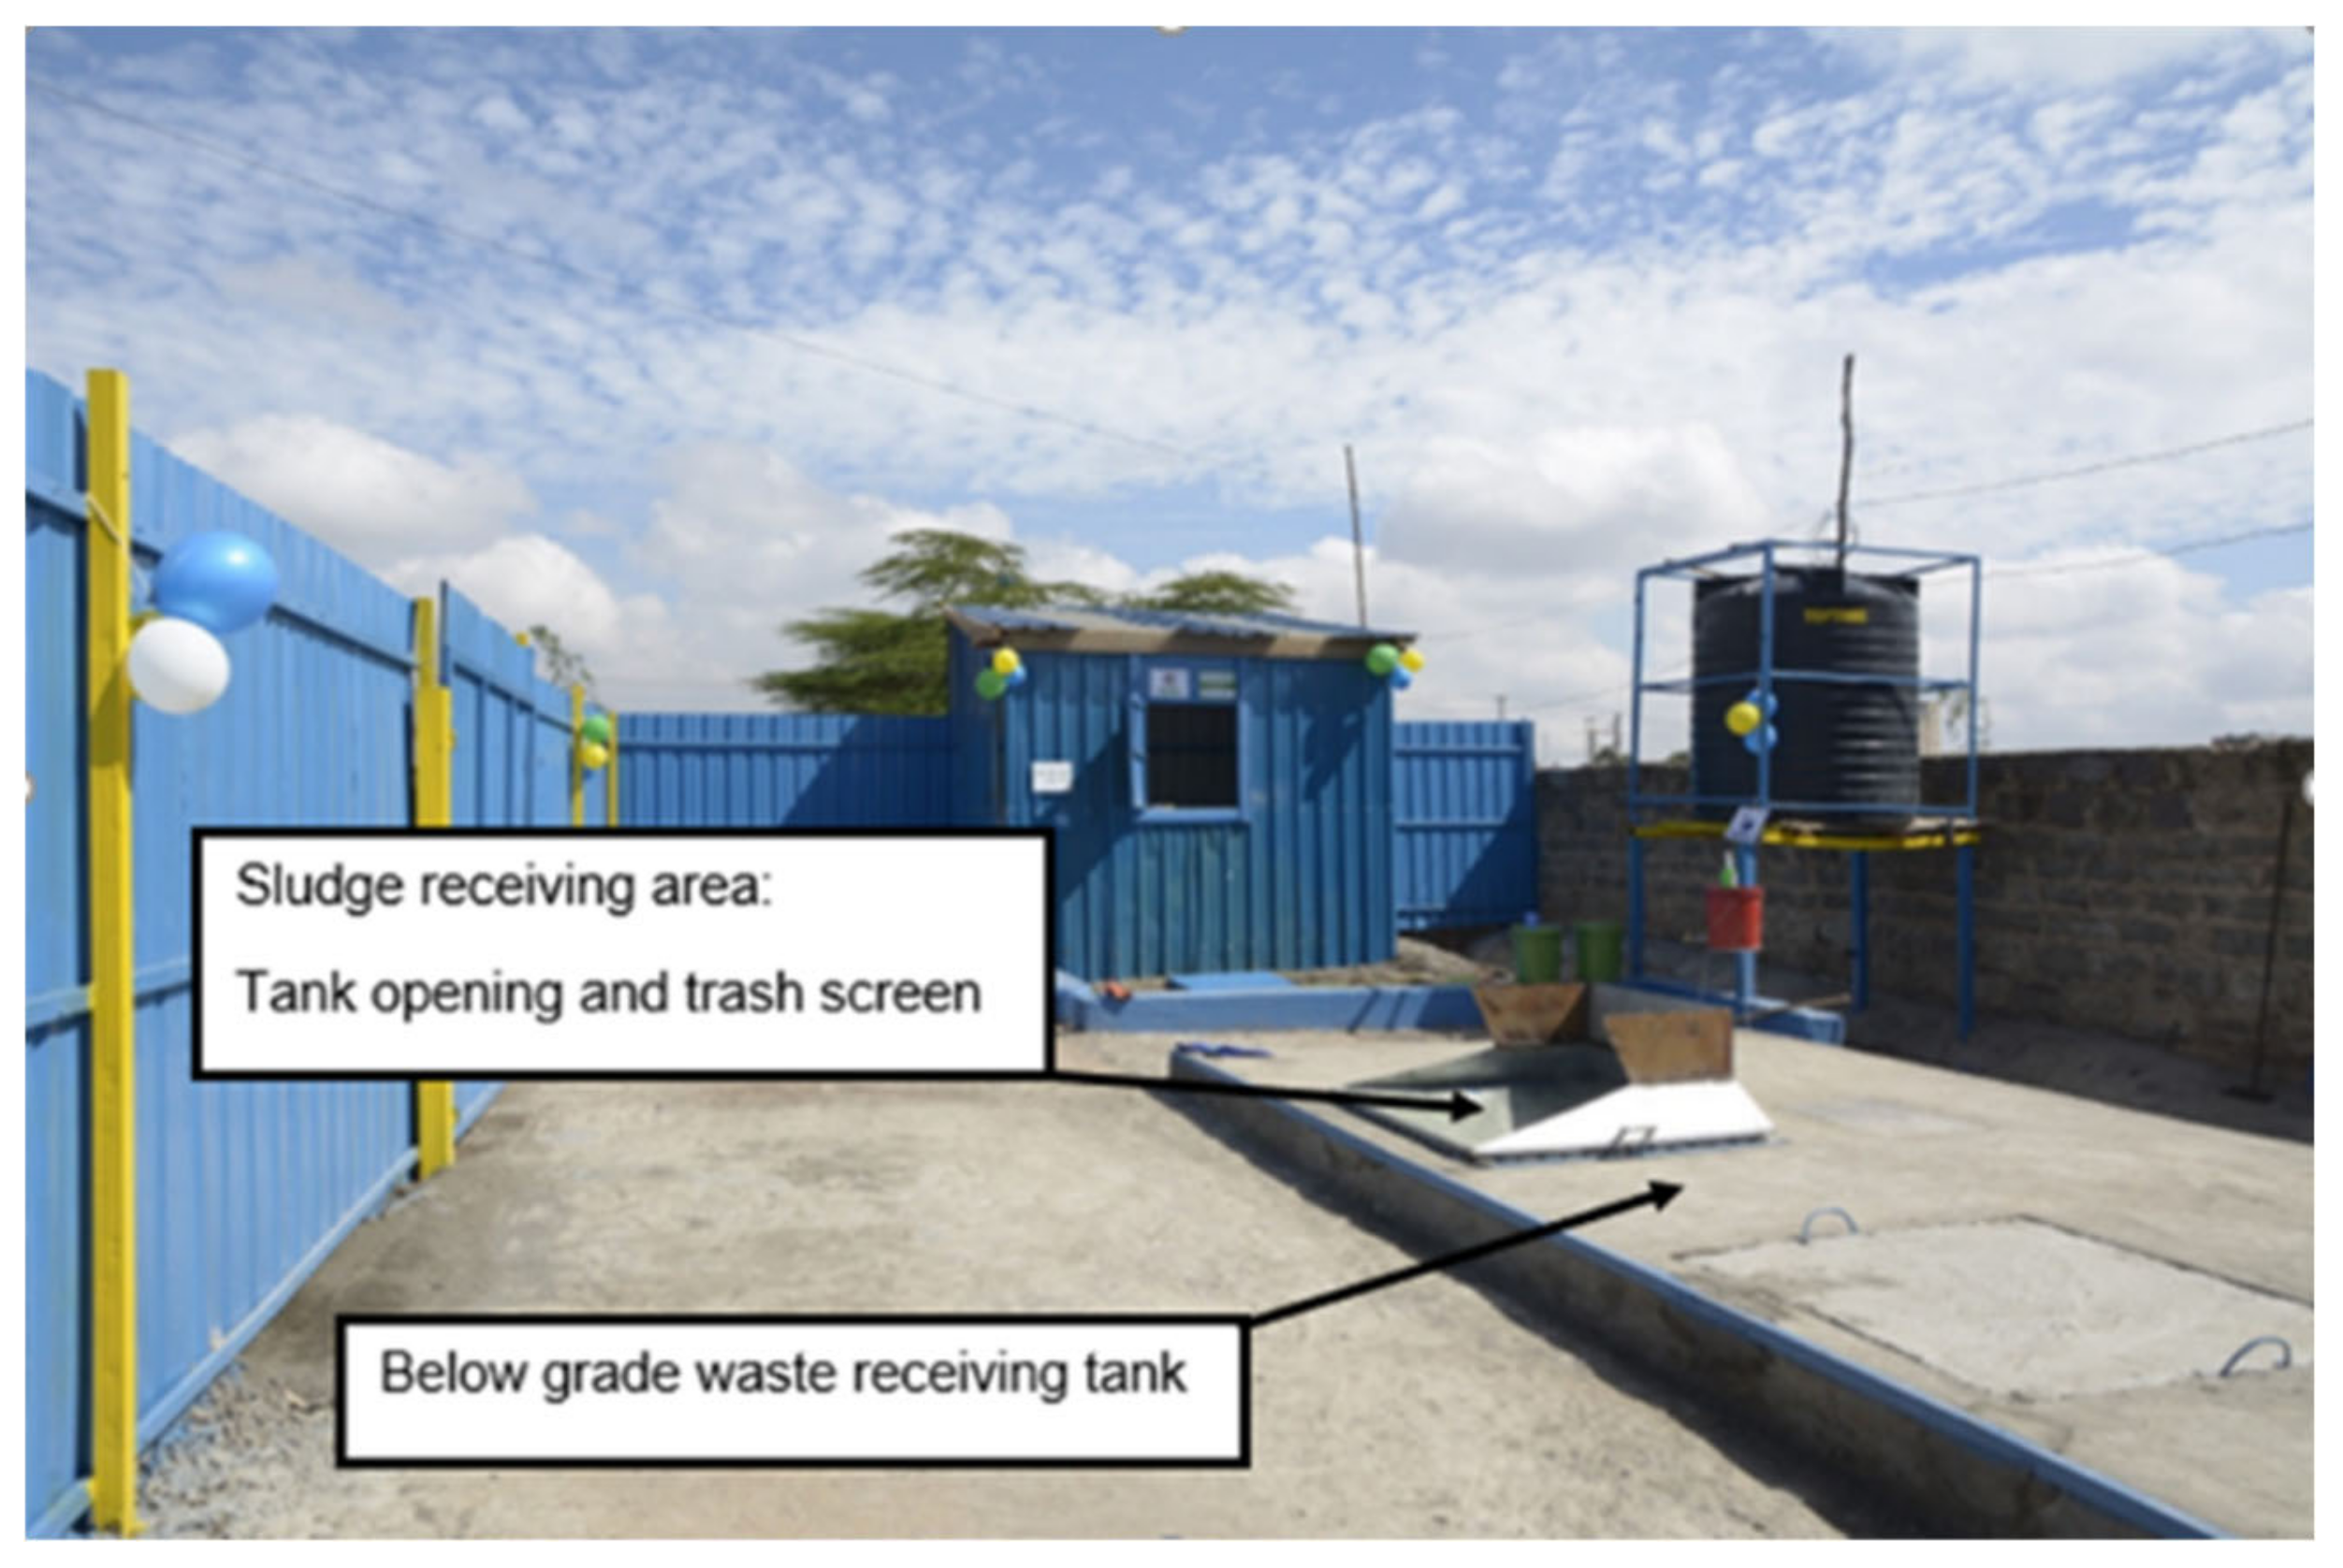
2.1. Site Description

Sanergy’s waste transfer station, Mtaa Fresh, is located in Mukuru Kwa Njenga, an informal settlement in Nairobi (Figure 1). The site contains a 28,000 L below grade tank in which the pit latrine sludge is received from manual pit emptiers, one 200 L barrel at a time. The receiving tank has a screen to aid in trash removal, as sludge is poured into the tank. Approximately 8000–10,000 L of sludge is received per day. The tank is currently emptied using an exhauster truck, as needed, depending on the amount of sludge received daily. The truck removes most of the sludge present in the tank, however, solids that have settled to the bottom of the tank are not completely removed. Complete emptying occurs manually as needed.

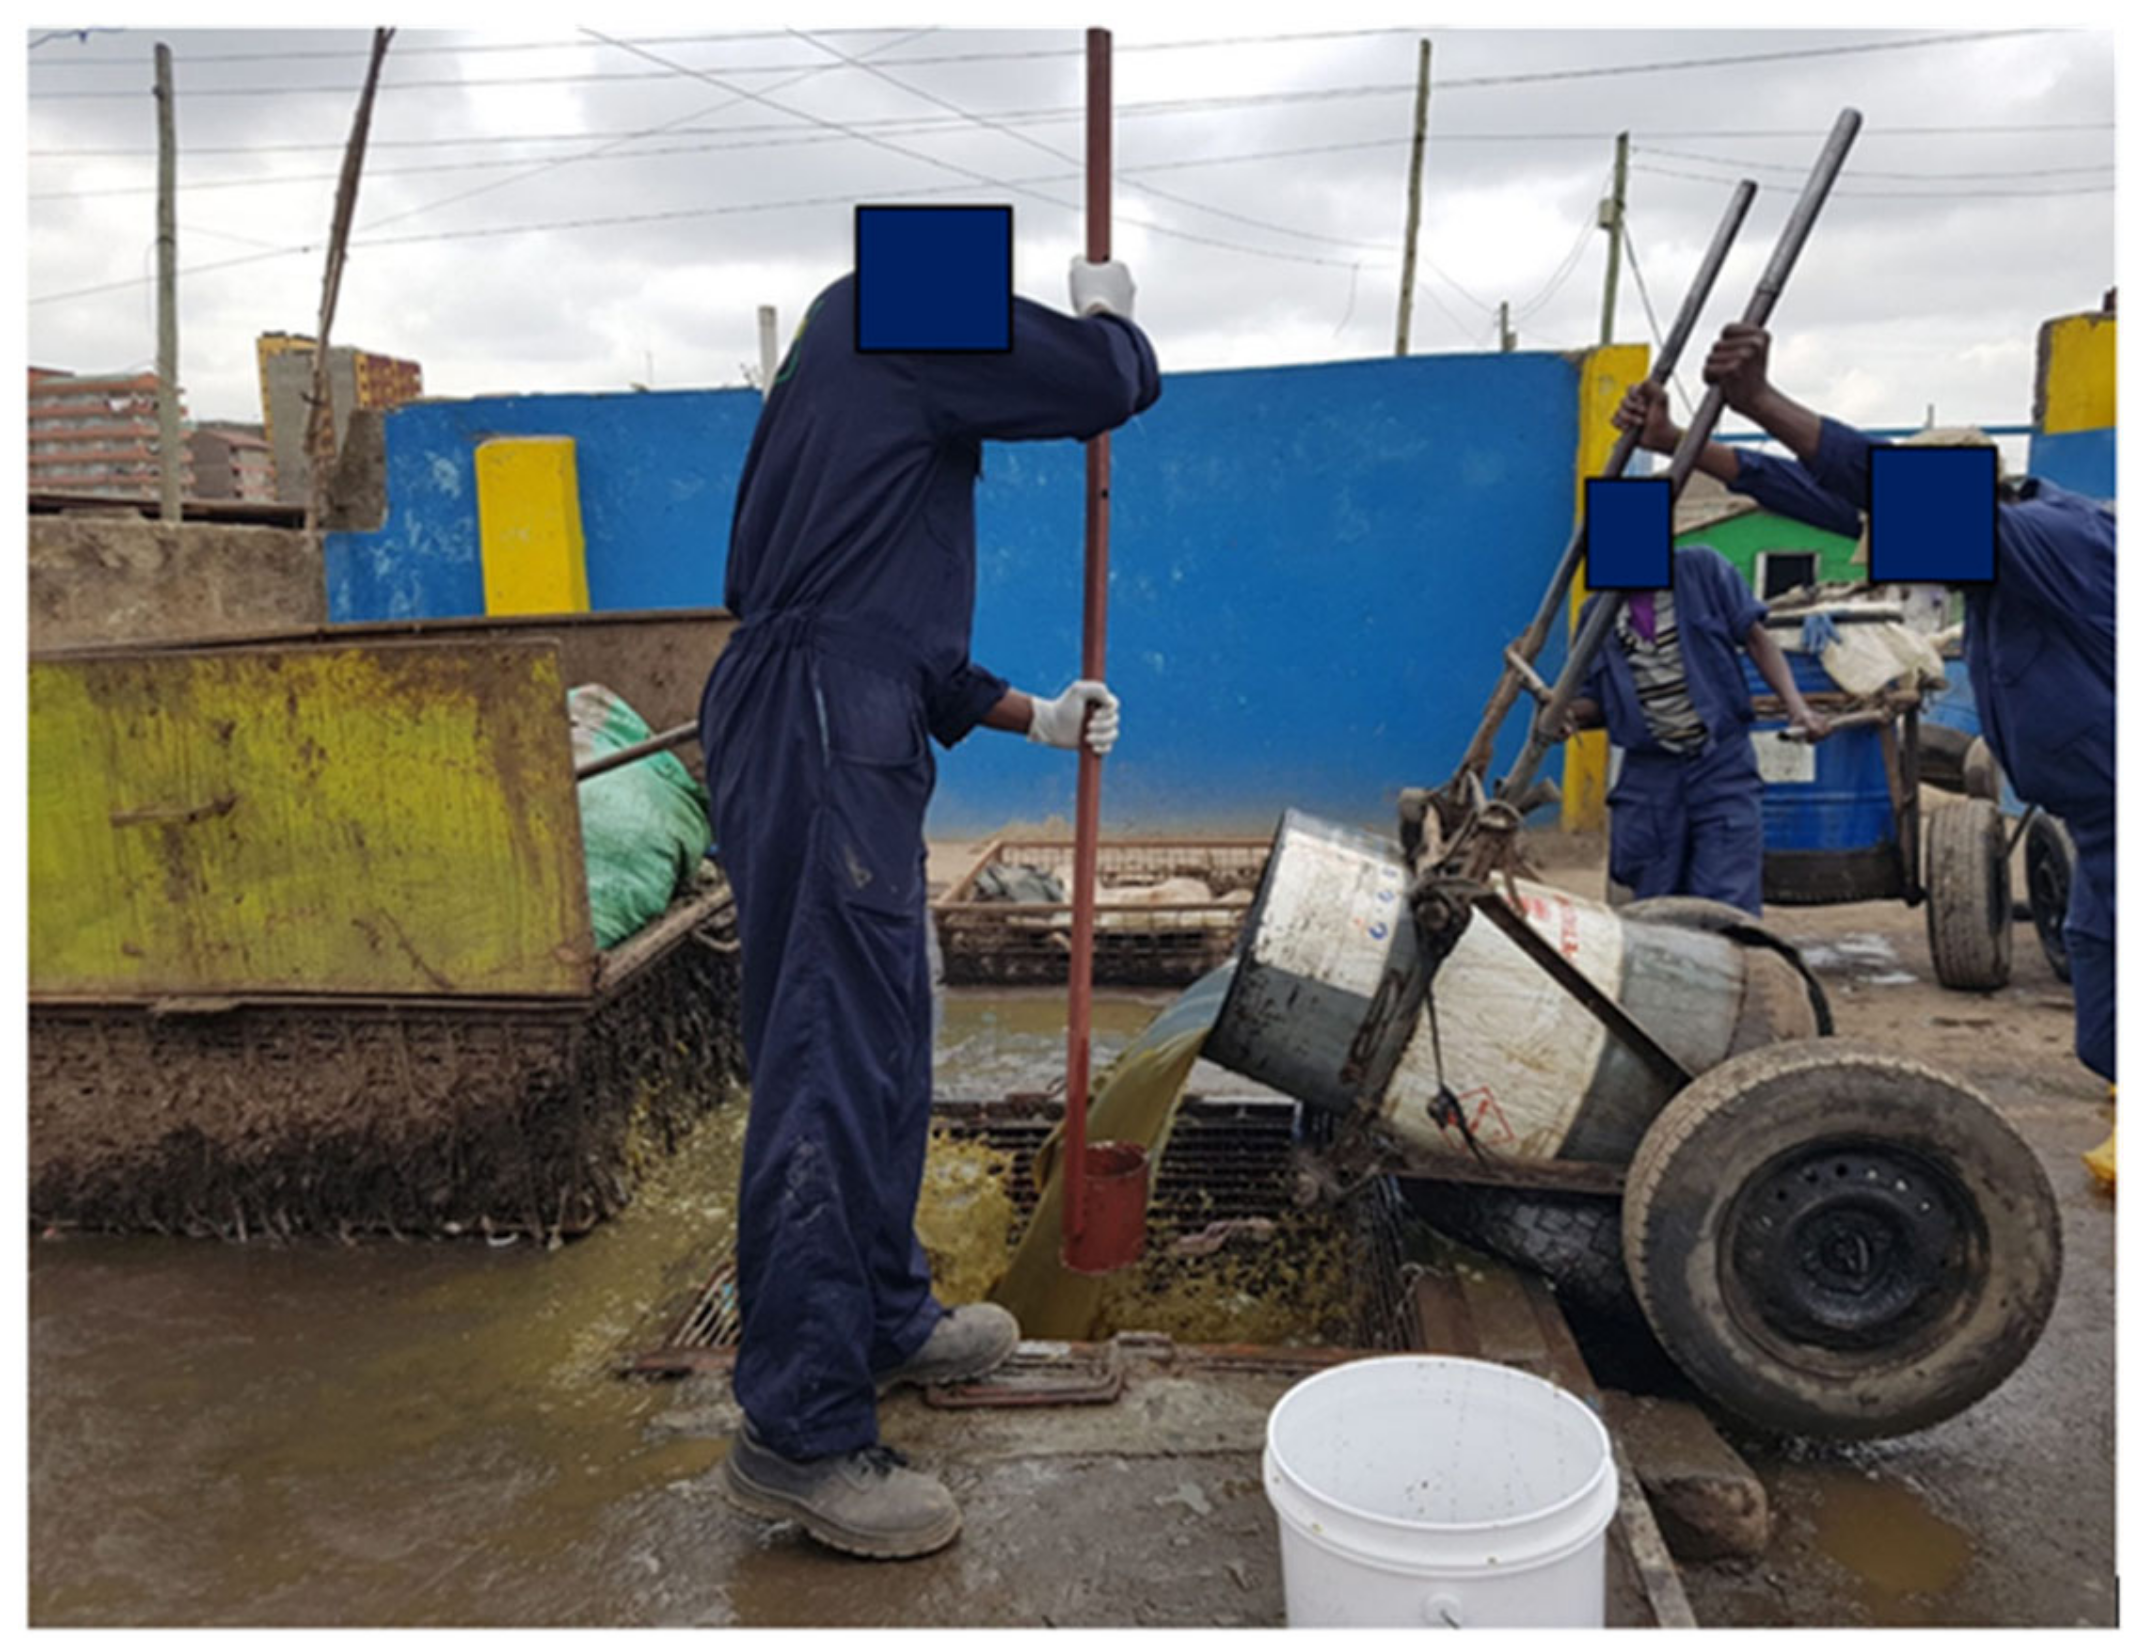
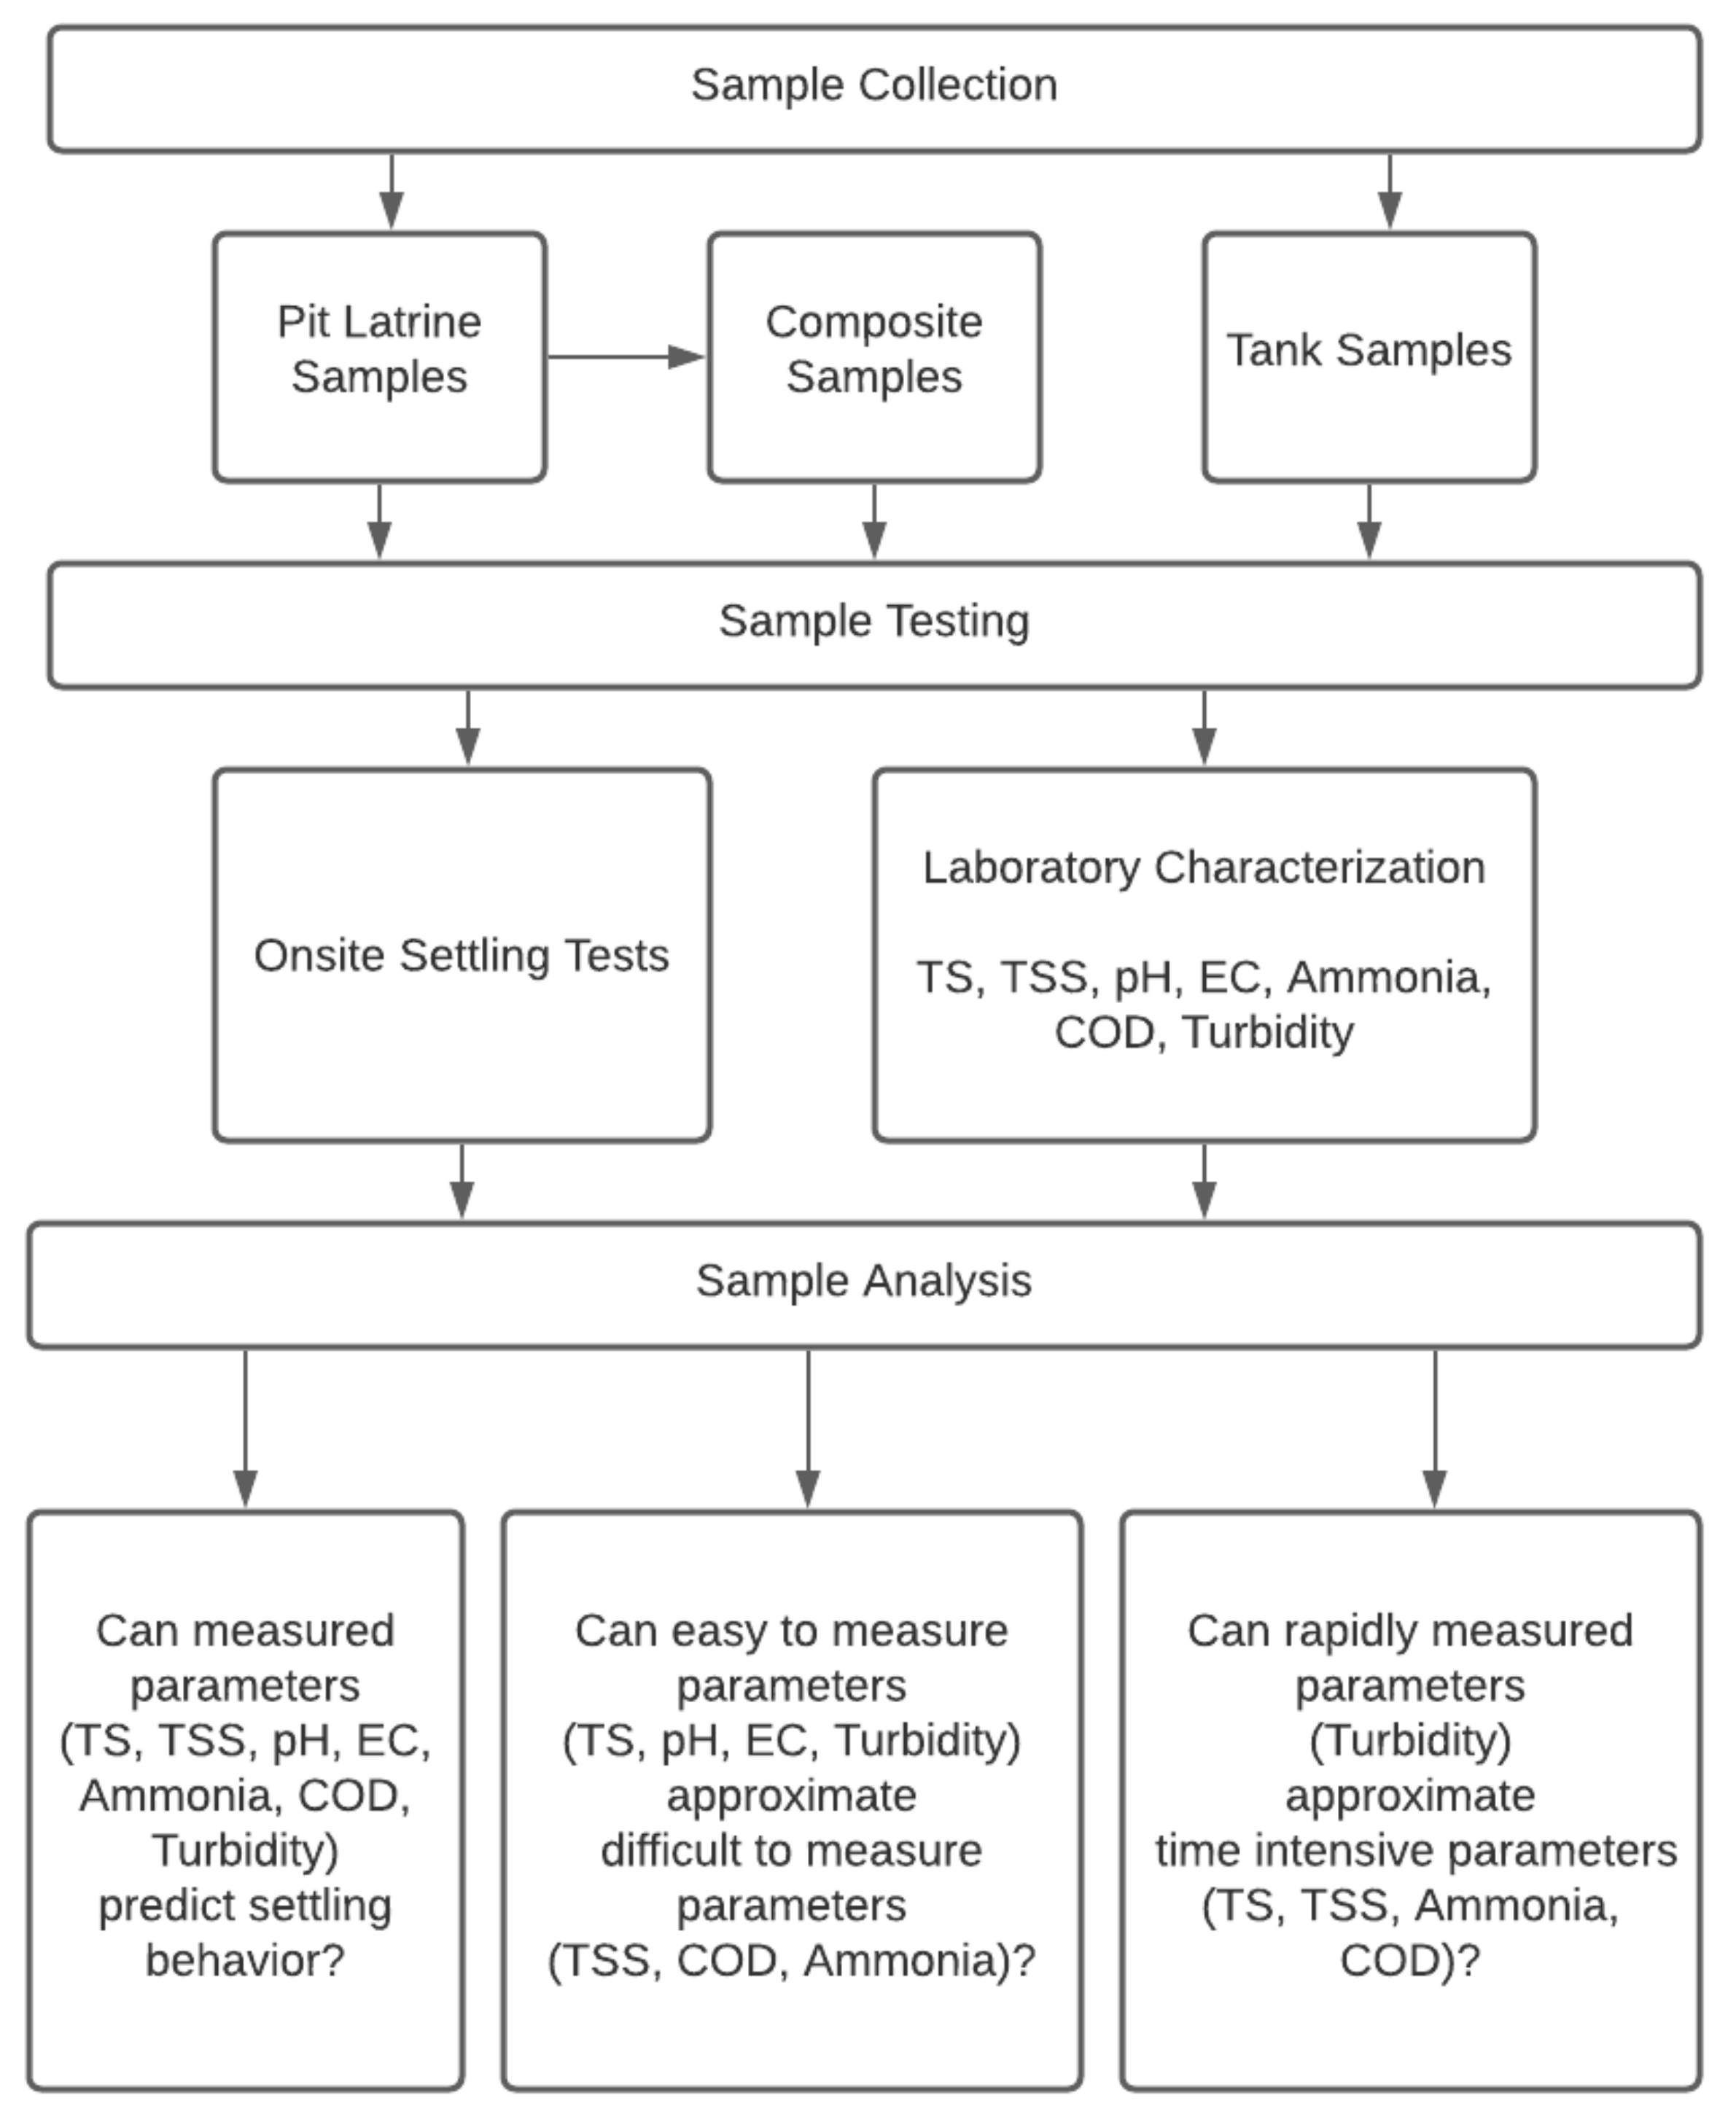
2.2. Sampling Procedure

Sampling was conducted at the Mtaa Fresh site. Sludge from 29 different pit latrines was collected over eight weeks from June to August 2019. Sludge samples were gathered during discharge using a long-handled 2 L metal scoop (Figure 2). Two 2 L samples were taken from each barrel as sludge was poured into the receiving tank, first when the barrel was 1/3 empty, and second when it was 2/3 empty to obtain a representative sample. Samples from the same pits were combined into one container, homogenized with a large wooden spoon, and 1 L cumulative samples for each pit were taken for laboratory analysis. Buckets were labeled with appropriate nomenclature and kept covered, out of direct sunlight between sample collections.
On each of the eight sampling days, an additional sample was prepared by mixing 2 L of each pit latrine sample collected that day into a 20 L container. After homogenizing the sample containing 2 L from each pit sampled that day, 1 L of the sample was collected for analysis and was referred to as a “composite” sample. Additionally, an 8 L sample from the sludge receiving tank was also collected and analyzed for each day of sampling from an opening in the top of the tank, adjacent to where sludge is discharged into the tank. The long-handled metal scoop was used to collect samples from the top, middle and lower levels of sludge within the tank.

2.3. Testing Procedures & Analysis Methods

Gravitational settling tests were completed with methods adopted from Method 6.2.13, Sludge Volume Index (SVI) testing with 22 pit samples and two tank samples at the site using graduated cylinders [22]. Samples were thoroughly mixed with a large spoon and then poured or scooped into the graduated cylinders to approximately 1000 mL. The initial sludge volume was observed and recorded. The sludge settled for one hour, at which time the total and visibly settled sludge volumes were recorded. While SVI is commonly used to evaluate the settling behavior of wastewater sludge, the variability in the settling of FS and the high concentration of FS can hinder the results of the SVI calculation with FS [22]. As a result, in this procedure, the supernatant liquid and settled solids were collected and analyzed for TS. Settling results were analyzed by calculating the percent change in the original sample TS to the supernatant liquid TS after one hour of settling.
Samples for characterization were transported to the Sanergy laboratory and to Kenya Industrial Research and Development Institute (KIRDI), an external laboratory located in Nairobi. Sample containers were kept in coolers and transferred to the refrigerator or freezer immediately upon arrival at the Sanergy laboratory. Sample containers that were prepared for Sanergy’s internal laboratory were refrigerated at 4 °C. Sample containers that were prepared for KIRDI were refrigerated at 4 °C (27 June 2019 samples) or frozen at 0 °C (3 July 2019 samples and later). Sample containers that were too large for the refrigerator were kept in cool boxes with ice packs and were monitored frequently to ensure the samples remained cool.
All 45 samples (29 pit, 8 tank, 8 composite) were analyzed for TS (g/L), pH, and EC (mS/cm). TS analyses were completed gravimetrically in duplicate or triplicate by Sanergy’s internal laboratory, within 24 h of sample collection, using methods adopted from ASTM D2216 [23]. Unit conversions relied on a density of 1 g/mL based on published literature [3]. The pH and EC were measured within 48 h of collection using a Hanna Instruments HI 2211 pH/ORP Meter and a AZ pH/mV/Cond./TDS/Temperature Meter, model 86505, respectively. Samples were brought to room temperature before pH and EC measurements were completed. Samples analyzed by KIRDI utilized standard methods for free ammonia (SM 4500-NH3-Nitrogen, g/L), turbidity (SM 2130, NTU) [13], COD (ISO 6060:1989, g/L) [24] and TSS (ISO 11923:1997, g/L) [25].
The relationships between measured parameters were evaluated using a linear regression model in RStudio Version 1.2.1335.
Figure 3 outlines the process for sample collection, sample testing, and sample analysis.

3. Results

3.1. Lab Characterization

Lab characterization results were evaluated in four groups as summarized in Table 1—all sample results, pit samples individually, composite samples individually, and tank samples individually, as summarized in Table 1. Both median and mean values were reported because FS characteristics are typically not normally distributed [17,26]. Comparisons to previous studies are summarized in Table 2.
The standard deviation for the composite samples is lowest for all analyzed laboratory parameters, excluding EC, suggesting that variability may be reduced when incoming sludge is mixed in a receiving facility.
Tank samples varied notably from individual pits and composite samples, likely due to current site operations and tank emptying procedures. Tank samples had higher mean TS, TSS, turbidity, COD, and ammonia than pit and composite samples. EC for tank samples was lower and had less variation than for pit and composite samples. pH was the most consistent across sample types, with the mean and standard deviation varying by 0.1.
Results in this study are comparable to previously reported median values for FS from pit latrines in Uganda [17,27] and Zambia [20], as summarized in Table 2.
Turbidity of raw fecal sludge has not been reported in other studies. Turbidity has been used to qualify results of settling tests and show the relationship between a sample’s supernatant turbidity after prolonged settling and various lab parameters [19].

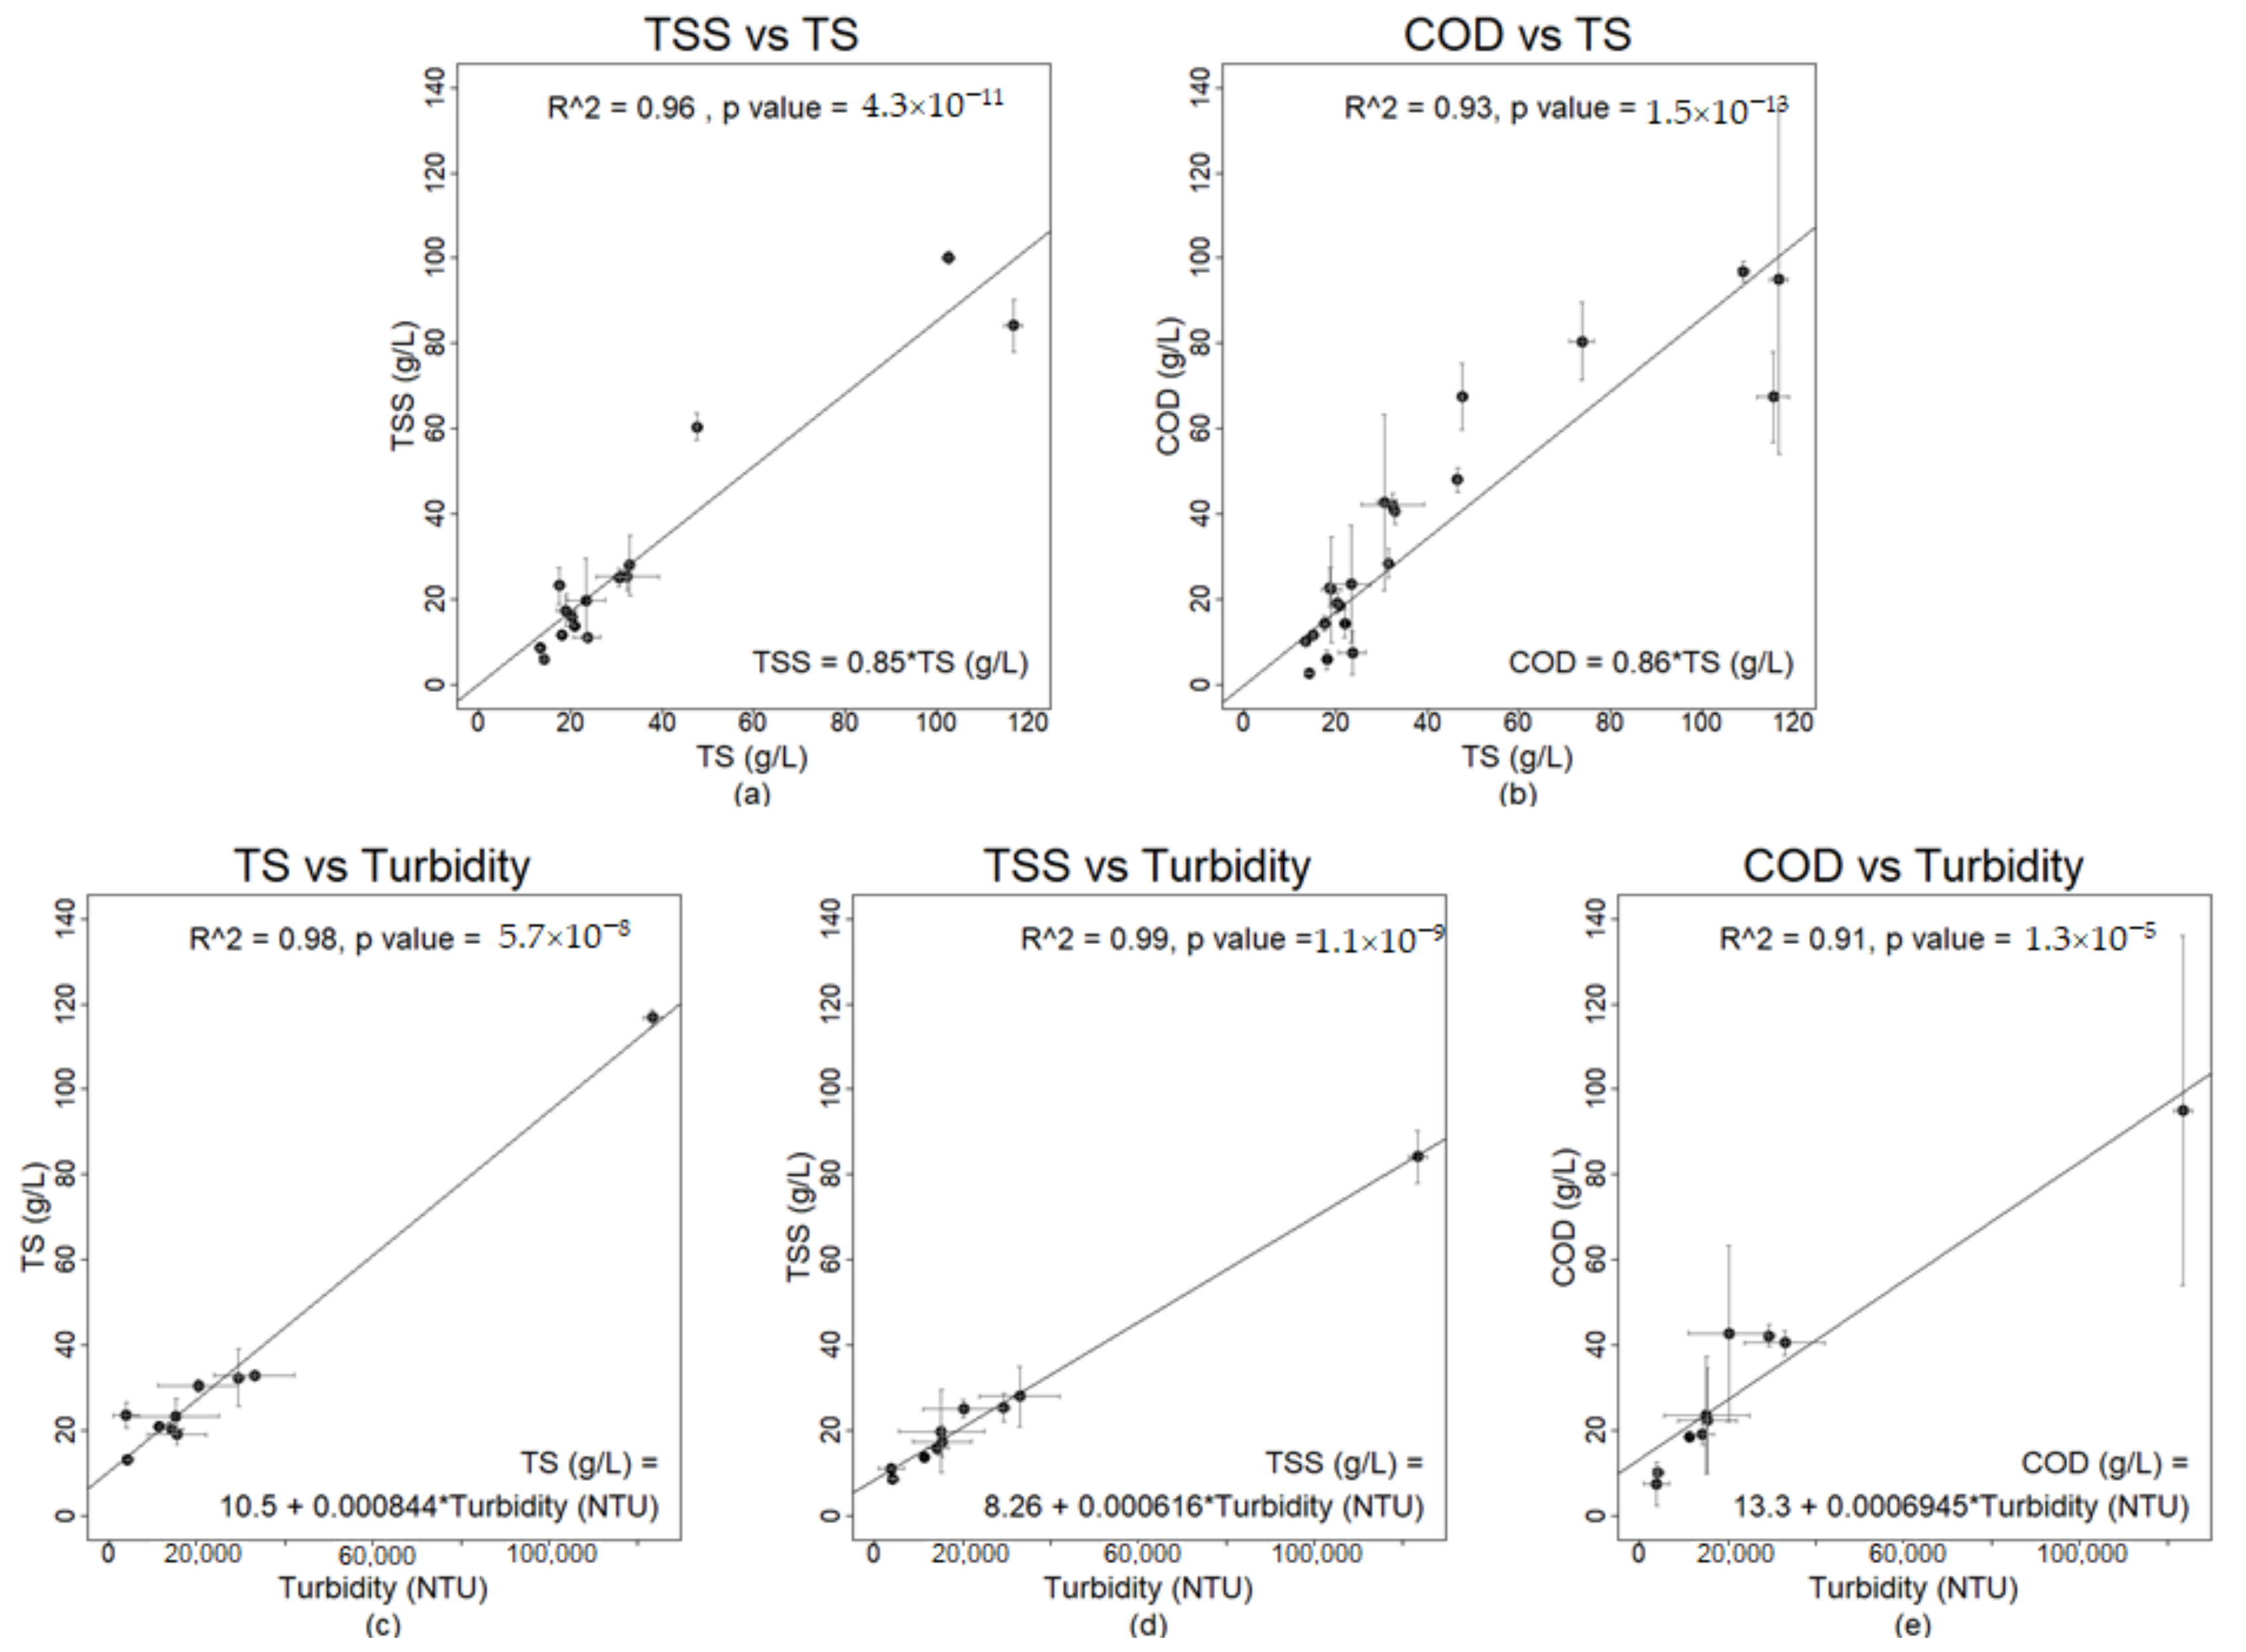
3.2. Relationships of Measured Parameters

The relationship between measured parameters was assessed using all samples. Significant relationships were found between TS and turbidity (p-value = 5.7 × 10⁻⁸, R2 = 0.98), TSS (p-value = 4.3 × 10⁻¹¹, R2 = 0.96), and COD (p-value = 1.5 × 10⁻¹², R2 = 0.93). Significant relationships were found between turbidity and TSS (p-value = 1.1 × 10⁻⁹, R2 = 0.99) and COD (p-value = 1.3 × 10⁻⁵, R2 = 0.91). Linear relationships with standard deviation error bars for sample replicates are shown in Figure 4.
Significant (p-value < 0.05) relationships between TS and pH, and TS and free ammonia were not found. A significant p-value (5−04) was calculated for the relationship between TS and EC, but visual inspection of the plot and the R2 value of 0.23 concluded that the linear model between these variables was not operationally reliable.

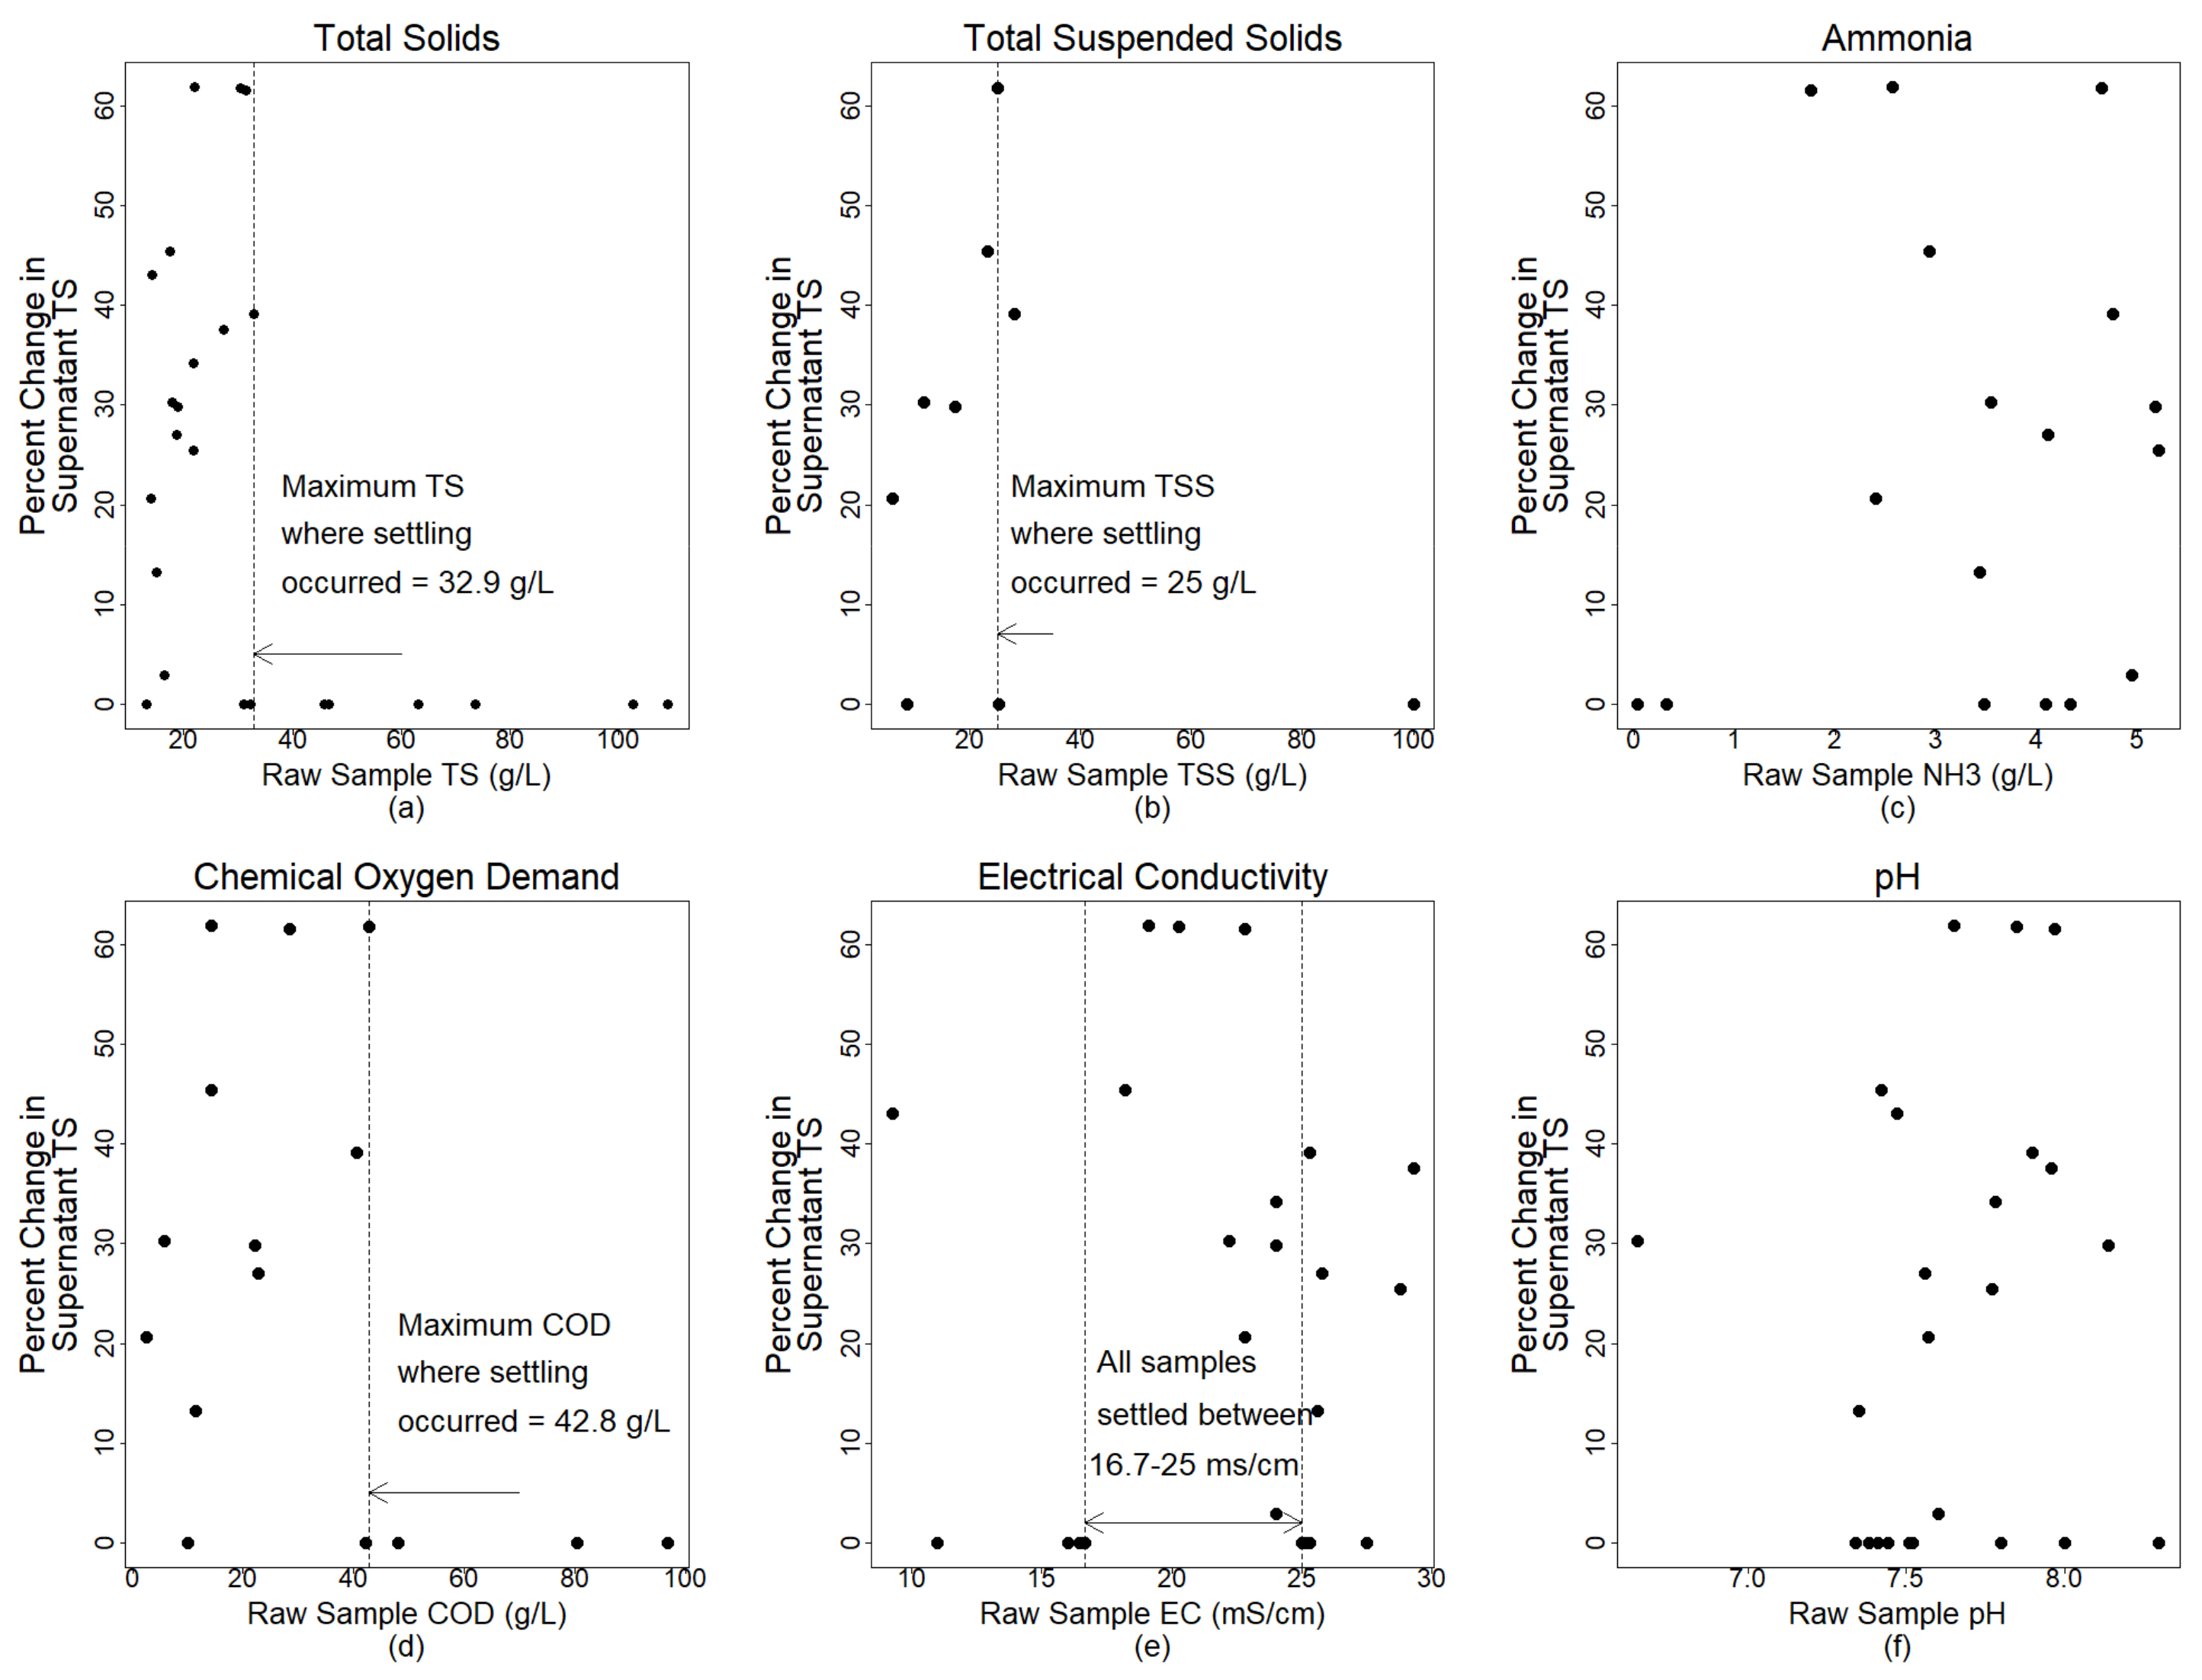
3.3. Onsite Settling

Onsite settling results ranged from no change in the supernatant TS to a reduction of 61.9% from the raw sample to the supernatant liquid TS. An upper limit was evident for multiple laboratory parameters (TS, COD, TSS), above which settling did not occur, as indicated by dotted vertical lines in Figure 2. Settling did not occur for samples where the measured values of the raw sludge exceeded the upper limit for the particular laboratory parameter.
For samples with TS less than 32.9 g/L, TS was not directly related to the percent change in supernatant TS, likely due to typical settling phenomena observed in wastewater treatment, where settling is dependent on particle size and density [15].
All samples within the range of EC indicated by vertical dotted lines on Figure 5 settled, with the three best performing samples included in that range. Free ammonia and pH did not appear to be related to settling behavior. However, the two samples with the lowest values for ammonia did not settle.

4. Discussion

4.1. Characterization

Results in this study are comparable to previously reported median values for FS from pit latrines in Uganda [17,27], and Zambia [20], suggesting the results of this study may be informative of FS characteristics in other cities.
The reduction in variability observed in composite samples indicates the use of reception facilities, such as holding or mixing tanks, may help reduce variability across incoming FS. This conclusion supports the proposal that understanding FS parameters at a neighborhood or city-wide scale, rather than at a containment level scale, may be more feasible and useful for designing treatment facilities [17]. This is especially helpful in decision-making in treatment design in space-constrained areas. Waste transfer stations in densely populated areas may face severe space limitations [28]. In areas where space for mixing tanks is limited, understanding the magnitude of reduction in variability as a result of mixing is extremely important to assist in decision-making processes for the utilization of space. For FS that sees considerable reductions in variability as a result of mixing, mixing tanks may be a high priority when planning site layouts. One example of a treatment process where reducing variability is especially important is with conditioner dosing for flocculation in settling or dewatering applications, which are common treatment steps in resource-constrained contexts [11,29]. Appropriate dosing is heavily dependent on the TS and TSS of incoming sludge, which can fluctuate widely. Because both underdosing and overdosing can result in poor flocculation, accurate dosing is important and may require frequent adjustment in response to variable incoming sludge. Operational challenges of underdosing or overdosing include the poor settling of FS or the clogging of drying beds or geotextiles. A reduction in variability of incoming TS and TSS may help stabilize dosing rates and frequency to improve the overall treatment process [11,20].
In cases where mixing tanks do not reduce variability enough to influence treatment operations, directly treating individual loads may be considered. While uncommon with centralized wastewater treatment, some FS treatment methods process individual loads at a time. In research conducted by Sanivation in Naivasha, Kenya, a pilot-scale set up was designed to process sludge from one vacuum truck at a time utilizing polymer flocculant and geotextiles [12].

4.2. Relationships of Measured Parameters

Understanding localized characteristics of FS is important to help achieve treatment objectives. Establishing relationships between measured FS parameters at a neighborhood or city-wide scale may provide information relevant to the design and operation of treatment processes, while reducing the requirements of laboratory analysis and time [17,18]. The identified relationships between TS and measured parameters, including TSS and COD, may be helpful for the design, operation and selection of treatment processes, such as settling tanks, drying beds, and/or digesters [3,9]. While TS analysis does not provide real time information, it provides a relatively simple and affordable test that can be used to predict TSS and COD values, which typically require more extensive and expensive laboratory procedures [18]. Data from six studies in sub-Saharan Africa and Asia show considerable variation of the relationship between COD and TS in FS across cities, with slopes ranging from 0.89 to 1.5, likely attributed to varying organic matter within the FS. This study found nearly the same relationship between COD and TS (COD = 0.86*TS, R2 = 0.93) as in Ouagadougou, Burkina Faso (COD = 0.89*TS, R2 = 0.84) [18]. While the relationships between COD and TS may not be transferrable across cities [18], the similarity of results of this study in Nairobi and the study in Ouagadougou, Burkina Faso, suggest the potential for establishing an empirical relationship that can be used more widely for FS analysis.
The relationships between turbidity and TS and TSS may be helpful for the operation of treatment processes, including conditioning. Real time TS and/or TSS estimates, obtained from field turbidity measurements, may be useful for the implementation of conditioner dosing for flocculation at treatment facilities where operators are required to monitor and adjust dosing based on changing sludge characteristics [3]. While limitations of turbidity measurements include a lack of precision, especially at values that exceed 1000 NTU [13], there are practical applications that have utilized turbidity measurements. Studies in the field of stormwater management show that turbidity can be used as a proxy for TSS in combined sewer systems and for monitoring catchments [30,31]. Turbidity has been used to qualify results of FS settling tests by evaluating the relationship between supernatant turbidity after prolonged settling and various lab parameters [19]. Estimates of turbidity are useful for process control [15] and can provide estimates of design parameters based on the relationships with other measured parameters provided above. While field measurements of FS turbidity will likely require dilution, turbidity can be measured rapidly and provide instant approximations of other parameters [13]. Estimates of TS, TSS, and COD can provide real-time data to monitor settling performance and the efficacy of treatment processes [11]. The ability to monitor incoming sludge and effluent solids and liquids with near instant results will allow for immediate data related to process control, treatment goals, and compliance with effluent standards [3].

4.3. Onsite Settling

While studies of the settling behavior of FS are limited, a study in Senegal and Tanzania indicated that FS settling performance decreased as pH and EC increased [19], whereas this study showed little effect of pH on settling, and higher EC values suggested increased settling. The contrast of these results indicates that FS settling behaviors vary across contexts and further studies are required to increase understanding of FS settling behavior.
Understanding upper limits of where settling is expected to occur is important for planning treatment steps. The categorization of FS based on settling behavior may facilitate multiple waste streams, which are mixed at a designated proportion to increase treatment efficacy, as demonstrated in drying bed and co-composting applications in Ghana [29]. In a space-constrained area, multiple waste streams could be implemented to prioritize site layout considerations. For example, an initial treatment step, such as a settling tank can be completed onsite at the waste transfer facility, while final treatment occurs offsite [14]. Completing an initial treatment phase at a waste transfer site may allow for significant volume reduction, which reduces the burden and cost of transporting sludge to a centralized treatment facility [32].

5. Conclusions

The relationship of easy to measure parameters (e.g., turbidity, TS) and difficult to measure parameters (e.g., TSS, COD), as well as the relationship between rapidly measured parameters (i.e., turbidity) and time-consuming parameters (e.g., TS, TSS, COD) allows for the prediction of characteristics and settling behavior of the FS analyzed in this study. These are useful parameters for design considerations, including organic, and solid loading rates for FS treatment processes, including settling tanks and drying beds and for operational considerations, such as conditioner dosing and solids accumulation. The accessibility of FS characteristics provided by understanding the relationships between easy to measure and difficult to measure parameters, as well as rapidly measured and time-intensive parameters is especially useful for the design and implementation of FS treatment in resource-constrained areas. The measured parameters in this study fell within expected ranges and demonstrated less variability in composite samples than in samples from individual pit latrines, suggesting that implementing receiving facilities, such as holding or mixing tanks, may aid in the treatment of FS by offering both storage and a decrease in variability. Upper limits and ranges of laboratory parameters of where settling occurred were apparent. Future areas of suggested research include the investigation of settling behavior of FS, the continued investigation of FS characterization and relationships between measured parameters. Increasing our understanding of FS characteristics and the relationships between measured parameters can increase our ability to effectively and safely manage FS, particularly in resource-constrained areas.

Author Contributions

Conceptualization, K.J., L.R.-D., B.J.W., W.M., L.S. and E.T.; data curation, K.J.; formal analysis, K.J., L.R.-D. and B.J.W.; funding acquisition, L.S. and E.T.; investigation, K.J., L.R.-D. and E.G.; methodology, K.J., L.R.-D. and B.J.W.; project administration, W.M. and E.T.; resources, E.G.; software, K.J. and L.R.-D.; supervision, L.S. and E.T.; validation, B.J.W.; visualization, K.J.; writing—original draft, K.J., L.R.-D. and B.J.W.; writing—review & editing, E.G., W.M., L.S. and E.T. All authors have read and agreed to the published version of the manuscript.

Funding

This research was funded by Sanergy, Inc. and the University of Colorado Boulder.

Acknowledgments

University of Colorado-Boulder Mortenson Center in Global Engineering, Eawag: Swiss Federal Institute of Aquatic Science and Technology, Sanergy Team Members: Thomas Onsoti, Jared Owino, David Gwili, Irene Shikami, Douglas Lifede, Valbet Adera, Eunice Muthui.

Conflicts of Interest

The authors declare no conflict of interest.

References

  1. World Health Organization, UNICEF. Progress on Drinking Water, Sanitation and Hygiene: 2017 Update and SDG Baselines; UNICEF: Geneva, Switzerland, 2017. [Google Scholar]
  2. Strande, L. The Global Situation. In Faecal Sludge Management-Systems Approach for Implementation and Operation; Strande, L., Ronteltap, M., Brdjanovic, D., Eds.; IWA Publishing: London, UK, 2014; pp. 1–14. ISBN 9781780404738. [Google Scholar]
  3. Tayler, K. Faecal Sludge and Septage Treatment, A Guide for Low and Middle Income Countries; Practical Action Publishing Ltd.: Rugby, UK, 2018; ISBN 978-1-78044-987-6. [Google Scholar]
  4. Republic of Kenya Ministry of Health. Kenya Environmental Sanitation and Hygiene Policy 2016–2030; Republic of Kenya Ministry of Health: Nairobi, Kenya, 2016.
  5. Tilley, E.; Ulrich, L.; Lüthi, C.; Reymond, P.; Zurbrügg, C. Compendium of Sanitation Systems and Technologies, 2nd ed.; Eawag: Dübendorf, Switzerland, 2014. [Google Scholar]
  6. Nelson, K.L.; Murray, A. Sanitation for Unserved Populations: Technologies, Implementation Challenges, and Opportunities. Annu. Rev. Environ. Resour. 2008, 33, 119–151. [Google Scholar] [CrossRef]
  7. Peal, A.; Evans, B.; Blackett, I.; Hawkins, P.; Heymans, C. A Review of Fecal Sludge Management in 12 Cities. J. Water Sanit. Hyg. Dev. 2014, 4, 563–575. [Google Scholar] [CrossRef]
  8. Dodane, P.-H.; Ronteltap, M. Unplanted Drying Beds. In Faecal Sludge Management–Systems Approach for Implementation and Operation; Strande, L., Ronteltap, M., Brdjanovic, D., Eds.; IWA Publishing: London, UK, 2014; pp. 141–153. ISBN 9781780404738. [Google Scholar]
  9. Niwagaba, C.B.; Mbéguéré, M.; Strande, L. Faecal Sludge Quantification, Characterisation and Treatment Objectives. In Faecal Sludge Management–Systems Approach for Implementation and Operation; Strande, L., Ronteltap, M., Brdjanovic, D., Eds.; IWA Publishing: London, UK, 2014; pp. 19–43. ISBN 9781780404738. [Google Scholar]
  10. Bassan, M.; Robbins, D.M. Operation, Maintenance and Monitoring of Faecal Sludge Treatment Plant. In Faecal Sludge Management: Systems Approach for Implementation and Operation; Strande, L., Ronteltap, M., Brdjanovic, D., Eds.; IWA Publishing: London, UK, 2014; pp. 231–253. ISBN 9781780404738. [Google Scholar]
  11. Ward, B.; Strande, L. Conditioning. In Faecal sludge management: Highlights and Exercises; Englund, M., Strande, L., Eds.; Eawag: Swiss Federal Institute of Aquatic Science and Technology: Dübendorf, Switzerland, 2019; ISBN 9783906484709. [Google Scholar]
  12. Ward, B.J.; Septien, S.; Ronteltap, M.; Strande, L. Experimental design for the development, transfer, scale-up, and optimization of treatment technologies: Case studies of dewatering and drying. In Methods for Faecal Sludge Analysis; Velkushanova, K., Strande, L., Ronteltap, M., Koottatep, T., Brdjanovic, D., Buckley, C., Eds.; IWA Publishing: London, UK; ISBN 9781780409115.
  13. APHA. Standard Methods for the Examination of Water and Wastewater; APHA: Washington, DC, USA, 2017. [Google Scholar]
  14. Dodane, P.-H.; Bassan, M. Settling-Thickening Tanks. In Faecal Sludge Management - Systems Approach for Implementation and Operation; Strande, L., Ronteltap, M., Brdjanovic, D., Eds.; IWA Publishing: London, UK, 2014; pp. 123–139. ISBN 9781780404738. [Google Scholar]
  15. Tchobanoglous, G.; Stensel, D.H.; Tsuchihash, R.; Burton, F.; Abu-Orf, M.; Bowden, G.; Pfrang, W. Wastewater Engineering, Treatment and Resource Recovery, 5th ed.; Metcalf & Eddy, Ed.; McGraw-Hill Education: New York, NY, USA, 2014. [Google Scholar]
  16. Englund, M.; Strande, L. What is faecal sludge? In Faecal Sludge Management: Highlights and Exercises; Englund, M., Strande, L., Eds.; IWA Publishing: Dübendorf, Switzerland, 2019; ISBN 978-3-906484-70-9. [Google Scholar]
  17. Strande, L.; Schoebitz, L.; Bischoff, F.; Ddiba, D.; Okello, F.; Englund, M.; Ward, B.J.; Niwagaba, C.B. Methods to reliably estimate faecal sludge quantities and qualities for the design of treatment technologies and management solutions. J. Environ. Manag. 2018, 223, 898–907. [Google Scholar] [CrossRef] [PubMed]
  18. Strande, L.; Englund, M.; Andriessen, N.; Cabajal, J.P.; Scheidegger, A. Estimating quantities and qualities (Q&Q) of faecal sludge at community to citywide scales. In Methods for Faecal Sludge Analysis; Velkushanova, K., Strande, L., Ronteltap, M., Koottatep, T., Brdjanovic, D., Buckley, C., Eds.; IWA Publishing: London, UK, in press; ISBN 9781780409115.
  19. Ward, B.J.; Traber, J.; Gueye, A.; Diop, B.; Morgenroth, E.; Strande, L. Evaluation of conceptual model and predictors of faecal sludge dewatering performance in Senegal and Tanzania. Water Res. 2019, 167. [Google Scholar] [CrossRef] [PubMed]
  20. Ward, B.J.; Andriessen, N.; Grau, M.; Scheidegger, A.; Tembo, J.; Kabika, J.; Morgenroth, E.; Strande, L. Predictive models from cheap and easy measurements: Can they fill the gap in online monitoring at faecal sludge treatment plants? Prep. Submiss. to Water Res. in press.
  21. Dewhurst, R. SFD Thinking–SFD Creation Process and Impacts (Case of Nairobi, Kenya); Susana: Eschborn, Germany, 2018. [Google Scholar]
  22. Torfs, E.; Nopens, I.; Winkler, M.K.; Vanrolleghem, P.A.; Balemans, S.; Smets, I.Y. Settling Tests. In Experimental Methods In Wastewater Treatment; Daigger, G.T., Takács, I., Eds.; IWA Publishing: London, UK, 2016; Volume 9781780404, pp. 235–262. ISBN 9781780404752. [Google Scholar]
  23. ASTM International D2216-19 Standard Test Methods for Laboratory Determination of Water (Moisture) Content of Soil and Rock by Mass. 2019. Available online: https://www.astm.org/Standards/D2216 (accessed on 29 October 2020).
  24. ISO. Water Quality–Determination of the Chemical Oxygen Demand, ISO 6060:1989; ISO: Geneva, Switzerland, 2017; Available online: https://www.iso.org/standard/12260.html (accessed on 29 October 2020).
  25. ISO. Water Quality–Determination of Suspended Solids by Filtration through Glass-Fibre Filters, ISO 11923:1997; International Organization for Standardization: Geneva, Switzerland, 2017; Available online: https://www.iso.org/standard/20654.html (accessed on 29 October 2020).
  26. Schmid, H.; Huber, A. Measuring a small number of samples, and the 3v fallacy: Shedding light on confidence and error intervals. IEEE Solid State Circuits Mag. 2014, 6, 52–58. [Google Scholar] [CrossRef]
  27. Gold, M.; Harada, H.; Therrien, J.-D.; Nishida, T.; Cunningham, M.; Semiyaga, S.; Fujii, S.; Dorea, C.; Nguyen, V.-A.; Strande, L. Cross-country analysis of faecal sludge dewatering. Environ. Technol. 2017. [Google Scholar] [CrossRef] [Green Version]
  28. Semiyaga, S.; Okure, M.A.E.; Niwagaba, C.B.; Katukiza, A.Y.; Kansiime, F. Decentralized options for faecal sludge management in urban slum areas of Sub-Saharan Africa: A review of technologies, practices and end-uses. Resour. Conserv. Recycl. 2015, 104, 109–119. [Google Scholar] [CrossRef] [Green Version]
  29. Ronteltap, M.; Dodane, P.-H.; Bassan, M. Overview of Treatment Technologies. In Faecal Sludge Management–Systems Approach for Implementation and Operation; Strande, L., Ronteltap, M., Brdjanovic, D., Eds.; IWA Publishing: London, UK, 2014; pp. 97–120. ISBN 9781780404738. [Google Scholar]
  30. Hannouche, A.; Chebbo, G.; Ruban, G.; Tassin, B.; Lemaire, B.J.; Joannis, C. Relationship between turbidity and total suspended solids concentration within a combined sewer system. Water Sci. Technol. 2011, 64, 2445–2452. [Google Scholar] [CrossRef]
  31. Rügner, H.; Schwientek, M.; Beckingham, B.; Kuch, B.; Grathwohl, P. Turbidity as a proxy for total suspended solids (TSS) and particle facilitated pollutant transport in catchments. Environ. Earth Sci. 2013, 69, 373–380. [Google Scholar] [CrossRef]
  32. Ingallinella, A.M.; Sanguinetti, G.; Koottatep, T.; Montangero, A.; Strauss, M. The challenge of faecal sludge management in urban areas - Strategies, regulations and treatment options. Water Sci. Technol. 2002, 46, 285–294. [Google Scholar] [CrossRef]
Figure 1. The Mtaa Fresh site contains a below grade tank in which pit latrine sludge is received from manual pit emptiers in Mukuru Kwa Njenga in Nairobi, Kenya. FS is delivered to the site in barrels. The contents of the barrels are tipped through a trash screen and into the tank. Photo Credit: Sanergy.
Sustainability 12 09040 g001
Figure 2. The contents of the barrels are tipped through a trash screen and into the tank. The Mtaa Fresh site operator is using the metal scoop to obtain a sample as the FS is poured into the tank. Photo Credit: Barbara J Ward.
Sustainability 12 09040 g002
Figure 3. The flow chart outlines the process of this study. Sample collection included collecting samples of pit latrine sludge received at the site, and the tank, as well as preparing a composite sample on each sampling day. Sample testing included onsite settling tests of the FS and laboratory characterization (TS, TSS, pH, EC, ammonia, COD, turbidity). Sample analysis involved assessing the relationship between measured parameters (TS, TSS, pH, EC, ammonia, COD, turbidity) and settling performance, the relationship between easy to measure parameters (TS, pH, EC, turbidity) and difficult to measure parameters (TSS, COD, ammonia) and the relationship between rapidly measured parameters (turbidity) and time-intensive parameters (TS, TSS, ammonia, COD).
Sustainability 12 09040 g003
Figure 4. The relationships between measured parameters were analyzed and shown in each figure. Significant relationships were found between the following measured parameters: (a) TSS vs. TS, (b) COD vs. TS, (c) TS vs. Turbidity, (d) TSS vs. Turbidity, and (e) COD vs. Turbidity COD.
Sustainability 12 09040 g004
Figure 5. The relationships between measured parameters of raw FS samples (a) TS, (b) TSS, (c) Ammonia, (d) COD, (e) EC, and (f) pH, and the percent change in the supernatant TS at the completion of the settling test are shown. Upper limits and ranges where settling occurred are indicated with dotted vertical lines.
Sustainability 12 09040 g005
Table 1. Pit latrine sludge laboratory characterization data for all samples, pit samples individually, composite samples individually, and tank samples individually.
ParameterAll Samples
Sample SizeMinimumMaximumMedianMeanStandard Deviation
TS (g/L)4513.20116.8027.4041.8232.02
TSS (g/L)154.0166.7013.1820.2719.21
pH456.038.307.677.620.39
EC (mS/cm)456.7829.3022.8020.875.64
Ammonia (g/L)250.034.652.382.401.11
COD (g/L)221.7064.5815.4524.0519.94
Turbidity (NTU)103800123,50015,20027,00035,194
Pit Samples
TS (g/L)2913.20108.9821.9230.7421.12
TSS (g/L)104.0140.339.6814.0511.47
pH296.038.147.657.600.43
EC (mS/cm)296.7829.3024.0022.185.59
Ammonia (g/L)200.004.651.711.571.43
COD (g/L)171.7064.5814.8321.4219.42
Turbidity (NTU)6380032,90013,30014,60010,995
Composite Samples
TS (g/L)820.2751.5025.2629.5010.42
TSS (g/L)210.6013.1811.8911.891.82
pH87.228.137.807.730.28
EC (mS/cm)816.1526.9023.6521.844.30
Ammonia (g/L)22.273.292.782.780.72
COD (g/L)212.7115.6914.2014.202.11
Turbidity (NTU)214,30015,10014,70014,700579
Tank Samples
TS (g/L)832.33116.8099.9694.2826.89
TSS (g/L)316.8666.7056.1346.5626.26
pH87.098.307.567.580.38
EC (mS/cm)88.9020.6015.6515.153.30
Ammonia (g/L)32.324.172.382.961.05
COD (g/L)328.1563.3345.0045.4917.60
Turbidity (NTU)229,300123,50076,40076,40066,589
Table 2. Summary of reported median literature values for select FS characteristics.
ParameterLined and Unlined Pit LatrinesHousehold Pit LatrinesPit Latrines
Uganda [27]Uganda [17]Zambia [20]
TS (g/L)17–148 *25148 *
TSS (g/L)N/A20N/A
pH7.88.357.73
EC (mS/cm)12–13.6N/A14.5
COD (g/L)20.8–127.228121.1
* Data were presented as a percent in the original study. Values were converted to g/L, assuming a sludge density of 1 g/L.
Publisher’s Note: MDPI stays neutral with regard to jurisdictional claims in published maps and institutional affiliations.

