Article

Sustainable HRM as a Pathway to Sustainability—HRMS Relevance on Affective Commitment through Organizational Trust

by
Ana Teresa Ferreira-Oliveira
1,*,
José Keating
2 and
Isabel Silva
2
1
CISAS, Escola Superior de Tecnologia e Gestão, Instituto Politécnico de Viana do Castelo, Rua Escola Industrial e Comercial Nun’Álvares, 4900-347 Viana do Castelo, Portugal
2
Escola de Psicologia, Universidade do Minho, Campus de Gualtar, 4710-057 Braga, Portugal
*
Author to whom correspondence should be addressed.
Sustainability 2020, 12(22), 9443; https://0-doi-org.brum.beds.ac.uk/10.3390/su12229443
Submission received: 14 October 2020 / Revised: 4 November 2020 / Accepted: 8 November 2020 / Published: 13 November 2020
(This article belongs to the Special Issue Designing Sustainable HRM)

Abstract

:
Human resource management system (HRMS) is an organizational instrument that sends organizational messages to employees. If we consider that HRMS can be an indicator of organization’s involvement towards employees’ it is relevant to understand its impact in employees’ organizational commitment and study indicators that can help unravel the black box between HRMS and positive results, associating an emerging approach, sustainable HRMS that relates HRMS with sustainability, having as common features the association with positive results for employees. Recent literature has tested organizational trust (OT) as a relevant indicator in the understanding of this process. There have been studies that have debated and tested OT in managers as a mediator or moderator of HRMS on affective commitment (AOC) and support for both have been found. In this study, we attempt to contribute to the development of the field, by considering the terminological, conceptual and statistical distinction between moderator and mediator, testing two alternative models that may elucidate the relationship between these variables. 1328 valid responses with employees and managers from 21 Portuguese organizations were collected. A factor analysis, a cluster analysis, moderation tests using hierarchical linear regression, pos hoc tests and mediation tests with sequential regressions were performed. HRMS dimensions are mediated (partially or totally) by OT in manager towards AOC. HRMS dimensions (HR relationship with employees, comprehensibility, utility, visibility and distributive justice) influences OT in manager, which, in turn, influences AOC. Regarding moderation, the interaction between distributive justice and OT, pos-hoc tests showed that when distributive justice increases and levels of OT in manager is high, OAC increases rapidly. It seems that the importance of the distributive justice of HRMS only becomes relevant on OAC, if OT in manager is present. This empirical test of the HRMS model also suggests its reframing in two meta-dimensions: A. the agents of HR system, the HR relationship with employees based on their competence, consistent behavior, ability to solve problems and listening to people; and B. the effects of the system itself, possibly Visibility is the most relevant attribute. We suggest that these interactions between HR agents and employees are relevant and may lead to generalizations about the HRMS.

1. Introduction

The human resource management system (HRMS) intends to promote positive conditions to employees and this will probably result in more commitment towards an organization and a more sustainable organization. An emerging approach, sustainable HRMS relates HRMS to sustainability, having as common features the association with positive results for employees and developing organizational sustainability through HRMS [1,2]. Following this line of reasoning, the literature enhances the relevance of implementation processes to sustainable HRMS [1] and an organizational climate in influencing employees’ attributions specifically through mediators [3,4,5,6,7]. These attributions will have an impact on regulating employees’ behavior and producing relevant individual and organizational results. Research has shown the relevance of HRMS in predicting organizational outcomes such as performance [4,5,8,9,10,11,12]; however, little empirical work has been carried out that addresses the link between HRMS and organizational commitment. Organizational affective commitment (OAC) is a psychological dimension relevant in organizational dynamics and few studies have tested the relationship between HRMS and OAC, especially within a process-based approach. Previous research has tested climate strength as a mediator between employees’ perceptions of HRM and affective commitment [13,14,15] They used Bowen and Ostroffs’ theoretical model [4,6] and found a moderation relationship between consistency and affective commitment when the climate strength was present [13,14,15]. Relying on social exchange theory, organizational trust (OT) was also tested as a mediator between perceived organizational support and organizational commitment [16] or moderator (for reviews, see References [17,18,19] These results indicated that human resource practices affected the relationship between perceived organizational support and organizational commitment or trust in management. More recent research has debated the role of organizational trust and its effect as a mediator or moderator in HRMS [13,14,16,20]. Considering the relevance of trust in reducing the perceive risk of behavior it is reasonable to expect that in addition to having a direct effect on organization commitment, it can also act as moderator in the relationship between HRMS and OAC. HRMS intends to promote a specific organizational climate that will enhance employees’ performance and satisfaction, enhancing sustainability. OT in manager can act in the fortification of the link between HRMS and a positive commitment towards organization as a mediator. Recent literature presents results confirming the relevance of OT in sustainable HRMS [21]. This emerging approach, sustainable HRMS, relates HRMS to sustainability, having as common features the association with positive results for employees, developing organizational sustainability through HRMS [1,2]. This study also intends to contribute to the literature on sustainable HRMS as it considers the relationship between HRSM and positive outcomes as OT and AOC. The literature uses both theoretical paradigms and there is a need for conceptual and empirical distinction in the role of OT.
RQ: Do employees’ HRMS perceptions contribute to their OAC? What is the role for OT in the link between HRMS and OAC? Does HRMS, moderated by organizational trust in a manager, contribute to organizational affective commitment? Or does HRMS influence trust in managers which mediates the link between HRMS and OAC?

1.1. Sustainable HRM

Sustainable HRMS relates HRMS to sustainability, having as common features the association with positive results for employees, developing organizational sustainability through HRMS [1,2]. Human resource management based on a content approach was the most relevant approach for at least 40 years. In 2004, a process-based approach begun assuming that processes and the way these are implemented mediated and moderated by relevant indicators could unravel the gap between HRM black box and positive organizational and individual results. This process-based approach can be associated with sustainable HRM. Sustainable HRM intends to link HRM and sustainability [1]. This study also intends to contribute to the literature on sustainable HRMS as it considers the relationship between HRSM and positive outcomes as OT and AOC.
Sustainable HRM explicitly intends to foster the impact of HRMS not only on performance but instead, on internal and external outcomes, not necessarily economic. In this paper, we intend to contribute to the literature on sustainable HRM, studying relevant psychological attitudes, such as OT and OAC, assuming the purpose of HRM as a central organizational policy that is demonstrated through HRMS and has a positive and relevant impact on employees.

1.2. Human Resource Management System (HRMS)

HRMS is an organizational tool that intends to contribute to the development of stability, coherence and justice in organizations through the unification of the procedures and cultural accepted behaviors in them. The importance of the HR (Human Resource) function and HRMS in organizations is commonly accepted as positive and crucial. However, the impact of HRMS on individual or organizational results remains to be understood [13,14,22]. Human resource management can be a system that defines rules, proceedings, organizational interests and structures organizational expectations between employees and organizations. It is very difficult to research HRMS considering the ethnocentricity and complexity of the construct. The difficulty of obtaining reasonable samples and relating data to these differences and complexity at an empirical and theoretical level explains, at least in part, the difficulties of the research. The difficult replication of the object of study combined with difficulties of measurement [5,12] have contributed to the difficult clarification of HR impact. Research struggles with multiple distinct realities, such as different functional HR forms [23], the differences on the set of practices differences regarding different interpretations of HR function on the HR implementation processes among others. The lack of clear theoretical and empirical dimensions that constitute the construct itself (HRMS) are a major difficulty in measuring and associating it with relevant organizational outcomes such as performance, commitment or psychological contract. Bosalie, Ditz and Boon [3,5] shed some light on reviewing the HRM (Human Resource Management) literature and addressing new lines of research as the search for moderators or mediators in the “black box,” the link between HRM and performance. Bowen and Ostroff [4,6] built a relevant theoretical model, focusing in a process-based approach and enhancing HRMS defined with meta-dimensions and sending clear messages to employees. The authors also acknowledge the relevance of mediators in the link between HRMS and performance. This research intends to contribute to HRMS “black box,” by addressing the gap between HRMS and relevant organizational results [3,5]. This research develops these ideas by exploring the contribution of social exchange trades, specially the reliance of OT in this process-based approach. HRMS in this paper will be theoretically and empirically assessed through Bowen and Ostroff’s model [3,5] that assumes three meta-features to evaluate HRMS Distinctiveness is divided in four attributes: Visibility (of HRM practices), Comprehensibility (of HRM practices), Legitimacy of authority (of the system and its agents, the HR function) and Relevance (importance of the system towards personal and organizational goals). Consistency has three attributes: Instrumentality (of the HR system, a perceived cause-effect relationship between the system and individual consequences, like incentives or rewards.), Validity (consistency between the stated objective of the system and the day to day routine) and Consistent HRM messages. Finally, the third dimension is Consensus and it has two attributes: Agreement among principal HRM decision makers and Fairness (distributive, procedural and interactional). Bowen and Ostroff [3,5] enhances the relevance of employees’ response. Until now, there are few published researches on employees’ perception on HRMS. Quantitative studies often ask about the presence or absence of the practices without considering the possibility that employees can evaluate the system as a poor system [24,25,26] or even as useless. Literature has brought about the relevance to understand the perceived importance of HRMS by employees and managers [27,28,29,30,31,32]. Results are clear and show the need to develop research in the gap between different representations and impacts of HRMS for employees and managers, as it cannot be assumed that employees have the same perspective regarding the importance of HRMS as HR managers or the top managers. This research intends to bring about these effects studying, in a large sample, employees’ representation on HRMS and the link between these representations and relevant organizational outcomes.

1.3. Organizational Affective Commitment

Research on the association between high commitment HRMS and work-related outcomes has only more recently begun to address commitment. Morrow [33] defines commitment, especially OAC, as a mature construct, as the extant literature on the topic enables us to understand the relations between OAC and other constructs. Employees with high levels of commitment are more likely to have higher performance and are less likely to leave [28,34,35,36,37]. Although OAC is a mature construct, there are still areas under developed [33]. There is a scarcity of studies with significant results on the link between HRMS and commitment. Recent literature has found a significant and direct effect between HRMS and employee commitment [28,34,35,36,37]. Morrow [33] argues that research has still not found significant and important effects of HRMS and OAC. This paper intends to give contributions to this dimension, exploring significant empirical effects between HRMS and OAC, through OT. Literature suggests that employees interpret HRMS as a product that reveals organizations commitment towards them and they reciprocate (or not) to this perception. The result can be their personal commitment [17,38]. Recently, the literature has included a few studies that have explored HRM’s role in this theoretical assumption [28,34,35,36,37] and OT has also been scarcely researched within this specific framework. This study also intends to add OT as a relational dimension that interferes in the process between HRMS and OAC as recent research suggests [9,28,34,39].

1.4. Organizational Trust in Manager

The recent literature on social exchange theory [2,17,38,40,41] regarding HRMS argues the relevance of the relationship between employees and managers as dimensions that can influence employees’ perception of HRMS. HRMS creates the conditions and the climate in which employees and managers build their perceptions, attributions and behaviors [4,6,13,15,34,42,43,44]. Organizations are built daily on people’s relations and interactions and the existence of a HRMS mediated by “strong” human relationships can provide the necessary climate that influences employees and managers’ attributions, attitudes and behaviors’. OT gathers the conditions to be considered an important relational variable that can interfere in the chain that links HRMS to organizational results. Recent research has debated the role of OT and its effect as a mediator or moderator in HRMS [8,20]. OT assumes a willingness of a party to be vulnerable to the actions of another party based on the expectation that the other will engage in an expected behavior. Despite several positions in the literature regarding antecedents of OT, dimensions and results one of the upmost OT important aspect is the need for the acceptation of vulnerability. This study builds from here, considering that the vulnerability acceptance allows OT to act as a buffer towards risk and change. Therefore, OT can be a relevant indicator for quality relationships between employee and manager. Considering the importance of OT in reducing the perceived risk in social situations by diminishing the expectation of control it is reasonable to expect that in addition to having a direct effect on organization commitment, it will also act as moderator or mediator in the relationship between HRMS and OAC. The literature has begun to study OT in these processes. Recent literature [16,20] has analyzed the effect of HRMS on OT impersonal dimensions. They analyzed organizations based on their fairness (HRM practices, fair play and communication) and capability (organizing activities, sustainability, top management characteristics, technological reliability and competitiveness). Their results reveal a positive association between HRMS and OT. These authors call for studies to explore relationships between HRMS and OT, as we continue to have a scarcity of research that addresses these two dimensions. Recent literature focus on OT as mediator and as moderator in HRM. Both roles of trust as a mediator or moderator in the path of HRMS and other organizational results have found support in the literature. Next, we will review both.

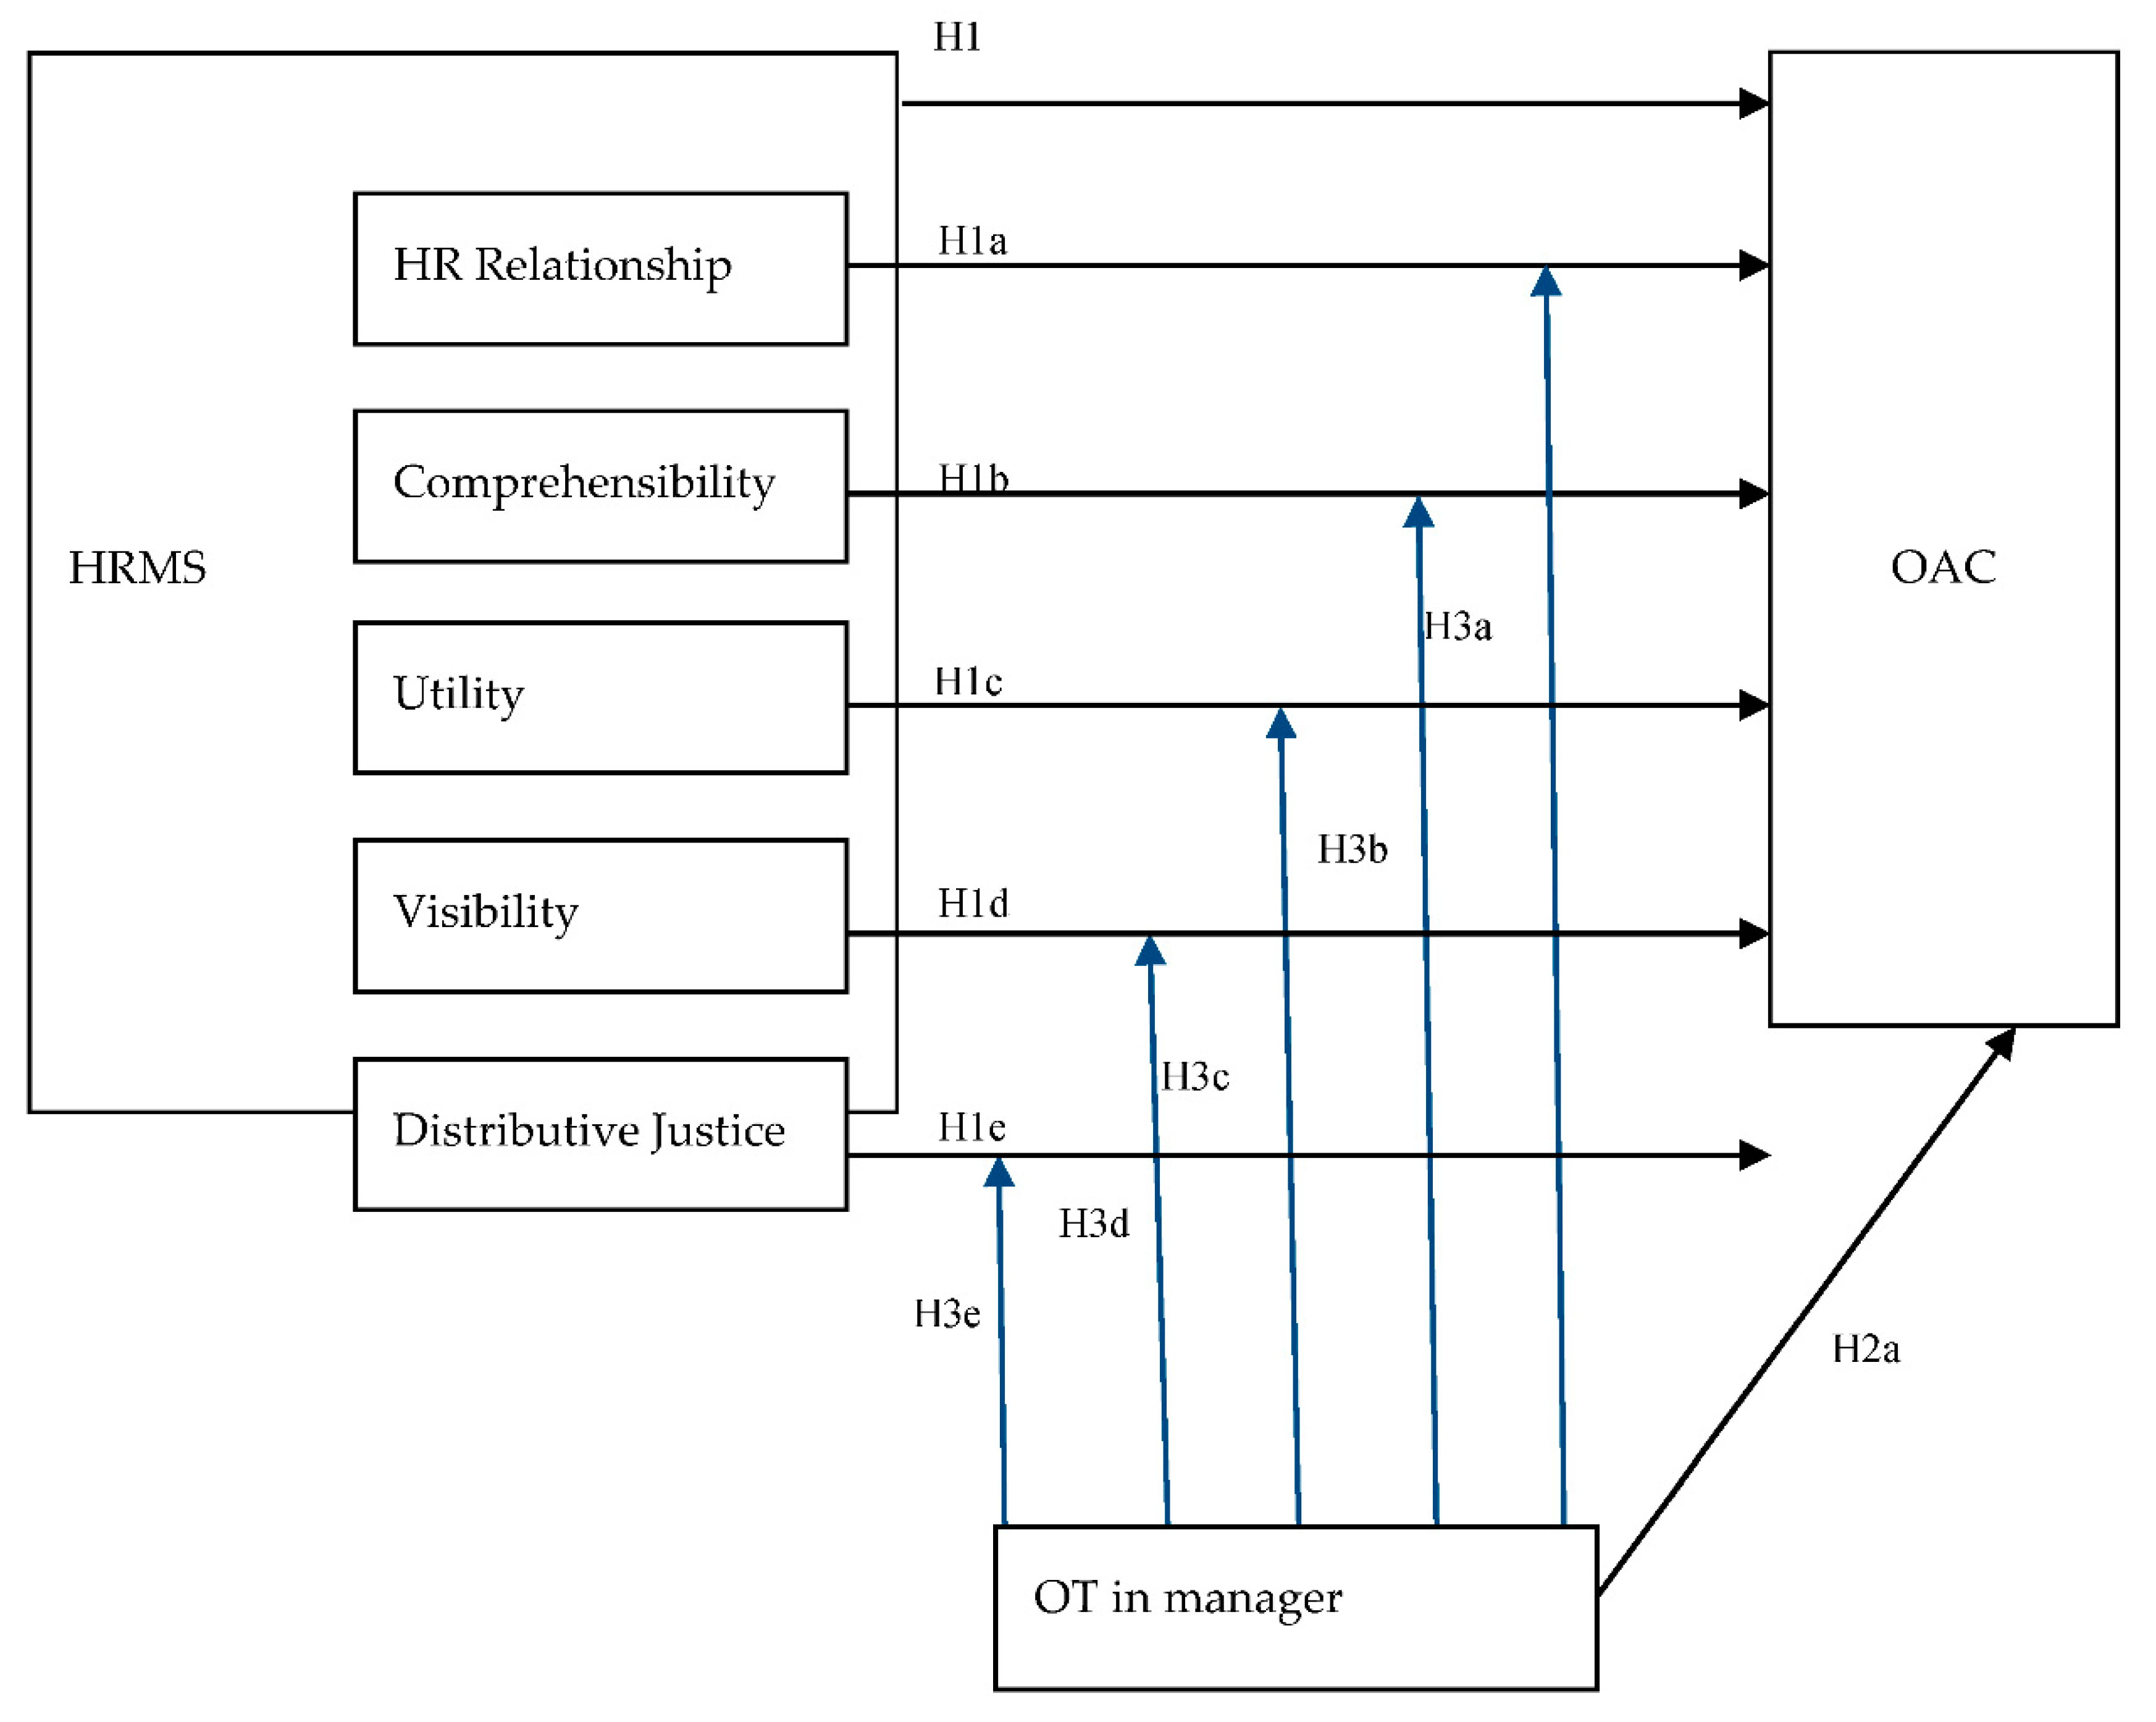
1.5. Moderation Models

The literature has studied OT in management as a HRMS moderator on employees’ attitudes [15,20,45,46]. Results confirm moderation with the overall HRMS and in a specific set of HR bundles, the motivation practices. Fryxell, Dooley and Li [47] tested OT as a moderator for employee commitment during a process of restructuring, assuming that in times of uncertainty the decrease of risk perceived by high trust could act as a buffer in commitment. Their results demonstrated that trust based on competency is a moderator of value commitment. Alfes, Shantz and Truss [48] examined the interaction between HRMS, performance and well-being, using OT as a moderator. They used data from employees and line managers in one service sector organization in UK. Their results demonstrate that OT moderates performance and well-being. Farndale, Hope-Hailey and Kelliher [49] found support for OT in a manager as a moderator towards commitment, considering justice as mediator. Their findings demonstrate an association between employees’ perceptions of HRMS and commitment, considering OT and justice as important variables present in the organizational climate that fosters commitment. More recent literature has made some contributions to the role of OT as a moderator on HRMS [15,20,45,46]; however, it remains scarce.

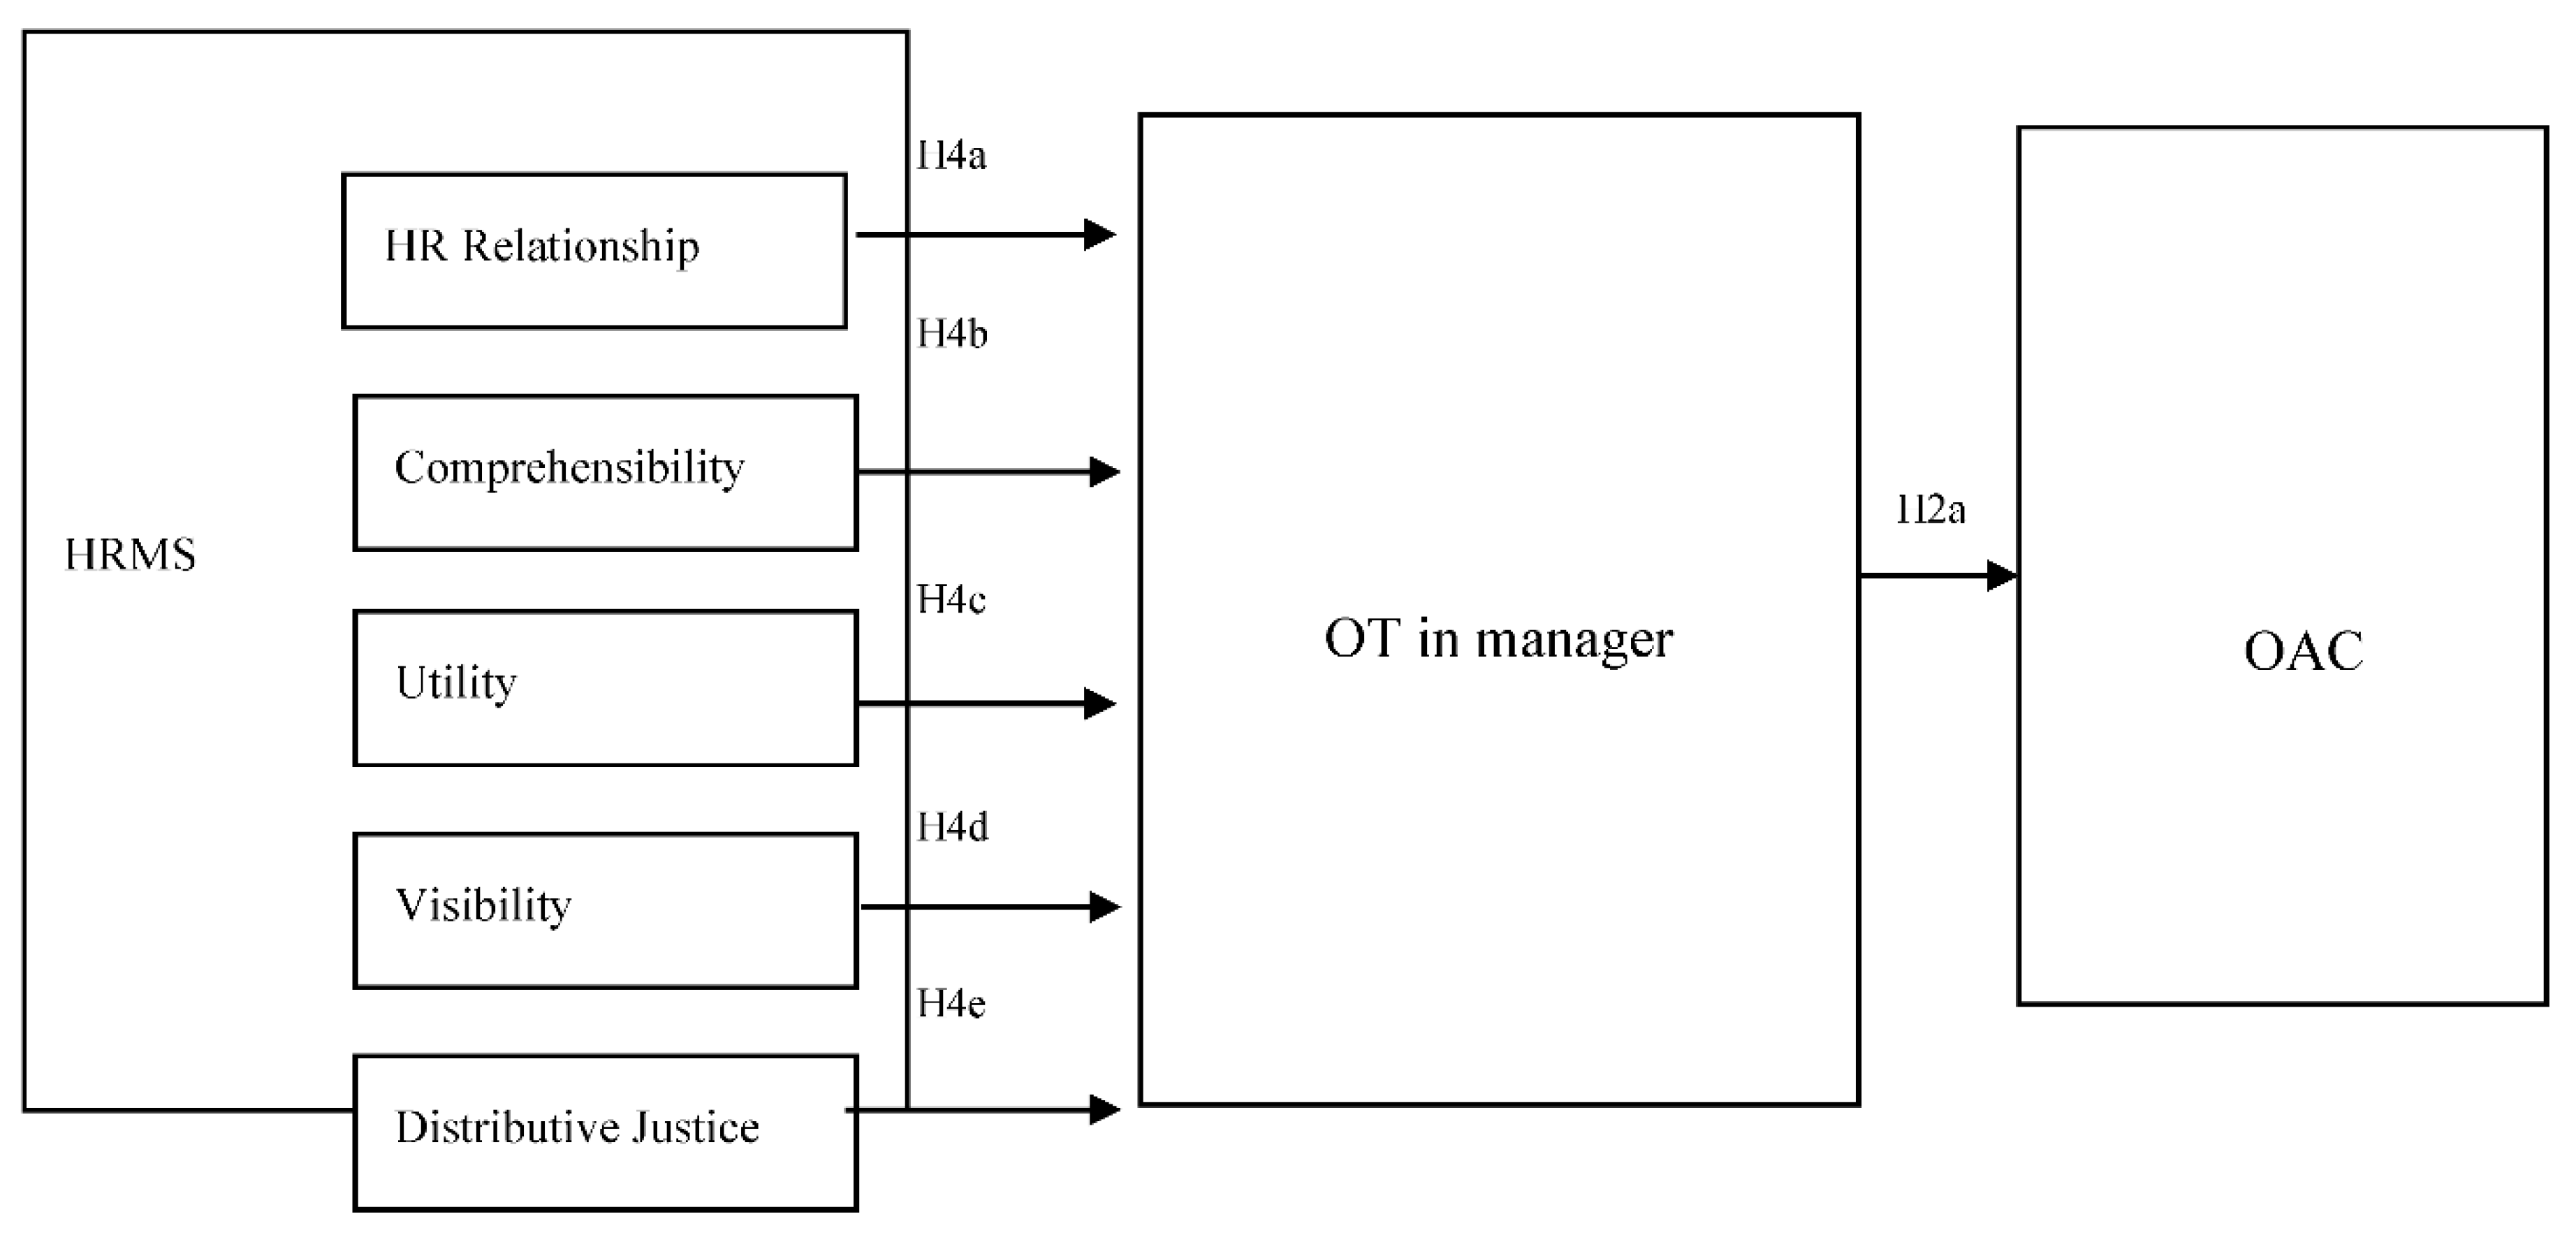
1.6. Mediation Models

The literature has studied the relationships between HRMS, OT in managers and organizational commitment in employees [17]. The results showed that OT in management partially mediates the relationship between perceived organizational support and commitment. Lehmann-Willenbrock, Grohmann and Kauffeld [50] analyzed OT and commitment as mediators of organizational citizenship behavior in German teams over a period of three years. Their findings showed that employees who perceive procedural justice in organizations reciprocate in terms of OT and over time they reciprocate with commitment. Their study was conducted in a serial mediation effect entering first OT as mediator and second commitment. Results demonstrated that OT precedes commitment and that employees who trusted are more likely to feel committed [50]. Mahajan, Bishop and Scott [51] studied trust in top management as a mediator of top management communication, employee involvement and organizational commitment. Their findings suggest that trust in manager partially mediated the relationship between employee involvement and commitment. Literature continues to argue on the need to conduct research that associates OT to HRMS, especially as a mediator [28,34,39] and this paper wants to contribute to this call.

2. Method

The purpose of the current study is to test and compare two alternative models in which trust interferes in HRMS’ link to affective commitment—a moderation model versus a mediation model (for other examples of the same procedure see References [52,53]). Considering the important terminological, conceptual and statistical distinction between moderator and mediator [54]. The study is designed in a differential approach by testing two alternative models, who intend to clarify the role of OT in HRMS and OAC.
  • To evaluate the direct impact of HRMS and OT on OAC.
Hypothesis 1 (H1):
Positively perceived HRMS is positively related to OAC.
Hypothesis 1a (H1a):
Positively perceived HR relationship with employees is positively related to OAC.
Hypothesis 1b (H1b):
Positively perceived comprehensibility of HRMS is positively related to OAC.
Hypothesis 1c (H1c):
Positively perceived utility of HRMS is positively related to OAC.
Hypothesis 1d (H1d):
Positively perceived visibility of HRMS is positively related to OAC.
Hypothesis 1e (H1e):
Positively perceived distributive justice of HRMS is positively related to OAC.
Hypothesis 2a (H2a):
Positively perceived OT in manager is positively related to OAC.
2.
To compare two models of the effects of OT on OAC.
Model 1, the moderator model, predicted that the HRMS dimensions would interact with OT in order to modify OAC. (see in Figure 1)
Hypothesis 3a (H3a):
OT in manager moderates the relationship between perceived HR relationship with employees’ and commitment, such that if it is high, the relationship between the perceived HR relationship with employees and OAC will be stronger.
Hypothesis 3b (H3b):
OT in manager moderates the relationship between perceived comprehensibility and commitment, such that if it is high, the relationship between comprehensibility and OAC will be stronger.
Hypothesis 3c (H3c):
OT in manager moderates the relationship between perceived utility and OAC, such that if it is high, the relationship between perceived utility and commitment will be stronger.
Hypothesis 3d (H3d):
OT in manager moderates the relationship between perceived visibility and commitment, such that if it is high, the relationship between perceived visibility and OAC will be stronger.
Hypothesis 3e (H3e):
OT in manager moderates the relationship between distributive justice and commitment, such that if it is high, the relationship between distributive justice and commitment will be stronger.
Model 2, the mediator model, predicted that HRMS dimensions influence OT in manager, which, in turn, influences OAC (see in Figure 2)
Hypothesis 4a (H4a):
Relationship between perceived HR relationship with employees and OAC is mediated by OT in manager.
Hypothesis 4b (H4b):
Relationship between perceived comprehensibility and OAC is mediated by OT in manager.
Hypothesis 4c (H4c):
Relationship between perceived utility and OAC is mediated by OT in manager.
Hypothesis 4d (H4d):
Relationship between perceived visibility and OAC is mediated by OT in manager.
Hypothesis 4e (H4e):
Relationship between distributive justice and OAC is mediated by OT in manager.

2.1. Procedure and Sample

The collection of the sample was realized with the specific goal of covering the largest range of organizations possible from all sectors and sizes, spanning multiple organizational contexts. This study is part of a research project which has begun with micro, qualitative data. The objective of this paper is to explore these relations in large samples and multiple contexts. Data were collected from 21 organizations in Portugal, including 9 public sector organizations and 12 private sector companies. The nine public sector organizations included four public sector administration agency, four city halls and one school. The private sector companies included four industries (beverage, powertrain and automotive suppliers) three services provider (consultancy and information services) one nonprofit organization, one Construction Company and three schools. The organizations were contacted through a formal request to senior managers. We had online or local meetings with the HR senior manager in order to describe the requirements to participate in the study. Organizations were informed about the goals of the research and the degree of data confidentiality. A survey facilitator was identified in each establishment, typically located in the HR department and provided with guidance on how to distribute the surveys. Only one organization allowed the collection of data by the researcher herself. In order to overcome this obstacle in the effective response rate, each organization was sent a pack of questionnaires in paper and an online link. The paper questionnaire was delivered by the facilitator to workers who had no access to a computer workstation. This survey was delivered with an envelope addressed to the research team in order to assure the confidentiality of data. Workers who had access to a computer in the organization were sent a link by email to an online version of the survey, guaranteeing anonymity. We sent a total of 4078 questionnaires and online links and received 1677 responses, with a response rate by organization of between 5 and 100 per cent. The mean was 39.20 per cent of response rate and 308 received questionnaires were not used due to responses with high musings or due to non-variability on the responses (all the responses on the same rating at the scale). The final result was 1369 valid surveys. The following Table 1 and Table 2 present sample characterization.

2.2. Instruments

HRMS

We used an adaptation of the HRMS Questionnaire (HRMQS) [55]. In its original version the HRMSQ, included 42 items that assessed three meta features of Bowen and Ostroffs’ model—distinctiveness, consistency and consensus. Each item is responded to on a 6-points Likert scale where 1 = strongly disagree and 6 = strongly agree (Item example: “The existing reward system helps each employee to achieve greater success”). We tested and adapted this instrument based on the specific objectives of this research. We removed some items and adapted the human resource practices used as referents for the original items as follows. Twenty-one items were used to assess perception of the utility, comprehensibility and visibility of the HRM system. Each item used as referent one identifiable human resource practice (socialization, recruitment and selection, training, performance appraisal, administrative procedures, communication and teamwork). The selected practices were based on the with special Portuguese organizations reality, specially the high administrative load of HR function and the lack of well implemented reward systems [56]. We removed career and bonus and added socialization and administrative processes. The practices evaluated were socialization, recruitment and selection, training, performance appraisal, administrative procedures, communication and teamwork. Each item is responded on 5 points Likert scale, where 1 = it is never useful and 5 = extremely useful (Item example: “The performance evaluation is useful”).
Human Resource Relationship—Five items were developed and written based on previous qualitative work that focused on communication and proximity as the foundation for the relationship between HR function and employees. Previous research on the topic was considered [57]. It was emphasized open communication and demonstration of concern for employees as the main relevant factors in the managerial-employee relationship. Five items were developed. Each item is responded on a Likert scale with 6 points, where 1 = strongly disagree and 6 = strongly agree (Item example: “The Human Resources Department helps me to solve problems.” “Normally the Human Resources Department tries to understand my opinion on the definition of new procedures” “The department seems to keep informed about the best HRM practices that are used in other organizations”).
OT in direct manager: Organizational interpersonal trust in direct manager was measured using a scale adapted to the Portuguese population [58] that is the adaption of the scale by Mayer and Gavin [59]. The scale has consistent validity and reliability. 8 items were used considering the 3 antecedents of trust: Competence, Benevolence and Integrity. Our criterion was to select the items that contribute the most to each dimension. Each item is responded on a Likert scale with 6 points, where 1 = strongly disagree and 6 = strongly agree (Item example: “My manager will change his normal way of proceeding to help me”; “My manager strives to be fair in his relations with others; “My manager knows in depth the work that needs to be done”).
OAC: Organizational commitment was measured using a scale adapted to the Portuguese population [60]. The scale has consistent validity and reliability and 8 items were used. Our criterion was to select the items that contribute the most to the first factor, OAC. Each item is responded on a Likert scale with 6 points, where 1 = strongly disagree and 6 = strongly agree (Item example: “I think that my values and the organizational values are similar,” “I am proud to tell others, that I am part of this organization”).
Control variables: In all analyses, the following control variables were entered: age, sex, seniority, manager or subordinate, seniority in managing and training in HR, public vs. private sector, industry vs. services sector and contract type.

2.3. Statistical Analysis Procedure

This analysis is divided into four parts. The first is the development, test and consolidation of the measure. The second is a global analysis with the objective of testing hypothesis 1 using an exploratory approach with a cluster analysis. The third part is the moderation and the fourth the mediation.
We followed the relevant statistical literature on the development of our analysis of correlation patterns and to develop valid measures in which the questionnaire was based [58,59,60,61,62,63,64,65,66,67,68]. Principal component analysis (PCA) and factor analysis (FA) are two distinct statistical techniques [67] that can be used to this effect. In PCA all the variance is analyzed, in FA shared variance (covariance) is analyzed [65,66,67]. According to our research goal we considered PCA a better choice following the relevant statistical literature [61,62,63,64,65,66,67,68]. Our final instrument, with all the sub-scales integrated had 54 items. The data were analyzed for their suitability for principal component analysis with PASW–18. A PCA was conducted on the 54 items. Data were explored in order to maximize variance through orthogonal (rigid) rotation using Varimax method. Although theoretically all these factors are correlated in some manner, which would suggest the use of oblique rotations, empirically we wanted to increase the factor loadings so the interpretation could be more accurate and less ambiguous in terms of perceived dimensions of the system by the employees [66,67] However, in order to test our data for significant differences in the analysis, assuming that our factors could be highly correlated and that this could influence our results we also conducted an oblique rotation with the Oblimin method [66] with similar results. Following previous research [62] we retained the results of Varimax rotation. In the first analysis we did not define the number of factors enabling the items to load on any number of factors [65]. Analyses were performed with the missing data and without them. Missing data were replaced with the mean response for the variable in question, so that the sample size didn’t become too small [66] However, in the reliability analysis we did not replace the missing values [66]. In all of the following analyses correlations were screened concerning singularity (variables that are perfectly correlated) and extreme multi-collinearity (variables with high correlations; r ≥ 0.8) [62]. The Kayser-Meyer Olkin sampling statistic was adequate which indicates that the factor analysis procedures were appropriate. We consider the following arguments to retain the factors: the point of inflexion of the curve, in a scree plot, in more than 200 participants [66]. We also considered the substantive importance of factor loadings by Joliffe’s (retaining factors with eigenvalues greater than 0.7) [62]. However, the final decision was made over Kaiser’s criterion of 1 [66]. In the interpretation of the factors we decided to use a cutoff level of 0.45 [66,68] and a 20% variance overlap between variable and factor [66]. The sample size (N = 1369) was adequate as literature [66] suggested, with a minimum of 300 cases for factor analysis as a general rule of thumb. The frequencies of each item were analyzed and the total range of the points of the scale was used in every item, proving the frequency of occurrence of different behaviors. Bartlett’s test of sphericity relating to item interdependence was examined (X2(1431) = 39138.79; p < 0.001) indicating that the correlations between items were sufficiently large for PCA. The Kayser-Meyer Olkin sampling statistic was KMO= 0.967 which indicates that the principal component analysis procedures were appropriate. An initial analysis was run to obtain eigenvalues for each component in the data. Eight components had eigenvalues over Kaiser’s criterion of 1 and explained 64.55% of the variance. The scree plot showed two points of inflexion that could indicate eight or twelve factors. The Jollife’s criterion showed 15 factors. We followed Field’s [68] and according to the large sample size, the convergence of the scree plot and Kaiser’s criterion, we retained eight components. The loadings of the items suggested the exclusion of the 12 items according to the following principles: Item 24 did not correlate with others (r ≤ 0.30). Item 25 did not meet the cutoff criterion of factorial loading ≥0.45 [62,66]: Items 1,4,5,6,8,9,10,11,16,18 had differences ≤0.2 in the factorial loadings on different factors. In all of the following analysis all the remaining items showed good correlation with the total (>0.30) and we did not find extreme multi-collinearity. We subjected the remaining 42 items to another principal component analysis (PCA) following the same procedure as above. Bartlett’s test of sphericity relating to item interdependence was examined (X2(903) = 35697.681; p < 0.001) and the Kayser-Meyer Olkin sampling statistic was KMO = 0.96. Six components had eigenvalues over Kaiser’s criterion of 1 and explained 64.04% of the variance. By Jollife’s criterion of retaining factors we would retain 13 factors. This scree plot is less ambiguous then the first but also showed two points of inflexion that could indicate five or eight factors. The rotated component matrix showed all items distributed along 5 factors. We performed a new analysis on the data, in which we limited the number of factors to five. Bartlett’s test of sphericity relating to item interdependence was examined (X2(820) = 34312; p < 0.001) and the Kayser-Meyer Olkin sampling statistic was KMO= 0.960. Five components had eigenvalues over Kaiser’s criterion of 1 and explained 63.24% of the variance. The scree plot showed two points of inflexion that could indicate five or eight factors. We analyzed the rotated component matrix and the structure was clearer. Items 2 and 7 were removed considering the cutoff (loading ≥0.45) [64,67].
For part two, t main objective of cluster analysis is to cluster individuals based on their characteristics research. In this initial analysis our objective was to divide our sample according to the assessed dimensions of HRMS. With this approach we can compare different individuals who come from different organizations, based solely on their HRMS. Clustering of cases was performed using a k-means analysis (SPSS) with squared Euclidean distance as the index of similarity. The five subscales from the HRMS (standardized scores) were used in the cluster analysis: HR relationship with employees’; Comprehensibility, Utility, Visibility and Distributive Justice. The number of clusters was determined by examining the dendrogram and the coefficients from a hierarchical cluster analysis using Ward’s (1963) hierarchical agglomeration method. This method does not calculate distances. The clusters are built minimizing the sum of squared errors. The clusters retained are those with the lowest sum of squared errors [68]. The analysis led to the adoption of a two-cluster solution (in the coefficients we have a leap from the penultimate to the ultimate (2915.72 to 4740). Because clusters are based on maximization of differences between cases, we performed a MANOVA. Clusters were renamed and recoded as a new variable named “HRM perception.” This new variable is composed by two groups (1 = people who have a more positive perception on HRM) tested as the input variable and the 5 variables used in the cluster analysis were used as the target. With this dummy variable we conducted a linear regression testing the association between this variable and affective commitment.
In the third part of the analysis we tested the essential assumptions underlying the fixed linear regression model [65]. 1. Sample size: Concerning the sample size various rules have been suggested. Stevens [66] suggests 15 participants for predictor. According to this rule we should have the minimum of 330 participants, specifically in hierarchical multiple regression [61,64,66]. It is important to have 20 participants for predictor (main effect). They present the following rule to assume the minimum acceptable sample size in order to test the overall fit of the regression model or the individual predictors: N ≥ 50 + 8k. We have six principal predictors, however as caution we considered the more complex model which has 22 IV’S (including controls and interactions). In this case, following this rule the N should be ≥226. Our final sample is 1328 so we can considerer our sample size appropriate to the technique; 2. The power analysis literature has questioned sample size and its relationship with the size effect [61]. The sample size required will depend on the size of the effect that we are trying to detect. The power analysis considers sample size (N), significance criterion (ft), population effect size (ES) and statistical power. We follow Cohen ’s [61] who determines sample size for several statistical tests. According, in multiple regression analysis with the significance tests at a = 0.05, for the F test of the multiple R2, with a population small effect size, that is, f2 = 0.02 and a set of six independent variables, the required sample size is 686. Also, using G*Power 3.1 for the Ftest, assuming fixed effects, main effects and interactions it suggests a total of 400 participants Again, our sample is 1328 so it is appropriate to the technique; 3. Variable types: We used only continuous or categorical variables with two categories; 4. Independent errors: Independence of the observations (absence of auto-correlation): Durbin Watson values should be between 1 and 3 and the closer to 2 the value is, the better [68]. For these data the value is 1.95, which is very close to 2. We conclude that this assumption has been met; 5. Outliers: We detected 41 outliers in our data, through the analysis of the Standardized residuals and Cook’s Distance. The analyses were performed with the presence of the outliers and without them. The presence of the outliers distorted our results, interfering significantly with the data and decreased the total variance explained by the model. Our results show a stronger model without the presence of the outliers, therefore all the analyses were conducted without these cases. In the final model the minimum for the standardized residuals is −0.296 and the maximum is 2.95. Our final results for the Cook’s Distance ranges between 0.00 and 0.02. Our initial sample was 1369, our final sample is constituted by 1328 valid cases; 6. Essential multicollinearity [64]: We tested this assumption with simple correlations, presented at Table 3, considering that they cannot exceed 0.90 [68]; 7. Normally distributed errors: We analyzed the histogram of regression standardized residuals, as well as the normal p-p plot of standardized residual and both show the normality of the errors; 8. Linearity: We analyzed the scatter plot representing the linear relations between the main effects and the dependent variable and all the relationships were linear.
In order to compare both models (moderation and mediation), different statistical procedures were performed [52,53,61,62,63,64,66,68].

Model 1: The moderator model

In order to test the moderation effects, we performed a hierarchical linear regression. We used the method enter and the IV’S were entered cumulatively in a prespecified sequence [54] As this research followed a PCA described above, the IV’s were the factors that resulted from this PCA. Considering specifically the analysis of moderation with regression equations containing higher order terms, no automatic search procedures are indicated [63,64]. The moderation model has three steps. In the first step, the control variables were entered into the model. In the second step the main effects were entered. Interactions entered in the third step. The control variables that weren’t continuous were transformed into categorical with two categories: Public sector = 0, Private = 1; Industry = 0, Services = 1; No term contract, Fixed term contract = 1. In the second step the main effects were entered in the order indicated above. In the final step, the interactions factors were calculated (Trust x HR Relationship with employees, Trust x Comprehensibility, Trust x Utility, Trust x Visibility and Trust x Distributive Justice) and entered [54]. In our analysis both the moderator variable and the independent variable are continuous. In this case “If one presumes that the effect of the independent variable (X) on the dependent variable (Y) varies linearly or quadratically with respect to the moderator (Z), the product variable approach should be used [66]. Non-essential multicollinearity is a typical problem in interactions analysis. We chose to follow what is considered a good practice in recent research, the main effects were centered before producing the interactions [63,64,65,69]. When both predictors are quantitative, as in this case, the interactions must be produced with the initial predictors transformed in centered variables [63,69,70] Pos-hoc analyses were performed and are detailed in the results section.

Model 2: The mediator model

In order to test the mediation model, we follow a strong statistic procedure [54] in which mediation is supported if the following conditions are met: (1) regressing the dependent variable on the independent (2); regressing the mediator on the independent variable (3) regressing the dependent variable on the mediator (4) regressing the dependent variable on the independent and on the mediator. Separate coefficients for each equation should be estimated and tested. We used the method enter and IV’S are entered in the prespecified sequence, after all the control variables were entered as described before in the moderation model. Further details of these procedures are presented in the results section. All analysis on both models were conducted with PASW for Windows and Excel.

3. Results

3.1. Factors Interpretation on the Development of the Measures

PCA was described above and the IV’s for the model were the factors that resulted from this PCA. Table 3 shows the factor loadings after rotation of the remaining 40 items. The items that clustered on factor 1 suggest that it represents HR Relationship with employees, factor 2 represents Comprehensibility of the Practices, factor 3 represents Utility of the practices, factor 4 represents Visibility of the practices, factor 5 represents Distributive Justice. Factor 1 integrated the scale of HR relationship, HR Department competence and items related to the Consistency of the HRMS. As presented before, our definition of the HR relationship with employees embraces the HR competence, therefore the factor can be called HR relationship with employees. Some items related to the consistency of the HRMS loaded on this factor (instrumentality and consistent HRM messages). This integration can be interpreted as the relevance of consistency (e.g., the importance of time) on the development of this relationship, stressing the importance of the tested relationship as an instrumental one and the relevance of communication in this relationship. Also, factors with highest loadings are those related to the instrumentality of the relationship, especially the resolution of problems and the availability to listen, which adds information to this interpretation. Factor 2 represents the comprehensibility of the practices and the items loaded as predicted, in one subscale. The item with highest loading is the comprehensibility of recruitment and selection, followed by comprehensibility of the administrative procedures. Factor 3 represents the perceived utility of the practices and the items loaded as predicted, in one subscale. The item with the highest loading is the utility of communication (sharing information). Factor 4 represents the visibility of the practices and the items loaded as predicted, in one subscale. The item with the highest loading is socialization. Factor 5 is an unexpected factor and all factors have very similar loadings. It is specific, with clear statistics relevance and related only to distributive justice as all the items assess the relevance of outcomes of reward systems.

3.2. Reliability Analysis for Iv’s

Item-total correlations ranged between 0.44 and 0.83 and all items correlated with the total score. The item-item correlation ranged between 3.74 and 8.31. Each item contribution to Cronbach’s alpha was examined and no item was removed. Cronbach’s alpha coefficients and distribution data for each scale are presented in Table 4 and Table 5 respectively.
As expected, the results indicate the existence of significant correlations between all dimensions, p ≤ 0.001. Table 6 presents Pearson’s correlations. All correlations are above 0.30 and none of the correlations is greater than 0.8 [64,66,71] which demonstrates validity of the construct and the relevance of each dimension towards the global construct. The correlation matrix shows that the HR relationship with employees presents the highest pattern of correlations among the factors. This brings about its relevance in the construct. Visibility presents a high correlation with comprehensibility that is totally consistent with the theoretical frame, since both are presented as attributes of the same meta-features (distinctiveness). Utility has its highest correlation with visibility. Distributive justice has its highest correlation with HR relationship with employees.

3.3. Evidence from Reliability Data

The total scale score proved to have good internal consistency for this sample. Our final data (40 item questionnaire) has good reliability on all assessed features and the total correlations composite seem to be working together and to be measuring the same underlying construct. The implication is that respondents understood the meaning of the items and mobilized similar representatives in order to answer them [71].

3.4. Evidence for Validity

These results provide support for adequate content validity [69,71]. The use of practices adapted to the Portuguese reality reduced the discrepancies between organizations and promoted content validity. The questionnaire was the same for all organizations and participants. One of the major concerns in the self-report studies is the comprehensibility of the message presented in the scale. We also had major concerns regarding the clarity of the items. The information required in the scale had to be clear to all respondents of all educational levels. Limitations concerning the educational level were also screened. Educational level could have a negative impact because the wording of items might not be familiar to employees (e.g., HR strategy). We got around this difficulty by presenting the scale to the HR directors of the organization and asking them to assess the level of difficulty, objectivity and clarity of the questionnaire. After this we instructed the facilitators in the organization. In all organizations we asked the human resource manager to test the questionnaire in a smaller group of employees with the lowest educational level in the organization, prior to general data collection. In one of the organizations where the researcher collected the data personally, the only difference detected in the respondents towards the response to the questionnaire was the response time. It was greater for respondents with lower academic qualifications. We also consider that the features related to utility, visibility and comprehensibility helped in this process, because they were objective and easily understood by employees. Our final sample included 339 (24.9 %) participants with the 9th grade or below. Our results reflect data from 1369 from 21 organizations. This large sample from different organizations, in different evolution stages of HRMS, increases the validity of the measure.
All dimensions have significant correlations at the same level (p < 0.001). All dimensions correlate in the same course as hypothesized in the theoretical model and no correlation is ≥0.90 [68] as you can see on Table 7.
In Table 8 there are significant multivariate differences between group 1 and group 2 at the level of perception of the human resource management. (Wilk’s Lamba = 3.45; Pillai’s Trace = 0.655, F(5943) = 357.62, p ≤ 0.001). Linear regression tests were performed; (R2 Aj = 0.20; R2 Aj= 0.20, B = −5.75; SE B= 0.32 β= −0.44; t = −18.00, p ≤ 0.001. This model explains 20% of the variance of affective commitment. H1 is confirmed, there is an association between HRM perception and affective commitment. As group 1 is the group that has the highest means in HRMS dimensions, the results show that people who have a more positive perception of HRMS have a higher affective commitment towards organization. This cluster analysis was a first exploratory analysis and was conducted in an effort to explore HRM perception based on previous suggestions in the literature [4,6].
  • Model 1: Moderation model
The next Table 9 presents the results the moderation model, specifically the regression coefficients for each variable (including control variables) and for each hierarchical step. Every steps of the model are significant. The model improves at each step. The final model explains 60% of the variance in affective commitment.
Model 1 hypothesized that the HRMS dimensions would interact with OT in order to modify affective commitment.
  • Control Variables
The control variables will be described below, despite their role in the mediation model, considering that the results were similar.
As shown in Table 10, in step 1, the model of the control variables, explained 7% of the variance of affective commitment (R2 aj = 0.07, p ≤ 0.001) (F(11,1367) = 9.38, p ≤ 0.001). The hierarchical regression allowed to identify sex, public vs. private sector, industry vs. services sector, contract type, management as significant predictors of OAC:
(1) Control Predictors with levels of significance at p level of 0.001 in the three steps of the model: (a) The respondent’s is significant in predicting OAC ranging between β= −13 to β= −0.07 at p ≤ 0.001. Employees from the female sex (=1) are more committed than male employees; (b) In the contract type, the standardized Beta ranged between β = 0.11 to β = 0.06. Employees with no term contract are less affective committed than respondents with fixed term contract.
(2) Control Predictors with Levels of significance at step1, p ≤ 0.001 that decreases to p value ≤ 0.05 in step 2 and 3 of the model: (a) Regarding the predictor “public vs. private sector” the standardized Beta ranged between β = 0.16 in step 1 and β = 0.06 in step 3. Employees from the private sector are more affective committed than employees on public sector; (b) Considering “industry vs. services sector” the standardized Beta ranged between β = 0.21 to β = 0.06. Employees from services organizations are more committed than respondents from industry organizations.
(3) Control Predictors with Levels of significance at step1, p ≤ 0.001: (a) The predictor “Management function” only is significant at step 1 of the model and presents a β = 0.12. This means that employees that aren’t managers are more committed than managers.
As expected all the regression coefficients of the control variables decreased in step 2 and 3. Also a curious result is that “the number of subordinates to respondents who are managers” is not significant in the first step, however it becomes marginally significant in the step 2 and 3, with β = 0.03 and β = 0.03.
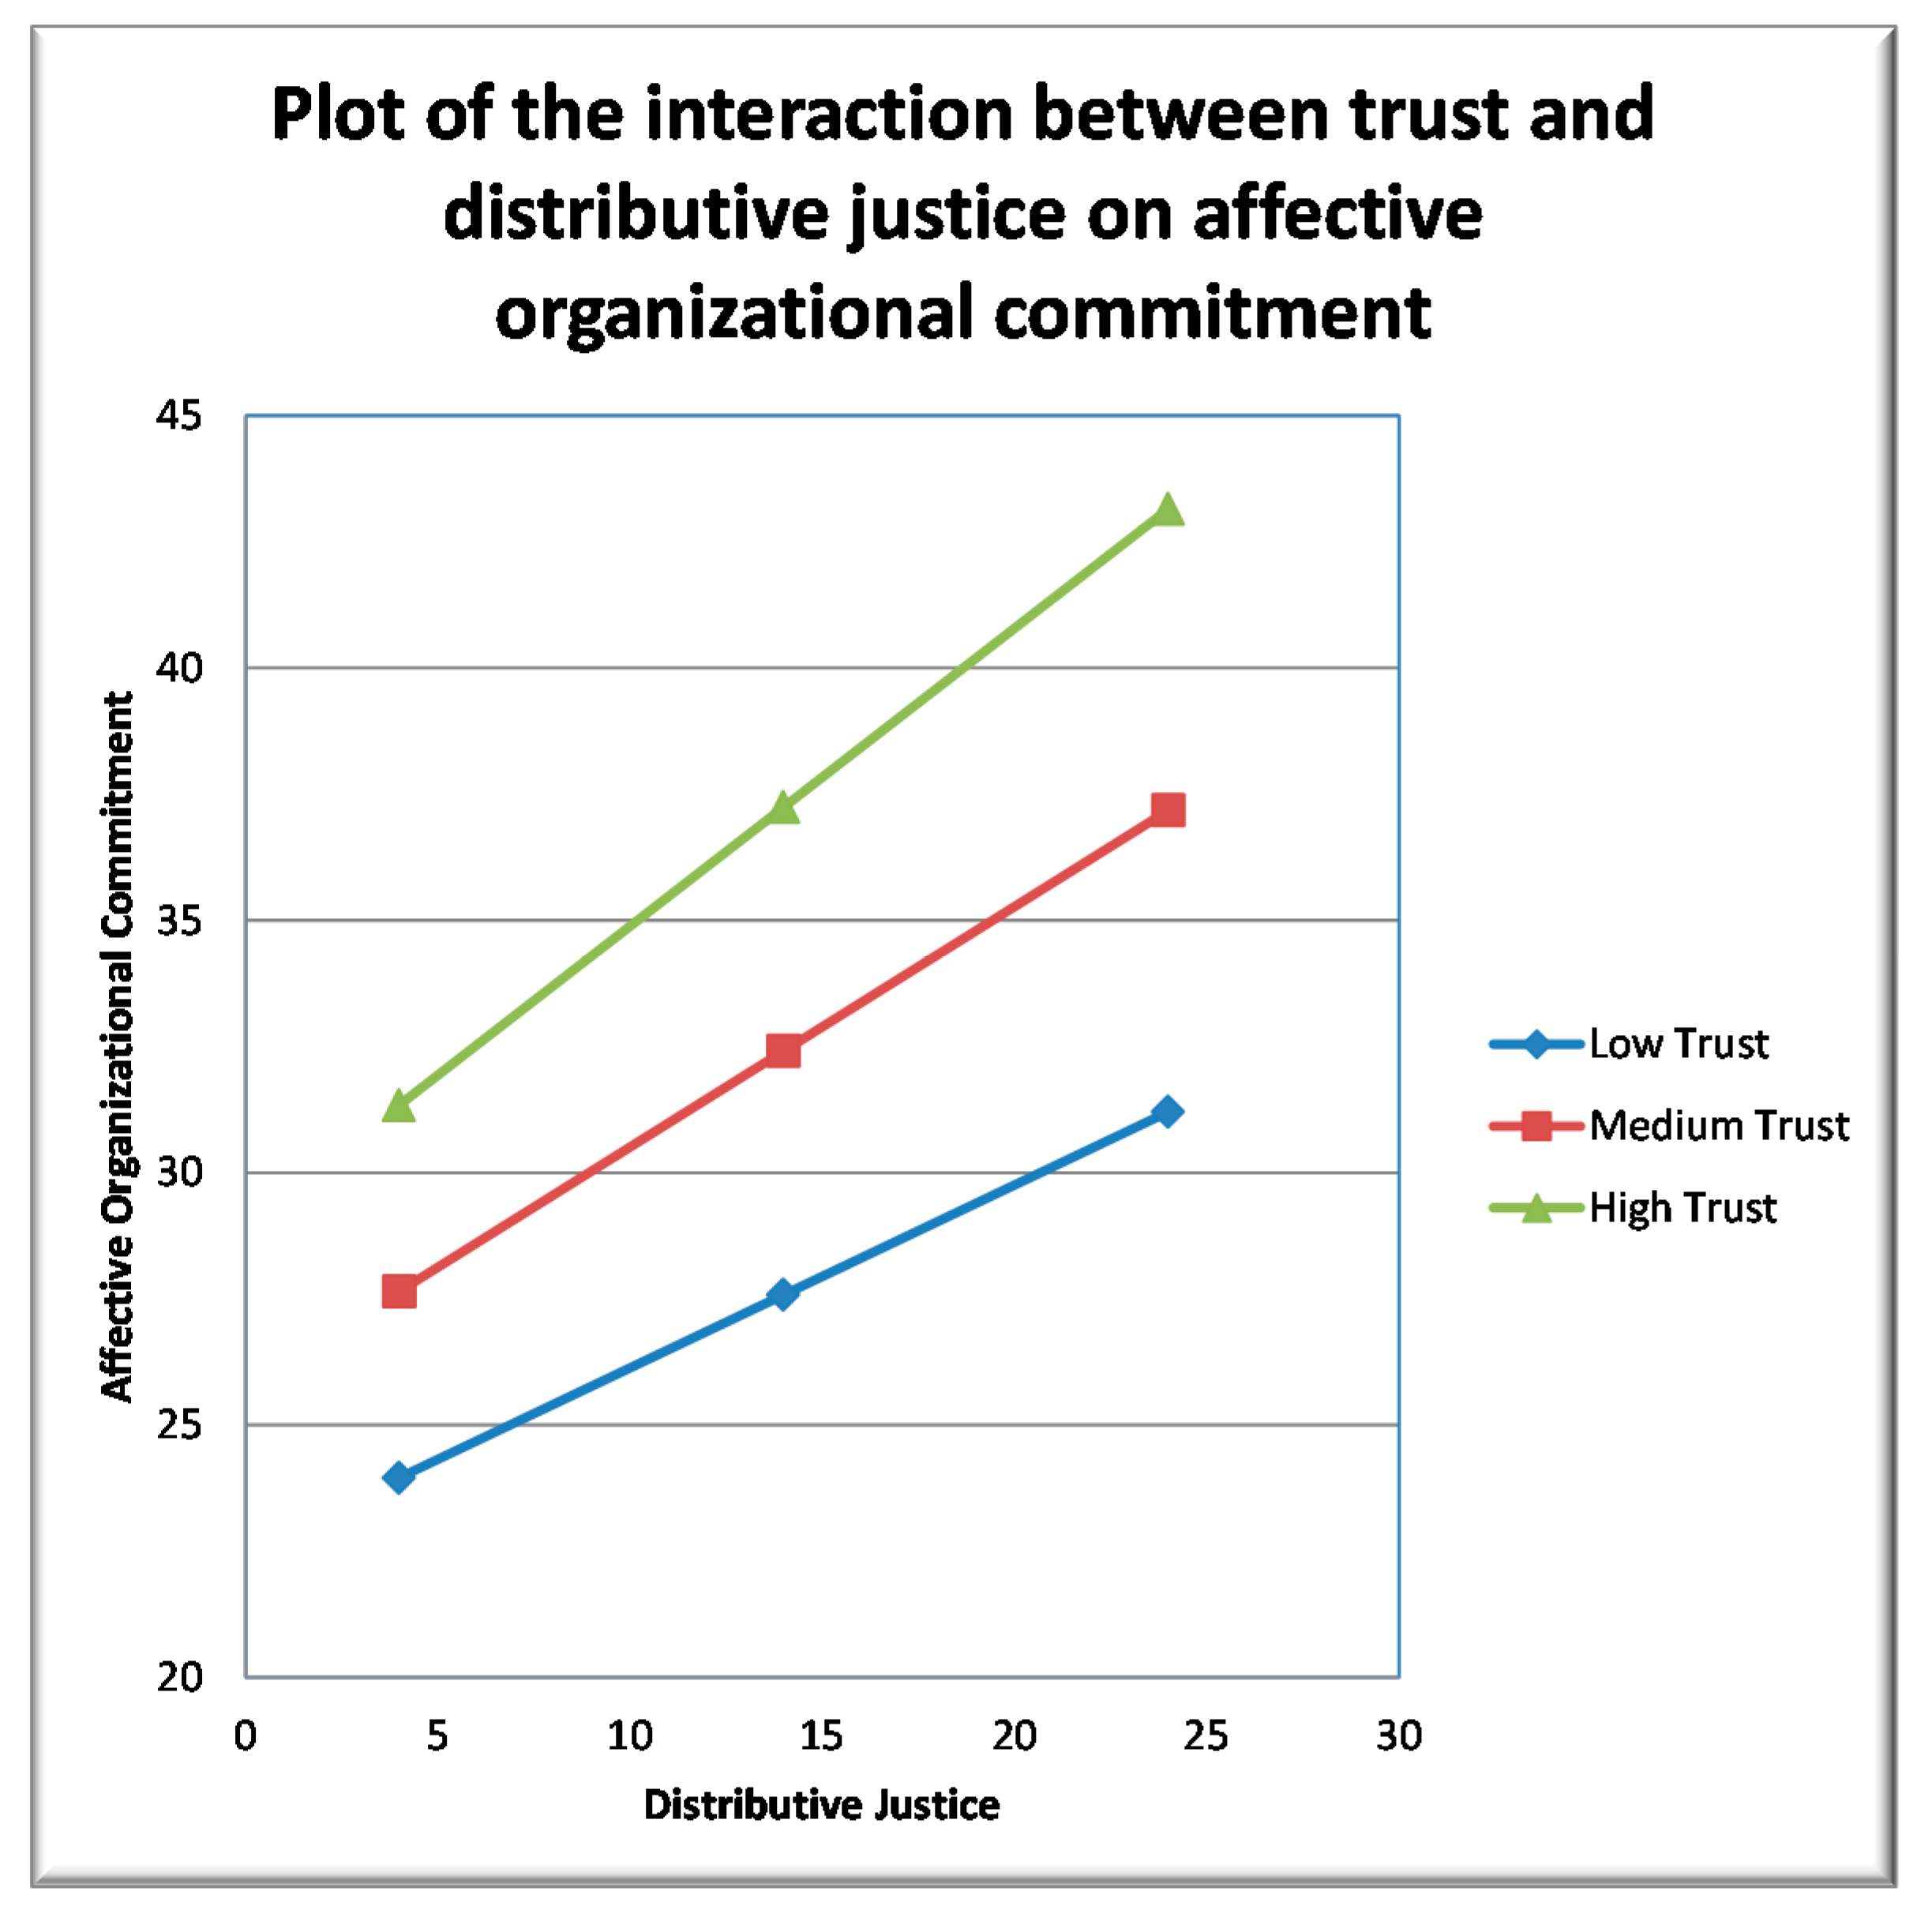
  • Main effects and Interactions of the moderation model
Considering step 2, the model with the control variables and the main effects, our model explained 59% of the variance of affective commitment (R2 aj = 0.59, p ≤ 0.001) (F(17,1311) = 110,91, p ≤ 0.001). As expected, the R2 showed an increment of 0.517. Hypothesis 1a and 1d are confirmed. The results show that HR relationship with employees and the visibility of the system directly predicted affective commitment. HR relationship with employees (β = 0.20) is the second in order of importance in predicting affective commitment, followed by Visibility (β = 0.14). Hypothesis 1 b, 1c and 1e are not confirmed. Contrary to the expected, comprehensibility, utility and distributive justice of the system in this model, do not directly influence the affective commitment.
The HR relationship with employees’ is significant in all the steps of the model, demonstrating an important direct effect on affective commitment (β = 0.20 to β = 0.21). Visibility of HRMS is also significant in all the steps of the model. Its importance decreases, as expected, considering the standardized Beta (β = 0.14 to β = 0.13).
Hypothesis 2a is confirmed. The results demonstrate that trust in manager predicts affective commitment. Organizational trust is the predictor which most contributes to the model. The Beta standardized value is the highest, in the second and third step (β= 0.53; β= 0.51). The regression coefficients slightly decrease as expected.
In step 3, interactions were entered. The third model increased the variance in 0.005 and is significant (R2 = 0.60, p ≤ 0.001) (F(22,1306) = 87.09 p ≤ 0.001). The final model shows that 60% of the variability in affective commitment is predicted by our model.
In the third step, Hypothesis 3a, 3b, 3c and 3d were not confirmed. Contrary to what was expected HR relationship with employees, Comprehensibility, Utility and Visibility of the system are not moderated by trust in a manager, as these interactions were not significant. Only hypothesis 3e is confirmed as the interaction between distributive justice and trust is significant (β = 0.09, p ≤ 0.001) t (1306) = 3.53, p < 0.001. In other words, the slope to predict affective commitment from distributive justice becomes more positive as trust increases.
In order to better understand the moderation between distributive justice and trust in manager, pos-hoc analysis was performed. We analyzed the simple effects of the independent variable for different levels of the moderator relation. Research [64] recommends that when interaction terms are statistically significant, plots are useful for post hoc interpretations. Cohen et al. [64] recommend plotting the regression of Y on X at three values: one standard deviation below the mean, the mean and one standard deviation above the mean. To perform this analysis we have written a regression equation for each of the simple regression lines and for each slope substitute the value of X2, in the rearranged regression equation: Y’= (A + B2X2) + (B1 + B3X2)X1.
Regression lines for the DV (affective commitment) at: The low value of X2 y = 11.938 + (0.397 × 26.62) + (−0.01 + (0.014 × 26.62))X1; The medium value of X2 y = 11.938 + (0.397 × 34.77) + (−0.01 + (0.014 × 34.77))X1; The high value of X2 y = 11.938 + (0.397 × 42.92) + (−0.01 + (0.014 × 42.92))X1.
We resolved the three equations for three values of X1 and the resulted DV values were plotted. The chosen values of X1 were: X1 = 4; X1 = 14; X1 = 24. These values were chosen because 4 and 24 represent the minimum and maximum values that distributive justice assumed. Each regression was then solved at these three values and the interactions plotted at Figure 3.
Figure 3 shows the the plot with differences in affective commitment at of different levels of trust and distributive justice. An interaction effect is seen with the presence of nonparallel lines. We observe an interaction between two factors whenever the simple effects of one changes as the levels of the other factor changes as well. There will always be a simple effect because if plotted the other way the lines would cross. We have nonparallel lines in all the levels of trust, as trust increases the leap in the levels of commitment rises. The positive sloping lines suggest that as the distributive justice increases, the presence of trust increases more rapidly the affective commitment. In high trust, where the effect is most pronounced, we can interpret that as distributive justice increases and levels of trust in manager is high, the affective organizational commitment increases very rapidly. The final moderation model can be observed in Figure 4.
  • Model 2: The mediation model
In contrast with the moderation model described above, Model 2 predicted that perceived OT would intervene between HRMS and OAC. Mediation can be detected when the relationship between the IV and DV is reduced, when the mediator is in the analysis. If the relationship between the IV and the DV goes to zero when the mediator is in the equation, mediation is said to be perfect. Table 10 presents the results for the regression coefficients for each variable: The regressions were performed independently and not sequentially. The control variables were not described here, however they entered in all the regression analysis of the model are significant. The final model explains 59% of the variance in affective commitment.
As shown in Table 11 and Table 12, Regression 1 analyses of HRMS in OAC (R2 aj = 0.41. p ≤ 0.001) Sustainability 12 09443 i001 
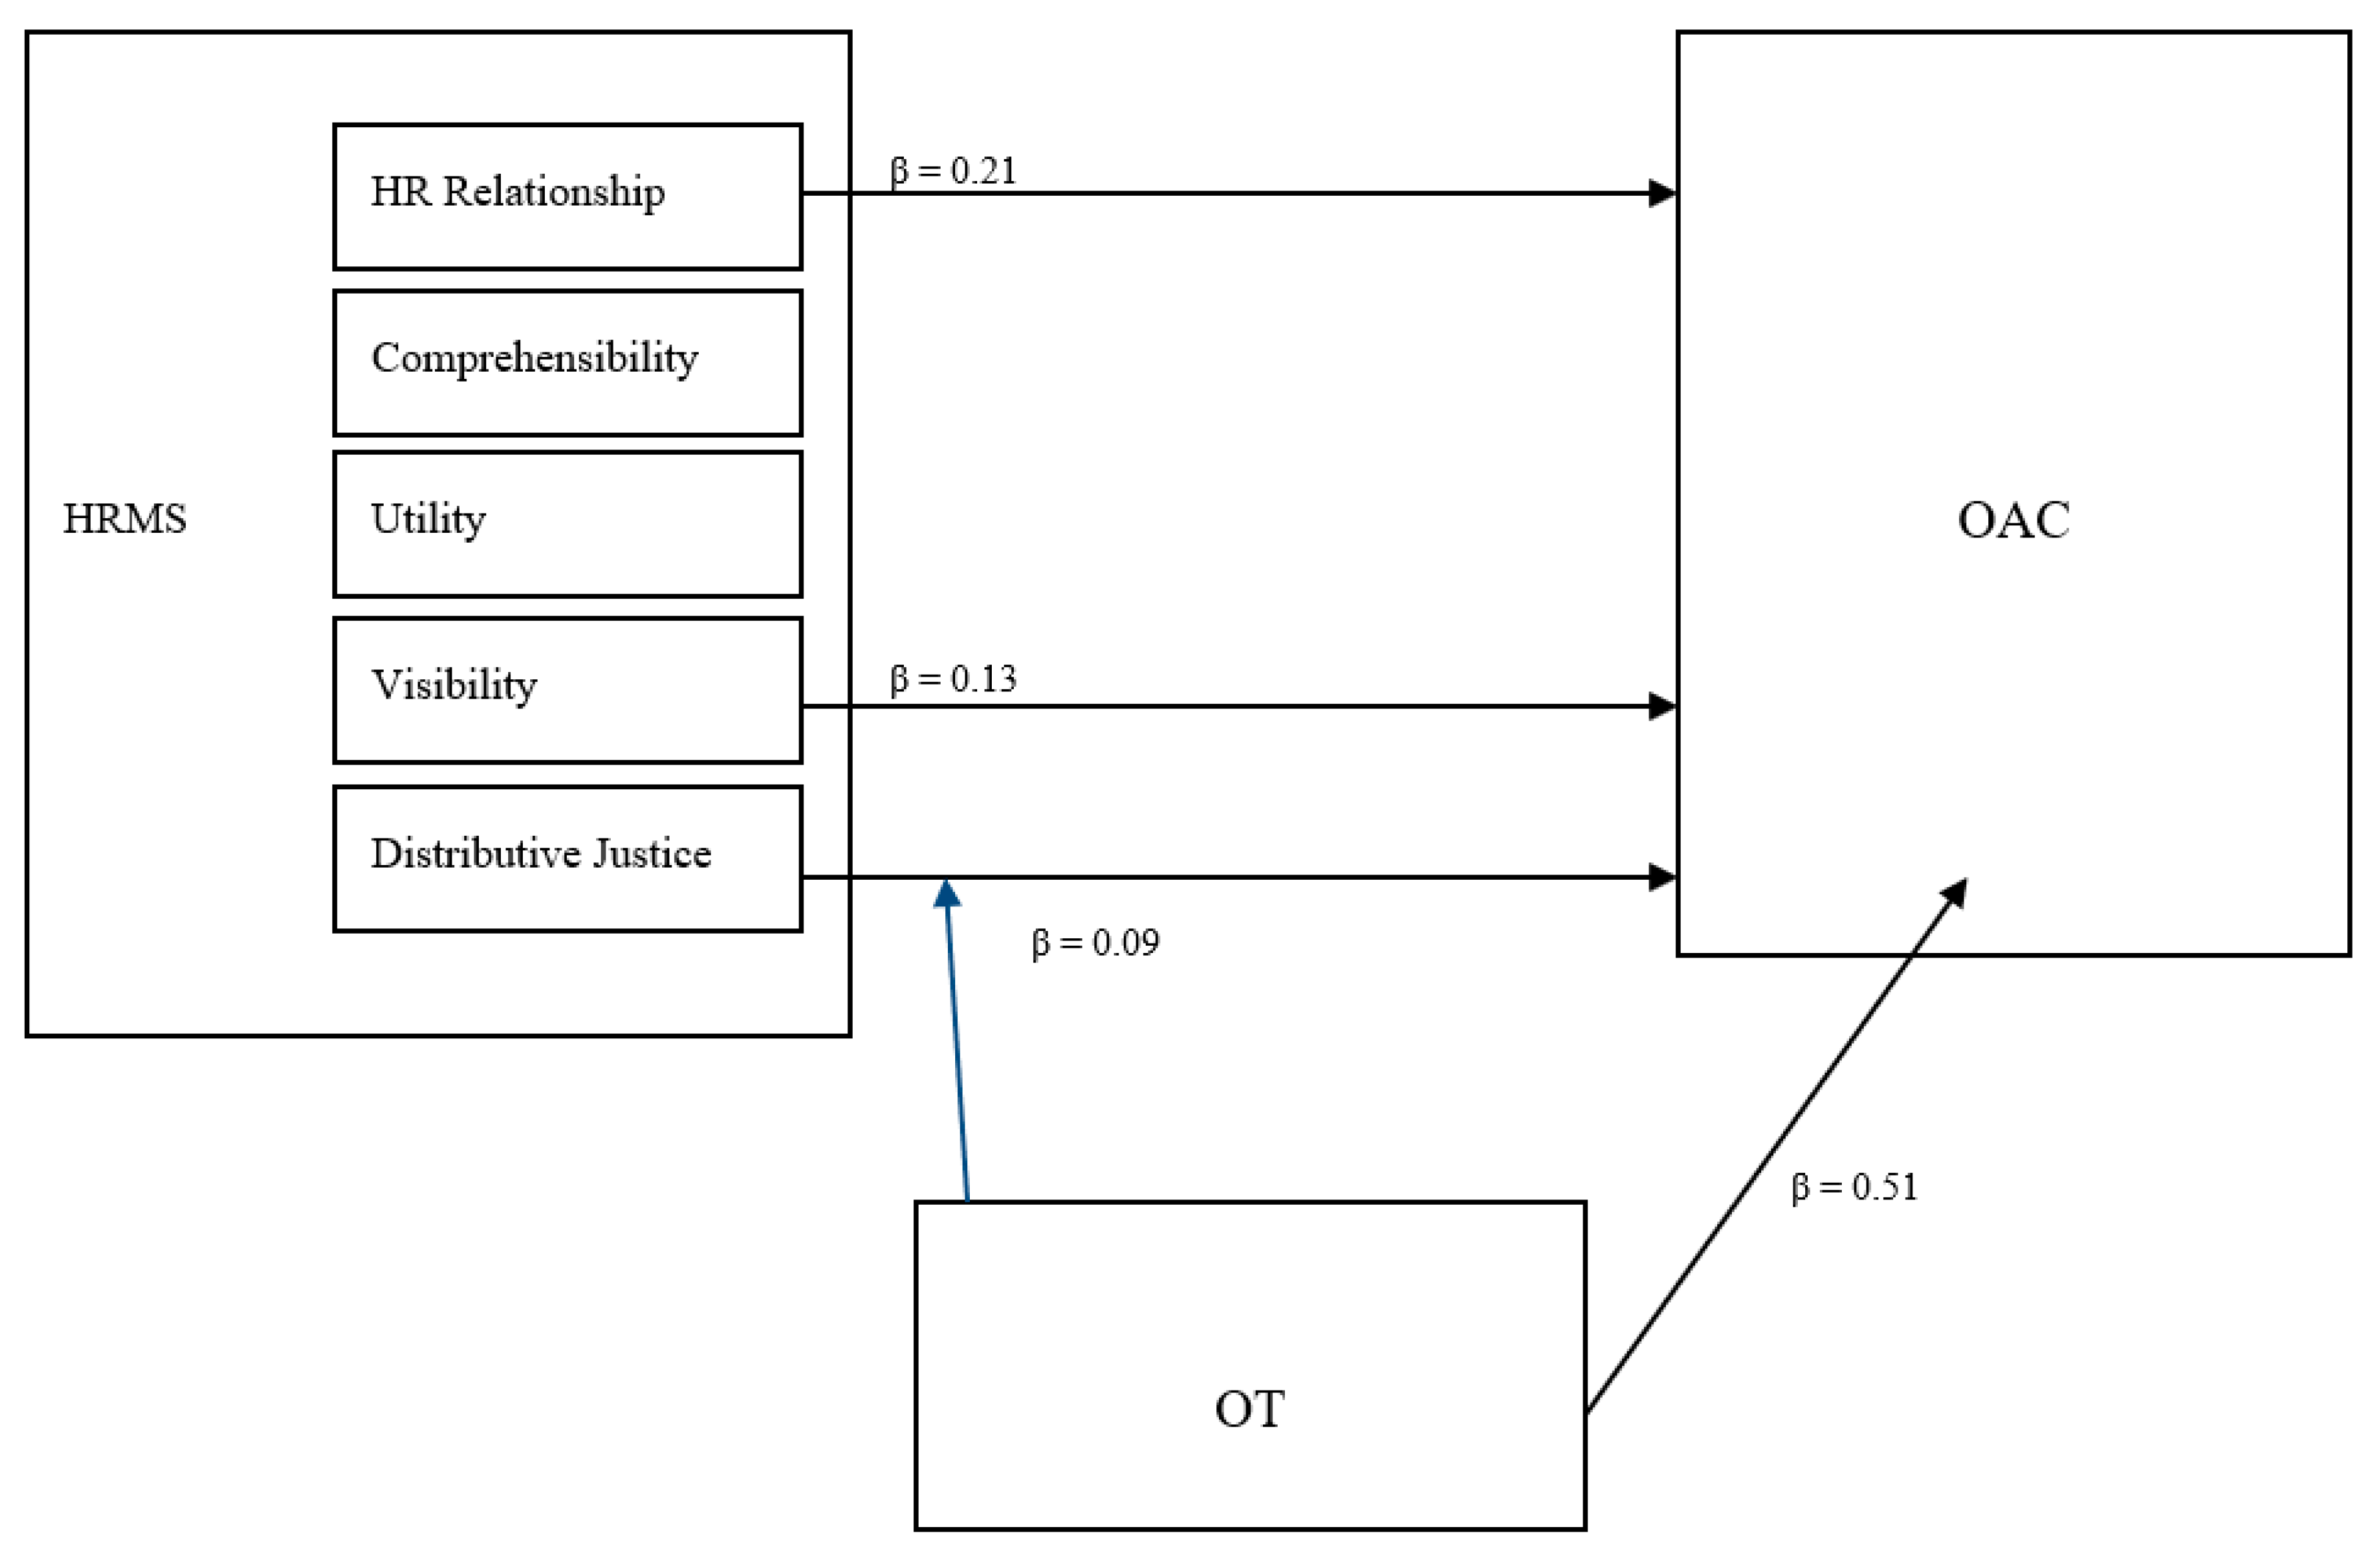
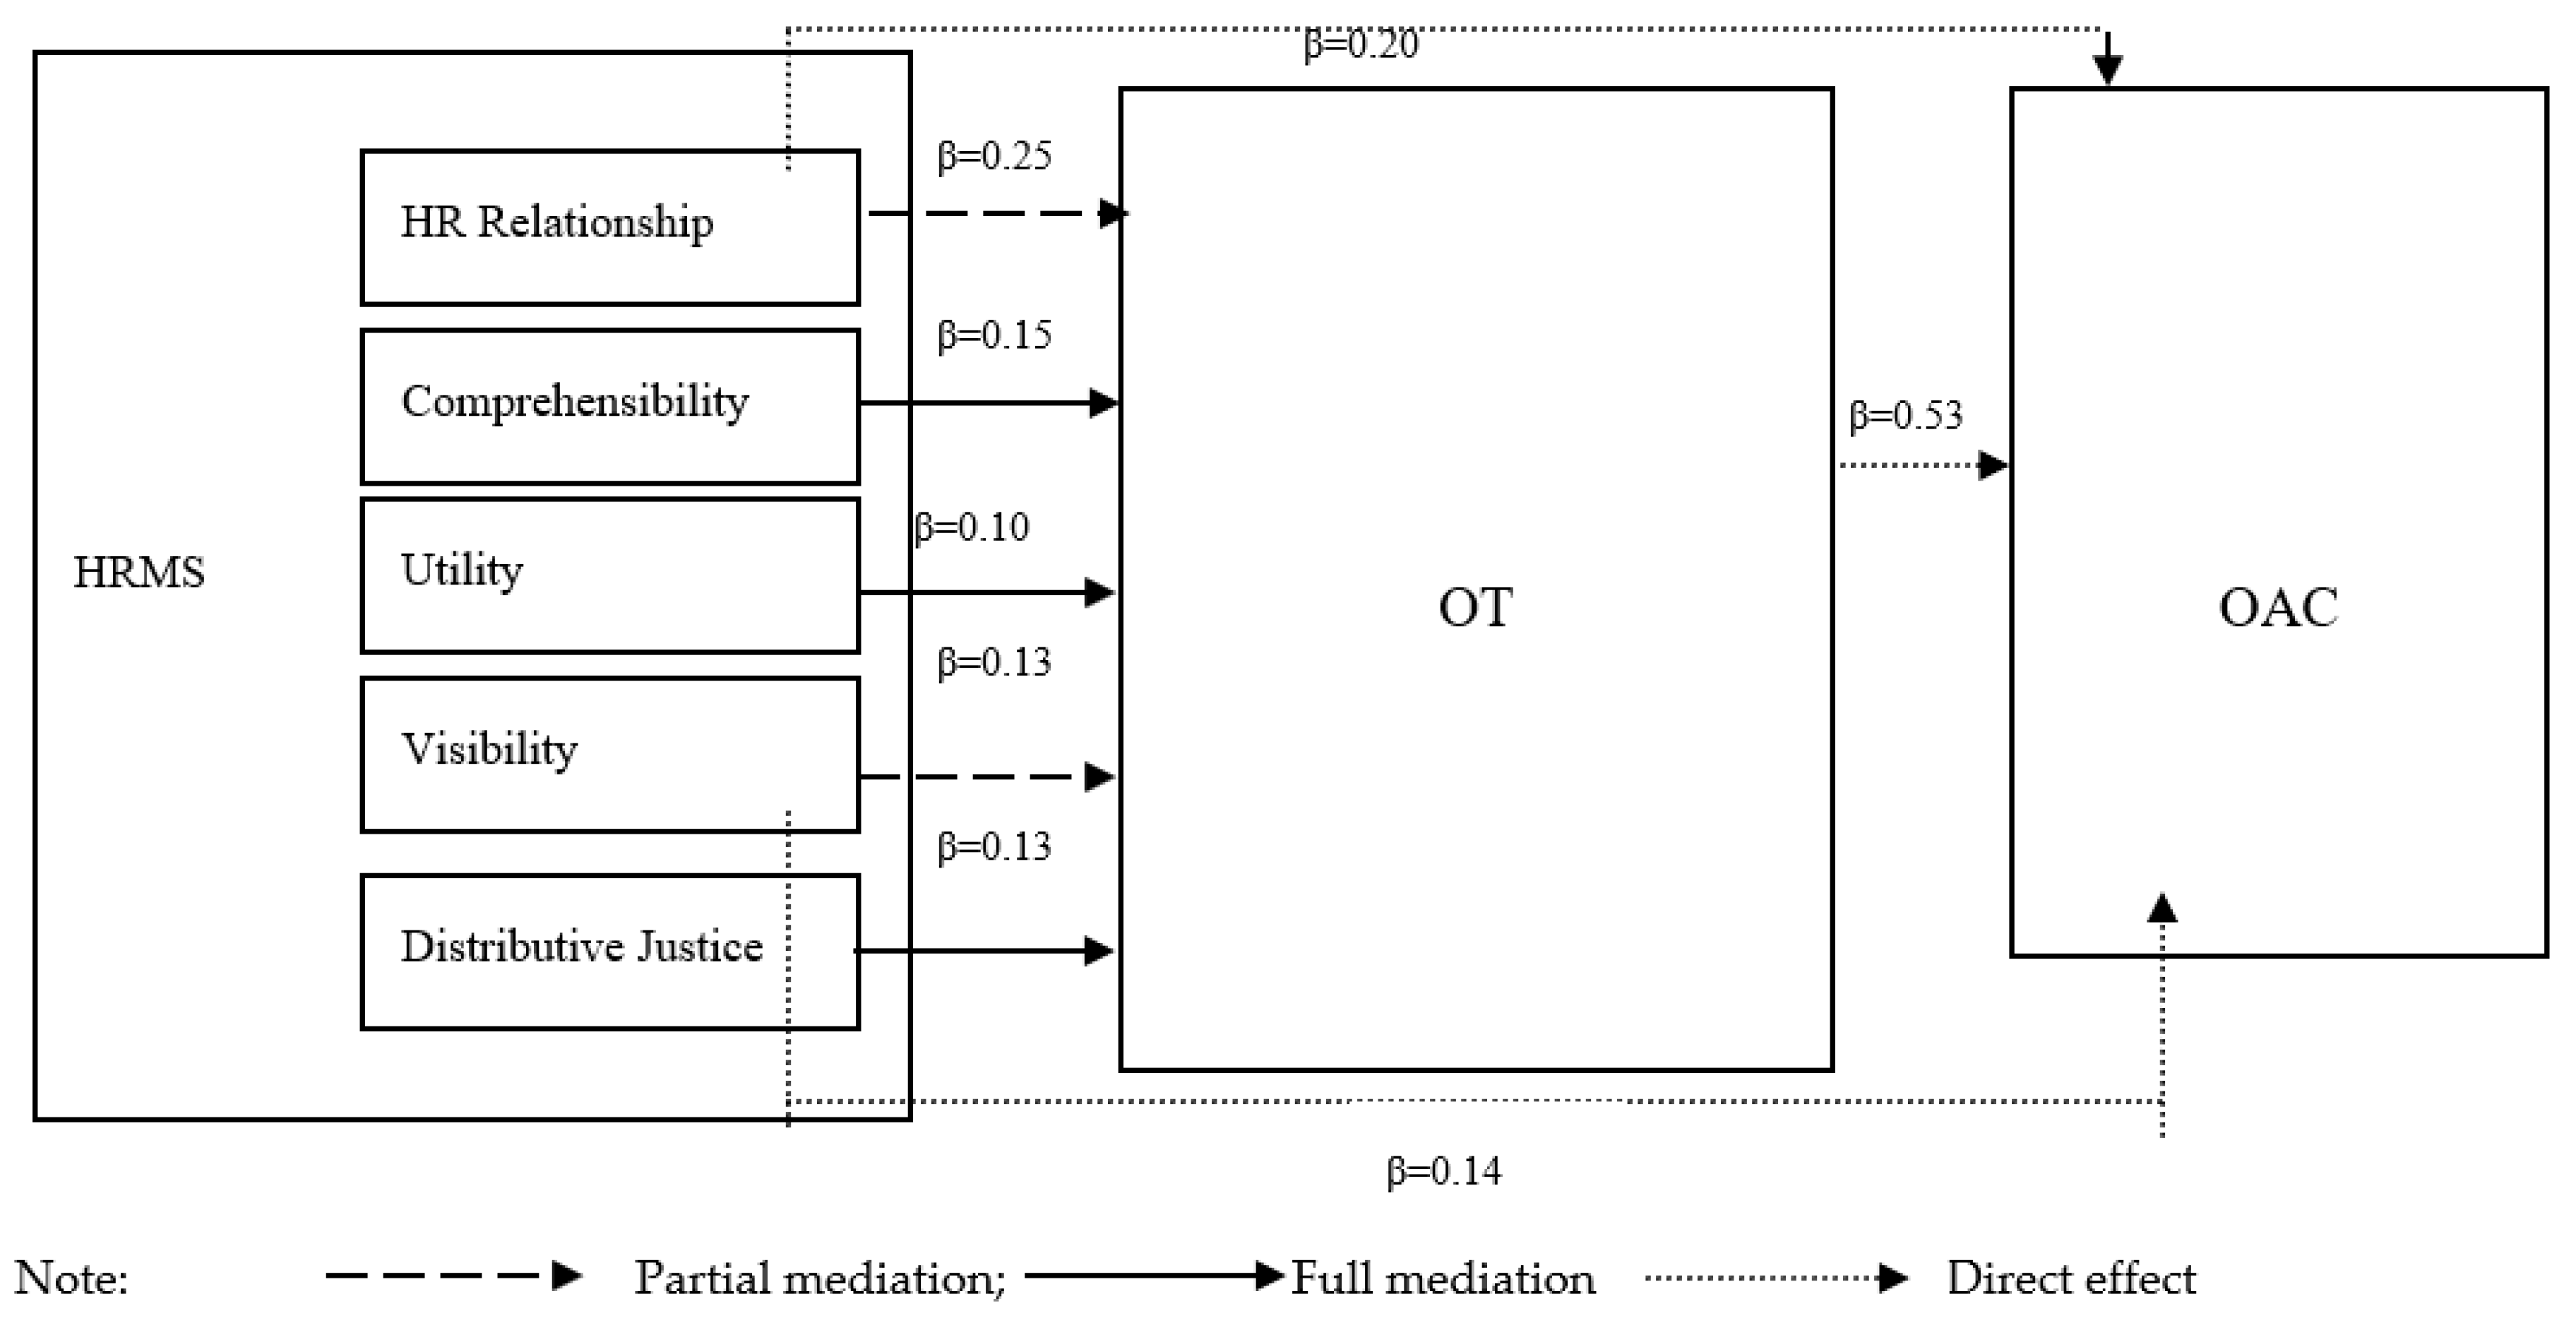
R2 = 0.34 (F(5,1312) = 151.29, p ≤ 0.001) indicated that HR relationship with employees (β = 0.34, p ≤ 0.001) Comprehensibility (β = 0.06, p ≤ 0.10), Utility (β = 0.07, p ≤ 0.05), Visibility (β = 0.21, p ≤ 0.001) and Distributive Justice (β = 0.07, p ≤ 0.05), are positively related to OAC, thus meeting the first mediation condition. In regression 2, analysis of HRMS in OT in manager (R2 aj = 0.37. p ≤ 0.001) Sustainability 12 09443 i001 R2 = 0.32 (F(5,1312) = 134.99, p ≤ 0.001) show that HR relationship with employees (β = 0.25, p ≤ 0.001) Comprehensibility (β = 0.15, p ≤ 0.001), Utility (β = 0.10, p ≤ 0.001), Visibility (β = 0.13, p ≤ 0.001) and Distributive Justice (β = 0.12, p ≤ 0.001), are positively related to OT, thus meeting the second mediation condition. In Regression 3, analysis of OT in manager in OAC (R2 aj = 0.53, p ≤ 0.001) Sustainability 12 09443 i001 R2 = 0.46 (F(1,1316) = 1294.07, p ≤ 0.001) shows that OT (β = 0.66, p ≤ 0.001) is positively related to OAC, thus meeting the third mediation condition. In regression 4, analysis of HRMS dimensions and OT in manager in OAC (R2 aj = 0.59, p ≤ 0.001) Sustainability 12 09443 i001 R2 = 0.52 (F (6,1311) = 275.53, p ≤ 0.001) indicated that HR relationship with employees (β = 0.20, p ≤ 0.001) and Visibility (β = 0.14, p ≤ 0.001) decreased the Beta but did not become nonsignificant, indicating a partial mediation. Comprehensibility (β = −0.020, n.s), Utility (β = 0.02, p ≤ n.s) and Distributive Justice (β = −0.01, n.s) become nonsignificant, indicating a full or perfect mediation by OT. OT is the most relevant predictor (β = 0.53, p ≤ 0.001).
Model 2, hypothesized that the HRMS dimensions influences OT in manager, which, in turn, influences OAC. Hypothesis 1a, 1b, 1c, 1d, 1e and 2 were totally supported. Concerning the mediation model, Hypothesis 4b, 4c and 4e were totally supported and Hypothesis 4a and 4c were partially supported, as observed in Figure 5.

4. Discussion

Few studies have examined the gap between HRMS, OT and OAC [26]. This paper adds new information to the research domain that investigates the impact of HRMS based on a process-based approach [15,71]. The results found evidence of the impact of HRMS on AOC. These findings add empirical data to the identified gap of Bowen and Ostroff’s model [4,6] and show clear effect of HRMS on OT and OAC, through mediation and moderation processes, as proposed by the model but scarcely demonstrated in research. This paper contributes to this gap and to the definition of the construct itself considering especially discriminant validity. Results confirm that HRMS builds an important frame in which it produces rules, procedures and types of relationships. These perceptions have an impact, building climates and sending messages to employees with particular relevance on the development of OT. Our results show that OT can be confirmed as an indicator of the quality of the relationship between management and employees. These results are consistent with social-exchange theory and past research [16,17,18,20,57,72] acknowledging organizational trust as relevant in the development of OAC. Results emphasize the crucial role of HRMS in an organization, functioning as a promotor for the development of OT. These findings theoretically and empirically support recent work considering the importance of organizational trust as mediator [15,16,29,73,74,75,76] or a moderator [20,43,48,77,78,79] Considering our findings, we suggest that the mediation model is the one that offers stronger results. HRMS dimensions are mediated (partially or totally) by OT in manager towards OAC. HRMS dimensions (HR relationship with employees, comprehensibility, utility, visibility and distributive justice) influences OT in manager, which, in turn, influences affective commitment.
A special comment regarding associated variables is important. Our results show the importance of other predictors in AOC that were screened as control variables: (1) Respondents’ sex. Employees from the female sex are more committed than male employees confirming results in the literature [80] that women are often more committed than men. Future studies should address not only respondents’ sex but also parenthood or family responsibilities. There is a scarcity of studies that study the interaction effect of parents by gender on HRMS, OT and AOC. The presence of a family-friendly culture should also be integrated in future studies so we could understand its prevalence in HRMS impact; (2) The differentiation between public and private sector have been explored and studied in the recent literature [23]. These results show that employees from the private sector are more affectively committed than employees from the public sector; (3) Industries employees are less committed than services employees. This is an expected result that confirms the literature. Possibly the nature of HRMS related processes, in bureaucracies, such as public services or industries, tend to have a top down strategy, combined with reduced power in HR function. Reduced relationship between HRM function and employees may contribute to reduced levels of OAC as HRMS can be seen as difficult to perceived or understand by employees. (4) employees that aren’t managers are more committed than managers; and (5) the contract type influences AOC, demonstrating that employees with no term contract are less committed than respondents with fixed term contract. Changes and breaches on OAC can be found possibly if we have to consider that time also will have an effect on the existence of more “ruptures” in the organization-employee relationship. If we consider the literature on OT and the psychological contract as relevant towards the understanding of employees-organization relationship, we can observe that time allows for the possibility of more “breaches” in the quality of employees-organizational relationship. These “breaches” have impact in employees AOC [37]. Another interesting result is that 6) managers with a higher number of subordinates are more committed than managers with a lesser number of subordinates. A possible explanation to this result is that as the team increases the manager has different perceptions towards his responsibility and is more actively engaged. Future studies should address these differences regarding different managerial levels, exploring the number of elements of the team and the associated responsibility of the function in the organizational structure as relevant variables towards HRSM impact on OT and AOC.
In the moderation model, it is relevant to discuss the interaction found, distributive justice x OT. This was the only significant interaction present and pos-hoc tests showed that when distributive justice increases and levels of OT in manager is high, OAC increases rapidly. This brings new information to study the relation between OT and distributive justice. If we consider this interaction but also the mediation model, distributive justice by itself did not produce results in OAC; therefore findings suggest that OT in manager strengths the relation of distributive justice towards OAC. Perhaps the importance of the distributive justice of HRMS only becomes relevant on OAC, if OT in manager is present. It is important to also refer that OT and justice appear to have some similarities empirically, therefore recent studies have tried to disaggregate them. Future studies should try to isolate the role and unique impact of OT and distributive justice. Future studies should address this suggestion integrating also results from this paper that brings about the relevance of distribute justice integrated in HRSM and afterwards in the development of OT.
Coming back to HRMS dimensions it is also interesting to find that there are two dimensions in HRMS that appear to be more important than others in predicting OAC: The HR relationship with employees and Visibility. In both models (moderator and mediator) these two dimensions appear with a direct effect on OAC. We can interpret these results at the light of the Bowen and Ostroff’s model [4,6] and the attribution theory. Results show that HRMS differences between dimensions can be established theoretically in two blocks. The first more related to the system acted by its agents, the actors of the HRMS (HR relationship with employees) and the second the system acts by itself (comprehensibility, visibility, utility and distributive justice of the system). Future studies should understand if these two possible meta-dimensions can be perceived independently. Our data suggest that there are two attributes that are especially relevant: In Meta-dimension 1 (the agents of HR system) it is “HR relationship with employees” based on their competence, consistent behavior, ability to solve problems and listen to people; This relationship is relevant, strategic and it’s built by HR function based on proximity, communication and support. We suggest that these interactions between the HR agents and employees are relevant and may lead to generalizations about the HRMS. In Meta-dimension 2 (the effects of the system itself) possibly Visibility is the most relevant attribute. Future studies should test empirically these two meta-dimensions. Probably both meta-dimensions have significant effects in OAC adding to the literature of a process-based approach and bringing new results to the importance of demonstrating HRMS perception in employees individual results. Our results follow recent findings that OT in manager is unequivocally important in the relationship between HRMS and AOC. It is crucial for organizations to acknowledge HRMS and OT in managers as having a relevant impact on employees’ AOC.

Limitations and Future Research

Mediating effects may provide important information about links between the model variables. However, because of the cross-sectional nature of the current study, all proposed mediational effects are considered exploratory. Also, the possible causal sequence of the line is due to our theoretical framework. It is important to test other possible chains, because trust is built based on a several antecedents, constituting a difficulty to perceive clearly where one begins and other ends. It is recommended that future researchers replicate the use of this scale and dimensions and compare the findings in other contexts, especially in other cultures, as the cultural context can be important in the explanation of the importance of trust. This paper presents a perspective based on employee and managers perceptions of HRMS as antecedents of OT and OAC. Other theoretical perspectives can be used to explain this construct and also on the nature of characterization of employees’ perceptions of HRMS. In this paper we also tried to associate an emergent dimension in HRM, sustainable HRM with process-based approach, as they assume several points of contact. Other conceptual and empirical approximations can be made in order to study relevant process implementation indicators with positive outcomes for employees namely. We used a single perspective on employee perceptions of HRMS but more descriptive, more qualitative data are needed for us to gain a deeper understand of HRMS implementation processes and which indicators are the upmost relevant in the process.

5. Conclusions

The main goal of this paper is to respond to the HRM “black box” towards positive results, namely on OT and OAC, specifically associated with sustainable HRM. Also, this paper intends to contribute to the fostering of empirical models that test Bowen and Ostroffs model, as the model as revealed itself complex and empirically difficult to measure. Sustainable HRM is a theoretical approach that is used on this paper as relevant on the development of organizational sustainability through HRMS. The process-based approach that enhances the relevance of HRMS with its implementation processes and therefore with the relevance of mediators and moderators on the process fits perfectly and adds relevant results to sustainable HRM. If sustainable HRM is a complex system that organizes positive messages to employees, HRMS should be developed with a positive goal that addresses this responsibility for sustainability. This research considers HRMS as a relevant organizational system that is perceived by employees as an indicator of organization’s involvement. Results of this study show that HRMS dimensions are mediated (partially or totally) by OT in manager towards OAC and distributive justice of HRMS only becomes relevant on OAC, if OT in manager is present. This empirical test of the HRMS model also suggests its reframing in two meta-dimensions: A. the agents of HR system, the HR relationship with employees based on their competence, consistent behavior, ability to solve problems and listening to people; and B. the effects of the system itself, possibly Visibility is the most relevant attribute. We suggest that these interactions between HR agents and employees are relevant and may lead to generalizations about the HRMS. It is crucial for organizations and research to acknowledge HRMS and OT in managers as having relevant impact on employees’ AOC. Also, the adoption of more sustainable HRMS constitute a relevant pathway to enhance and foster a positive organizational development with positive and relevant results.

Author Contributions

Conceptualization, A.T.F.-O., J.K. and I.S.; methodology, A.T.F.-O.; software, A.T.F.-O.; validation, J.K. and I.S.; formal analysis, A.T.F.-O.; investigation, A.T.F.-O.; resources, A.T.F.-O., J.K. and I.S.; data curation, A.T.F.-O.; Writing—Original draft preparation, A.T.F.-O.; Writing—Review and editing, J.K. and I.S.; visualization, A.T.F.-O.; supervision, J.K. and I.S.; project administration, A.T.F.-O.; funding acquisition, A.T.F.-O., J.K. and I.S. All authors have read and agreed to the published version of the manuscript.

Funding

This research was funded by FCT, grant number SFRH/BD/60939/2009.

Conflicts of Interest

The authors declare no conflict of interest.

References

  1. Kramar, R. Beyond strategic human resource management: Is sustainable human resource management the next approach? Int. J. Hum. Resour. Manag. 2014, 25, 1069–1089. [Google Scholar] [CrossRef]
  2. Lee, J.; Kim, S.; Lee, J.; Moon, S. Enhancing employee creativity for a sustainable competitive advantage through perceived human resource management practices and trust in management. Sustainability 2019, 11, 2305. [Google Scholar] [CrossRef] [Green Version]
  3. Boon, C.; Den Hartog, D.N.; Lepak, D.P. A Systematic Review of Human Resource Management Systems and Their Measurement. J. Manag. 2019, 45, 2498–2537. [Google Scholar] [CrossRef] [Green Version]
  4. Bowen, D.E.; Ostroff, C. Understanding HRM-firm performance linkages: The role of the “strength” of the HRM system. Acad. Manag. Rev. 2004, 29, 203–221. [Google Scholar] [CrossRef] [Green Version]
  5. Boselie, P.; Dietz, G.; Boon, C. Commonalities and contradictions in HRM and performance research. Hum. Resour. Manag. J. 2005, 15, 67–94. [Google Scholar] [CrossRef] [Green Version]
  6. Ostroff, C.; Bowen, D.E. Reflections on the 2014 decade award: Is there strength in the construct of HR system strength? Acad. Manag. Rev. 2016, 41, 196–214. [Google Scholar] [CrossRef]
  7. Becker, B.E.; Huselid, M.A. Strategic human resources management: Where do we go from here? J. Manag. 2006, 32, 898–925. [Google Scholar] [CrossRef] [Green Version]
  8. Do, H.; Budhwar, P.; Patel, C. Relationship between innovation-led HR policy, strategy, and firm performance: A serial mediation investigation. Hum. Resour. Manag. 2018, 57, 1271–1284. [Google Scholar] [CrossRef]
  9. Breswter, C.; Gooderham, P.N.; Mayrhofer, W. Human Resource Management: The promise, the performance, the consequences. J. Organ. Eff. People Perform. 2016, 3, 181–190. [Google Scholar] [CrossRef]
  10. Delaney, J.T.; Huselid, M.A. The Impact of Human Resources Management on Organizational Performance. Acad. Manag. J. 1996, 39, 949–969. [Google Scholar]
  11. Gould-Williams, J. The importance of HR practices and workplace trust in achieving superior performance: A study of public-sector organizations. Int. J. Hum. Resour. Manag. 2003, 14, 28–54. [Google Scholar] [CrossRef]
  12. Guest, D.; Conway, N. The impact of HR practices, HR effectiveness and a “strong HR system” on organisational outcomes: A stakeholder perspective. Int. J. Hum. Resour. Manag. 2011, 22, 1686–1702. [Google Scholar] [CrossRef]
  13. Wang, Y.; Kim, S.; Rafferty, A.; Sanders, K. Employee perceptions of HR practices: A critical review and future directions. Int. J. Hum. Resour. Manag. 2020, 31, 128–173. [Google Scholar] [CrossRef]
  14. Sanders, K.; De Cieri, H. Similarities and differences in international and comparative human resource management: A review of 60 years of research. Hum. Resour. Manag. 2020, 1–34. [Google Scholar] [CrossRef]
  15. Sanders, K.; Dorenbosch, L.; de Reuver, R.S.M. The impact of individual and shared employee perceptions of HRM on affective commitment: Considering climate strength. Pers. Rev. 2008, 37, 412–425. [Google Scholar] [CrossRef]
  16. Vanhala, M.; Ritala, P. HRM practices, impersonal trust and organizational innovativeness. J. Manag. Psychol. 2016, 31, 95–109. [Google Scholar] [CrossRef]
  17. Whitener, E.M. Do “high commitment” human resource practices affect employee commitment? J. Manag. 2001, 27, 515–535. [Google Scholar] [CrossRef]
  18. Whitener, E.M.; Brodt, S.E.; Korsgaard, M.A.; Werner, J.M. Managers as inititators of trust: An exchange relationship framework for understanding managerial trustworthy behavior. Acad. Manag. J. 1998, 23, 513–530. [Google Scholar]
  19. Zeffane, R.; Connell, J. Trust and HRM in the new millennium. Int. J. Hum. Resour. Manag. 2003, 14, 3–11. [Google Scholar] [CrossRef]
  20. Vanhala, M.; Dietz, G. How Trust in One’s Employer Moderates the Relationship Between HRM and Engagement Related Performance. Int. Stud. Manag. Organ. 2019, 49, 23–42. [Google Scholar] [CrossRef]
  21. Clipa, A.-M.; Clipa, C.-I.; Danileț, M.; Andrei, A.G. Enhancing sustainable employment relationships: An empirical investigation of the influence of trust in employer and subjective value in employment contract negotiations. Sustainability 2019, 11, 4995. [Google Scholar] [CrossRef] [Green Version]
  22. Boxall, P.; Purcell, J. Strategic HRM; where have we come from and where should we be going? Int. J. Manag. Rev. 2000, 2, 183–203. [Google Scholar] [CrossRef]
  23. Truss, C. Changing HR functional forms in the UK public sector. Int. J. Hum. Resour. Manag. 2009, 20, 717–737. [Google Scholar] [CrossRef]
  24. Guest, D.E. Human resource management and employee well-being: Towards a new analytic framework. Hum. Resour. Manag. J. 2017, 27, 22–38. [Google Scholar] [CrossRef] [Green Version]
  25. Kooij, D.T.A.M.; Guest, D.E.; Clinton, M.; Knight, T.; Jansen, P.G.W.; Dikkers, J.S.E. How the impact of HR practices on employee well-being and performance changes with age. Hum. Resour. Manag. J. 2013, 23, 18–35. [Google Scholar] [CrossRef]
  26. Troth, A.C.; Guest, D.E. The case for psychology in human resource management research. Hum. Resour. Manag. J. 2020, 30, 34–48. [Google Scholar] [CrossRef] [Green Version]
  27. Peccei, R.; Van De Voorde, K. Human resource management–well-being–performance research revisited: Past, present, and future. Hum. Resour. Manag. J. 2019, 29, 539–563. [Google Scholar] [CrossRef] [Green Version]
  28. Cafferkey, K.; Harney, B.; Dundon, T.; Edgar, F. Unravelling the foci of employee commitment. J. Organ. Eff. 2017, 4, 2–17. [Google Scholar] [CrossRef]
  29. Peccei, R.; Van De Voorde, K. The Application of the Multilevel Paradigm in Human Resource Management–Outcomes Research: Taking Stock and Going Forward. J. Manag. 2019. [Google Scholar] [CrossRef] [Green Version]
  30. Van Beurden, J.; Van De Voorde, K.; Van Veldhoven, M. The employee perspective on HR practices: A systematic literature review, integration and outlook. Int. J. Hum. Resour. Manag. 2020, 1–35. [Google Scholar] [CrossRef]
  31. Van De Voorde, K.; Beijer, S. The role of employee HR attributions in the relationship between high-performance work systems and employee outcomes. Hum. Resour. Manag. J. 2015, 25, 62–78. [Google Scholar] [CrossRef]
  32. Edgar, F.; Geare, A. HRM practice and employee attitudes: Different measures—Different results. Pers. Rev. 2005, 34, 534–549. [Google Scholar] [CrossRef] [Green Version]
  33. Morrow, P.C. Managing organizational commitment: Insights from longitudinal research. J. Vocat. Behav. 2011, 79, 18–35. [Google Scholar] [CrossRef]
  34. Cafferkey, K.; Heffernan, M.; Harney, B.; Dundon, T. Perceptions of HRM system strength and affective commitment: The role of human relations and internal process climate. Int. J. Hum. Resour. Manag. 2019, 30, 3026–3048. [Google Scholar] [CrossRef]
  35. Costa, F.M.; Bastos, A.V.B. Comprometimento organizacional: Bases para uma abordagem processual. Psicol. Teor. Pesqui. 2014, 30, 329–337. [Google Scholar] [CrossRef] [Green Version]
  36. Maia, L.G.; Bastos, A.V.B.; Solinger, O.N. Which factors make the difference for explaining growth in newcomer organizational commitment? A latent growth modeling approach. J. Organ. Behav. 2016, 37, 537–557. [Google Scholar] [CrossRef] [Green Version]
  37. Gao-Urhahn, X.; Biemann, T.; Jaros, S.J. How affective commitment to the organization changes over time: A longitudinal analysis of the reciprocal relationships between affective organizational commitment and income. J. Organ. Behav. 2016, 37, 515–536. [Google Scholar] [CrossRef]
  38. Brockner, J.; Flynn, F.J.; Dolan, R.J.; Ostfield, A.; Pace, D.; Ziskin, I.V. Commentary on “radical HRM innovation and competitive advantage: The Moneyball story”. Hum. Resour. Manag. 2006, 45, 127–145. [Google Scholar] [CrossRef]
  39. Kidron, A.; Tzafrir, S.; Meshoulam, I. All we need is trust:Trust and human resource management. Team Perform. Manag. 2016, 22, 139–155. [Google Scholar] [CrossRef]
  40. Snape, E.; Redman, T. HRM practices, organizational citizenship behaviour, and performance: A multi-level analysis. J. Manag. Stud. 2010, 47, 1219–1247. [Google Scholar] [CrossRef]
  41. Takeuchi, R.; Lepak, D.P.; Wang, H.; Takeuchi, k. An Empirical Examination of the Mechanisms Mediating Between High-Performance Work Systems and the Performance of Japanese Organizations. J. Appl. Psychol. 2007, 92, 1069–1083. [Google Scholar] [CrossRef] [PubMed] [Green Version]
  42. Pereira, C.M.M.; Gomes, J.F.S. The strength of human resource practices and transformational leadership: Impact on organisational performance. Int. J. Hum. Resour. Manag. 2012, 23, 4301–4318. [Google Scholar] [CrossRef]
  43. Farndale, E.; Sanders, K. Conceptualizing HRM system strength through a cross-cultural lens. Int. J. Hum. Resour. Manag. 2017, 28, 132–148. [Google Scholar] [CrossRef] [Green Version]
  44. Sanders, K.; Shipton, H.; Gomes, J. Call for papers: Are HRM processes important? Hum. Resour. Manag. 2012. Available online: http://www.eawop.org/ckeditor_assets/attachments/128/hrm_process_si.pdf?1332990184 (accessed on 7 November 2020).
  45. Vieira, V.A. Moderação, mediação, moderadora-mediadora e efeitos indiretos em modelagem de equações estruturais: Uma aplicação no modelo de desconfirmação de expectativas. Rev. Adm. RAUSP 2009, 44, 17–33. [Google Scholar]
  46. Innocenti, L.; Pilati, M.; Peluso, A.M. Trust as moderator in the relationship between HRM practices and employee attitudes. Hum. Resour. Manag. J. 2011, 21, 303–317. [Google Scholar] [CrossRef]
  47. Fryxell, G.E.; Dooley, R.S.; Li, W.S. The Role of trustworthiness in maintaining employee commitment during restructuring in China. Asia Pacific J. Manag. 2004, 21, 515–533. [Google Scholar] [CrossRef]
  48. Alfes, K.; Shantz, A.; Bailey, C. The link between perceived HRM practices, performance and well-being: The moderating effect of trust in the employer. Hum. Resour. Manag. J. 2012, 22, 409–427. [Google Scholar] [CrossRef]
  49. Farndale, E.; Hope-Hailey, V.; Kelliher, C. High commitment performance management: The roles of justice and trust. Pers. Rev. 2011, 40, 5–23. [Google Scholar] [CrossRef] [Green Version]
  50. Lehmann-Willenbrock, N.; Grohmann, A.; Kauffeld, S. Promoting multifoci citizenship behavior: Time-lagged effects of procedural justice, trust, and commitment. Appl. Psychol. 2013, 62, 454–485. [Google Scholar] [CrossRef] [Green Version]
  51. Mahajan, A.; Bishop, J.W.; Scott, D. Does trust in top management mediate top management communication, employee involvement and organizational commitment relationships? J. Manag. Issues 2012, 24, 173–190. [Google Scholar]
  52. Quittner, A.L.; Glueckauf, R.L.; Jackson, D.N. Chronic Parenting Stress: Moderating Versus Mediating Effects of Social Support. J. Pers. Soc. Psychol. 1990, 59, 1266–1278. [Google Scholar] [CrossRef] [PubMed]
  53. Lewis, H.A.; Kliewer, W. Hope, coping, and adjustment among children with sickle cell disease: Tests of mediator and moderator models. J. Pediatr. Psychol. 1996, 21, 25–41. [Google Scholar] [CrossRef] [Green Version]
  54. Baron, R.M.; Kenny, D.A. The moderator.mediator variable distinction in social psychological research: Conceptual, strategic, and statistical considerations. J. Pers. Soc. Psychol. 1986, 51, 1173–1182. [Google Scholar] [CrossRef] [PubMed]
  55. Coelho, J.P.; Cunha, R.C.e.; Gomes, J.F.S.; Correia, A. Strength of the HRM system: The development of a measure. J. Ind. Eng. Manag. 2015, 8, 1069–1086. [Google Scholar] [CrossRef] [Green Version]
  56. Cabral-Cardoso, C. The evolving Portuguese model of HRM. Int. J. Hum. Resour. Manag. 2004, 15, 959–977. [Google Scholar] [CrossRef]
  57. Krosgaard, M.A.; Brodt, S.E.; Whitener, E.M. Trust in the face of conflict: The role of managerial trustworthy behavior and organizational context. J. Appl. Psychol. 2002, 87, 312–319. [Google Scholar] [CrossRef]
  58. Ferreira-Oliveira, A.T.; Silva, I.; Keating, J. Desenvolvimento organizacional: O uso de confiança como ferramenta. Conferência Investig. e Interv. Recur. Hum. 2014. [Google Scholar] [CrossRef]
  59. Mayer, R.C.; Gavin, M.B. Trust in management and performance: Who minds the shop while the employees watch the boss? Acad. Manag. J. 2005, 48, 874–888. [Google Scholar] [CrossRef] [Green Version]
  60. Carochinho, J.A.; Neves, J.G.; Jesuino, J.C. “Organizational comitment”—O conceito e sua medida: Adaptação e validação do “ Organizational commitment questionannaire(OCQ)” para a cultura organizacional portuguesa. Psicol. Teor. Investig. Prática 1998, 3, 269–284. [Google Scholar]
  61. Cohen, J. Quantitative methods in psychology. Psychol. Bull. 1992, 112, 155–159. [Google Scholar] [CrossRef] [PubMed]
  62. Pedhazur, E.J.; Schmelkin, P.L. Measurement, Design, and Analysis: An Integrated Approach; Psychology Press: London, UK, 2013. [Google Scholar]
  63. Aiken, L.S.; West, S.G.; Luhmann, M.; Baraldi, A. Estimating and graphing interactions. In Handbook of Research Methods in Psychology: Data analysis and Research Publication; Cooper, H., Ed.; American Psychological Association: Worcester, MA, USA, 2012; pp. 101–129. [Google Scholar] [CrossRef]
  64. Cohen, J.; Cohen, P.; West, S.G.; Aiken, L.S. Applied Multiple Regression/Correlation Analysis for the Behavioral Sciences; Routledge: London, UK, 2003. [Google Scholar]
  65. Tabachnicnk, B.G.; Fidell, L.S. Multivariate Statistics; Springer: Boston, MA, USA, 2019. [Google Scholar] [CrossRef]
  66. Stevens, J. Applied Multivariate Statistics for the Social Sciences; Routledge: Abingdon, UK, 2002. [Google Scholar] [CrossRef]
  67. Hair, J.F.; Black, W.C.; Babin, B.J.; Anderson, R.E. Multivariate Data Analysis; Prentice Hall: Upper Saddle River, NJ, USA, 1998. [Google Scholar] [CrossRef]
  68. Field, A. Discovering Statistics Using SPSS; Sage Publications: London, UK, 2009. [Google Scholar]
  69. Byrne, B.M. Structural Equation Modeling With AMOS, EQS, and LISREL: Comparative Approaches to Testing for the Factorial Validity of a Measuring Instrument. Int. J. Test. 2001, 1, 55–86. [Google Scholar] [CrossRef]
  70. Warner, R. Applied Statistics: From Bivariate Through Multivariate Techniques; Sage Publications: Thousand Oaks, CA, USA, 2013. [Google Scholar]
  71. Byrne, B.M. Measurement and instrumentation in psychology. In Measuring Self-Concept Across the Life Span: Issues and Instrumentations; Amercian Psychological Association: Worcester, MA, USA, 1996. [Google Scholar] [CrossRef] [Green Version]
  72. Levin, D.Z.; Whitener, E.M.; Cross, R. Perceived trustworthiness of knowledge sources: The moderating impact of relationship length. J. Appl. Psychol. 2006, 91, 1163–1171. [Google Scholar] [CrossRef] [PubMed] [Green Version]
  73. Ehrnrooth, M.; Björkman, I. An Integrative HRM Process Theorization: Beyond Signalling Effects and Mutual Gains. J. Manag. Stud. 2012, 49, 1109–1135. [Google Scholar] [CrossRef]
  74. Elorza, U.; Aritzeta, A.; Ayestaran, S. Exploring the black box in spanish firms: The effect of the actual and perceived system on employees’ commitment and organizational performance. Int. J. Hum. Resour. Manag. 2011, 22, 1401–1422. [Google Scholar] [CrossRef]
  75. Ogbonnaya, C.; Daniels, K.; Connolly, S.; van Veldhoven, M. Integrated and isolated impact of high-performance work practices on employee health and well-being: A comparative study. J. Occup. Health Psychol. 2017, 22, 98–114. [Google Scholar] [CrossRef] [Green Version]
  76. Vermeeren, B. Variability in HRM implementation among line managers and its effect on performance: A 2-1-2 mediational multilevel approach. Int. J. Hum. Resour. Manag. 2014, 25, 3039–3059. [Google Scholar] [CrossRef]
  77. Klaas, B.S.; Mcclendon, J.A.; Gainey, T.W. Trust and the role of professional employer organizations: Managing HR in small and medium enterprises. J. Manag. Issues 2002, 14, 31–48. [Google Scholar]
  78. Dirks, K.T.; Ferrin, D.L. The Role of Trust in Organizational Settings. Organ. Sci. 2001, 12, 450–467. [Google Scholar] [CrossRef]
  79. Ladeira, W.J.; Santini, F.; Araujo, C.; Sampaio, C. A Meta-Analysis of the Antecedents and Consequences of Satisfaction in Tourism and Hospitality. J. Hosp. Mark. Manag. 2016, 25, 975–1009. [Google Scholar] [CrossRef]
  80. Jepsen, D.M.; Rodwell, J. Female Perceptions of Organizational Justice. Gender Work Organ. 2012, 19, 723–740. [Google Scholar] [CrossRef]
Figure 1. Model 1 Moderation model.
Sustainability 12 09443 g001
Figure 2. Model 2—Mediation model.
Sustainability 12 09443 g002
Figure 3. Note: X = distributive justice. Y represents the DV (affective commitment).
Sustainability 12 09443 g003
Figure 4. Final moderation model with the significant associations.
Sustainability 12 09443 g004
Figure 5. Final Mediation model with the significant associations.
Sustainability 12 09443 g005
Table 1. Sample Characterization based on quantitative variables.
MeanStandard Deviation
Age40.159.99
Seniority 12.8011.08
Number of subordinates (a)24.3216.42
Seniority in management (a) 2.901.78
a Only managers answered this question. N = 209.
Table 2. Sample characterization based on qualitative variables.
FrequenciesPercentage
SexMale58242.7
Female78157.3
Educational 4th grade916.7
Qualifications6th grade715.2
9th grade17713.0
12th grade41030.0
Bachelor1057.7
Graduation48535.5
Masters261.9
PhD10.1
Contract typePermanent86275.9
Fixed-term20418.0
Temporary686.0
Other20.2
ManagerYes20918.4
No92681.6
Yes 133
No8137.9
Public vs. private sectorPublic
Private
457
872
34.4
65.6
Industry vs. Services SectorIndustry
Services
602
727
45.3
54.7
Table 3. Factor loadings for Exploratory Factor Analysis with Varimax rotation.
Factors
12345
Socialization’s Utility00.0710.1850.7070.1890.113
Recruitment & Selection Utility00.1120.1970.6870.1250.133
Performance evaluation Utility0.1950.1220.6520.1300.260
Training Utility0.0850.0350.7600.0870.046
Administrative procedures Utility0.2060.1920.6620.130−0.009
Communication (sharing information) Utility0.1970.1450.7750.180−0.027
Team work Utility0.1320.0950.7670.1980.000
Socialization’s Visibility0.2010.2150.1970.6970.210
Recruitment & Selection’s Visibility0.1950.2600.1690.6810.187
Performance evaluation Visibility0.2640.2730.2230.5860.253
Training Visibility0.2200.2860.2100.5890.175
Administrative procedures Visibility0.3260.2970.2310.5770.003
Communication (sharing information) Visibility0.3800.2800.2120.6580.057
Team work Visibility0.2700.2160.3380.6070.082
Socialization’s Comprehensibility0.1950.6920.1690.2950.186
Recruitment & Selection’s Comprehensibility0.2160.7510.1510.2270.197
Performance evaluation Comprehensibility0.2800.6770.1340.2470.237
Training Comprehensibility0.1960.7360.1360.2040.164
Administrative procedures Comprehensibility0.2760.7460.1870.1700.032
Communication (sharing information) Comprehensibility0.3580.7070.2160.2550.054
Team work Comprehensibility0.2800.6040.3320.2790.043
Salary increases depend on the performance appraisal results 0.2500.0830.1020.1540.656
Employees who are rewarded are those who deserve.0.4230.2150.1150.1350.657
The existing reward system helps each employee to achieve greater success0.4250.1440.1020.1850.672
All employees know exactly when and what to do in order to receive a prize.0.3430.2180.0240.1610.656
The HRM practices are applied similarly in various departments0.5760.2650.1340.1200.295
The Human Resource Management practices are consistent over time0.6280.2330.1420.1690.290
The guidance provided by the HR Department is credible0.7140.2700.1420.1310.184
The HRM practices contribute to a high level of employees performance 0.7050.2170.1600.1380.351
The HRM practices contribute to a good performance appraisal0.6960.2160.1490.1530.393
There is a consistency between what the HR Department diffuses and states and then what it does and apply.0.6410.2220.1150.1630.276
All activities of HRM system complement themselves in order to reach the objectives of my employer.0.6110.1760.1690.0380.142
The HR department appears to be informed about the best practices that are used in other organizations.0.7370.1380.1870.1510.157
Our HR system is effective as to attract and retain competent employees.0.7270.1330.1530.1900.240
Our HR system is effective in developing skills among our employees.0.7190.1260.1520.1750.224
The HR Department was consistent with my expectations regarding the role and responsibilities of HR function0.7640.1710.1810.2210.207
The HR Department is available to listen to me whenever I need.0.7840.1610.0870.204−0.015
I feel that my opinions and suggestions are heard by the HR Department.0.7730.1880.0980.2180.073
The HR Department helps me solve problems.0.8190.1470.0950.2240.022
Normally the Human Resources Department tries to understand my opinion on the definition of new procedures.0.7630.1570.0930.2430.126
Eigenvalues23.084.854.633.963.02
% of variance0.57611.8411.299.657.37
Note (N = 1369); The items are presented in the order they were administrated to participants. 1 = HR Relationship with employees; 2 = Comprehensibility; 3 = Utility; 4 = Visibility; 5 = Distributive Justice.
Table 4. Cronbach’s Alpha.
Cronbach’s AlphaN of ParticipantsN° of Items
HR relationship with employees0.959124615
Comprehensibility0.92611127
Utility0.88310897
Visibility0.90310957
Distributive justice0.84113354
Table 5. Means, minimum, maximum values and standard deviations.
MeanMinMaxStandard Deviation
MMinMaxSD
HR relationship with employees60.3115.0090.0014.57
Comprehensibility27.467.0042.006.48
Utility26.897.0035.004.52
Visibility27.657.0042.005.80
Distributive justice12.824.0024.0012.82
Table 6. Matrix of Pearson’s correlation coefficient between dimensions.
Dimension(1)(2)(3)(4)
(1) HR relationship with employees-
(2) Comprehensibility0.612 **-
(3) Utility0.482 **0.525 **-
(4) Visibility0.656 **0.717 **0.604 **-
(5) Distributive justice0.686 **0.532 **0.36 8 **0.544 **
Note: ** Values represent significant correlations at a p < 0.001 level.
Table 7. Descriptive Statistics and Pearson’s Correlations.
MeanStandard DeviationN(1)(2)(3)(4)(5)(6)
(1) Afective commitment36.86.331053-
(2) Trust in manager34.778.1510460.73 **-
(3) HR relationship with employees60.7714.3212110.66 **0.60 **
(4) Comprehensibility27.666.3610720.48 **0.50 **0.60 **
(5) Utility27.004.4110520.41 **0.40 **0.46 **0.52 **
(6) Visibility27.835.6710590.55 **0.51 **0.67 **0.72 **0.59 **
(7) Distributive justice12.954.8512950.49 **0.50 **0.68 **0.53**0.37 **0.55 **
Note: ** Values on the diagonal (in bold) represent significant correlations at a p < 0.001 level.
Table 8. Cluster analysis and multivariate tests.
Cluster 1 (n = 585)Cluster 2 (n = 364)F (1947)
MeanStandard DeviationMeanStandard Deviation
HR relationship with employees69.478.9247.3913.88889.56
Comprehensibility31.354.9721.895.56741.86
Utility29.003.40323.425.33388.12
Visibility31.154.5322.655.03726.07
Distributive Justice15.693.768.693.36843.96
Table 9. Hierarchical Multiple Regression Analyses.
Model 1—ControlsModel 2—Main EffectsModel 3—Interactions
Independent variablesββB
(a) Control Variables
Sex−0.13 ***−0.07 ***−0.07 ***
Age−0.020.010.01
Dummy for Public vs. Private Sector0.16 ***0.07 **0.06 **
Dummy for Industry vs. Service Sector0.21 ***0.07 **0.06 **
Seniority−0.030.030.02
Dummy contract type0.11 ***0.07 ***0.06 ***
Management function−0.12 ***−0.02−0.02
Seniority in management−0.01−0.01−0.01
Number of subordinates0.020.03 0.03
Seniority in management in other organizations0.040.010.01
Training in HR−0.020.020.02
(b) Main effects
OT in management 0.53 ***0.51 ***
HR relationship with employees 0.20 ***0.21 ***
Comprehensibility −0.02−0.02
Utility 0.020.02
Visibility 0.14 ***0.13 ***
Distributive Justice −0.01
(c) Interactions
HR relationship with employees X OT in manager −0.01
Comprehensibility X OT in manager −0.01
Utility X OT in manager 0.05
Visibility X OT in manager −0.03
Distributive Justice X OT in manager 0.09 ***
Note: Sex: 1 female, 2 male; Manager function: 1 yes, 2 no; Dummy for Public Vs Private Sector: 0 Public, 1 Private; Dummy for Industry vs. Service Sector: 0 Industry, 1 Services; Dummy for contract type: 0 No term contract, 1 Fixed Term contract. p < 0.10, * p < 0.05, ** p < 0.01, *** p < 0.001.
Table 10. Statistics for the improvement of the model on hierarchical multiple regression analysis.
InterceptR2 (R2 Aj) Sustainability 12 09443 i001R2F Statistics
(a) Step 1: Control variables40.210.07 (0.07)0.073 ***F(11,1317) = 9.38 ***
(b) Step 2: Main effects11.380.59 (0.59)0.517 ***F(17,1311) = 110.91 ***
(c) Step 3: Interactions11.940.60 (0.60)0.005 ***F(22,1306) = 87.09 ***
*** p < 0.001.
Table 11. Hierarchical Multiple Regression Analyses Predicting organizational affective commitment (OAC) from human resource management (HRM) dimensions with organizational trust (OT) moderation tests.
Regression 1
VD (OAC)
Regression 2
VD (OT)
Regression 3
VD (OAC)
Regression 4
VD (OAC)
Independent variables
and mediator
ββββ
HR relationship 0.34 ***0.25 *** 0.20 ***
Comprehensibility0.06 0.15 *** −0.02
Utility0.07 **0.10 *** 0.02
Visibility0.21 ***0.13 *** 0.14 ***
Distributive Justice0.07 **0.12 *** −0.01
OT in management (mediator)- 0.66 ***0.53 ***
Note: These regressions were performed independently and not sequentially. The control variables were not described here, however they entered in all the regression analysis. p < 0.10,* p < 0.05, ** p < 0.01, *** p < 0.001.
Table 12. Statistics for multiple regressions in the test of mediation.
InterceptR2 (R2 Aj) Sustainability 12 09443 i001R2F Change
(a) Regression 1 (HRMS on OAC)15.280.41 (0.41)0.34 ***F(5.1312) = 151.29 ***
(b) Regression 2 (HRMS on OT)9.430.37 (0.37)0.32 ***F(5.1312) = 134.99 ***
(c) Regression 3 (OT on OAC)17.630.53 (0.53)0.46 ***F(1.1316) = 1294.07 ***
(d) Regression 4 (HRMS and OT on OAC)11.380.59 (0.59)0.52 ***F(6.1311) = 275.53
Note: When interpreting Sustainability 12 09443 i001 R2 note that these regressions were performed independently and not sequentially. The control variables were not described here, however they entered in all the regression analysis. p < 0.10, * p < 0.05, ** p < 0.01, *** p < 0.001.
Publisher’s Note: MDPI stays neutral with regard to jurisdictional claims in published maps and institutional affiliations.

