Article

Evaluation of Green Transformation Efficiency in Chinese Mineral Resource-Based Cities Based on a Three-Stage DEA Method

1
School of Economics and Management, China University of Mining and Technology, Xuzhou 221116, China
2
School of Economics and Management, Huaiyin Normal University, Huai’an 223001, China
3
School of Economics and Management, Beihang University, Beijing 100083, China
*
Author to whom correspondence should be addressed.
Sustainability 2020, 12(22), 9455; https://0-doi-org.brum.beds.ac.uk/10.3390/su12229455
Submission received: 15 October 2020 / Revised: 5 November 2020 / Accepted: 9 November 2020 / Published: 13 November 2020

Abstract

:
With sustained and rapid economic growth, environmental degradation and resource depletion are becoming increasingly prominent in Chinese mineral resource-based cities (MRBC). An in-depth study regarding the efficiency and characteristics of urban green transformation in recent years will help to promote the healthy development of MRBC in China. In this study, we use a three-stage data envelopment analysis model to evaluate the green transformation efficiency and potential of 110 MRBC in China from 2008 to 2017. The results show that, first, the comprehensive green transformation efficiency in the vast majority of MRBC is relatively low. After excluding external factors, the efficiency of most MRBC is considerably improved. Second, regardless of whether the external factors are excluded, the green transformation efficiency in the western and northeast regions of China is relatively higher than that in the central and eastern regions, whereas the coal cities and ferrous cities have higher efficiencies compared with non-ferrous cities and oil cities. Third, compared with pure technology efficiency, scale efficiency plays a leading role in overall green transformation efficiency. Based on the empirical analysis results, this study indicates that China’s MRBC should pay special attention to the influence of external environmental factors when formulating green transformation policies.

1. Introduction

China’s economy entered an era of rapid development since its reform and opening in 1978. Consequently, most mineral resource-based cities (MRBC) have constructed an urban development model dependent upon the large-scale consumption of mineral resources. While efficiently promoting economic growth, this backward developmental model has caused significant damage to the environmental ecology of MRBC [1,2]. According to the “China City Statistical Yearbook” [3] statistics, in Chinese MRBC, sulfur dioxide emissions in 2018 reached a total of 2.65 million tons, and the total amount of industrial wastewater discharge was as high as 3.1 billion tons. Moreover, differing interests and continuous disputes concerning environmental ecology between the residents of resource exploitation areas and the mineral enterprises may create socio-ecological problems. These conflicts of interest will eventually affect the healthy development of the entire national economy [4]. To cope with this severe situation and smoothly promote the green transformation of MRBC, the central government issued a strategic policy document “National Resource-based City Sustainable Development Plan (2013–2020)” in 2013. The document clarifies the transformation goals of resource-based cities by 2020, that is, the historical legacy of resource depletion would have been basically solved, the capacity for sustainable development would have been significantly enhanced, and the transformation tasks would have been completed; the pattern of coordination between resource development, economic and social development and eco-environmental protection would have been formed; substantial progress would have been made in the transformation of economic development mode, and a long-term mechanism to promote the sustainable development of resource-based cities would have been established and improved [5]. Subsequently, the National Development and Reform Commission successively promulgated the “guidelines on strengthening classification and guiding the cultivation of new drivers for the transformation and development of resource-based cities” [6] and “notice on supporting the construction of the first batch of industrial transformation and upgrading demonstration zones in old industrial cities and resource-based cities” [7] and other implementation opinions, and identified Anshan, Fushun, and Songyuan as pilot cities for transformation. Furthermore, many MRBC have combined the characteristics and advantages of regional development, through the creation of local regulations, e.g., opinions of Benxi City on promoting ecological development of ecological cities, 2019 and opinions on the implementation of green transformation development of industries in Taian City, 2017, to gradually explore and clarify the real path of green transformation. Consequently, the green transformation, as a new form of environmental protection, economic growth model, and the urban development model, has become an inevitable trend in the MRBC to achieve sustainable development.
As the MRBC green transformation strategy continues to advance, the academic research on MRBC green transformation evaluation also further develops. The content of this research primarily consists of the evaluation purpose, the sample characteristics, and the index selection. For example, Yuying et al. [8] used panel data from 2006 to 2016 to construct an evaluation system of MRBC green transformation level by utilizing the Analytic Hierarchy Process and entropy weight method. In that study, the green transformation levels of 109 different MRBC in China were evaluated and analyzed. Although these studies provide valuable references for the sustainable development of MRBC, there are shortcomings in the research content, methods, and perspective. For example, the research on the evaluation of MRBC green transformation efficiency has not been included and valued, interference factors, such as the external environment of the research object, have not been eliminated, and a comprehensive evaluation index system has not been established and perfected. As different MRBC are in different stages of resource, social, and economic development, the contradictions and problems they face are varied and affected by different environmental factors. Thus, there is a significant variation in the green transformation efficiencies of each MRBC. Green transformation efficiency assessments can reflect the real effect of green transformation over time and help explore efficiency differences, influencing factors, existing problems, and their causes [9,10]. Therefore, it is necessary to improve the research on evaluations of MRBC green transformation and to specifically evaluate and analyze the efficiency of green transformation. These factors are particularly important for MRBC to improve green transformation methods promptly.
The empirical evaluation conducted in this study mainly involves the following three aspects of contributions. First, the evaluation system of MRBC green transformation efficiency was constructed based on six dimensions of economic growth, environmental protection, industrial transformation, energy conservation, mineral protection, and livelihood improvement. These dimensions improve the comprehensiveness and dynamics of the existing evaluation system. Second, the external environmental factors and statistical noise were eliminated by using the three-stage data envelopment analysis (DEA) method, and the comprehensive and real efficiencies of MRBC green transformation were evaluated and compared. Additionally, the influence of external environmental factors, including economic structure, energy consumption structure, and technological innovation level, was discussed to effectively improve the accuracy of efficiency evaluation results. Third, based on the decomposition of efficiency, we discuss the efficiency differences and the causes of the green transformation of Chinese MRBC in different regions and types. Additionally, we proposed different strategies for improving the efficiency of different groups, to benefit the formulation of targeted efficiency improvement measures. Overall, in this study, we explored methods to improve the efficiency of MRBC green transformation in China and suggested improvements for the efficiency of green transformation MRBC for other developing countries.

2. Literature Review

With the rise of urban green transformation research, the driving mechanisms of green transformation, influencing factors, and evaluations of the transformation have been receiving increasing attention.
Regarding the driving mechanisms of urban green transformation, Ji et al. [11] believe that the environmental deterioration caused by bad behavior, such as excessive carbon emissions, restricts the sustainable development and utilization of urban natural resources. This breaks the balance between rapid economic development and environmental protection, and the urgent demand to solve this contradiction promotes the green transformation of cities. Qian et al. [1] analyzed the existence of the resource curse effect by using a system generalized method of moments based on the panel data from 30 coal mine cities in China from 2005 to 2015. The results showed that the resource curse effect is the main driving force for cities to implement green transformation. Jian et al. [12] analyzed the endowment of climate resources, urban transformation and development, and restructuring of the culture-economy-ecological geography chain in China’s Panzhihua City. The authors believed that the backward economy, significant pressure on the ecological environment, and depletion of natural resources are the key reasons for the green transformation of cities. Lin et al. [13] found that extreme environmental pollution, particularly air pollution (considered a national emergency), has a significant negative impact on human health, industrial production, and social well-being. These impacts have prompted decision-makers to begin to advance the green transformation of cities, such as the implementation and expansion of The Clean Air Action measures. Additionally, Sun et al. [14] indicate that China has proposed an inclusive green transformation strategy based on social, economic, and environmental coordination in response to global resource management, environmental demand, and economic growth slowdown. The consistency of developmental goals is the fundamental driving force for cities to achieve inclusive green transformation. In summary, the unsustainability of urban development is generally considered to be the key to driving cities to implement green transformation, primarily manifested in the contradiction between economic growth expectations and environmental pollution status. Important contributions have been made to the research on the driving mechanisms of urban green transformation; however, further research is required. For example, existing literature offers limited discussion regarding the protection of depleted minerals, improvement of people’s livelihood, and solving social and ecological problems caused by environmental pollution. There is still room for expansion.
Researchers have explored urban green transformation influence factors from a different perspective. Jin et al. [15] found that the influence of macroeconomic uncertainty on green transformation in different cities varies, and its negative impact on developed and coastal cities is not evident; however, the inhibitory effect on underdeveloped cities is significant. Yuan et al. [16] analyzed the spatial threshold effect of 272 prefecture-level cities in China from 2003 to 2014 using a spatial panel Durbin model and panel threshold regression model. They found that financial agglomerations have a considerable impact on promoting urban green transformation. Based on the logistic regression model, Zhao et al. [10] estimated the determinants of green transformation efficiency in 286 cities of different sizes and different regions of China in 2013. They found that the regional effect and the population size effect are the most significant factors for transformation efficiency. Cheng et al. [17] used the panel data of 194 prefecture-level cities in China from 2007 to 2016 and difference-in-differences models to discuss the impact of low-carbon city construction on urban green transformation. Their study showed that the construction of low-carbon cities has economies of scale and regional differences. Cities with larger scales, better infrastructure, and better technological foundations have a more pronounced positive impact on green transformation efficiency. Ma et al. [9] constructed a green growth efficiency analysis database based on the remote sensing data and socio-economic data of 285 prefecture-level cities in China from 2005 to 2016. They found that the spatial difference had a significant impact on the efficiency of urban green transformation in China. Based on the panel data of 278 cities in China from 2011 to 2016, Lin et al. [13] empirically analyzed the policy effect of clean air actions on urban green transformation by constructing a green transition indicator system. The results showed that clean air actions have a significant positive impact on the cities’ green transformation and show an increasing trend in efficiency over time, particularly for cities with high emission reduction targets and rich resource endowments. Sun et al. [14] adopted a comprehensive directional distance function and slacks-based measure (DDF-SBM) model to make an inclusive green transformation of 285 cities in China from 2003 to 2015. The efficiency level was evaluated, and the authors found that technology and region are two important factors that affect the level of transformation. Among the two factors, the scope of technological change is the main obstacle in improving the level of transformation. In summary, researchers have analyzed the impact of different factors on green transformation based on the aspects of urban economy, finance, policy, technology, region, and scale, and have laid a good foundation for further research in this field. However, there are still some deficiencies. For example, there is no in-depth study regarding the influencing factors and their effects in the fields of industry and energy, culture and tradition, system and innovation, or other areas. Additionally, there is no cross over, mixing, or synthesis of factors in different fields and of different levels of research to obtain factors that jointly affect the performance, efficiency, and effectiveness of urban green transformation.
Given the urban green transformation evaluation, researchers have analyzed different transformation levels according to the evaluation purpose, sample characteristics, and index selection. Zhao et al. [10] used a met frontier-DEA to analyze the green transformation capabilities of 286 sample cities in China in 2013 and evaluated their efficiency gaps. The authors found that cities of different sizes and in different regions have different green transformation efficiency statuses. Wang et al. [18] adopted a multi-level evaluation method and entropy method to improve the human settlement environment and pollutant treatment and utilization, increase ecological benefits, and improve the ecological environment. A green transformation evaluation index system was constructed, and the green transformation level of nine cities in the Pearl River Delta in China was evaluated in 2015. The levels of green transformation in Shenzhen, Zhuhai, and Guangzhou were relatively high, whereas other cities lagged. Ma et al. [9] used a technique for order of preference by similarity to ideal solution (TOPSIS) model and the super-efficient slack based measure (SBM) model to explore the efficiency of green transformation in 285 sample cities in China from 2005 to 2016. The results showed that the center of gravity of urban green transformation efficiency is shifting to the southwest; the comprehensive evaluation index of green transformation rises first and then falls, and that the regional difference is small, but gradually expanding. Simultaneously, the efficiency of green transformation decreases first and then rises, and the spatial difference is significant. Using the super-efficiency DEA epsilon-based measure model, Jin et al. [15] incorporated macroeconomic uncertainty and high-level innovation into the urban green transformation performance analysis framework. They evaluated the green transformation efficiency and heterogeneity of 282 sample cities in China from 2005 to 2016. Sun et al. [14] combined a DDF-SBM model and utilized a Luenberger indicator on panel data from 285 cities in China from 2003 to 2015. They analyzed the transformation efficiency and differences, and proposed countermeasures from both technical and regional aspects. In summary, we found that the existing research on the evaluation of urban green transformation has some shortcomings in terms of research objects, research methods, and research perspectives. In terms of sample selection for research objects in previous studies, main cities in the entire country or a certain region were focused upon, and there are few specialized studies on the green transformation evaluation of MRBC in a targeted manner. In terms of research methods, some of the more common ones are stochastic frontier analysis (SFA), TOPSIS model, met frontier-DEA, super-efficient SBM model, super-efficiency DEA epsilon-based measure model, and DDF-SBM model. However, none of these methods can remove disrupting factors such as the external environment of urban green transformation and statistical noise; therefore, the reliability and authenticity of the evaluation results are debatable. From a research perspective, the indicators selected in previous studies mainly focused on economic growth and environmental protection and lacked a comprehensive consideration of industrial transformation, energy conservation, mineral protection, and livelihood improvement. Most of these indicators are static indicators, showing that the evaluation index system is not yet perfect.
Based on the number and content of existing documents on urban green transformation, the evaluation of urban green transformation in recent years has received increasing attention from academic circles. Although most cities have made remarkable progress in implementing green transformation, there are significant differences and imbalances in the effectiveness of green transformation in different cities. According to the data of “TOP 50 report of Chinese Green Cities Index in 2019” [19], only Zhangjiakou and Chengde are among the top 50 in China for 2019, and the remainder of the MRBC has not performed well. The evaluation of green transformation will help discover efficiency differences, influencing factors, existing problems, and their causes among different cities. This information will then provide advice, guidance, and decision-making references for cities to improve green transformation [14,18]. Given the shortcomings in the existing literature regarding the evaluation of urban green transformation, we provide exploratory amendments and attempt to make useful contributions to the research in this field. First of all, the sample selection of the research object has been specially set. This study is conducted with a focus on the research of green transformation efficiency evaluation for MRBC in China, and comparative evaluations are performed based on two features: area and city type. Furthermore, we strive to comprehensively analyze the efficiency, gaps, existing problems, and their causes in MRBC green transformation. Second, we use correct and suitable evaluation methods by utilizing the three-stage DEA method to measure and evaluate the efficiency of MRBC green transformation. Compared with other methods, the three-stage DEA method can eliminate interference factors such as the external environment and statistical noise and accurately calculate the relative efficiency value of each decision unit. Thus, the results are closer to the real values. Additionally, an expanded application field of the three-stage DEA method is introduced. Third, we optimize the evaluation index system. The evaluation index system not only includes economic growth and environmental protection, but also adds the relevant indexes, such as industrial transformation, mineral protection, and energy conservation, highlighting the characteristics of MRBC. Some indicators are set as dynamic indexes to comprehensively, accurately, and effectively present the efficiency of and differences between MRBC green transformations.

3. Methods

At present, the efficiency evaluation methods commonly used in the field of urban green transformation include: the SFA [20], the global Malmquist-Luenberger productivity index [21], the TOPSIS model [9], the analytic hierarchy process and entropy method [8], the multi-level evaluation method and entropy method [18], and the DEA method [15]. The DEA method, a non-parametric method, is more suitable to solve the “multi-input and multi-output” problem compared with other methods. Additionally, it can overcome defects such as function setting errors and limiting assumptions for overall distribution. Thus, the DEA method has received increasing attention and is widely used for efficiency evaluations in various fields. Since Charnes et al. proposed the Charnes, Cooper and Rhodes (CCR) model in 1978, a series of amendments and improvements have been made to the DEA method. Currently, the most widely used models are met frontier-DEA [10], the super-efficient SBM [9], super-efficiency DEA epsilon-based measure model [15], DDF-SBM model [14], and the three-stage DEA method [
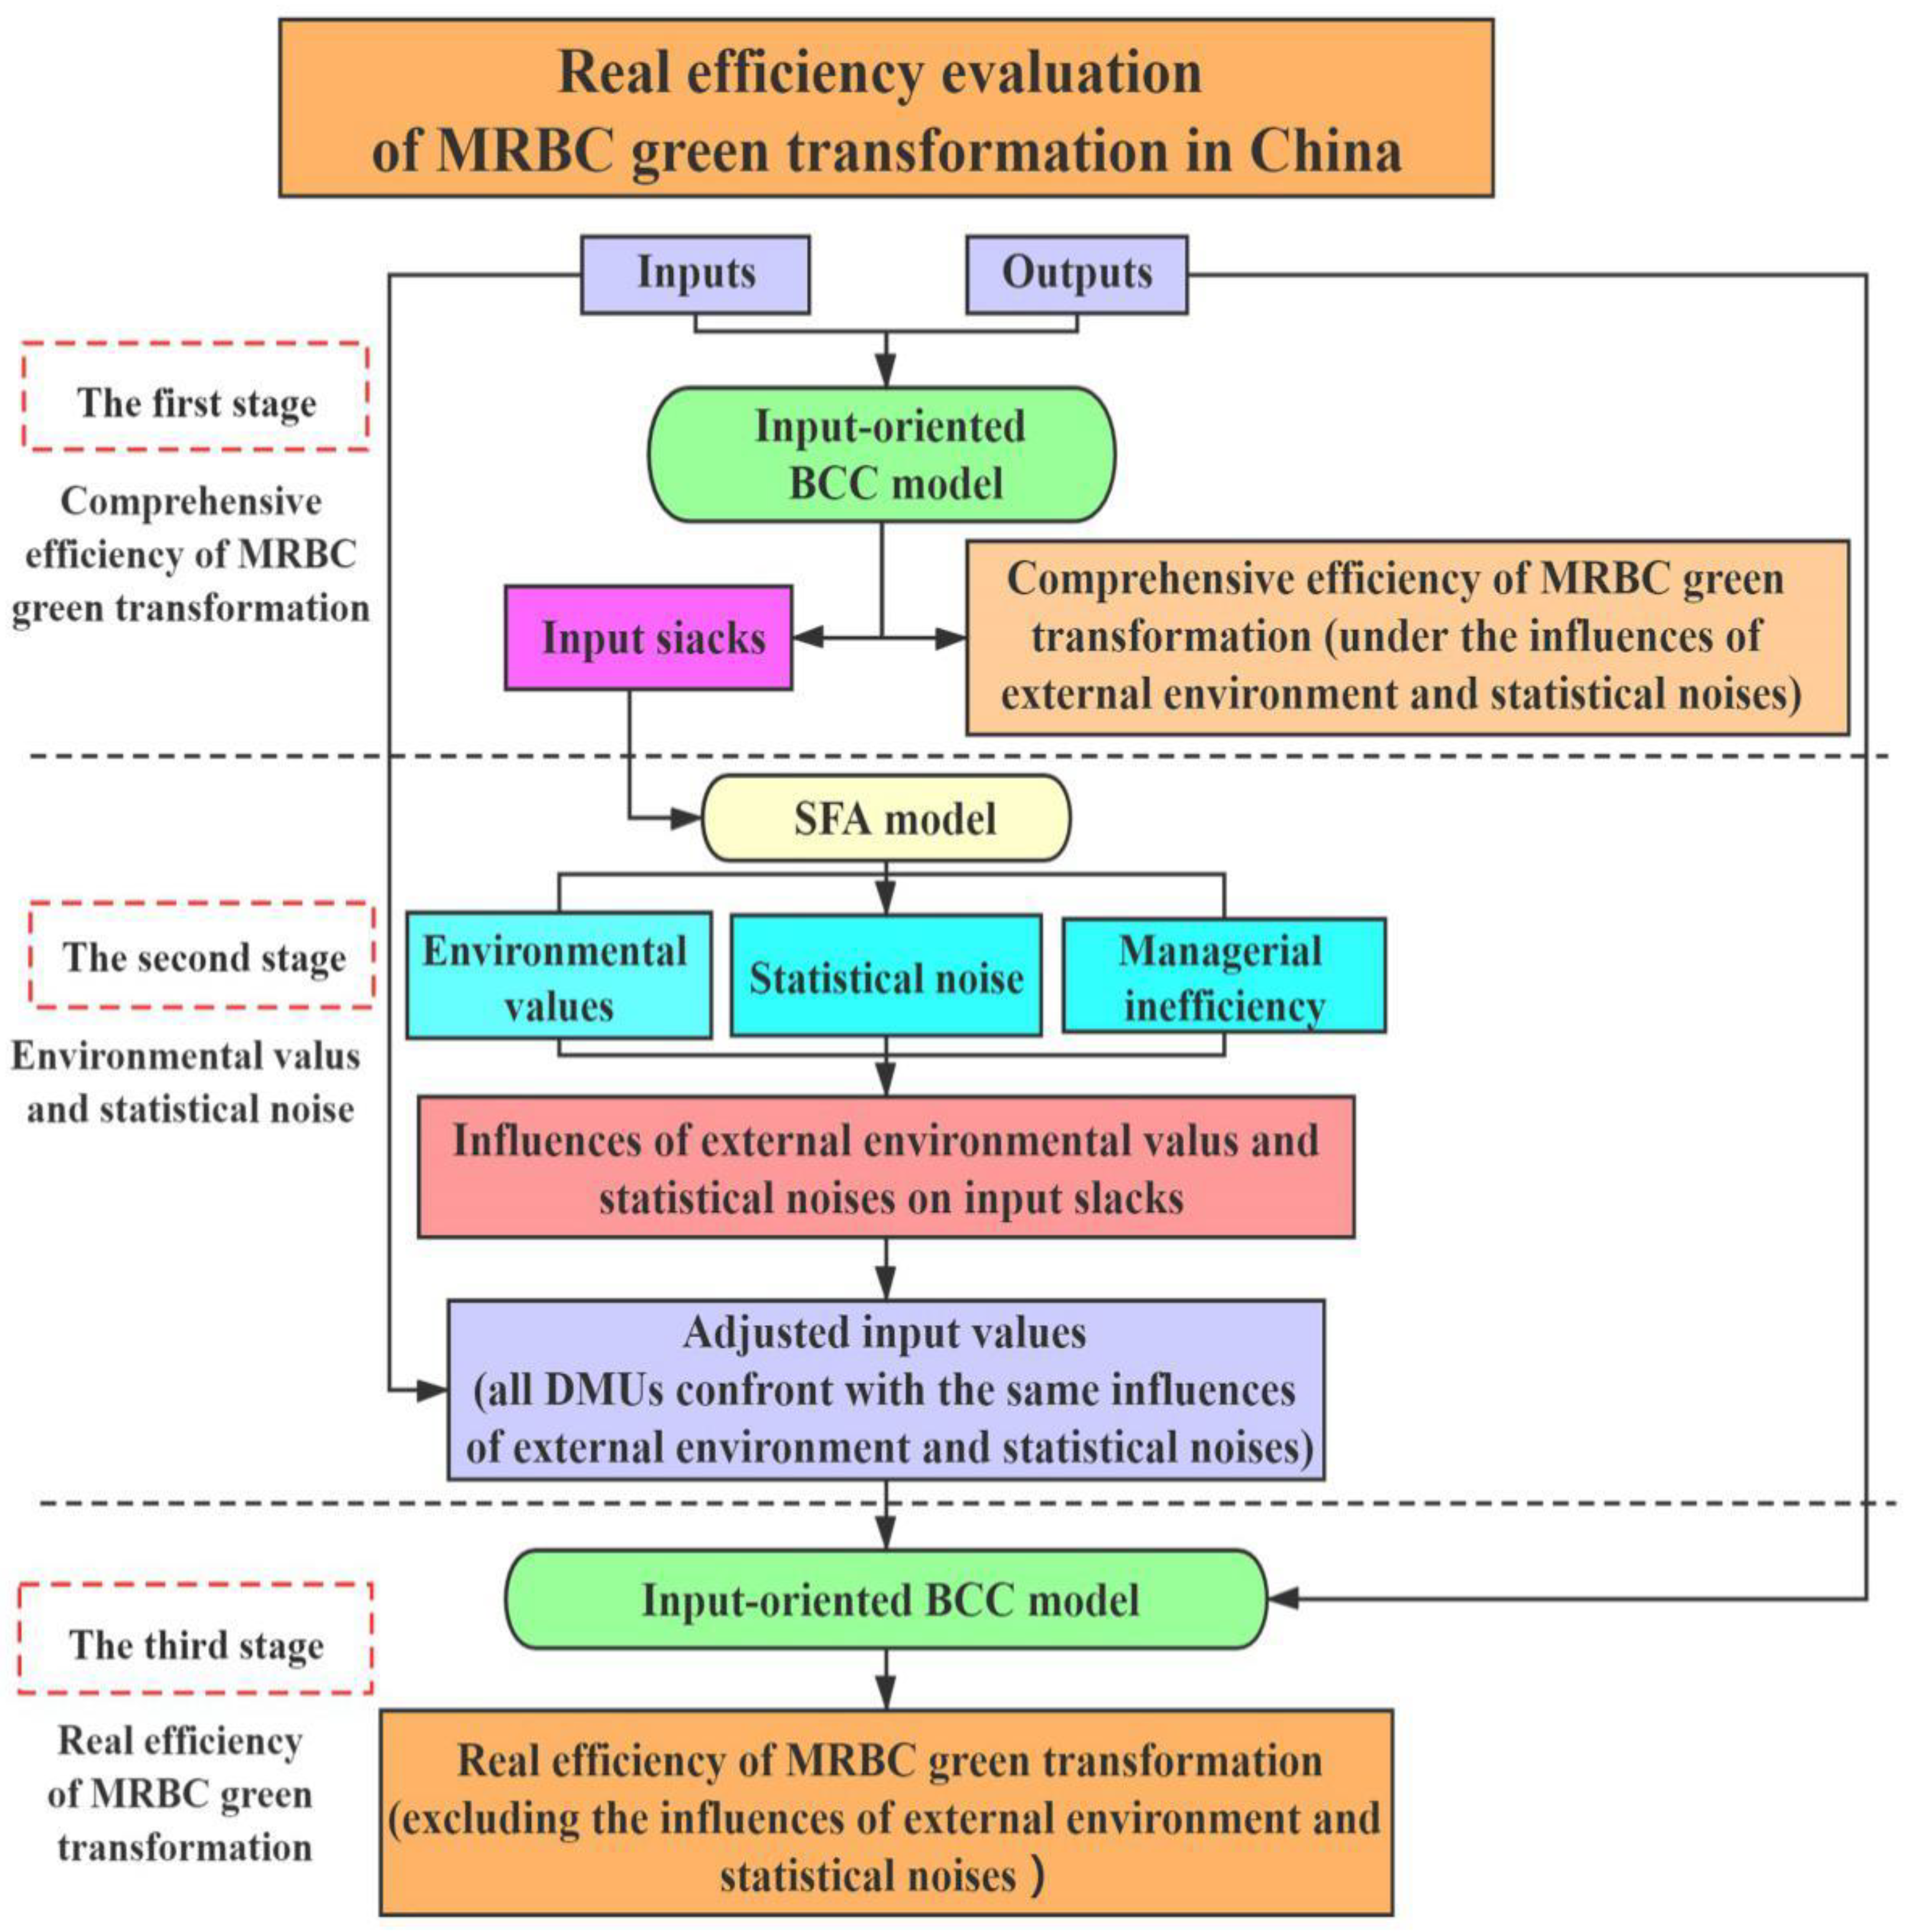
22]. Compared with other improved DEA methods, the core purpose of the three-stage DEA method is to eliminate the external environment, statistical noise, and other interference factors, and to evaluate the relative efficiency of decision-making units more accurately. Therefore, in this study, we use the three-stage DEA method to evaluate the green transformation efficiency of MRBC in China (Figure 1). In the first stage, the input-oriented Banker, Charnes and Cooper (BCC) model is used to calculate the comprehensive efficiency of green transformation of the MRBC under the influence of an external environment and statistical noise. In the second stage, based on the SFA, each input relaxation variable is divided into three different impact values: external environment, management inefficiency, and statistical noise. Concurrently, the external environmental impact value and statistical noise impact value are eliminated, that is, the second input variable value of each MRBC is adjusted. In the third stage, based on the adjusted input variables, the BCC model is used again to calculate the green transformation efficiency of MRBC to obtain the real efficiency evaluation value of each city.

3.1. First Stage: Comprehensive Efficiency Evaluation of MRBC Green Transformation

There are two types of DEA methods: input-oriented and output-oriented. Compared with output variables, input variables can better reflect the direction and controllability of the decision-making unit. Consequently, we use the DEA method based on input orientation to evaluate efficiency. Meanwhile, the BCC model can measure the scale efficiency (SE) and pure technical efficiency (PTE) of decision-making units (DMUs), whereas the CCR model cannot. Therefore, in this stage, the BCC model based on input orientation is used to calculate the green transformation efficiency of MRBC to obtain the comprehensive efficiency value of the MRBC green transformation. The equation is as follows:
min θ s . t . θ x i j 0 j = 1 n x i j λ j y r j 0 j = 1 n y r j λ j j = 1 n λ j = 1 λ j 0 , j = 1 , 2 , , n i = 1 , 2 , , m ; r = 1 , 2 , , s
where x i j and y r j represent the i -th input variable and the r -th output variable of the j -th DMU, respectively. n , m , and s represent the number of DMU, number of input, and number of output variables, respectively. λ j implies a j dimensional weight vector of the DMU. θ represents the comprehensive efficiency of the green transformation of each DMU.

3.2. Second Stage: Calculate the Adjusted Secondary Input Value

In the second stage, the external impact value and the statistical noise impact value were eliminated. Here, by calculating the difference between the real input and the target input, we can find the relaxation value s i j of the input variables of the DMU. The relaxation value s i j consists of three parts: management inefficiency impact value, external environmental impact value, and statistical noise impact value. When it comes to the decomposition calculation of relaxation variables s i j , the related formulas based on the SFA are established as follows:
s i j = f i ( Q j , β i ) + ε i j ε i j = μ i j + v i j
where Q j represents the environment variables, Q j = ( q 1 j , q 2 j , , q p j ) , and p represents the number of environment variables. β i is the coefficient of each environmental variable. f i ( Q j , β i ) represents the function to measure the impact value of the external environment. v i j and μ i j represent the statistical noise impact value and management inefficiency impact value of the j -th DMU, respectively. v i j obeys the distribution of ν i j N ( 0 , σ v i 2 ) , whereas μ i j obeys the distribution of μ i j N + ( μ , σ μ i 2 ) , and they are independent of each other.
The SFA is used because of the existence of the inefficiency-term, μ i and this assumption can be verified by using a unilateral generalized likelihood ratio test where H 0 :   σ μ 2 = 0 and H 1 :   σ μ 2 > 0 . If the test results reject the original hypothesis, showing that μ i exists, the SFA method can be used for estimation. If the test results accept the original assumption, that is, μ i does not exist, ordinary least squares should replace the SFA for estimation.
To obtain the adjusted secondary input variable value of each DMU, the inefficiency-term μ i j needs further decomposition calculation. The μ i j calculation formula of conditional expectation [23] is shown as follows:
E ( μ i j | μ i j + ν i j ) = λ i σ i 1 + λ i 2 ( ϕ ( ε i j λ i σ i ) φ ( ε i j λ i σ i ) + ε i j λ i σ i ) ,
where E ( μ i j | μ i j + ν i j ) , λ i , ε i j , and σ i represent the evaluation value of E ( μ i j | μ i j + ν i j ) , λ i , ε i j , and σ i , successively. λ i = σ μ i σ v i , σ i 2 = σ μ i 2 + σ ν i 2 , ϕ and φ represent the density function and cumulative density function obeying standard normal distribution, successively. Please refer to the attached documents for specific operation processes [24].
The conditional expectation of ν i j can be calculated using the following formula (in which, β i , which is the evaluation value of β i , and can be calculated using the SFA):
E ( ν i j | μ i j + ν i j ) = s i j Q j β i E ( μ i j | μ i j + ν i j )
Finally, we adjust the input variable x i j to the second input variable x i j A . The formula is as follows:
x i j A = x i j + [ max i ( Q j β i ) Q j β i ] + [ max i ( E ( ν i j | μ i j + ν i j ) ) E ( ν i j | μ i j + ν i j ) ]
where [ max i ( Q j β i ) Q j β i ] represents the adjusted estimated value of each DMU under the most unfavorable external environment. [ max i ( E ( ν i j | μ i j + ν i j ) ) E ( ν i j | μ i j + ν i j ) ] represents the adjusted estimated value of each DMU under the least favorable statistical noise condition. This calculation process can adjust all the DMUs to the same external conditions.

3.3. Third Stage: Real MRBC Green Transformation Efficiency Measurement

The adjusted secondary input variables and the original output variables are substituted into the BCC model based on input orientation. The real value of the green transformation efficiency of MRBC is calculated after excluding the impact of the external environment and statistical noise.

4. Variables and Data

4.1. Sample Selection

According to relevant data statistics from the “National Resource-based Urban Sustainable Development Plan (2013–2020)” [5], there are 119 mineral-resource-based prefecture-level cities in China. Given the lack of data in some cities (nine autonomous states), 110 cities were selected as the research objects in this study. There are 20 cities in the eastern region, 37 in the central, 38 in the western, and 14 in the northeastern regions. Among the mineral resource types, there are 57 coal, 10 non-ferrous, 30 ferrous, and 13 oil cities. The MRBC geographical distribution is shown in Figure 2. Table 1 shows the MRBC region and distribution type.

4.2. Indicators and Data Sources

According to the specific requirements of the three-stage DEA method, the measurements of the model need to reasonably determine the input variables, output variables, and environmental variables. Based on existing research results and the dynamic behavior perspective of MRBC implementation of green transformation, we determine the input variables to evaluate the efficiency of green transformation based on three dimensions: capital investment, human investment, and space investment. These dimensions are represented by four indicators: total green investment, the proportion of fixed asset investment of the tertiary industry, total green talents, and green area. Simultaneously, based on the perceived harmonious coexistence of humans and nature, and the coordinated development of the economy, society, and ecology, the output variables are determined from six dimensions. These include economic growth, industrial transformation, resource conservation, improvement of people’s livelihood, environmental governance, and mineral protection. In this study, we use eight indicators, namely, gross domestic product (GDP) growth rate, the proportion of added value in the tertiary industry, energy consumption per unit GDP, per capita disposable income of urban residents, area per capita of green spaces in built-up areas, sulfur oxide emission, the comprehensive utilization rate of industrial solid waste, and decline rates of main mineral exploitation to represent the aforementioned dimensions. For the determination of environmental variables, we considered the impact of external factors, such as economic and social factors, and selected three dimensions. Economic structure, energy consumption structure, and technological innovation level were selected as external environmental variables affecting the green transformation efficiency of MRBC. These external variables consider three indicators for transformation efficiency: the proportion of added value from the secondary industry, the proportion of coal consumption in the comprehensive energy consumption, and the number of patents approved per capita. Accordingly, we constructed a preliminary MRBC green transformation efficiency evaluation system (Table 2). The numbers of input, output, and environmental variables involved in the evaluation model are 4, 8, and 3, respectively. The evaluation model meets the requirement that the number of DMU should be more than five times the total number of input-output variables [25], to fully guarantee the effectiveness of the evaluation results for MRBC green transformation efficiency.
The relevant data in the study are from the statistical systems of Chinese governments at all levels, including “China City Statistical Yearbook”, a statistical yearbook from each province, a statistical yearbook from each city, and “The Statistical Bulletin of National Economic and Social Development” from each city. Among them, some index data are indirect and calculated from the original data (the calculation formula is shown in Table 3). On account of 2018 being the year of China’s economic census, as of this paper’s date of submission, the statistical yearbooks of some cities have not been officially published, and some data from 2018 cannot be obtained. Thus, we selected 2008 to 2017 as the study period. Meanwhile, to eliminate the impact of price fluctuations, we consider 2000 as the base period and convert the total amount of green investment, GDP, and per capita disposable income of urban residents into constant prices for calculation.

5. MRBC Green Transformation Efficiency Evaluation Results

5.1. First Stage: Comprehensive Efficiency Evaluation Results of MRBC Green Transformation

The comprehensive efficiency of the green transformation of 110 MRBC was calculated by using the input-oriented BCC model (Table 4). As shown in Table 4, 10 MRBC, namely, Ezhou, Qitaihe, Liaoyuan, Wuhai, Tongchuan, Jinchang, Longhai, Shizuishan, Ya’an, and Karamay, had average comprehensive efficiency values of 1. This value was among the highest of the efficiency evaluations and their transformation efficiencies were better than those of the other MRBC. The average comprehensive efficiency values of seven MRBC, namely, Jining, Luoyang, Xuzhou, Nanchong, Handan, Chengde, and Tai’an, were 0.384, 0.451, 0.459, 0.477, 0.478, 0.489, and 0.495, respectively. These values are considerably lower than those of the aforementioned 10 MRBC. Next, the average comprehensive efficiency values of 21 MRBC, namely Zhangjiakou, Tangshan, Zibo, Linyi, Zaozhuang, Shaoguan, Changzhi, Ganzhou, Nanyang, Hengyang, Anshan, Chifeng, Luzhou, Qujing, Jining, Luoyang, Xuzhou, Nanchong, Handan, Chengde, and Tai’an, were lower than 0.6, indicating poor performance. Specifically, the comprehensive efficiencies of Jining from 2008 to 2017 were 0.464, 0.352, 0.385, 0.404, 0.467, 0.438, 0.413, 0.340, 0.289, and 0.289. The average value was 0.384, which was significantly lower than the average value of the other 110 MRBC (average value = 0.757). Third, the trend of comprehensive efficiency of the 110 MRBC from 2008 to 2017 is not optimistic, and the comprehensive efficiency of most MRBC is decreasing. For example, from 2008 to 2017, the comprehensive efficiency of Huainan and Tangshan decreased from 1 to 0.486 and 0.446, respectively. Fourth, the comprehensive efficiency of less developed MRBC is overall better than that of more developed MRBC. For example, the comprehensive efficiencies of Karamay, Ya’an, Jinchang, Shizuishan, and Longnan are significantly higher than those of Xuzhou, Chengde, Handan, Jining, and Tai’an. The abovementioned results show that the comprehensive efficiency of the 110 MRBC green transformation has a negative trend; thus more actions should be taken to improve the efficiency of this shift.
In this study, we divided 110 MRBC into four regional levels and four city type levels to further analyze the comprehensive efficiency of green transformation of MRBC (Figure 3 and Figure 4, respectively). As shown in Figure 3, the comprehensive efficiency of MRBC in the four regions is low, which means that the comprehensive efficiency of MRBC in all regions needs to be improved. Next, the comprehensive efficiency of MRBC in the western and northeastern regions is relatively higher than that in the central and eastern regions, indicating that there are regional differences in the comprehensive efficiency of the green transformation of MRBC in China. Furthermore, the comprehensive efficiency of MRBC in the eastern and central regions showed a significant decline, whereas the efficiency in the western and northeastern regions only showed a slight decline. As shown in Figure 4, the comprehensive efficiency of MRBC of the four urban types is also low, and the comprehensive efficiency should be improved. Second, the comprehensive efficiency of the coal cities and ferrous cities is slightly higher than that of non-ferrous and oil cities, but the difference is not significant. Third, from 2008 to 2017, the comprehensive efficiency of the four types of MRBC all declined, among which the oil cities showed the clearest decline, followed by the coal cities, non-ferrous cities, and then the ferrous cities. The abovementioned results show that the comprehensive efficiency of MRBC green transformation has a negative trend, and that the attempt made by the central Chinese and local governments to improve the comprehensive efficiency of MRBC green transformation in the past 10 years has not been successful.

5.2. Second Stage: Impacts of External Environmental Factors on the Green Transformation Efficiency of MRBC

In this study, the SFA method is used to analyze the slack value of the input variables. First, it calculated the slack values of the total green investment, the proportion of the fixed asset investment of the tertiary industry, the total number of green talents, and the green area. Second, three external environmental factors from the proportion of the added value from the secondary industry, the proportion of coal consumption to comprehensive energy consumption, and the number of patents granted per capita were taken as explanatory variables to estimate the model. Table 5 shows the estimated results of the SFA. The results show that the one-sided error LR test results from the four relaxation variables (based on the three environmental impact factors) are all larger than the significance value of the mixed chi-square distribution test. Furthermore, the results are all lower than the 1% significance level, which fully reflects the robustness of the SFA model. It can be concluded that the SFA method is effective in separating environmental impacts, statistical noise, and management inefficiencies.
According to the t-statistics in brackets (Table 5), all the evaluated coefficients are significant at the 1% level, indicating that the three external environmental factors do have a key impact on the green transformation efficiency amongst the 110 MRBC in China. Therefore, it is necessary to eliminate these influences to obtain the real efficiency of the 110 MRBC. Furthermore, different coefficients represent the different relationships between various environmental factors and input relaxation variables. Negative coefficients indicate that environmental factors have a positive impact on transformation efficiency, whereas positive coefficients indicate a negative impact. The specific impact of environmental factors is shown in Table 5.
The coefficients of the proportion of the added value of the secondary industry GDP are all positive and significant. This shows that the increase in the proportion of the added value of the secondary industry GDP will lead to an additional increase of the input in the total green investment, the proportion of fixed assets investment in the tertiary industry, the total number of green talents, and the green area. These changes will harm the efficiency of green transformation because they will reduce the input-output efficiency. With the implementation of Chinese MRBC economic restructuring policies, economic development will gradually shift from relying on energy-intensive and pollution-intensive industries to energy-saving and high-value-added industries, and the expansion of the secondary industry will be controlled. This is conducive to further reducing the negative impact on the efficiency of green transformation.
In terms of the proportion of coal consumption to comprehensive energy consumption, all the coefficients are positive and significant. These positive coefficients indicate that the increase of the proportion of coal consumption will lead to an increase of the input value of the efficiency evaluation of green transformation, thus, reducing the efficiency of MRBC green transformation. It is well known that coal burning is the main source of atmospheric pollutants such as sulfur dioxide, and an increase in coal consumption will lead to an increase in the emission of these pollutants. With this increase, green investment and green talents must also increase to control the emissions of atmospheric pollutants, creating a negative impact on the efficiency of green transformation.
In terms of the number of patents granted per capita, all the coefficients are negative and significant, and this measurement result is especially remarkable. Encouraging technological innovation and increasing the number of patents approved can improve the utilization efficiency of green factors of production and reduce the input of green capital, green talents, and green space. Additionally, it can promote the improvement of green production efficiency, and thus increase the favorable output and reduce the unfavorable output. Therefore, the number of patents granted per capita plays a positive role in improving the efficiency of the green transformation of the MRBC.
According to the above regression results, the three environmental variables selected all have significant impacts on the input relaxation variables. For this reason, it is necessary to eliminate the influence of external environmental factors to evaluate the real green transformation efficiency of the MRBC. Based on the regression results obtained by the SFA model, the adjusted input variables can be obtained according to Equations (2)–(5), and then the real efficiency of MRBC green transformation can be calculated.

5.3. Third Stage: Real Efficiency Evaluation Results of MRBC Green Transformation

Table 6 lists the real efficiency values of the Chinese MRBC green transformation from 2008 to 2017 calculated according to the adjusted input value. The real average green transformation efficiencies of 20 MRBC, namely, Sanming, Laiwu, Yangquan, Chizhou, Pingxiang, Hebi, Ezhou, Qitaihe, Liaoyuan, Wuhai, Yan’an, Tongchuan, Jinchang, Qingyang, Longnan, Shizuishan, Ya’an, Baoshan, Lincang, and Karamay, were 1. For these cities, the real efficiencies were better than those of other MRBC, and Xuzhou, Ganzhou, and Nanchong had considerably lower values than those of other MRBC. The latter three had average real green transformation efficiencies of 0.706, 0.797, and 0.798, respectively. Additionally, except for 16 MRBC (Datong, Hengyang, Anshan, Luzhou, Handan, Nanyang, Zibo, Suqian, Luoyang, Jining, Tai’an, Linyi, Zaozhuang, Nanchong, Ganzhou, and Xuzhou) the average real efficiencies of other MRBC green transformation were all greater than 0.9. After excluding the influence of external environmental factors and statistical noise, the real efficiency of the green transformation of a majority of MRBC shows a significant upward trend. Considering Yan’an as an example, the average comprehensive efficiency was 0.864, whereas the average real efficiency was 1. The value remained at the optimal level of real efficiency from 2008 to 2017. Finally, the real efficiency of the green transformation of less developed MRBC is generally better than that of the more developed MRBC. For example, the real efficiency of Jinchang, Yan’an, Lincang, and Karamay is significantly higher than that of Xuzhou, Zaozhuang, Linyi, and Tai’an.
Figure 5 shows the real efficiency of MRBC green transformation in the four regions from 2008 to 2017. As shown, the real efficiency of MRBC green transformation in the northeast and western regions was relatively higher than that in the eastern and central regions. This difference indicates that despite excluding the influence of external environmental factors and statistical noise, there is still a regional difference in MRBC green transformation efficiency. Additionally, the real efficiency of the green transformation of MRBC in the eastern region showed a significant downward trend, whereas the efficiency in the western and central regions showed a slight downward trend, and that in the northeast region showed a slight upward trend.
Similarly, Figure 6 shows the real efficiency value of MRBC green transformation categorized into four types from 2008 to 2017. After excluding the influence of external environmental factors and statistical noise, the real efficiency of green transformation of coal cities and ferrous cities was relatively higher than that of the non-ferrous and oil cities, though the difference is not large. The real efficiencies of the coal cities, ferrous cities, and non-ferrous cities also show a slightly decreasing trend, whereas those of the oil cities show a slightly increasing trend; the annual fluctuations of the oil cities and ferrous cities are relatively large.

6. Discussion

6.1. Comparative Analysis of the Comprehensive Efficiency of MRBC Green Transformation and the Real Efficiency Value

When comparing the comprehensive efficiency (Table 4) and the real efficiency (Table 6) we can find that, in addition to Ezhou, Qitaihe, Liaoyuan, Wuhai, Tongchuan, Jinchang, Longhai, Shizuishan, Ya’an, and Karamay, other green transformation efficiencies improved after eliminating the influence of external environment values and statistical noise. From 2008 to 2017, the average efficiency of the 110 MRBC increased from 0.757, considering external factors, to 0.955 after these factors were eliminated. The transformation efficiencies of MRBC in the eastern, central, northeastern, and western regions increased by 0.269, 0.215, 0.169, and 0.157, respectively. The transformation efficiencies of coal, oil, non-ferrous, and ferrous cities increased by 0.189, 0.215, 0.208, and 0.203, respectively, suggesting that external factors lead to a severe underestimation of the Chinese MRBC green transformation efficiencies. After excluding the environmental impact and noise statistics, there were 20 cities close to the green transformation efficiency optimal state. However, in the first stage, only 10 cities consistently maintained this level of efficiency. This indicates that the external environment factors and statistical noise have a negative impact on the latter ten MRBC: Sanming, Yangquan, Chizhou, Pingxiang, Hebi, Yan’an, Qingyang, Baoshan, Lincang, and Laiwu. There is substantial potential for improving these external environments. Furthermore, the comparison results also show that none of the green transformation efficiencies in 2017 were positively impacted by environmental factors, indicating that the overall external environment of green transformation in China is poor.
Figure 7 shows the average Chinese green transformation comprehensive efficiency of all MRBC and the average real efficiency from 2008 to 2017. As shown in Figure 7, the shaded areas in Figure 7B are darker than those in Figure 7A, indicating that the green transformation efficiency of most MRBC is significantly improved. For example, for Chengde and Zaozhuang, the green transformation efficiency after eliminating the influence of external environmental factors and statistical noise is 0.420 and 0.305 higher than before they were eliminated, respectively. According to the analysis of value-added data of relevant industries in the “China City Statistical Yearbook” (National Bureau of Statistics, 2009–2018), Chengde’s economic development relies heavily on iron and steel metallurgy, industrial manufacturing, and other energy-intensive high pollution industries. Additionally, Zaozhuang’s economic development relies heavily on the textile industry and other industrial manufacturing, so the green transition in these two cities requires a greater investment in green capital and green talents. A poor external environment leads to a relatively low comprehensive efficiency of green transformation in these two cities. Once external environmental factors and statistical noise were removed from the data from Changzhi and Hulunbuir, the green transformation efficiency increased by 0.366 and 0.263 respectively. This increase can be attributed to resource endowment characteristics. According to the “China City Statistical Yearbook” (National Bureau of Statistics, 2009–2018), Changzhi and Hulunbuir have large coal reserves and are the main coal suppliers for Chinese cities. A coal dominated industry structure hinders the transformation of electronics, medicine, energy-saving methods, high added value, and modern industry. Therefore, improving the green transformation comprehensive efficiency in Changzhi and Hulunbuir is difficult owing to external environmental factors such as economic structure and energy consumption structure.

6.2. Decomposition Analysis of Green Transformation Efficiency of MRBC

To better understand the green transformation of the 110 Chinese MRBC and the change of real efficiencies, we used DEAP software to categorize the green transformation real efficiency into two parts [31]. That is, the overall technical efficiency (OTE) of each DMU was decomposed into PTE and SE. Their relationship can be represented as: OTE = PTE × SE. It is important to note that PTE does not include the scale effects; this explains how MRBC green transition technology can be effectively applied to achieve maximum output. SE is obtained by the green transformation of MRBC, reflecting the degree of realization for the scale effect on green transformation.
Figure 8 shows trends of the real OTE, PTE, and SE values of the eastern, central, northeastern, western regions, and all MRBC green transformation from 2008 to 2017. As shown, the SE trend is close to the real efficiency trend of the green transformation, which means that the change of the real efficiency of the green transformation is primarily determined by SE. Compared with the PTE, the SE of the MRBC in the four regions is relatively low. Except for the northeast region, others experienced diminishing returns for the SE, particularly the eastern region. Therefore, MRBC in the eastern, central, and western regions has the potential to expand the scale effect of green transformation. Since 2012, the PTE of the MRBC in the central and western regions have shown a trend of slow growth, which may be attributed to the fact that the implementation of “Guidance on undertaking industrial transfer in central and western regions” [32] has promoted the PTE of green transformation; thus, there has been a positive impact on transformation. Similarly, Figure 9 shows trends of the real OTE, PTE, and SE values for the four city types from 2008 to 2017. The SE trend is close to the real efficiency trend of the green transformation, indicating that the change of real efficiency of the green transformation is principally determined by SE (Figure 9). Compared with the PTE, the SE of all types of MRBC is relatively low. Except for oil cities, other types of MRBC experienced diminishing returns for the SE, indicating that coal cities, non-ferrous cities, and ferrous cities have failed to realize the scale effect of green transformation through optimizing industrial structure, energy structure, pollution control, and emission reduction policies.
Figure 10 and Figure 11 show the classification comparison of the real PTE and SE (Figure 10A and Figure 11A) and comprehensive PTE and SE (Figure 10B and Figure 11B), respectively, of the green transformation of the four regions and four types of MRBC. From a regional perspective, whether or not the external environmental factors and statistical noise are excluded, the PTEs and SEs of the western and northeastern MRBC belong to the high-high group; the central MRBC belongs to the low-high group, and the eastern MRBC belong to the low-low group. In terms of city types, the PTEs and SEs of non-ferrous cities and coal cities are in the low-high group, whereas those of oil cities and ferrous cities are in the high-low group, regardless of whether external environmental factors and statistical noise are excluded.
The low-high group represents different regions or types of MRBC that have low PTE and high SE. Regardless of whether the influences of external environment factors and statistical noise are eliminated, the central region MRBC PTEs and SEs belong to the low-high value group. The non-ferrous and coal cities also belong to the low-high group as the PTEs are below the national average of MRBC. Thus, they should improve the PTEs, especially in the non-ferrous and coal cities in the central region. Increasing the investment in green technological innovation and application, improving the quality of green talents, improving energy efficiency, reducing resource exploitation and utilization, and reducing pollutant emissions are important steps for these MRBC to improve the efficiency of green transformation.
The high-low group represents a state of high PTE and low SE for different regions or different types of MRBC. The PTEs and SEs of both oil cities and ferrous cities are in the high-low group, regardless of whether or not the external environmental factors and statistical noise are excluded. However, none of the four regions are in the high-low group. Accordingly, oil cities and ferrous cities should focus on improving the SE, particularly oil cities with a relatively low SE. Furthermore, they should expand the scale of green transformation, increase the concentration of green transformation industries, green investment, and talents, and effectively realize the scale effect of green transformation.
The low-low group represents a state of low PTE and low SE for different regions and different types of MRBC. Regardless of whether the effects of external environmental factors and statistical noise are excluded, the PTEs and SEs of MRBC in the eastern region are in the low-low group, whereas none of the different types of MRBC are in the low-low group. Therefore, the PTEs and SEs of the eastern MRBC must be improved, and the technological innovation and scale effect of green transformation should be promoted. Moreover, MRBC in the eastern region should continuously promote the green adjustment of the industrial structure. They should transition from traditional resource and energy-intensive industries to modern green industries that rely on new technologies, to promote the overall improvement of their green transformation efficiency.

7. Conclusions and Policy Implications

7.1. Key Conclusions

After decades of development, societies and economies of Chinese MRBC have made considerable progress. However, rapid economic development has placed a significant strain on resources and the natural environment. The depletion of mineral resources, particularly fossil fuels, and the deterioration of the ecological environment have significant negative impacts on the development of MRBC. Therefore, green transformation is widely regarded as the only way for MRBC to achieve sustainable development. The evaluation of green transformation efficiencies is important for policy-making and will help MRBC determine the key factors that affect these efficiencies, allowing for countermeasures to be taken. In this study, we used the three-stage DEA method to empirically evaluate the green transformation efficiency of Chinese MRBC from 2008 to 2017, and draw the following conclusions.
(1)
From the comprehensive efficiency of Chinese MRBC green transformation, the 10 MRBC of Ezhou, Qitaihe, Liaoyuan, Wuhai, Tongchuan, Jinchang, Longhai, Shizuishan, Ya’an, and Karamay had better results than other cities, whereas the seven MRBC of Jining, Luoyang, Xuzhou, Nanchong, Handan, Chengde, and Tai’an had significantly lower results than other cities. MRBC in the northeast and the west had higher efficiencies than those in the central and the east. Coal cities and ferrous cities had slightly higher values compared with oil cities and non-ferrous cities. In addition, the green transformation efficiency of MRBC in China is declining, and the overall transformation effect is not optimistic.
(2)
Three external environmental factors, namely, the proportion of the added value of the secondary industry in GDP, the proportion of coal consumption in comprehensive energy consumption, and the number of patents approved per capita, have a significant impact on the green transformation efficiency of Chinese MRBC. The coefficient of the ratio of the added value of the secondary industry to the GDP and the ratio of the coal consumption to the comprehensive energy consumption were both positive, indicating that these two factors have a negative impact on the transformation efficiency. However, the coefficient of the number of patents approved per capita was negative, indicating that this factor has a positive impact on the transformation efficiency.
(3)
After eliminating the influence of external environmental factors and statistical noise, the Chinese MRBC green transformation efficiency evaluation produced notable results. In addition to the 10 MRBC of Ezhou, Qitaihe, Liaoyuan, Wuhai, Tongchuan, Jinchang, Longhai, Shizuishan, Ya’an, and Karamay, the green transformation efficiencies of other MRBC were improved after eliminating the influence of the external environment and statistical noise. Overall, external environmental factors and statistical noise lead to a significant underestimation of the green transformation efficiency.
(4)
After decomposing the transformation efficiency into SE and PTE, the comparative results showed that the green transformation SE played a leading role in both comprehensive efficiency and real efficiency. Based on this, and the average level of SE and PTE, the 110 MRBC were divided into four groups according to region and city type. Note, each group formulates different strategies to improve the efficiency of green transformation.

7.2. Policy Implications

To improve the efficiency of MRBC green transformation in China, the following policies are suggested.
(1)
Policy makers should consider the comprehensive efficiency evaluation results of MRBC green transformation and also refer to the real efficiency evaluation results for robust decision-making. Because the traditional DEA method cannot eliminate the influence of external environmental factors and statistical noise, the MRBC green transformation efficiencies may be distorted. In social, economic, and natural environments, the impact of external environmental factors should not be ignored during transformation efforts. Therefore, the real efficiency resulting from the elimination of external factors is helpful when forming policies to improve transformation efficiency.
(2)
Policy makers should strive to optimize the external environment and improve the green transformation comprehensive efficiency of the MRBC. The MRBC, including Ezhou, Qitaihe, and Liaoyuan, which have relatively high levels of an industry structure optimization, energy structure optimization, and technological innovation also have high comprehensive efficiencies for green transformation. Therefore, those MRBC should speed up the process of economic and industrial restructuring. Furthermore, they should transform the pollution-intensive industries that rely on capital and energy investments into modern green industries with high energy efficiencies and high added value. Additionally, it is extremely important to pay attention to technological and scientific innovation, to increase the investment in the research and development of green high-tech industries, and to promote the application of green advanced technology.
(3)
Policy makers should make special policies to improve the SE or PTE of green transformation, to effectively improve the green transformation efficiency of MRBC. According to the decomposition results of the green transformation efficiency, regardless of whether the impact of external environmental factors and statistical noise is eliminated, oil cities and ferrous cities in the high-low groups should expand their economic scale, increase industrial agglomeration, form economies of scale, and continuously improve the SE of green transformation. For the oil cities, non-ferrous cities, and central region MRBC in the low-high group, investment in technological innovation and application must be increased, particularly in green high-tech, to reduce the consumption of resources and energy, and emission of pollutants, and to improve the PTE of green transformation. For the eastern region MRBC in the low-low group, the PTE and SE should be improved to holistically promote the efficiency of green transformation.

Author Contributions

Q.Y.: conceptualization, data curation, methodology, writing—original draft. Y.W.: data curation, visualization, supervision, editing. K.W.: visualization, review and editing, software. D.W.: review and editing. All authors have read and agreed to the published version of the manuscript.

Funding

This research was funded by the National Natural Science Foundation of China (No.72074210; No.71573252) and Think Tank of Energy Mining Economy (2018 Project for Cultural Evolution and Creation of CUMT 2018WHCC01).

Acknowledgments

Finally, we thank the anonymous reviewers for their constructive comments for improving the paper.

Conflicts of Interest

The authors declare no conflict of interest.

Data Availability

The datasets used and/or analyzed during the current study are available from the corresponding author on reasonable request.

Ethical Approval and Consent to Participate

We declare that we did not involve human participants, human data, or human tissue in the study.

Availability of Data and Materials

The data-sets used and/or analyzed during the current study are available from the corresponding author on reasonable request.

References

  1. Qian, X.; Wang, D.; Wang, J.; Chen, S. Resource curse, environmental regulation and transformation of coal-mining cities in China. Resour. Policy 2019. [Google Scholar] [CrossRef]
  2. Merli, R.; Preziosi, M.; Acampora, A. How do scholars approach the circular economy? A systematic literature review. J. Clean. Prod. 2018, 178, 703–722. [Google Scholar] [CrossRef]
  3. National Bureau of Statistics, 2009–2018, China City Statistical Yearbook. Available online: http://www.stats.gov.cn/tjsj/ndsj/ (accessed on 20 June 2020).
  4. Della Bosca, H.; Gillespie, J. The coal story: Generational coal mining communities and strategies of energy transition in Australia. Energy Policy 2018, 120, 734–740. [Google Scholar] [CrossRef]
  5. The State Council. National Resource-Based Urban Sustainable Development Plan (2013–2020). 2013. Available online: http://www.gov.cn/zwgk/2013-12/03/content_2540070.htm (accessed on 20 June 2020).
  6. NDRC. Guidelines on Strengthening Classification and Guiding the Cultivation of New Drivers for the Transformation and Development of Resource-Based Cities. 2017. Available online: https://www.ndrc.gov.cn/xxgk/zcfb/tz/201701/t20170125_962892.html (accessed on 20 June 2020). (In Chinese)
  7. NDRC. Notice on Supporting the Construction of the First Batch of Industrial Transformation and Upgrading Demonstration Zones in Old Industrial Cities and Resource-Based Cities. 2017. Available online: https://www.ndrc.gov.cn/xxgk/zcfb/tz/201704/t20170421_962949.html (accessed on 20 June 2020). (In Chinese)
  8. Yang, Y.; Guo, H.; Chen, L.; Liu, X.; Ke, X. Regional analysis of the green development level differences in Chinese mineral resource-based cities. Resour. Policy 2019, 61, 261–272. [Google Scholar] [CrossRef]
  9. Ma, L.; Long, H.; Chen, K.; Tu, S.; Liao, L. Green growth efficiency of Chinese cities and its spatio-temporal pattern. Resour. Conserv. Recycl. 2019, 146, 441–451. [Google Scholar] [CrossRef]
  10. Zhao, T.; Yang, Z. Towards green growth and management: Relative efficiency and gaps of Chinese cities. Renew. Sustain. Energy Rev. 2017, 80, 481–494. [Google Scholar] [CrossRef]
  11. Ji, Q.; Li, C.; Jones, P. New green theories of urban development in China. Sustain. Cities Soc. 2017, 30, 248–253. [Google Scholar] [CrossRef]
  12. Jian, M.; Jin, A. Environmental Analysis of Climate Resource Endowment, Urban Transformation and Development & Culture-Economy-Eco Geography Chain Remolding: Green Transformation of Panzhihua as Resource-Exhausted City. EKOLOJI 2018, 27, 1543–1553. [Google Scholar]
  13. Lin, B.; Zhu, J. Policy effect of the Clean Air Action on green development in Chinese cities. J. Environ. Manag. 2020, 258, 110036. [Google Scholar] [CrossRef]
  14. Sun, Y.; Ding, W.; Yang, Z.; Yang, G.; Du, J. Measuring China’s regional inclusive green growth. Sci. Total Environ. 2020, 713, 136367. [Google Scholar] [CrossRef]
  15. Jin, P.; Peng, C.; Song, M. Macroeconomic uncertainty, high-level innovation, and urban green development performance in China. China Econ. Rev. 2019, 55, 1–18. [Google Scholar] [CrossRef]
  16. Yuan, H.; Feng, Y.; Lee, J.; Liu, H.; Li, R. The spatial threshold effect and its regional boundary of financial agglomeration on green development: A case study in China. J. Clean. Prod. 2020, 244, 118670. [Google Scholar] [CrossRef]
  17. Cheng, J.; Yi, J.; Dai, S.; Xiong, Y. Can low-carbon city construction facilitate green growth? Evidence from China’s pilot low-carbon city initiative. J. Clean. Prod. 2019, 231, 1158–1170. [Google Scholar] [CrossRef]
  18. Wang, M.-X.; Zhao, H.-H.; Cui, J.-X.; Fan, D.; Zhou, G.-J. Evaluating green development level of nine cities within the Pearl River Delta, China. J. Clean. Prod. 2018, 174, 315–323. [Google Scholar] [CrossRef]
  19. Ecological Finance Research Center of Renmin University of China, 2019: TOP 50 Report of Chinese Green Cities Index in 2019. Available online: http://www.xinhuanet.com/globe/2019-12/31/c_138668624.htm (accessed on 20 June 2020).
  20. Wang, D.; Wan, K.; Yang, J. Measurement and evolution of eco-efficiency of coal industry ecosystem in China. J. Clean. Prod. 2019, 209, 803–818. [Google Scholar] [CrossRef]
  21. Tao, F.; Zhang, H.; Hu, J.; Xia, X.H. Dynamics of green productivity growth for major Chinese urban agglomerations. Appl. Energy 2017, 196, 170–179. [Google Scholar] [CrossRef]
  22. Jia, S.; Wang, C.; Li, Y.; Zhang, F.; Liu, W. The urbanization efficiency in Chengdu City: An estimation based on a three-stage DEA model. Phys. Chem. Earth 2017, 101, 59–69. [Google Scholar] [CrossRef]
  23. Jondrow, J.; Lovell, C.A.K.; Materov, I.S.; Schmidt, P. On the estimation of technical inefficiency in the stochastic frontier production function model. J. Econom. 1982, 19, 233–238. [Google Scholar] [CrossRef] [Green Version]
  24. Fried, H.O.; Lovell, C.A.K.; Schmidt, S.S.; Yaisarwarng, S. Accounting for environmental effects and statistical noise in data envelopment analysis. J. Prod. Anal. 2002, 17, 157–174. [Google Scholar] [CrossRef]
  25. Golany, B.; Roll, Y. An application procedure for DEA. Omega 1989, 17, 237–250. [Google Scholar] [CrossRef]
  26. Dang, X.; Zhang, Y.; Feng, W.; Zhou, N.; Ginsberg, M. Comparative study of city-level sustainability assessment standards in China and the United States. J. Clean. Prod. 2020, 251, 119622. [Google Scholar] [CrossRef]
  27. Yuan, W.; Li, J.; Meng, L.; Qin, X.; Qi, X. Measuring the area green efficiency and the influencing factors in urban agglomeration. J. Clean. Prod. 2019, 241, 118092. [Google Scholar] [CrossRef]
  28. He, S.Y.; Lee, J.; Zhou, T.; Wu, D. Shrinking cities and resource-based economy: The economic restructuring in China’s mining cities. Cities 2017, 60, 75–83. [Google Scholar] [CrossRef]
  29. Zhao, H.; Guo, S.; Zhao, H. Provincial energy efficiency of China quantified by three-stage data envelopment analysis. Energy 2019, 166, 96–107. [Google Scholar] [CrossRef]
  30. Zhang, J.; Chang, Y.; Zhang, L.; Li, D. Do technological innovations promote urban green development?—A spatial econometric analysis of 105 cities in China. J. Clean. Prod. 2018, 182, 395–403. [Google Scholar] [CrossRef]
  31. Banker, R.D.; Charnes, A.; Cooper, W.W. Some models for estimating technical and scale inefficiencies in data envelopment analysis. Manag. Sci. 1984, 30, 1078–1092. [Google Scholar] [CrossRef] [Green Version]
  32. The State Council. Guidance on Undertaking Industrial Transfer in Central and Western Regions. 2010. Available online: http://www.gov.cn/zwgk/2010-09/06/content_1696516.htm (accessed on 20 June 2020). (In Chinese)
Figure 1. The methodological framework of a three-stage DEA (data envelopment analysis) method for efficiency evaluation of MRBC green transformation in China.
Sustainability 12 09455 g001
Figure 2. Geographical distribution of MRBC in China.
Sustainability 12 09455 g002
Figure 3. Comprehensive efficiency of MRBC green transformation in four regions of China from 2008 to 2017.
Sustainability 12 09455 g003
Figure 4. Comprehensive efficiency of four types of MRBC green transformation in China from 2008 to 2017.
Sustainability 12 09455 g004
Figure 5. Real efficiency of green transformation of MRBC in four regions of China from 2008 to 2017.
Sustainability 12 09455 g005
Figure 6. Real efficiency of four types of MRBC green transformation in China from 2008 to 2017.
Sustainability 12 09455 g006
Figure 7. Average comprehensive efficiency (A) and real efficiency (B) of China’s MRBC green transformation from 2008 to 2017.
Sustainability 12 09455 g007
Figure 8. Real OTE, PTE, and SE trends of four regions and all MRBC green transformation from 2008 to 2017.
Sustainability 12 09455 g008
Figure 9. Real OTE, PTE, and SE trends of four types and all MRBC green transformation from 2008 to 2017.
Sustainability 12 09455 g009
Figure 10. Classification comparison of real PTE and SE (A) and comprehensive PTE and SE (B) of MRBC in four regions.
Sustainability 12 09455 g010
Figure 11. Classification comparison of real PTE and SE (A) and comprehensive PTE and SE (B) of MRBC of four types.
Sustainability 12 09455 g011
Table 1. MRBC region and distribution type.
Coal CityOil CityNon-Ferrous CityFerrous CityTotal
Eastern regionXuzhou, Zhangjiakou, Xingtai, Handan, Sanming, Zaozhuang, Jining, Taian, LaiwuDongying, ZiboSuqian, Chengde, Tangshan, Huzhou, Nanping, Shaoguan, WanfowLongyan, Linyi20
Central regionDatong, Shuozhou, Yangquan, Changzhi, Jincheng, Linfen, Luliang, Huaibei, Bozhou, Huainan, Jingdezhen, Sanmenxia, Luoyang, Jiaozuo, Hebi, Pingdingshan, LoudiPuyang, NanyangYuncheng, Suzhou, Chuzhou, Tongling, Chizhou, Xuancheng, Xinyu, Ganzhou, Yichun, Huangshi, Hengyang, Chenzhou, ShaoyangXinzhou, Jinzhong, Maanshan, Pingxiang, Ezhou37
Western regionWuhai, Hulunbuir, Ordos, Yan’an, Tongchuan, Weinan, Xianyang, Yulin, Wuwei, Zhangye, Pingliang, Shizuishan, Guangyuan, Nanchong, Guang’an, Zigong, Luzhou, Ya’an, Qujing, Baoshan, Zhaotong, Liupanshui, Anshun, BijieQingyang, Dazhou, KaramayChifeng, Baise, Hechi, Hezhou, Jinchang, Baiyin, Longnan, LincangBaotou, Baoji, Panzhihua, Pu’er39
Northeast regionFuxin, Hegang, Shuangyashan, Qitaihe, Jixi, Liaoyuan, TonghuaPanjin, Daqing, SongyuanFushun, HuludaoBenxi, Anshan14
Total57103013110
Table 2. MRBC green transformation efficiency evaluation system.
VariableEvaluation IndicatorIndicator InterpretationReferencesData Sources
Input variableCapital investmentTotal green investment (10,000 yuan) X1Including the total investment in environmental protection, science and technology innovation and education; reflecting the condition of green capital investment in green transformation.[20]China urban statistical yearbook; provincial statistical yearbook
Proportion of fixed asset investment of tertiary industry (%) X2Reflecting the condition of green capital investment to promote the green transformation of industry and economic structure.[26]Provincial statistical yearbook
Human investmentTotal number of green talents (10,000 people) X3Including environmental protection, science and technology innovation and the sum of education talents; reflecting the green human investment in green transformation.[14,20]Provincial statistical yearbook; statistical yearbook of each city
Space investmentGreen area (hectare) X4Reflecting the green space investment in green transformation.[26,27]China urban statistical yearbook
Output variableEconomic growthGDP growth rate (%) Y1Reflecting the effectiveness of green transformation in promoting economic development.[8]China urban statistical yearbook
Industrial transformationProportion of added value of tertiary industry (%) Y2Reflecting the effect of green transformation to promote the upgrading of industry and economic structure.[8]China urban statistical yearbook
Resource savingEnergy consumption of unit GDP (tons of standard coal/10,000 yuan) Y3 *Reflecting the effect of green transformation to promote energy and other resources saving.[18]Statistical yearbook of each city; Municipal Statistical Bulletin
Improvement of people’s livelihoodPer capita disposable income of urban residents (yuan) Y4Reflecting the effect of green transformation on the improvement of population wealth and welfare.[9]Provincial Statistical Yearbook; Municipal Statistical Bulletin
Per capita green coverage area of built-up area (hectare/10,000 people) Y5Reflecting the effect of green transformation on the improvement of the urban living environment.[18]China urban statistical yearbook
Environmental governanceSulfur dioxide emissions (ton) Y6 *Reflecting the effect of green transformation on pollutant emission control.[14]China urban statistical yearbook
Comprehensive utilization rate of industrial solid waste (%) Y7Reflecting the effect of green transformation on promoting mining area and industrial pollution management.[18]China urban statistical yearbook
Mineral protectionDecline rate of main mineral production (%) Y8Reflecting the effect of green transformation on promoting the conservation and protection of exhausted minerals.[26,28]Statistical yearbook of each city; Municipal Statistical Bulletin
Environment variableEconomic structureProportion of added value of secondary industry (%) E1Reflecting the impact of economic structure on green transformation.[29]China urban statistical yearbook
Energy consumption structureProportion of coal consumption (%) E2Reflecting the impact of energy consumption structure on green transformation.[29]Statistical yearbook of each city; Municipal Statistical Bulletin
Technological innovation levelNumber of patents approved per capita (pieces/10,000 people) E3Reflecting the impact of technological innovation level on green transformation.[30]China urban statistical yearbook
Note: * indicates the negative indicator in the output variable.
Table 3. Calculation formula of indexes.
IndexCalculation Formula
Total green investment (ten thousand yuan) X1Investment in environmental protection + investment in science and innovation + investment in Education
Proportion of fixed asset investment of tertiary industry (%) X2Fixed assets investment of tertiary industry/total fixed assets investment × 100%
Total number of green talents (10,000 people) X3Number of environmental protection talents + number of scientific and creative talents + number of educational talents
energy consumption of unit GDP (tons of standard coal/10,000 yuan) Y3Comprehensive energy consumption/GDP
Per capita green area of built-up area (hectare) Y5Green coverage area of built-up area/household registration population at the end of the year
Decline rate of main mineral production (%) Y8(last year’s mining volume of a core mineral—current year’s mining volume)/last year’s mining volume × 100%
Proportion of coal consumption (%) E2Coal consumption/comprehensive energy consumption
Table 4. Comprehensive efficiency of Chinese MRBC green transformation from 2008 to 2017.
RegionCity2008200920102011201220132014201520162017Average
Eastern RegionXuzhou0.6600.5250.3050.4130.6540.5530.4120.4170.4640.1890.459
Suqian0.7990.7550.6100.8140.6490.6620.3750.6110.7040.3760.636
Zhangjiakou0.6890.4670.4460.6170.5270.4320.4630.4410.4750.5670.512
Chengteh0.5640.4970.4530.6210.4350.3460.4340.4090.4240.7020.489
Tangshan110.9930.3740.3640.5020.4150.3890.4850.4460.597
Xingtai0.7860.6540.4860.5530.6680.8640.6840.8110.8450.7020.705
Handan0.6640.5500.3960.5030.5420.4340.2590.4040.5510.4770.478
Huzhou0.87610.688110.6710.5720.6980.7000.6770.788
Nanping0.92510.7930.7620.8200.7530.7180.6630.7440.7940.797
Sanming10.8040.7780.9040.8830.8240.9100.8460.8930.9210.876
Longyan0.8400.9630.7690.7850.7430.630.6960.6740.6740.7510.753
Dongying0.6010.9650.4660.7450.4540.5060.5220.8090.4740.4790.602
Zibo0.7260.4390.4990.5240.4690.5070.6020.4410.5980.3970.520
Lingyi0.6050.3830.4210.5210.99010.4270.3280.4010.3000.538
Zaozhuang0.5890.4890.5090.5210.4430.5470.5250.4300.5700.4360.506
Jining0.4640.3520.3850.4040.4670.4380.4130.3400.2890.2890.384
Tai’an0.4650.7010.4880.5240.5320.4470.4750.4760.4400.4060.495
Laiwu10.986111111110.999
Shaoguan0.6170.5840.7860.710.6870.6350.5930.4530.4360.4570.596
Yunfu110.9921110.8650.9270.8850.8730.954
Central RegionDatong0.6370.4880.5270.5920.5530.5960.5830.6400.5100.4120.554
Shuozhou 0.9610.89310.9980.8260.7420.8330.9780.9380.9940.916
Yangquan 111110.9860.8750.8420.88010.958
Changzhi 0.6710.6050.5340.6310.6000.5310.5570.5580.5770.5820.585
Jincheng 0.8780.7780.8010.860.8130.6830.7370.7180.7710.9400.798
Xinzhou 11110.7540.70310.7990.8300.8410.893
Jinzhou 0.7880.6780.7040.6520.6250.6420.6650.8240.6370.6300.685
Linfen 0.7640.7210.7040.5870.4910.5260.5900.5860.6050.6630.624
Yuncheng 0.6640.7040.7570.8700.6360.5310.7050.6590.6250.6050.676
Lvliang 0.9490.75510.9510.95010.8500.6860.8850.6890.872
Suzhou0.75510.7270.9300.6360.5200.5960.5030.6430.7100.702
Huaibei 10.9800.9070.8340.6980.8130.8870.6180.6550.6660.806
Bozhou 0.9260.832110.7460.6740.6870.5720.6730.7080.782
Huainan 10.8330.6620.5740.4880.5190.6260.5450.5600.4860.629
Chuzhou 0.7520.7470.6460.5700.5010.6630.5140.4900.5100.6470.604
Ma’anshan0.9610.8870.8950.7740.6520.6030.6490.5970.5370.6430.720
Tongling 0.9781111110.9130.9450.6880.952
Chizhou 0.9991111110.9440.98910.993
Xuancheng 0.8890.9680.7750.9010.7180.5580.6450.6090.6250.6750.736
Jingdezhen 0.93810.82811110.8330.7730.8780.925
Xinyu 0.66210.9530.9480.8721110.9590.9950.939
Pingxiang 10.751110.90310.8961110.955
Ganzhou0.4940.5620.6790.4310.5680.4330.4020.40310.3190.529
Yichun 0.8250.8140.7170.7360.7320.59210.7490.6850.8110.766
Sanmenxia 0.8970.7920.7460.7480.7500.7750.8860.8330.7450.9440.812
Luoyang 0.5330.6250.3530.4060.4500.5850.3090.4090.4420.4000.451
Jiaozuo 0.6630.7230.6860.6350.7930.6080.7010.7170.7240.5720.682
Hebi 10.8000.8810.9610.7890.9000.9480.8740.9510.910
Puyang 0.9020.7450.8310.8050.7800.7000.8500.7580.7800.6960.785
Pingdingshan 0.7690.7690.6070.4760.6340.5540.6150.6220.6600.8130.652
Nanyang 0.6060.6900.4820.6390.35610.4560.6000.4980.4110.574
Ezhou11111111111
Huangshi 0.7260.5780.6320.6320.5980.6200.8590.6510.5720.6890.656
Hengyang 0.4430.5490.3600.5550.4970.4680.49610.4490.4210.524
Chenzhou 0.6690.6570.9890.5530.6040.4660.5940.5000.5310.5510.611
Shaoyang 0.7800.7240.6010.5730.4740.4930.6620.5640.6080.5480.603
Loudi 0.8780.7560.7070.5290.5400.6910.6840.6680.6990.9720.712
Northeastern RegionFuxin 0.8080.6040.8020.7390.6800.5600.64410.7620.9550.755
Fushun 0.6070.7880.5750.7520.6060.4810.5630.5840.6670.9410.656
Benxi 0.63110.5180.7640.5860.5390.5990.5480.57410.676
Anshan 0.7440.6720.3510.6830.4680.5180.4570.4870.5150.4840.538
Panjin 110.8230.8270.8090.7150.6960.7020.6870.6530.791
Huludao 0.6650.6520.6170.6420.5950.5870.6150.83010.6290.683
Daqing 0.5210.6950.8560.8220.6790.5690.7790.5190.6930.6100.674
Hegang 10.8320.97810.9451110.86310.962
Shuangyashan 110.9731110.95810.80910.974
Qitaihe11111111111
Jixi 0.9250.97810.9750.9120.9890.955110.6900.942
Songyuan 10.6800.7100.8440.7680.7030.6900.7540.7550.6710.758
Liaoyuan 11111111111
Tonghua0.7990.7200.7910.8040.7850.9250.5880.7530.8250.9160.791
Western RegionBaotou0.5080.5670.49510.84810.6760.5040.5670.4610.663
Wuhai11111111111
Chifeng0.6170.5730.4960.5590.4730.4400.4540.5250.4560.4570.505
Hulunbuir 0.7000.8670.9680.8050.7180.7430.6810.6710.5380.5290.722
Erdos 0.7310.8790.83710.4800.44910.7150.8510.5120.745
Baise 0.5990.5510.6030.8460.7830.9550.5550.5920.5150.7330.673
Hechi110.8460.8250.7360.8850.9810.976110.925
Hezhou1110.9050.9150.91810.97310.7950.951
Yan’an 10.9740.8550.9050.8370.8810.8970.8120.7620.7130.864
Tongchuan 11111111111
Weinan 0.7220.8930.5960.5640.5830.5900.7140.6590.7530.6580.673
Xianyang 0.7230.7060.5650.5930.6190.5610.5650.5610.6990.6550.625
Baoji 0.7070.4380.5180.8290.6910.8160.61510.5560.5670.674
Yulin 0.6900.5450.6840.6040.6560.85010.6840.7480.6060.707
Jinchang 11111111111
Baiyin 0.7490.7740.7910.8190.71410.8430.76310.7740.823
Wuwei 10.98410.8910.990111110.987
Zhangye 111111110.8850.9800.987
Qingyang 1110.9250.96410.9870.999110.988
Pingliang0.73810.7310.6580.957110.9380.8580.9780.886
Longnan 11111111111
Shizuishan 11111111111
Guangyuan 0.8800.9720.6480.6570.6960.6780.7070.7160.7170.9870.766
Nanchong 0.5220.4900.5310.4660.5500.4330.5490.3900.3820.4550.477
Guang’an 0.8360.9580.9090.7770.7950.7480.7680.7200.6770.6700.786
Zigong 0.7090.6530.8010.8540.670.6110.7310.5940.6270.6060.686
Luzhou0.6020.6520.5380.5800.5190.6400.6090.4630.4900.4970.559
Panzhihua0.7610.7760.7550.8130.7730.7030.8330.7710.7350.8190.774
Dazhou 0.7230.7410.6500.6650.7230.5890.6590.5330.6300.7100.662
Ya’an 11111111111
Qujing 0.6240.4370.4450.4730.4370.4800.6190.5440.8930.7640.572
Baoshan 1110.920.974111110.989
Zhaotong10.83910.7880.7360.73010.8910.6600.6710.832
Pu’er 0.8600.9530.8460.7940.8120.8390.9701110.907
Lincang 1110.9121111110.991
Liupanshui 11111110.6220.6710.5700.886
Anshun0.81310.72911110.4960.7410.7010.848
Bijie 0.6320.9970.4970.5850.4660.7230.6940.6750.6740.7530.670
Karamay 11111111111
Average 0.8120.8030.7570.7770.7390.7430.7490.7250.7340.7270.757
Table 5. SFA estimation results.
Slacks
Explanatory VariableTotal Green InvestmentProportion of Fixed Asset Investment of Tertiary IndustryTotal Number of Green TalentsGreen Area
Constant term−785,164.82−0.08208−1.50921−1246.77
(−783,043.30) ***(−4.75752) ***(−4.25824) ***(−5.29999) ***
Proportion of the added value of the secondary industry164,486.960.031570.41998490.76
(164,397.25) ***(1.23342) ***(0.89376) ***(3.40251) ***
Proportion of the coal consumption949,254.480.100571.659541349.81
(948,837.94) ***(4.14334) ***(3.33799) ***(6.05144) ***
Number of patents granted per capita−7060.63−0.00056−0.01830−8.74509
(−6691.52) ***(−0.63660) ***(−1.13341) ***(−0.69348) ***
σ i 2 227,963,8400.010915.515622,675,984
γ i 0.650.490.690.56
LR test400.39120.72327.47329.34
Note: *** indicates the 1% significance level. Data in brackets demonstrate the t-statistics of the coefficients.
Table 6. Real efficiency of Chinese MRBC green transformation from 2008 to 2017.
RegionCity2008200920102011201220132014201520162017Average
Eastern RegionXuzhou 0.9540.8020.5350.5260.8320.6920.7790.7200.7600.4620.706
Suqian 0.9570.9470.8350.8140.8560.7960.6840.9030.9360.7590.849
Zhangjiakou 0.9860.9460.9360.8880.9320.8970.9080.9400.9390.9730.935
Chengteh0.9820.9090.8600.9940.8870.8240.8570.8930.88010.909
Tangshan 1110.8110.8180.8630.8820.8640.9130.9210.907
Xingtai 10.9390.8840.8940.9630.9930.9210.984110.958
Handan 0.9670.9450.7650.8610.9160.8440.7190.8460.9540.8980.872
Huzhou 1111110.9941110.999
Nanping 1111110.9740.9670.9950.9890.993
Sanming 11111111111
Longyan 0.9871110.9890.9820.9410.9850.9810.9700.984
Dongying 0.92410.8400.8950.8260.9210.92410.920.9650.922
Zibo 0.9430.8380.9210.7190.6910.8510.8770.8840.9420.8920.856
Lingyi 0.8750.7940.7440.741110.7740.6650.7220.7950.811
Zaozhuang 0.9220.8310.8300.8020.7000.7810.7980.7850.8590.7970.811
Jining 0.8770.7380.9150.8660.8210.8550.7080.8190.8140.7830.820
Tai’an 0.8920.9150.8430.7570.7700.7590.7720.8380.8010.8360.818
Laiwu 11111111111
Shaoguan 0.9410.93910.9790.9980.9330.8870.8730.9110.9300.939
Yunfu 1111110.98110.9560.9290.987
Central RegionDatong0.8470.8560.8780.9380.8650.8060.9020.9880.9420.8800.890
Shuozhou 111110.9810.9951110.998
Yangquan 11111111111
Changzhi 0.9700.8920.9470.9680.9620.9190.9570.9540.9520.9830.950
Jincheng 0.9850.9340.99110.9950.9740.9950.9370.97410.979
Xinzhou 11110.9790.98810.9670.99610.993
Jinzhou 0.9990.9880.9960.9300.9790.9810.96710.9870.9790.981
Linfen 110.9880.9770.9400.9300.9600.9440.98510.972
Yuncheng 0.9850.94010.9980.9310.9450.9710.9790.9430.9840.968
Lvliang 10.9301110.9660.9790.9320.93010.974
Suzhou0.95510.9870.9910.9730.9500.9320.9240.9730.9470.963
Huaibei 10.998110.992110.9760.9890.9770.993
Bozhou 11110.9920.9550.9370.9410.9550.9550.974
Huainan 10.99910.9960.9600.9490.9930.9910.9740.9450.981
Chuzhou 0.9090.9290.9050.9330.9020.9320.8590.8410.9150.9490.907
Ma’anshan1110.9750.9780.9380.9340.9690.93010.972
Tongling 1111111110.9870.999
Chizhou 11111111111
Xuancheng 11110.9680.9360.9250.9550.9290.9880.970
Jingdezhen 110.98011111110.998
Xinyu 0.9841110.998111110.998
Pingxiang 11111111111
Ganzhou0.7530.8780.9290.7150.8090.7610.6570.78010.6840.797
Yichun 0.9880.97910.8930.9800.87910.9690.97010.966
Sanmenxia 0.9920.98810.9680.9700.98910.9870.97910.987
Luoyang 0.8790.9430.8810.7960.8590.9460.7360.7590.8880.7600.845
Jiaozuo 0.9490.97510.9540.9830.9340.9710.9880.9860.9640.970
Hebi 11111111111
Puyang 0.9960.98310.9440.9930.9790.977110.9560.983
Pingdingshan 0.9840.9760.9810.8900.9670.9570.9450.9320.9580.9840.957
Nanyang 0.84410.8960.8470.77010.8350.8840.7940.7390.861
Ezhou11111111111
Huangshi 10.9910.9960.9730.9570.98210.9780.9690.9850.983
Hengyang 0.8870.9070.8570.8890.8970.7370.86710.9410.9110.889
Chenzhou 0.9120.94110.9140.9580.9440.8450.8940.9380.8830.923
Shaoyang 110.9530.850.9190.9530.8880.9470.9460.8930.935
Loudi 10.9500.9950.8590.8420.9950.9830.9860.98910.960
Northeastern RegionFuxin 10.96510.9150.9690.9600.9031110.971
Fushun 0.8750.9400.8460.9010.7990.8810.8880.941110.907
Benxi 0.96410.9420.9060.9080.9360.94610.97410.958
Anshan 10.8880.7000.8600.7960.880.910.9250.8950.9470.880
Panjin 1111110.973110.9850.996
Huludao 0.9570.9480.8940.9580.8630.9670.9561110.954
Daqing 0.7830.87110.9530.8960.7930.9930.93910.9690.920
Hegang 10.959110.997111110.996
Shuangyashan 111111110.96210.996
Qitaihe11111111111
Jixi 1111111110.9740.997
Songyuan 11110.99510.9581110.995
Liaoyuan 11111111111
Tonghua10.992110.98710.9541110.993
Western RegionBaotou0.8920.8440.88811110.9260.9130.9030.937
Wuhai11111111111
Chifeng0.9380.9490.9360.9630.8850.8500.9100.9420.8750.8910.914
Hulunbuir 11110.9970.9490.9990.9960.9370.9720.985
Erdos 11110.9360.8471110.9770.976
Baise 0.9550.9480.9830.9930.9990.9620.9440.9510.9270.9690.963
Hechi10.9560.97011111110.993
Hezhou1110.998111110.9750.997
Yan’an 11111111111
Tongchuan 11111111111
Weinan 0.9300.9870.9780.9250.9390.9570.9300.9750.9770.9910.959
Xianyang 0.9270.9250.9450.8720.94710.8840.98510.9950.948
Baoji 0.9790.9130.9540.9780.9170.9620.83910.8800.8600.928
Yulin 0.8900.89510.9740.993110.9690.9650.9350.962
Jinchang 11111111111
Baiyin 0.9870.9370.9860.9850.98210.9940.98210.9720.983
Wuwei 1110.9901111110.999
Zhangye 110.99511111110.999
Qingyang 11111111111
Pingliang0.96410.9850.9651111110.991
Longnan 11111111111
Shizuishan 11111111111
Guangyuan 1110.9330.9650.9530.95010.96010.976
Nanchong 0.7450.8040.8590.7400.8210.7400.8500.7980.8650.7550.798
Guang’an 1110.9900.9970.9590.9790.9800.9670.9620.983
Zigong 11110.9500.90110.9560.9780.9210.971
Luzhou0.9710.9190.9600.8180.9190.8440.8590.8320.8210.8470.879
Panzhihua0.9590.90110.9900.9980.9710.9911110.981
Dazhou 0.9450.99410.93410.9290.9440.9730.9620.9930.967
Ya’an 11111111111
Qujing 0.9650.8190.9440.9280.9180.9440.9180.960110.940
Baoshan 11111111111
Zhaotong111110.954110.9530.9580.987
Pu’er 0.98910.9890.9540.971111110.990
Lincang 11111111111
Liupanshui 10.914111110.9490.9800.9130.976
Anshun0.98810.98411110.867110.984
Bijie 0.93510.8720.8480.91510.9131110.948
Karamay 11111111111
Average 0.9690.9620.9610.9460.9510.9490.9430.9570.9620.9540.955
Publisher’s Note: MDPI stays neutral with regard to jurisdictional claims in published maps and institutional affiliations.

