Efficiency in the Holiday and Other Short-Stay Accommodation Industry


Department of Business and Accounting, Faculty of Economics and Management, UNED (National Distance Education University), 28040 Madrid, Spain
*
Author to whom correspondence should be addressed.
Sustainability 2020, 12(22), 9493; https://0-doi-org.brum.beds.ac.uk/10.3390/su12229493
Submission received: 30 September 2020
/
Revised: 7 November 2020
/
Accepted: 12 November 2020
/
Published: 15 November 2020
(This article belongs to the Special Issue Tourism, Economic Growth and Sustainability)
Abstract
:This study extends previous empirical efficiency research by focusing on a tourism sector which has limited evidence to date: the holiday and other short-stay accommodation industry (tourist apartments and hostels). The sample comprises 12,864 firm-level observations during the period 2005–2016. First, we calculate the efficiency index using a non-radial Data Envelopment Analysis (DEA). Second, we test the association between efficiency index and contextual factors using both Tobit and bootstrapped regression. Another major contribution is the use of a radial DEA model to confirm the results of the study. The current study offers new insights by focusing on an industry with scarce evidence, using radial and non-radial DEA approaches, and examining a wide variety of efficiency drivers. The efficiency results are examined by year, region and tourist destination type (including tourism dimensions such as rural, cultural and wine tourism). This is an important novelty of the study. The main findings reveal that the most efficient tourism destinations correspond to mixed or diversified destinations: those that combine some dimensions such as cultural, rural and wine tourism. The regressions models show that environmental, macroeconomic and business variables are drivers of tourism competitiveness. Taken together, the study goes a step further in the efficiency field.
1. Introduction
Sustainable tourism development requires a balance between several dimensions—environmental, economic, and socio-cultural—as well as the participation of all the agents and actors (governments, business and stakeholders) to achieve long-term sustainability. In terms of worldwide economies, most businesses have used linear production models based on production and consumption. These business models have negative impacts on the environment such as CO2 emissions, global warming, damage to natural and non-renewable resources, pollution, high energy resources and waste [1]. The environmental perspective requires that companies improve their production models, such as minimizing the consumption of resources in order to increase competitiveness with a focus on sustainability, and adopting new business models such as circular economy models [2,3,4].
The Global Sustainable Tourism Council (GSTC) proposes four main areas to promote sustainable business in the tourism industry: effective planning for sustainability, maximizing social and economic benefits for the local community, to promote cultural heritage, and to avoid negative impacts on the environment (GSCT, 2020). The criteria are established as minimum levels to achieve best practices in sustainable tourism, and these criteria are developed through a set of criteria, indicators and guidelines [5]. The analysis of business efficiency is reflected in the Sustainable Development Goals SDG (Goal 12—responsible production and consumption). The use of fewer inputs or resources to obtain a better efficiency with a sustainable perspective is crucial for future business models in tourism industry.
Efficiency is an economic concept related to the scarcity of available resources, which is susceptible to alternative uses. In the previous literature, efficiency has been linked to productive activity, by relating inputs or resources and outputs or production. However, the term business efficiency is more extensive than productive efficiency, and implies a relationship between inputs or economic resources, expressed both in physical and monetary units, and outputs expressed as economic results of the company, both in physical units and monetary value (income, costs, benefits, etc.). Furthermore, the efficiency index is a relative index: a company or decision-making unit is more or less efficient according to the sample of firms analyzed [6,7].
There is extensive efficiency research on the hotel industry focusing on how well firms manage their resources. In the last decade, the academic literature has made notable progress in overcoming the main weaknesses of early efficiency studies, mostly related to scope (only one objective, efficiency measure), setting (a single city, region or destination), period (only one year), methodology (one-stage Data Envelopment Analysis (DEA) or performance models), sample size (small samples with few observations), available data (few variables selected for inputs and outputs as well as potential drivers of efficiency) and industries (most empirical tourism research examines hotel firms).
Our study aims to contribute to the substantial efficiency literature in several ways. The study offers evidence on a tourism sector that has not been widely explored to date: holiday and other short-stay accommodation (the classification includes the provision of accommodation, typically on a daily or weekly basis, principally for short stays by visitors, in a self-contained space consisting of complete furnished rooms or areas for living/dining and sleeping, with cooking facilities or fully equipped kitchens. This may take the form of apartments in small, free-standing, multi-storey buildings or clusters, single-storey bungalows, chalets, cottages and cabins). The evidence on new industries responds to recent calls for research on new contexts and industries [8]. To overcome the problem of micro-samples and cross-sectional data, the study uses 12,864 firm-level observations during the period 2005–2016. We used radial and non-radial DEA models to assess tourism firm efficiency. The non-parametric frontier analysis DEA covers a large set of theoretical and empirical tourism research papers based on the original Farrell model [9] to measure efficiency. In fact, DEA is a nonparametric technique for frontier analysis that has been widely used to measure efficiency in tourism firms by means of a comparative synthetic index [10,11,12,13,14].
The results of the study are analysed by year, regional location and destination type. The analysis by year allows us to understand the evolution of the efficiency over the period (it should be noted that the period includes the pre-2008 financial crisis years, the years affected by the 2008 financial crisis and post-2008 financial crisis years). It is also interesting to show the results by regional location because most related empirical studies find that location is a source of competitive advantage for tourism firms and the tourist accommodation sector [10,15,16,17,18].
The current study also proposes a range of tourist destination dimensions in order to better analyse the efficiency of the industry. Our paper is the first to examine a wide variety of destination types (diversified and non-diversified tourism), thereby contributing new insights to the existing literature. The results of this research are particularly interesting in terms of the tourist non-diversified destinations: (i) sun-and-sea, (ii) cultural, and (iii) rural tourism, as well as diversified/mixed destinations that combine dimensions, such as (i) cultural and sea tourism; (ii) cultural and rural tourism; (iii) sea and rural tourism; (iv) snow and mountain tourism; (v) wine and rural tourism.
Another interesting question concerns the factors that boost efficiency. The short-stay accommodation industry is a subsector with a clear prevalence of micro-firms (fewer than 10 persons employed). Micro-firm characteristics such as governance, ownership, agency problems, strategies and access to external funds, differ from large firms. Traditional drivers of efficiency in the hotel industry (size, location, tourist attraction) and ongoing drivers proposed by the recent literature (environmental variables and other business factors) can show similar behaviours in the holiday and short-stay accommodation industry or a different picture. To explore this issue, we run both Tobit regressions and bootstrapped regressions to test the association among efficiency scores and business, environmental and macroeconomic variables. Specifically, the current study examines factors such as firm size, legal form, leverage, cash flow, 2008 financial crisis, tourist arrivals, overnight stays and average stay.
Finally, given recent calls for robust research applying methodological advances, we use an additional DEA model to assess efficiency and its potential drivers. That is, we combine more advanced methods such as the non-radial with radial DEA models to confirm the previous results. By using several DEA approaches, the study provides further evidence and contributes to a better understanding of efficient firm management as well as confirming the drivers of that efficiency.
The dynamic efficiency results confirm the impact of the financial crisis (2008–2011) on tourism firms. The results also indicate that firms geographically located in diversified destinations that combine cultural and rural dimensions (cultural and sea tourism, cultural and rural tourism, sea and rural tourism, snow and mountain tourism, and wine and rural tourism) perform better than those located in non-diversified destinations such as: (i) only sun-and-sea tourism, (ii) only cultural tourism, and (iii) only rural tourism. Considering regional efficiency, the most efficient firms are located in the Basque country, Catalonia, La Rioja, Madrid and the Canary Islands.
The results also show that factors such as legal form, cash flow, tourist arrivals, overnight stays and average stay are positive and significantly associated with efficiency score, whereas factors such as the 2008 financial crisis, firm size and leverage are negative and significantly associated with efficiency score. However, the variable legal form needs further examination in future research, as most of the firms in the sample belong to the same category. It should be also noted that the most representative firm size segment is micro-firms. The evidence shows that the highest levels of efficiency are achieved by micro-firms and large firms. Furthermore, the Tobit and bootstrap regressions also confirm the association between the efficiency score and firm determinants: business, environmental and macroeconomic variables.
A novel contribution of this study to the previous literature is the industry under analysis—short-stay tourist accommodation—in conjunction with the segmentation by tourist destinations associated with the firms’ geographical locations (diversified and non-diversified tourism; including some tourism dimensions such as rural, cultural and wine tourism), as well as the application of several methodologies and sensitivity analyses to confirm the results. This study provides important evidence for decision-makers, entrepreneurs and tourism policymakers seeking to define the behaviour of the most efficient companies by regions and tourist destinations. It also confirms that the diversification of the tourist destinations based on cultural and rural tourism dimensions is a useful strategy for improving economic growth, competitiveness and tourist firms’ performance.
The rest of the paper is structured as follows: the next section reviews the existing literature. Section 3 explains the methodology, business, macroeconomics and environmental variables used in the empirical analysis, as well as the sample and descriptive statistics for all the models. Section 4 presents the empirical results and includes supplemental analyses. Section 5 and Section 6 present the discussion and the conclusions, and finally the last section focuses on the limitations and future developments.
2. Literature Review
A matter of considerable interest in production theory and tourism growth is the assessment of performance and efficiency. The main body of the tourism and efficiency literature [13,17,18,19,20,21,22,23,24,25,26,27] has primarily applied non-parametric frontier analysis methodologies such as the DEA model to evaluate the competitiveness and efficiency of firms. This methodology allows the researcher to estimate a synthetic index through a set of input and output variables, and with several DEA model specifications.
Liu et al. [28] review the main areas for the application of DEA in recent years and point out that the “two-stage contextual factor evaluation framework” is the prevailing trend. In the tourism industry, location has been considered a key factor for boosting economic growth, competitiveness and efficiency. There is extensive research focusing on location as source of competitive advantage for tourism firms.
Previous studies have analyzed the tourist destination variables as a factor linked to geographical location. For example, Botti et al. [29] compare the competitiveness of tourist destinations considering 22 French regions. The study focuses on regional performance from a geographical perspective. Their model identifies the best regional practices as well as the possibility of improving efficiency in the 12 regions analysed. Ben Aissa and Goaied [13] focus on the competitiveness of Tunisian tourist destinations from a regional perspective, and the influence of macroeconomic variables, namely, investment, economic circumstances, number of travel agents and worker skills. Other studies analyse economic growth, competitiveness and regional efficiency focusing on cultural tourism [30]; specifically, such studies aim to link cultural resources and tourist demand, by including a production function and the region’s available cultural resources.
More recent studies assess the impact of tourist destination on firm efficiency, focusing on tourist location. Lado-Sestayo and Fernández-Castro [24] classify the location at the tourist destination level instead of tourist regions. Our research expands on the previous literature focusing on tourist destination variables by including geographical location (regional location) and tourist destinations type: non-diversified destinations such as (i) sun-and-sea tourism, (ii) rural tourism, and (iii) cultural tourism), and diversified tourism destinations (based on several tourism dimensions such as rural, cultural and wine tourism): (i) cultural and sea tourism; (ii) cultural and rural tourism; (iii) sea and rural tourism; (iv) snow and mountain tourism; (v) wine and rural tourism. The empirical literature has also tested the relationship between firm efficiency and a wide range of business variables such as firm size [8,10,17,20,21,31], management styles and ownership types [12,16,17,20,31,32], type of service [8], firm age [16,20], professional specialization [33], and corporate governance variables [34,35], among others.
For example, Barros [10] found evidence that firm size and location are positively associated with firm efficiency in a sample of Portuguese hotels. Barros and Dieke [32] examined the efficiency of 12 Luanda hotels for the years 2000–2006. In a second stage, they ran a bootstrap regression to test the relationship between hotel efficiency and market share, hotels belonging to a commercial group and hotels with an international expansion strategy. Shang et al. [16] examined the efficiency in international tourist hotels in Taiwan and the efficiency drivers using Tobit regressions and bootstrap regressions. The results indicate that firm efficiency is influenced by location (they compare resort hotels and metropolitan area hotels) and firm age. Conversely, management style and e-commerce are not associated with firm efficiency. Parte and Alberca [12] show that market conditions and business factors such as ownership structure and audit variables are associated with efficiency scores.
Assaf and Agbola [20] examined technical efficiency in Australian hotels during the period 2004–2007 using a DEA double bootstrap approach. They found that location, firm size, star rating and age are drivers of greater efficiency. In another paper, Assaf et al. [17] evaluated firm-level determinants of efficiency in 78 Taiwanese hotels during the period from 2004 to 2008 using a bootstrap model. The results reveal that firm size, type of organization (chain or independent hotels), and the type of tourist (international tourist class or tourist class hotels) are positively associated with firm efficiency. Moreover, Assaf and Tsionas [8] examined 613 hotels operating in different locations worldwide and found that location (urban, airport, suburban, interstate, small metro/town and resort) and type of service (full vs. limited) are drivers of firm efficiency. Regarding firm size, the study shows that this factor is not important in boosting firm efficiency.
Regional-level efficiency analysis has also attracted the attention of academia [22,24,25,26,29,36,37,38]. Generally, prior studies use DEA methodology to measure efficiency in a first stage, and Tobit or bootstrap models to test the association between the efficiency level and its potential determinants in a second stage. For example, Botti et al. [29] examined regional efficiency in France and found that the number of tourists is a driver of efficiency. Barros et al. [36] also focused on regional efficiency in France, showing in the second-stage analysis that efficiency scores are associated with the number of monuments, number of museums, number of theme parks, kilometres of beaches, presence of ski resorts, and presence of natural parks. Huang et al. [37] examined the Chinese industry and included factors such as the richness of tourism resources, international tourism attractiveness (ratio of inbound arrivals to total inbound arrivals in China), education (proportion of urban employees with senior high school education or higher), payment levels of employees, market competition and regional trade openness.
Focusing on the hotel industry in Spain, Solana-Ibáñez et al. [22] examined variables such as coastal destination, number of cultural sites, number of museums and collections, meeting attendance, number of federated golf clubs, number of restaurants and number of retailers. To obtain robust results, they used two-stage double bootstrap DEA. Sellers-Rubio and Casado-Díaz [25] find that the length of stay and tourist arrivals are strong drivers of firm efficiency. Lado-Sestayo and Fernández-Castro [24] used a sample of 400 hotels in 97 tourist destinations in Spain. In the second stage, they included factors related to destination (accessibility, population density, market concentration, occupancy, demand and seasonality) and management factors (size, market orientation or meeting space capacity, market share, number of stars, management agreements and distance to the tourist destination). The results show the importance of tourist destination variables for firm efficiency.
Yang et al. [38] focused on regional efficiency in the Chinese hotel industry using a super-efficiency slack-based measure in DEA. The findings suggest that room price and occupancy rate are the main determinants of firm efficiency. Chaabouni [26] examined 31 Chinese provinces during the period 2008–2013 using a two-stage double bootstrap approach. He found that trade openness, climate change and the intensity of market competition all boost tourism efficiency. To gain an understanding of the potential determinants of hotel performance, Assaf et al. [17] conducted an extended analysis with more than 20 variables. The results show that the quality of the educational system, government support, disposable income, and number of international arrivals to a tourism destination are key factors in firm performance.
In terms of sustainability, Kularatne et al. [26] focused on the efficiency in hotels environmentally sustainable in Sri Lanka for the period 2010–2014. The eco-friendly practices were measured through three variables: energy-saving, water-saving and waste management practices. The evidence shows that hotels that are environmentally responsible in terms of improving energy competitiveness and waste management achieve more efficiency compared to the remaining hotels. In contrast, water consumption does not present the result expected. Radovanov et al. [4] evaluated the sustainable tourism development efficiency, using a DEA model in a sample of 27 EU countries and five Western Balkan countries over the period from 2011 to 2017. The results show a positive and significant association between tourism efficiency and factors such as sustainability of tourism development, share of GDP and tourist arrivals and inbound receipts. In contrast, government expenditure on tourism is negatively and significantly associated with tourism efficiency.
The review of the literature points to the remarkable progress made in the study of efficiency determinants over the last decade; however, there are still calls in academia for a better understanding of efficiency determinants [33,38,39]. Yang et al. [38] argue that it is crucial to introduce industry factors as well as local factors in the evaluation of efficiency.
It is important to highlight that the related tourism research has primarily focused on hotel firms, with little evidence reported for other subsectors such as the holiday and short-stay accommodation industry. To fill this gap, this study provides empirical evidence to contribute to a better understanding of this subsector. Moreover, this study deals with the efficiency of tourist destinations competitiveness, combining several dimensions such as geographical location and diversification level of tourism destination based on some tourism dimensions such as rural, cultural and wine tourism. These classifications and segmentations have not been analysed in previous efficiency studies.
3. Materials and Methods
3.1. Research Design and General Description of Methods
In this paper, we estimate the economic efficiency of the holiday and other short-stay accommodation firms (tourist apartments and hostels) at firm level during the period 2005–2016, and we examine the association between a set of variables (environmental variables, business variables and macroeconomic factors) and the efficiency scores. Our empirical part is divided in two steps: the first stage is the efficiency estimation of tourist apartments and hostels with non-radial DEA methodology (Section 3.2). We also apply the Mann–Whitney U test and the Kruskal Wallis test to show if there are statistically significant differences in efficiency score by year, region and tourist destination.
The second stage focuses on examining the influence of a set of factors on efficiency scores (Section 3.3). We use correlation analysis, non-parametric tests (the Mann–Whitney U test and the Kruskal Wallis test) and multivariate models such as Tobit and bootstrapped regressions. Finally, given recent calls for robust research applying methodological advances, the second stage concludes with a Robustness analysis. We use an additional DEA radial model to assess efficiency and both Tobit and bootstrapped regressions to confirm the influence of environmental, business and macroeconomic variables (or potential drivers) on efficiency scores. By using several DEA approaches, the study provides further evidence and contributes to a better understanding of efficient firm management as well as confirming the drivers or factors that influence firm efficiency.
3.2. Efficiency Analysis of Short-Stay Accommodation Industry
Efficiency evaluation is important for business and Data Envelopment Analysis (DEA) is an excellent tool to measure the relative efficiency of production units [38]. DEA is a non-parametric methodology that uses mathematical programming to define the production frontier based on the set of production possibilities, and assesses the efficiency of production units in relation to the best practices. Similar to the classical production function, it is based on the concept of efficiency when comparing outputs or results with inputs or productive resources. However, unlike the production function that assumes specific functional forms, DEA is estimated using the information on the units evaluated in the period [31].
Since this methodology was initially used by Charnes et al. [40], to date, a large number of articles with theoretical contributions and empirical applications have been published. Cooper et al. [6] can be considered a reference for methodological issues. A more detailed review of the extensive literature on DEA can be found in Emrouznejad and Yang [41]. One of its main advantages is flexibility, however it has some disadvantages, such as the homogeneity of the units or firms analysed. This means that the production units evaluated use the same production factors to produce goods or provide services [6].
Consider that the efficient frontier is specified with the reference point of the best observations. Then, DMUs on the efficient frontier are relatively efficient but DMUs outside the frontier are relatively inefficient [42].
DEA methodology entails the use of a number of linear programs to construct a piecewise linear production frontier in order to define an efficiency index relative to that frontier. DEA is a non-parametric frontier estimation approach and a mathematical optimization tool that can be used to determine the efficiency of each tourism firm by maximizing the ratio of the weighted sum of its outputs to the weighted sum of its inputs. In the case of a production process employing “m” inputs and producing “s” outputs
where Eo is the relative efficiency of the unit “O”; Ur is the weight on the output r; Vi is the weight on the input i; X = vector of inputs = (X1, X2, X3, ……, Xm); Y = vector of outputs = (Y1, Y2, Y3, ……, Ys).
The first methodological stage is estimated by Data Envelopment Analysis (DEA) to account the economic efficiency of the holiday and other short-stay accommodation industry (tourist apartments and hostels). We apply a max-average DEA model or non-radial model (Färe-Lovell or Russell measure) that determines the maximum relative improvements as a ratio of the average relative input consumption to the average relative output production (reduction in input/increase in output as a percentage of the current level). The model is an extension of the additive DEA model: max-average DEA is an indicator of Koopmans’ efficiency for positive data, unlike the additive DEA model, which quantifies the absolute measure as a sum of slacks. Although the max-average DEA indicator does not allow the direct interpretation of prices, it is also invariant to changes in the units of measurement [43]. Unlike additive models, max-average DEA models are unit invariant, but not translation invariant [44]. The input-oriented non-radial DEA model is formulated as follows:
The estimated non-radial DEA model uses total revenues and sales as the output variables and capital, labour and materials as input variables. Given that the output variables should reflect the firm’s goals or objectives [45], total revenues and sales have frequently been included in previous studies as output variables [10,19,21,23,24,37]. On the other hand, capital, labour and materials are typically considered as input variables. In this study, we take operational costs as material input, total assets as capital input, number of employees as labour input and labour costs as an indicator of labour quality.
3.3. The Influence of Environmental Variables, Business Variables and Macroeconomic Factors on Efficiency Scores
The analysis of the influence of environmental variables, business variables and macroeconomic factors on efficiency scores is key for several reasons. Firstly, the identification of firm-level efficiency determinants has emerged as one of the main branches of efficiency research [28]. Secondly, the decision-making implications for practitioners and entrepreneurs may explain the importance of advances in this specific branch. Some examples in the hotel industry are the papers by Assaf et al. [17], Shang et al. [16], Seller-Rubio and Casado Díaz [25], Barros and Dieke [32], Barros et al. [36] and Huang et al. [37]. In terms of methodology, most DEA research uses the Tobit and bootstrap procedure suggested by Simar and Wilson [46,47]. Based on previous empirical studies, in this methodological stage we use correlation analysis, non-parametric test (the Mann–Whitney U test and the Kruskal Wallis test); and multivariate models as Tobit and bootstrapped regressions. The second methodological stage includes eight variables: firm size, legal form, cash flow and leverage as business variables; financial crisis as macroeconomic factor; and tourist arrivals, overnight stays and average stay as environmental variables.
- Size
Most related empirical studies find that size is associated with hotel efficiency [10,17,20,31]. Several studies show that large firms achieve better levels of hotel efficiency for a sample of Australian hotels during the period 2004–2007 [20] and for a sample of Taiwanese hotels during the period 2004–2008 [17]. In a recent study, Assaf and Tsionas [8] also conclude that large firms achieve better efficiency than small firms, using a sample of hotel firms operating in different geographical locations. However, Jauhari and Sanjeev [19], for a sample of 68 Indian hotels, found that the smallest firms and the largest firms are more efficient.
The current paper examines efficiency in a setting characterized by very small firms. Consequently, prior empirical evidence on hotel firms may differ from the findings for the holiday and short-stay accommodation industry, due to the absence of large firms acting as a leader and a benchmark in the latter. We predict that firm size influences firm efficiency, but the sign may be positive or negative. To account for firm size, we used a dummy variable with four levels: 1 for firms with fewer than 5 employees; 2 for firms with between 5 and 9 employees; 3 for firms with between 10 and 19 employees; and 4 for firms with more than 20 employees. It should be noted that we did not follow the conventional classification of firm size because our sample does not include large firms. In a robustness analysis, we introduced additional classifications into smaller segments to assess the effect of firm size on efficiency;
- Legal form
Scholars have paid relatively little attention to the effect of legal form on firm efficiency. One exception is the paper by Yu and Ramanathan [48]. They evaluated the efficiency of 41 UK retail companies during the periods 2000 and 2005 using DEA methodology. In a second step, they ran Tobit and bootstrapped regressions to find evidence on firm-level efficiency determinants and competitiveness. Their findings show that efficiency scores are positively associated with the type of ownership, legal form and retail characteristics. The current study includes the legal form variable defined as 1 for UTES, 2 for Public Limited Company (PLC), 3 for Limited Liability Company (LLC), 4 for Foreign Entities, 5 for Permanent Establishments owned by non-resident entities and 6 for Others;
- Financial variables
In terms of financial variables, several studies have examined the effect of leverage, cash flow and financial variables on firm performance and bankruptcy. Following Jang and Park’s review [49], the bankruptcy aspect deals with the factors that most strongly predict a firm’s failure. The prior financial literature concludes that higher leverage and lower levels of cash flow are associated with negative firm performance and a higher probability of bankruptcy [50,51,52,53]. Consequently, the operational cash flow and financial leverage are key elements to examine the variability in profitability and firm performance. Based on previous tourism studies, we predict a positive association between cash flow and efficiency scores, and a negative association between leverage and efficiency scores. The cash flow variable is measured as the ratio of cash flow to total assets, and the leverage variable is measured as the ratio of long-term debt to total assets;
- 2008 Financial crisis
The current study analyses efficiency over a long period, which includes the pre-2008 financial crisis period, years affected by the 2008 financial crisis and post-2008 financial crisis years. Consequently, we incorporate an independent variable capturing the years affected by the 2008 financial crisis. We expect a negative association between the 2008 financial crisis and the efficiency scores. Many economists have pointed out that the effects of the financial crisis become apparent on balance sheets and income statements from 2008 on. Thus, we defined the variable financial crisis as a dummy that takes the value of 1 for the years 2008–2011 and 0 otherwise;
- Environmental variables
Several studies show that higher numbers of tourist arrivals (national and international) are linked to greater efficiency in the tourism industry [8,17,20,25,37,44,53]. Assaf et al. [17] found that the number of international tourists is a strong driver of firm performance. Chen [34] analysed the impact of economy and tourism growth in Taiwan hotel industry in the period 1997–2008 and shows that international tourist arrivals is a strong determinant of financial performance. Huang et al. [37] examined regional efficiency in China and found that international tourism attractiveness in a region (measured as the ratio of inbound arrivals received by a particular region to the total inbound arrivals to China) are positively associated with the technical efficiency of regional hotel sectors. Sellers-Rubio and Casado-Díaz [25] also found a positive relationship between international tourist arrivals and efficiency scores in the Spanish hotel industry.
Parte and Alberca [12] found that tourist arrivals and overnight stays are positively associated with firm efficiency in a sample of Spanish hotels during the period 2001–2010. Seller-Rubio and Casado-Díaz [25] also found a positive association between length of stay and efficiency scores in the hotel industry, using a two-stage double-bootstrap DEA approach. Lado-Sestayo and Fernández-Castro [24] apply a four-stage DEA to a sample of 400 Spanish hotels in the year 2011 to analyze the impact of tourist destination on firm efficiency. The authors include variables such as occupancy level, population density, market concentration and demand level. They conclude that the main variables that boost efficiency are occupancy level, degree of seasonality and market concentration.
Based on previous studies in this field, we included three environmental variables: tourist arrivals, overnight stays and average stay. We expected a positive association between these variables and efficiency scores. The variable tourist arrivals are defined as the ratio of inbound arrivals received by a particular region to the total inbound arrivals to Spain. The variable overnight stays are defined as the ratio of overnight stays in a particular region to the total number of overnight stays in Spain. The variable average stay is the average number of days that tourists stay in each region.
3.4. Sample and Descriptive Statistics
The sample combines information on business variables available in the SABI database managed by Bureau van Dijk, and data on tourism flows from the Spanish Statistical Office (National Statistics Institute—INE). The final dataset contains 12,864 firm-level observations corresponding to National Classification of Economic Activities (CNAE) code 552, holiday and other short-stay accommodation, during the period 2005–2016.
Table 1 shows the descriptive statistics for the variables used in the first stage (the estimation of tourism firms’ efficiency). The financial variables for a large sample of tourism firms allow us to improve the estimation of non-radial DEA model in order to define the best-practice frontier where the most competitive, top-performing tourism firms are located [12,54]. The variable capturing tourism firms’ revenues and sales shows a positive evolution in the pre-2008 financial crisis period (2005–2007) and also in the post-2008 financial crisis period (2012–2016). However, it registers a decline during the years affected by the 2008 financial crisis (2008–2011).
Table 2, Table 3 and Table 4 show the descriptive statistics for the variables used in the second stage (variables that could influence on firm efficiency or potential efficiency drivers): size, legal form, 2008 financial crisis, cash flow and leverage, and environmental variables such as arrivals, overnight stays and average stay. The descriptive statistics in Table 2 shows that 59.27% of the sample of tourism firms have fewer than 4 employees, 18.11% of firms have between 5 and 9 employees, 12.03% have between 10 and 20 employees, and 10.60% have more than 20. That is, the industry has a high percentage of small businesses, with more than half the firms being micro-firms. Regarding the legal form, the majority of the firms are LLC firms (90%). Table 3 shows the descriptive statistics for the financial variables: the average cash flow is 0.041 and the average leverage is 0.304. Finally, Table 4 shows the descriptive statistics for environmental variables: tourist arrivals, overnight stays and average stay. The descriptive statistics for the tourism flow variables indicate regional differences: the Canary Islands and Balearic Islands achieve the first and second position, respectively, in terms of number of arrivals and overnight stays. On the other hand, Murcia, the Canary Islands and Valencia have longer average stays, with 9.077, 8.491 and 8.013 days, respectively.
4. Empirical Results
The empirical results of the first and the second methodological stages are shown in Section 4.1 and Section 4.2, respectively. Section 4.1 presents the first-stage results: the efficiency results of tourism firms (hostels and tourist apartments) by year, region and tourist destination. Section 4.2 presents the second stage results: the association between the efficiency scores and contextual factors (business, macroeconomic and environmental variables) using correlation analysis, non-parametric test (Mann–Whitney U test and Kruskal Wallis test), and multivariate models such as Tobit and bootstrapped regressions. The subsection concludes with a Robustness analysis.
4.1. First Stage Results: Dynamic Efficiency Results, Regional Efficiency Results and Efficiency Results by Tourist Destination
This section summarizes the efficiency results in relation to three dimensions: year, regional location and tourist destination (diversified and non-diversified).
- Efficiency results by year
The results of the efficiency index by year for tourism firms (Table 5 last row “Total”) reveal some variations over the period: in the pre-2008 financial crisis period (2005–2007) and the post-2008 financial crisis period (2012–2016), the efficiency indexes increase.
For example, in 2005, the efficiency index (Table 5, average efficiency on the last row “Total”) was 0.499 and the average efficiency in 2007 period was 0.544; however, in the years affected by the 2008 financial crisis (2008–2011) some variations in average efficiency are observed. On average, the highest levels of efficiency are registered in the years 2007, 2010 and 2014, and the lowest in 2008 and 2011 (Table 5, average efficiency on the last row “Total”). The Kruskal Wallis test (results not reported for brevity) shows statistically significant differences for the period analysed (p < 0.05).
- Efficiency results by tourist destination (diversified and non-diversified).
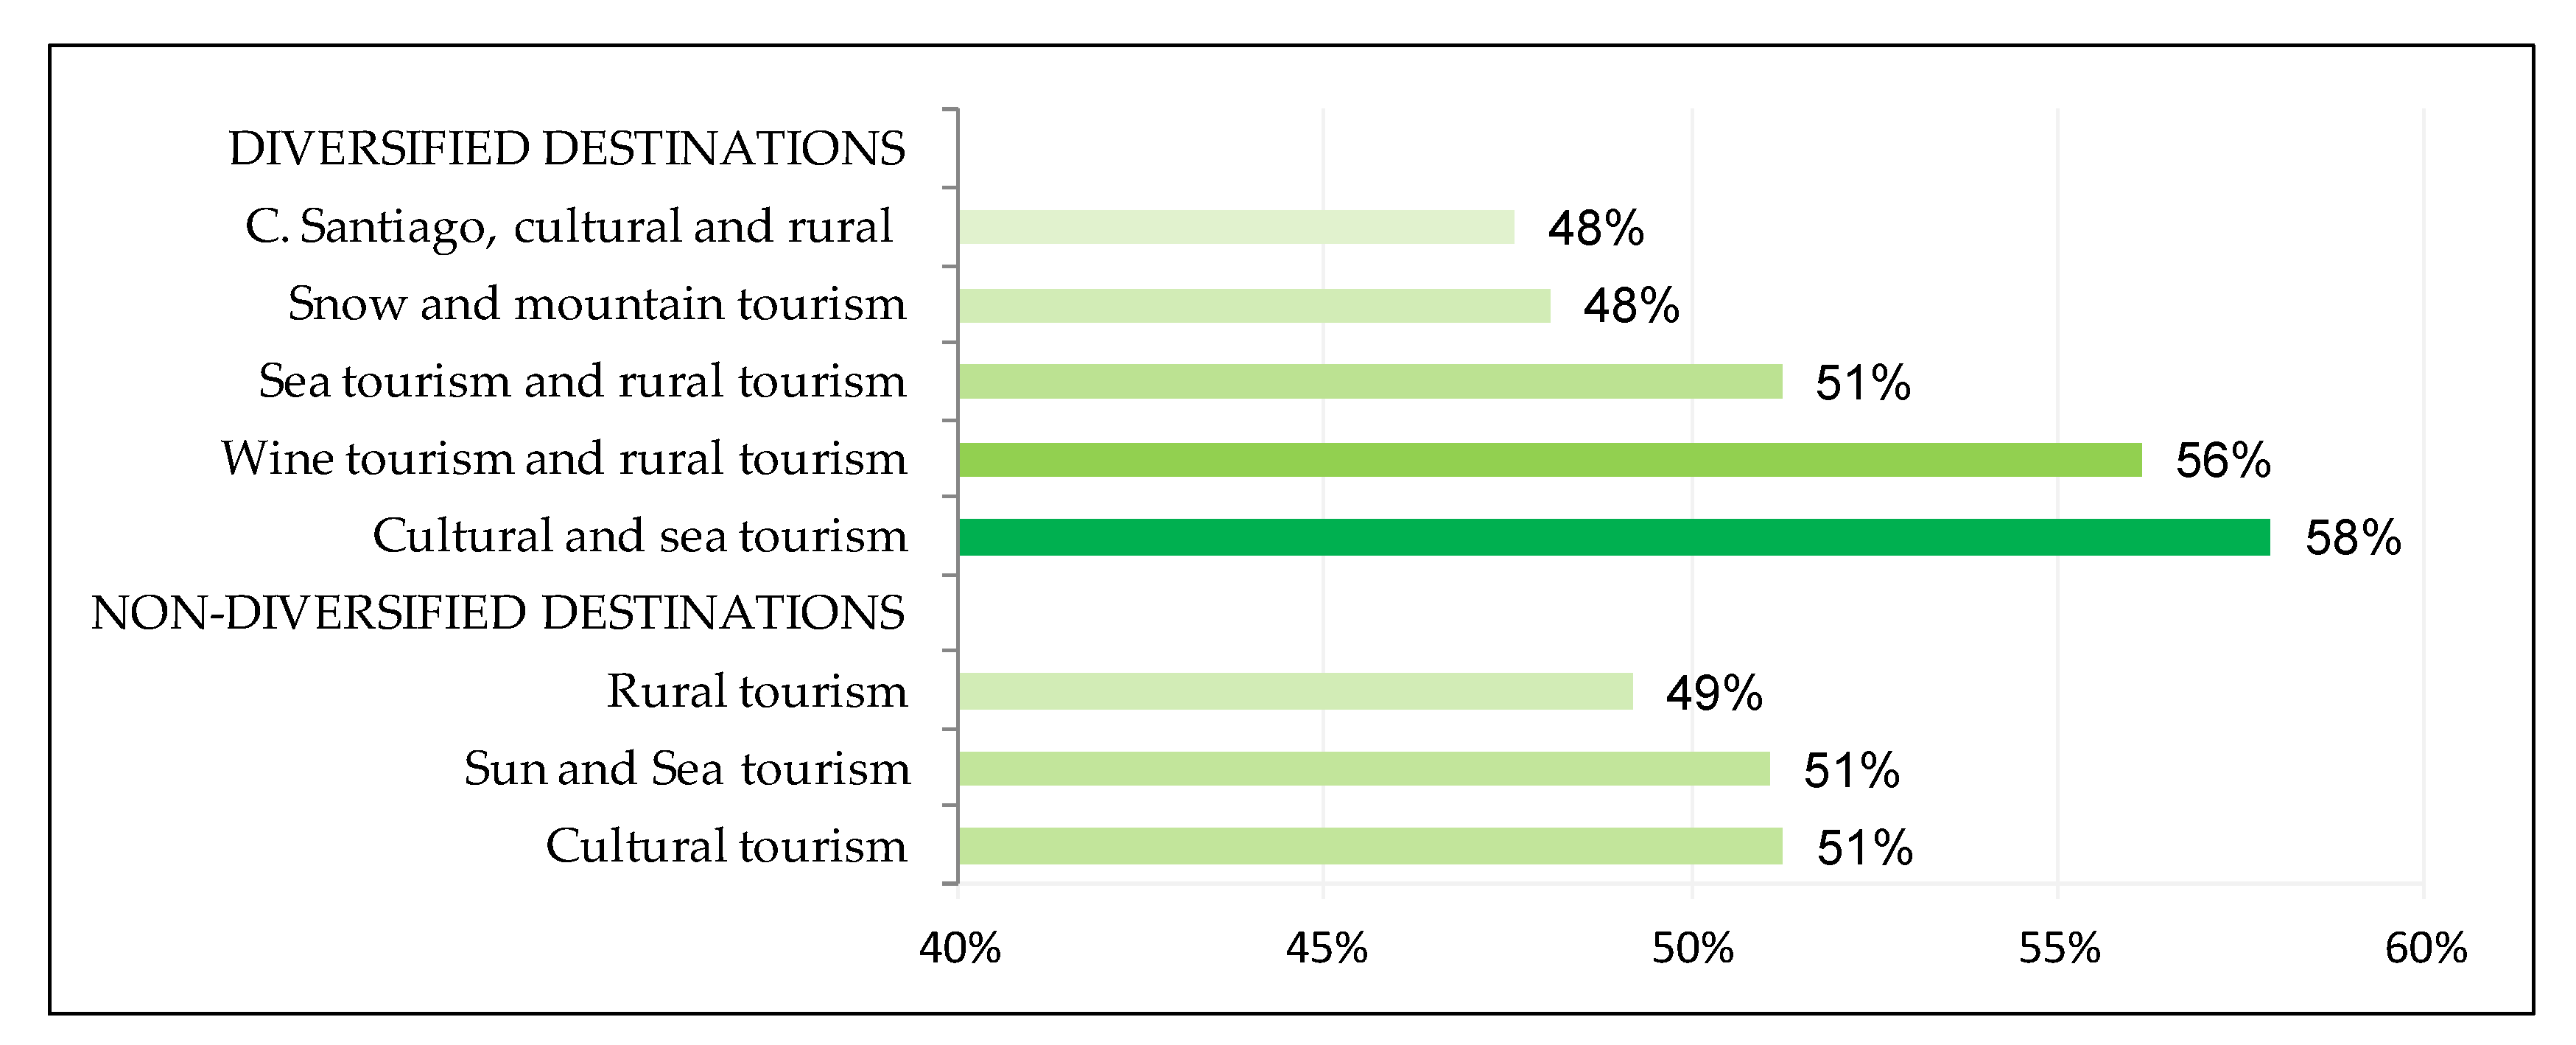
Figure 1 shows the tourist destinations according to two dimensions: non-diversified destinations (sun-and-sea tourism, rural tourism, and cultural tourism) and diversified destinations (specifically, cultural and sea tourism; Camino de Santiago, cultural and rural tourism; sea and rural tourism; snow and mountain tourism; and finally wine and rural tourism). The efficiency results by tourist destination types indicate that the most efficient tourism destinations correspond to mixed or diversified destinations based on some tourism dimensions such as rural, cultural and wine tourism; for example, those that combine cultural and sea dimensions, and those that combine the rural dimension with wine tourism. In contrast, the lowest ranked are the snow and mountain tourism destinations, and the Camino de Santiago, cultural and rural tourism destinations.
Table 6 shows the non-parametric analysis (Kruskal Wallis test and Mann–Whitney U test) to confirm the above efficiency results by tourist destination. The Kruskal Wallis test (Table 6) indicates statistically significant differences (p < 0.05) for the eight tourist destinations’ classification (sun and sea tourism, cultural tourism, rural tourism, snow and mountain tourism, Camino de Santiago, cultural and rural, cultural and sea tourism, wine tourism and rural tourism, sea tourism and rural tourism). The Mann–Whitney U test (Table 7) indicates statistically significant differences for diversified and non-diversified tourism destinations (p < 0.05).
The efficiency results (Table 7, column “Mean efficiency”) indicate that diversified destinations (efficiency mean score = 0.5269) perform better than non-diversified destinations on efficiency (mean score = 0.5037).
- Efficiency results by regional location
An important novelty of this study is that it expands the efficiency results by region, including the variable tourist destination type, which indicates the type of tourism associated with the geographical location of tourism firms. Most previous research in the field shows that hotel efficiency is strongly associated with geographical location [10,16,17,20,22,24,31]. In the empirical framework of this study, the regions registering the highest efficiency on average are the Basque country, Valencia, Catalonia, La Rioja and Madrid. In contrast, regions such as Extremadura occupy the bottom positions. The Kruskal Wallis test reveals statistically significant differences for regions (p < 0.05).
Figure 2 presents the efficiency results by regional location of tourism firms. When the results are analysed by regions and tourist destinations types, the Valencia, Catalonia, Asturias and Canary Islands achieve the top positions in non-diversified destinations such as sun-and-sea tourism; Madrid and Cantabria achieve high efficiency levels in cultural tourism. Conversely, the results by diversified destinations indicate that Basque country and Catalonia achieve the top positions in diversified destinations based on rural, cultural and wine tourism dimensions, for example, destinations that combines cultural and sea tourism, the Canary islands achieve high efficiency levels in destinations that combine sea and rural tourism, and La Rioja ranks top in wine and rural tourism.
4.2. Second Stage Results: The Influence of Contextual Factors (Environmental Variables, Business Variables and Macroeconomic Factors)
The second methodological stage focuses on the association between the efficiency scores and the influence of contextual factors (business, macroeconomic and environmental variables). Firstly, we use several statistics or exploratory test (Spearman’s rank correlation, Mann–Whitney U test and Kruskal Wallis test), and secondly we use more advanced multivariate models such as Tobit regression and bootstrapped regression. Specifically, in the second stage, we include eight factors in the exploratory test and the regression models to analyse the influence of contextual variables: the 2008 financial crisis as a macroeconomic factor, firm size, legal form, cash flow and leverage as business factors, and finally the arrivals of international tourist, overnight stays and average stay as environmental variables. Finally, we conclude the second methodological stage by using a VRS radial DEA model to confirm the above efficiency results and potential efficiency drivers.
- The Spearman’s rank correlation results, the Mann–Whitney U test results and the Kruskal Wallis test results
Firstly, the Table 8 presents the Spearman’s rank correlation. This correlation analysis helps to explore the association between the efficiency score and the contextual factors.
The correlation between efficiency score and environmental variables is positively and statistically significant: tourist arrivals (r = 0.023, p < 0.05), overnight stays (r = 0.026, p < 0.05), and average stay (r = 0.017, p < 0.05). Similar results have been found for hotel firms [11,12,24].
Table 8 also presents the correlation between efficiency scores and the macroeconomic factors (2008 financial crisis). This correlation is negative and statistically significant (r = −0.057, p < 0.005). Finally, regarding business variables (legal form, cash flow or CFO, size and leverage), Table 5 presents the correlation between efficiency score and business variables. The correlation between efficiency scores and legal form is positive and statistically significant (r = 0.116, p < 0.05), as well as the correlation between efficiency score and cash flow (r = 0.203, p < 0.05). In contrast, the efficiency score is negatively associated with size (r = −0.269, p < 0.05) and leverage (r = −0.153, p < 0.05). Previous empirical papers have also found that large firms do not always outperform second- and third-tier firms (see, for example [8,19]).
Additionally, we apply the Mann–Whitney U test and the Kruskal Wallis test (see Table A1, Appendix A) to show if there are differences in efficiency score by contextual factors. The Kruskal Wallis test shows statistically significant differences for size (p < 0.05) and legal form (p < 0.05) and the Mann–Whitney U test reveals statistically significant differences for financial crisis (p < 0.05). Regarding the size variable, the results show the highest efficiency for firms with fewer than five employees and firms with more than 20 employees. Considering the legal form, permanent establishments owned by non-resident entities and LLC achieve higher efficiency, on average, than other types of firms, such as foreign entities. Finally, the efficiency is lower, on average, during years affected by the 2008 financial crisis (2008–2011) than in the pre-2008 financial crisis and the post-2008 financial crisis periods.
- The Tobit regression models and the bootstrap regression models
The determinants of firm efficiency are analysed using Tobit regression models and bootstrap regression models. In order to deal with multicollinearity, we run several regressions including environmental variables in separate models.
The regression models show that efficiency scores are positively and statistically significantly associated with business variables such as legal form and cash flows, whereas efficiency scores are negatively and statistically significant associated with macroeconomic factors such as the 2008 financial crisis and other business variables such as size and leverage. In terms of environmental variables, Table 9 and Table 10 reveal that efficiency scores are positively and statistically significantly associated with environmental variables such as tourist arrivals, overnight stays and average stay. Consequently, both the Tobit and bootstrap regressions models show that the business variables, macroeconomic factors and environmental variables examined in this paper can be considered as drivers or variables that influence firm efficiency in the holiday and short-stay accommodation sector.
- Robustness analysis
In this subsection, we conducted a robustness analysis to validate and confirm the previous results considering both the new dependent variable (efficiency scores with a new radial DEA model) and independent variables or contextual variables that could influence firm efficiency (the same contextual variables and also alternative measures). We applied the DEA radial model with variable returns to scale proposed by Banker et al. [55] to obtain the efficiency results with a new model, and we repeated the second stage analysis to confirm the results for factors that could influence firm efficiency (environmental variables, macroeconomic factors and business variables). The radial DEA model was developed in a seminal paper by Charnes et al. [40], in which the authors evaluated the Debreu–Farrell measure with the constant returns to scale (CRS) hypothesis. Banker et al. [55] extended this original DEA model, proposing the BCC model with variable returns to scale.
As in the previous section, the BCC radial model results show that the years 2007, 2010 and 2014 register the highest levels of efficiency, while the years 2008 and 2011 present the lowest levels. The Kruskal Wallis test confirms statistically significant differences for years (p < 0.05), for tourist destination profile, for regions (p < 0.05) and for tourist destination (p < 0.05). Results are not reported for brevity.
The Spearman’s rank correlation also confirms previous results. The efficiency score has a significant and positive correlation with environmental variables such as tourist arrivals (r = 0.019, p < 0.05), overnight stays (r = 0.021, p < 0.05), and average stay (r = 0.028, p < 0.05), and business variables such as legal form (r = 0.10, p < 0.05) and cash flow (r = 0.029, p < 0.05). In contrast, the correlations are negative and statistically significant with size (−0.52, p < 0.05) and leverage (r = −0.104, p < 0.05). The Kruskal Wallis test also confirms statistically significant differences for business factors: size (p < 0.05) and legal form (p < 0.05). The Tobit regression and bootstrap regressions indicate that efficiency is positively associated with legal form, cash flow, tourist arrivals, overnight stays and average stay, while efficiency scores are negatively associated with size and leverage. The coefficients are statistically significant (p < 0.05). Results are not reported for brevity.
Second, we used alternative proxies for the independent variable to test the results presented in the previous section. In particular, we used different classifications for legal form because is not equally distributed among the sample, and alternative proxies for independent variables. The Kruskal Wallis test, Spearman correlation and regression analysis remain similar.
5. Discussion
This section discusses the results of this study and the similarities and differences with other previous results on the efficiency tourism field. Firstly, we comment on the efficiency results by year, region and tourism destination, secondly, the influence of environmental variables, business variables and macroeconomic factors on efficiency scores (or the efficiency drivers), and finally we present some comparisons with the prior efficiency literature.
Dynamic efficiency results by year indicate that the 2008 financial crisis (2008–2011) affected the tourism companies analysed, with average efficiency scores lower than in the pre-2008 financial crisis period (2005–2007) and the post-2008 financial crisis period (2012–2016). An important novelty of this study is that it expands the efficiency results by regional location, including the tourist destination (non-diversified and diversified) which indicates the type of tourism associated with the geographical location of the tourism firms. The dynamic efficiency results by tourist destination type (non-diversified and diversified) indicate that diversified destinations achieve higher efficiency levels than non-diversified destinations.
Focusing on non-diversified destinations, the main results indicate that Cantabria and Madrid are the top-ranked regions for some tourism dimensions, such as cultural tourism; Catalonia, Valencia and the Canary Islands obtain better efficiency results in sun-and-sea tourism and rural tourism. Conversely, efficiency results by diversified/mixed destinations indicate that the Basque country and Catalonia are the top-ranked regions for cultural and sea tourism; La Rioja is best positioned for wine and rural tourism, and the Canary Islands perform best for the sea and rural profile. On average, the main efficiency results by region indicate that the Basque country, Catalonia, La Rioja, Madrid and the Canary Islands perform better than other regions.
We also explore efficiency drivers focusing on a set of business factors, macroeconomic variables and environmental variables such as tourist arrivals, overnight stays and average stay. Multivariate models—Tobit and bootstrapped regressions—indicate that business factors and environmental variables are drivers of firm efficiency. Specifically, efficiency scores are positively and statistically significantly associated with cash flows, legal form, tourist arrivals, overnight stays and average stay, whereas efficiency scores are negatively and statistically significantly associated with the 2008 financial crisis, size and leverage. In addition, the study provides a robustness analysis using a DEA model with radial DEA model proposed by Banker et al. [55] in order to confirm prior findings; the results remain similar.
Since the prior efficiency literature and empirical tourism efficiency analysis have primarily focused on hotel firms, there is no evidence reported from other subsectors such as the holiday and short-stay accommodation industry. However, if we compare the results of this study with prior efficiency tourism studies (mainly focusing on hotels firms) we find some similarities and differences. Similarly to Radovanov et al. [4], Assaf et al. [17], Lado-Sestayo and Fernández-Castro [24], Sellers-Rubio and Casado-Díaz [25], Botti et al. [29], Yang et al. [38], we find that the environmental variables (tourist arrivals, overnight stays and average stay) are strong drivers of firm efficiency. Furthermore, the previous tourism efficiency literature provide evidence that firm size is a key factor or driver of hotel efficiency: Barros [10], Parte and Alberca [12], Assaf et al. [17], Assaf and Agbola [20]. In this study, in the empirical context of hostels and apartments, we also find that firm size is a key factor linked with firm efficiency.
Following the prior literature, location is a main factor or driver in tourism firm efficiency: Assaf and Tsionas [8], Barros [10], Parte and Alberca [12], Shang et al. [16], Lado-Sestayo and Fernández-Castro [24], Chaabouni [26], Botti et al. [29], Huang et al. [37], Yang et al. [38]. The main results of this study also confirm the above evidence: geographical location is also a key efficiency factor or variable that influences firm efficiency in the holiday and short-stay accommodation industry (hostels and tourist apartments).
6. Conclusions
Since tourism efficiency analysis has mainly focused on hotel firms, this study analyses dynamic efficiency in the holiday and short-stay tourism accommodation industry (e.g., apartments and hostels), on which there is limited evidence to date.
Based on two methodological stages, the study applies several DEA models to investigate the efficiency of tourism firms and the associated variables or drivers. The study uses a non-radial frontier DEA model in order to measure the efficiency and competitiveness of tourism firms. This nonparametric model offers important advantages over classic radial models: it takes into account all inefficiencies (both radial and non-radial) and is invariant to the units of measurement.
A major contribution of this study to the previous efficiency literature is the industry under analysis—the holiday and short-stay tourism accommodation industry—in conjunction with the segmentation associated with the firms’ geographical locations on tourist destinations (non-diversified destinations and diversified destinations; including some tourism dimensions as rural, cultural and wine tourism), as well as the application of several methodologies and sensitivity analyses to confirm the results. This research combines more advanced methods such as the non-radial with radial DEA models to confirm the results. By using several DEA approaches, the study provides further evidence and contributes to a better understanding of efficient firm management as well as confirming efficiency drivers.
The efficiency results confirm the impact of the financial crisis (2008–2011) on tourism firms. The results also indicate that firms geographically located in diversified destinations obtain better efficiency results than those located in non-diversified destinations. Furthermore, considering regional efficiency, the most efficient firms are located in the Basque country, Catalonia, La Rioja, Madrid and the Canary Islands.
Another findings of this study also confirms the influence of some environmental and business variables on firm efficiency: factors such as legal form, cash flow, tourist arrivals, overnight stays and average stay are positive and significantly associated with efficiency score, whereas factors such as the 2008 financial crisis, firm size and leverage are negative and significantly associated with efficiency score.
Business efficiency is closely linked to sustainability: the efficient firms can achieve their production goals with the lowest consumption of resources and responsible production (Goal 12 of SGD). The evidence for the holiday and other short-stay accommodation sector may help entrepreneurs, tourism policymakers and practitioners in their decision-making and development of new strategies seeking the behaviour of the most efficient companies by regions and tourist destination types. The results also confirm that the diversification of the tourist destination based on some tourism dimensions (rural, cultural and wine tourism) is a useful strategy for improving tourist firms’ performance and competitiveness. With respect to efficiency drivers, the evidence indicates that managerial effectiveness with respect to environmental variables, business variables and macroeconomic factors (positively or negatively) can influence tourist firms’ performance.
7. Limitations and Future Developments
In this study, we focus on economic efficiency, generally related to a lower consumption of inputs or productive resources. The efficiency score is estimated using the input variables (capital, labour and materials), which included all the productive resources of each firm. The database used in the paper collects financial and non-financial information for each firm but does not contain specific information related to the sustainable resources and investments of each firm. This is a limitation that can be addressed in future papers. Furthermore, it could be interesting to use additional databases and collect specific information for each firm to examine, for example, eco-efficiency practices such as investments in solar and renewable energy and other aspects. Depending on the available data, it could be interesting to include alternative inputs and outputs to measure efficiency.
Finally, it is worth noting that the empirical analysis in this study assesses efficiency in the holiday and short-stay tourism accommodation industry using several nonparametric frontier estimation approaches, and examines a set of efficiency drivers through multivariate modelling. The results and conclusions of this study could change if other sectors (hotels, restaurants), other countries and regions, and other methodological approaches were considered.
Future studies could extend the results by using an international sample of short-stay accommodation firms. The introduction of more business factors, environmental variables and macroeconomics factors may also reinforce the comparability of this results. Furthermore, the COVID-19 pandemic is causing severe disruptions in the tourism industry; future studies should examine the pandemic effects in all the subsectors from a broad perspective.
Author Contributions
The authors contributed equally to this research paper, including data collection, conceptualization, literature review, methodology, data processing and analysis, validation, writing and editing, critically reviewing, conclusions and discussion, and checking the overall manuscript. All authors have read and agreed to the published version of the manuscript.
Funding
The authors acknowledge the financial contribution from the Spanish Ministry of Economy, Industry and Competitiveness. Ref project ECO2016-79659-R.
Conflicts of Interest
The authors declare no conflict of interest.
Appendix A
Figure A1.
Graphical abstract.


Table A1.
Kruskal Wallis test and Mann–Whitney U test.
| Size | N | Mean | S.D. | Mid-Range | H Kruskal-Wallis | Sig. | ||
|---|---|---|---|---|---|---|---|---|
| 1 | between 1 and 4 employees | 7624 | 0.5431 | 0.1737 | 7417.51 | 1659.35 | 0.00 | |
| 2 | between 5 and 9 employees | 2330 | 0.4275 | 0.1433 | 4345.49 | |||
| 3 | between 10 and 20 employees | 1547 | 0.4328 | 0.1415 | 4581.46 | |||
| 4 | more than 20 employees | 1363 | 0.5205 | 0.1946 | 6591.43 | |||
| Total | 12,864 | 0.5065 | 0.1750 | |||||
| Legal Form | N | Mean | S.D. | Mid-Range | H Kruskal-Wallis | Sig. | ||
| 1 | UTE | 9 | 0.4980 | 0.0763 | 7272.67 | 187.84 | 0.00 | |
| 2 | PLC | 1260 | 0.4578 | 0.1672 | 5098.23 | |||
| 3 | LLC | 11,584 | 0.5118 | 0.1751 | 6578.40 | |||
| 4 | Foreign entities | 2 | 0.4037 | 0.0346 | 4114.75 | |||
| 5 | Establishments owned by non-resident entities | 3 | 0.5571 | 0.0671 | 9004.00 | |||
| 6 | Others | 6 | 0.3780 | 0.0565 | 3180.58 | |||
| Total | 12,864 | 0.5065 | 0.1750 | |||||
| Financial Crisis | N | Mean | S.D. | Mid-Range | U-Mann Whitney | Z | Sig. | |
| 0 | 2005–2007, 2012–2016 | 8485 | 0.5128 | 0.1760 | 6585.82 | 17276972 | −6.519 | 0.00 |
| 1 | 2008–2011 | 4379 | 0.4943 | 0.1723 | 6135.41 | |||
| Total | 12,864 | 0.5065 | 0.1750 | |||||
Source: Results obtained by the authors.
References
- Zucchella, A.; Previtali, P. Circular business models for sustainable development: A “waste is food” restorative ecosystem. Bus. Strateg. Environ. 2019, 28, 274–285. [Google Scholar] [CrossRef]
- Demirel, P.; Danisman, G.O. Eco-innovation and firm growth in the circular economy: Evidence from European small-and medium-sized enterprises. Bus. Strateg. Environ. 2019, 28, 1608–1618. [Google Scholar] [CrossRef]
- Kularatne, T.; Wilson, C.; Mansson, J.; Hoang, V.; Lee, B. Do environmentally sustainable practices make hotels more efficient? A study of major hotels in Sri Lanka. Tour. Manag. 2019, 71, 213–225. [Google Scholar] [CrossRef]
- Radovanov, B.; Dudic, B.; Gregus, M.; Marcikic Horvat, A.; Karovic, V. Using a Two-Stage DEA Model to Measure Tourism Potentials of EU Countries and Western Balkan Countries: An Approach to Sustainable Development. Sustainability 2020, 12, 4903. [Google Scholar] [CrossRef]
- GSCT. Global Sustainable Tourism Council (GSTC). 2020. Available online: www.gstcouncil.org (accessed on 3 November 2020).
- Cooper, W.W.; Seiford, L.M.; Tone, K.; Zhu, J. Some models and measures for evaluating performances with DEA: Past accomplishments and future prospects. J. Prod. Anal. 2007, 28, 151–163. [Google Scholar] [CrossRef]
- Färe, R.; Grosskopf, S.; Lovell, C.K. The Measurement of Efficiency of Production; Springer Science & Business Media: New York, NY, USA, 2013; Volume 6. [Google Scholar]
- Assaf, A.G.; Tsionas, M. Measuring Hotel Performance: Toward More Rigorous Evidence in Both Scope and Methods. Tour. Manag. 2018, 69, 69–87. [Google Scholar] [CrossRef]
- Farrell, M.J. The Measurement of Productive Efficiency. J. R. Stat. Soc. Ser. 1957, 120, 253–281. [Google Scholar] [CrossRef]
- Barros, C.P. Evaluating the Efficiency of a Small Hotel Chain with a Malmquist Productivity Index. Int. J. Tour. Res. 2005, 7, 173–184. [Google Scholar] [CrossRef]
- Yu, M.M.; Lee, B.C. Efficiency and effectiveness of service business: Evidence from international tourist hotels in Taiwan. Tour. Manag. 2009, 30, 571–580. [Google Scholar] [CrossRef]
- Parte, L.; Alberca, P. Determinants of Technical Efficiency in the Spanish Hotel Industry: Regional and Corporate Performance Factors. Curr. Issues Tour. 2015, 18, 391–411. [Google Scholar] [CrossRef]
- Ben Aissa, S.; Goaied, M. Performance of Tourism Destinations: Evidence from Tunisia. J. Hosp. Tour. Res. 2017, 41, 797–822. [Google Scholar] [CrossRef]
- Lee, Y.L.; Kuo, S.H.; Jiang, M.Y.; Li, Y. Evaluating the performances of Taiwan’s international tourist hotels: Applying the directional distance function and meta-frontier approach. Sustainability 2019, 11, 5773. [Google Scholar] [CrossRef] [Green Version]
- Tsaur, S.H. The operating efficiency of international tourist hotels in Taiwan. Asia Pac. J. Tour. Res. 2001, 6, 73–81. [Google Scholar] [CrossRef]
- Shang, J.K.; Wang, F.C.; Hung, W.T. A Stochastic DEA Study of Hotel Efficiency. Appl. Econ. 2010, 42, 2505–2518. [Google Scholar] [CrossRef]
- Assaf, A.G.; Barros, C.P.; Josiassen, A. Hotel efficiency: A Bootstrapped Metafrontier Approach. Int. J. Hosp. Manag. 2012, 31, 621–629. [Google Scholar] [CrossRef]
- Higuerey, A.; Viñan-Merecí, C.; Malo-Montoya, Z.; Martínez-Fernández, V.A. Data Envelopment Analysis (DEA) for Measuring the Efficiency of the Hotel Industry in Ecuador. Sustainability 2020, 12, 1590. [Google Scholar] [CrossRef] [Green Version]
- Jauhari, V.; Sanjeev, G.M. Measuring Efficiency of the Hotel and Restaurant Sector: The Case of India. Int. J. Contemp. Hosp. Manag. 2007, 19, 378–387. [Google Scholar] [CrossRef]
- Assaf, A.G.; Agbola, F.W. Modelling the Performance of Australian Hotels: A DEA Double Bootstrap Approach. Tour. Econ. 2011, 17, 73–89. [Google Scholar] [CrossRef]
- Parte, L.; Alberca, P. New Insights into Dynamic Efficiency: The Effects of Firm Factors. Int. J. Contemp. Hosp. Manag. 2015, 27, 107–129. [Google Scholar] [CrossRef]
- Solana-Ibáñez, J.; Caravaca-Garratón, M.; Para-González, L. Two-Stage Data Envelopment Analysis of Spanish Regions: Efficiency Determinants and Stability Analysis. Contemp. Econ. 2016, 10, 259–274. [Google Scholar] [CrossRef] [Green Version]
- Alberca, P.; Parte, L. Operational efficiency evaluation of restaurant firms. Int. J. Contemp. Hosp. Manag. 2018, 30, 1959–1977. [Google Scholar] [CrossRef]
- Lado-Sestayo, R.; Fernández-Castro, A.S. The Impact of Tourist Destination on Hotel Efficiency: A Data Envelopment Analysis Approach. Eur. J. Oper. Res. 2019, 272, 674–686. [Google Scholar] [CrossRef]
- Sellers-Rubio, R.; Casado-Díaz, A.B. Analyzing Hotel Efficiency from a Regional Perspective: The Role of Environmental Determinants. Int. J. Hosp. Manag. 2018, 75, 75–85. [Google Scholar] [CrossRef]
- Chaabouni, S. China’s Regional Tourism Efficiency: A Two-stage Double Bootstrap Data Envelopment Analysis. J. Destin. Mark. Manag. 2019, 11, 183–191. [Google Scholar] [CrossRef]
- Yin, P.; Yang, M.; Yang, R. Investigating the Effects of IT Capability on Hotel Performance Based on DEA Approach: An Empirical Example of International Hotels in Hong Kong. Sustainability 2020, 12, 6732. [Google Scholar] [CrossRef]
- Liu, J.S.; Lu, L.Y.Y.; Lu, W.-M.; Lin, B.J.Y. Data Envelopment Analysis 1978–2010: A Citation-Based Literature Survey. Omega-Int. J. Manag. Sci. 2013, 41, 3–15. [Google Scholar] [CrossRef]
- Botti, L.; Peypoch, N.; Robinot, E.; Solonandrasana, B. Tourism Destination Competitiveness: The French Regions Case. Eur. J. Tour. Res. 2009, 2, 5–24. [Google Scholar]
- Herrero-Prieto, L.C.; Gomez-Vega, M. Cultural Resources as a Factor in Cultural Tourism Attraction: Technical Efficiency Estimation of Regional Destinations in Spain. Tour. Econ. 2017, 23, 260–280. [Google Scholar] [CrossRef]
- Hwang, S.; Chang, T. Using Data Envelopment Analysis to Measure Hotel Managerial Efficiency Change in Taiwan. Tour. Manag. 2003, 24, 357–369. [Google Scholar] [CrossRef]
- Barros, C.P.; Dieke, P.U.C. Technical Efficiency of African Hotels. Int. J. Hosp. Manag. 2008, 27, 438–447. [Google Scholar] [CrossRef]
- Yang, Z.; Cai, J. Do Regional Factors Matter? Determinants of Hotel Industry Performance in China. Tour. Manag. 2016, 52, 242–253. [Google Scholar] [CrossRef]
- Chen, M.H. The Economy, Tourism Growth and Corporate Performance in the Taiwanese Hotel Industry. Tour. Manag. 2010, 31, 665–675. [Google Scholar] [CrossRef] [PubMed]
- Chen, M.H.; Lin, C.P.; Tian, L.; Yang, Y.A. Theoretical Link between Corporate Giving and Hospitality Firm Performance. Int. J. Hosp. Manag. 2017, 66, 130–134. [Google Scholar] [CrossRef]
- Barros, C.P.; Botti, L.; Peypoch, N.; Robinot, E.; Solonandrasana, B.; Assaf, A.G. Performance of French Destinations: Tourism Attraction Perspectives. Tour. Manag. 2011, 32, 141–146. [Google Scholar] [CrossRef]
- Huang, Y.; Mesak, H.I.; Hsu, M.K.; Qu, H. Dynamic Efficiency Assessment of the Chinese Hotel Industry. J. Bus. Res. 2012, 65, 59–67. [Google Scholar] [CrossRef]
- Yang, Z.; Xia, L.; Cheng, Z. Performance of Chinese Hotel Segment Markets: Efficiencies Measure Based on Both Endogenous and Exogenous Factors. J. Hosp. Tour. Manag. 2017, 32, 12–23. [Google Scholar] [CrossRef]
- Assaf, A.G.; Josiassen, A.; Woo, L.; Agbola, F.W.; Tsionas, M. Destination Characteristics that Drive Hotel Performance: A State-of-the-Art Global Analysis. Tour. Manag. 2017, 60, 270–279. [Google Scholar] [CrossRef] [Green Version]
- Charnes, A.; Cooper, W.W.; Rhodes, E. Measuring the Efficiency of Decision Making. Units. Eur. J. Oper. Res. 1978, 2, 429–444. [Google Scholar] [CrossRef]
- Emrouznejad, A.; Yang, G.L. A survey and analysis of the first 40 years of scholarly literature in DEA: 1978–2016. Socio-Econ. Plan. Sci. 2018, 61, 4–8. [Google Scholar] [CrossRef]
- Soysal-Kurt, H. Measuring tourism efficiency of European countries by using data envelopment analysis. Eur. Scient. J. 2017, 13, 31–49. [Google Scholar] [CrossRef] [Green Version]
- Färe, R.; Lovell, C.K. Measuring the Technical Efficiency of Production. J. Econom. 1978, 19, 150–162. [Google Scholar] [CrossRef]
- Tone, K. A Slacks-Based Measure of Efficiency in Data Envelopment Analysis. Eur. J. Oper. Res. 2001, 130, 498–509. [Google Scholar] [CrossRef] [Green Version]
- Donthu, N.; Yoo, B. Cultural Influences on Service Quality Expectations. J. Serv. Res. 1998, 1, 178–186. [Google Scholar] [CrossRef]
- Simar, L.; Wilson, P.W. Estimation and Inference in Two Stage, Semi-Parametric Models of Productive Efficiency. J. Econom. 2007, 136, 31–64. [Google Scholar] [CrossRef]
- Simar, L.; Wilson, P.W. Two-Stage DEA: Caveat Emptor. J. Prod. Anal. 2011, 36, 205–218. [Google Scholar] [CrossRef]
- Yu, W.; Ramanathan, R. An Assessment of Operational Efficiencies in the UK Retail Sector. Int. J. Retail Distrib. Manag. 2008, 36, 861–882. [Google Scholar] [CrossRef]
- Jang, S.S.; Park, K. Hospitality finance research during recent two decades: Subjects, methodologies, and citations. Int. J. Contemp. Hosp. Manag. 2011, 23, 479–497. [Google Scholar] [CrossRef]
- Dalbor, M.C.; Upneja, A. Growth Opportunities and the Long-Term Debt Decision of US Lodging Firms. J. Hosp. Fin. Manag. 2002, 10, 93. [Google Scholar] [CrossRef] [Green Version]
- Dalbor, M.C.; Upneja, A. The Investment Opportunity Set and the Long-Term Debt Decision of US Lodging Firms. Int. J. Tour. Res. 2004, 28, 346–355. [Google Scholar] [CrossRef]
- Kim, H.; Gu, Z. Predicting Restaurant Bankruptcy: A Logit Model in Comparison with a Discriminant Model. Int. J. Hosp. Manag. 2006, 30, 474–493. [Google Scholar] [CrossRef]
- Kim, H.; Gu, Z. A Logistic Regression Analysis for Predicting Bankruptcy in the Hospitality Industry. J. Hosp. Fin. Manag. 2010, 14, 17–34. [Google Scholar] [CrossRef]
- Haugland, S.A.; Myrtveit, I.; Nygaard, A. Market Orientation and Performance in the Service Industry: A data envelopment analysis. J. Bus. Res. 2007, 60, 1191–1197. [Google Scholar] [CrossRef]
- Banker, R.D.; Charnes, A.; Cooper, W.W. Some Models for Estimating Technical and Scale Inefficiencies in Data Envelopment Analysis. Manag. Sci. 1984, 30, 1078–1092. [Google Scholar] [CrossRef] [Green Version]
Figure 1.
Efficiency index by tourism destinations (diversified and non-diversified).

Figure 2.
Regional Efficiency: (a) diversified destinations, (b) non-diversified destinations.

Table 1.
Descriptive statistics for Data Envelopment Analysis (DEA) efficiency models.
| Firms | {O} Revenues and Sales (a) | {I} Capital (a) | {I} Employees (b) | {I} Labour Costs (a) | {I} Materials (a) | |
|---|---|---|---|---|---|---|
| 2005 | 795 | |||||
| Mean | 863.5629 | 2211.6953 | 12.2830 | 258.7766 | 252.0523 | |
| SD | 2623.4213 | 6616.6827 | 30.0437 | 714.3679 | 1256.5266 | |
| 2006 | 865 | |||||
| Mean | 870.6255 | 2141.7058 | 11.8185 | 262.607 | 254.1235 | |
| SD | 2643.1756 | 6765.6803 | 29.9845 | 733.4786 | 1230.6289 | |
| 2007 | 789 | |||||
| Mean | 945.0703 | 2394.6354 | 12.0520 | 281.1954 | 261.7521 | |
| SD | 2852.4610 | 7405.6326 | 28.3427 | 734.7294 | 1223.5574 | |
| 2008 | 1029 | |||||
| Mean | 785.1878 | 2232.1203 | 10.4742 | 250.1027 | 250.2362 | |
| SD | 2272.8741 | 8176.0650 | 25.9208 | 710.6353 | 1501.0491 | |
| 2009 | 1104 | |||||
| Mean | 673.2045 | 2159.6992 | 9.2754 | 225.6093 | 164.0564 | |
| SD | 2375.2897 | 8014.6914 | 22.4916 | 652.0296 | 752.9601 | |
| 2010 | 1091 | |||||
| Mean | 628.6719 | 2186.1246 | 8.6774 | 217.5097 | 150.5944 | |
| SD | 1670.0852 | 6960.6454 | 20.6367 | 629.5729 | 580.9594 | |
| 2011 | 1155 | |||||
| Mean | 663.1304 | 2097.7988 | 8.7489 | 222.1387 | 151.6558 | |
| SD | 1756.4619 | 6736.6528 | 20.8055 | 632.2828 | 549.1531 | |
| 2012 | 1161 | |||||
| Mean | 666.0738 | 2445.2697 | 8.3910 | 218.2935 | 146.7894 | |
| SD | 1751.1316 | 10,222.8534 | 20.1337 | 609.5923 | 459.1374 | |
| 2013 | 1174 | |||||
| Mean | 671.4901 | 2349.5001 | 8.4302 | 215.7912 | 141.3004 | |
| SD | 1788.5701 | 10,195.7112 | 19.8779 | 599.0618 | 532.3282 | |
| 2014 | 1193 | |||||
| Mean | 719.3923 | 2358.1531 | 9.5524 | 218.9189 | 156.9629 | |
| SD | 1865.0250 | 9966.3971 | 36.2332 | 577.6156 | 569.6784 | |
| 2015 | 1271 | |||||
| Mean | 742.7328 | 2249.9218 | 8.6373 | 222.1361 | 148.6566 | |
| SD | 1815.8106 | 9619.4752 | 19.8118 | 574.0375 | 419.7088 | |
| 2016 | 1237 | |||||
| Mean | 832.1543 | 2207.0743 | 9.2652 | 239.7652 | 173.2128 | |
| SD | 2022.9318 | 6995.5730 | 21.2223 | 602.6248 | 644.9459 | |
| N (Firms) | 12,864 |
(a) Million euros (b) Number. Source: Results obtained by the authors.
Table 2.
Descriptive statistics for business and macroeconomic variables.
| Size | N | % | Legal Form | N | % | Financial Crisis | N | % |
|---|---|---|---|---|---|---|---|---|
| 1 and 4 employees | 7624 | 0.5927 | UTE | 9 | 0.0007 | 2005–2007, 2012–2016 | 8485 | 0.6596 |
| 5 and 9 employees | 2330 | 0.1811 | PLC | 1260 | 0.0979 | 2008–2011 | 4379 | 0.3404 |
| 10 and 20 employees | 1547 | 0.1203 | LLC | 11,584 | 0.9005 | |||
| more 20 employees | 1363 | 0.1060 | Foreing entities | 2 | 0.0002 | |||
| Establishments non-resident | 3 | 0.0002 | ||||||
| Others | 6 | 0.0005 | ||||||
| Total | 12,864 | 100% | Total | 12,864 | 100% | Total | 12,864 | 100% |
Table 3.
Descriptive statistics for business variables.
| N | Min | Max | Mean | S.D. | |
|---|---|---|---|---|---|
| CFO | 12,862 | −0.4319. | 0.5348 | 0.0407 | 0.1352 |
| Leverage | 12,864 | 0.0000 | 1.1779 | 0.3042 | 0.3251 |
Table 4.
Descriptive statistics for environmental variables.
| Arrivals | % (Arrivals/Total) | Overnight Stays | % (Overnight/Total) | Average Stay | |
|---|---|---|---|---|---|
| 01 Andalusia | 100,074 | 13.25% | 540,460 | 9.71% | 5.514 |
| 02 Aragón | 7958 | 1.05% | 28,687 | 0.52% | 3.623 |
| 03 Asturias | 3657 | 0.48% | 15,915 | 0.29% | 3.962 |
| 04 Balearic islands | 107,868 | 14.29% | 824,244 | 14.80% | 7.551 |
| 05 Canary islands | 317,230 | 42.01% | 2702,181 | 48.53% | 8.491 |
| 06 Cantabria | 6298 | 0.83% | 28,147 | 0.51% | 4.417 |
| 07 Castilla—León | 4348 | 0.58% | 13,502 | 0.24% | 3.695 |
| 08 Castilla Mancha | 4885 | 0.65% | 14,180 | 0.25% | 2.936 |
| 09 Catalonia | 68,228 | 9.04% | 507,741 | 9.12% | 7.225 |
| 10 Valencia | 84,283 | 11.16% | 674,150 | 12.11% | 8.013 |
| 11 Extremadura | 2443 | 0.32% | 6039 | 0.11% | 2.584 |
| 12 Galicia | 4839 | 0.64% | 20,176 | 0.36% | 3.846 |
| 13 Madrid | 28,025 | 3.71% | 103,282 | 1.86% | 3.725 |
| 14 Murcia | 6828 | 0.90% | 60,784 | 1.09% | 9.077 |
| 15 Navarra | 3635 | 0.48% | 11,700 | 0.21% | 3.325 |
| 16 Basque Country | 2673 | 0.35% | 11,789 | 0.21% | 5.121 |
| 17 Rioja | 1799 | 0.24% | 4565 | 0.08% | 2.592 |
| Total | 755,071 | 100% | 5567,542 | 100% | 86 |
Source: Results obtained by the authors.
Table 5.
Efficiency by year and tourist destination (diversified and non-diversified).
| N | 2005 | 2006 | 2007 | 2008 | 2009 | 2010 | 2011 | 2012 | 2013 | 2014 | 2015 | 2016 | |
|---|---|---|---|---|---|---|---|---|---|---|---|---|---|
| NON-DIVERSIFIED DESTINATIONS | 11,357 | 0.501 | 0.500 | 0.541 | 0.477 | 0.497 | 0.524 | 0.471 | 0.487 | 0.498 | 0.523 | 0.511 | 0.522 |
| 5546 | 0.510 | 0.514 | 0.552 | 0.478 | 0.498 | 0.530 | 0.474 | 0.495 | 0.493 | 0.539 | 0.522 | 0.526 |
| 4126 | 0.481 | 0.480 | 0.514 | 0.470 | 0.490 | 0.513 | 0.466 | 0.477 | 0.503 | 0.499 | 0.489 | 0.516 |
| 1685 | 0.507 | 0.495 | 0.559 | 0.492 | 0.517 | 0.538 | 0.474 | 0.485 | 0.501 | 0.529 | 0.524 | 0.523 |
| DIVERSIFIED DESTINATIONS | 1507 | 0.484 | 0.507 | 0.569 | 0.476 | 0.519 | 0.562 | 0.485 | 0.501 | 0.523 | 0.550 | 0.564 | 0.549 |
| 606 | 0.467 | 0.520 | 0.618 | 0.486 | 0.569 | 0.605 | 0.506 | 0.546 | 0.577 | 0.625 | 0.645 | 0.619 |
| 396 | 0.466 | 0.476 | 0.519 | 0.466 | 0.459 | 0.508 | 0.466 | 0.460 | 0.482 | 0.491 | 0.467 | 0.453 |
| 232 | 0.543 | 0.555 | 0.586 | 0.493 | 0.484 | 0.547 | 0.472 | 0.462 | 0.501 | 0.492 | 0.519 | 0.513 |
| 208 | 0.442 | 0.487 | 0.492 | 0.474 | 0.518 | 0.540 | 0.453 | 0.466 | 0.443 | 0.502 | 0.489 | 0.463 |
| 65 | 0.618 | 0.429 | 0.640 | 0.395 | 0.530 | 0.660 | 0.562 | 0.605 | 0.521 | 0.519 | 0.539 | 0.625 |
| Total | 12,864 | 0.499 | 0.501 | 0.544 | 0.477 | 0.500 | 0.528 | 0.473 | 0.488 | 0.501 | 0.527 | 0.518 | 0.525 |
Source: Results obtained by the authors.
Table 6.
Kruskal Wallis test for tourist destinations.
| Tourist Destination | N | Mean Efficiency | S.D. | Mid-Range | H Kruskal-Wallis | Sig. | |
|---|---|---|---|---|---|---|---|
| NON-DIVERSIFIED DESTINATIONS | |||||||
| 1 | Sun and Sea tourism | 5546 | 0.5103 | 0.1827 | 6435.95 | 105.028 | 0.000 |
| 2 | Cultural tourism | 1685 | 0.5121 | 0.1781 | 6547.14 | ||
| 3 | Rural tourism | 4126 | 0.4916 | 0.1575 | 6230.87 | ||
| DIVERSIFIED DESTINATIONS | |||||||
| 4 | Snow and mountain tourism | 208 | 0.4803 | 0.1288 | 6219.73 | ||
| 5 | Camino de Santiago, cultural and rural | 396 | 0.4755 | 0.1574 | 5757.73 | ||
| 6 | Cultural and sea tourism | 606 | 0.5787 | 0.2131 | 7662.69 | ||
| 7 | Wine tourism and rural tourism | 65 | 0.561 | 0.1844 | 7710.43 | ||
| 8 | Sea tourism and rural tourism | 232 | 0.5119 | 0.1503 | 6874.39 | ||
| Total | 12,864 | 0.5065 | 0.175 | ||||
Table 7.
Mann–Whitney U test for tourist destinations.
| Non-Diversified/Diversified | N | Mean Efficiency | S.D. | Mid-Range | Mann–Whitney U Test | Sig. | |
|---|---|---|---|---|---|---|---|
| 1 | Non-diversified | 11,357 | 0.5037 | 0.1734 | 6377.94 | 7,937,882.500 | 0.000 |
| 2 | Diversified | 1507 | 0.5269 | 0.1846 | 6843.66 | ||
| Total | 12,864 | 0.5064 | 0.1749 | ||||
Table 8.
Spearman’s rank correlation.
| Effic | Arrivals | Overnight Stays | Average Stay | Financial Crisis | Size | Legal Form | CFO | Leverage | |
|---|---|---|---|---|---|---|---|---|---|
| Effic | 1.000 | 0.023 | 0.026 | 0.017 | −0.057 | −0.269 | 0.116 | 0.203 | −0.153 |
| 0.010 | 0.003 | 0.059 | 0.000 | 0.000 | 0.000 | 0.000 | 0.000 | ||
| Arrivals | 1.000 | 0.975 | 0.717 | −0.048 | 0.288 | −0.106 | 0.078 | −0.124 | |
| 0.000 | 0.000 | 0.000 | 0.000 | 0.000 | 0.000 | 0.000 | |||
| Overnight Stays | 1.000 | 0.799 | −0.033 | 0.295 | −0.124 | 0.096 | −0.130 | ||
| 0.000 | 0.000 | 0.000 | 0.000 | 0.000 | 0.000 | ||||
| Average Stay | 1.000 | 0.075 | 0.277 | −0.131 | 0.099 | −0.116 | |||
| 0.000 | 0.000 | 0.000 | 0.000 | 0.000 | |||||
| Financial crisis | 1.000 | −0.007 | −0.005 | −0.086 | 0.060 | ||||
| 0.405 | 0.590 | 0.000 | 0.000 | ||||||
| Size | 1.000 | −0.237 | 0.130 | −0.077 | |||||
| 0.000 | 0.000 | 0.000 | |||||||
| Legal form | 1.000 | −0.051 | 0.031 | ||||||
| 0.000 | 0.000 | ||||||||
| CFO | 1.000 | −0.164 | |||||||
| 0.000 | |||||||||
| Leverage | 1.000 |
Table 9.
Tobit models.
| Efficiency | Coef. | P > z | Coef. | P > z | Coef. | P > z | Coef. | P > z |
|---|---|---|---|---|---|---|---|---|
| Arrivals | 0.1059 | 0.0000 | ||||||
| Overnight Stays | 0.0949 | 0.0000 | ||||||
| Stay average | 0.0065 | 0.0000 | ||||||
| Financial Crisis | −0.0105 | 0.0000 | −0.0106 | 0.0000 | −0.0106 | 0.0000 | −0.0126 | 0.0000 |
| Legal form | 0.0272 | 0.0210 | 0.0304 | 0.0090 | 0.0306 | 0.0090 | 0.0317 | 0.0070 |
| Size | −0.0444 | 0.0000 | −0.0459 | 0.0000 | −0.0460 | 0.0000 | −0.0457 | 0.0000 |
| CFO | 0.1629 | 0.0000 | 0.1639 | 0.0000 | 0.1637 | 0.0000 | 0.1625 | 0.0000 |
| Leverage | −0.0567 | 0.0000 | −0.0558 | 0.0000 | −0.0554 | 0.0000 | −0.0556 | 0.0000 |
| c | 0.5455 | 0.0000 | 0.5250 | 0.0000 | 0.5257 | 0.0000 | 0.4970 | 0.0000 |
Table 10.
Bootstrap models.
| Efficiency | Coef. | P > z | Coef. | P > z | Coef. | P > z | Coef. | P > z |
|---|---|---|---|---|---|---|---|---|
| Arrivals | 0.1059 | 0.0000 | ||||||
| Overnight Stays | 0.0949 | 0.0000 | ||||||
| Stay average | 0.0065 | 0.0000 | ||||||
| Financial Crisis | −0.0105 | 0.0000 | −0.0106 | 0.0000 | −0.0106 | 0.0000 | −0.0126 | 0.0000 |
| Legal form | 0.0272 | 0.0000 | 0.0304 | 0.0000 | 0.0306 | 0.0000 | 0.0317 | 0.0070 |
| Size | −0.0444 | 0.0000 | −0.0459 | 0.0000 | −0.0460 | 0.0000 | −0.0457 | 0.0000 |
| CFO | 0.1629 | 0.0000 | 0.1639 | 0.0000 | 0.1637 | 0.0000 | 0.1625 | 0.0000 |
| Leverage | −0.0567 | 0.0000 | −0.0558 | 0.0000 | −0.0554 | 0.0000 | −0.0556 | 0.0000 |
| c | 0.5455 | 0.0000 | 0.5250 | 0.0000 | 0.5257 | 0.0000 | 0.4970 | 0.0000 |
Source: Results obtained by the authors.
Publisher’s Note: MDPI stays neutral with regard to jurisdictional claims in published maps and institutional affiliations. |
© 2020 by the authors. Licensee MDPI, Basel, Switzerland. This article is an open access article distributed under the terms and conditions of the Creative Commons Attribution (CC BY) license (http://creativecommons.org/licenses/by/4.0/).
Share and Cite
MDPI and ACS Style
Alberca, P.; Parte, L. Efficiency in the Holiday and Other Short-Stay Accommodation Industry. Sustainability 2020, 12, 9493. https://0-doi-org.brum.beds.ac.uk/10.3390/su12229493
AMA Style
Alberca P, Parte L. Efficiency in the Holiday and Other Short-Stay Accommodation Industry. Sustainability. 2020; 12(22):9493. https://0-doi-org.brum.beds.ac.uk/10.3390/su12229493
Chicago/Turabian StyleAlberca, Pilar, and Laura Parte. 2020. "Efficiency in the Holiday and Other Short-Stay Accommodation Industry" Sustainability 12, no. 22: 9493. https://0-doi-org.brum.beds.ac.uk/10.3390/su12229493
Note that from the first issue of 2016, this journal uses article numbers instead of page numbers. See further details here.