Continuous Anaerobic Co-Digestion of Biowaste with Crude Glycerol under Mesophilic Conditions


1
Department of Waste and Resource Management, Faculty of Agricultural and Environmental Sciences, University of Rostock, D-18059 Rostock, Germany
2
Deutsches Biomasseforschungszentrum gGmbH, D-04347 Leipzig, Germany
*
Author to whom correspondence should be addressed.
Sustainability 2020, 12(22), 9512; https://0-doi-org.brum.beds.ac.uk/10.3390/su12229512
Submission received: 28 September 2020
/
Revised: 7 November 2020
/
Accepted: 11 November 2020
/
Published: 15 November 2020
(This article belongs to the Special Issue Sustainable Waste Technology and Management)
Abstract
:A persistent topic of the anaerobic digestion of biowaste is the efficient use of co-substrates. According to Renewable Energy Sources Act the co-substrate input is limited to 10 percent of the average daily substrate feed in Germany. In this concern, the primary focus of this paper is to understand the suitability of crude glycerol in anaerobic digestion of biowaste. Two identical lab-scale anaerobic digester units were added with crude glycerol, and each unit was equipped with four identical fermenters. Unit A was fed with an average organic loading rate of 4.5 kg VS m−3 d−1, and the average organic loading rate of unit B was set at 5.5 kg VS m−3 d−1. The share of crude glycerol in the total feed was 0.77 percent of the fresh matter. The abort criterion is a ratio of the volatile organic acids and buffer capacity (FOS/TAC) in the fermenter above 1.2. The abort criterion was reached after 16 days. In summary, the results lead us to the conclusion crude glycerol is not suitable as a co-substrate for anaerobic digestion for several reasons.
1. Introduction
Anaerobic digestion of biowaste is an established process for treating biowaste in Germany and is most common in other regions of the world. The technology of anaerobic digestion to reduce greenhouse gas emissions and to produce biogas is state-of-the-art and is used in a variety of ways [1,2]. The aerobic and anaerobic treatment of biowaste from the organic fraction of municipal solid waste or kitchen waste is well known and has already been studied by many researchers all over the world [3,4,5].
The benefits of anaerobic digestion compared to aerobic treatment (composting) are the additional production of biogas and the consequent conversion in electricity and heat by combined heat and power modules. To increase the biogas yield in a fermentation plant and to strengthen the biocenosis, several modifications in the process are feasible such as the use of biochar and the co-digestion of suitable co-substrates. Biochar can catalyze anaerobic digestion by alleviating mild ammonia inhibition, support archaeal growth, and methanize labile carbon present in the biochar [6]. Biochar is proven to have positive effects during anaerobic digestion by shortening the lag phase, enabling easy degradation of biomass, and supporting the bacteria colonies [7]. Further, biochar acts as a conductor for electron transfer among species, a sorbent for indirect inhibitors, and a reactant in biochar labile carbon, consequently improving the methane production rate [6,7,8]. Mumme et al. (2016) investigated the influence of utilizing pyrochar (biochar from pyrolysis) and hydrochar (biochar from hydrothermal carbonization) in anaerobic digestion and their effects on biogas yield and ammonia inhibition. The investigation results showed that there is no clear effect from utilizing pyrochar on methane production; however, hydrochar utilization increased the methane yield by 32%.
The current research focuses exclusively on the use of co-substrates in the anaerobic treatment of biogas [9,10]. According to German Renewable Energy Sources Act - EEG 2017, the use of co-substrates is limited to 10% of the average daily feed of biowaste [11]. Restrictions on the use of co-substrates are country-specific and depend on the available biomass. The use of co-substrates has several advantages such as the increase of the specific biogas yield and higher process stability caused by the variety of the substrates. To increase the biogas yield and the income, the use of co-substrates should be optimized by adapted substrate management.
The use of compost from aerobically treated fermented residues of anaerobic biowaste is the most common practice in Germany, provided the pollutants in the produced compost are within the set limits The advantage of using fermentation residues from regenerative sources is the conservation of natural resources, which would be used for the production of conventional fertilizers.
In recent decades, biodiesel has been produced at the industrial scale in Europe, North and South America, and Asia. In 2019, 38.835 million liters of biodiesel were produced worldwide [12]. Various raw materials such as vegetable oils (rapeseed oil, soya oil, palm oil), fats from used feedstocks, or animal fats can be used to produce biodiesel. Worldwide biodiesel production is concentrated primarily in the European Union (market share 37%) and in North and South America [13].
Vegetable oils can be classified into short-chain (SFA), monounsaturated (MUFA), and polyunsaturated (PUFA) oils. Rapeseed oil is the main source to produce biodiesel in Germany and oleic acid is the main component of rapeseed oil (Table 1). Biodiesel is often produced from other plants such as soya, palm, sunflowers, and edible oils worldwide [13,14]. Other oil plants include flax, jatropha, castor oil plant and olive, although their importance for biodiesel production is currently also of minor importance [15]. Through targeted breeding, the content of harmful erucic acid was reduced, and rapeseed varieties with high oleic acid content were specifically used in agriculture.
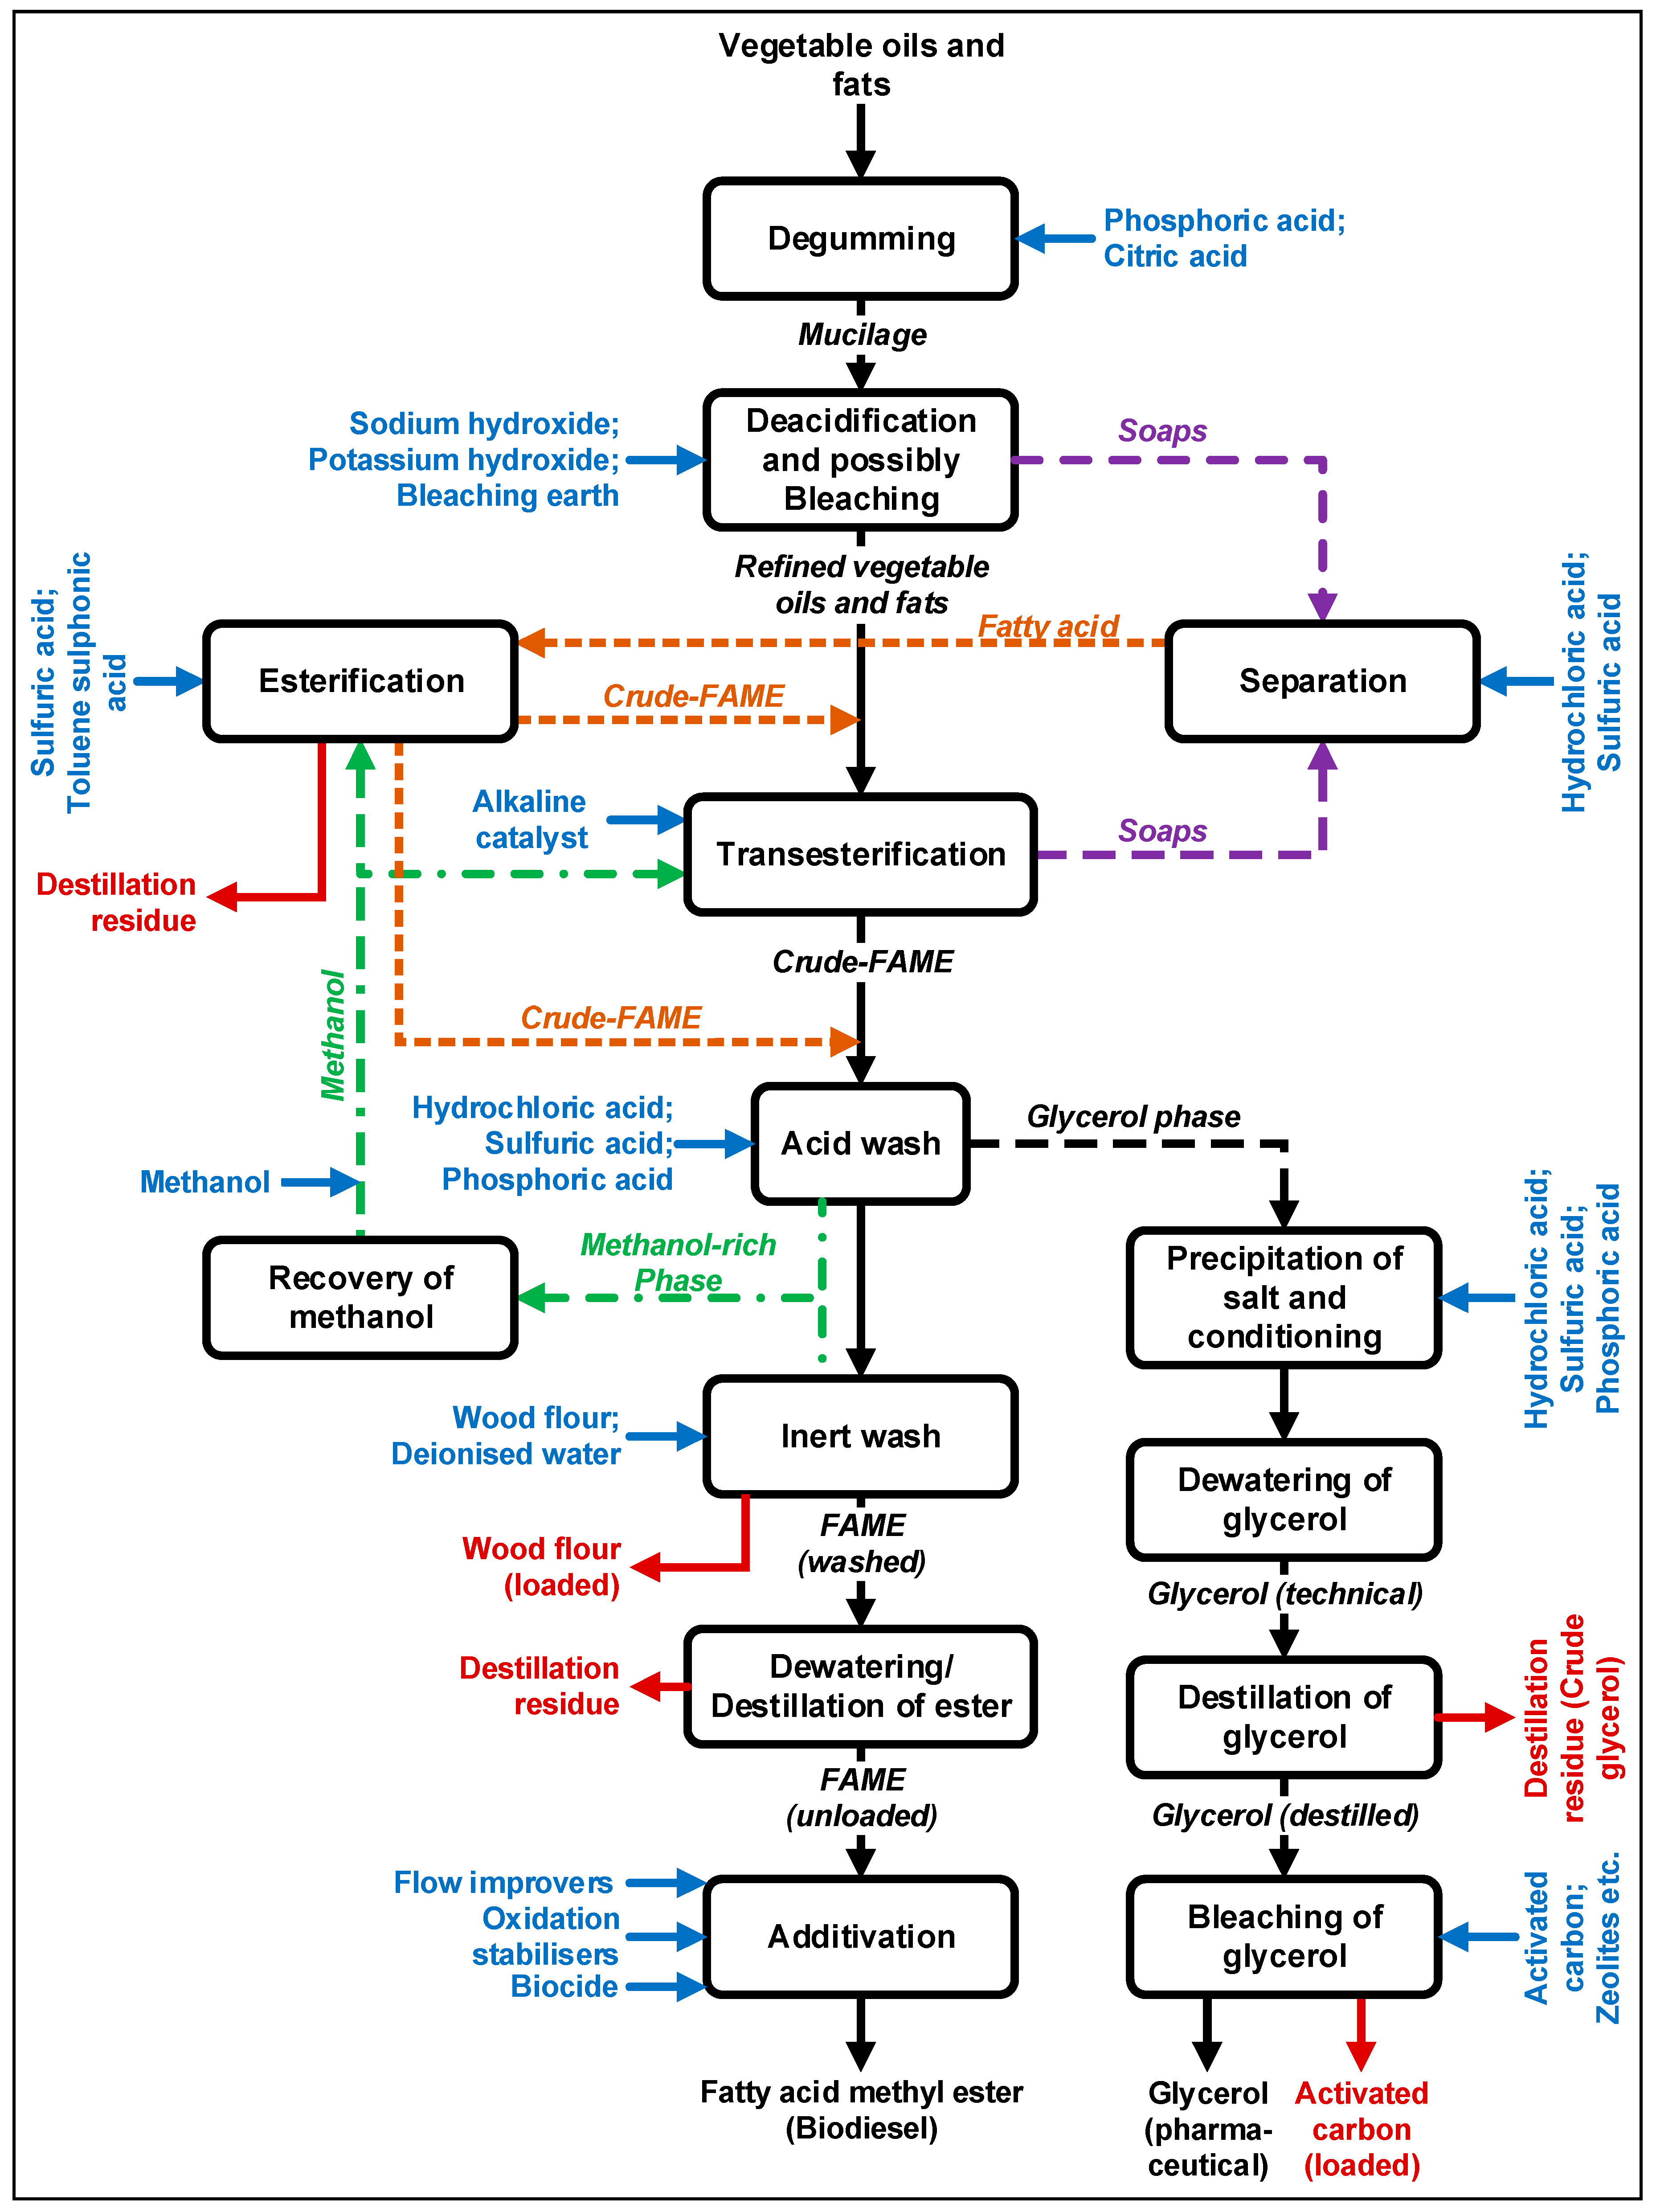
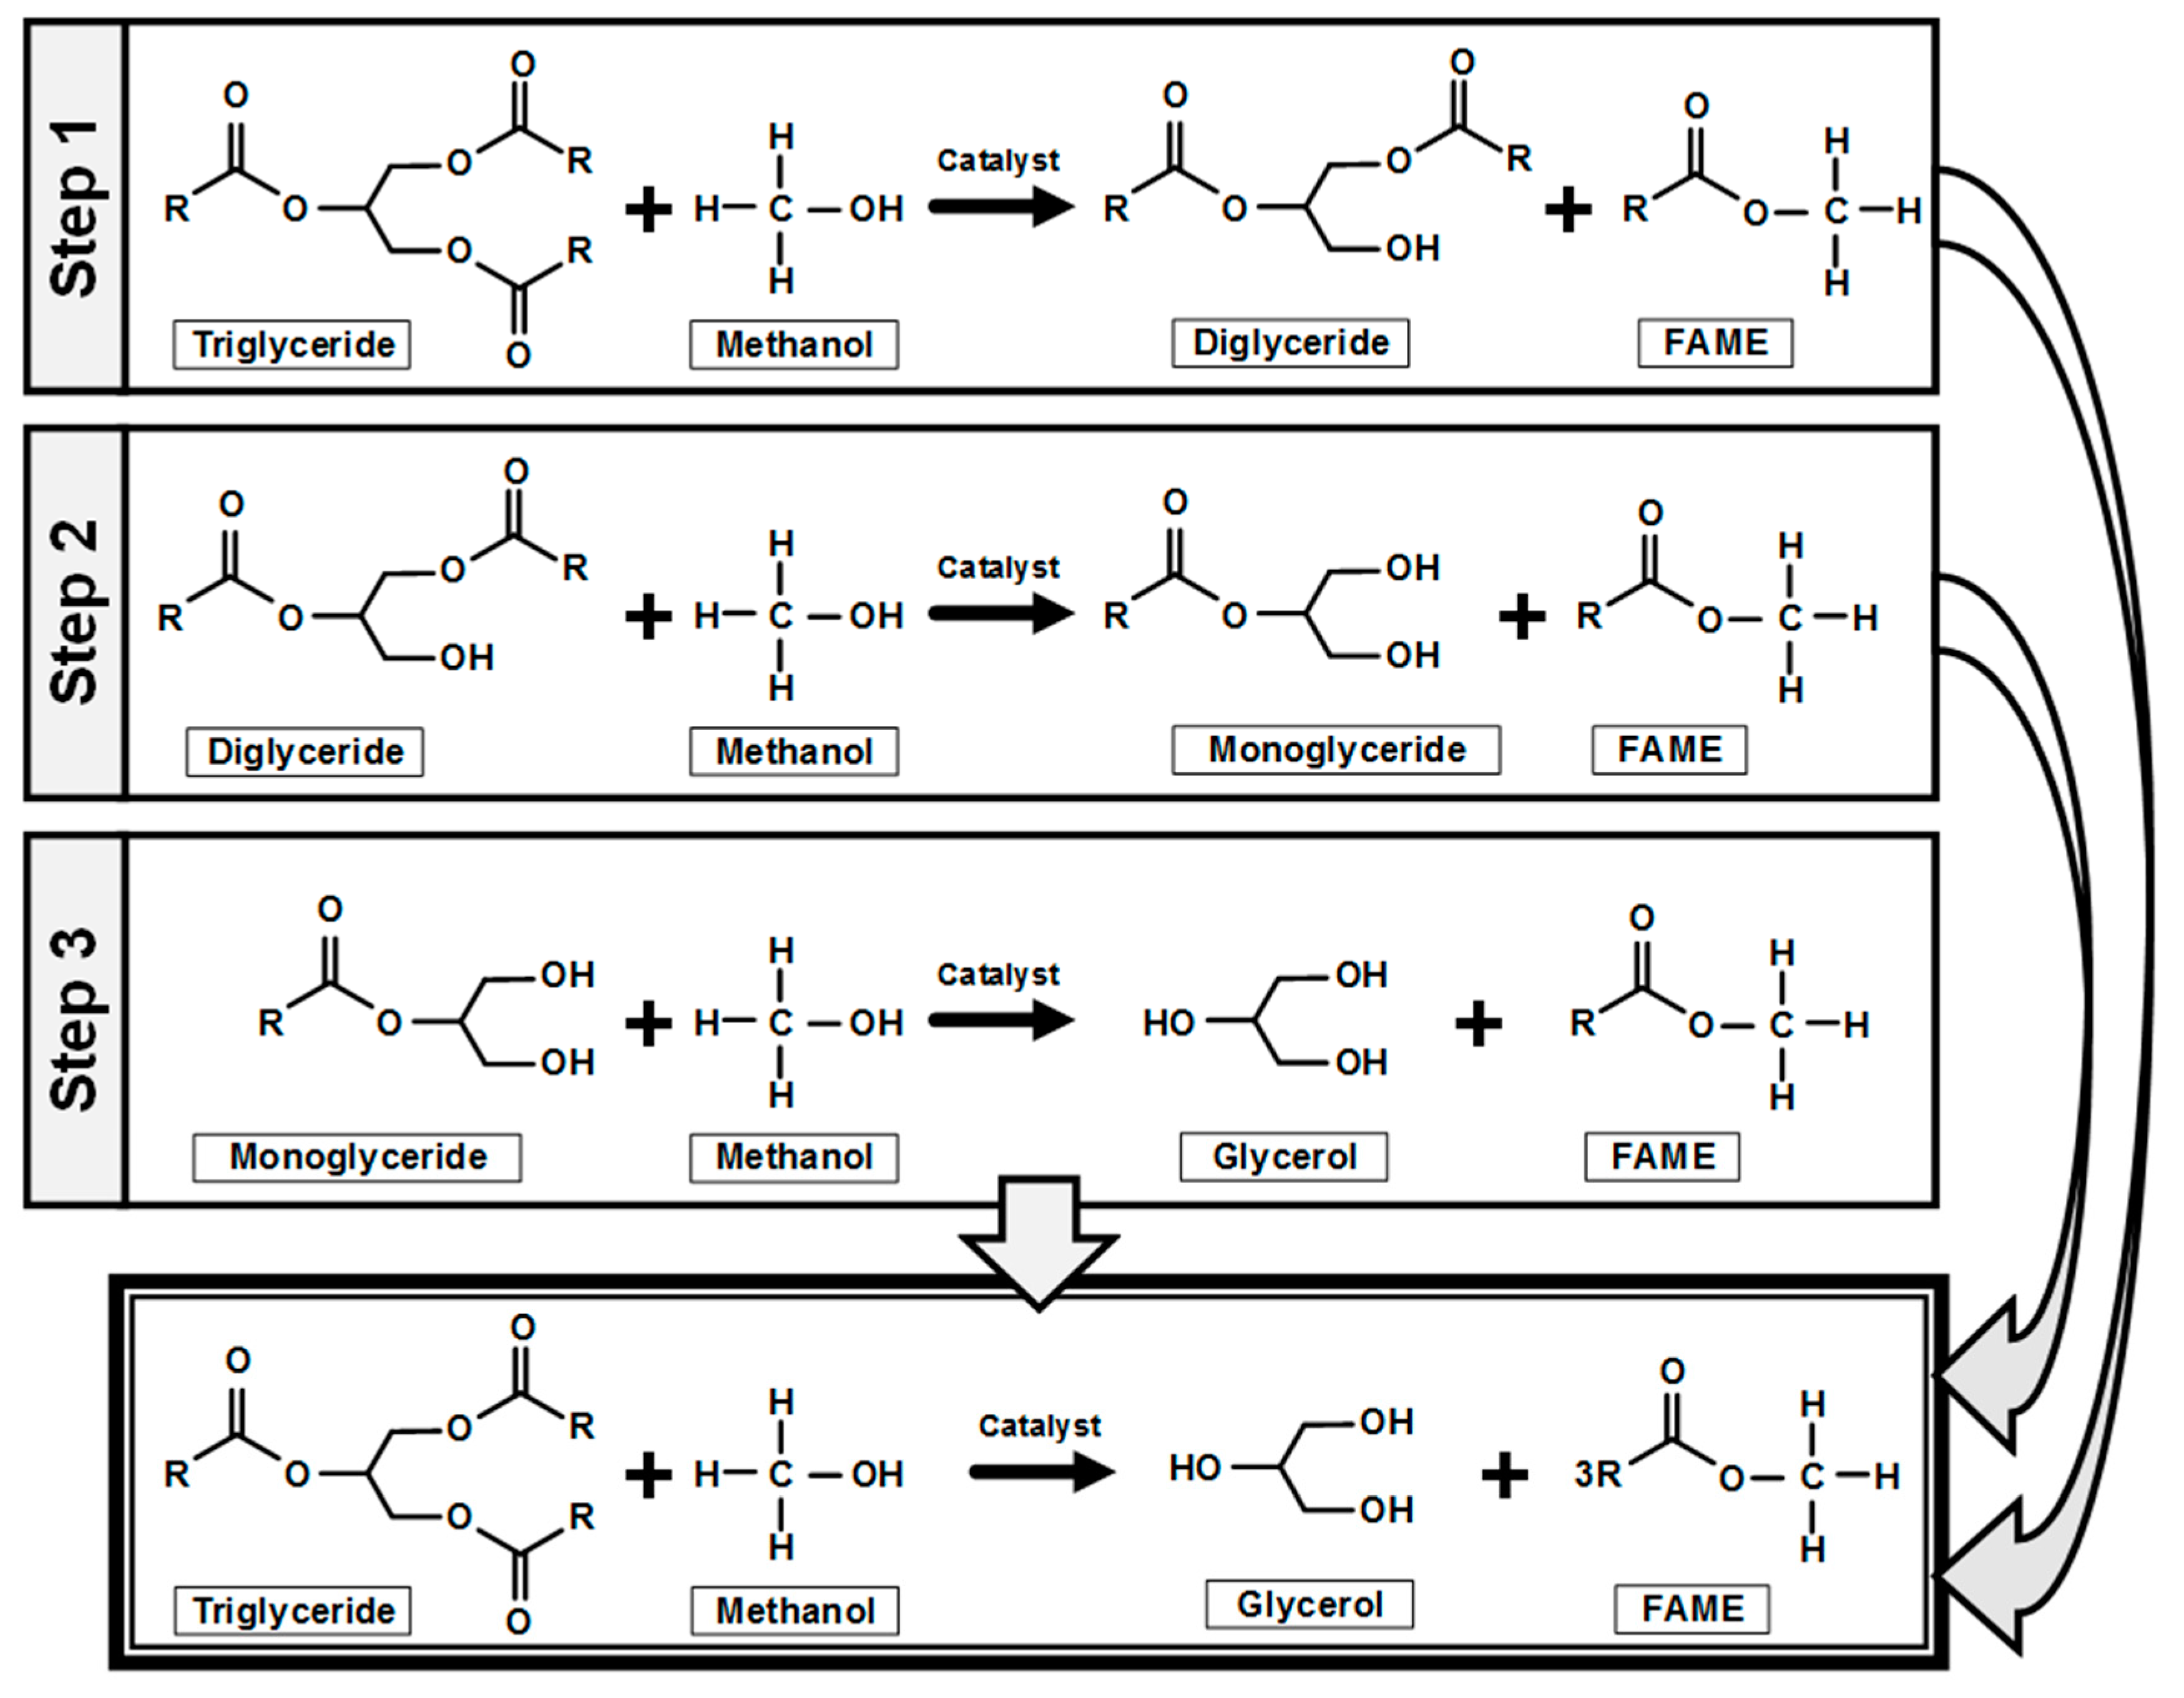
The production of biodiesel is characterized by catalyzed transesterification (Figure 1 and Figure 2) with alcohol (most likely methanol), together with a catalyst to improve the reaction rate and yield [17]. The main by-product of the production of biodiesel is crude glycerol which is 10 percent of the raw weight of the initial substrate [9,10]. Contents of crude glycerol are glycerol, alcohol, water, salts, soapstock, heavy metals, free fatty acids, mono, di- and triglycerides, and methyl esters [10,18,19]. The concentration varies depending on the source of oil (animal or vegetable) and the used technology for biodiesel production [19].
The use and function of glycerol in anaerobic digestion has been studied in many ways [23,24]. According to the quality parameters, the glycerol content in purified and refined glycerol is more than 99 percent of fresh matter. The glycerol content in crude glycerol is in the range of 60 to 80 percent of fresh matter [20]. Other literature sources indicate a glycerol content of around 50% [9,25]. Crude glycerol, which is a by-product of the dewatering process, has also been studied, and anaerobic fermentation experiments are often carried out in batch or continuous tests with other substrates as mono or co-fermentation [10,18,25,26]. To investigate the suitability of crude glycerol from biodiesel production as a co-substrate in anaerobic digestion of biowaste, an anaerobic continuous test was performed by the University of Rostock. The anaerobic digestion is often characterized by the four-stage model. The stages are hydrolysis, acidogenesis, acetogenesis, and methanogenesis distributed based on their intermediate products and metabolites [27]. The key stages of the anaerobic digestion process are described several times [25,28,29]. The main products are fermenter residues and biogas, with the main components of methane, carbon dioxide, and with traces of ammonia, hydrogen sulfide, hydrogen, and nitrogen.
The energetic transformation of crude glycerol and other products of the transesterification process on feedstocks such as sewage sludge has also been studied by many other researchers [24,25,26,30]. The fundamental focus of this research is to understand the influence of crude glycerol on the anaerobic degradation of biowaste from the separate collection in Germany.
2. Materials and Methods
2.1. Experimental Setup
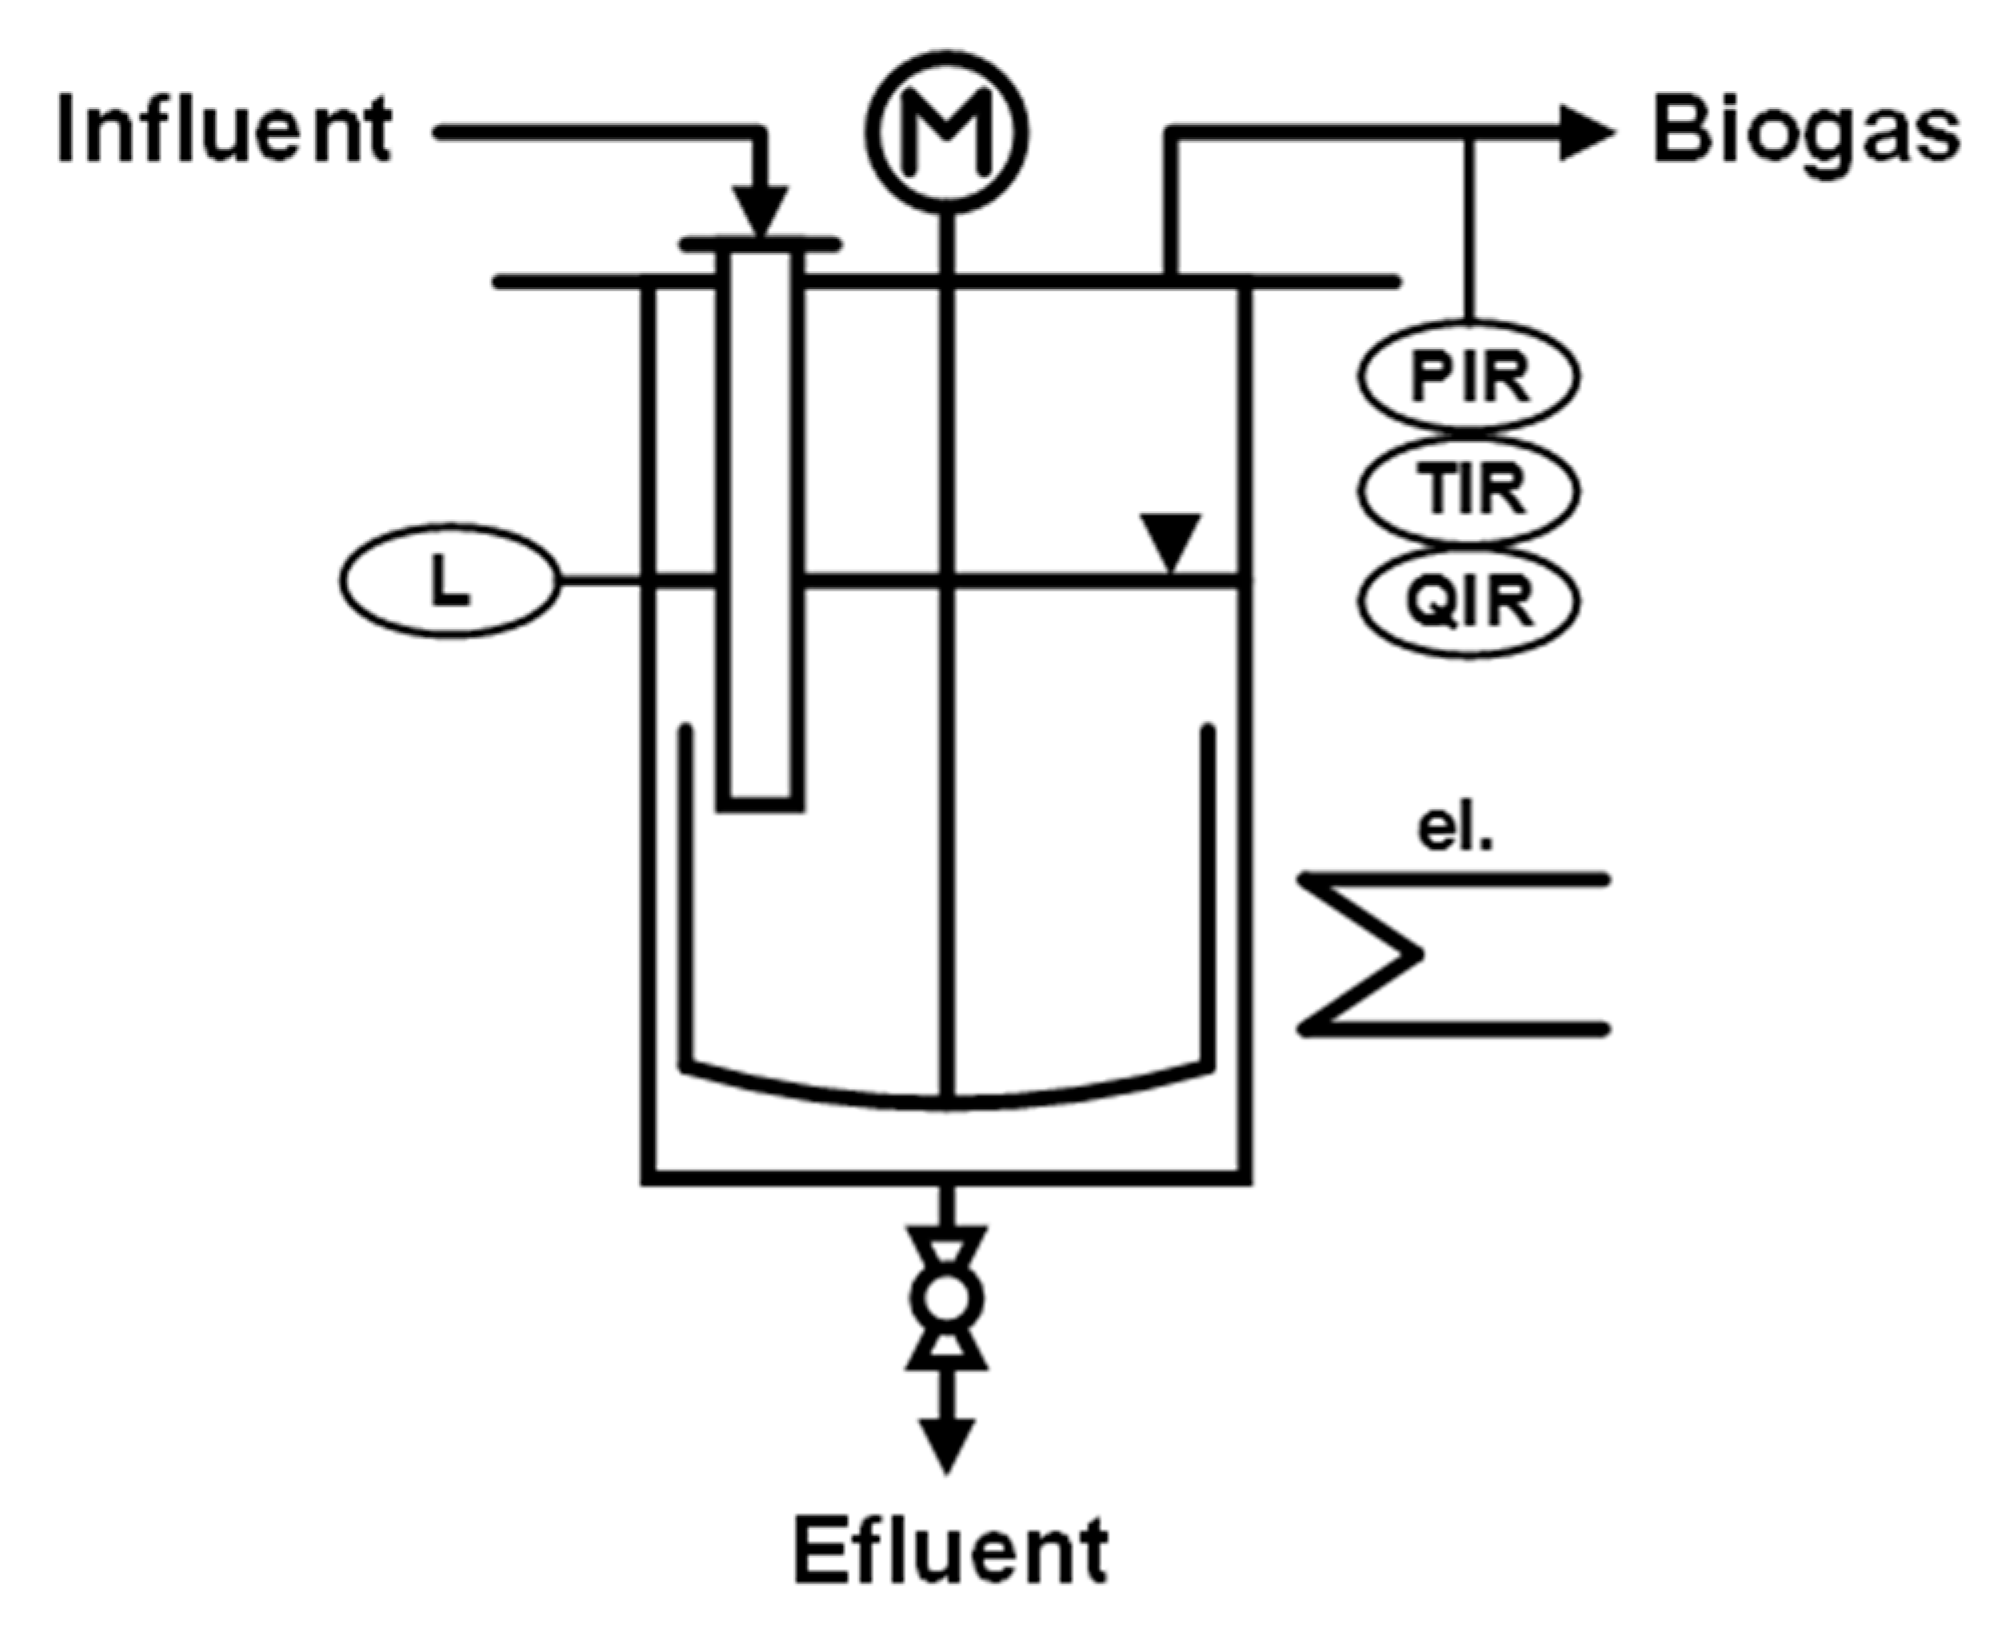
Two experimental units with four identical custom-made fermenters (Figure 3) per unit with a working volume of 20 L were used. Each fermenter was equipped with a milligas counter (Ritter MGC 1), and the biogas yield was continuously recorded by the data acquisition software RIGAMO (Dr.-Ing. RITTER Apparatebau GmbH & Co. KG, Bochum, Germany). Furthermore, the biogas was collected in gas collection bags, and the gas composition was measured several times per week with a gas analyser Visit 03 (Messtechnik EHEIM GmbH, Schwaigern, Germany). The components methane (CH4), carbon dioxide (CO2), hydrogen sulfide (H2S), and oxygen (O2) were measured. The components methane and carbon dioxide were measured by infrared spectrometry, and electrochemical sensors were used for hydrogen sulfide and oxygen. The process temperature under mesophilic conditions was regulated by circulating fresh air from a heater. All fermenters were capsuled by an insulation system. The liquid phase of the digester had a semi-continuous stirrer connected to an anchor stirrer with variable rotation per minute and stirring intervals. Depending on the daily feed, the hydraulic retention time was set at 29 days in unit A and 24 days in unit B. Every unit was fed with a defined mixture of biowaste and crude glycerol from diesel production. The digester was fed and purged by hand two times every day via a feeding tube extending from above to below the filling level. The fermentation residues were also removed manually via a ball valve at the bottom. During the weekend, the fermenters were not fed; as a result, a decrease in specific gas production over the weekend could be expected.
Once a week, a portion was defrosted and the daily feeding rations for each fermenter were prepared for the coming week. The daily substrate mixture was prepared and frozen in a fridge chamber at 20 °C. These individual portions were defrosted at 4 °C at the respective feeding time and put into the corresponding fermenter. Unit A was fed with an average organic loading rate (OLR) of 4.5 kg VS m−3 d−1. The average OLR of unit B was 5.5 kg VS m−3 d−1. The share of crude glycerol in the total feed (based on fresh matter) was 0.77% of the fresh matter in both units. The fermentation residue was removed once a week via the ball valve located at the bottom of the fermenter. The filling level, which rises slightly during the week, was reset to the nominal value. The following analyses were carried out on the contents of the fermenter:
- Total solids, volatile solids (usually as a mixed sample for the whole group);
- Volatile organic acids (FOS), titration (buffer capacity—TAC) for each fermenter;
- Fermentation acid pattern (GC-FID) for each fermenter.
An inoculum acclimatization period was not performed because the inoculum was taken from a previous experiment with adapted inoculum. The abort criterion was a FOS/TAC ratio of more than 1.2 or stable process conditions in each unit of a function of occurrence.
2.2. Biowaste, Crude Glycerol, and Inoculum Origin
Sewage sludge was used as an inoculum and was obtained by a wastewater treatment plant in Rostock with a total solid content of 6.4 percent and a volatile solid content of 4.6 percent in the fresh matter. The use of untreated, uninhibited digested sludge is recommended due to the diverse biocenosis of such sludge [28,31]. Sewage sludge usually has a long hydraulic residence time with a low organic load and consequently a low endogenous methane production [3,32]. For this reason, sewage sludge is often used as inoculum for continuous and discontinuous anaerobic digestion tests. After sampling, the sewage sludge was used in time.
Crude glycerol was obtained from an industrial plant that mainly produces biodiesel through transesterification of rapeseed oil. The glycerol had to be prepared before use to change the properties of the material. This preparation consisted of temperature conditioning to 36 °C in a heating chamber.
The used biowaste comes from the separate collection of biowaste from the state capital Schwerin and was created as a blend of biowaste from rural and urban areas. The total solids and volatile solids of the biowaste were 38.0 percent and 24.4 percent in the fresh matter. Detailed studies on the qualitative and quantitative properties of biogas have already been published in recent years by the authors [33,34,35].
2.3. Analytical Procedure and Methods
Biogas yield and temperature in the fermenter was measured continuously. The biogas quality, conductivity, volatile organic acid, buffer capacity ratio, pH value, and acid spectrum were measured periodically. Conductivity and pH values are measured by a Hach HQ 40 d multi-function meter (Hach Lange GmbH, Düsseldorf, Germany). By determining the conductivity, it was possible to determine fluctuations in the salt content in the fermenter [36].
Volatile organic acids and buffer capacity were analyzed with a Hach TitraLab AT1000 (Dr.-Ing. RITTER Apparatebau GmbH & Co. KG, Bochum, Germany) Samples were taken from each fermenter and centrifuged for 20 min at 6000 rpm to remove the solids and main contamination. Several buffers are present in the degradation process such as carbonate, phosphate, ammonium, and volatile fatty acids [29]. The carbon buffer system keeps the reactor at pH 7 and is most important. To determine the buffer capacity (TAC) of the carbon buffer system as lime reserve, the 0.1 N H2SO4 consumption up to pH 5.0 was measured [37]. The organic acids (FOS) found in the digester have their acid constant in the pH range between pH 5.0 and pH 4.4 and can be displaced by sulfuric acid with an acid constant of −3.9 pKs. Therefore, a qualitative statement can be made about the content of volatile organic acids (FOS) expressed as acetic acid equivalent [38]. The ratio of both parameters as FOS/TAC has meanwhile found widespread application in assessing the process stability of biogas plants.
A gas chromatograph equipped with an autosampler, a split–splitless injector, a polar capillary column (Free fatty acids phase (FFAP): length 30 m; 0.25 mm inner diameter; 0.25 µm film thickness), and a flame ionization detector set at 240 °C were used for the analyses of acids. The injection system was set at 220 °C and was equipped with a 10 µL syringe and a straight split liner with wool. The injection mode was split by a ratio of 1:20, and the injection volume was 0.6 µL. A one-ramp oven program was used: Initial temperature 40 °C for one minute and 10 °C/min up to 220 °C with a 5-min final hold. Hydrogen was used as the carrier gas with a column flow of 1,8mL/min. The gas flows for the flame were 35 mL/min for hydrogen, 400 mL/min for synthetic air, and 30mL/min for the make-up gas nitrogen.
3. Results
3.1. Specific Methane Yield
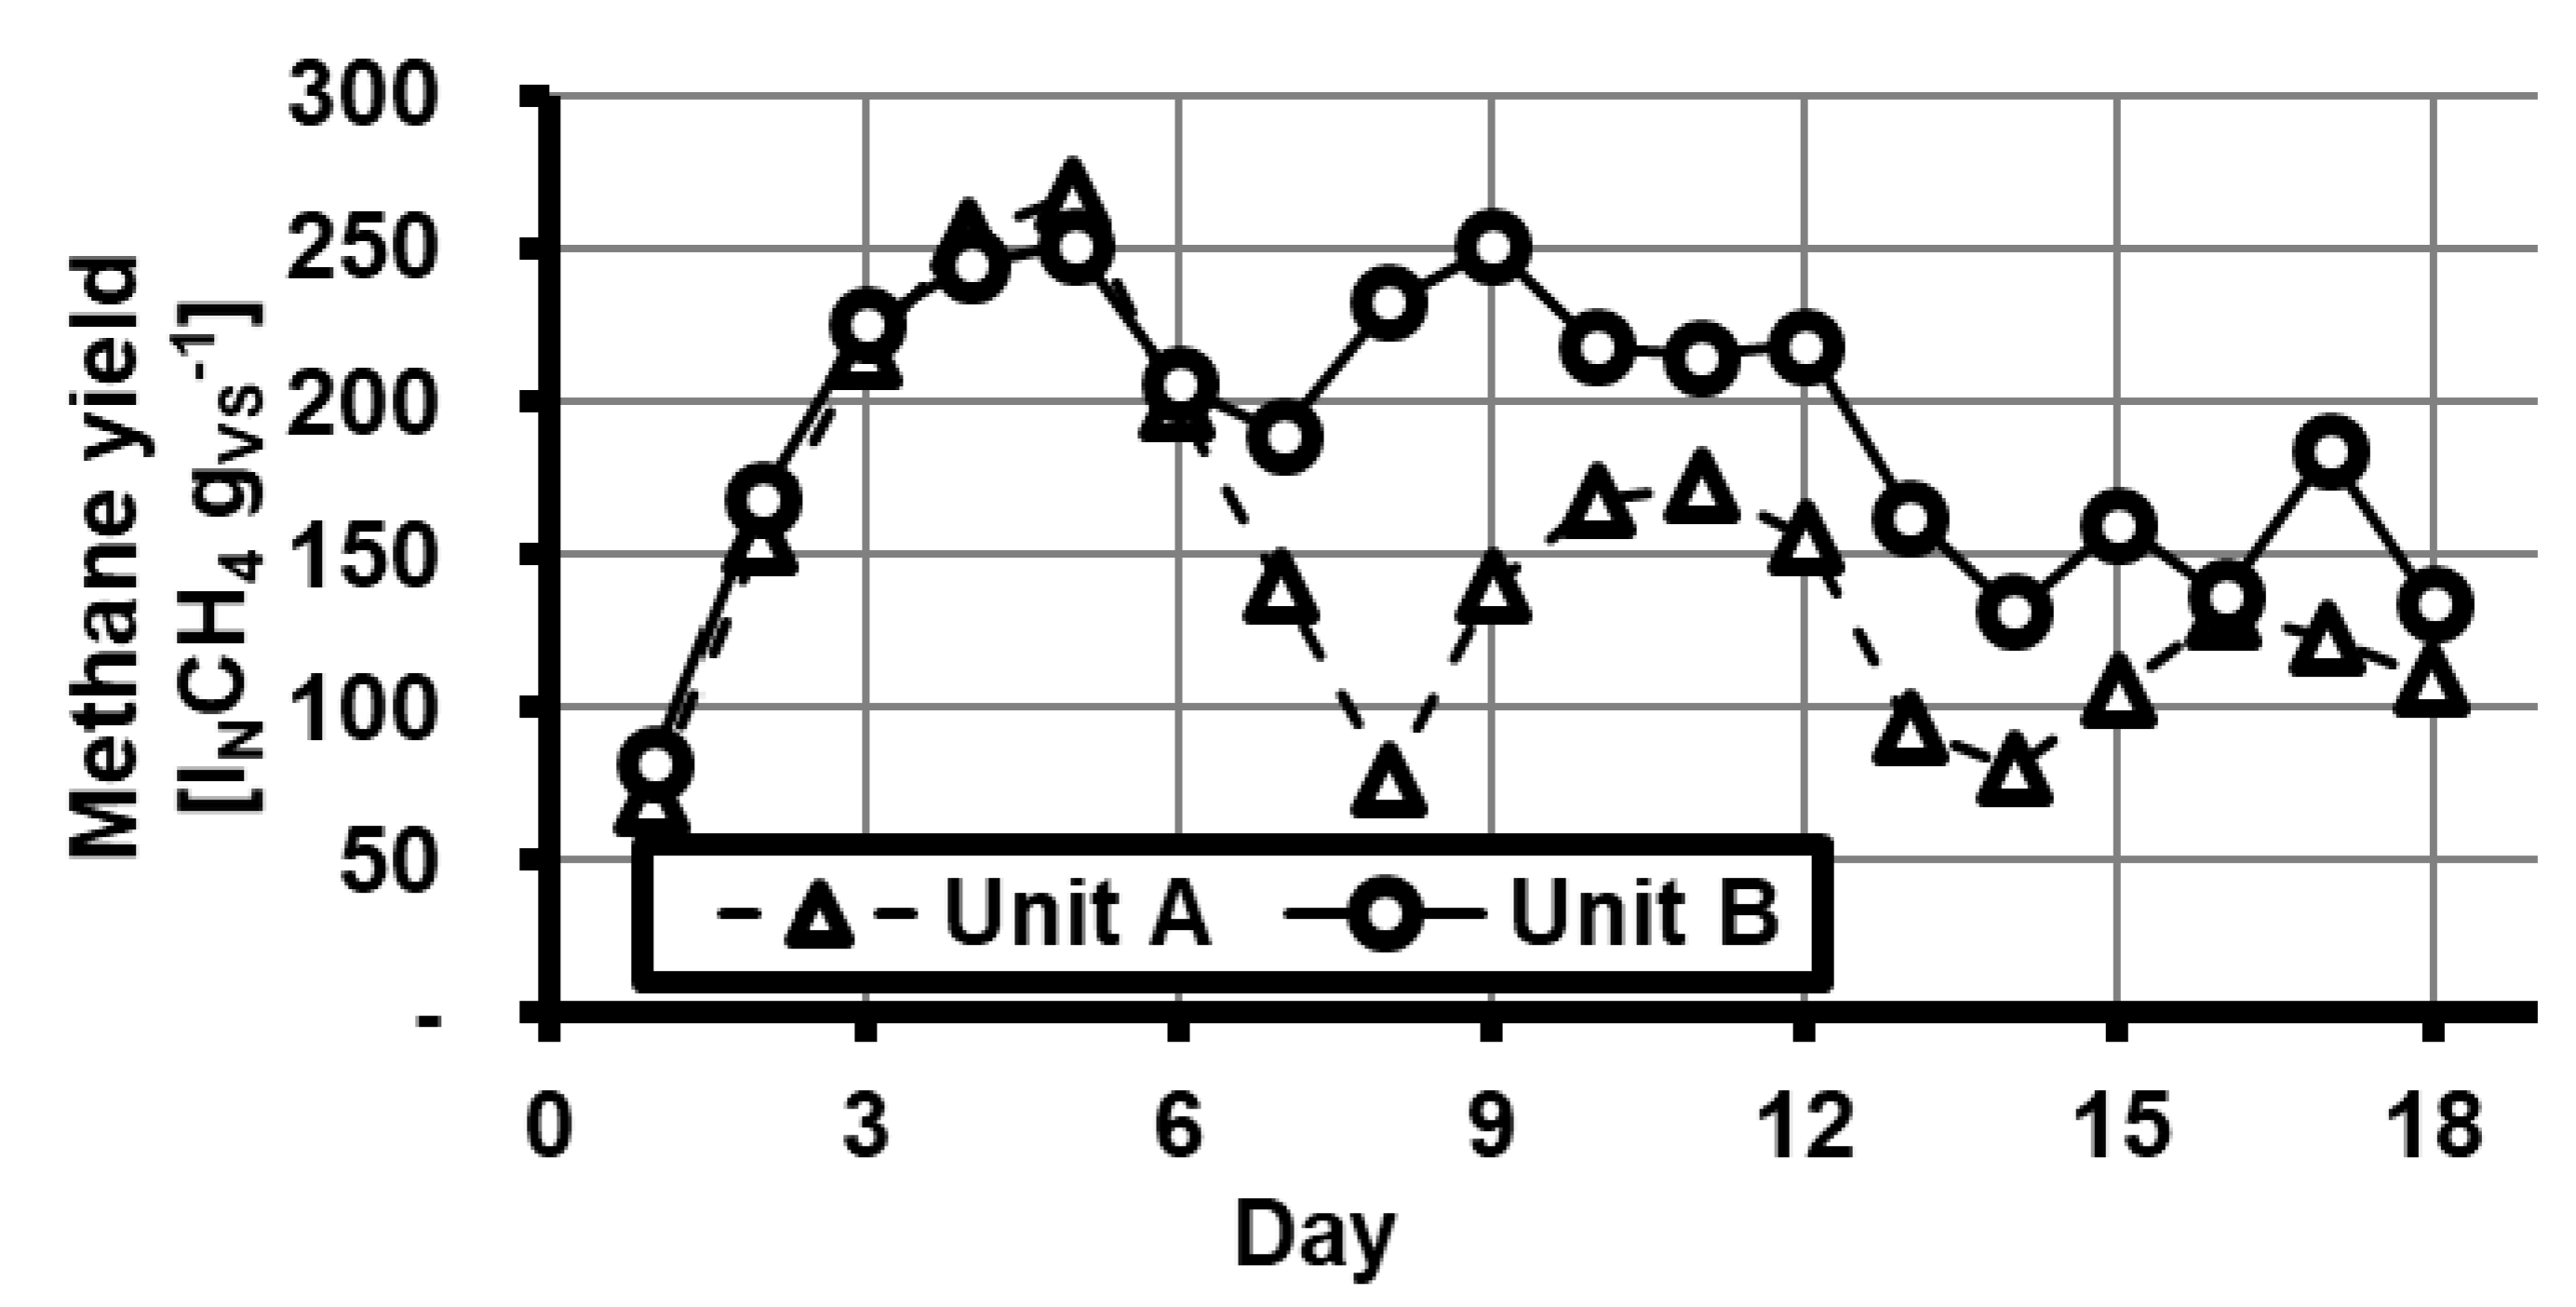
The specific methane yield had reached its maximum in both units by the end of the first week. The values of unit B were constantly higher than the values of unit A starting from week two. The achieved methane values in week 1 were comparable with values from the monofermentation of biowaste under stable conditions [39]. The theoretical biogas yield depends on the content of carbohydrates, proteins, and fats in the substrate [31]. These components were cleaved by enzymes. The cleaved products were then diffused and metabolized by bacteria. Metabolic products from higher molecular compounds were also released into the environment and ideally metabolized by specialized microorganisms. Otherwise, the process could be disrupted. The maximum methane yield in Figure 4 is comparable with the methane yield of pure biowaste from monofermentation in a previous test [34]. The standard deviation of the measurement series is very diverse. While the standard deviation in unit B was up to 22.43, it rose to 139 in unit A. Overall, the values in unit A show unsteady characteristics.
3.2. Methane Content in Biogas
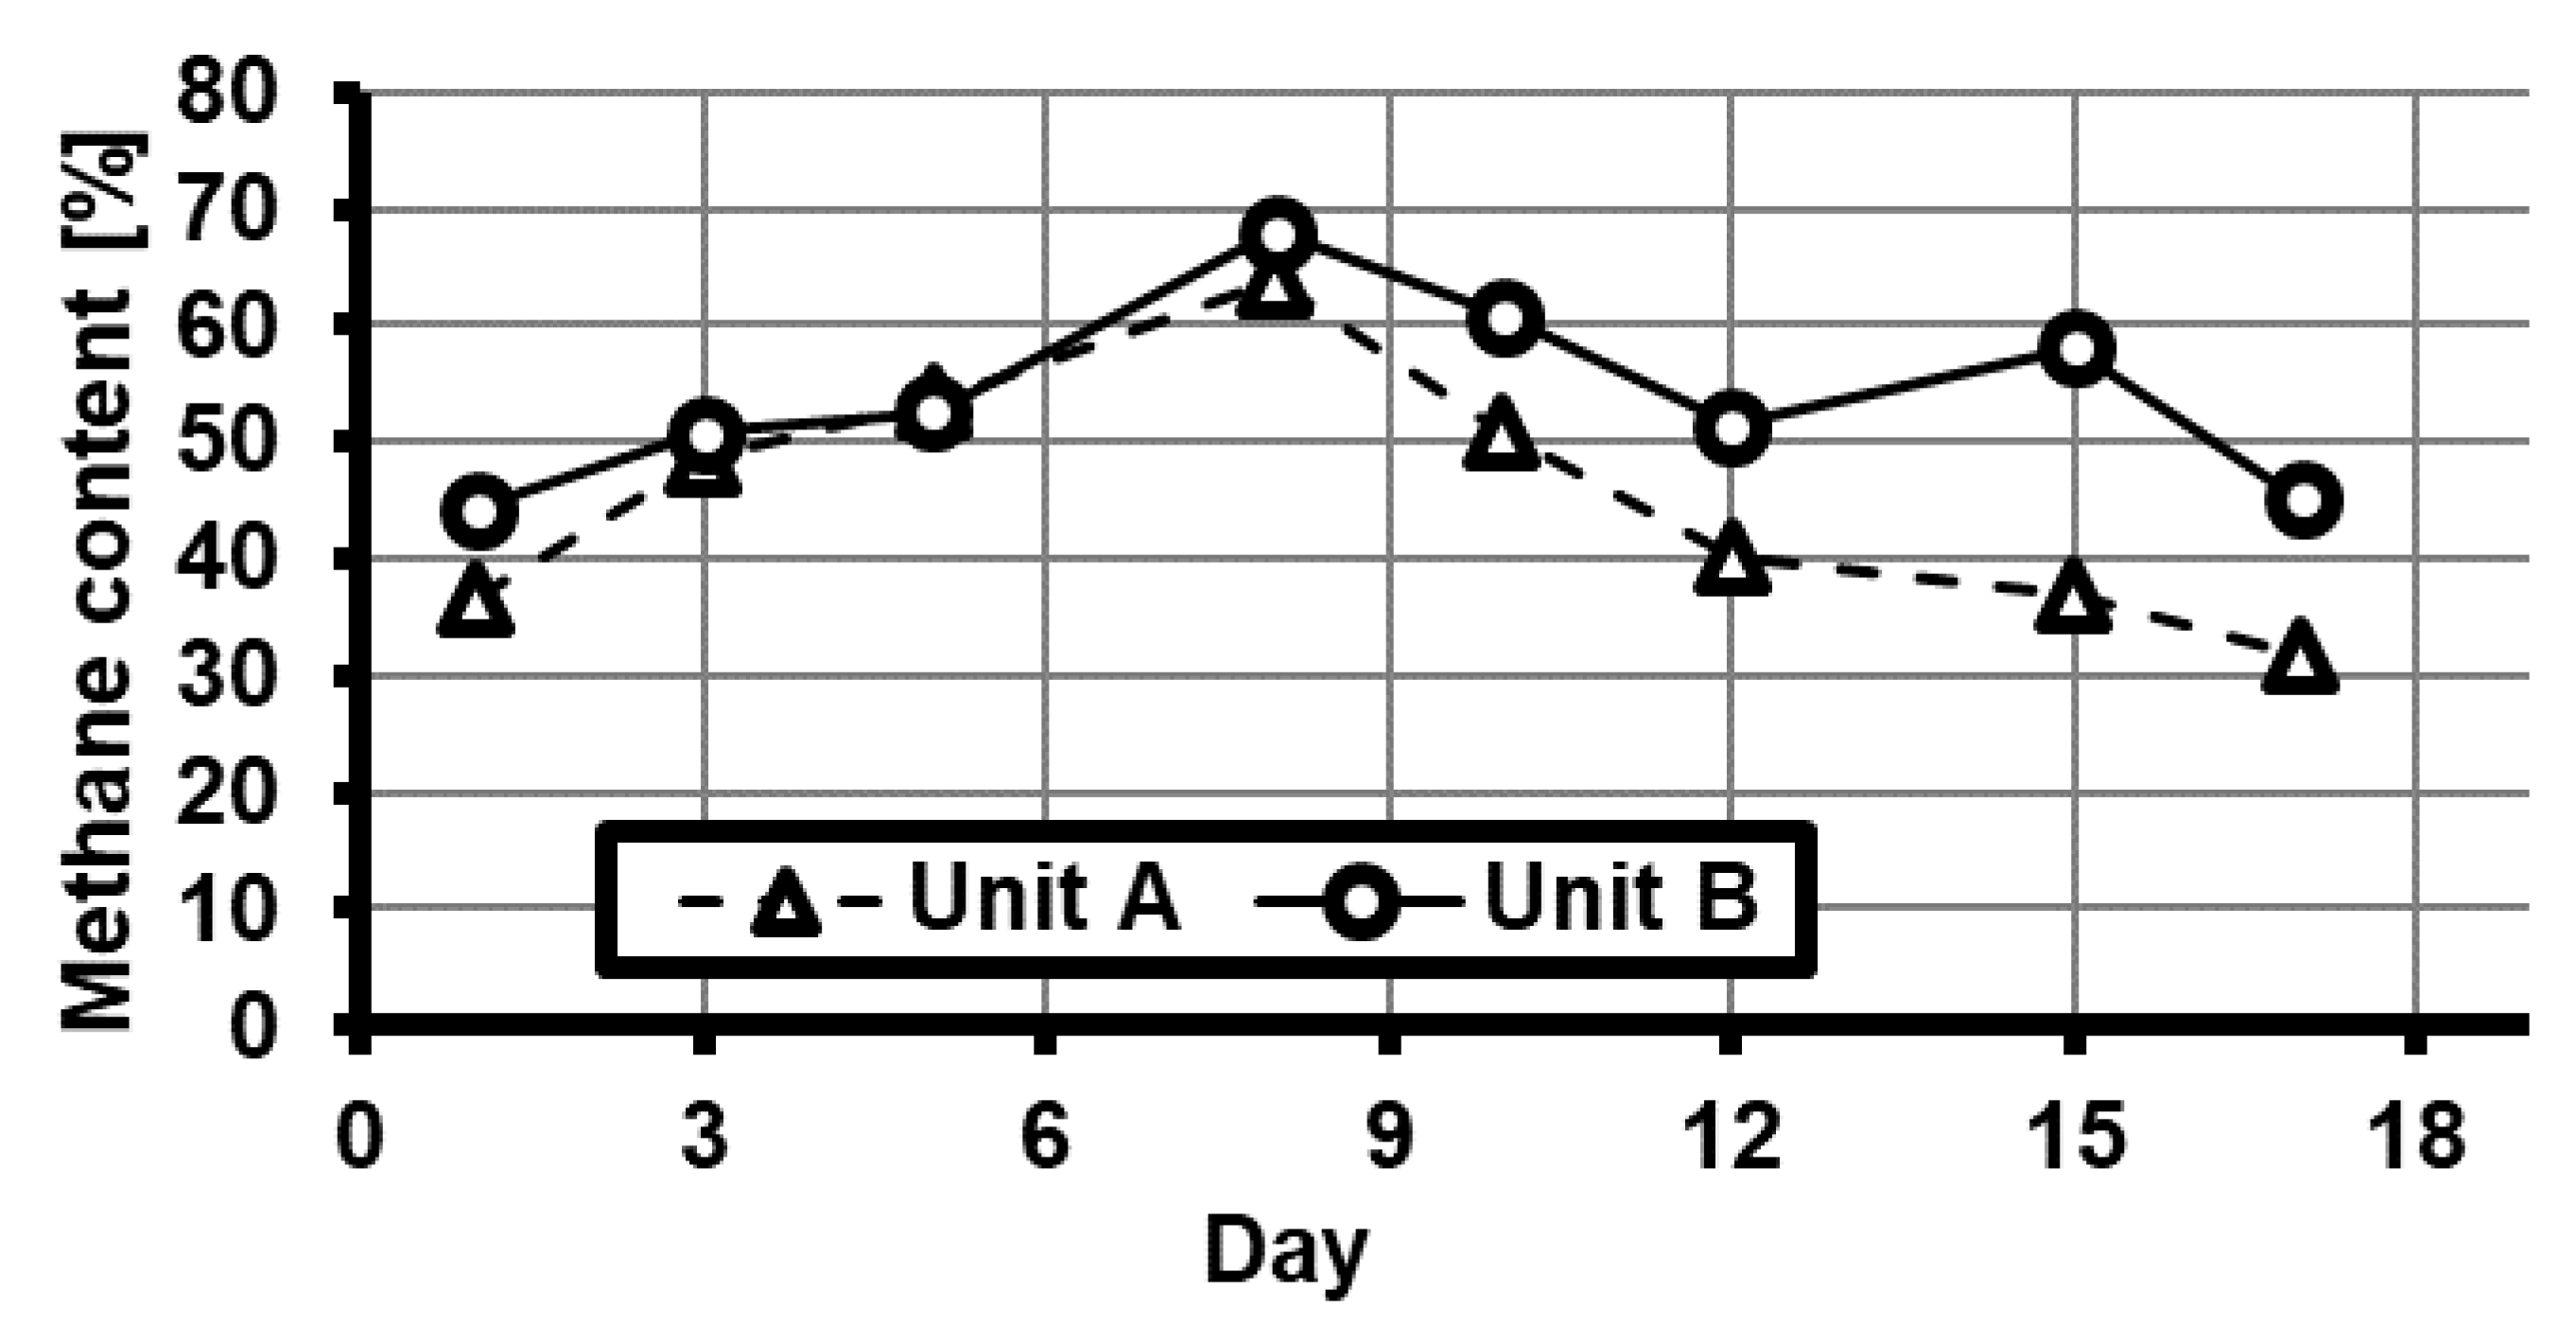
The methane content in biogas during the experiment ranged from 31.6% to 69.9% (Figure 5). Furthermore, the maximum methane content in biogas was reached after one week in both units. The minimum methane content was reached after 17 days. The decreasing methane content was associated with a decreasing gas yield. The average methane content of unit A can be found under the average methane content of unit B, depending on the organic loading rates of units A and B.
3.3. pH Value and Acids in the Effluent
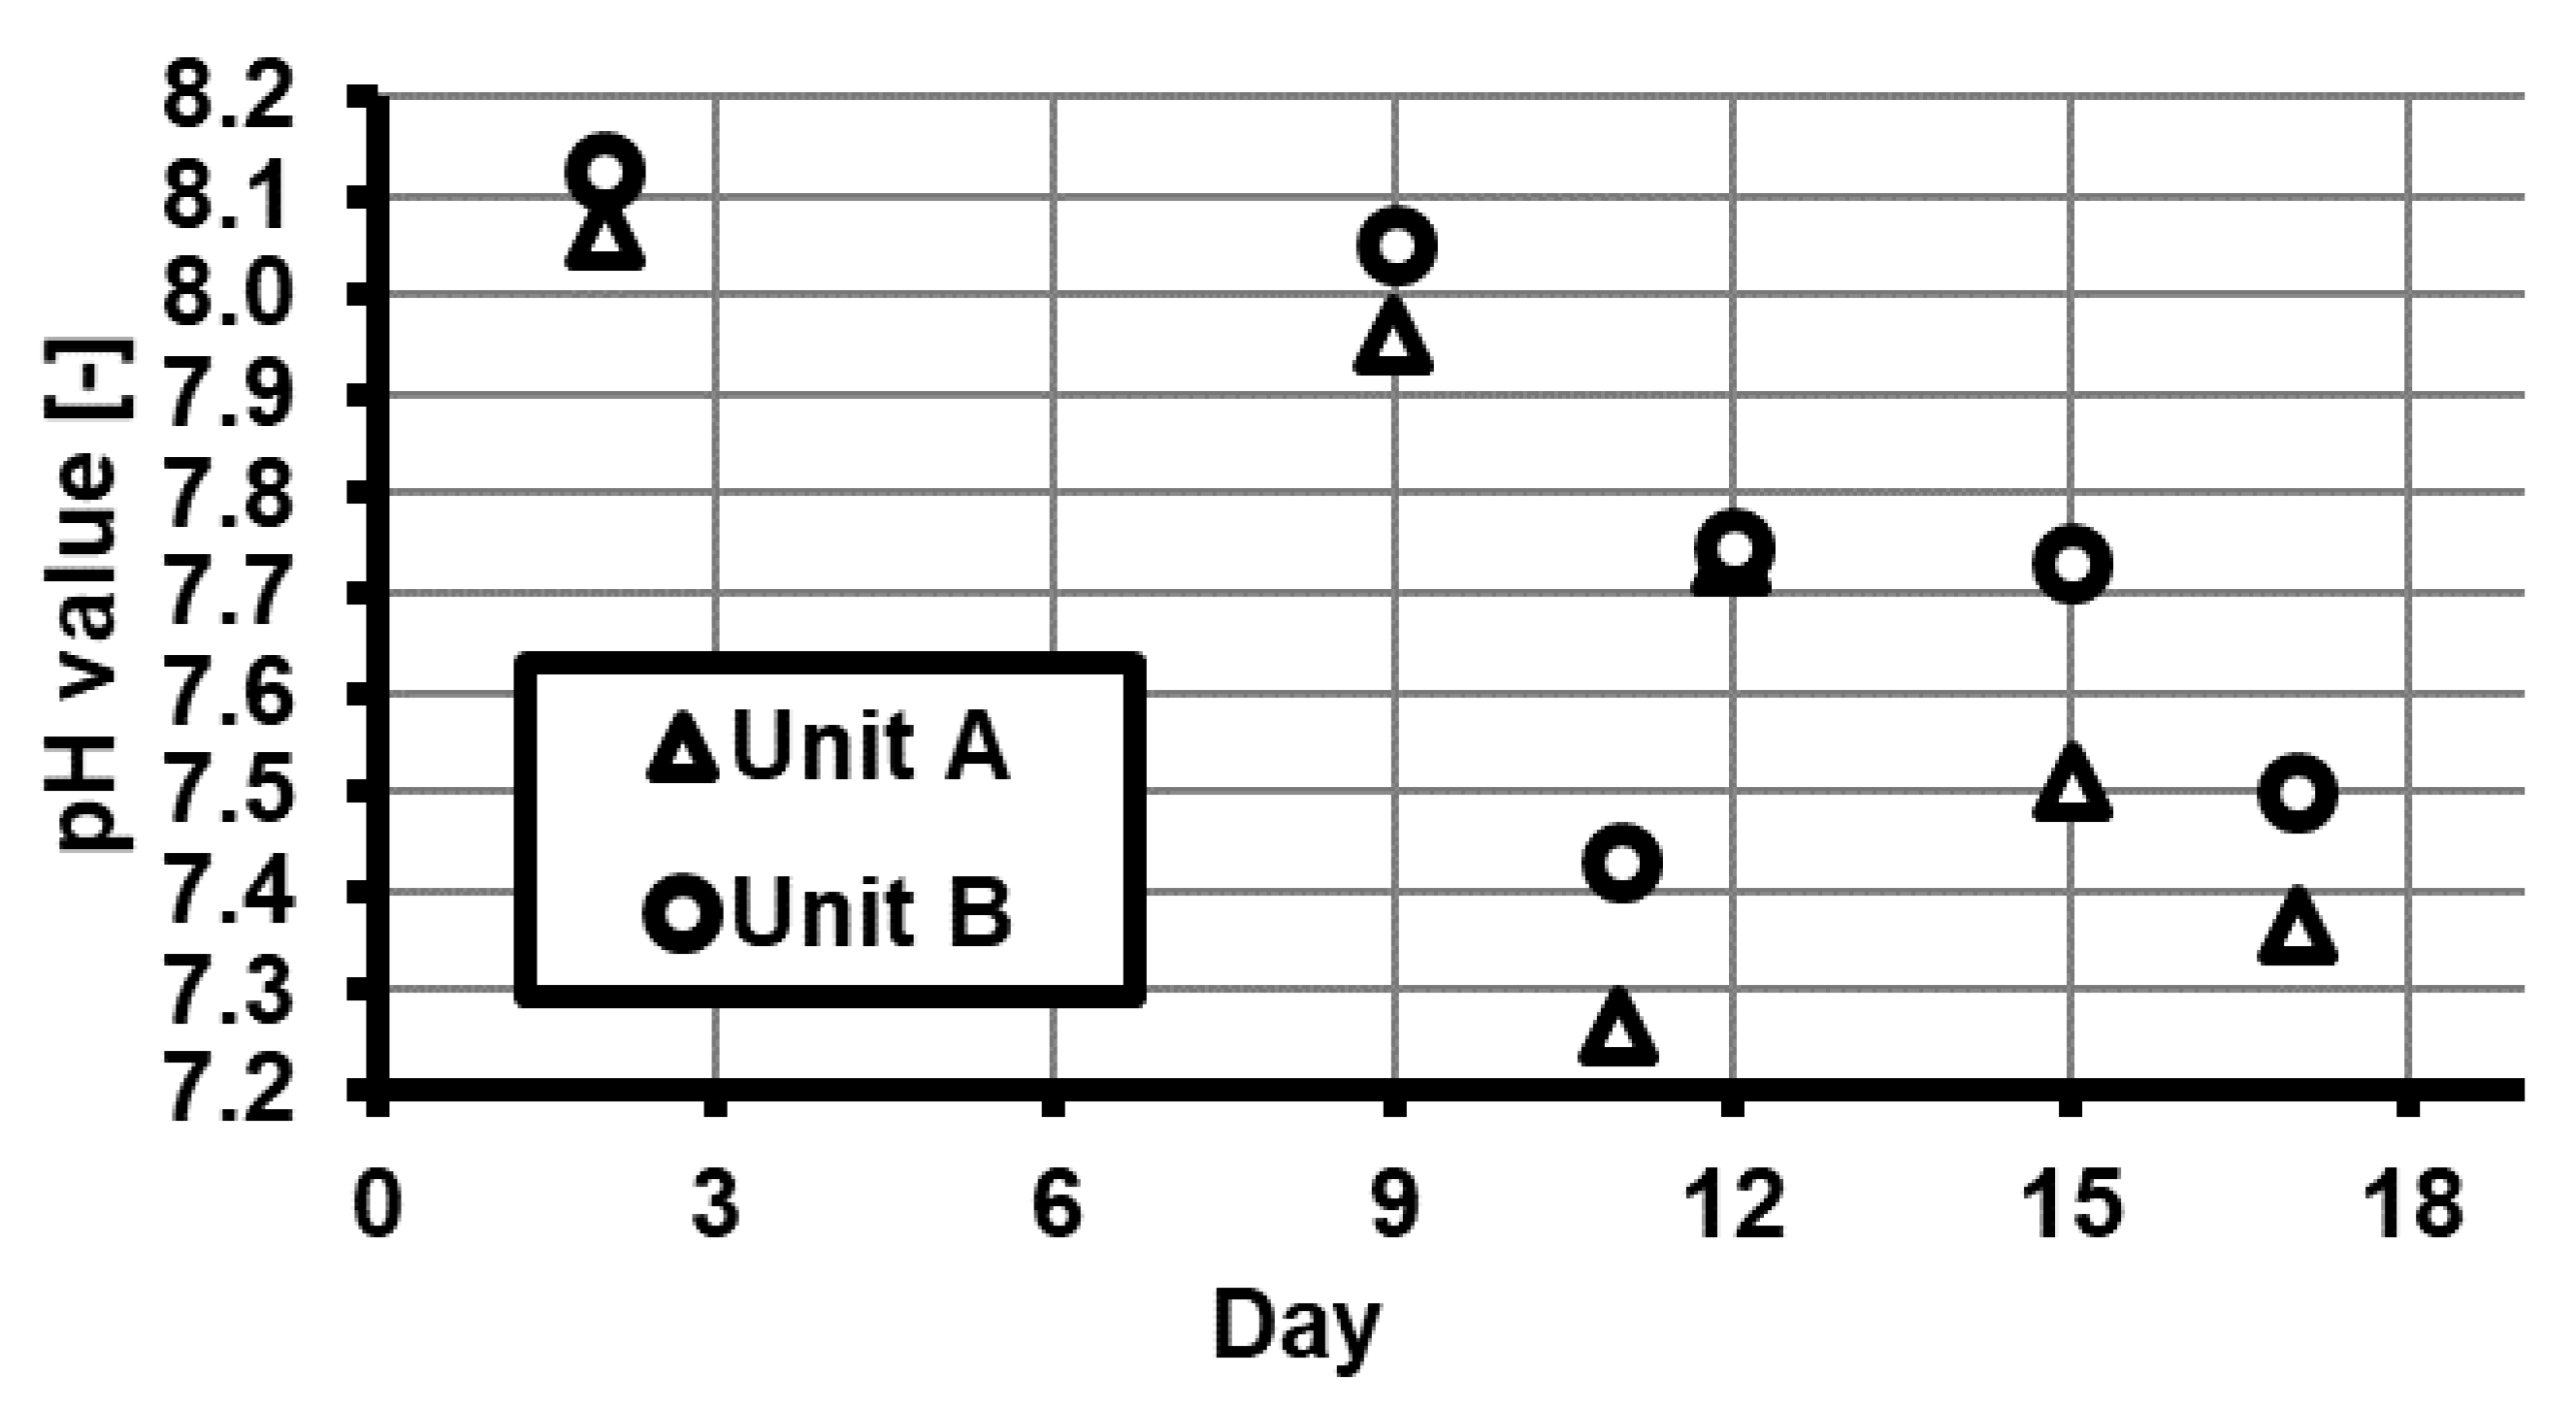
The pH value was measured to rate the process during the testing period. A decrease in the pH value was detected in both units (Figure 6). The decreasing pH value was compared with an accumulation of acids. The pH value shift due to temperature changes [9] was excluded because the mesophilic temperature was almost constant during the test period. The excess of buffer capacity can explain the rapid pH value change after 11 days [40]. There were several buffer systems in the digester such as carbonate, phosphate, ammonium, and volatile fatty acids (VFA) [29]. Due to its concentration and the pKs value in the pH optimum of the methane bacteria, the hydrogen carbonate/carbonate buffer was the most important buffer system for the biogas process [36].
An accumulation compared with an increase of VFA such as acetic acid, propionic acid, and butyric acid was detected during the testing period (Table 2). Acetic acid was the greatest contributor in units A and B.
The increase of VFA could be explained by the presence of long-chain fatty acids in crude glycerol. Long-chain fatty acids could inhibit anaerobic degradation as well as the formation of methane by microorganisms.
3.4. Hydrogen Sulfide
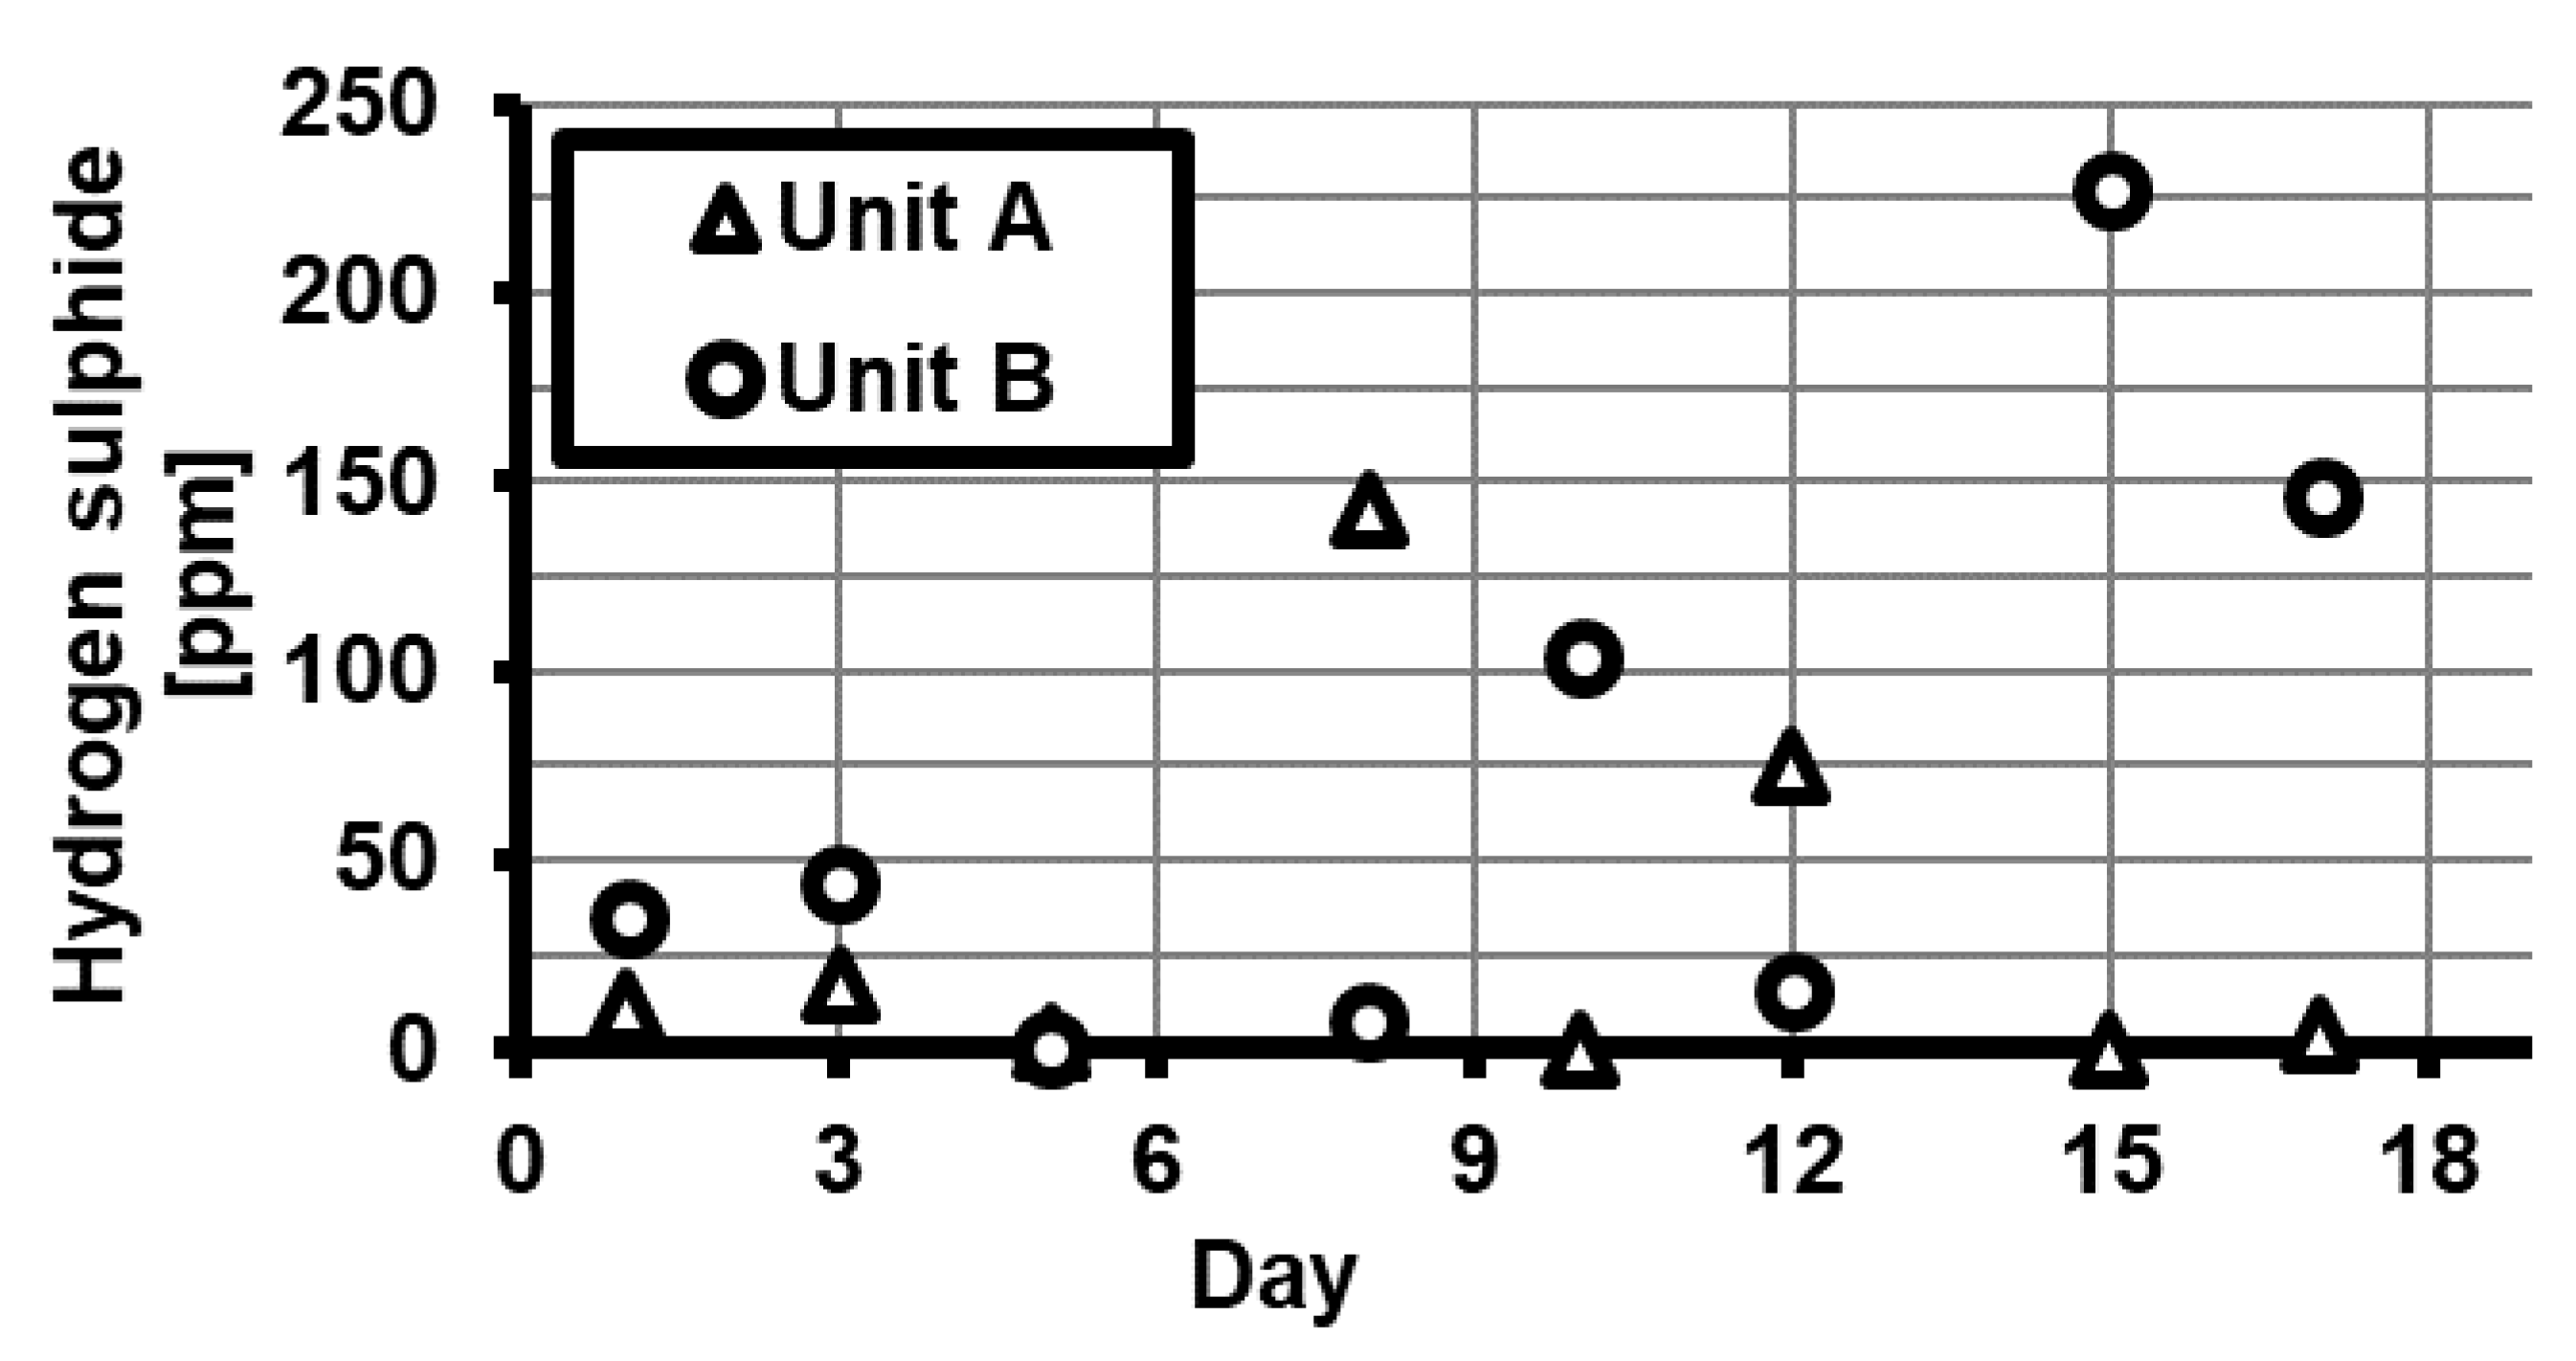
Sulfur is essential for the growth of microorganisms. Undissociated hydrogen sulfide inhibits the growth of microorganisms. In a stable digestion process, a balance between hydrogen sulfide and the dissolved sulfides can be found. A decreasing pH value shifts the balance in favor of hydrogen sulfide [41]. Between day 1 and day 17, it was visible that the concentration of hydrogen sulfide in biogas increased in both units (Figure 7). In unit B, the increase of hydrogen sulfide was much higher than in unit A.
3.5. Volatile Organic Acids Content (FOS) and Buffer Capacity (TAC)
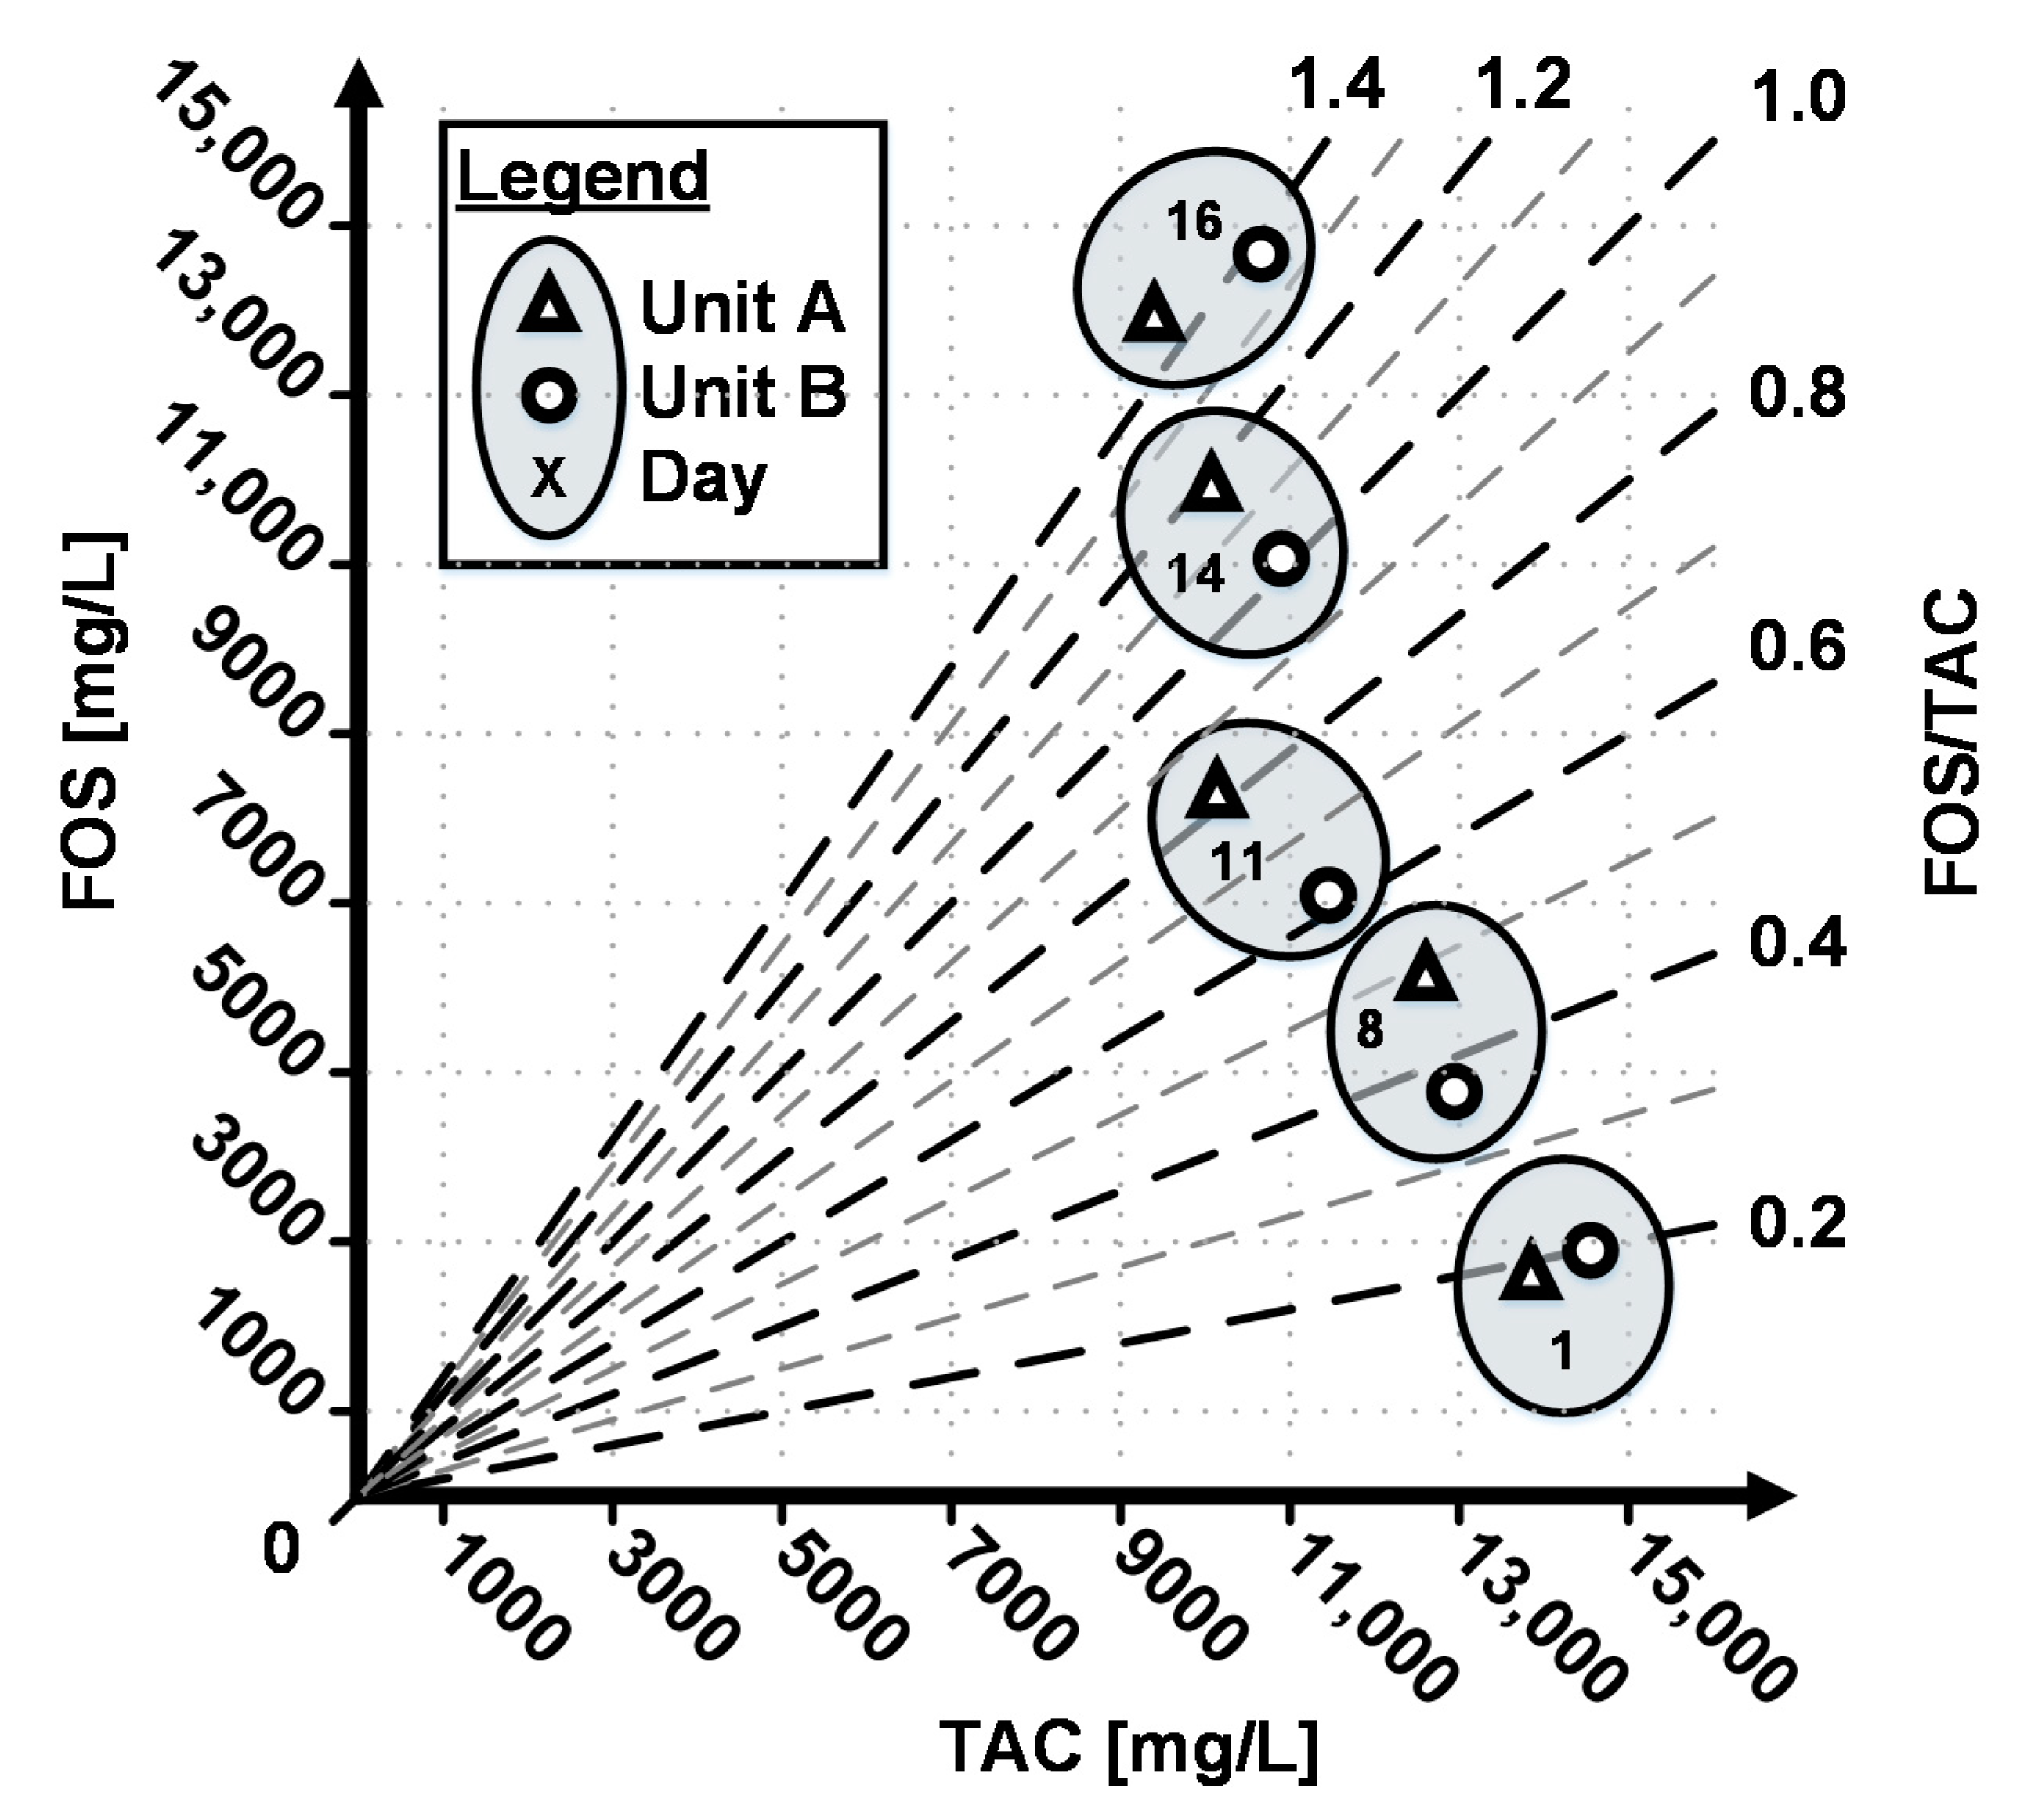
The following Figure 8 shows the concentration of the volatile organic acid content (FOS) and the buffer capacity (TAC). Until day 11 of the experiment, the increasing FOS/TAC value was characterized by the decrease in TAC with a simultaneous increase of FOS value. After day 11, the increase in the FOS/TAC value was due to the accumulation of acids and the connected inhibition of methanogenic archaea by toxic components [41].
3.6. Conductivity
In both units, an increase of conductivity was determined after day 11 (Table 3). The maximum conductivity in unit A was 31.20 mS/cm and in unit B was 33.70 mS/cm.
4. Discussion
The results of the present study demonstrate that the co-digestion of crude glycerol together with biowaste does not work. The data show an accumulation of acids and chlorides with decreasing methane content and yield in both units. The abort criteria of a FOS/TAC ratio of more than 1.2 reached on day 16 in unit A and unit B.
There are three different impurities in crude glycerol that affected microbial metabolism [19]:
- (1)
- Long-chain fatty acids
- (2)
- Chloride
- (3)
- Sulfates
The inhibition of the biocenosis could be caused by the accumulation of intermediates, the influence of chloride, or sulfates.
4.1. Inhibition by the Accumulation of Intermediaries
Naturally found triglycerides are made up of a glycerol compound that is linked to various long-chain fatty acids (LCFA) via ester bonds. The chain length results from the number of linked carbon atoms. It is usually between 12 and 24 C atoms [42]. LCFA are dissolved in the crude glycerol and can inhibit acetogenic bacteria, acetoclastic methanogenic archaea, and hydrogenotrophic methanogenic archaea. Acidogenic bacteria can convert glycerol into more simple compounds.
Due to this fact, the limiting step in the system will be found on the acetogenic or methanogenic bacteria [19]. The acidogenic bacteria formed organic acids such as acetic acids, propionic acids, and others. In fact, the cellular yield coefficient of acidogenic bacteria is much higher than the cellular yield coefficient of acetogenic and methanogenic bacteria; the anaerobic process is inhibited by the accumulation of these metabolites. In Table 2, the accumulation of metabolites can confirm this statement. Furthermore, inhibition of the methanogenesis can be caused by long-chain fatty acids and especially double-bond long-chain fatty acids [28]. The increase in carboxylic acids such as propionic acid indicates a disturbance of the methanogenic bacteria. This disturbance causes an increase of the hydrogen partial pressure in the fermentation residues which results from the insufficient decomposition of hydrogen by the methanogenic bacteria [42].
4.2. Inhibition by Chloride
During the neutralization step, chloride or sulfide is formed by the transesterification. These salts are present in larger quantities in the crude glycerol. The conductivity correlates with the salt content in the fermentation substrate. At higher concentrations, dissolved salts can result in inhibition of the process by changing the mass transfer behavior, viscosity, and pH value in the fermentation medium. Furthermore, by shifting the osmotic pressure gradient between bacterial cells and the environment, higher salt contents outside of the living cells can lead to their degradation as a result of dehydration and dry-out [28]. The increase in conductivity of the fermenter effluent can be related to the increased salinity within the fermenter. A salt concentration of 35 mS/cm inhibits the production of methane caused by the selective pressure on methanogenic bacterial communities [43]. The decreased methane content reinforces the assertion that the methanogenic bacteria are inhibited.
4.3. Inhibition by Sulfates
The inhibition of sulfates is caused by sulfate-reducing bacteria and acidogenic, acetogenic, and methanogenic bacteria of available substrates [44,45,46]. The presence of hydrogen sulfide in biogas shows that sulfates are in substrate. The sulfates are reduced to sulfide by the sulfate-reducing bacteria. The second way of inhibition is due to the toxicity of sulfide to various bacteria [45]. The concentration of hydrogen sulfide suggests that the concentration of sulfates will not cause problems in the anaerobic digestion process. Additionally, the ratio of COD/SO42− in crude glycerol is 4941, and this conditions favors the growth of methanogenic bacteria [19,45].
5. Conclusions
The investigation results depicted that a stable process could not be established by anaerobic co-digestion of biowaste and crude glycerol. A process instability can be concluded from the following reasons:
- (1)
- Decreasing methane yield
- (2)
- Volatile methane content in biogas
- (3)
- Decreasing pH value
- (4)
- Increasing conductivity
- (5)
- Increasing FOS/TAC ratio
The increasing salinity was verified by the increase in conductivity. The accumulation of acids was observed during the investigation period. Furthermore, it is evident from the results that there was a strong increase in acetic acids and propionic acids in both units. The lower amount of organic matter might have influenced that more pronounced inhibitory effect in unit A. In both groups, an accumulation of organic acids combined with a decrease in buffer capacity was observed. The results suggest inhibition of the methanogenic bacteria caused by the accumulation of metabolic products.
Moreover, batch tests are not able to give feedback on the long-term properties of different substrates.
Author Contributions
Investigation, J.S.; original draft, J.S.; writing, J.S., V.S.E., and M.N. All authors have read and agreed to the published version of the manuscript.
Funding
This research was funded by European Social Fund for Germany (ESF/14-BM-A55-0021/16).
Acknowledgments
The presented work is part of the running research project “Network Stability with Wind and Bioenergy, Storage and Loads (Netz-Stabil)”. The authors are grateful to the Excellence Initiative of the Federal State Mecklenburg-Western Pomerania funded by the European Social Fund for Germany (ESF/14-BM-A55-0021/16) for support of the research.
Conflicts of Interest
The authors declare no conflict of interest.
References
- Lanzini, A.; Ferrero, D.; Papurello, D.; Santarelli, M. Reporting Degradation from Different Fuel Contaminants in Ni-anode SOFCs. Fuel Cells 2017, 17, 423–433. [Google Scholar] [CrossRef]
- Cakir, F.Y.; Stenstrom, M.K. Greenhouse gas production: A comparison between aerobic and anaerobic wastewater treatment technology. Water Res. 2005, 39, 4197–4203. [Google Scholar] [CrossRef]
- Stan, C.; Collaguazo, G.; Streche, C.; Apostol, T.; Cocarta, D. Pilot-Scale Anaerobic Co-Digestion of the OFMSW: Improving Biogas Production and Startup. Sustainability 2018, 10, 1939. [Google Scholar] [CrossRef] [Green Version]
- Chaher, N.E.H.; Chakchouk, M.; Engler, N.; Nassour, A.; Nelles, M.; Hamdi, M. Optimization of Food Waste and Biochar In-Vessel Co-Composting. Sustainability 2020, 12, 1356. [Google Scholar] [CrossRef] [Green Version]
- Hwang, H.Y.; Kim, S.H.; Shim, J.; Park, S.J. Composting Process and Gas Emissions during Food Waste Composting under the Effect of Different Additives. Sustainability 2020, 12, 7811. [Google Scholar] [CrossRef]
- Mumme, J.; Srocke, F.; Heeg, K.; Werner, M. Use of biochars in anaerobic digestion. Bioresour. Technol. 2014, 164, 189–197. [Google Scholar] [CrossRef] [PubMed]
- Cai, J.; He, P.; Wang, Y.; Shao, L.; Lü, F. Effects and optimization of the use of biochar in anaerobic digestion of food wastes. Waste Manag. Res. 2016, 34, 409–416. [Google Scholar] [CrossRef] [PubMed]
- Luz, F.C.; Cordiner, S.; Manni, A.; Mulone, V.; Rocco, V. Biochar characteristics and early applications in anaerobic digestion—A review. J. Environ. Chem. Eng. 2018, 6, 2892–2909. [Google Scholar] [CrossRef]
- Baba, Y.; Tada, C.; Watanabe, R.; Fukuda, Y.; Chida, N.; Nakai, Y. Anaerobic digestion of crude glycerol from biodiesel manufacturing using a large-scale pilot plant: Methane production and application of digested sludge as fertilizer. Bioresour. Technol. 2013, 140, 342–348. [Google Scholar] [CrossRef]
- Astals, S.; Nolla-Ardèvol, V.; Mata-Alvarez, J. Anaerobic co-digestion of pig manure and crude glycerol at mesophilic conditions: Biogas and digestate. Bioresour. Technol. 2012, 110, 63–70. [Google Scholar] [CrossRef]
- Gesetz für den Ausbau Erneuerbarer Energien (Erneuerbare-Energien-Gesetz - EEG 2017): EEG 2017. (Translation: Act for the Development of Renewable Energies (Renewable Energy Sources Act - EEG 2017)). Available online: https://www.gesetze-im-internet.de/eeg_2014/EEG_2017.pdf (accessed on 28 May 2019).
- Union zur Förderung von Öl- und Proteinpflanzen e.V. Biodiesel & Co. 2019/2020. Available online: https://www.ufop.de/files/2616/0197/7754/RL_UFOP_1751_GB_2020_Auszug_de_061020.pdf (accessed on 3 November 2020).
- Union zur Förderung von Öl- und Proteinpflanzen e.V. UFOP-Bericht zur Globalen Marktversorgung 2017/2018: Der Europäische und Globale Biomassebedarf für die Biokraftstoffproduktion im Kontext der Versorgung an den Nahrungs- und Futtermittelmärkten. Available online: https://www.ufop.de/files/7115/1515/2636/UFOP-Bericht_zur_globalen_Marktversorgung_2017-2018.pdf (accessed on 2 August 2019).
- Harabi, M.; Neji, S.; Marrakchi, F.; Chrysikou, L.; Bezergianni, S.; Bouaziz, M. Biodiesel and Crude Glycerol from Waste Frying Oil: Production, Characterization and Evaluation of Biodiesel Oxidative Stability with Diesel Blends. Sustainability 2019, 11, 1937. [Google Scholar] [CrossRef] [Green Version]
- Braune, M.; Grasemann, E.; Gröngröft, A.; Klemm, M.; Oehmichen, K.; Zech, K. (Eds.) Die Biokraftstoffproduktion in Deutschland—Stand der Technik und Optimierungsansätze, 1. Auflage; DBFZ-Report; Nr. 22; Deutsches Biomasseforschungszentrum Gemeinnützige GmbH: Leipzig, Germany, 2016. [Google Scholar]
- Dubois, V.; Breton, S.; Linder, M.; Fanni, J.; Parmentier, M. Fatty acid profiles of 80 vegetable oils with regard to their nutritional potential. Eur. J. Lipid Sci. Technol. 2007, 109, 710–732. [Google Scholar] [CrossRef]
- Kolesárová, N.; Hutňan, M.; Špalková, V.; Kuffa, R.; Bodík, I. Anaerobic treatment of biodiesel by-products in a pilot scale reactor. Chem. Pap. 2011, 65, 447–453. [Google Scholar] [CrossRef]
- Robra, S.; Serpa da Cruz, R.; de Oliveira, A.M.; Neto, J.A.A.; Santos, J.V. Generation of biogas using crude glycerin from biodiesel production as a supplement to cattle slurry. Biomass Bioenergy 2010, 34, 1330–1335. [Google Scholar] [CrossRef]
- Viana, M.B.; Freitas, A.V.; Leitão, R.C.; Pinto, G.A.S.; Santaella, S.T. Anaerobic digestion of crude glycerol: A review. Environ. Technol. Rev. 2012, 1, 81–92. [Google Scholar] [CrossRef]
- Ayoub, M.; Abdullah, A.Z. Critical review on the current scenario and significance of crude glycerol resulting from biodiesel industry towards more sustainable renewable energy industry. Renew. Sustain. Energy Rev. 2012, 16, 2671–2686. [Google Scholar] [CrossRef]
- Luna, C.; Luna, D.; Calero, J.; Bautista, F.M.; Romero, A.A.; Posadillo, A.; Verdugo-Escamilla, C. Biochemical catalytic production of biodiesel. In Handbook of Biofuels Production; Elsevier: Amsterdam, The Netherlands, 2016; pp. 165–199. [Google Scholar] [CrossRef]
- Kolesárová, N.; Hutňan, M.; Bodík, I.; Spalková, V. Utilization of biodiesel by-products for biogas production. J. Biomed. Biotechnol. 2011, 2011, 126798. [Google Scholar] [CrossRef]
- Fountoulakis, M.S.; Petousi, I.; Manios, T. Co-digestion of sewage sludge with glycerol to boost biogas production. Waste Manag. (N. Y.) 2010, 30, 1849–1853. [Google Scholar] [CrossRef]
- Ma, J.; van Wambeke, M.; Carballa, M.; Verstraete, W. Improvement of the anaerobic treatment of potato processing wastewater in a UASB reactor by co-digestion with glycerol. Biotechnol. Lett. 2007, 30, 861–867. [Google Scholar] [CrossRef]
- Athanasoulia, E.; Melidis, P.; Aivasidis, A. Co-digestion of sewage sludge and crude glycerol from biodiesel production. Renew. Energy 2014, 62, 73–78. [Google Scholar] [CrossRef]
- Nartker, S.; Ammerman, M.; Aurandt, J.; Stogsdil, M.; Hayden, O.; Antle, C. Increasing biogas production from sewage sludge anaerobic co-digestion process by adding crude glycerol from biodiesel industry. Waste Manag. (N. Y.) 2014, 34, 2567–2571. [Google Scholar] [CrossRef] [PubMed]
- Feher, A. Untersuchungen zur Bioverfügbarkeit von Mikronährstoffen für den Biogasprozess. Master’s Dissertation, Universität Rostock, Agrar- und Umweltwissenschaftliche Fakultät, Rostock, Germany, 2018. [Google Scholar]
- Langhans, G.; Scholwin, F.; Nelles, M. Handbuch Zur Bilanzierung Von Biogasanlagen Für Ingenieure—Band I: Grundlagen und Methoden Für Die Bewertung und Bilanzierung in der Praxis; Springer Vieweg, in Springer Fachmedien Wiesbaden GmbH: Wiesbaden, Germary, 2020. [Google Scholar]
- Rehman, Z.-U. Process Stability in Biogas Digesters: Influencing Parameters and Control Using Carbonate Addition. Ph.D. Dissertation, Ruhr-Universität Bochum, Bochum, Germary, 2019. [Google Scholar]
- Konstantinovic, S.; Danilovic, B.; Ciric, J.; Ilic, S.; Savic, D.; Veljkovic, V. Valorization of crude glycerol from biodiesel production. Chem. Ind. Chem. Eng. Q. 2016, 22, 461–489. [Google Scholar] [CrossRef]
- Verein Deutscher Ingenieure. Charaterisation of the Substrate, Sampling, Collection of Data, Fermentation Tests; Verein Deutscher Ingenieure: Dusseldorf, Germany, 2016; 13.030.30, 27.190; Available online: https://www.vdi.de/fileadmin/pages/vdi_de/redakteure/richtlinien/inhaltsverzeichnisse/2385990.pdf (accessed on 10 June 2020).
- Astals, S.; Koch, K.; Weinrich, S.; Hafner, S.D.; Tait, S.; Peces, M. Impact of Storage Conditions on the Methanogenic Activity of Anaerobic Digestion Inocula. Water 2020, 12, 1321. [Google Scholar] [CrossRef]
- Sprafke, J.; Engler, N.; Thabit, Q.; Nelles, M.; Schuech, A. Increasing the baseload capacity of biowaste fermentation through optimised substrate management. Detritus 2020, 2020, 68–75. [Google Scholar] [CrossRef]
- Nelles, M. (Ed.) 14. Rostocker Bioenergieforum, Veranstalter: Universität Rostock, Landesforschungsanstalt für Landwirtschaft und Fischerei MV, Deutsches Biomasseforschungszentrum gemeinnützige GmbH-19. Dialog Abfallwirtschaft MV, Veranstalter: Universität Rostock, Ministerium für Landwirtschaft und Umwelt MV, enviMV: Geplant am 16./17. + 18. Juni 2020 an der Universität Rostock (nicht durchgeführt aufgrund der Beschränkungen im Zuge der Corona-Pandemie): Tagungsband; Schriftenreihe Umweltingenieurwesen; Band 95; Universität Rostock, Agrar- und Umweltwissenschaftliche Fakultät: Rostock, Germany, 2020. [Google Scholar]
- Bockreis, A. (Ed.) 9. Wissenschaftskongress Abfall- und Ressourcenwirtschaft: Tagungsband: Am 14. und 15. März 2019 an der Ostbayerischen Technischen Hochschule Amberg-Weiden, 1. Auflage; Innsbruck University Press: Innsbruck, Austria, 2019. [Google Scholar]
- Roitsch, J.; Büscher, W. Charakterisierung und Optimierung von NawaRo-Biogasanlagen in Typischen Ackerbauregionen in NRW: Schriftenreihe des Lehr- und Forschungsschwerpunktes USL 2009. Available online: https://www.usl.uni-bonn.de/pdf/Forschungsbericht%20160.pdf (accessed on 19 August 2019).
- Lili, M.; Biró, G.; Sulyok, E.; Petis, M.; Borbély, J.; Tamás, J. Novel approach on the basis of FOS/TAC method. In Proceedings of the International Symposia “Risk Factors for Environment and Food Safety” & “Natural Resources and Sustainable Development” & “50 Years of Agriculture Researche in Oradea”, Oradea, Romania, 4–5 November 2011; pp. 802–807. [Google Scholar]
- Voß, E.; Weichgrebe, D.; Rosenwinkel, K.-H. FOS/TAC: Herleitung, Methodik, Anwendung und Aussagekraft. Int. Wiss. Biogas Sci. 2009, 3, 675–682. [Google Scholar]
- Meyer-Kohlstock, D.; Haupt, T.; Heldt, E.; Heldt, N.; Kraft, E. Biochar as Additive in Biogas-Production from Bio-Waste. Energies 2016, 9, 247. [Google Scholar] [CrossRef]
- Kurzweil, P. Chemie: Grundlagen, Aufbauwissen, Anwendungen und Experimente, 10., Überarb. Aufl.; Lehrbuch; Springer: Berlin/Heidelberg, Germany, 2015. [Google Scholar]
- Muth, K. Modellgestütztes Monitoring von Störungen der Prozessbiologie in Biogasanlagen. Ph.D. Dissertation, Technische Universität Dresden, Dresden, Germany, 2018. [Google Scholar]
- Schieder, D.; Gronauer, A.; Lebuhn, M.; Bayer, K.; Beck, J.; Hiepp, G.; Binder, S. Prozessmodell Biogas: Zusammengestellt für die Arbeitsgruppe III (Prozessbiologie, -bewertung und Analytik) im “Biogas Forum Bayern”; 2010. Available online: https://www.biogas-forum-bayern.de/publikationen/Prozessmodell_Biogas.pdf (accessed on 11 June 2020).
- Ogata, Y.; Ishigaki, T.; Nakagawa, M.; Yamada, M. Effect of Increasing Salinity on Biogas Production in Waste Landfills with Leachate Recirculation: A Lab-Scale Model Study. Biotechnol. Rep. 2016, 10, 111–116. [Google Scholar] [CrossRef] [Green Version]
- Pol, L.W.H.; Lens, P.N.L.; Stams, A.J.M.; Lettinga, G. Anaerobic treatment of sulphate-rich wastewaters. Biodegradation 1998, 9, 213–224. [Google Scholar]
- Chen, Y.; Cheng, J.J.; Creamer, K.S. Inhibition of anaerobic digestion process: A review. Bioresour. Technol. 2008, 99, 4044–4064. [Google Scholar] [CrossRef]
- Dahlhoff, A. Auswirkungen Einer Erhöhten Faulraumbelastung auf die Prozessbiologie bei der Vergärung Nachwachsender Rohstoffe in Landwirtschaftlichen Biogasanlagen: Untersuchung unter besonderer Berücksichtigung der Aktuellen Situation der Biogasproduktion in Nordrhein-Westfalen. @Göttingen, Univ., Diss. 2007. Available online: http://webdoc.sub.gwdg.de/diss/2009/dahlhoff/dahlhoff.pdf (accessed on 11 June 2020).
Figure 1.
Flowchart of fatty acid methyl ester (FAME) production.


Figure 3.
Schematic diagram of the anaerobic digester.

Figure 4.
Specific methane yield (median).

Figure 5.
Methane content in biogas.

Figure 6.
pH value.

Figure 7.
Share of hydrogen sulfide in biogas.

Figure 8.
Volatile organic acids (FOS), buffer capacity (TAC), and FOS/TAC ratio.


| SFA | MUFA | PUFA | Others | ||||
|---|---|---|---|---|---|---|---|
| Fatty Acid | Palmitic Acid | Stearic Acid | Oleic Acid | Linoleic Acid | Linolenic Acid | ||
| Rapeseed Brassica napus | C-ratio1 | 16:0 | 18:0 | 18:1 | 18:2 | 18:3 | - |
| Share [%] | 4–5 | 1–2 | 60 | 20–22 | 7–10 | 2 | |
1 the C-ratio x:y corresponds to a fatty acid with x carbon atoms and y double bonds.
Table 2.
Gas chromatography analysis of unit A and B during the test period.
| Acid [ng/μL] | Day 1 | Day 9 | Day 12 | Day 15 | Day 17 | |
|---|---|---|---|---|---|---|
| Unit A | Acetic acid | 506.1 | 1734.2 | 3733.8 | 9369.5 | 13,045.5 |
| Propionic acid | 82.1 | 940.9 | 1625.6 | 1082.2 | 1389.7 | |
| iso-butyric acid | 0.0 | 155.5 | 304.3 | 503.2 | 520.7 | |
| butyric acid | 47.5 | 442.0 | 348.8 | 607.6 | 782.4 | |
| iso-pentanoic acid | 56.1 | 168.2 | 317.1 | 658.7 | 694.3 | |
| Valeric acid | 97.5 | 371.5 | 185.1 | 109.0 | 159.6 | |
| 4-Methyl pentanoic acid | 186.2 | - | - | - | 967.2 | |
| Hexanoic acid | 179.0 | 378.8 | 4.1 | 114.7 | 91.7 | |
| Unit B | Acetic acid | 466.1 | 1844.4 | 4726.9 | 11,035.5 | 12,748.4 |
| Propionic acid | 105.3 | 841.4 | 1589.2 | 1801.9 | 2464.0 | |
| iso-butyric acid | 50.5 | 176.7 | 305.9 | 440.3 | 521.8 | |
| butyric acid | 48.5 | 185.1 | 340.0 | 315.8 | 747.3 | |
| iso-pentanoic acid | 62.0 | 156.6 | 356.2 | 515.6 | 655.6 | |
| Valeric acid | 91.3 | 165.5 | 361.3 | 259.0 | 149.5 | |
| 4-Methyl pentanoic acid | 153.7 | - | - | - | - | |
| Hexanoic acid | 155.4 | 424.2 | 601.7 |
Table 3.
Average conductivity in units A and B.
| Day | Unit A | Unit B |
|---|---|---|
| 1 | 24.23 | 24.48 |
| 12 | 30.75 | 31.70 |
| 14 | 30.97 | 32.63 |
| 16 | 31.20 | 33.70 |
Publisher’s Note: MDPI stays neutral with regard to jurisdictional claims in published maps and institutional affiliations. |
© 2020 by the authors. Licensee MDPI, Basel, Switzerland. This article is an open access article distributed under the terms and conditions of the Creative Commons Attribution (CC BY) license (http://creativecommons.org/licenses/by/4.0/).
Share and Cite
MDPI and ACS Style
Sprafke, J.; Shettigondahalli Ekanthalu, V.; Nelles, M. Continuous Anaerobic Co-Digestion of Biowaste with Crude Glycerol under Mesophilic Conditions. Sustainability 2020, 12, 9512. https://0-doi-org.brum.beds.ac.uk/10.3390/su12229512
AMA Style
Sprafke J, Shettigondahalli Ekanthalu V, Nelles M. Continuous Anaerobic Co-Digestion of Biowaste with Crude Glycerol under Mesophilic Conditions. Sustainability. 2020; 12(22):9512. https://0-doi-org.brum.beds.ac.uk/10.3390/su12229512
Chicago/Turabian StyleSprafke, Jan, Vicky Shettigondahalli Ekanthalu, and Michael Nelles. 2020. "Continuous Anaerobic Co-Digestion of Biowaste with Crude Glycerol under Mesophilic Conditions" Sustainability 12, no. 22: 9512. https://0-doi-org.brum.beds.ac.uk/10.3390/su12229512
Note that from the first issue of 2016, this journal uses article numbers instead of page numbers. See further details here.