The Influence of Urban Climate on Bioclimatic Conditions in the City of Iași, Romania


Department of Geography, Faculty of Geography and Geology, Alexandru Ioan Cuza University of Iași, 700506 Iași, Romania
*
Author to whom correspondence should be addressed.
Sustainability 2020, 12(22), 9652; https://0-doi-org.brum.beds.ac.uk/10.3390/su12229652
Submission received: 18 October 2020
/
Revised: 15 November 2020
/
Accepted: 16 November 2020
/
Published: 19 November 2020
(This article belongs to the Special Issue Urban Heat Island Mitigation and Adaptation for Sustainability in Developing Countries)
Abstract
:This study was carried out in order to outline the human bioclimatic stress/comfort conditions within the area of Iași city, Romania. The meteorological data were obtained over a 7-year period (December 2012–November 2019) from an observation network relying on 8 fixed observation points located in selected spots, relevant for the urban climate conditions in the region. The results demonstrate firstly that throughout the entire analyzed period, using the thermo-hygrometric index (THI), “very cold” conditions characterize 4% of the entire year in the inner parts of the city and 6% in the rural area, while the “hot” THI conditions vary from 18% in the middle of the urban heat island to 15% in the rural area. Overall, the rural areas are generally more comfortable than the inner city, especially during summer, when the urban heat island (UHI) core is starting to develop from the evening and persists during the night. On the contrary, the UHI renders the inner city more comfortable than the rural surroundings from October to April. Similar bioclimatic conditions are also presented in detail for the summer by the relative strain index (RSI), which exceeds the stress threshold value mostly during heat waves, when a significant contrast between urban and rural areas is felt. In brief, it has been determined that the most suitable area for human comfort in Iași city is inside the urban area during the winter and in the rural areas during the summer.
1. Introduction
The field of human bioclimatology started to gain relevance during the 1980s [1] and nowadays the characteristics of urban bioclimatic conditions are researched in depth worldwide. Urban climate studies cover a wide range of research categories, including the assessment of thermal comfort, with the aim to improve urban sustainability [2]. Actually, there is an increasing interest in this topic [3] due to the simple fact that more than half of the world population lives in cities and the percentage is increasing [4]. Consequently, from hot climates to temperate and subarctic climates, bioclimatic conditions are analyzed [5], especially from the perspective of the manifestation and effect of the urban heat island (UHI) [6]. The overall effect of urban climate on human bioclimatic conditions is far more complex than the largely discussed higher thermal stress specific for inner parts of the cities. For instance, outdoor thermal comfort has important implications for urban planning and energy consumption [7]. Beyond this aspect, the human body possesses a certain capacity to respond to environmental conditions and acclimatize to it, but exposure to extreme heat or cold may be harmful to human health [8].
Human bioclimatology in cities deals mainly with aspects of urban climate and its relation to outdoor thermal comfort/discomfort levels [9] and health [10]. Throughout time, various approaches have been used and several reviews of human biometeorology have been published [1,11,12]. Overall, the different kind of methods used in the field only give a first approximation of the physiological reactions of selected groups of individuals in complex environments like urban areas [1,13,14]. During discomfort periods, generated mainly by heat waves (HWs) or cold waves (CWs), the people affected most severely by thermal discomfort are those who suffer from cardiovascular diseases or diabetes, which are more frequent among the elderly people [15,16]. Strong HWs can induce more than double the mean annual mortality rate, the most common cause of death being represented by heat stroke, heat exhaustion or other heat-related conditions [17,18].
Globally, bioclimatic conditions are assessed using a variety of bioclimatic indices. Warm and cold stress depend on the climatic region, being determined by air temperature, humidity and wind speed [19,20]. In temperate and warm regions, many studies focus on the variation of bioclimatic indices during the warm season [6,15]. During this period of the year, the most frequent exceedances of the thermal comfort thresholds are recorded during extreme HWs [17]. In winter, under strong anticyclonic conditions, CWs generate strong decreases in air temperature that induce extremely cold stress [21,22]. In many studies the bioclimatic indices are analyzed and correlate with mortality rates [10], but also with the level of comfort in different urban areas [9,23]. For the various indices used, the most frequently applied parameters are air temperature and relative humidity [1], which are easily recorded, requiring a simple and relatively inexpensive set of instruments and data-loggers.
The bioclimatic studies in Romania have targeted generally large physical–geographical regions and have used climatic data obtained mainly from the meteorological observation network of the National Meteorological Administration. At the country scale, Dobrinescu et al. [24] revealed a significant increase in the frequency of extremely high thermal discomfort indices after 1985, a process that was assessed to increase the risk for human health. Furthermore, Ciobotaru et al. [25] analyzed for the entire territory of Romania the THI (thermo-hygrometric index) in relation to tourism activity using the Higuchi dimension for additional assessment of THI, in order to define the annual and seasonal THI variations. Generally, bioclimatic studies aim to provide a representative image of the risk areas due to overheating or overcooling [1,2,3,6,7,8,9,10,26,27]. A series of research studies on local or regional bioclimate have focused on Dobruja province where seaside tourism activities are more developed [26]. The studies carried out within the Romania and Moldova region, which include Iași city, are based on the analysis of the following indices: effective temperature, wind chill [28] THI and RSI (relative strain index) [26,29]. These studies focused on the delimitation of the intervals characterized by bioclimatic comfort/discomfort for long periods of time. Furthermore, the Moldavian Plain region, where Iași city is located, was analyzed by Mihăilă et al. [30], from the perspective of bioclimatic favorability for tourism activities using: tourism climate index (TCI), physiological equivalent temperature (PET), universal thermal climate index (UTCI) and climate-tourism-information-scheme (CTIS).
Besides these bioclimatic studies, the number of urban bioclimatic studies carried out in Romania is relatively small. For Cluj-Napoca city some bioclimatic indicators (pulmonary stress index, THI and RSI) have been investigated [31]. The climate of Iași city was studied recently in its major characteristics by Alexe [32] and from the perspective of the urban heat island (UHI) extension and intensity by Sfîcă et al. [33]. Thermal differences generated by the UHI in Iași city were also observed previously by Apostol et al. [34], Alexe et al. [32], Sfîcă et al. [33] and Ichim et al. [35]. From December 2012 to November 2015, Sfîcă et al. [33] observed a mean annual temperature 0.8 °C higher in the city area compared with the rural conditions. During summer, UHI has the highest intensity, especially during the night hours with differences of 2.5–3.0 °C between urban and rural areas [33]. More than this, in a study aiming to depict the weather conditions during summer nights, Ichim et al. [35] observed a nocturnal UHI reaching 4 °C in intensity during a HW (1–5 August 2017).
Events with a major impact on exceedence bioclimatic thresholds are associated with dynamic atmospheric factors. The most important climatic events that have capacity to generate sudden and lasting heating or cooling are associated with HWs, warm spells (WSs), CWs and cold spells (CSs). In the eastern part of Romania during summer, HWs and WSs occur in different synoptic conditions, but in the last two decades HWs are associated with cyclonic conditions generating high air temperatures and humidity, which can generate intense thermal discomfort [36]. It was observed that HWs and WSs have increased in their annual frequency and have become more intense [20]. Therefore, some studies focused on particular synoptic conditions when the region was under the incidence of strong HWs [34,35].
The current study represents the first attempt to describe bioclimatic conditions of a major city in Romania using multiple fixed points of observations monitored over a consistent period of time (7 years) for air temperature and relative humidity.
2. Study Area
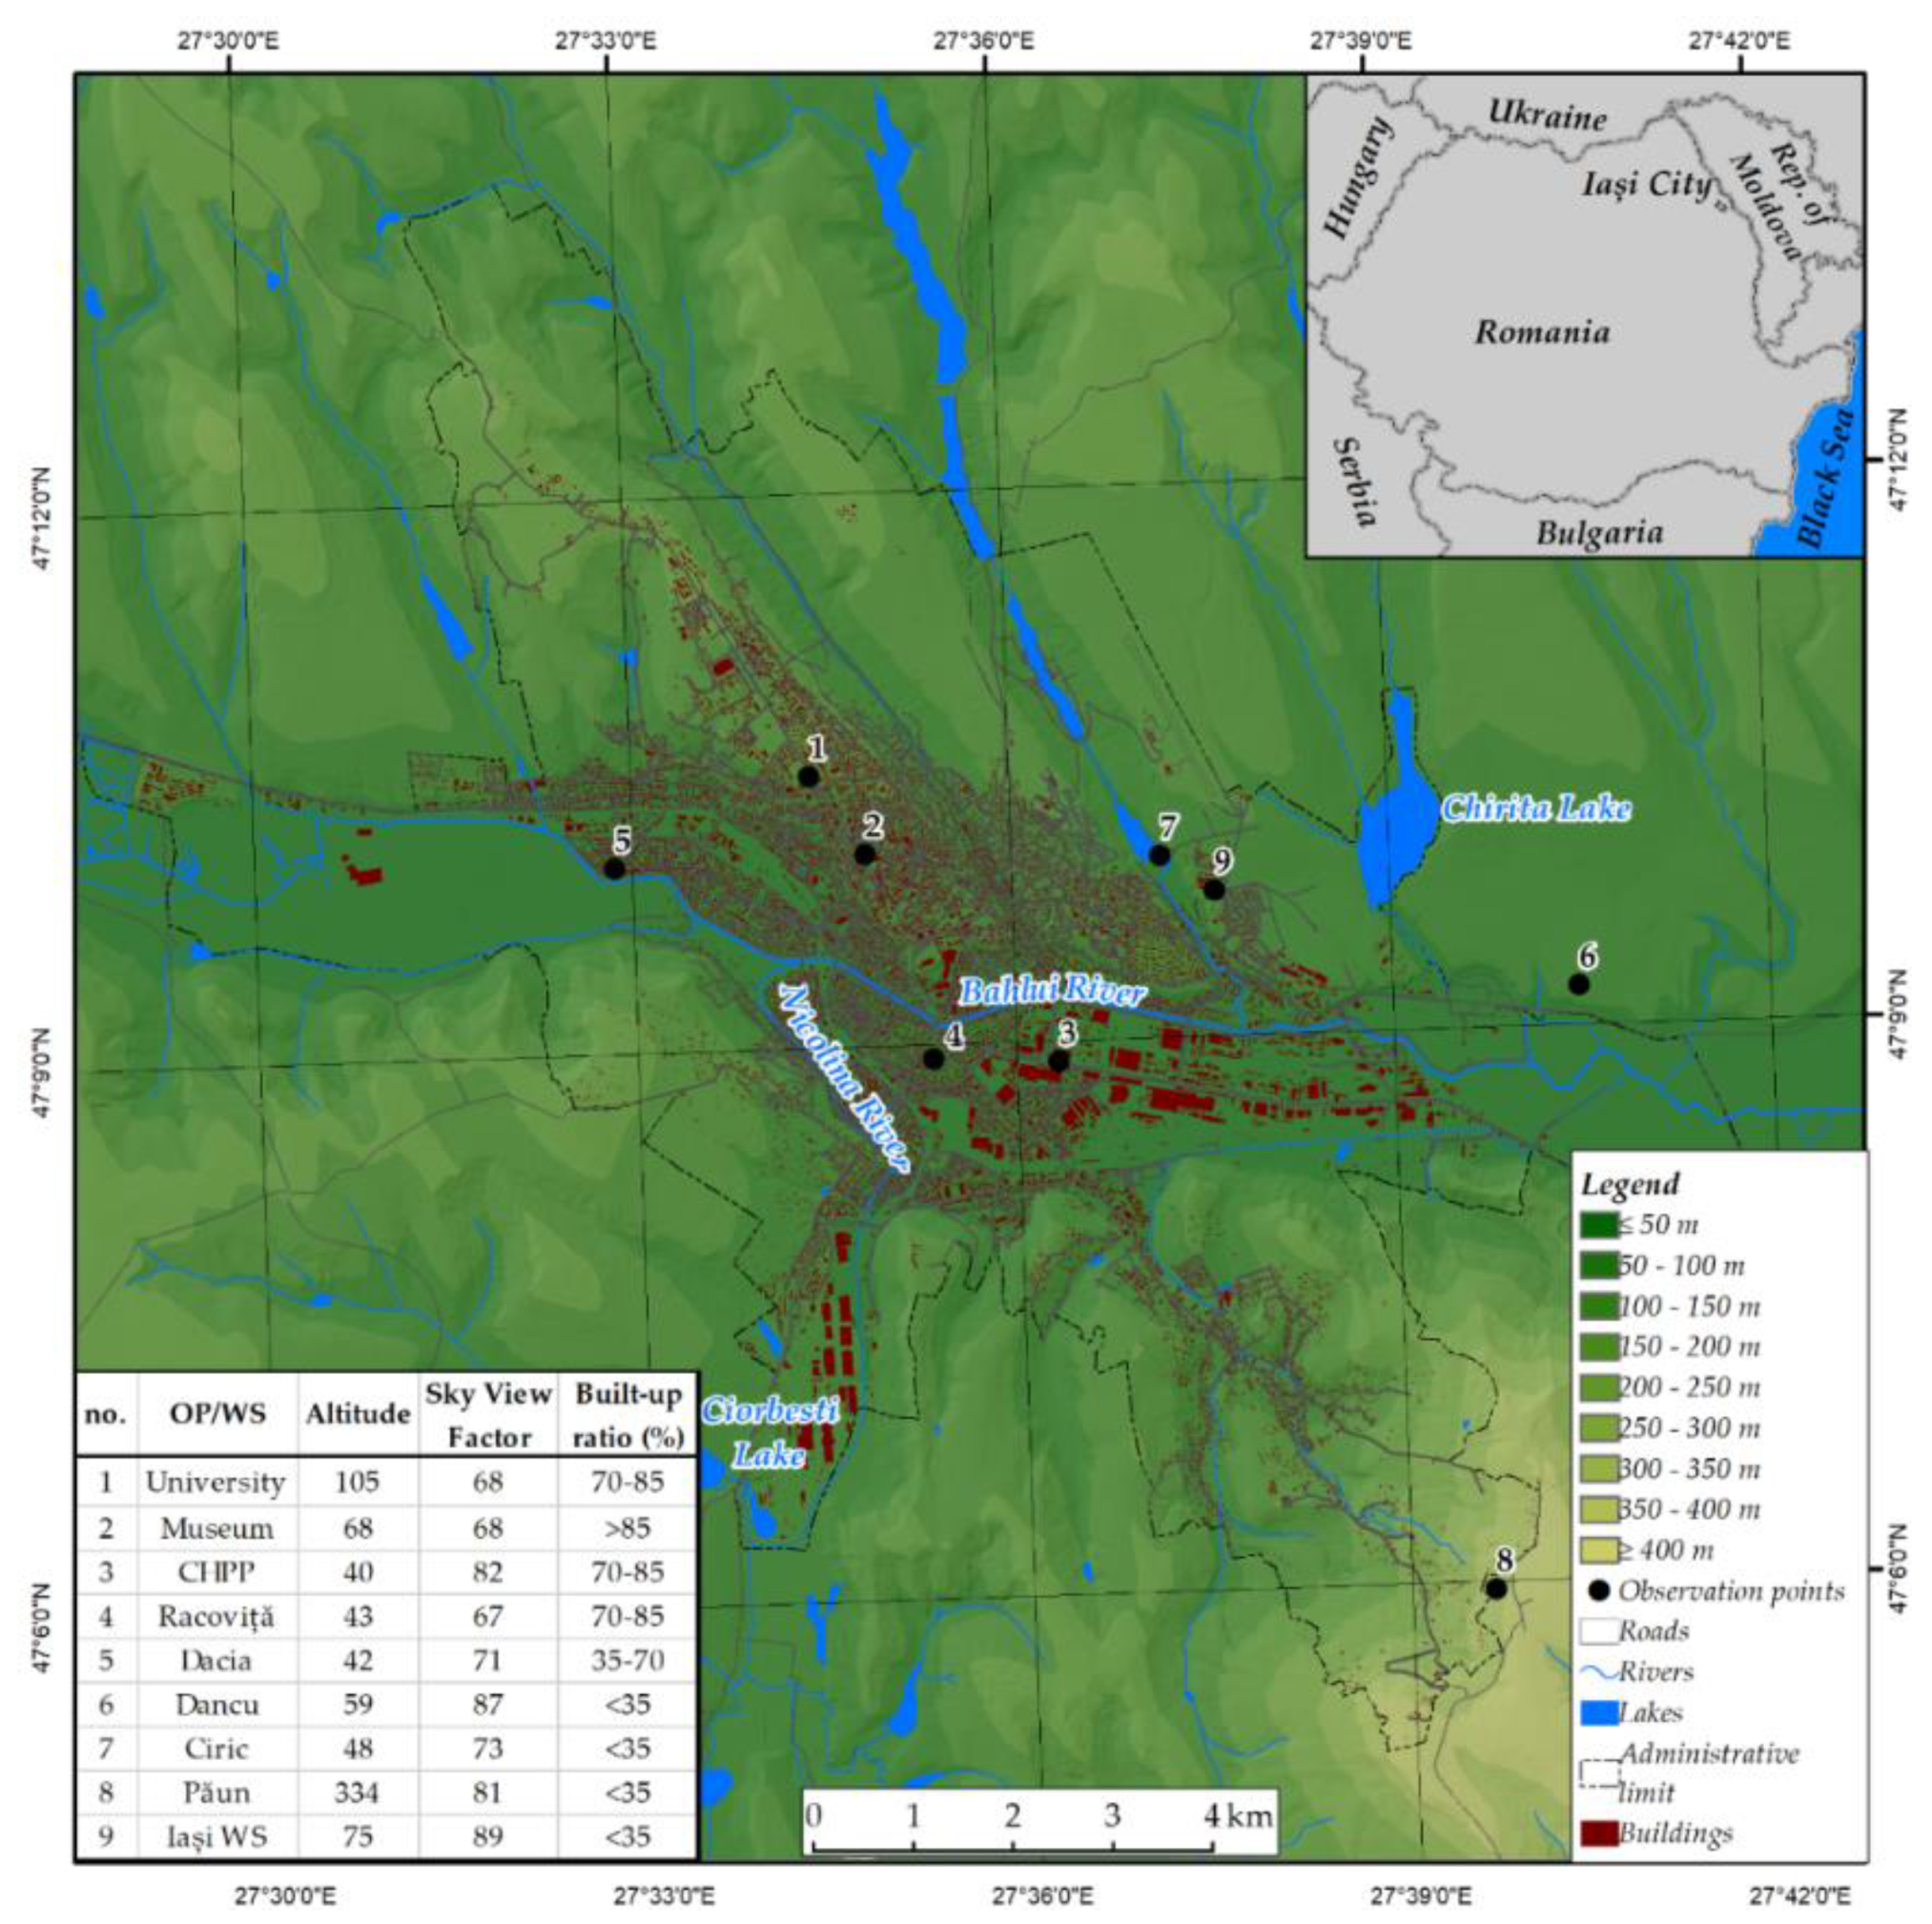
Iași city is situated in the northeastern part of Romania (47°N, 27°E) in the historical province of Moldova, at a mean altitude of 87 m above sea level (Figure 1). Iași city is a medium-size city with a population of almost 335,000 inhabitants in 2012 [37] and its built-up area was approximately 71 km2, this being subject to a significant increase in the past years [38]. The urban population density decreased by 12.7% from 2006 to 2012 [38], due to the migration in the newly residential areas surrounding the city. Most of the population (74.3%) lives in multifamily residential buildings (apartments mostly) where approximately 260,000 inhabitants live in 2673 buildings [39]. In recent years, the city of Iași has maintained most of its green spaces in its inner city [37].
From a climatic point of view, according to the Köppen climate classification, Iași city is located within the Cf (temperate warm climate with uniform annual distribution of precipitation) climatic region or in Dc (temperate continental climate with a long warm season) climatic region, according to Trewartha’s classification [40]. The mean annual air temperature is 9.7 °C for 1961–2009 [32] with a fast increase in the last period estimated by 0.25 °C/decade [41]. The seasonal differences are high, with mean air temperature of −3.0 °C in January and 21.2 °C in July [33]. The precipitation amount reached 572 mm for 1961–2016 [42]. For a temperate climate zone, as in the Iași city region, the thermal comfort is appreciated at 16.8–20.8 °C [29].
To obtain a better image of the urban heat island (UHI) of Iași, starting with December 2012, a network of eight data loggers was established with fixed observation points (OPs) in representative areas for the local climate within the urban and rural area. In addition to this network, in the current study we also used data obtained from Iași national weather station [43], located at the margin of the city area (Figure 1). From the entire network, five observation points (1—University; 2—Museum; 3—Combined heat and power plant, CHPP; 4—Racoviță; 5—Dacia) are located inside the urban area, while three other observation points (6—Dancu; 7—Ciric; 8—Păun) are located in rural area. The OPs were selected in order to cover all the type of urban land use and environments, as explained in Sfîcă et al., 2018 [33]. This way, the current study is based on mean values obtained for urban and rural OPs.
In order to create a clear image of the spatial distribution of the climatic features and bioclimatic conditions we excluded from the rural area the Păun OP. Due to its location in a higher altitude in the region, Păun OP would modify the mean thermo-hydrometric variations between urban and rural areas. This point was used instead for mapping the climate elements and the bioclimatic indices over the region.
3. Data and Methods
The current study is based on air temperature and relative humidity data obtained from the observation points mentioned above. In these points, local time (LT) hourly air temperature and relative humidity were measured. The data were recorded using certified data loggers for air temperature and relative humidity. All observations were made in classical thermometer shelters at the height of 2 m above ground level.
The above-mentioned data were used to calculate the thermal stress expressed by the THI for the entire period and by the RSI for summer (June–August).
At each measuring point for all the observation times, eight THI categories were calculated (very cold, cold, cool, comfortable, hot, very hot and torrid). Water vapor pressure (hPa) data were derived from psychrometric formula using hourly relative humidity data for the period December 2012–November 2019.
The THI formula proposed by Kyle [44] was used in the current study. This formula incorporates hourly air temperature (T) and relative humidity (U):
where T is air temperature (°C) and RH is relative humidity (%).
THI (°C) = T − (0.55 − 0.0055∙RH)∙(T − 14.5)
For comfort values, Thom [45] delimited 70 °F (21.1 °C) as a threshold separating comfort from hot discomfort (Table 1). The comfortable conditions range between 15 °C and 20 °C [46].
After calculating the hourly values of THI, in order to highlight the urban/rural variations of THI, the total number of hours within each class was divided by 24, thus obtaining the total number of conventional days per year in each THI class for the entire analyzed interval. Furthermore, the number of effective days with at least 1 h in a specific THI class was calculated. Using together these two parameters, expressed in the same unit (no. of days), we indicate both the frequency and the persistence of THI classes and ease the comparison between these parameters. For instance, a specific THI class with a high number of effective days, but a low number of conventional days, shows that the corresponding conditions occur normally for a small number of hours during each day of occurrence.
The RSI was calculated with Formula (2) using hourly air temperature and water vapor pressure (hPa), the second parameter being derived using Formula (3) proposed by Asghari et al. [47] from relative humidity measurements. RSI was developed to evaluate the comfort level for a sedentary man, in healthy condition, 25 years old, wearing a light business suit and not acclimatized to heat. RSI renders the comfort level according to the following conditions: internal heat production 100 W/m2, air movement less than 1 ms−1 and no solar radiation income. RSI is calculated using air temperature values (t/°C) and water vapor pressure (e/hPa) [46,47]) and is mathematically expressed as follows:
where T is air temperature (°C) and e is water vapor pressure (hPa).
where T is air temperature (°C) and RH is relative humidity (%).
The RSI defines the thermal stress threshold for the heat exchange budget of the human body under overheating conditions and the potential negative effects that extreme air temperature might have on human physiology [26,48]. As for the territory of Moldova, Ionac [48] proposed a modified classification of RSI thresholds, we decided to use Kyle’s [44] RSI classification (Table 2) due to its simplicity and broad usage in similar studies.
Air temperature, relative humidity and thermal comfort distribution maps were modeled using the residual kriging method from Qgis software. The interpolation method started with the distribution of altitudinal regression. Then, the climatic parameters were interpolated by ordinary kriging. To obtain the final distribution model, the regression residuals were interpolated by ordinary kriging and added to the altitudinal regression model [49]. The residual kriging method is considered the optimal method for mapping climatic parameters for areas with fragmented topography [33,50]. Indeed, the validation of the model, presented as Supplementary Materials (Table S1), confirms that the model errors are very small so that the final interpolation reflects accurately the distribution of the represented parameters.
As descriptive statistics for the analyzed data (air temperature and relative humidity) we used mean, maximum, minimum values for all the parameters. For RSI, in order to highlight the differences imposed by the UHI between rural and urban areas we applied a classical quartile analysis. Furthermore, a t-test (p < 0.05) was applied for differences between urban and rural areas for mean monthly, seasonal and annual air temperature, for relative humidity, but also for RSI quartiles. The detailed results of this t-test are presented in Supplementary Materials (Tables S2–S4).
4. Results and Discussion
4.1. General Characteristics of Iași Urban Heat Island
For the period December 2012–November 2019 (Table 3), the UHI mean intensity is quite similar (0.6 °C) to the period analyzed by Sfîcă et al. [33]. This difference is statistically significant at annual level, but also for the summer and winter months. Generally, the UHI is less pronounced during seasons with a more dynamic atmospheric circulation, such as spring, and a more pronounced urban heat island is observed in periods with high anticyclonic activity, as in autumn and winter [33].
According to the data from Iași weather station of the National Meteorological Administration, the mean annual air temperature of the analyzed period (December 2012–November 2019) is 0.3 °C higher than the annual mean indicated by Sfîcă et al. [33] for December 2012 to November 2015 (10.9 °C) and by 1.5 °C higher than the annual mean (9.7 °C) indicated by Alexe [32] for 1961–2010. This confirms once more the previously discussed warming trend in the region.
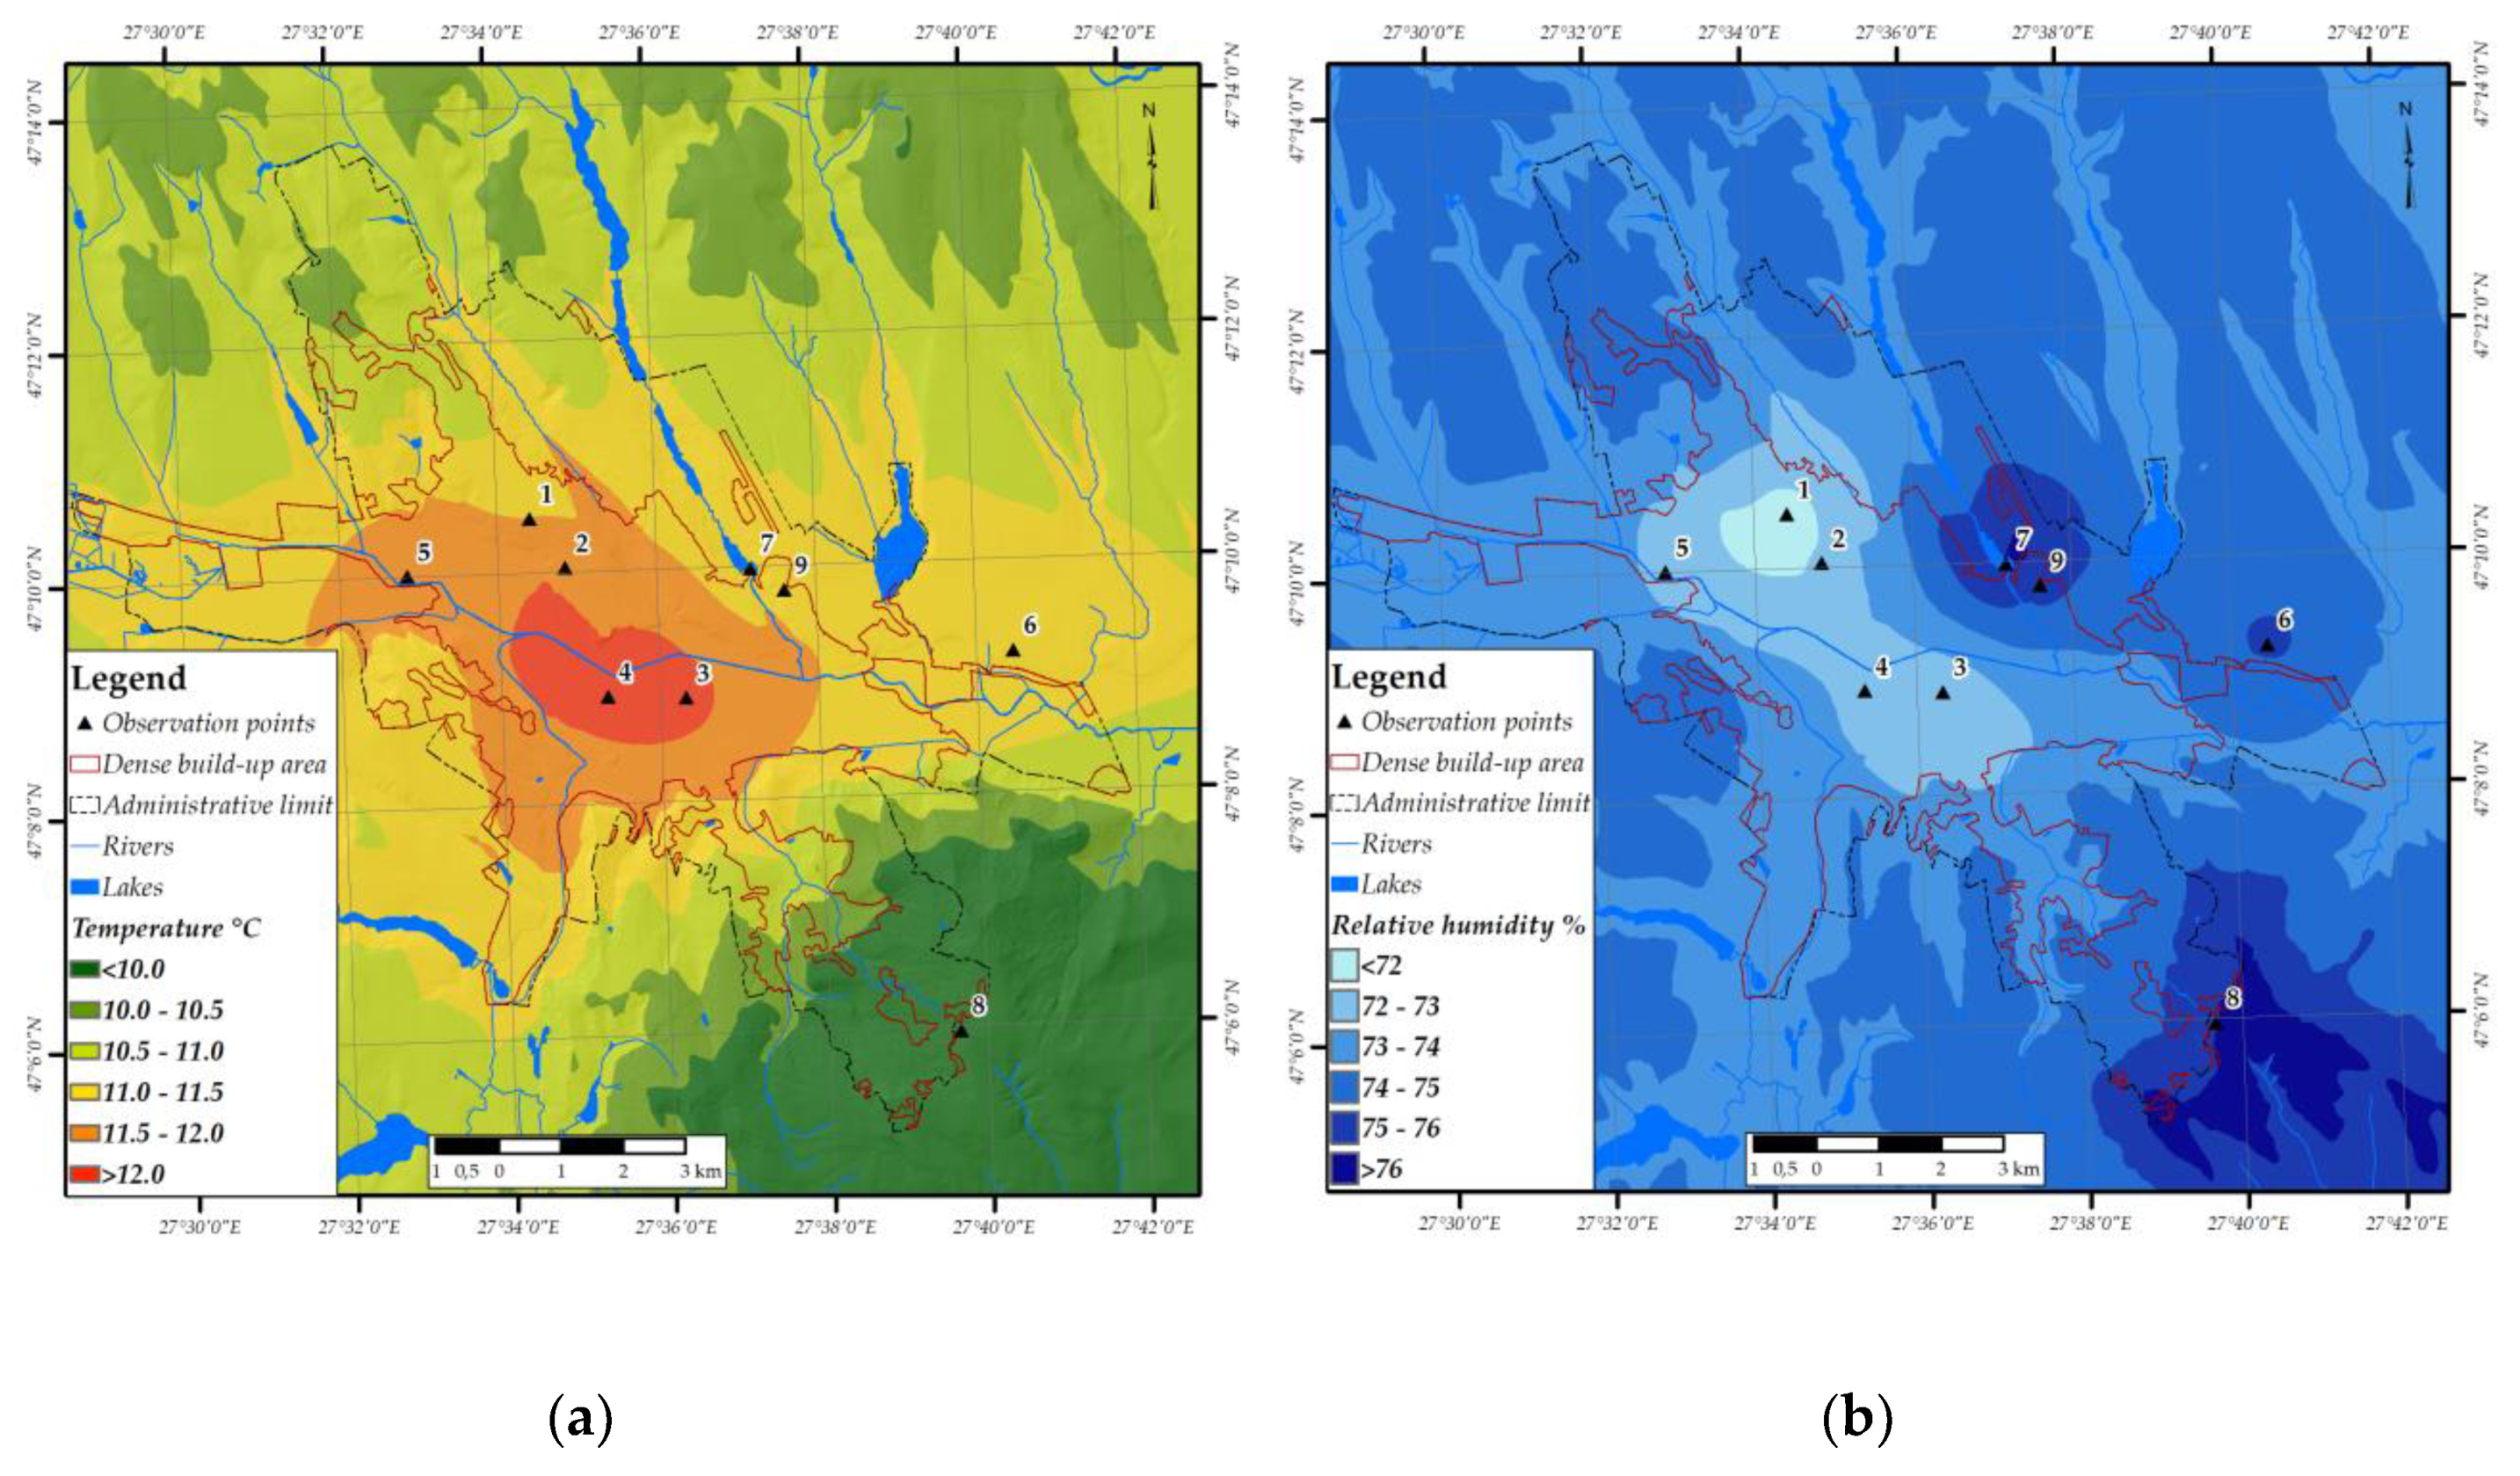
In Iași city, the annual mean relative humidity was 73.8% for the current analyzed period. The data in Figure 2 show that the mean relative humidity above 73% is specific for the rural areas (74.7%, Dancu OP; 75.3%, Iași weather station; Ciric OP, 75.9%; and Păun OP, 75.4%). Minimum values of relative humidity instead can be observed in urban OPs (Racoviță, 72.6%; Dacia, 72.1%; CHPP, 71.7%, Museum, 71.7%; and University, 71.0%) as a direct effect of the higher air temperature within the UHI.
During the analyzed period, the mean monthly relative humidity values record higher values in rural areas, with significant statistical differences comparatively with urban areas. These differences are higher during summer (−4.2%) and smaller in winter (−2.6%) (Table 4). The absolute maximum relative humidity of the analyzed interval exceeds 95% in the entire region, reaching the highest values during the cold season. However, on a microclimatic scale, a consistent difference can be distinguished between rural and urban areas. The data in Table 4 show that differences between urban and rural areas (significant for all the analyzed intervals) for the mean and maximum relative humidity are negative throughout the year, which is an indirect result of the higher air temperature imposed by the UHI within the urban area. Analyzing the distribution of the minimum values of relative humidity, it is observed that the absolute minimum values are specific for the rural area and this represents an effect of the urban climate as well. Generally, the urban climate induces a higher amount of water vapor during very dry periods originated from evapotranspiration within the green areas and other humidity sources specific for the city. Even if within the territory of Iași city six man-made lakes were created with a surface below 100 ha [51] they would not drastically influence the climate conditions over the city, as in other cities [52]. However, we can observe that the Ciric OP (Figure 2b), which is located near a small lake, reached the maximum values of relative humidity in the region.
4.2. Thermo-Hygrometric Index (THI)
4.2.1. Annual Characteristics of THI
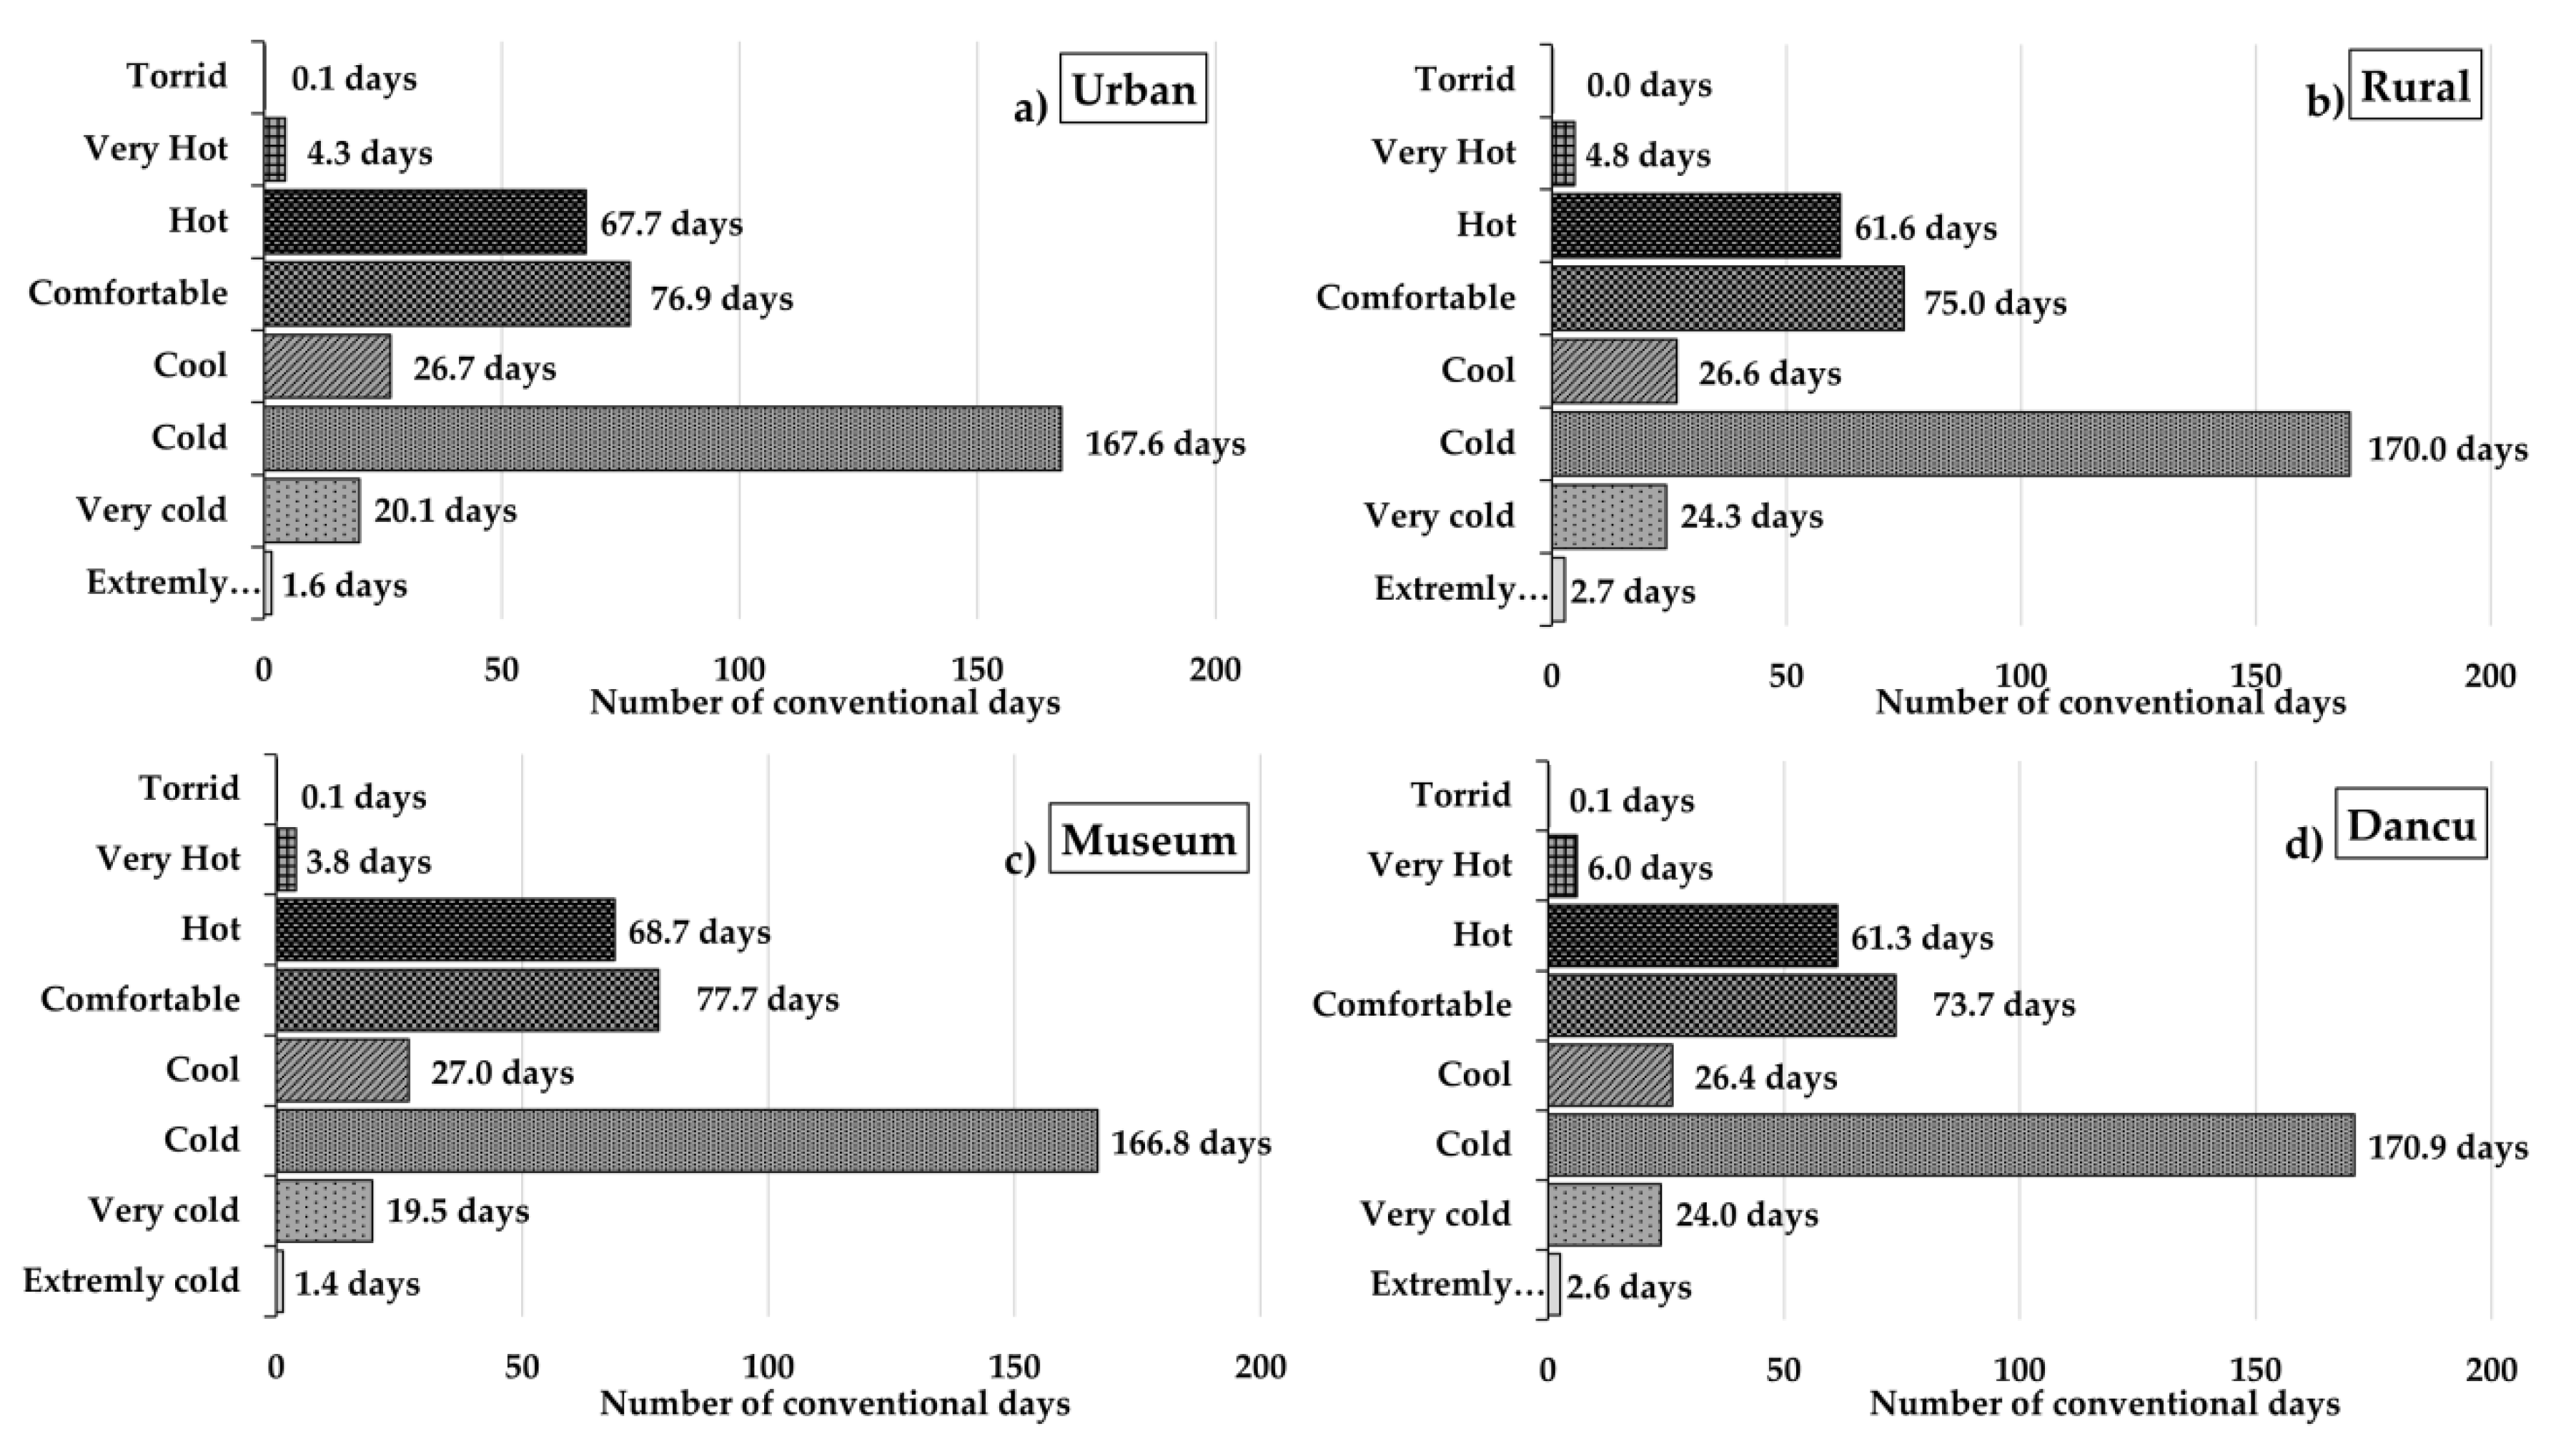
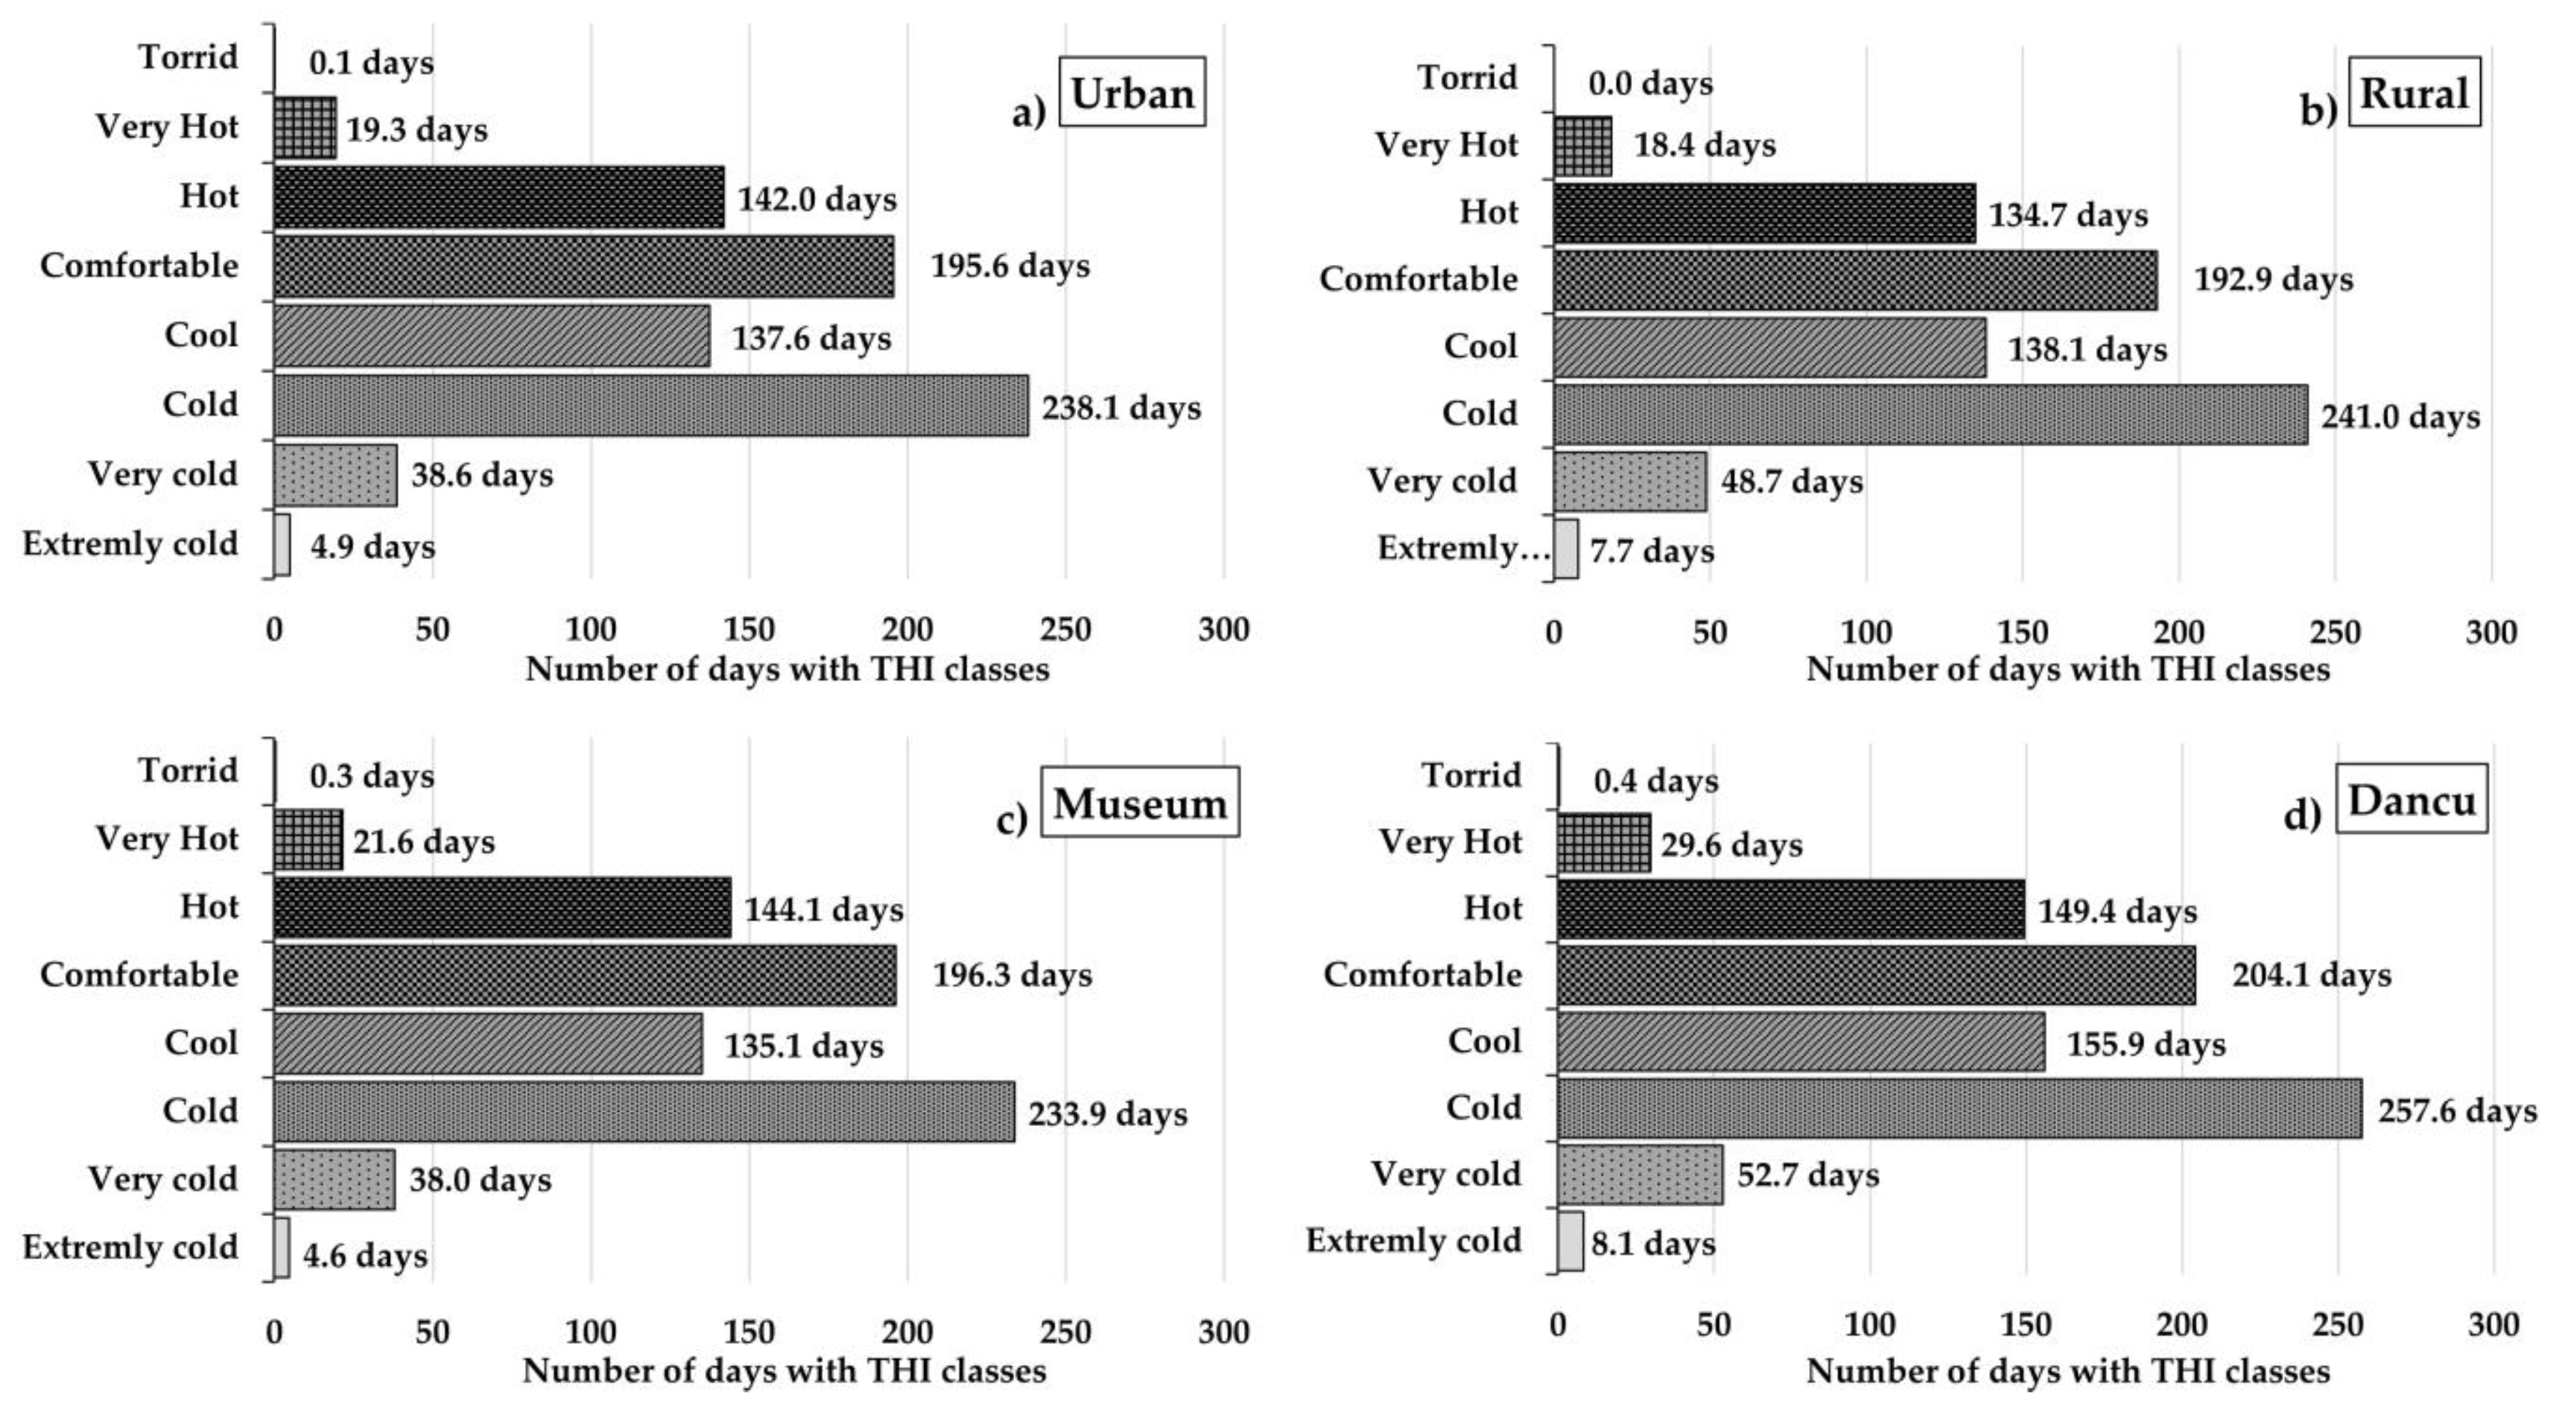
Considering the THI index, the most frequent bioclimatic class in urban and rural areas is the “cold” class (Figure 3 and Figure 4), which prevails along the entire cold season (from October to April) and even during the night in late spring and early autumn (Figure 5). In urban areas the “cold” class has an annual frequency of 45.9% (167.6 conventional days), almost 0.7% lower than in rural areas (46.6%, 170 conventional days/year). The difference in the cold class frequency between the urban and rural area is generated mainly by the UHI, but also by the effect of the thermal inversion phenomena, manifesting especially during the winter or cold season of the year, when the frequency of thermal inversions during morning hours reaches 30% between Păun and Dacia OP [53]. This leads to lower air temperatures along the valley of Bahlui river, while the inner parts of the city remain warmer as an effect of the UHI. This effect is even more pronounced when we analyze the “very cold” and “extremely cold” classes which gather more than 4.2 conventional days/year in the rural area than inside the urban area (Figure 3). For the number of effective days the difference is even higher, reaching 10.1 effective days (Figure 4a,b). When analyzing the two points considered as the most representative for urban (Museum) and rural (Dancu) areas (Figure 3c,d and Figure 4c,d), the above differences are even more pronounced (4.5 conventional days and 14.7 effective days).
The THI “extremely cold” class have very low frequencies, not exceeding 1% of the entire analyzed interval. Even if the “extremely cold” index has a low annual frequency, the impact on the human body is extremely high as bioclimatic discomfort. “Extremely cold” events are generated by strong CWs during winter that generate high atmospheric stability and increase the frequency of thermal inversion phenomena [33]. It is noticeable that under these conditions the frequency of “extremely cold” intervals differs greatly between urban and rural areas. The “extremely cold” events are 0.31% (1.1 conventional day/year and 2.8 effective days/year) higher in rural areas than inside the urban area (Figure 3 and Figure 4). The explanation for this difference is given by the manifestation of the UHI during the cold periods of the year, or during the slightly colder mornings. For example, in January the “very cold” class has a higher frequency (Figure 5) in rural areas (2200 to 0500 LT) compared to urban areas.
The difference in percentage of the year where conditions are “cool” is small between rural and urban areas. Furthermore, the “comfortable” class is characterized by a small difference (Figure 3 and Figure 4) between urban (76.9 conventional days/year) and rural areas (75.0 conventional days/year). It is to be noticed that the corresponding mean annual frequency (cca. 20%) is smaller than in other cities from central Europe such as Szeged [46] or in Turkey, such as Erzincan [54]. This smaller frequency of comfortable conditions could be induced by a variety of influencing factors. Firstly, the smaller size of the two cities could explain their higher comfortable conditions, but also the capacity of the Iași UHI to increase higher thermal stress during summer plays a role in reducing the comfortable conditions. Secondly, Iași city is placed in more extreme climate conditions exposed to both HWs and CWs [20].
The UHI effect on bioclimatic conditions is very accurately expressed through the differences highlighted by the “hot” and especially “very hot” classes of THI. In the urban area the “hot” class exceeds by 6.1 conventional days(7.3 effective days) the values recorded in rural surroundings. The same differences are to be observed in the case of the “very hot” class. Interestingly, for the number of effective days in the Museum and Dancu OPs (Figure 4c,d) we can observe the higher frequency of these classes in the rural area. The difference is caused by the higher exposure of the Dancu OPs to solar radiation during the summer midday, while in the sheltered parts of the city center, where the Museum OP is situated, the urban cold pool develops [33].
The “torrid” class has the lowest frequency, representing < 0.1 conventional days/year, restricted to intervals with strong HWs.
4.2.2. Monthly Characteristics of THI
The “comfortable” class presents a warm season maximum from May to September, as shown by both the conventional and effective number of days (Figure 5d and Figure 6d). However, the comfort conditions are more reduced during the middle part of the summer, especially during July and August. The differences between urban and rural areas highlight the impact of the UHI on regional bioclimatic conditions. While in April–May and September–October there is 1 conventional/effective day more in urban area, during July and August there is 1 conventional/effective day less than in the rural area.
A similar bimodal monthly distribution can be observed for “cool” days, with more pronounced shoulder-peaks for effective days, which underlines the fact that the number of hours within the cool class is small per day but they occur in a large number of days (Figure 5c and Figure 6c). During spring and autumn, the frequency of the “cool” index is slightly higher in the urban area, due to the sheltered conditions generated by the urban canopy. In autumn, the inner city keeps more cold areas during the day, which is reflected in the higher frequency of the “cool” index class (Figure 5i and Figure 6i).
The “hot” and “very hot” THI classes present a clear summer peak for both conventional and effective days. The differences between rural and urban areas are high for “hot” class, with 2 more conventional days in July in the city center (Figure 5k). Instead, this difference is smaller when analyzing the effective days in July and August (Figure 6k) due to the fact that in this period in urban areas more important intervals shift to “very hot” conditions (Figure 6l).
Obviously, the “cold” and “very cold” classes are common for winter (Figure 5a,b and Figure 6a,b). It is to be noticed that the two classes have a complementary evolution, with January presenting a lower frequency of “cold” class simply due to the higher frequency of “very cold” class during this month. For December and January the UHI imposes less “extremely cold” conditions in the urban areas. This confirms the fact that the urban climate has positive effects on the human bioclimatological comfort during winter, for Iași city as well [9,47].
We must mention that all the differences between urban and rural areas regarding conventional and effective number of days are not statistically significant at p-value < 0.05.
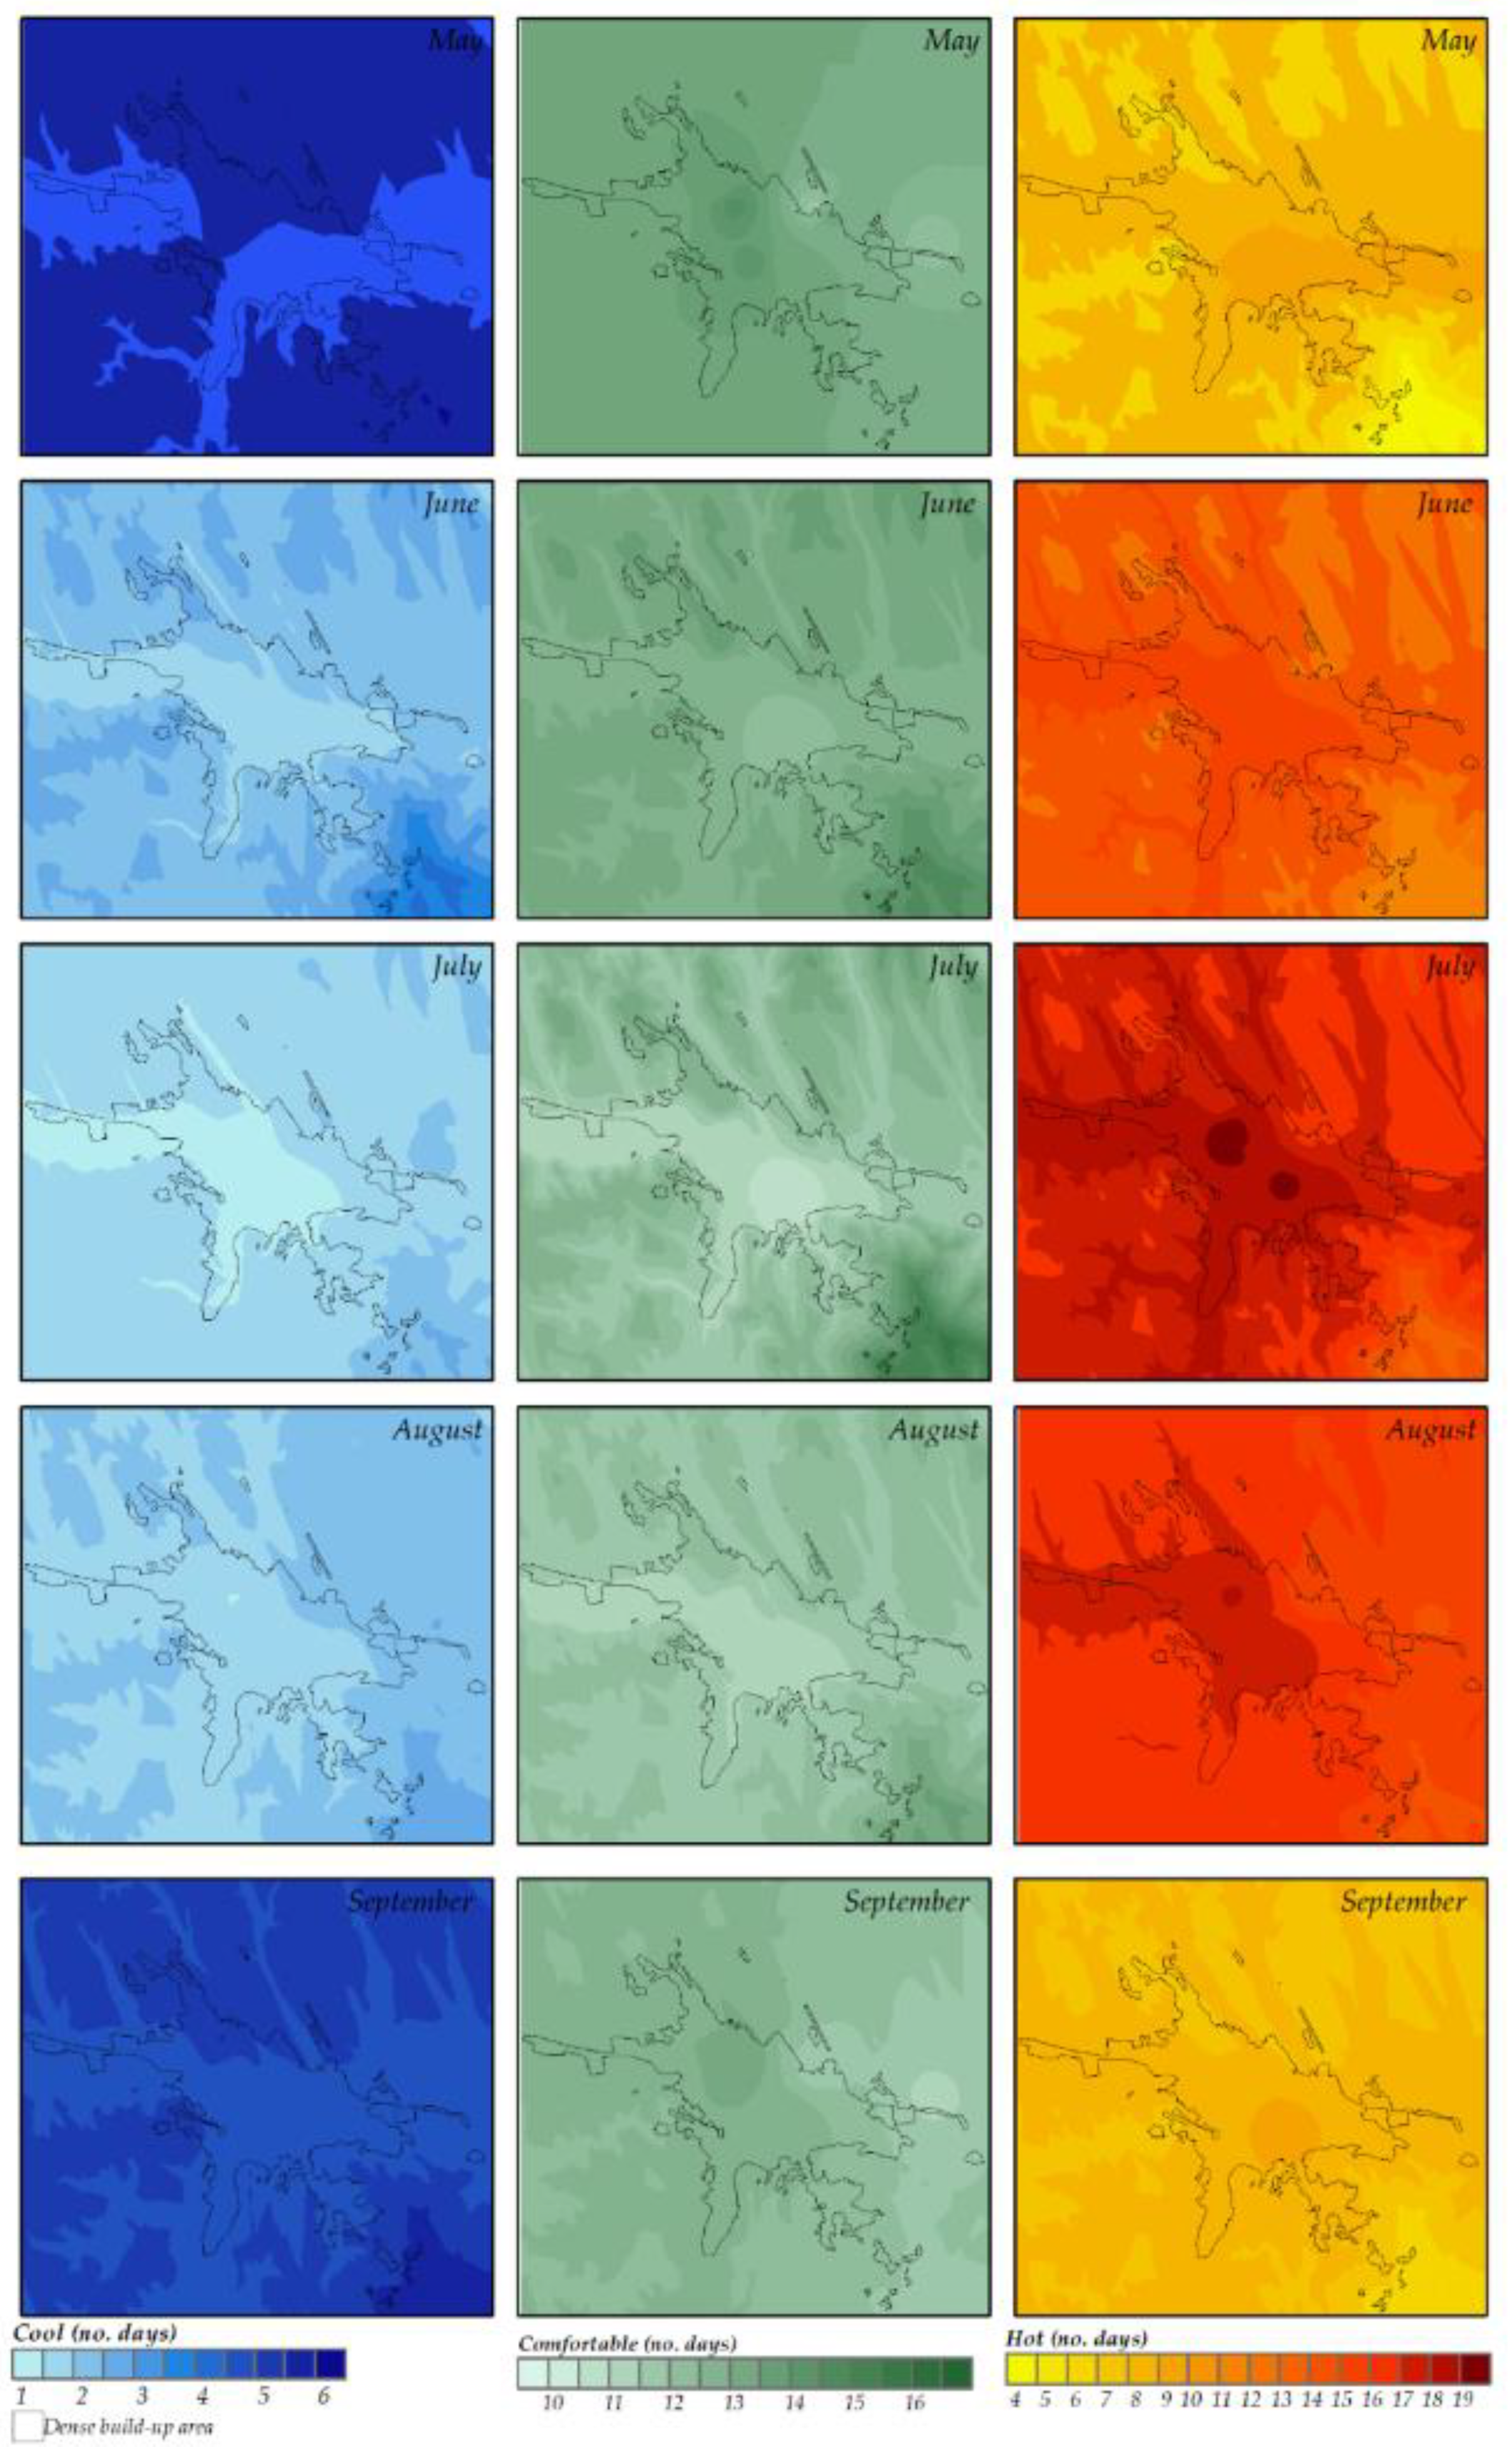
From May to the end of September, the highest monthly frequencies are given by the cool, comfortable and hot classes. During this interval THI classes have a more dynamic distribution over the study area. Therefore, the distribution of these three classes at the monthly level is presented in Figure 7. From the spatial distribution of the three classes it can be observed how the UHI directly impacts the spatial distribution of the comfort and discomfort threshold between urban and rural areas.
The spatial distribution of the number of conventional days within the “comfort” class is significantly influenced by UHI, especially during summer months. In May and September, the UHI increases the number of conventional days within the “comfort” class inside the city, while in July and August the effect is opposite.
Furthermore, we can observe that from June to August the number of days with comfortable conditions increases with altitude from less than 11 in along the valley of Bahlui river and 15 days over the hills surrounding the city from the south. This is a typical distribution for a city situated in a hilly region, as observed previously for Cluj-Napoca in northwestern Romania [31]. During the analyzed interval, the distribution of the “hot” index is concentrated inside the urban area, outlining itself in a distribution similar to that of UHI observed by Sfîcă et al., 2018 [33]. A similar spatial distribution is observed for “hot class”, reaching 19 conventional days in July in the middle of the UHI and 10 days over the hilly area in the rural areas.
4.2.3. Daily Characteristics of THI
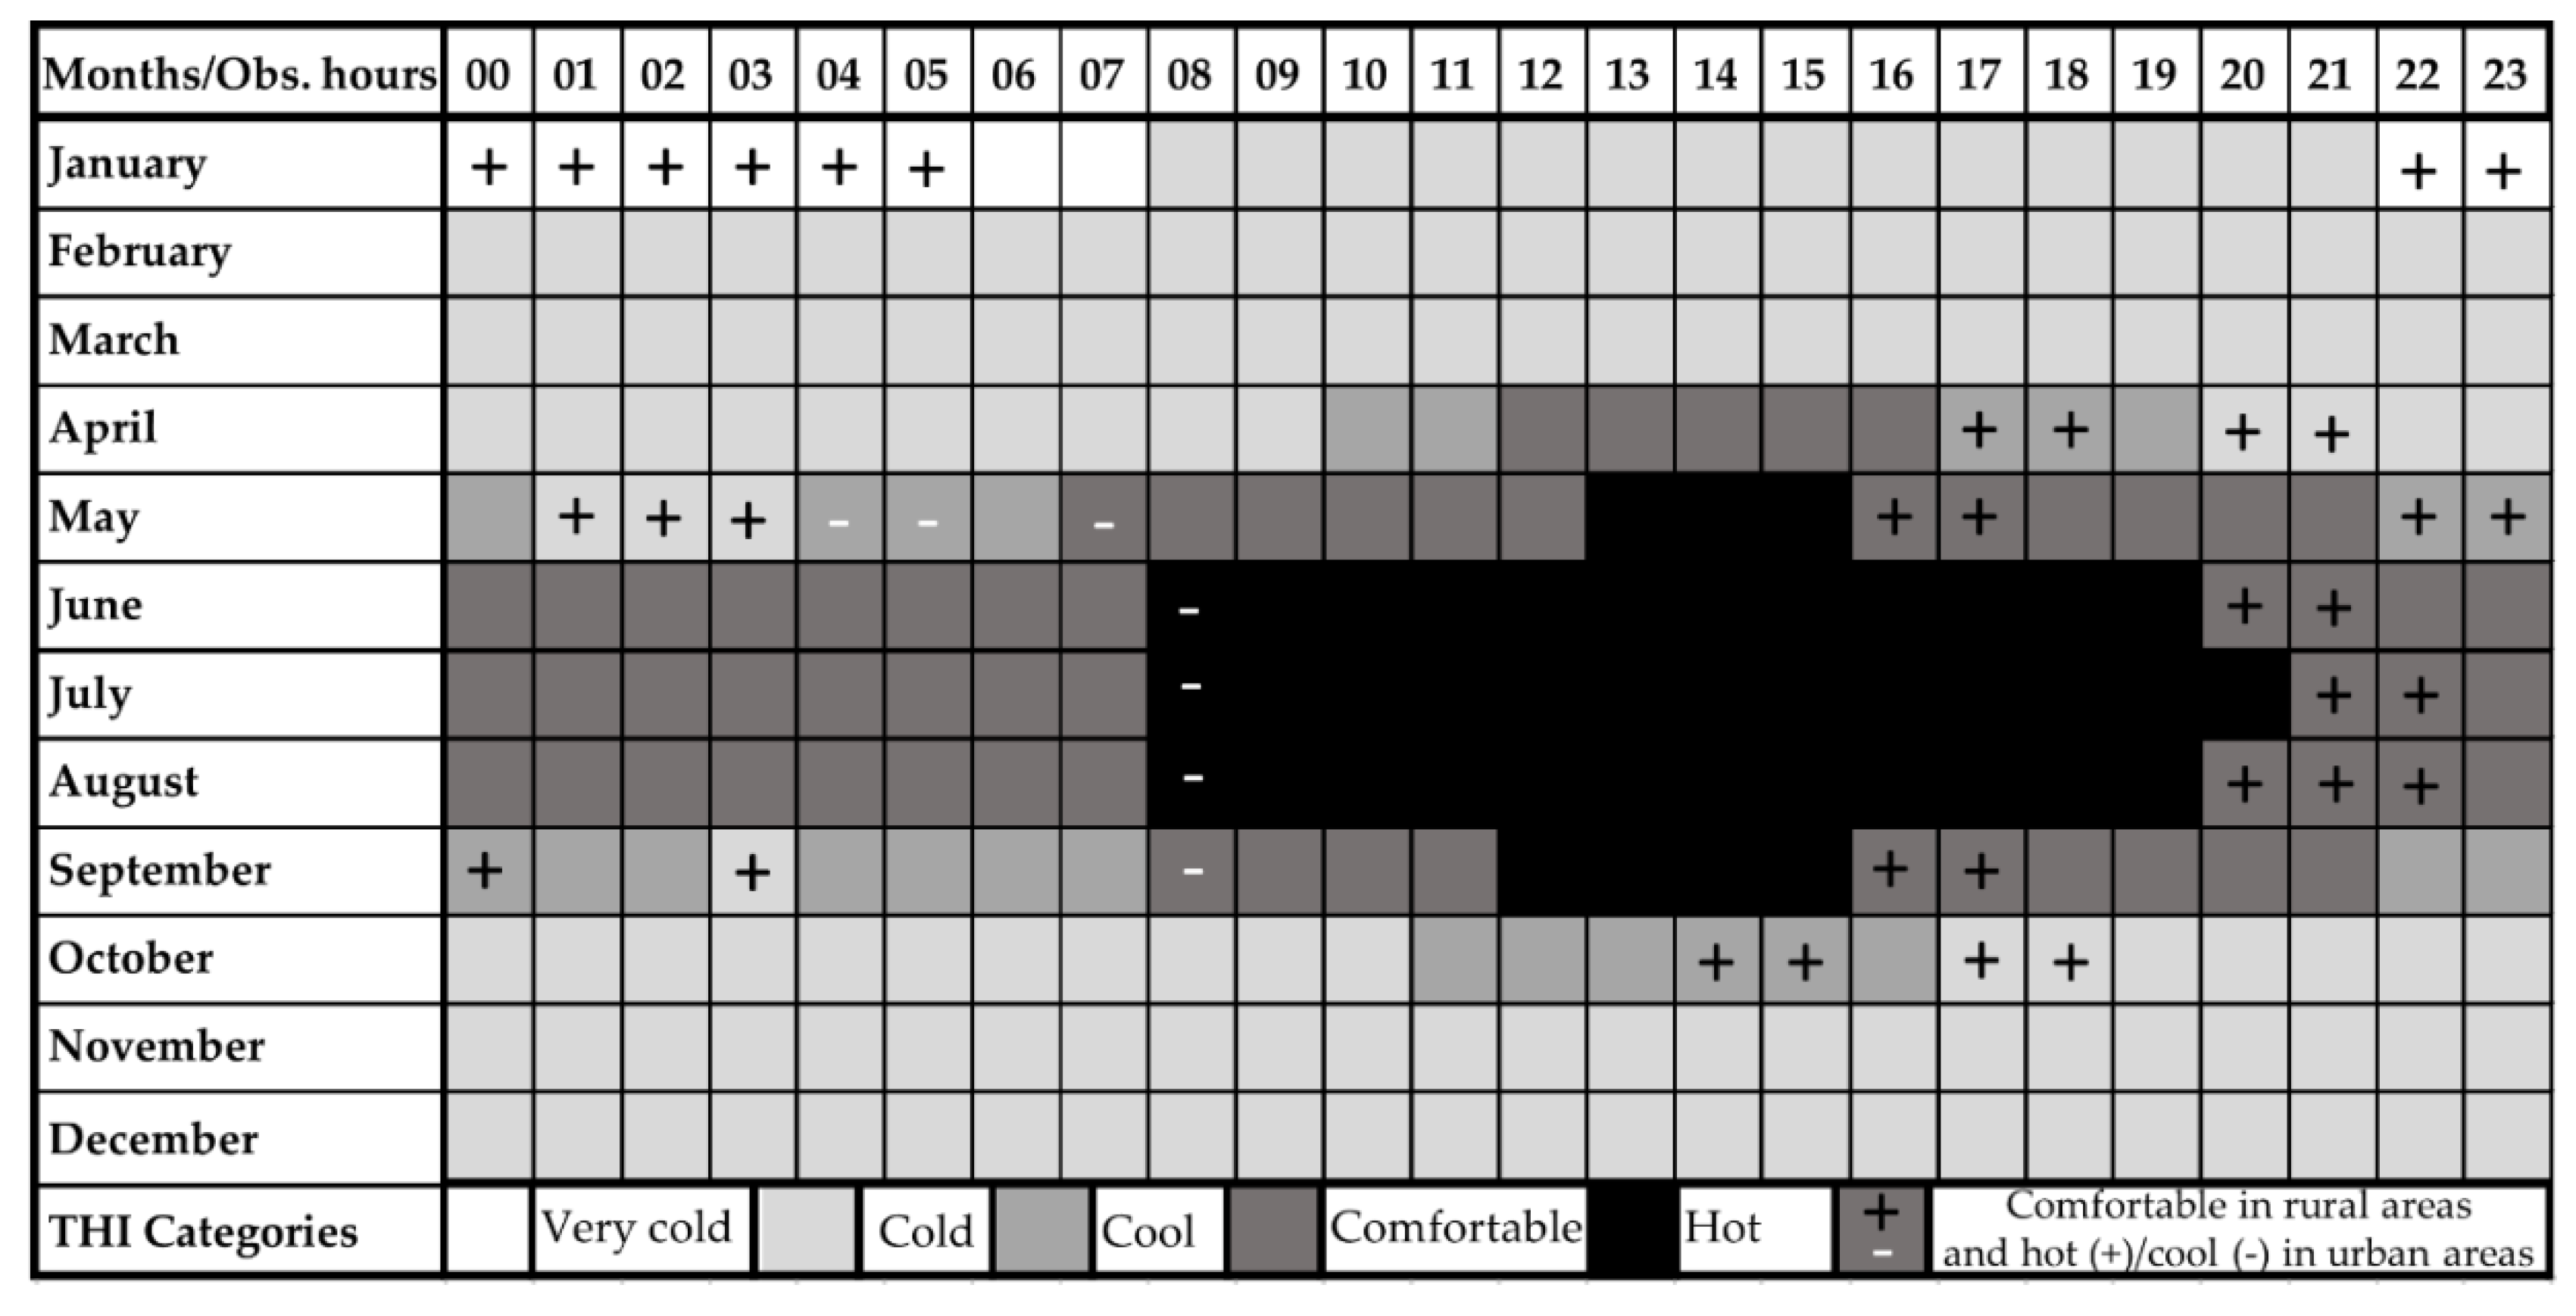
At the hourly level, in urban and rural areas even if almost the same distribution of THI was identified (Figure 8), the differences are very relevant for the impact of urban climate on the bioclimatic conditions over the region. The “cold” class is common along the entire cold season (November–March and November–December). In January instead, the “very cold” class is restricted to morning hours (0600 to 0700 LT) in the urban areas, while in the rural surroundings it lasts from 2200 to 0700 LT.
April and October are dominated by “cold” conditions during the night and early morning and “cool” conditions before midday (10 to 11 LT in April and 11 to 13 LT in October) and during the evening hours (19 LT in April and 16 LT in October). Furthermore, in these months the warming effect of the urban area during the evening hours can be easily observed (Figure 8). Actually, inside these urban areas UHI converts the discomfort which is specific for rural areas in April and October into more comfortable conditions, through a higher level of overheating.
The most complex evolution of bioclimatic conditions during the day occurs in May and September. During these months, the nights are mostly cool and for a couple of hours even cold in the rural area. Instead, during the afternoon hours (12–15 LT) “hot” class prevails, while the remaining morning and evening hours the “comfortable” conditions are dominant.
Considering the hourly values of the THI during summer, it is noticeable that inside the urban area the most pleasant period occurs during night time (after 2200 LT in June and after 2300 LT in July and August), while in the rural areas the comfort period starts earlier (after 2000 LT in June and August and after 2100 LT in July). This is in line with other studies confirming that the major differences between urban and rural areas are observed at night [6]. In these conditions it is obvious that the rural areas are more comfortable than the inner city, where the UHI core intensifies until midnight [33,35]. On the contrary, during the morning, the comfort interval is shifted by an hour in the rural area comparatively to the inner city (Figure 5), due to the sheltering effect induced by the built-up area within the city.
4.3. Relative Strain Index (RSI)
Due to the fact that extremes of air temperature generated by HWs impose a high thermal stress during summer, associated with short-term increases of daily mortality [15], some details have been given on this intervals by analyzing RSI at hourly level for June–August. RSI values are not so highly variable in space and time, but they highlight very well the potential area of risk caused by overheating [10,55,56].
If the maximums recorded at noon exceed the RSI threshold (>0.40) it indicates overheating risk for more than 50% of the human population [48]. Above that, the RSI threshold for physiological failure is 0.50 for young people and 0.30 for older people or people with bad health conditions [10].
Thermal comfort, as expressed by RSI (<0.10), is specific throughout the summer season in Iași city for the night and the early morning hours. It can also be observed (Figure 9) that longer periods of time characterized by thermal discomfort are more specific for the urban area. In summer, the whole region is characterized by a pronounced lack of comfort for more sensitive persons (0.10 ≤ RSI ≤ 0.20) during 1000–1800 LT. The mean maximum values of hourly RSI are reached in August between 1300 and 1600 LT in urban area and restricted to 1300 and 1400 LT in rural area. This August maximum is explained especially by more stable conditions and is associated with radiative income. This radiative effect, specific for August, is seen also in the maximum values of RSI that increase rapidly during the morning hours (0900–1000).
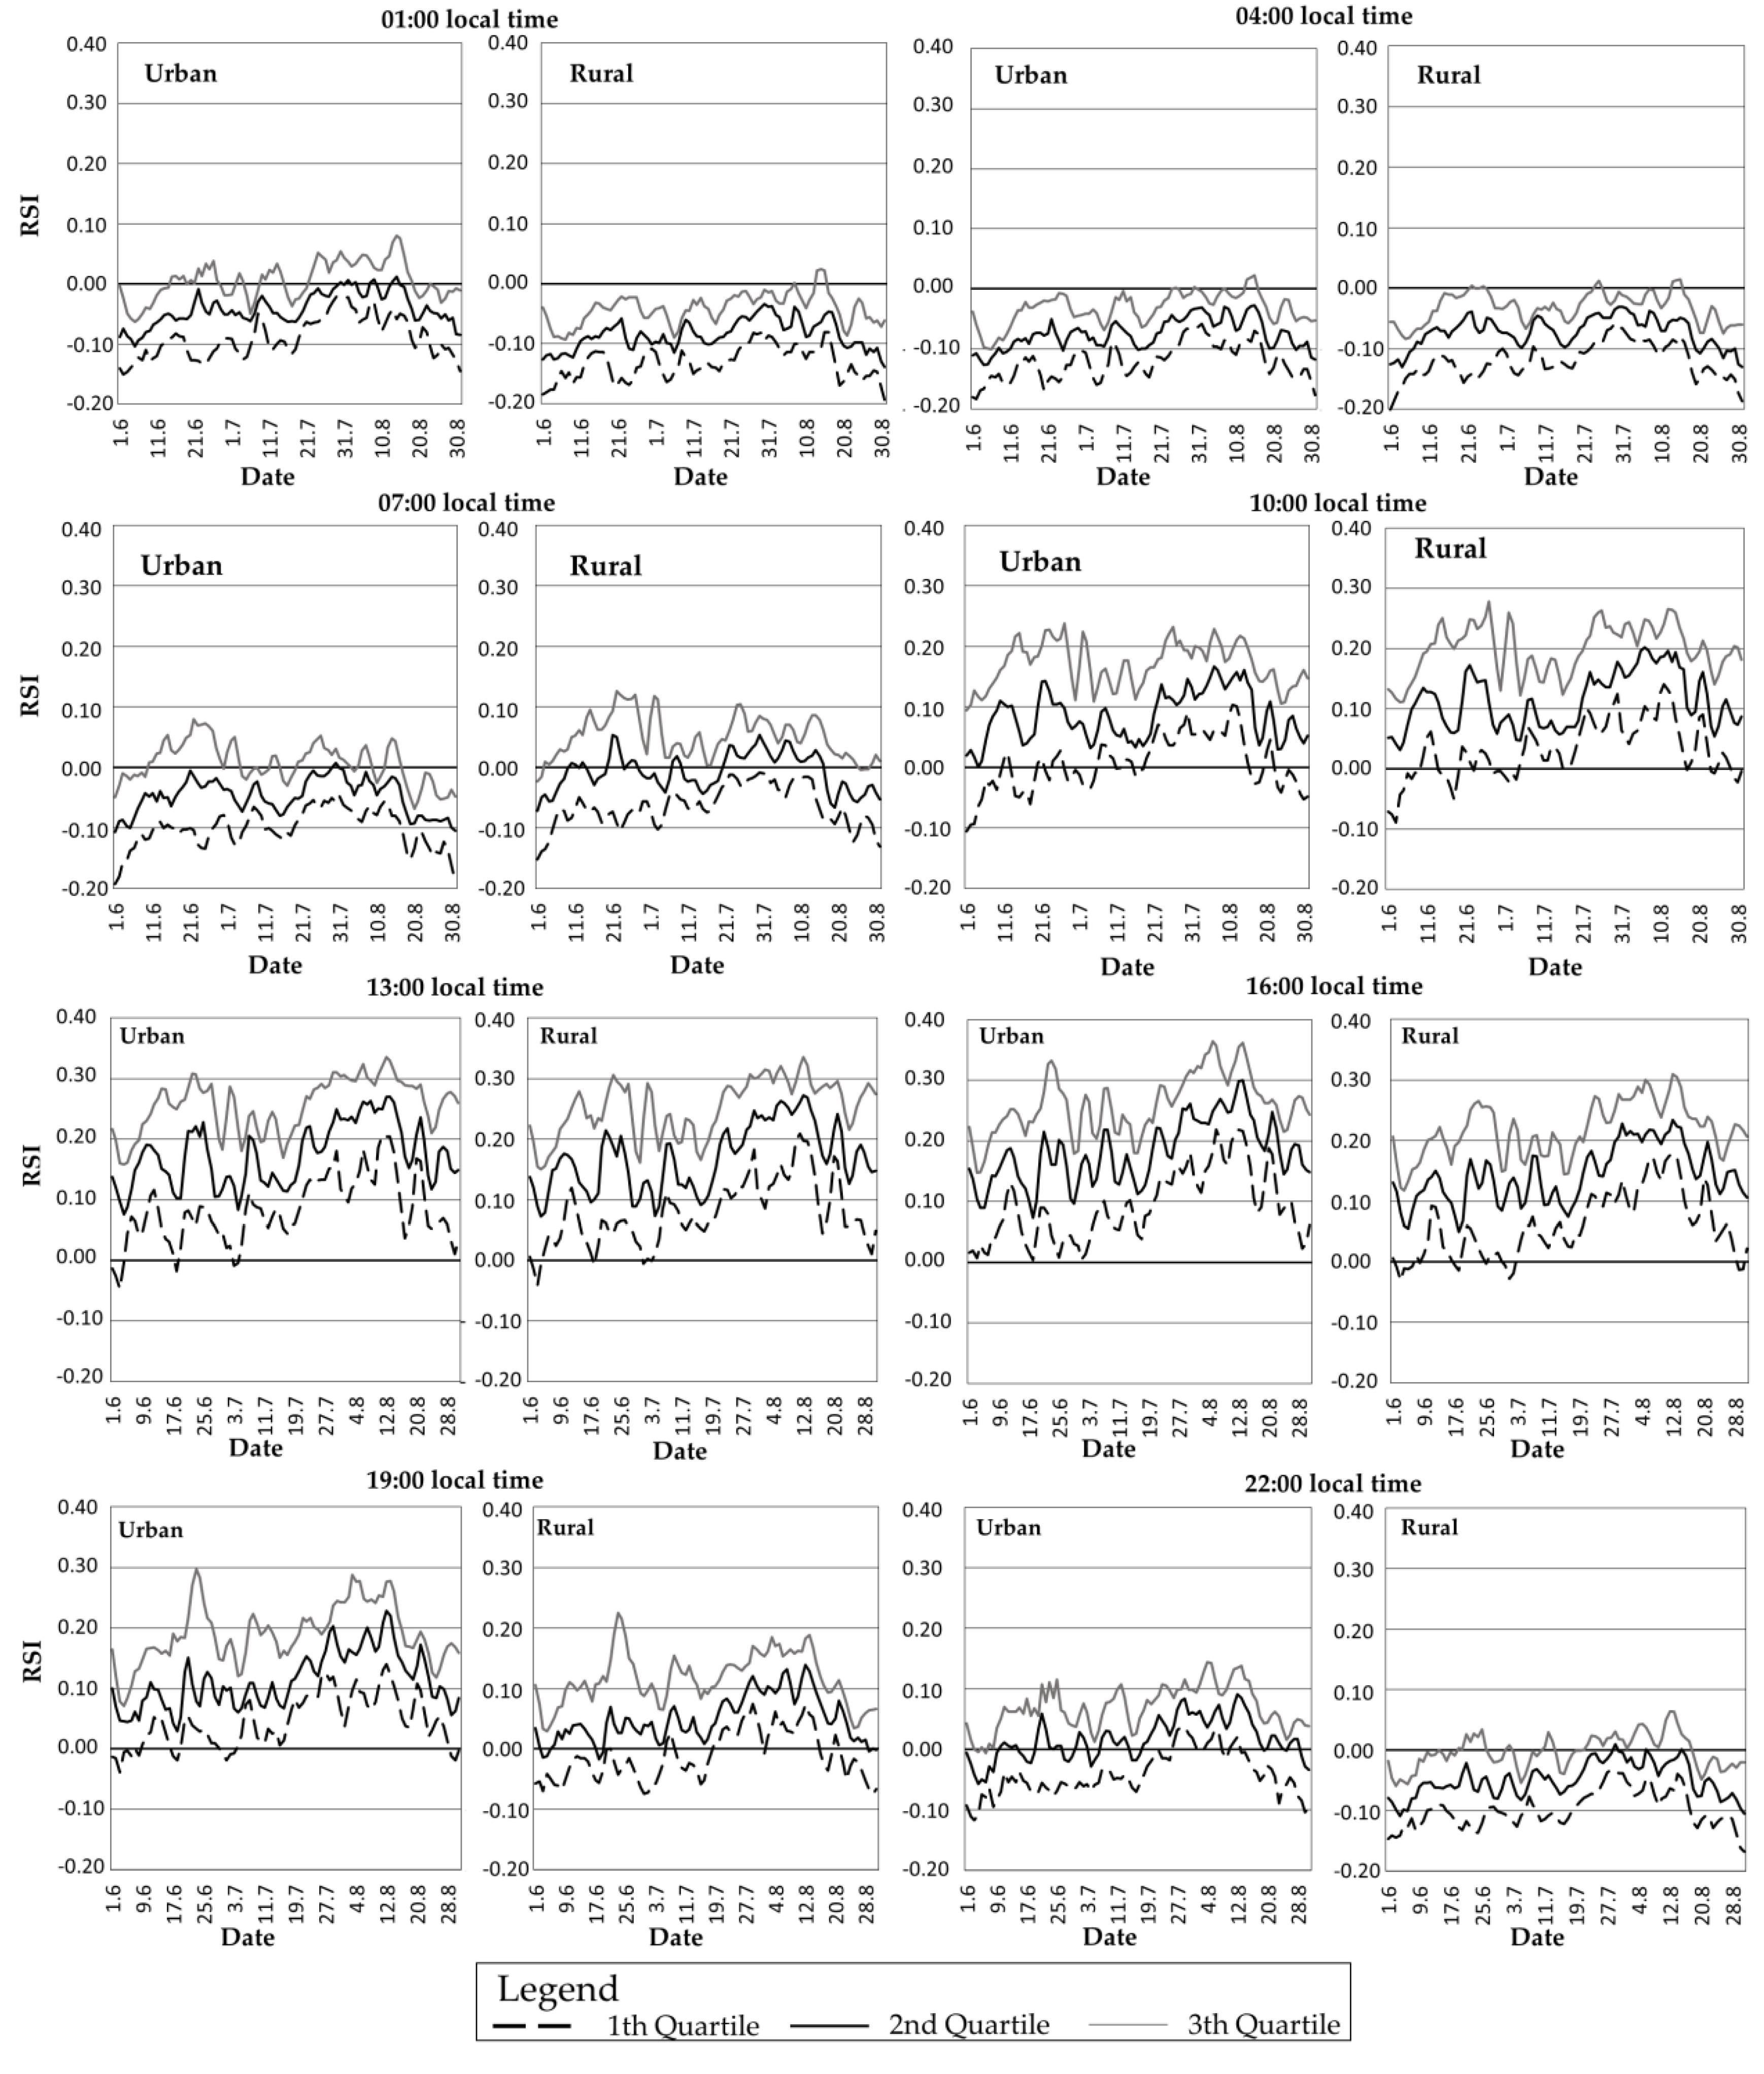
For the summer season (June to August), RSI series were determined at 3 h intervals, starting from 0100 to 2200 LT, using quartiles of each day from the sub-series computed for the entire period of 7 years. The differences from urban and rural areas for each quartile were tested for statistical significance using a t-test. Except late night (0400 LT) and midday (1300 LT) hours, all the other intervals present statistically significant differences at p-value < 0.05.
The RSI quartile analysis (Figure 10) shows that during the night hours, in urban and rural areas of Iași city, thermal comfort is characteristic for the entire summer season. Inside urban areas, during the morning hours, the shading effect induced by the buildings significantly reduces the radiative heating. Under these conditions, slight exceedances of RSI > 0.10 for the 3rd quartile in the rural area occur from 0700 to 1000 LT.
During the afternoon, the frequency of bioclimatic stress becomes higher with more than 80% of days showing conditions of discomfort, especially from the end of July until mid-August, as shown also by the quartile analysis (Figure 10). In fact, the highest frequency of thermal discomfort is extended from the second half of July to mid-August. During this interval, in the afternoon (1600 LT), over 50% (2nd quartile) of cases have RSI > 0.20 (Figure 10).
5. Conclusions
The current study represents the first extensive bioclimatic study of Iași city, an important developing city in northeastern Romania.
As a general bioclimatic feature, we highlighted that Iași city is characterized by a small frequency of bioclimatic comfort as shown by THI, as an effect of the dynamic exposure of the region to both HWs and CWs. Additionally, the urban area of Iași city significantly modifies the air temperature and the relative humidity within the climate of the region and consequently the bioclimatic conditions. Overall, the most favorable conditions in terms of human comfort inside the city areas occur during the months of April–May and September–October.
During the summer months the region is characterized by unpleasant bioclimatic conditions during daytime, the negative impact on human population being more pronounced in the urban area. This represents the effect of strong heating, frequent heat wave occurrence and the intensity and persistence of UHI during the summer. Therefore, the UHI induces the persistence of the thermal discomfort until midnight, representing one of the major impacts of the urban area on the bioclimatic conditions in the region. In the same time, the rural areas are considerably more comfortable. On the contrary, the inner city is slightly more comfortable during winter, especially due to higher minimum air temperature recorded here as an effect of UHI.
It should be emphasized that from a methodological point of view, RSI creates a better image of summer diurnal conditions that involve thermal comfort/discomfort. This index indicates that the highest thermal discomfort is reached during the day in the afternoon hours (1600 LT) between 25 July and 15 August.
Future work will focus on the analysis of some other bioclimatic indices, which have the capacity to depict better the parameters of human energy balance.
Supplementary Materials
The following are available online at https://0-www-mdpi-com.brum.beds.ac.uk/2071-1050/12/22/9652/s1, Table S1: Difference between in situ observation from Iasi WS and Racoviță OP and the values extracted from the residual kriging based on the 7 other OPs; Table S2: p-value for the difference between air temperature and relative humidity from urban and rural area of Iaşi city; significant values at p < 0.05 are given in bold (the results are given synthetically in Tables 1 and 2); Table S3: p-values for the difference between number of conventional and effective days in each THI classes from urban and rural area of Iaşi city; none of the values were found significant at p < 0.05; Table S4: p-values for the difference between hourly RSI quartiles from urban and rural area of Iaşi city; significant values at p < 0.05 are given in bold
Author Contributions
P.I. has made the conceptualization, the formal analysis and prepared the original draft. L.S. has reviewed and edited the manuscript. P.I. and L.S. have been involved in data acquisition and conceived the methodology. Both authors have equally contributed to this article. All authors have read and agreed to the published version of the manuscript.
Funding
This research was funded by “Alexandru Ioan Cuza” University of Iasi, within the Research Grants program, Grant UAIC, code GI-UAIC-2017-05.
Acknowledgments
We thank the Department of Geography from Alexandru Ioan Cuza University, sincerely acknowledged for its continuous support on this research field. Also, for hosting the temperature shelters, we kindly thank Emil Racoviță College, Veolia Energy Iași, Water Direction Prut-Iași, Union Museum Iași and the Melenciuc, Boian and Chiruță families. The article has benefited from the support of the Romanian Young Academy, which is funded by Stiftung Mercator and the Alexander von Humboldt Foundation for the period 2020–2022. We also thank Haralambie Athes for the improvement of the text in terms of English language.
Conflicts of Interest
The authors declare no conflict of interest.
References
- Jáuregui, E. Urban bioclimatology in developing countries. Experientia 1993, 49, 964–968. [Google Scholar] [CrossRef]
- Xue, J.; You, R.; Liu, W.; Chen, C.; Lai, D. Applications of Local Climate Zone Classification Scheme to Improve Urban Sustainability: A Bibliometric Review. Sustainability 2020, 12, 8083. [Google Scholar] [CrossRef]
- Elnabawi, M.H.; Hamza, N. Behavioural Perspectives of Outdoor Thermal Comfort in Urban Areas: A Critical Review. Atmosphere 2019, 11, 51. [Google Scholar] [CrossRef] [Green Version]
- Zhou, Y.; Varquez, A.C.G.; Kanda, M. High-resolution global urban growth projection based on multiple applications of the SLEUTH urban growth model. Sci. Data 2019, 6, 1–10. [Google Scholar] [CrossRef]
- Steinecke, K. Urban climatological studies in the Reykjaík subarctic environment, Iceland. Atmos. Environ. 1999, 33, 4157–4162. [Google Scholar] [CrossRef]
- Sajani, S.Z.; Tibaldi, S.; Scotto, F.; Lauriola, P. Bioclimatic characterisation of an urban area: A case study in Bologna (Italy). Int. J. Biometeorol. 2008, 52, 779–785. [Google Scholar] [CrossRef] [Green Version]
- Pearlmutter, D.; Jiao, D.; Garb, Y. The relationship between bioclimatic thermal stress and subjective thermal sensation in pedestrian spaces. Int. J. Biometeorol. 2014, 58, 2111–2127. [Google Scholar] [CrossRef]
- Basarin, B.; Lukić, T.; Matzarakis, A. Quantification and assessment of heat and cold waves in Novi Sad, Northern Serbia. Int. J. Biometeorol. 2015, 60, 139–150. [Google Scholar] [CrossRef]
- Toy, S.; Yilmaz, S.; Yilmaz, H. Determination of bioclimatic comfort in three different land uses in the city of Erzurum, Turkey. Build. Environ. 2007, 42, 1315–1318. [Google Scholar] [CrossRef]
- De Garín, A.; Bejaran, R. Mortality rate and relative strain index in Buenos Aires city. Int. J. Biometeorol. 2003, 48, 31–36. [Google Scholar] [CrossRef]
- Vanos, J.K.; Warland, J.S.; Gillespie, T.J.; Kenny, N.A. Review of the physiology of human thermal comfort while exercising in urban landscapes and implications for bioclimatic design. Int. J. Biometeorol. 2010, 54, 319–334. [Google Scholar] [CrossRef]
- Coccolo, S.; Kämpf, J.; Scartezzini, J.-L.; Pearlmutter, D. Outdoor human comfort and thermal stress: A comprehensive review on models and standards. Urban Clim. 2016, 18, 33–57. [Google Scholar] [CrossRef]
- Matzarakis, A.; Fröhlich, D. Sport events and climate for visitors—The case of FIFA World Cup in Qatar 2022. Int. J. Biometeorol. 2015, 59, 481–486. [Google Scholar] [CrossRef]
- Zhang, L.; Wei, D.; Hou, Y.; Du, J.; Liu, Z.; Zhang, G.; Shi, L. Outdoor Thermal Comfort of Urban Park—A Case Study. Sustainability 2020, 12, 1961. [Google Scholar] [CrossRef] [Green Version]
- Medina-Ramón, M.; Zanobetti, A.; Cavanagh, D.P.; Schwartz, J. Extreme Temperatures and Mortality: Assessing Effect Modification by Personal Characteristics and Specific Cause of Death in a Multi-City Case-Only Analysis. Environ. Health Perspect. 2006, 114, 1331–1336. [Google Scholar] [CrossRef]
- Mozaffarieh, M.; Gasio, P.F.; Schötzau, A.; Orgül, S.; Flammer, J.; Kräuchi, K. Thermal discomfort with cold extremities in relation to age, gender, and body mass index in a random sample of a Swiss urban population. Popul. Health Metrics 2010, 8, 17. [Google Scholar] [CrossRef] [Green Version]
- Matzarakis, A.; Mayer, H. The extreme heat wave in Athens in July 1987 from the point of view of human biometeorology. Atmos. Environ. Part B. Urban Atmos. 1991, 25, 203–211. [Google Scholar] [CrossRef]
- Muthers, S.; Laschewski, G.; Matzarakis, A. The Summers 2003 and 2015 in South-West Germany: Heat Waves and Heat-Related Mortality in the Context of Climate Change. Atmosphere 2017, 8, 224. [Google Scholar] [CrossRef] [Green Version]
- Sofroni, V.; Puţuntică, A.; Sfîcă, L.; Ichim, P. The cold wave of the 25 January–18 February 2012 period on the territory of the Republic of Moldova. Present Environ. Sustain. Dev. 2013, 7, 5–11. [Google Scholar]
- Croitoru, A.E.; Piticar, A.; Sfîcă, L.; Roșca, C.-F.; Tudose, T.; Horvath, C.; Ionuț, M.; Ciupertea, A.-F.; Scripcă, S.; Harpa, G. Extreme Temperature and Precipitation Events in Romania; The Romanian Academy: Bucharest, Romania, 2018; ISBN 978-973-27-2833-8. [Google Scholar]
- Zaninović, K. Limits of warm and cold bioclimatic stress in different climatic regions. Theor. Appl. Clim. 1992, 45, 65–70. [Google Scholar] [CrossRef]
- Zhu, Z.; Liang, J.; Sun, C.; Han, Y. Summer Outdoor Thermal Comfort in Urban Commercial Pedestrian Streets in Severe Cold Regions of China. Sustainability 2020, 12, 1876. [Google Scholar] [CrossRef] [Green Version]
- Ng, E.; Cheng, V. Urban human thermal comfort in hot and humid Hong Kong. Energy Build. 2012, 55, 51–65. [Google Scholar] [CrossRef]
- Dobrinescu, A.; Busuioc, A.; Birsan, M.; Dumitrescu, A.; Orzan, A. Changes in thermal discomfort indices in Romania and their connections with large-scale mechanisms. Clim. Res. 2015, 64, 213–226. [Google Scholar] [CrossRef]
- Ciobotaru, A.-M.; Andronache, I.; Dey, N.; Petralli, M.; Daneshvar, M.R.M.; Wang, Q.; Radulovic, M.; Pintilii, R.-D. Temperature-Humidity Index described by fractal Higuchi Dimension affects tourism activity in the urban environment of Focşani City (Romania). Theor. Appl. Clim. 2019, 136, 1009–1019. [Google Scholar] [CrossRef]
- Ionac, N.; Ciulache, S. The bioclimatic stress in Dobrudja. Present Environ. Sustain. Dev. 2007, 1, 168–178. [Google Scholar]
- Grigore, E.; Bogan, E.; Cristea, M.-A.; Tatu, F. The thermo-hygrometric index on the territory of the southern Dobrogea plateau—A component of the balneoclimateric treatment. Present Environ. Sustain. Dev. 2020, 14. [Google Scholar] [CrossRef]
- Ionac, N.; Ciulache, S. Bioclimatic considerations on the Moldavian Plain (article in Romanian). In Proceedings of the Geographic seminar “D. Cantemir”, Bucharest, Romania, 27–29 October 2004; Volume 25, pp. 20–29. [Google Scholar]
- Teodoreanu, E. Thermal Comfort Index. Present Environ. Sustain. Dev. 2016, 10, 105–118. [Google Scholar] [CrossRef] [Green Version]
- Mihăilă, D.; Bistricean, P.-I.; Briciu, A.-E. Assessment of the climate potential for tourism. Case study: The North-East Development Region of Romania. Theor. Appl. Clim. 2018, 137, 601–622. [Google Scholar] [CrossRef]
- Géczi, R. Human bioclimatological features of Cluj, Acta Universitatis Lodziensis. Folia Geograph. 1998, 3, 135–144. [Google Scholar]
- Alexe, C. Some thermic differences in the southern metropolitan area of Iași. Present Environ. Sustain. Dev. 2012, 6, 377–393. [Google Scholar]
- Sfîcă, L.; Ichim, P.; Apostol, L.; Ursu, A. The extent and intensity of the urban heat island in Iași city, Romania. Theor. Appl. Clim. 2018, 134, 777–791. [Google Scholar] [CrossRef]
- Apostol, L.; Alexe, C.; Sfîcă, L. Thermic differenciations in the Iași Municipality during a heat wave. Case Study July 10–20 2011. Present Environ. Sustain. Dev. 2012, 6, 395–404. [Google Scholar]
- Ichim, P.; Sfîcă, L.; Kadhim-Abid, A.; Ursu, A.; Jitariu, V. Characteristics of Nocturnal Urban Heat Island of Iaşi During a Summer Heat Wave (1–6 of August 2017). Air Water Compon. Environ. 2018. [Google Scholar] [CrossRef] [Green Version]
- Sfîcă, L.; Croitoru, A.-E.; Iordache, I.; Ciupertea, A.-F. Synoptic Conditions Generating Heat Waves and Warm Spells in Romania. Atmosphere 2017, 8, 50. [Google Scholar] [CrossRef] [Green Version]
- Roșu, L. The urban transformations of a post-socialist city centre. The socialist relicts and current identity of Iași historical city centre. Lucrările Seminarului Geografic Dimitrie Cantemir 2015, 40, 159–170. [Google Scholar] [CrossRef]
- Ursu, A.; Andrei, M.; Chelaru, D.A.; Ichim, P. Built-Up Area Change Analysis in Iasi City Using GIS. Present Environ. Sustain. Dev. 2016, 10, 201–216. [Google Scholar] [CrossRef] [Green Version]
- Bulai, A.-T.; Roşu, L.; Bănică, A. Patterns of urban fire occurence in Iasi City (Romania). Present Environ. Sustain. Dev. 2019, 13. [Google Scholar] [CrossRef]
- Belda, M.; Holtanová, E.; Halenka, T.; Kalvová, J. Climate classification revisited: From Köppen to Trewartha. Clim. Res. 2014, 59, 1–13. [Google Scholar] [CrossRef] [Green Version]
- Piticar, A.; Ristoiu, D. Analysis of air temperature evolution in northeastern Romania and evidence of warming trend. Carpathian J. Earth Environ. Sci. 2012, 7, 97–106. [Google Scholar]
- Tiron, M. Consideration on the atmospheric precipitations in the central plateau of Moldavia. Present Environ. Sustain. Dev. 2019, 13. [Google Scholar] [CrossRef]
- SYNOP Hourly Data. Available online: meteomanz.com (accessed on 10 July 2020).
- Kyle, W.J. Summer and winter patterns of human thermal stress in Hong Kong. In Proceedings of the 2nd International Conference on East Asia and Western Pacific Meteorology and Climate, Hong Kong, China, 7–10 September 1992; Kyle, W.J., Chang, C.P., Eds.; World Scientific: Singapore, 1992; pp. 575–583. [Google Scholar]
- Thom, E.C. The Discomfort Index. Weather 1959, 12, 57–61. [Google Scholar] [CrossRef]
- Unger, J. Comparisons of urban and rural bioclimatological conditions in the case of a Central-European city. Int. J. Biometeorol. 1999, 43, 139–144. [Google Scholar] [CrossRef] [PubMed]
- Asghari, M.; Ghalhari, G.F.; Abbasinia, M.; Shakeri, F.; Tajik, R.; Ghannadzadeh, M.J. Feasibility of Relative Strain Index (RSI) for the Assessment of Heat Stress in Outdoor Environments: Case Study in Three Different Climates of Iran. Open Ecol. J. 2020, 13, 11–18. [Google Scholar] [CrossRef]
- Ionac, N. The Heat stress in Moldavian Counties. In Proceedings of the Geographic Seminar “D. Cantemir”, Bucharest, Romania, 28–29 October 2005; Volume 26, pp. 53–60. [Google Scholar]
- Prudhomme, C.; Reed, D. Mapping extreme rainfall in a mountainous region using geostatistical techniques: A case study in Scotland. Int. J. Climatol. 1999, 19, 1337–1356. [Google Scholar] [CrossRef]
- Patriche, C.V. Statistical Methods Applied in Climatology; Terra Nostra: Iaşi, Romania, 2009. (In Romanian) [Google Scholar]
- Minea, I. The evaluation of the water chemistry and quality for the lakes from the south of the Hilly Plain of Jijia (Bahlui drainage basin). Rom. J. Limnol. Lakes Reserv. Ponds 2010, 4, 131–144. [Google Scholar]
- Cheval, S.; Popa, A.-M.; Șandric, I.; Iojă, I.-C. Exploratory analysis of cooling effect of urban lakes on land surface temperature in Bucharest (Romania) using Landsat imagery. Urban Clim. 2020, 34, 100696. [Google Scholar] [CrossRef]
- Ichim, P.; Apostol, L.; Sfîcă, L.; Kadhim-Abid, A.-L.; Istrate, V. Frequency of Thermal Inversions Between Siret and Prut Rivers in 2013. Present Environ. Sustain. Dev. 2014, 8, 267–284. [Google Scholar] [CrossRef] [Green Version]
- Toy, S.; Yilmaz, S. Evaluation of Urban-Rural Bioclimatic Comfort Differences over a Ten-Year Period in the Sample of Erzincan City Reconstructed after a Heavy Earthquake. Atmósfera 2010, 23, 387–402. [Google Scholar]
- Alessandro, A.P.; De Garín, A.B. A study on predictability of human physiological strain in Buenos Aires City. Meteorol. Appl. 2003, 10, 263–271. [Google Scholar] [CrossRef]
- Ap, A.; Ao, N.; Om, E.; Ks, P.; Oo, A. An Assessment of Effective Temperature, Relative Strain Index and Dew Point Temperature Over Southwest Nigeria. J. Clim. Weather Forecast. 2017, 5, 192. [Google Scholar] [CrossRef] [Green Version]
Figure 1.
Geographical position, hypsometry, built-up area and location of observation points (OPs) in Iași city (partially adapted from Sfîcă et al., 2018 [33]).
Figure 1.
Geographical position, hypsometry, built-up area and location of observation points (OPs) in Iași city (partially adapted from Sfîcă et al., 2018 [33]).

Figure 2.
Spatial distribution of the mean annual air temperature (a) and mean relative humidity (b) in Iași (December 2012–November 2019).
Figure 2.
Spatial distribution of the mean annual air temperature (a) and mean relative humidity (b) in Iași (December 2012–November 2019).

Figure 3.
Mean annual frequency of THI classes expressed as conventional number of days in urban (a) Museum representative point (c) and rural (b) Dancu representative point (d) areas of Iași.
Figure 3.
Mean annual frequency of THI classes expressed as conventional number of days in urban (a) Museum representative point (c) and rural (b) Dancu representative point (d) areas of Iași.

Figure 4.
Mean annual frequency of THI classes expressed as effective number of days with at least 1 h in each class in urban (a) Museum representative point (c) and rural (b) Dancu representative point (d) areas of Iași.
Figure 4.
Mean annual frequency of THI classes expressed as effective number of days with at least 1 h in each class in urban (a) Museum representative point (c) and rural (b) Dancu representative point (d) areas of Iași.

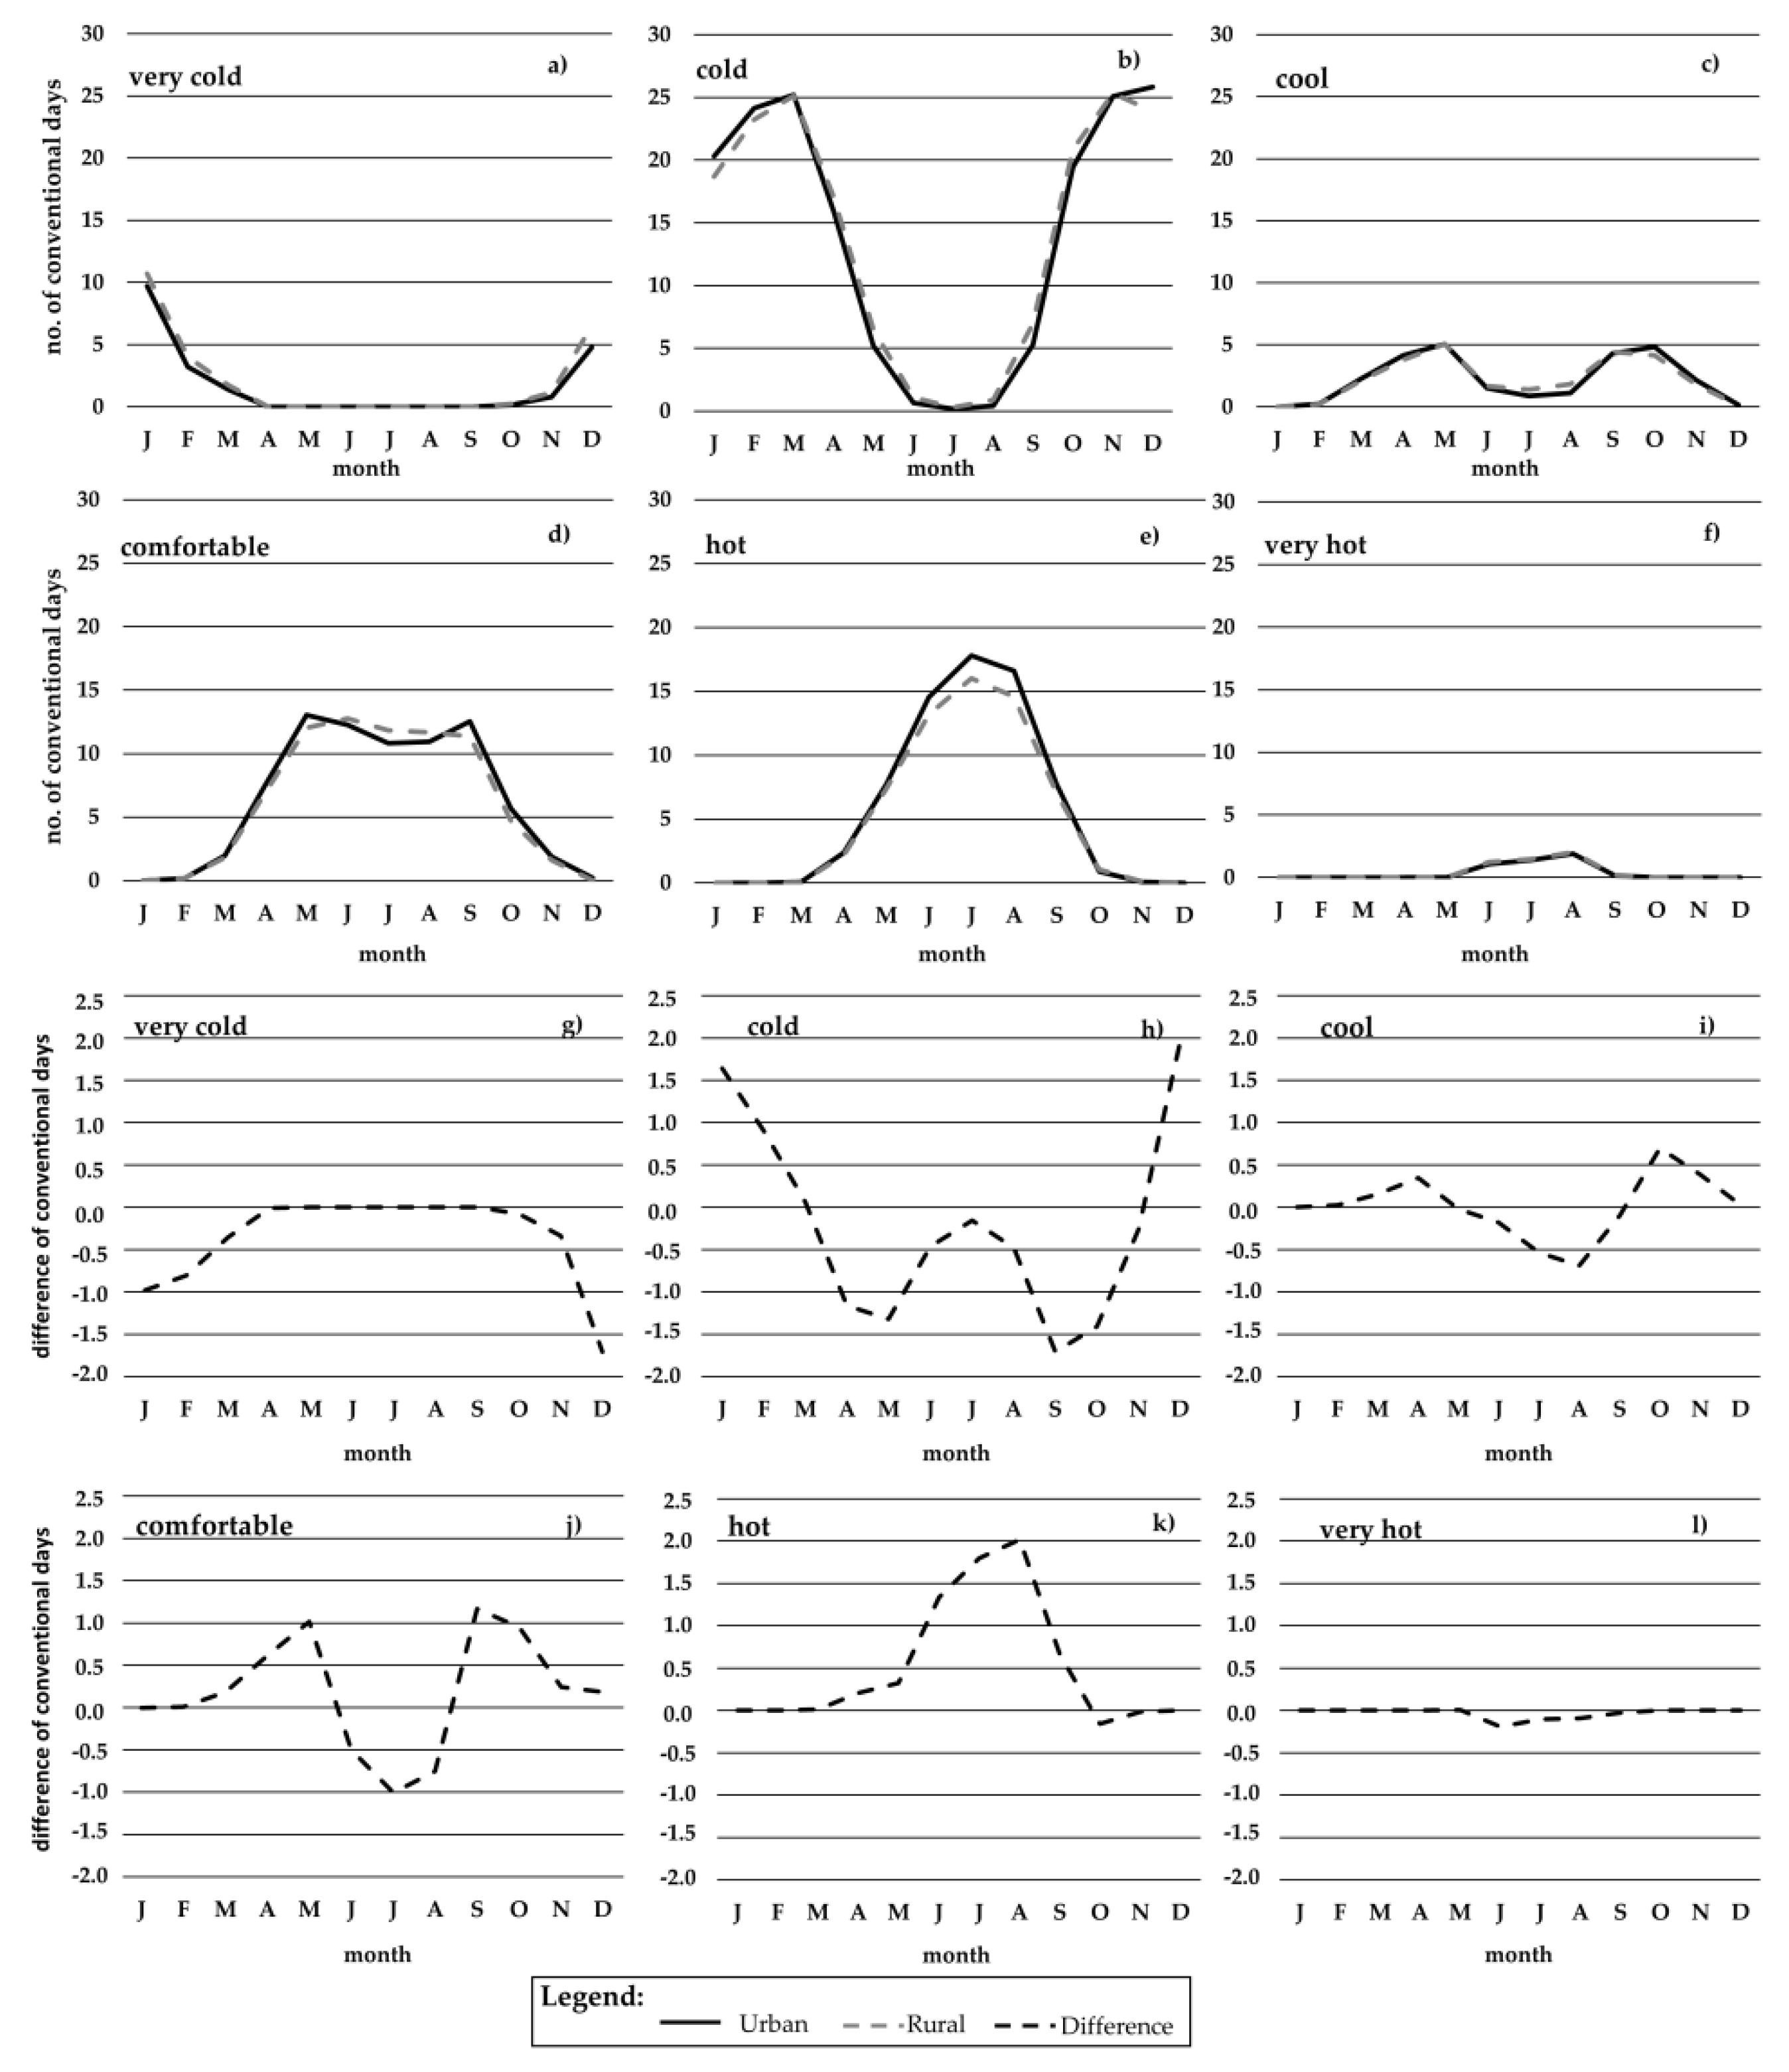
Figure 5.
Monthly number of conventional days for THI main classes (a–f) and the differences between urban and rural areas (g–l) in Iași city.
Figure 5.
Monthly number of conventional days for THI main classes (a–f) and the differences between urban and rural areas (g–l) in Iași city.

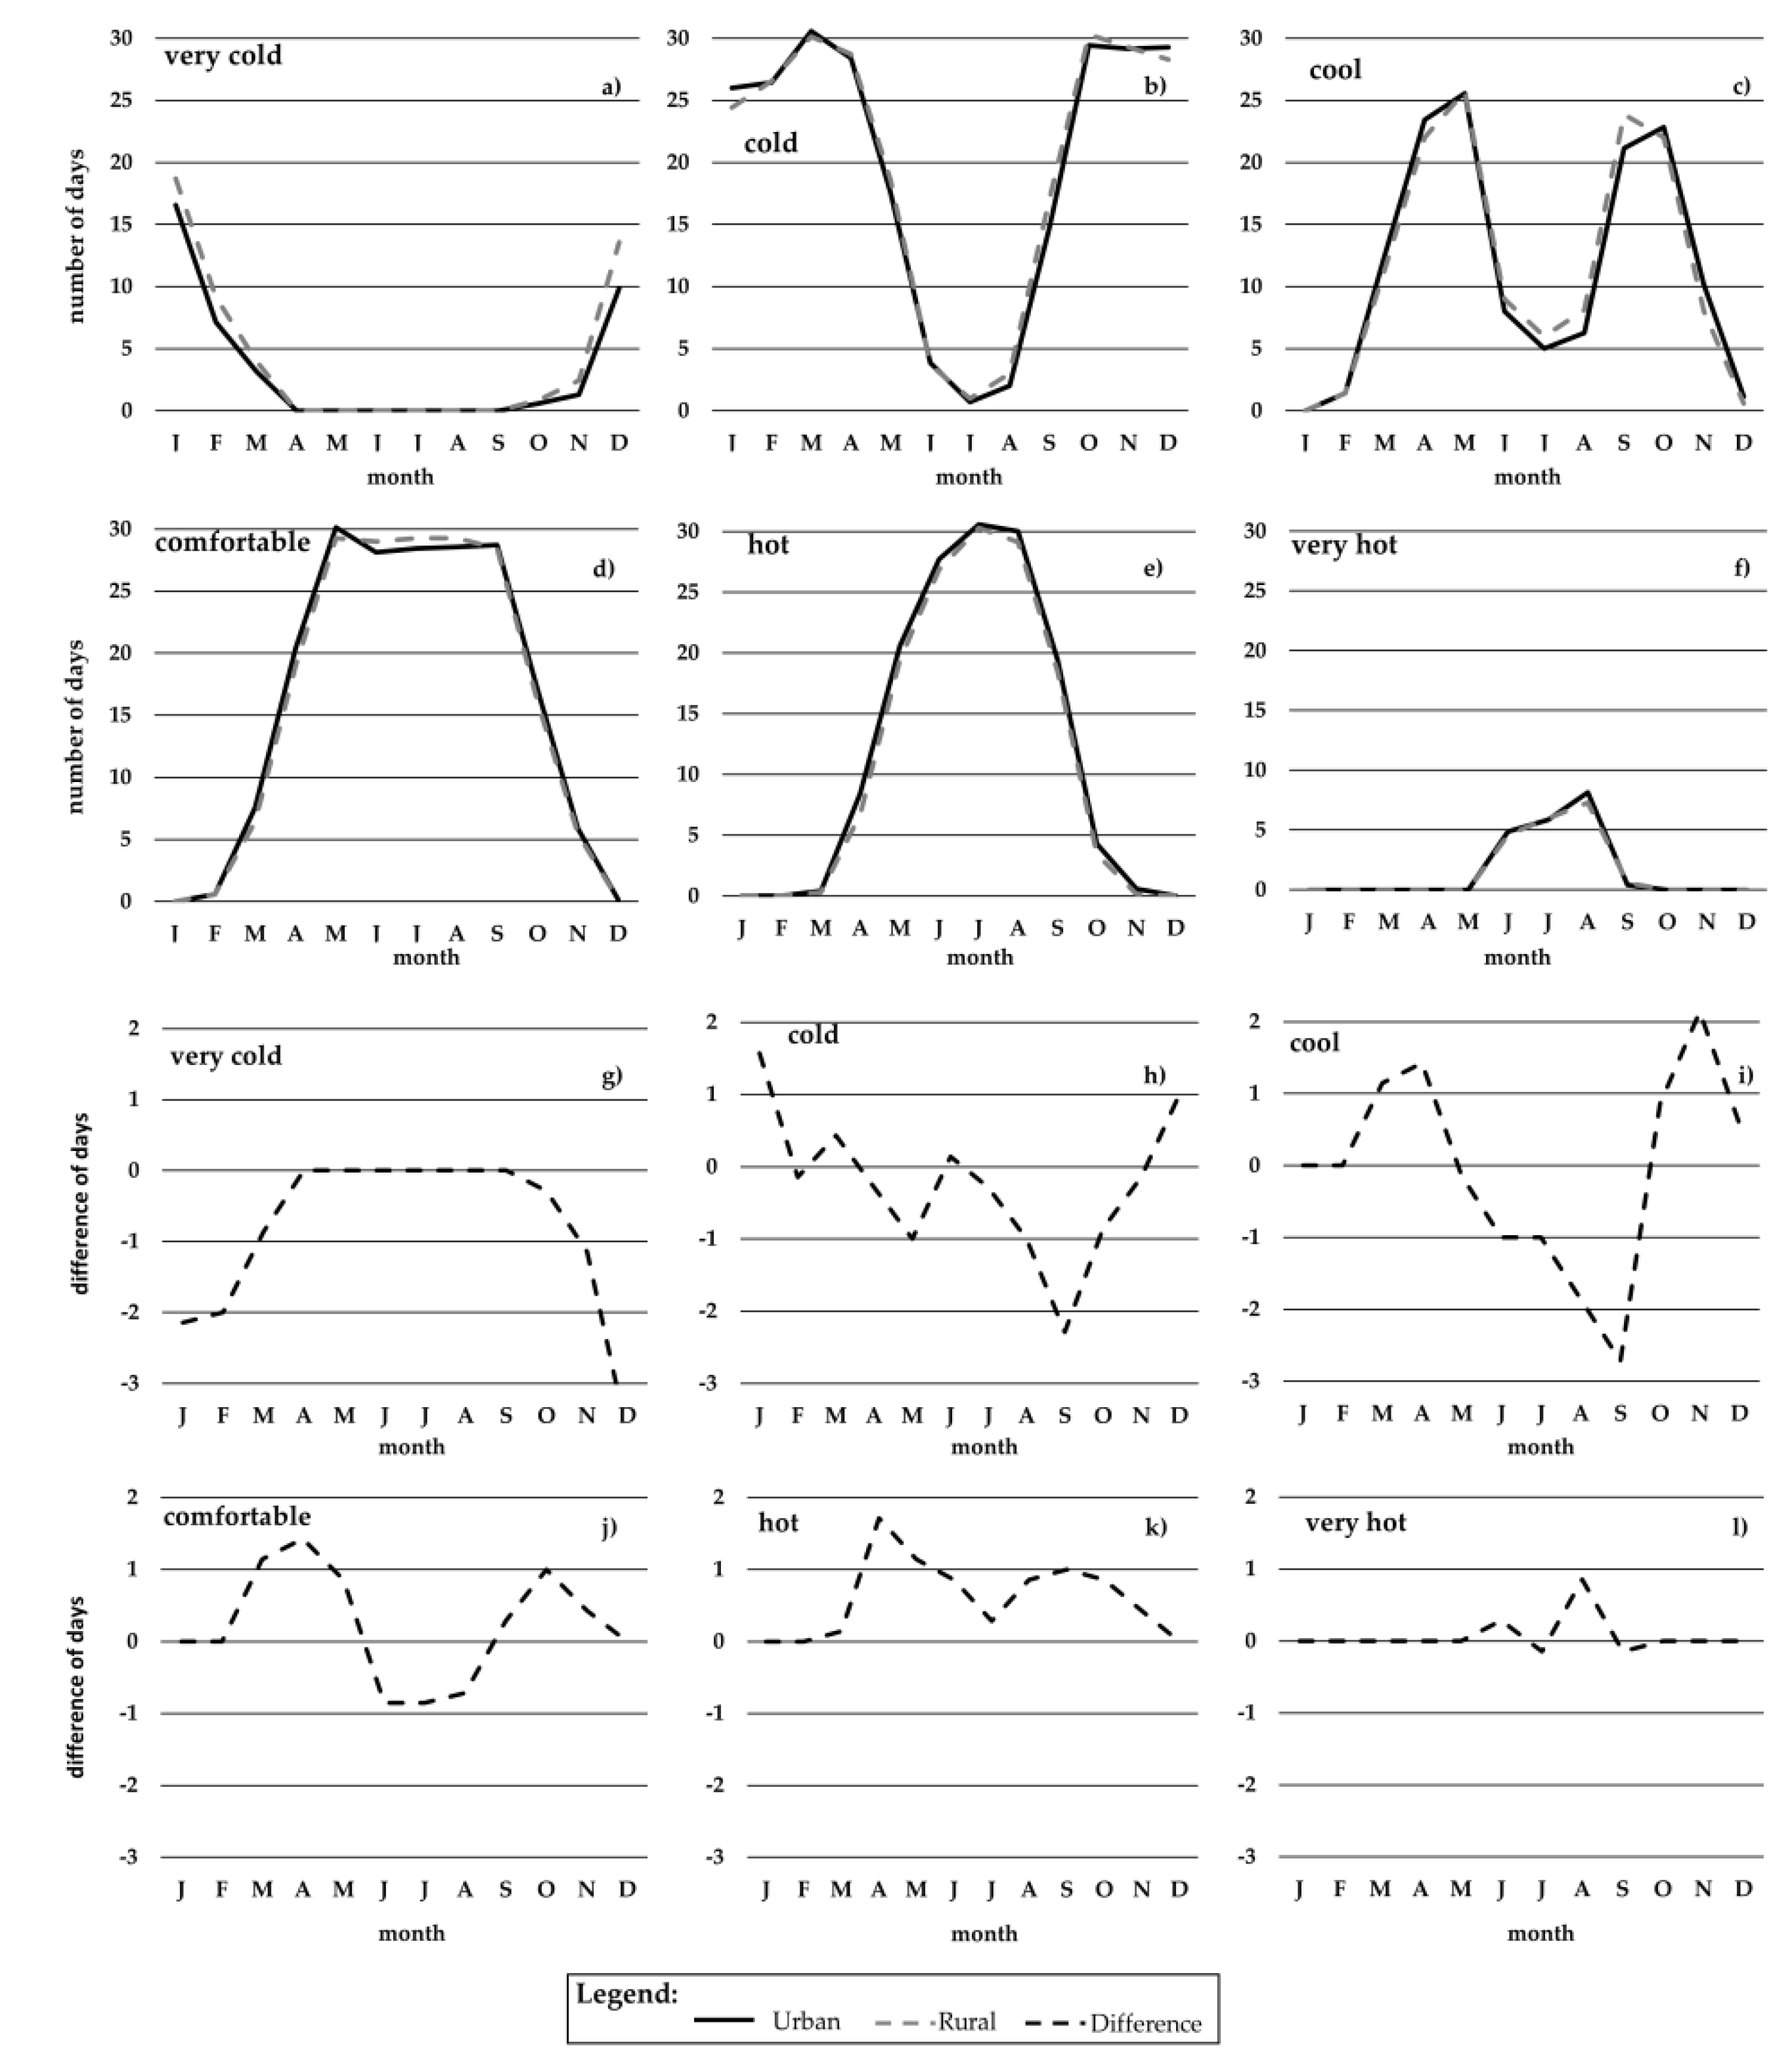
Figure 6.
Monthly number of effective days with at least 1 h within the THI main classes (a–f) and the differences between urban and rural areas (g–l) for Iași city.
Figure 6.
Monthly number of effective days with at least 1 h within the THI main classes (a–f) and the differences between urban and rural areas (g–l) for Iași city.

Figure 7.
The distribution of number of conventional days with “cool”, “comfortable” and “hot” classes from May to September in Iași city.
Figure 7.
The distribution of number of conventional days with “cool”, “comfortable” and “hot” classes from May to September in Iași city.

Figure 8.
The hourly mean prevalent THI class in rural areas and the differences (+/−) within the urban areas of Iași city.
Figure 8.
The hourly mean prevalent THI class in rural areas and the differences (+/−) within the urban areas of Iași city.

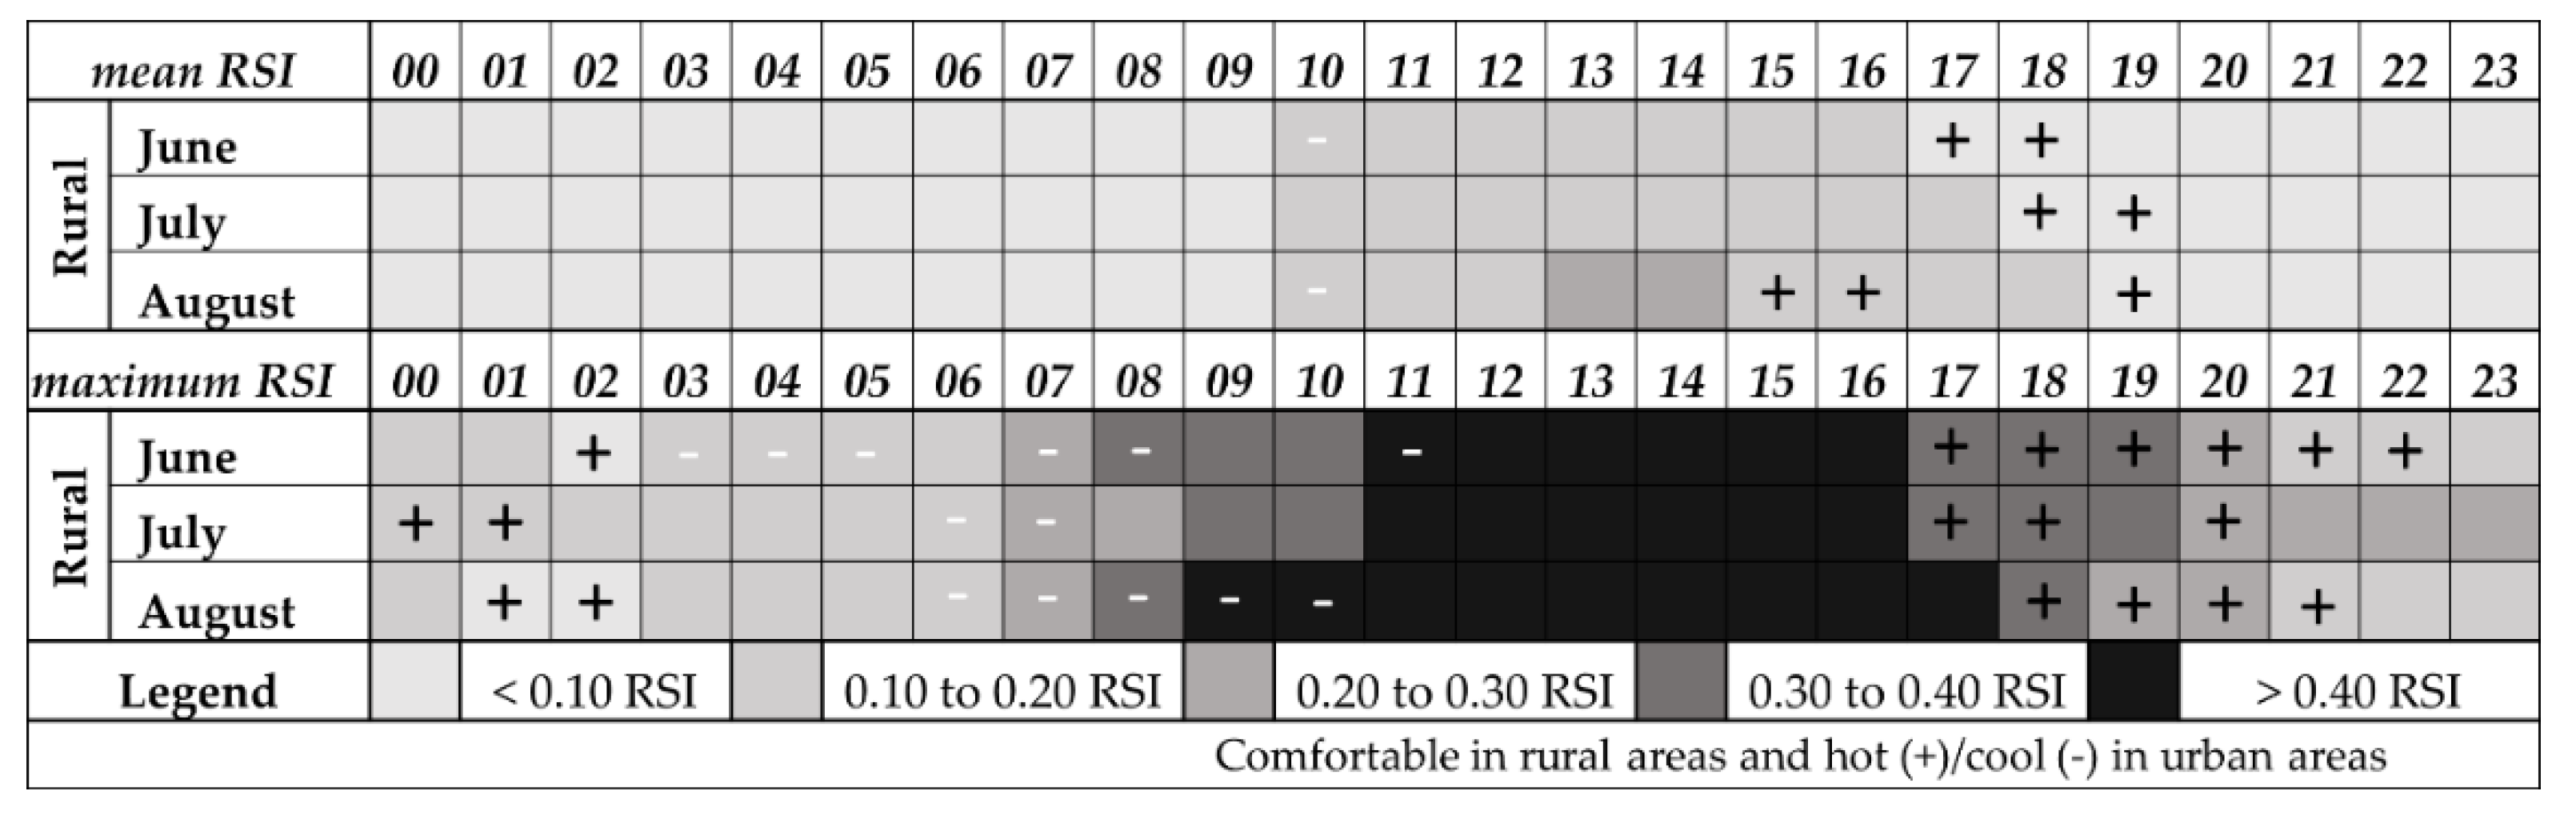
Figure 9.
Hourly RSI mean and maximum values during summer (June–August) in rural areas of Iași city and the difference imposed by the urban areas (+/− represents one class higher/lower in urban areas).
Figure 9.
Hourly RSI mean and maximum values during summer (June–August) in rural areas of Iași city and the difference imposed by the urban areas (+/− represents one class higher/lower in urban areas).

Figure 10.
Summer RSI quartiles series at 0100 LT, 0400 LT, 0700 LT, 1000 LT, 1300 LT, 1600 LT, 1900 LT and 2200 LT for urban and rural areas in Iași city.
Figure 10.
Summer RSI quartiles series at 0100 LT, 0400 LT, 0700 LT, 1000 LT, 1300 LT, 1600 LT, 1900 LT and 2200 LT for urban and rural areas in Iași city.


| THI Category | THI Values (°C) |
|---|---|
| Extremely cold | −19.9 to −10.0 |
| Very cold | −9.9 to −1.8 |
| Cold | −1.7 to 12.9 |
| Cool | 13.0 to 14.9 |
| Comfortable | 15.0 to 19.9 |
| Hot | 20.0 to 26.4 |
| Very Hot | 26.5 to 29.9 |
| Torrid | >30.0 |
Table 2.
The RSI (relative strain index) classification based on Kyle [44].
Table 2.
The RSI (relative strain index) classification based on Kyle [44].
| RSI Values after Kyle 1992 | Proportion of Persons Unstress/Distress (%) | Bioclimatic Comfort/Discomfort |
|---|---|---|
| 0 to 0.10 | 100 unstressed | Bioclimatic comfort |
| 0.10 to 0.20 | 75 unstressed | Bioclimatic discomfort for more sensitive persons 1 |
| 0.20 to 0.30 | 0 unstressed | Bioclimatic discomfort for more than 50% of the population |
| 0.30 to 0.40 | 75 distressed | Overheating risk for more than 50% of the population |
| 0.40 to 0.50 | 100 distressed | Heat-stroke risk for all population |
1 In the case of older and sick people, the RSI values equaling 0.20 represent the maximum limit of tolerance, above which heat stroke is evident.
Table 3.
Mean air temperature (T mean, °C), absolute maximum (T max, °C), absolute minimum (T min, °C) and differences (Diff, °C) between urban and rural areas at monthly and seasonal levels in Iași city (December 2012–November 2019). Tmax and Tmin extreme values are indicated with the corresponding OP, expressed as a number from Figure 1, where they have been recorded. Statistical significant differences for Tmean at p < 0.05 are indicated in bold italic.
| Winter | January | Spring | April | Summer | July | Autumn | October | Cold Season | Warm Season | Annual | ||
|---|---|---|---|---|---|---|---|---|---|---|---|---|
| T mean | Urban | 0.2 | −1.7 | 12.4 | 12.8 | 22.7 | 23 | 11.9 | 11.1 | 4.1 | 19.5 | 11.8 |
| Rural | −0.4 | −2.3 | 11.9 | 12.3 | 22.1 | 22.4 | 11.3 | 10.5 | 3.5 | 18.9 | 11.2 | |
| Diff | 0.6 | 0.6 | 0.5 | 0.5 | 0.6 | 0.6 | 0.6 | 0.6 | 0.6 | 0.6 | 0.6 | |
| T max | Urban | 20.7 | 12.8 | 33.5 | 32.8 | 39.9 | 39.4 | 38.9 | 29.7 | 29.7 | 39.9 | 39.9 |
| OPs | 3.0 | 3 | 3.0 | 2 | 3.0 | 3 | 3.0 | 3 | 3 | 3 | 3 | |
| Rural | 20.7 | 12.1 | 34.2 | 32.1 | 39.3 | 38.4 | 38.1 | 29.7 | 29.7 | 39.3 | 39.3 | |
| OPs | 7.0 | 6 | 6.0 | 6 | 6.0 | 6 | 3.0 | 6 | 6 | 6 | 6 | |
| Diff | 0.0 | 0.7 | −0.7 | 0.7 | 0.6 | 1 | 0.8 | 0 | 0 | 0.6 | 0.6 | |
| T min | Urban | −22.8 | −21.5 | −16.3 | −4.1 | 6.1 | 10.1 | −12.2 | −6.2 | −22.8 | −4.1 | −22.8 |
| OPs | 5.0 | 5 | 5.0 | 5 | 5.0 | 5 | 3.0 | 5 | 5 | 5 | 5 | |
| Rural | −22.8 | −22.8 | −19.3 | −4.2 | 6.3 | 9.2 | −12.3 | −5.2 | −22.8 | −4.2 | −22.8 | |
| OPs | 6.0 | 6 | 7.0 | 6 | 7.0 | 9 | 9.0 | 9 | 6 | 6 | 6 | |
| Diff | 0.0 | 1.3 | 3.0 | 0.2 | −0.2 | 0.9 | 0.1 | −1 | 0 | −0.1 | 0 |
Table 4.
Mean air relative humidity (RHmean, %), absolute maximum (RHmax, %), absolute minimum (RHmin, %) and differences (Diff, %) between urban and rural areas at monthly and seasonal levels in Iași city (December 2012–November 2019). RHmax and RHmin extreme values are indicated monthly with the corresponding OP (numbers from Figure 1) where they have been recorded. Statistical significant differences for RHmean at p < 0.05 are indicated in bold italic.
| Winter | January | Spring | April | Summer | July | Autumn | October | Cold Season | Warm Season | Annual | ||
|---|---|---|---|---|---|---|---|---|---|---|---|---|
| RHmean | Urban | 83.9 | 84.7 | 66.6 | 63.7 | 64.7 | 65.1 | 73.6 | 75.0 | 79.9 | 64.5 | 72.2 |
| Rural | 86.4 | 87.0 | 69.4 | 66.3 | 68.9 | 69.5 | 76.9 | 78.5 | 82.5 | 68.3 | 75.4 | |
| Diff | −2.6 | −2.3 | −2.8 | −2.6 | −4.2 | −4.4 | −3.3 | −3.5 | −2.7 | −3.8 | −3.2 | |
| RHmax | Urban | 98.9 | 98.9 | 97.2 | 96.6 | 97.1 | 97.1 | 98.5 | 98.1 | 98.9 | 97.1 | 98.9 |
| OPs | 2 | 2 | 2 | 2 | 5 | 5 | 2 | 5 | 2 | 5 | 2 | |
| Rural | 99.1 | 99 | 98.5 | 98.2 | 98.7 | 98 | 99 | 99 | 99.1 | 98.7 | 99.1 | |
| OPs | 6 | 6 | 6 | 6 | 6 | 7 | 6 | 6 | 6 | 6 | 6 | |
| Diff | −0.2 | −0.1 | −1.3 | −1.6 | −1.6 | −0.9 | −0.5 | −0.9 | −0.2 | −1.6 | −0.2 | |
| RHmin | Urban | 42.1 | 46.2 | 21.8 | 21.8 | 22 | 25.1 | 23.8 | 30.8 | 42.1 | 21.8 | 21.8 |
| OPs | 2 | 3 | 2 | 2 | 5 | 1 | 5 | 3 | 2 | 2 | 2 | |
| Rural | 38.9 | 42.1 | 19.6 | 19.6 | 20.1 | 25.3 | 22.1 | 26.3 | 38.9 | 19.6 | 19.6 | |
| OPs | 9 | 9 | 9 | 9 | 9 | 9 | 9 | 9 | 9 | 9 | 9 | |
| Diff | 3.2 | 4.1 | 2.2 | 2.2 | 1.9 | -0.2 | 1.7 | 4.5 | 3.2 | 2.2 | 2.2 |
Publisher’s Note: MDPI stays neutral with regard to jurisdictional claims in published maps and institutional affiliations. |
© 2020 by the authors. Licensee MDPI, Basel, Switzerland. This article is an open access article distributed under the terms and conditions of the Creative Commons Attribution (CC BY) license (http://creativecommons.org/licenses/by/4.0/).
Share and Cite
MDPI and ACS Style
Ichim, P.; Sfîcă, L. The Influence of Urban Climate on Bioclimatic Conditions in the City of Iași, Romania. Sustainability 2020, 12, 9652. https://0-doi-org.brum.beds.ac.uk/10.3390/su12229652
AMA Style
Ichim P, Sfîcă L. The Influence of Urban Climate on Bioclimatic Conditions in the City of Iași, Romania. Sustainability. 2020; 12(22):9652. https://0-doi-org.brum.beds.ac.uk/10.3390/su12229652
Chicago/Turabian StyleIchim, Pavel, and Lucian Sfîcă. 2020. "The Influence of Urban Climate on Bioclimatic Conditions in the City of Iași, Romania" Sustainability 12, no. 22: 9652. https://0-doi-org.brum.beds.ac.uk/10.3390/su12229652
Note that from the first issue of 2016, this journal uses article numbers instead of page numbers. See further details here.