Assessing Collaborative Capabilities for Sustainability in Interorganizational Networks


Production and Systems Engineering Postgraduate Program, Federal University of Paraíba, João Pessoa 58051-900, Brazil
*
Author to whom correspondence should be addressed.
Sustainability 2020, 12(22), 9763; https://0-doi-org.brum.beds.ac.uk/10.3390/su12229763
Submission received: 10 October 2020
/
Revised: 29 October 2020
/
Accepted: 6 November 2020
/
Published: 23 November 2020
(This article belongs to the Section Economic and Business Aspects of Sustainability)
Abstract
:Sustainability in interorganizational networks depends on developing collaborative capabilities for this purpose. However, to improve their collaborative capabilities for sustainability (CCS), companies in interorganizational networks need methods to assess them. The existing CCS assessment approaches in the literature do not indicate what capabilities should be improved in an individual company to support collaborative strategies. Addressing this gap, the main contribution of this paper is providing a framework to assess CCS in interorganizational networks, providing support for improving firm-level capabilities. To attain this aim, the framework was based on the graph-theoretic approach (GTA), a multi-attribute technique that captures the interrelationships between elements of a system, providing multi-level and overall assessment. We tested the framework in three hotels from a tourism cluster in Brazil, where sustainability has been an unsettling issue. By applying the assessment framework, it was possible to generate a CCS index for each company and, thereby, to compare the results. Findings from the field confirmed the benefits of using the framework and its utility in assessing CCS and setting priorities for improvement.
1. Introduction
Due to stakeholder pressure to become more sustainable, firms have been striving to develop capabilities for it [1]. A capability is the organization’s ability to perform a given task or activity [2], a concept derived from the traditional theory of the resource-based view of the firm [3]. Resources and routines are the “bricks and mortar” to build a capability. However, according to the classical resource-based theory, these resources are internal to the company, ignoring the interaction between an organization and its natural environment [4].
Addressing the gap left by the resource-based theory, Hart [5] proposed the natural-resource-based view of the firm (NRBV), which includes sustainability issues to achieve a competitive advantage. From this perspective, a company might focus on developing capabilities related to pollution prevention, product stewardship, clean technology, and the base of the pyramid [4]. Since the NRBV emerged, the literature has emphasized the need for developing capabilities for sustainability [1,6,7,8]. According to Wu et al. [8], this type of capability addresses the sustainability expectations of stakeholders to simultaneously pursue economic, environmental, and social competence.
Building capabilities for sustainability implies considering the whole system beyond the organizational boundaries. To achieve corporate sustainability, collaboration with stakeholders and other companies is crucial [9,10], and it is the basis of what has been called industrial symbiosis [11,12,13]. Thus, corporate sustainability requires the development and improvement of collaborative capabilities, particularly for companies in interorganizational networks [14,15]. Nevertheless, as any improvement requires performance measurement, companies in interorganizational networks need methods to assess their collaborative capabilities.
Assessing collaborative capabilities may be a challenging task, since a capability is an intangible and multidimensional concept. Although hard to find, the literature presents assessment approaches in this regard, such as Faustino et al. [16] and Rosas and Camarinha-Matos [17]. However, when it comes to assessing collaborative capabilities for sustainability (CCS), the literature is scarce [18]. Although few initiatives can be found for the CCS assessment [15,19,20], the existing approaches are not usually improvement-oriented, so they do not indicate which capabilities should be improved. Additionally, they are more focused on the relationship than on those aspects to support a successful collaboration, i.e., the collaboration capabilities at the firm level. Firm-level collaborative capabilities are responsible for supporting collaboration at the network level [18].
Thus, seeking to cover a literature gap on this topic, this paper proposes a framework to assess CCS in interorganizational networks, providing support for improving firm-level capabilities. Considering the need already identified by the authors in a systematic literature review [18], the proposed framework was designed to answer the following research question:
RQ: How do we assess firm-level collaborative capabilities for sustainability in the context of interorganizational networks?
The assessment framework adopts the assumption argued by Faustino et al. [16] that the different dimensions of a collaborative capability are interdependent, so it uses the graph-theoretic approach (GTA) as the appropriate technique to carry out the assessment. GTA is a multi-attribute approach to assessing the elements of a system and their interrelationships by using digraphs and matrices to provide a synthetic score for the entire system [21]. Another relevant characteristic of GTA for this research is that it enables the hierarchical analysis of the system [22]. Therefore, the attributes of CCS can be deployed in sub-attributes, promoting the assessment at different levels of detail and globally.
To test the applicability of the proposed framework, we assessed the CCS of three hotels from a tourism cluster in Northeastern Brazil. An industry cluster is a specific type of interorganizational network consisting of a group of geographically close companies operating in the same business sector, which may collaborate and, eventually, increase the overall competitiveness of the region [23]. Due to the need to develop collaborative capabilities in such an environment and considering that sustainability is a relevant issue for the hotel business [24], the choice of these case companies fitted appropriately with the aim of this research.
Following this introduction (Section 1), the theoretical background of this paper is presented (Section 2), followed by the research methodology design (Section 3). Then, we describe the research results from field research (Section 4), and in the fifth section, we discuss the characteristics and applicability of the proposed framework. The final section concludes the article by providing some implications, limitations, and future research opportunities (Section 6).
2. Theoretical Background
The traditional theory of the resource-based view (RBV) considers that companies need to possess or control strategic resources and capabilities that are valuable, rare, and hard to imitate, and the organization should have processes to exploit them [25]. However, the RBV is internally focused, limiting the source of competitive advantage to internal resources. Addressing this point, some authors have argued that companies must also explore external resources to remain competitive, and an alternative for it is leveraging resources from other players in the industry [23,26,27]. As a result, researchers have developed alternative theories to complement the RBV [28,29].
Including the critical resources derived from interorganizational relationships, Dyer and Singh [28] proposed the relational view (RV) as an extension of the RBV. They argue that business partners are willing to combine their resources, because these relationships may generate benefits called relational rents. As stated by Dyer and Singh [28] and corroborated by Helfat et al. [2], there are four sources of relational rents: investment in relation-specific assets, substantial knowledge exchange, the combination of complementary resources or capabilities, and lower transaction costs than competing partnerships due to governance mechanisms.
According to Czakon [30], there are some specific capabilities to generate each type of relational rent. Relation-specific asset investment requires developing the capability of resource allocation. Interfirm knowledge exchange requires knowledge management, openness to partners, and collaborative culture. To coordinate the complementarity of resources, firms need to develop the capability of value chain management. Finally, transaction cost minimization depends on the capability of network governance design and adaptation [30]. These capabilities will allow companies to access the resources and capabilities of their partners, expanding the opportunities for generating relational rents [2].
Just as the RV extends the RBV with collaborative capabilities, the NRBV also adds a different perspective, since it inserts the natural environment into the traditional RBV [5]. Collaborative capabilities are crucial when sustainability is at the core of the business strategy [1,9,14]. It suggests the integration between RV and NRBV to build collaborative capabilities for sustainability (CCS).
CCS have an essential role in interorganizational networks, especially in the particular situation of industrial symbiosis. Industrial symbiosis occurs when geographically close companies collaborate to create a competitive advantage by exchanging and sharing natural resources [11,13,31]. According to Chertow [11] (p. 314), “the keys to industrial symbiosis are collaboration and the synergistic possibilities offered by geographic proximity”. Collaboration and geographic proximity are inherent to industry clusters, so this type of interorganizational network is a fertile environment for industrial symbiosis projects [32,33]. Nonetheless, individual companies are not supposed to be spontaneously collaborative, even if they are part of industry clusters. As argued by Abreu and Ceglia [34] and Zhu and Ruth [35], industrial symbiosis requires the development of capabilities for it, notably CCS.
However, what constitutes the CCS? Based on the RV and the NRBV, we conduct a literature review to determine the variables of this research, considering the context of interorganizational networks. After a thorough analysis, we selected five attributes that correspond to CCS at a higher level of detail, as shown in Table 1. According to our study, each attribute comprises sub-attributes at a lower level of detail, making the CCS assessment more comprehensive.
The CCS attributes in Table 1 define what is required from companies to carry on sustainable strategies with partners in interorganizational networks. For instance, the collaborative capability of resource allocation requires joint coordination to apply assets on efforts for sustainability. Individually, a single company may not have enough resources to invest or may not willing to take risks. Thus, collaboration could make feasible the investment in clean technologies and sustainable innovation, which are essential initiatives for sustainability [36,39,42].
Interorganizational knowledge management is another critical capability for sustainability. In collaborative relationships, companies must develop the ability to learn with partners (absorptive capability) and share knowledge to achieve mutual benefits [44,45]. On the other hand, the potential to access external knowledge sources may stimulate the collaboration itself [38].
A relevant antecedent for collaboration is the propensity to build new partnerships. Seeing other firms as partners, instead of rivals, is a paradigm shift for some companies. Besides the cultural change for it, it is necessary to develop the capability to identify partners aligned with the same goals towards sustainability [46,51].
Collaborative relationships require thorough coordination of the value chain for managing together sustainable operations. Value chain management is a significant challenge when companies are in the joint development of a new product. Green development demands the adoption of a life-cycle perspective, which involves the whole supply chain [38,42].
The longevity of the relationships in interorganizational networks provides trust and mitigate risks in new initiatives for sustainability. Nonetheless, the relationship time is not enough, since it must generate relational rents to be relevant. Thus, it is necessary to coordinate the network structure to obtain mutual benefits and achieve sustainability goals [37,54].
To improve CCS, companies need to assess them to identify improvement opportunities and priorities. According to Cloutier et al. [53], assessment practices represent essential collaborative mechanisms for implementing sustainability-oriented innovations. However, frameworks and tools to assess CCS are scarce in the literature. Choi and Hwang [19] and Van Hoof and Thiell [15], for instance, assessed CCS in supply chains, but they did not provide a method applied to an individual firm to monitor and, consequently, improve collaborative capabilities. On the other hand, Rota et al. [20] provided a useful method for assessing the degree of collaboration between companies in a supply chain, but it does not measure firm-level capabilities.
When the focus is not on sustainability, there is a substantial number of studies assessing collaboration in interorganizational networks (e.g., [16,17,59,60,61]). However, most of them measure the degree of collaboration within the network instead of the capabilities that a single company has to collaborate with other partners of its network (e.g., [59,60]). Although it is important to monitor the collaboration intensity, individual firms need to improve their capabilities beforehand to increase collaboration within the network. Thus, the assessment of firm-level capabilities is the first step to improve them. That is the intent of our research on CCS.
Regarding the assessment of firm-level collaborative capabilities, we found the papers of Faustino, Gohr, and Santos [16], and Rosas and Camarinha-Matos [17], which use quantitative models to do it. While Faustino, Gohr, and Santos [16] applied the graph-theoretic approach (GTA), Rosas and Camarinha-Matos [17] used Bayesian belief network modeling. Both techniques consider the relationships between elements of a system, which is a premise of our research. Notwithstanding, although other techniques address these relationships, GTA can assess the system at different levels of detail and globally, enabling partial scores and constituting an index to represent the overall evaluation. That is the main reason for choosing GTA to build our framework.
3. Methodology
This study was conducted in two phases: the design of a GTA-based framework and its application for empirical testing purposes. The procedures of both phases are depicted below.
3.1. Framework Design
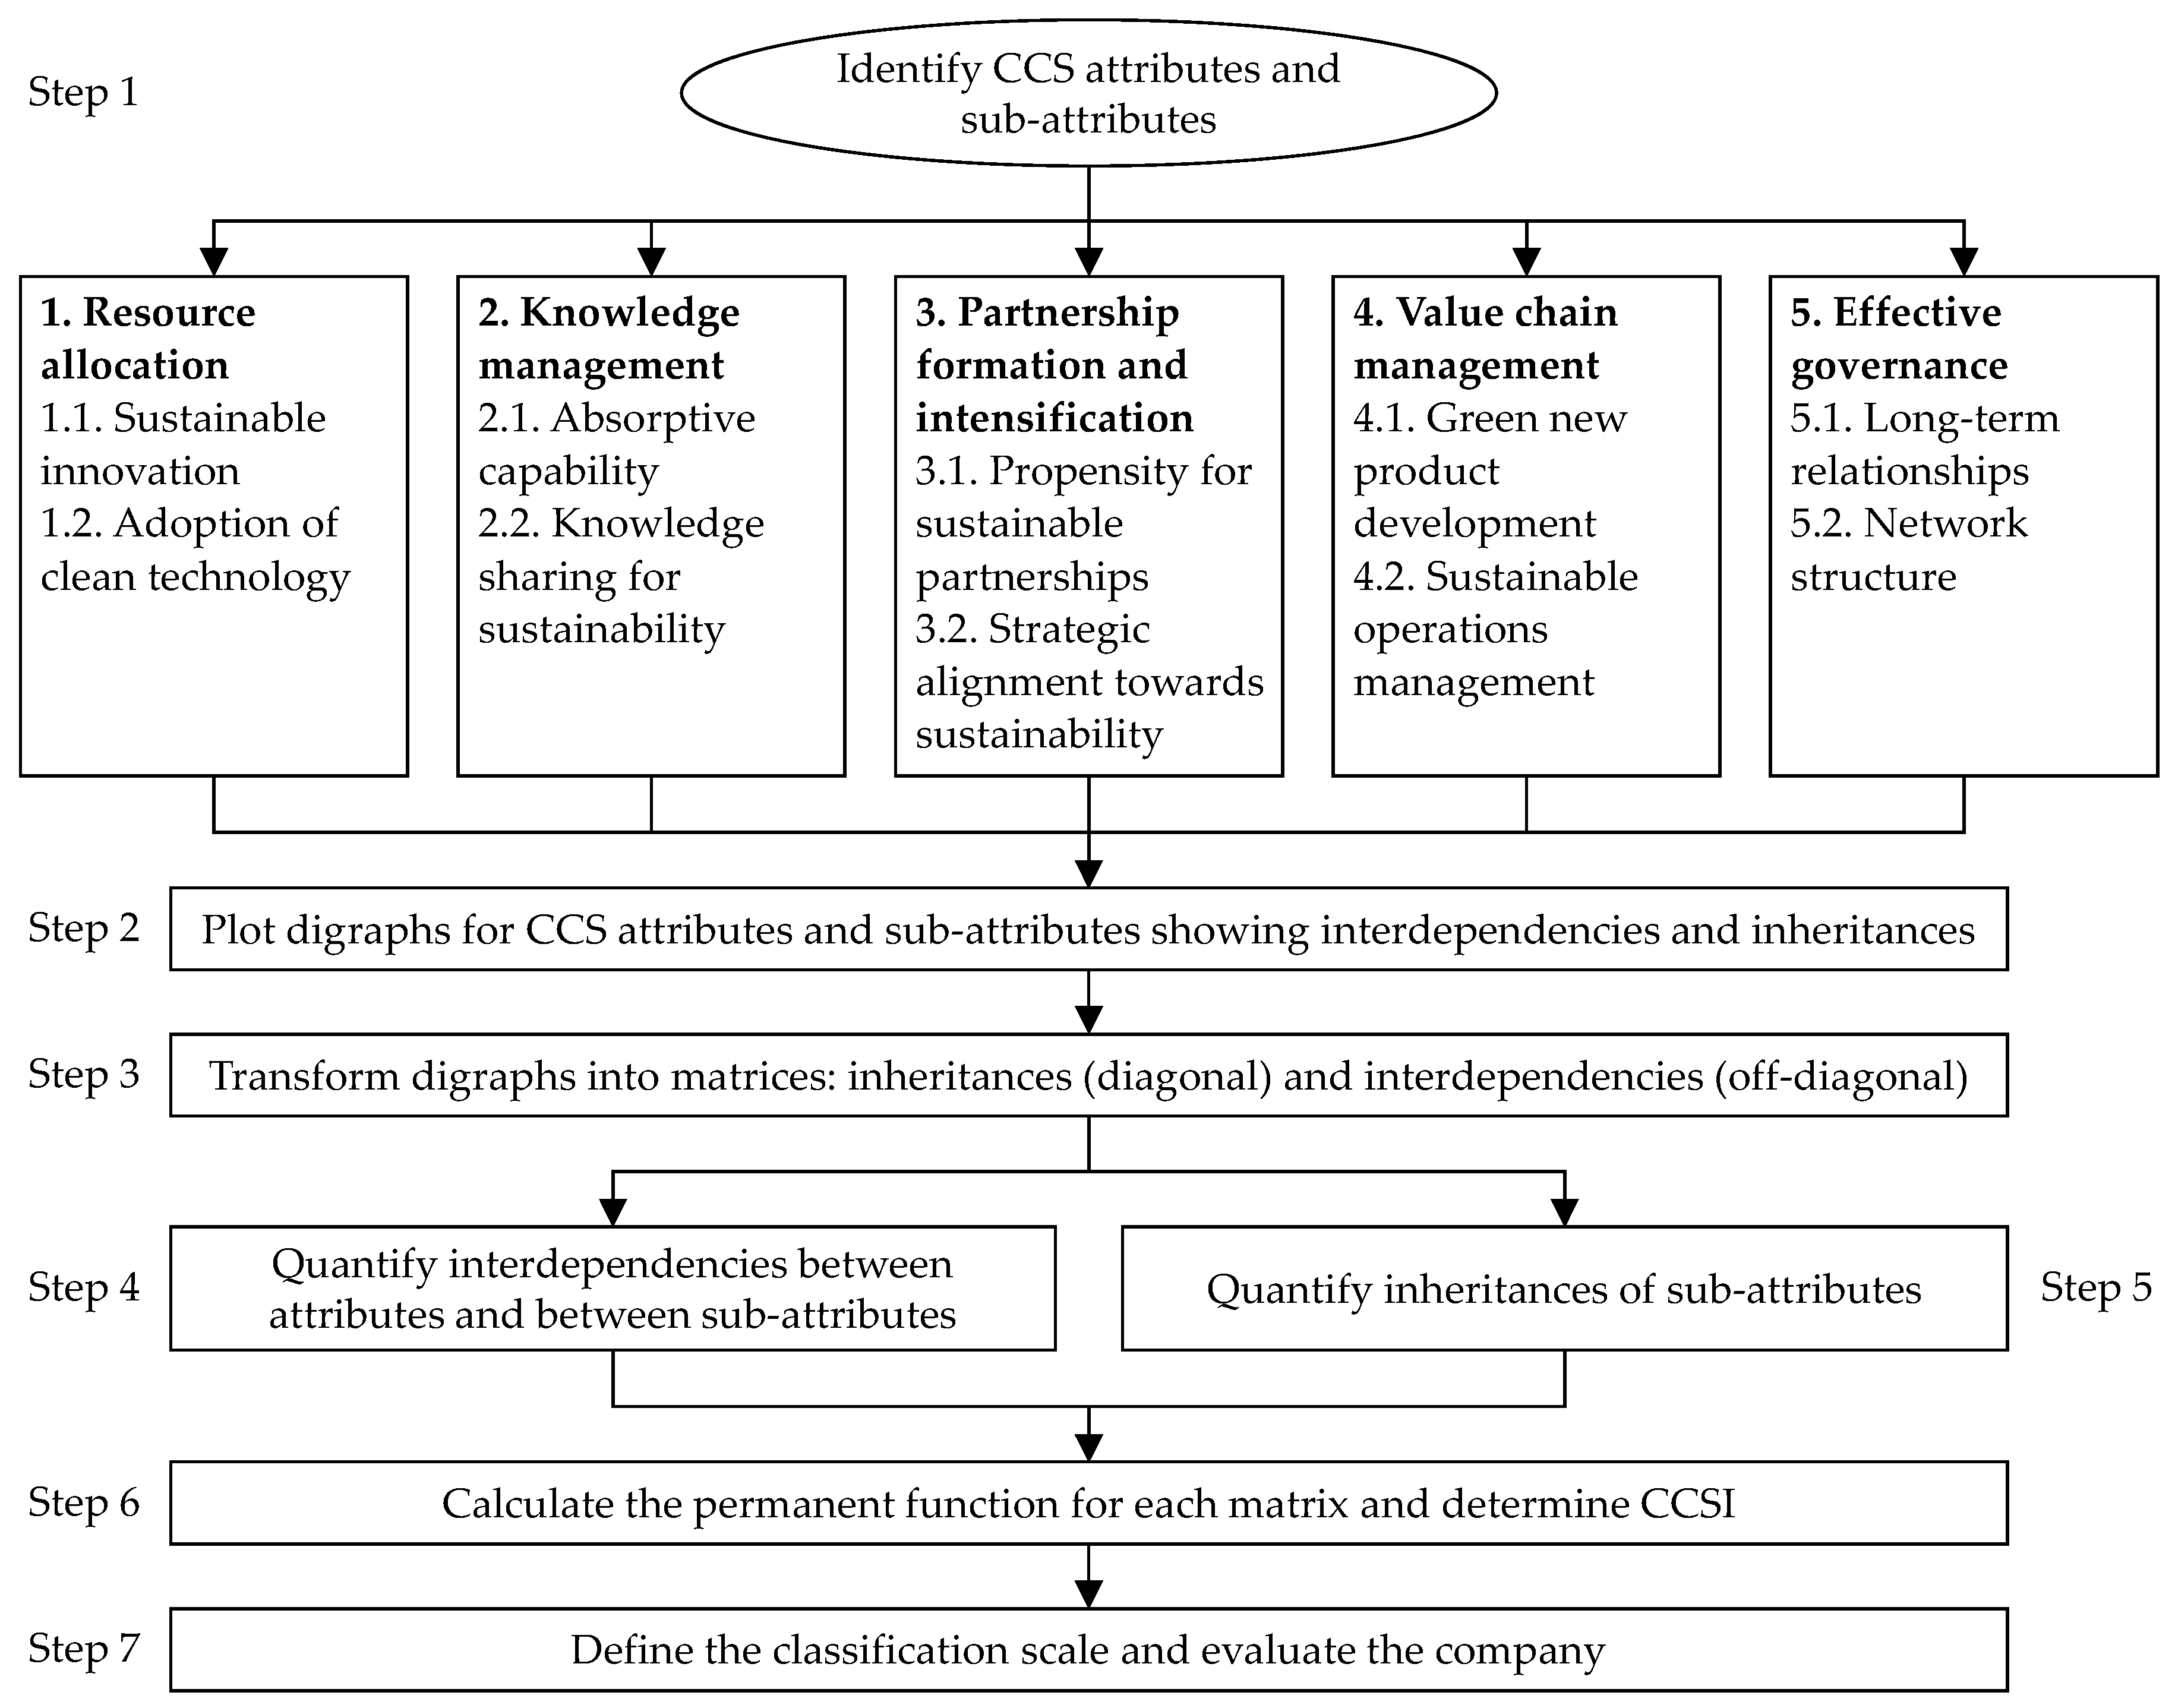
The main outcome of the proposed framework is the Collaborative Capabilities for Sustainability Index (CCSI), which determines the level of collaborative capabilities a company has achieved when it comes to sustainability. To obtain the CCSI, the framework is divided into seven steps (Figure 1), considering the attributes and sub-attributes we selected from the literature and following the methodological steps of GTA [22].
The seven steps in Figure 1 are the traditional steps in a GTA-based assessment process [22]. In the following sections, we thoroughly describe each step.
3.1.1. Step 1—Identification of CCS Attributes and Sub-Attributes
The first step is determined by the system composition, which has particular variables crucial to carrying out the next steps. In our study, the system to be assessed corresponds to the abstract system of CCS. This system is composed of variables (or sub-systems) we called CCS attributes made up of smaller parts called CCS sub-attributes.
For this research, we opted to identify the CCS attributes and sub-attributes in the framework by extracting them from the related literature detailed in our previous study [18] and summarized in Table 1. Therefore, the attributes already depicted in Table 1 are the ones used in the assessment framework. Alternatively, managers who want to apply this framework may define specific attributes more closely related to their operations.
3.1.2. Steps 2 and 3—Digraphs and Matrix Representation
Digraphs are the fundamental tools of GTA. They represent the system to be assessed, in which nodes stand for the composing elements (inheritances) and arrows stand for the relationships between elements (interdependencies). The representation of interdependencies assumes that the elements of a system influence or are dependent on each other. Another property of GTA is the decomposition of the system elements in sub-elements. Thus, modeling with GTA is multi-level and hierarchical.
In our framework, we drew the digraphs in two levels of detail, first for the attributes, and second, for the derived sub-attributes. The attributes correspond to the nodes at the first level, whereas the sub-attributes correspond to the second level nodes. Two opposite arrows connect each pair of nodes, representing the potential mutual influences between attributes or sub-attributes.
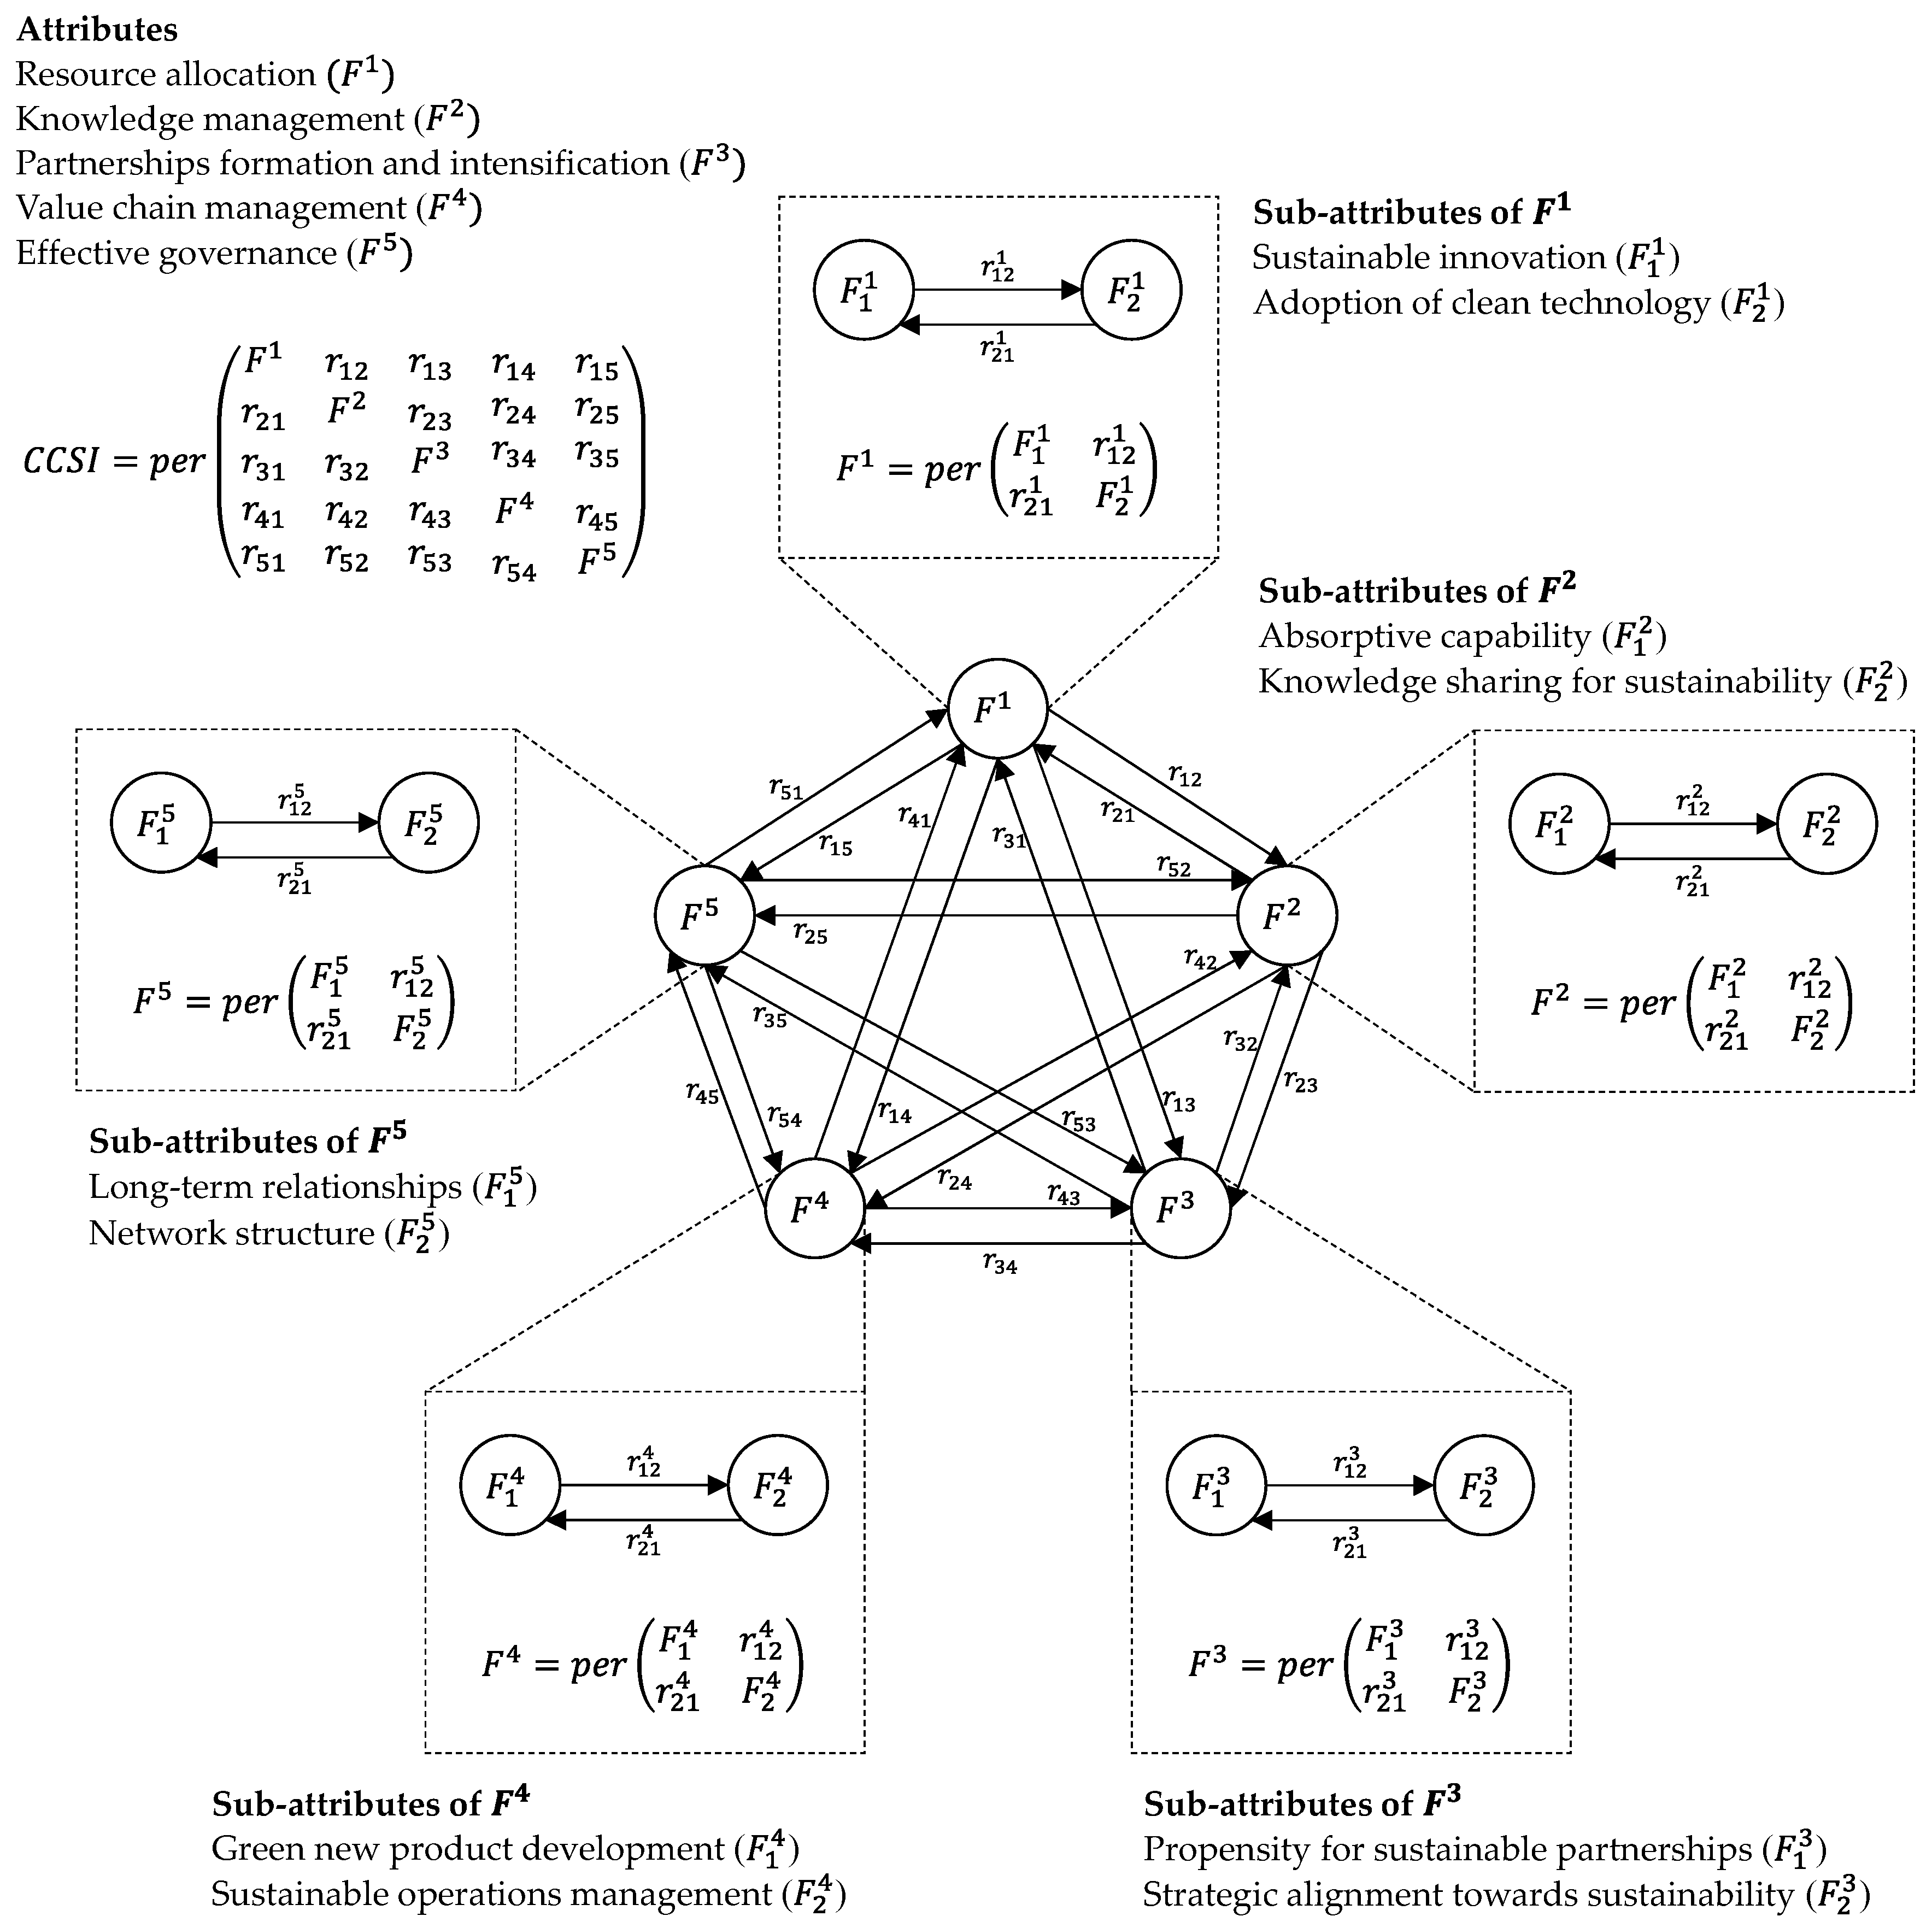
Figure 2 presents the CCS system modeling. As shown in this figure, CCS are represented in the first level by the main digraph composed of the attributes F1, F2, F3, F4, and F5 and their potential interdependencies. Each attribute is composed of the sub-attributes displayed in Figure 2. The decomposition logic of GTA requires a bottom-up approach of assessment, in which the lower levels provide information to the upper levels.
In graph theory, every digraph has a corresponding matrix representation, making it suitable for applying mathematical methods [62]. Therefore, as exhibited in Figure 2, digraphs become square matrices, where nodes fill the diagonal and arrows fill the remaining off-diagonal positions. The values in matrices enable calculating the permanent function, described as follows.
3.1.3. Steps 4, 5, and 6—Quantification and Permanent Function
The diagonal values of the matrices correspond to the performance levels achieved in each CCS attribute (or sub-attribute). In contrast, the off-diagonal values correspond to the levels of influence between pairs of CCS attributes (or sub-attributes). These values are always nonnegative, but they can be zero in cases of nonexistence or no influence.
In the GTA procedure, the quantification starts by measuring the performance of the elements at the lower level, i.e., the sub-attributes and their interdependencies in our proposed framework. In a given scale, framework users or any other appropriate source of information might quantify these elements. For this framework, we proposed the scales presented in Table 2 and Table 3, already used in other GTA-based models (e.g., [16,59]).
After the quantification of the lower level matrices, the permanent function can be calculated for each matrix. The general equation for the permanent function of an N × N nonnegative matrix A = (a (i, j)) is defined as [63]:
where the sum is over all permutations σ of {1, 2, …, n}.
The procedure to obtain the permanent function is similar to the one to calculate the determinant, but with the difference that all signs of the permutations are taken as positive [64]. This property of the permanent function assures that no information about the system is lost [22].
The value of an attribute is given by the permanent of the matrix composed of its sub-attributes. For example, the sub-attributes , and their interdependencies will provide the value of the attribute F1 (Figure 2). Similarly, the permanent of the matrix composed of the attributes F1, F2, F3, F4, and F5 and their interdependencies will provide the value of the entire system, i.e., the CCSI. However, it is noteworthy that the interdependencies in the matrix of attributes should be assessed with the scale in Table 2, since they cannot be obtained from the lower level matrices.
3.1.4. Step 7—Classification Scale
The last step of the assessment framework is dedicated to classifying the company according to the achieved level of CCS. However, it is necessary first to build a scale for that. Thus, we replaced the diagonal values of the sub-attributes matrices with the best- and worst-case situations to determine the highest and the lowest possible value for the CCSI and each attribute. In consonance with the scale in Table 3, a zero-diagonal matrix will generate the lowest permanent possible, while a nine-diagonal matrix will provide the highest permanent. Alongside setting upper and lower bounds, we selected intermediate thresholds to set out different levels of CCS. Therefore, diagonals were replaced by values 0, 3, 6, and 9, which delimited three levels: low, moderate, and high.
As the permanent function usually generates very large numbers, we adopted a logarithmic scale to express the results. It may provide better interpretation when comparing the performance of companies.
3.2. Empirical Research
As mentioned in the introduction section of this paper, we studied three hotels to test the applicability of the CCS assessment framework, hereafter referred to as Company A, Company B, and Company C. These hotels are part of a tourism cluster in Northeastern Brazil, in a city where tourism is a crucial economic activity. We chose those companies because they fulfilled two selection criteria for this research. First, they are part of an interorganizational network. Second, sustainability is a vital goal for them, and to achieve this aim, they need to collaborate with partners.
Data collection used two primary sources: hotel managers and outside experts. Experts assessed interdependencies between elements (attributes and sub-attributes), whereas managers assisted in assessing the current performance of their companies regarding CCS.
To quantify interdependencies, we opted to conduct a Delphi study by sending questionnaires to experts. The essential requirement for selecting experts was that they should be active Ph.D. researchers focused on interorganizational networks, sustainability, and collaborative capabilities. Under this requirement, we selected 35 experts and sent an e-mail to invite all of them. Then, 29 experts accepted taking part in the study, and we sent them a questionnaire. In that questionnaire, experts assessed relationships by assigning the level of influence between pairs of attributes or sub-attributes according to the scale in Table 2.
Over almost three months, three rounds of Delphi were needed to obtain an acceptable convergence in the responses. As usual in Delphi studies, the number of respondents decreased after each round. In the first round, we obtained responses from ten experts. Since the resulting convergence rate was 51% (i.e., experts agreed in 51% of the questions), we started the second round. In the second round, experts were invited to rethink those questions in disagreement and change the answer if they wanted. Nine experts answered the second round, reaching 70% of convergence. As we defined 80% as our goal, we started the third round, answered by six experts. The third round reached 87% of convergence, so we stopped collecting data from experts. In the end, we counted on the six remaining experts, from whom the values of interdependencies were extracted by taking the average of assessments.
The reasons for assessing interdependencies by collecting expert opinions instead of interviewing the hotel managers were twofold. First, it avoided biased assessments, since a superior performance in some sub-attribute (or attribute) may induce an overrated evaluation of its influence on other sub-attributes. As interdependencies are not context-dependent when it comes to CCS, expert opinions were appropriate for our purpose. The second reason for using expert opinions is that it contributed to obtaining a more comprehensive framework, ready to be applied in other companies and permitting comparisons. Hence, with interdependencies previously quantified, it would just be necessary to assess inheritances.
For field research, four managers were interviewed: one from Company A, two from Company B (in the same interview), and another from Company C. The companies in our sample were small-sized, having few decision-makers regarding CCS, and thereby few people qualified to be interviewed. Indeed, those four interviewees represented the only sources able to give us the information that we were seeking.
Interviews aimed primarily to quantify sub-attributes for each company. Nevertheless, since the evaluation of CCS depends on human judgments, one of us acted as a facilitator of the assessment process and not just as an interviewer. Accordingly, semi-structured interviews were conducted, in which the managers were encouraged to talk about their company, the commitment to sustainability, and the sub-attributes to be assessed. These data were recorded and transcribed to capture other relevant qualitative aspects, thereby enabling data triangulation.
Before scoring the sub-attributes, the facilitator explained the concepts under each one of them, providing support for a more realistic assessment. The previous discussion about each sub-attribute made managers more confident to assess them (according to Table 3). In addition, the qualitative data from interviews justified the performance achieved in the sub-attributes.
4. Results
Following the Delphi study, the level of influence between pairs of attributes and sub-attributes was set, as shown in Table 4 (using the scale displayed in Table 2). Resulting from the interviews, Table 5 shows the performance values of the sub-attributes in Company A, Company B, and Company C (using the scale in Table 3). As demonstrated in Figure 2, interdependencies (off-diagonal) and inheritances (diagonal) formed the matrices that compose the CCS attributes. These matrices enabled the calculation of the permanent function and, thereby, the values of the CCS attributes (Table 6).
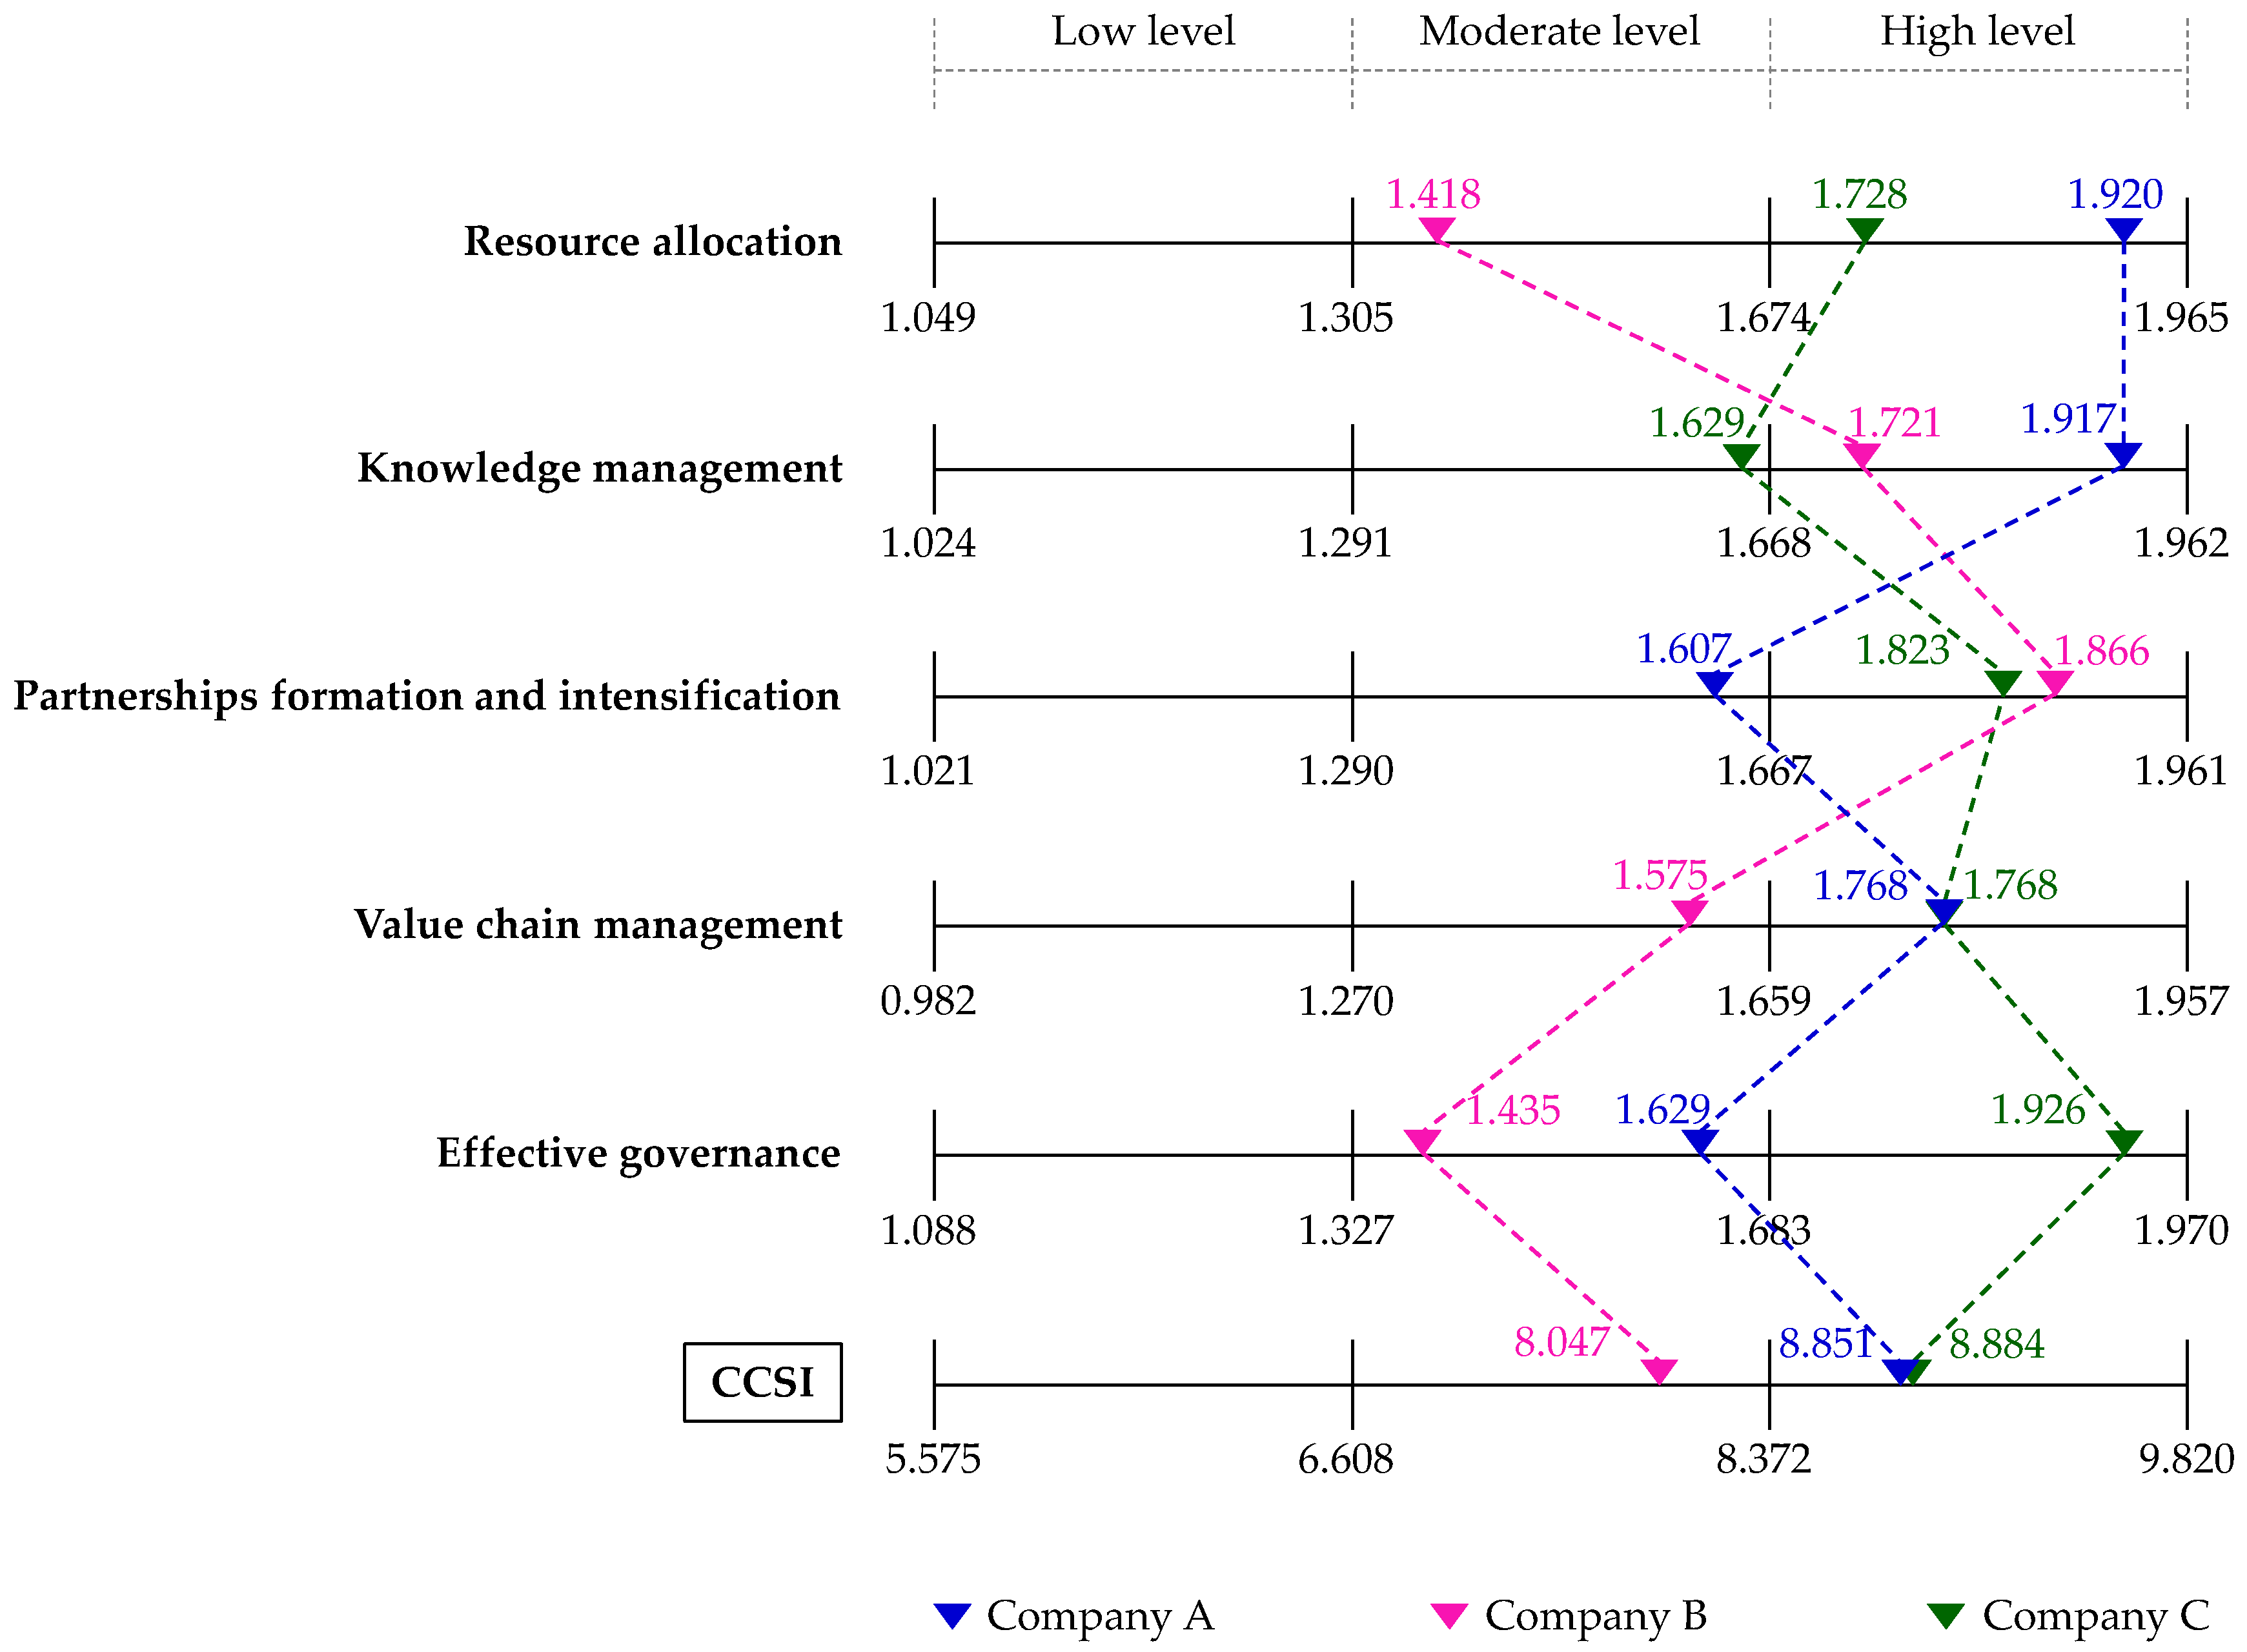
After calculating the values of the CCS attributes, we could determine the CCSI for each hotel, as shown in Table 7. Then, we transformed all permanents to logarithmic values in order to position them on the classification scale in Figure 3.
According to the classification scale, Company C has the highest CCS performance among the three hotels. As the oldest company, compared to Company A and Company B, Company C has the benefit of building long-term relationships, some of them with the potential to support sustainable initiatives. Company C is an active member of the tourism cluster, and because of it, it takes many advantages from the network structure. As a result, it has achieved a very high level of network governance, a critical determinant of its CCS performance.
Company A stands out from the others in the adoption of clean technologies, one of the key capabilities of the NRBV pointed out by Hart and Dowell [4]. The hotel has invested in substituting old equipment and processes for cleaner ones, such as the adoption of a new water heating system. Company A is wide open to sustainable innovations, and it has a clear strategy for sustainability. Nevertheless, the interviewee complained that it has been hard to find partners aligned with this purpose.
Company B got the lowest CCSI among the three hotels, reaching just a moderate CCS level. Although this hotel has an excellent performance in partnership formation, joint initiatives for sustainability are still scarce within the company. However, the existing partnerships and the objective to improve sustainability reveal a feasible potential for sustainable projects with partners.
Even though the studied hotels have taken some initiatives towards sustainability, data from interviews showed us that all of them need to improve their CCS. As expressed in Figure 3, none of the companies reached a high level in all CCS attributes. Despite the propensity for it, many of the sustainable initiatives observed within those companies came from individual effort instead of collaboration. Thus, our findings suggest that those companies have underestimated the opportunity to generate relational rents that eventually result in superior sustainable performance.
5. Discussion
After the application of the CCS assessment framework, we confirmed its contribution to assessing firm-level capabilities. Unlike Choi and Hwang [19] and Van Hoof and Thiell [15], who measured CCS as a construct, the proposed framework provides information for managerial insight. Differently from Rota et al. [20], who measured the degree of CCS between companies, our framework focuses on what can be done within the boundaries of an individual company, eventually leveraging inter-firm collaboration.
Knowing what collaborative capabilities are needed towards corporate sustainability is essential for managers, but not enough. Thus, the proposed framework helps managers in identifying what level has been achieved, indicating what and how much has to be improved. Moreover, including the framework in the company’s performance measurement routine promotes awareness about developing collaborative capabilities to get better results from collaborative projects within its interorganizational network.
The CCS assessment framework proved its feasibility, since we observed during the application that it fits completely with the case companies. For the interviewees, the CCS attributes and sub-attributes corresponded to the capabilities that they consider critical to improving the collaboration with partners to achieve sustainability goals. From the CCS assessment, managers could determine which capabilities they should prioritize for further improvement.
According to Platts [63], when studying a process approach for formulating manufacturing strategy, simply accomplishing the defined steps is enough to demonstrate the feasibility of a proposed approach. Analogously, this logic could be applied to our framework when it comes to feasibility. However, as mentioned by the authors [63], this demonstration is restricted to the particular company in which the framework was applied. Therefore, we can only affirm that the framework is feasible but not generalizable.
Nonetheless, we realized that the framework could be tested in other industries, because it is flexible enough to adapt the attributes to different contexts. On the other hand, the previously defined interdependencies enable the general application, since the attributes came from the current literature, and expert opinions avoided biased assessments.
The information provided by the assessment framework proved its utility when it pointed out the priorities for improvement in the CCS. Moreover, as demonstrated in Figure 3, it is possible to use the framework to benchmark the CCS performance among different companies. The CCS index may help in determining the best practices within an interorganizational network. Hence, it enables knowledge transfer within the network, since companies start to have references to follow.
From the data collection point of view, the proposed framework can be considered user-friendly. The hierarchical logic is easy to understand, and graphs contribute to give visibility to the model. Notwithstanding, to calculate the permanent function may not be an easy task for business practitioners. To aid this task, there are some free software applications available on the internet. For this research, we used Maxima (http://maxima.sourceforge.net), an open-source software system that made the calculation more accessible and might encourage managers to use the framework. Another alternative to improve usability is the development of a user-friendly software tool so that the assessment framework would become a simple checklist for potential users, with automatic data processing and prompt results.
The use of GTA to underpin the proposed framework proved to be an excellent alternative to assess CCS. As capability is an intangible concept, its assessment is based on managers’ perceptions. Accordingly, the multi-attribute approach of GTA is the appropriate one to capture human judgments. GTA also enables a multi-level assessment so that it mitigates the intangibility of CCS by breaking them down into smaller parts. Additionally, the GTA-based assessment includes the relationships between elements, but unlike other techniques, evaluation is not given by comparison. GTA put interdependencies and inheritances together to provide a single value representing the whole system or partial scores representing sub-systems.
6. Conclusions
The debate on collaborative capabilities is still in its infancy, with a limited number of papers focused on analyzing the factors that constitute these capabilities. This paper added a new variable to this debate, including sustainability issues. Thus, we selected attributes and sub-attributes of CCS from the literature, considering the RV and the NRBV applied to the context of interorganizational networks. These variables formed the underpinnings of the assessment framework we proposed here.
An important question that emerges from the knowledge about CCS is how to improve them. It requires identifying improvement opportunities from the assessment of CCS at the firm level. Considering the literature gap on this issue, we developed a GTA-based framework to assess CCS for companies in interorganizational networks. It was tested by assessing three hotels from a tourism cluster in Brazil, given the relevance of CCS for those companies.
From the research perspective, this paper fulfilled a poorly explored area by providing a comprehensive description of CCS and a structured way to assess them. Our research assumes that the concept of CCS is complex and comprises interdependent elements, and the proposed framework contributed by incorporating this characteristic. Furthermore, field research approached the context of industry clusters, differing from most studies on CCS, which focus on supply chains. It raised some evidence that the CCS attributes may be the same as any configuration of interorganizational networks, although additional research on it would be advisable.
Among the managerial implications, we can highlight the CCS index as a practical performance measure to stimulate improvement initiatives. According to the CCS index position in the classification scale (Figure 3), managers may understand the company’s collaborative capabilities overall performance. If an improvement is needed (low and moderate levels), they can investigate which attributes and sub-attributes are critical, given the decomposition logic inherent to GTA. The information about the partial performance of the attributes and sub-attributes enables managers to set priorities, design the improvement path, and eventually improve the global CCS index.
Additionally, the adoption of the framework might promote awareness for collaboration towards sustainability. The assessment process boosts action and influences a cultural change, taking into account the benefits of cooperation instead of competition. The stimulus for this change could be formalized by incorporating the CCS index in the company’s performance measurement system, linking this measure with the other current measures, and also with strategic and operational goals.
Despite the contributions, this study has some limitations, and one of them relates to the choice of GTA. Although GTA fulfilled our purpose, it does not consider the relationships between sub-attributes belonging to different attributes, due to its hierarchical structure. Thus, further research could try other multi-attribute tools to assess CCS at the firm level. A potential path for future research might be the combination of different techniques so that one can complement another.
Another limitation comes from the reduced context of the framework testing. Even though the hospitality industry is a relevant context to study CCS, we recommend testing the framework in different industries and selecting larger samples. Additionally, it is noteworthy to consider that cultural differences among countries might influence the natural inclination to collaborate. Therefore, cross-country studies would be welcome to test the framework and redefine its variables under another perspective that takes into account the potential cultural differences.
Author Contributions
Conceptualization: C.F.G. and J.M.G.d.A.; methodology: J.M.G.d.A. and L.C.S.; validation: J.M.G.d.A. and C.F.G.; formal analysis: J.M.G.d.A. and C.F.G.; investigation: J.M.G.d.A.; data curation: J.M.G.d.A.; writing—original draft preparation: L.C.S., J.M.G.d.A., and C.F.G.; writing—review and editing: L.C.S.; supervision: C.F.G.; project administration: C.F.G.; funding acquisition: C.F.G. and L.C.S. All authors have read and agreed to the published version of the manuscript.
Funding
This research was funded by the Conselho Nacional de Desenvolvimento Científico e Tecnológico (CNPq)—Brazil, grant number 448893/2014-2.
Conflicts of Interest
The authors declare no conflict of interest. The funders had no role in the design of the study; in the collection, analyses, or interpretation of data; in the writing of the manuscript; or in the decision to publish the results.
References
- Bezerra, M.C.C.; Gohr, C.F.; Morioka, S.N. Organizational capabilities towards corporate sustainability benefits: A systematic literature review and an integrative framework proposal. J. Clean. Prod. 2020, 247, 119114. [Google Scholar] [CrossRef]
- Helfat, C.E.; Finkelstein, S.; Mitchell, W.; Peteraf, M.A.; Singh, H.; Teece, D.J.; Winter, S.G. Dynamic Capabilities: Understanding Strategic Changes in Organizations; Blackwell Publishing: Malden, MA, USA, 2007; ISBN 9781405159043. [Google Scholar]
- Wernerfelt, B. A resource-based view of the firm. Strateg. Manag. J. 1984, 5, 171–180. [Google Scholar] [CrossRef]
- Hart, S.L.; Dowell, G. A natural-resource-based view of the firm: Fifteen years after. J. Manag. 2011, 37, 1464–1479. [Google Scholar] [CrossRef]
- Hart, S.L. A natural-resource-based view of the firm. Acad. Manag. Rev. 1995, 20, 986–1014. [Google Scholar] [CrossRef] [Green Version]
- Cezarino, L.O.; Alves, M.F.R.; Caldana, A.C.F.; Liboni, L.B. Dynamic capabilities for sustainability: Revealing the systemic key factors. Syst. Pract. Action Res. 2019, 32, 93–112. [Google Scholar] [CrossRef]
- Mousavi, S.; Bossink, B.; Van Vliet, M. Dynamic capabilities and organizational routines for managing innovation towards sustainability. J. Clean. Prod. 2018, 203, 224–239. [Google Scholar] [CrossRef]
- Wu, Q.; He, Q.; Duan, Y. Explicating dynamic capabilities for corporate sustainability. EuroMed J. Bus. 2013, 8, 255–272. [Google Scholar] [CrossRef]
- Xiang, P.; Yuan, T. A collaboration-driven mode for improving sustainable cooperation in smart industrial parks. Resour. Conserv. Recycl. 2019, 141, 273–283. [Google Scholar] [CrossRef]
- Dragomir, C.C.; Foriş, D.; Mihail Ţîţu, A.; Foriş, T. The role of intermediaries in supporting collaboration for sustainability: A model of commissioning intervention in the multi-stakeholder collaboration for sustainable territorial development. Sustainability 2020, 12, 6769. [Google Scholar] [CrossRef]
- Chertow, M.R. Industrial symbiosis: Literature and taxonomy. Annu. Rev. Energy Environ. 2000, 25, 313–337. [Google Scholar] [CrossRef] [Green Version]
- Herczeg, G.; Akkerman, R.; Hauschild, M.Z. Supply chain collaboration in industrial symbiosis networks. J. Clean. Prod. 2018, 171, 1058–1067. [Google Scholar] [CrossRef]
- Schlüter, L.; Mortensen, L.; Kørnøv, L. Industrial symbiosis emergence and network development through reproduction. J. Clean. Prod. 2020, 252, 119631. [Google Scholar] [CrossRef]
- Luzzini, D.; Brandon-Jones, E.; Brandon-Jones, A.; Spina, G. From sustainability commitment to performance: The role of intra-and inter-firm collaborative capabilities in the upstream supply chain. Int. J. Prod. Econ. 2015, 165, 51–63. [Google Scholar] [CrossRef] [Green Version]
- Van Hoof, B.; Thiell, M. Collaboration capacity for sustainable supply chain management: Small and medium-sized enterprises in Mexico. J. Clean. Prod. 2014, 67, 239–248. [Google Scholar] [CrossRef]
- Faustino, C.A.; Gohr, C.F.; Santos, L.C. An approach for evaluating collaboration attributes in cluster-based companies. Int. J. Prod. Res. 2019, 57, 2356–2371. [Google Scholar] [CrossRef]
- Rosas, J.; Camarinha-Matos, L.M. An approach to assess collaboration readiness. Int. J. Prod. Res. 2009, 47, 4711–4735. [Google Scholar] [CrossRef]
- Almeida, J.M.d.G.; Gohr, C.F.; Morioka, S.N.; Nóbrega, B.M. Towards an integrative framework of collaborative capabilities for sustainability: A systematic review and research agenda. J. Clean. Prod. 2021, 279, 123789. [Google Scholar] [CrossRef]
- Choi, D.; Hwang, T. The impact of green supply chain management practices on firm performance: The role of collaborative capability. Oper. Manag. Res. 2015, 8, 69–83. [Google Scholar] [CrossRef]
- Rota, C.; Pugliese, P.; Hashem, S.; Zanasi, C. Assessing the level of collaboration in the Egyptian organic and fair trade cotton chain. J. Clean. Prod. 2018, 170, 1665–1676. [Google Scholar] [CrossRef]
- Kavilal, E.G.; Venkatesan, S.P.; Sanket, J. An integrated interpretive structural modeling and a graph-theoretic approach for measuring the supply chain complexity in the Indian automotive industry. J. Manuf. Technol. Manag. 2018, 29, 478–514. [Google Scholar] [CrossRef]
- Baykasoglu, A. A review and analysis of “graph theoretical-matrix permanent” approach to decision making with example applications. Artif. Intell. Rev. 2014, 42, 573–605. [Google Scholar] [CrossRef]
- Camarinha-Matos, L.M.; Afsarmanesh, H.; Galeano, N.; Molina, A. Collaborative networked organizations–Concepts and practice in manufacturing enterprises. Comput. Ind. Eng. 2009, 57, 46–60. [Google Scholar] [CrossRef]
- Santos, R.A.; Méxas, M.P.; Meiriño, M.J. Sustainability and hotel business: Criteria for holistic, integrated and participative development. J. Clean. Prod. 2017, 142, 217–224. [Google Scholar] [CrossRef]
- Barney, J. Firm resources and sustained competitive advantage. J. Manag. 1991, 17, 99–120. [Google Scholar] [CrossRef]
- Baraldi, E.; Gressetvold, E.; Harrison, D. Resource interaction in inter-organizational networks: Foundations, comparison, and a research agenda. J. Bus. Res. 2012, 65, 266–276. [Google Scholar] [CrossRef]
- Lei, H.-S.; Huang, C.-H. Geographic clustering, network relationships and competitive advantage. Manag. Decis. 2014, 52, 852–871. [Google Scholar] [CrossRef]
- Dyer, J.H.; Singh, H. The relational view: Cooperative strategy and sources of interorganizational competitive advantage. Acad. Manag. Rev. 1998, 23, 660–679. [Google Scholar] [CrossRef] [Green Version]
- Lavie, D. The competitive advantage of interconnected firms: An extension of the resource-based view. Acad. Manag. Rev. 2006, 31, 638–658. [Google Scholar] [CrossRef]
- Czakon, W. Relational capability of organizations: Theoretical advances. J. Econ. Manag. 2009, 5, 48–65. [Google Scholar]
- Martin, M.; Harris, S. Prospecting the sustainability implications of an emerging industrial symbiosis network. Resour. Conserv. Recycl. 2018, 138, 246–256. [Google Scholar] [CrossRef]
- Jensen, P.D. The role of geospatial industrial diversity in the facilitation of regional industrial symbiosis. Resour. Conserv. Recycl. 2016, 107, 92–103. [Google Scholar] [CrossRef] [Green Version]
- Taddeo, R.; Simboli, A.; Morgante, A.; Erkman, S. The development of industrial symbiosis in existing contexts. Experiences from three Italian clusters. Ecol. Econ. 2017, 139, 55–67. [Google Scholar] [CrossRef]
- Abreu, M.C.S.; Ceglia, D. On the implementation of a circular economy: The role of institutional capacity-building through industrial symbiosis. Resour. Conserv. Recycl. 2018, 138, 99–109. [Google Scholar] [CrossRef]
- Zhu, J.; Ruth, M. The development of regional collaboration for resource efficiency: A network perspective on industrial symbiosis. Comput. Environ. Urban Syst. 2014, 44, 37–46. [Google Scholar] [CrossRef]
- Annunziata, E.; Pucci, T.; Frey, M.; Zanni, L. The role of organizational capabilities in attaining corporate sustainability practices and economic performance: Evidence from Italian wine industry. J. Clean. Prod. 2018, 171, 1300–1311. [Google Scholar] [CrossRef]
- Capaldo, A. Network structure and innovation: The leveraging of a dual network as a distinctive relational capability. Strateg. Manag. J. 2007, 28, 585–608. [Google Scholar] [CrossRef] [Green Version]
- Dangelico, R.M.; Pontrandolfo, P.; Pujari, D. Developing sustainable new products in the textile and upholstered furniture industries: Role of external integrative capabilities. J. Prod. Innov. Manag. 2013, 30, 642–658. [Google Scholar] [CrossRef]
- Hofmann, K.H.; Theyel, G.; Wood, C.H. Identifying firm capabilities as drivers of environmental management and sustainability practices–Evidence from small and medium-sized manufacturers. Bus. Strateg. Environ. 2012, 21, 530–545. [Google Scholar] [CrossRef]
- Jiang, W.; Mavondo, F.T.; Matanda, M.J. Integrative capability for successful partnering: A critical dynamic capability. Manag. Decis. 2015, 53, 1184–1202. [Google Scholar] [CrossRef]
- Schilke, O.; Goerzen, A. Alliance management capability: An investigation of the construct and its measurement. J. Manag. 2010, 36, 1192–1219. [Google Scholar] [CrossRef]
- Hartmann, J.; Germain, R. Understanding the relationships of integration capabilities, ecological product design, and manufacturing performance. J. Clean. Prod. 2015, 92, 196–205. [Google Scholar] [CrossRef]
- Rai, A.; Patnayakuni, R.; Seth, N. Firm performance impacts of digitally supply chain integration capabilities. MIS Q. 2006, 30, 225–246. [Google Scholar] [CrossRef] [Green Version]
- Lemmetyinen, A.; Go, F.M. The key capabilities required for managing tourism business networks. Tour. Manag. 2009, 30, 31–40. [Google Scholar] [CrossRef]
- Veldhuizen, M.; Blok, V.; Dentoni, D. Organisational drivers of capabilities for multi-stakeholder dialogue and knowledge integration. J. Chain Netw. Sci. 2013, 13, 107–117. [Google Scholar] [CrossRef]
- Worley, C.G.; Feyerherm, A.E.; Knudsen, D. Building a collaboration capability for sustainability: How Gap Inc. is creating and leveraging a strategic asset. Organ. Dyn. 2010, 39, 325–334. [Google Scholar] [CrossRef]
- Chen, I.J.; Kitsis, A.M. A research framework of sustainable supply chain management: The role of relational capabilities in driving performance. Int. J. Logist. Manag. 2017, 28, 1454–1478. [Google Scholar] [CrossRef]
- Hidayah, Z. Leadership role and social green relational capabilities, network and symmetric collaboration in organization’s performance. Int. J. Appl. Bus. Econ. Res. 2016, 14, 97–114. [Google Scholar]
- Spekkink, W. Building capacity for sustainable regional industrial systems: An event sequence analysis of developments in the Sloe Area and Canal Zone. J. Clean. Prod. 2015, 98, 133–144. [Google Scholar] [CrossRef]
- Ryan, A.; Mitchell, I.K.; Daskou, S. An interaction and networks approach to developing sustainable organizations. J. Organ. Chang. Manag. 2012, 25, 578–594. [Google Scholar] [CrossRef]
- Woo, C.; Kim, M.G.; Chung, Y.; Rho, J.J. Suppliers’ communication capability and external green integration for green and financial performance in Korean construction industry. J. Clean. Prod. 2016, 112, 483–493. [Google Scholar] [CrossRef]
- Vanpoucke, E.; Vereecke, A.; Wetzels, M. Developing supplier integration capabilities for sustainable competitive advantage: A dynamic capabilities approach. J. Oper. Manag. 2014, 32, 446–461. [Google Scholar] [CrossRef]
- Cloutier, C.; Oktaei, P.; Lehoux, N. Collaborative mechanisms for sustainability-oriented supply chain initiatives: State of the art, role assessment and research opportunities. Int. J. Prod. Res. 2020, 58, 5836–5850. [Google Scholar] [CrossRef]
- Fritz, M.M.C.; Schöggl, J.P.; Baumgartner, R.J. Selected sustainability aspects for supply chain data exchange: Towards a supply chain-wide sustainability assessment. J. Clean. Prod. 2017, 141, 587–607. [Google Scholar] [CrossRef]
- Ziggers, G.W.; Henseler, J. Inter-firm network capability: How it affects buyer-supplier performance. Br. Food J. 2009, 111, 794–810. [Google Scholar] [CrossRef]
- Paulraj, A. Understanding the relationships between internal resources and capabilities, sustainable supply management and organizational sustainability. J. Supply Chain Manag. 2011, 47, 19–37. [Google Scholar] [CrossRef]
- Rodríguez-Díaz, M.; Espino-Rodríguez, T.F. A model of strategic evaluation of a tourism destination based on internal and relational capabilities. J. Travel Res. 2008, 46, 368–380. [Google Scholar] [CrossRef]
- Li, E.L.; Zhou, L.; Wu, A. The supply-side of environmental sustainability and export performance: The role of knowledge integration and international buyer involvement. Int. Bus. Rev. 2017, 26, 724–735. [Google Scholar] [CrossRef]
- Anand, G.; Bahinipati, B.K. Measuring horizontal collaboration intensity in supply chain: A graph–theoretic approach. Prod. Plan. Control 2012, 23, 801–816. [Google Scholar] [CrossRef]
- Parung, J.; Bititci, U.S. A metric for collaborative networks. Bus. Process Manag. J. 2008, 14, 654–674. [Google Scholar] [CrossRef] [Green Version]
- Simatupang, T.M.; Sridharan, R. The collaboration index: A measure for supply chain collaboration. Int. J. Phys. Distrib. Logist. Manag. 2005, 35, 44–62. [Google Scholar] [CrossRef]
- Bondy, J.A.; Murty, U.S.R. Graph Theory; Springer: New York, NY, USA, 2008; ISBN 9781846289699. [Google Scholar]
- Jerrum, M.; Sinclair, A.; Vigoda, E. A polynomial-time approximation algorithm for the permanent of a matrix with nonnegative entries. J. ACM 2004, 51, 671–697. [Google Scholar] [CrossRef]
- Horn, R.A.; Johnson, C.R. Matrix Analysis, 2nd ed.; Cambridge University Press: New York, NY, USA, 2013; ISBN 9780521548236. [Google Scholar]
Figure 1.
CCS assessment framework.

Figure 2.
Digraphs and matrices of the GTA-based framework.

Figure 3.
Classification scale and comparison.


Table 1.
CCS attributes and sub-attributes in interorganizational networks.
| Attributes | Definition | Sub-Attributes | Definition | Authors |
|---|---|---|---|---|
| Resource allocation | Investment in relation-specific assets requires resource allocation processes towards partner companies and shared resources [30]. | Sustainable innovation | The ability of companies in an interorganizational network to seek and apply new ways to innovate their processes, products, and strategies to reduce environmental and social impacts. | [36,37,38,39,40,41] |
| Adoption of clean technology | The ability to identify and initiate projects with partners to adopt new technologies with low (or even no) impact on the environment. | [36,39,40,42,43] | ||
| Knowledge management | Organizational ability to manage interorganizational knowledge exchange [2,15,28,30]. | Absorptive capability | The ability of companies to internalize the knowledge from partners, using it to generate rents within their company. | [38,41,44,45,46] |
| Knowledge sharing for sustainability | The ability to exchange knowledge available only within the interorganizational network, derived from the know-how of each company. | [15,38,41,43,47,48,49] | ||
| Partnerships formation and intensification | Companies need to build new relationships with stakeholders and intensify existing partnerships [30]. | Propensity for sustainable partnerships | The ability to identify valuable partners for sustainability purposes and maintain or modify the existing ones. | [15,36,37,41,44,47,49,50] |
| Strategic alignment towards sustainability | To build relationships with partners, companies need to set common strategic goals, especially when it comes to sustainable strategies. | [14,44,46,49,50,51] | ||
| Value chain management | Management of multifunctional processes that go beyond the organizational boundaries and involve different companies [30]. | Green new product development | It refers to the product development process that involves the entire value chain (including all stakeholders), seeking to reduce environmental impacts and improve corporate environmental performance. | [19,38,42] |
| Sustainable operations management | Organizational skills needed to manage operations efficiently while protecting people and the environment. | [15,38,40,42,43,52] | ||
| Effective governance | It refers to how companies deal with conflicting interests, organize their network, and carry out collaborative actions through formal and informal mechanisms [30,53,54]. | Long-term relationships | The longevity of the relationships in an interorganizational network can offer a guarantee to collaborate in uncertain times, due to a pattern of behavior that provides credibility between business partners. | [37,55] |
| Network structure | It involves the ability to coordinate the network structure to share knowledge and balance the interdependencies between partners. | [40,41,42,44,47,48,50,52,55,56,57,58] |
Table 2.
Scale for quantification of interdependencies.
| Value | Level of Influence |
|---|---|
| 0 | No influence |
| 1 | Very weak |
| 2 | Weak |
| 3 | Medium |
| 4 | Strong |
| 5 | Very strong |
Table 3.
Scale for quantification of inheritances.
| Value | Performance Level |
|---|---|
| 0 | Nonexistent |
| 1 | Extremely low |
| 2 | Very low |
| 3 | Low |
| 4 | Marginally low |
| 5 | Average |
| 6 | Marginally high |
| 7 | High |
| 8 | Very high |
| 9 | Extremely high |
Table 4.
Level of influence between pairs of CCS attributes and sub-attributes.
| Interdependencies | Level | Interdependencies | Level | Interdependencies | Level |
|---|---|---|---|---|---|
| 3.5 | 3.2 | 3.2 | |||
| 3.0 | 2.5 | 3.5 | |||
| 3.0 | 3.0 | 3.2 | |||
| 3.0 | 3.0 | 3.3 | |||
| 3.0 | 3.0 | 3.5 | |||
| 3.2 | 3.2 | 3.0 | |||
| 3.0 | 3.0 | 3.0 | |||
| 3.0 | 2.8 | 3.2 | |||
| 3.2 | 2.8 | 3.5 | |||
| 3.0 | 2.8 | 3.5 |
Table 5.
Individual performance of sub-attributes.
| Sub-Attributes | Company A | Company B | Company C |
|---|---|---|---|
| Sustainable innovation () | 9 | 5 | 6 |
| Adoption of clean technology () | 8 | 3 | 7 |
| Absorptive capability () | 9 | 7 | 8 |
| Knowledge sharing for sustainability () | 8 | 6 | 4 |
| Propensity for sustainable partnerships () | 6 | 7 | 7 |
| Strategic alignment towards sustainability () | 5 | 9 | 8 |
| Green new product development () | 7 | 4 | 7 |
| Sustainable operations management () | 7 | 7 | 7 |
| Long-term relationships () | 6 | 5 | 8 |
| Network structure () | 5 | 3 | 9 |
Table 6.
Matrices and permanents.
| Attributes | Company A | Company B | Company C |
|---|---|---|---|
| Resource allocation () | |||
| Knowledge management () | |||
| Partnerships formation and intensification () | |||
| Value chain management () | |||
| Effective governance () |
Table 7.
CCS indexes.
| Company | Matrix | CCSI |
|---|---|---|
| Company A | ||
| Company B | ||
| Company C |
Publisher’s Note: MDPI stays neutral with regard to jurisdictional claims in published maps and institutional affiliations. |
© 2020 by the authors. Licensee MDPI, Basel, Switzerland. This article is an open access article distributed under the terms and conditions of the Creative Commons Attribution (CC BY) license (http://creativecommons.org/licenses/by/4.0/).
Share and Cite
MDPI and ACS Style
Gonçalves de Almeida, J.M.; Gohr, C.F.; Santos, L.C. Assessing Collaborative Capabilities for Sustainability in Interorganizational Networks. Sustainability 2020, 12, 9763. https://0-doi-org.brum.beds.ac.uk/10.3390/su12229763
AMA Style
Gonçalves de Almeida JM, Gohr CF, Santos LC. Assessing Collaborative Capabilities for Sustainability in Interorganizational Networks. Sustainability. 2020; 12(22):9763. https://0-doi-org.brum.beds.ac.uk/10.3390/su12229763
Chicago/Turabian StyleGonçalves de Almeida, Juliana Maria, Cláudia Fabiana Gohr, and Luciano Costa Santos. 2020. "Assessing Collaborative Capabilities for Sustainability in Interorganizational Networks" Sustainability 12, no. 22: 9763. https://0-doi-org.brum.beds.ac.uk/10.3390/su12229763
Note that from the first issue of 2016, this journal uses article numbers instead of page numbers. See further details here.