A Statistical Framework for Assessing Environmental Performance of Quality Wine Production

1
School of Science and Technology, Hellenic Open University, 26335 Patra, Greece
2
Department of Business Administration, University of Piraeus, 18534 Piraeus, Greece
3
Department of Statistics and Insurance Science, University of Piraeus, 18534 Piraeus, Greece
*
Author to whom correspondence should be addressed.
Sustainability 2020, 12(24), 10246; https://0-doi-org.brum.beds.ac.uk/10.3390/su122410246
Submission received: 21 October 2020
/
Revised: 3 December 2020
/
Accepted: 3 December 2020
/
Published: 8 December 2020
Abstract
:The present work presents a statistical framework for analysing and evaluating the environmental performance of 21 wines (protected designation of origin or protected geographical indication) produced in Greece, through their complete lifecycle. For this purpose, the life cycle assessment methodology was used. It is well known that lifecycle thinking is a scientific approach that can support businesses in decision making towards sustainable consumption and production. However, such techniques provide a large amount of multi-dimensional data that are difficult to comprehend and interpret. Therefore, the application of an appropriate statistical framework to aid this assessment, which should be as unambiguous and reliable as possible, is needed. This statistical framework should be based on the lifecycle inventory results, on an appropriate multivariate technique such as principal component analysis, and on probability distributions, thereby providing an objective framework to assist the evaluation of the environmental performance of the products. Applying the proposed framework to 21 Greek wines, we found that the proposed framework could be used for categorizing the examined wines according to their environmental impact severity, as well as the impact types associated with them.
1. Introduction
Today’s society is becoming increasingly concerned about the environmental impact of productive activity. A common term that is used to express this concern is “sustainability”; a term with a dynamic, regularly changing definition [1,2,3] that cannot be ignored by any business [4]. Various tools and methods have been used to assess environmental impacts [5]. The analysis of a product’s entire lifecycle in terms of sustainability is known as a life cycle assessment (LCA), which has evolved over time [6]. LCA was originally developed as a decision-making tool, aimed at a systematic assessment of the environmental performance of products and processes [7,8]. It also provides a consistent basis for comparisons between alternatives based on their associated environmental consequences [9]. Nevertheless, such analyses provide a large amount of multi-dimensional data (inputs and outputs) that are difficult to comprehend and interpret [10,11]. Therefore, lifecycle inventories need to be aggregated to be of much use [12]. For this purpose, an appropriate tool has been developed by Bersimis and Georgakellos [13] to aid in the assessment of the environmental performance of products based on the lifecycle inventory results, and using the principal component analysis (PCA) framework—an analysis method that is used when multiple measurements are performed on an object [14] and which can be employed in environmental fields, where often a wide range of variables are being analysed simultaneously [15].
The sustainability issues of the wine market were discussed in many studies [16,17,18,19], and sustainable or environmental factors of wine are important elements in wine purchasing [20,21,22]. In many cases, wines produced from organically grown grapes are perceived by consumers as sustainable [23,24,25,26]. Although traditionally wine production has been considered sustainable, practices for pollution prevention and protection of natural resources should be adapted for the wine industry, considering all phases [17,27,28,29]. Furthermore, extensive research has been conducted concerning the carbon footprint of wine, as this is considered an indicator that may help with improving environmental performances in wine production [30,31,32,33]. The water footprint should also be examined [34,35]. Management strategies for reducing carbon emissions and improving the water footprint of wines, moving towards a sustainable wine production, are recommended by Gierling and Blanke [36].
In this context, the present work aims to identify the environmental impacts occurring along the lifecycle of 21 wines (in glass bottles of various weights and volumes) produced in the prefecture Arcadia of the Peloponnese (Greece), as well as to compare the gravity of the environmental impacts of these wines using the general framework provided by Bersimis and Georgakellos [13]. This is very important because, even if the study of specific environmental issues occurring during wine production is common (e.g., Muñoz-González et al. [37]), examination of the environmental impacts occurring along the whole lifecycle of quality wine production and supply is rare. For the purpose of this study, the following methods were applied: (a) LCA, in order to create the inventory of environmental impacts along the lifecycle of the wines under examination, and (b) PCA, to establish environmental performance indices of the products.
Our approach identifies the environmental impact of 21 wine products in the key areas of environmental concern: energy consumption, water consumption, atmospheric emissions, waterborne waste, and solid waste. The aim of the proposed framework is to introduce a useful tool for the assessment of the environmental performance of wine products. The 21 wines (protected designation of origin or protected geographical indication) we considered were produced in the prefecture Arcadia of the Peloponnese (Greece), and were examined through their complete lifecycle using the LCA methodology. Their environmental performance was assessed using PCA.
The remainder of this article is organized as follows. In Section 2, the assumptions are briefly presented. In Section 3, the results of the proposed method are presented. In Section 4, the proposed approach is discussed for future research. The conclusions of the work are presented in the last section of the paper.
2. Materials and Methods
2.1. Environmental Performance of Wine Production
In recent years, many studies have been carried out in the wine industry to identify environmental impacts through the complete lifecycle, from vineyard cultivation and wine production, including distribution [38], to wine consumption, by examining consumers’ attitudes towards environmentally-friendly wines [39,40]. Despite the industry’s general reputation as being environmentally safe, research has shown that it is associated with a large number of environmental concerns. The focal points in terms of environmental concerns of the global wine industry are water use and quality issues, the production and management of solid waste, energy use and the generation of greenhouse gas emissions, the use and management of chemicals in the vineyard and winery, and land use issues [38,41].
Solid waste is produced both in the wine production, including vineyard cultivation, and includes plants remains, grape marc, and lees. Wine production generates huge amounts of waste [42,43] and wastewater [43] in both the red and white winemaking processes, which requires suitable disposal [44]. Furthermore, wine waste treatment constitutes a major problem of the wine industry both from an economic point of view and from an environmental one. Winery waste, in many cases, is improperly managed and handled, and this is a challenge for the industry in terms of sustainability [45].
Different strategies for the valorization of the winery industry waste have been reviewed [42]. Composting is a way of valorizing winery waste, which in most cases generates a compost of high agronomic value [42]. Grape marc is also a promising feedstock for renewable energy production [44]. Technologies such as an integrated biorefinery approach could be a solution for winery waste utilization, to generate various products in the form of food, feed, fuel, and clean energy, along with value-added chemical compounds [45]. Results from studies concerning recycling and reuse of the bottles have demonstrated that the first requires high quantities of energy for cullet processing and melting. The life cycle assessment (LCA) methodology was used for this assessment [46].
2.2. Life Cycle Inventory of Wines
The wines under examination, which were produced by five winemakers, are presented in Table 1. The grapes from which they were produced came from the demarcated geographical areas for wine production in the protected designation of origin (PDO) Mantinia, protected geographical indication (PGI) Arkadia and protected geographical indication Peloponnese, respectively. In addition, their production took place in the geographical area in compliance with the product specification of the PDO Mantinia, PGI Arkadia, and PGI Peloponnese. Specifically, the present study examined 21 wines in glass bottles of various weights and various volumes. In addition, the study includes both wines which have been produced from conventionally grown grapes, and wines from organic grapes.
The products under examination constitute systems which are divided into processes. The processes are linked: (a) through intermediate product flows and/or waste flows for treatment, (b) to other product systems through product flow, and (c) to the environment through elementary flows such as water and energy consumption, solid and water waste, sub-products (marc and lees), and air emissions. More precisely, during the various stages of their lifecycle, from raw material production (grapes) for wine production or their supply for bottle manufacture, wine-making, transport of wines, bottling, and distribution of final products, resources and energy are consumed, while emissions or waste are released. Product consumption leads to the release of waste into the environment, which can be recycled or taken to a waste landfill in whole or in part. The collection and calculation process of the above data was carried out by applying the method of life cycle assessment. The LCA system includes the following subsystems: (1) grape production, (2) transport of grapes for wine making, (3) production of wine, including maturation in barrels (for certain wines), (4) transport of the wine to bottling facilities (for certain wines), (5) bottle production, (6) transport of bottles, (7) bottling, (8) transport of the final product, (9) final product use and (10) final bottle disposal. The consumption of materials, water and energy, as well as the air emissions, are reported per 1000 L of wine as the functional unit.
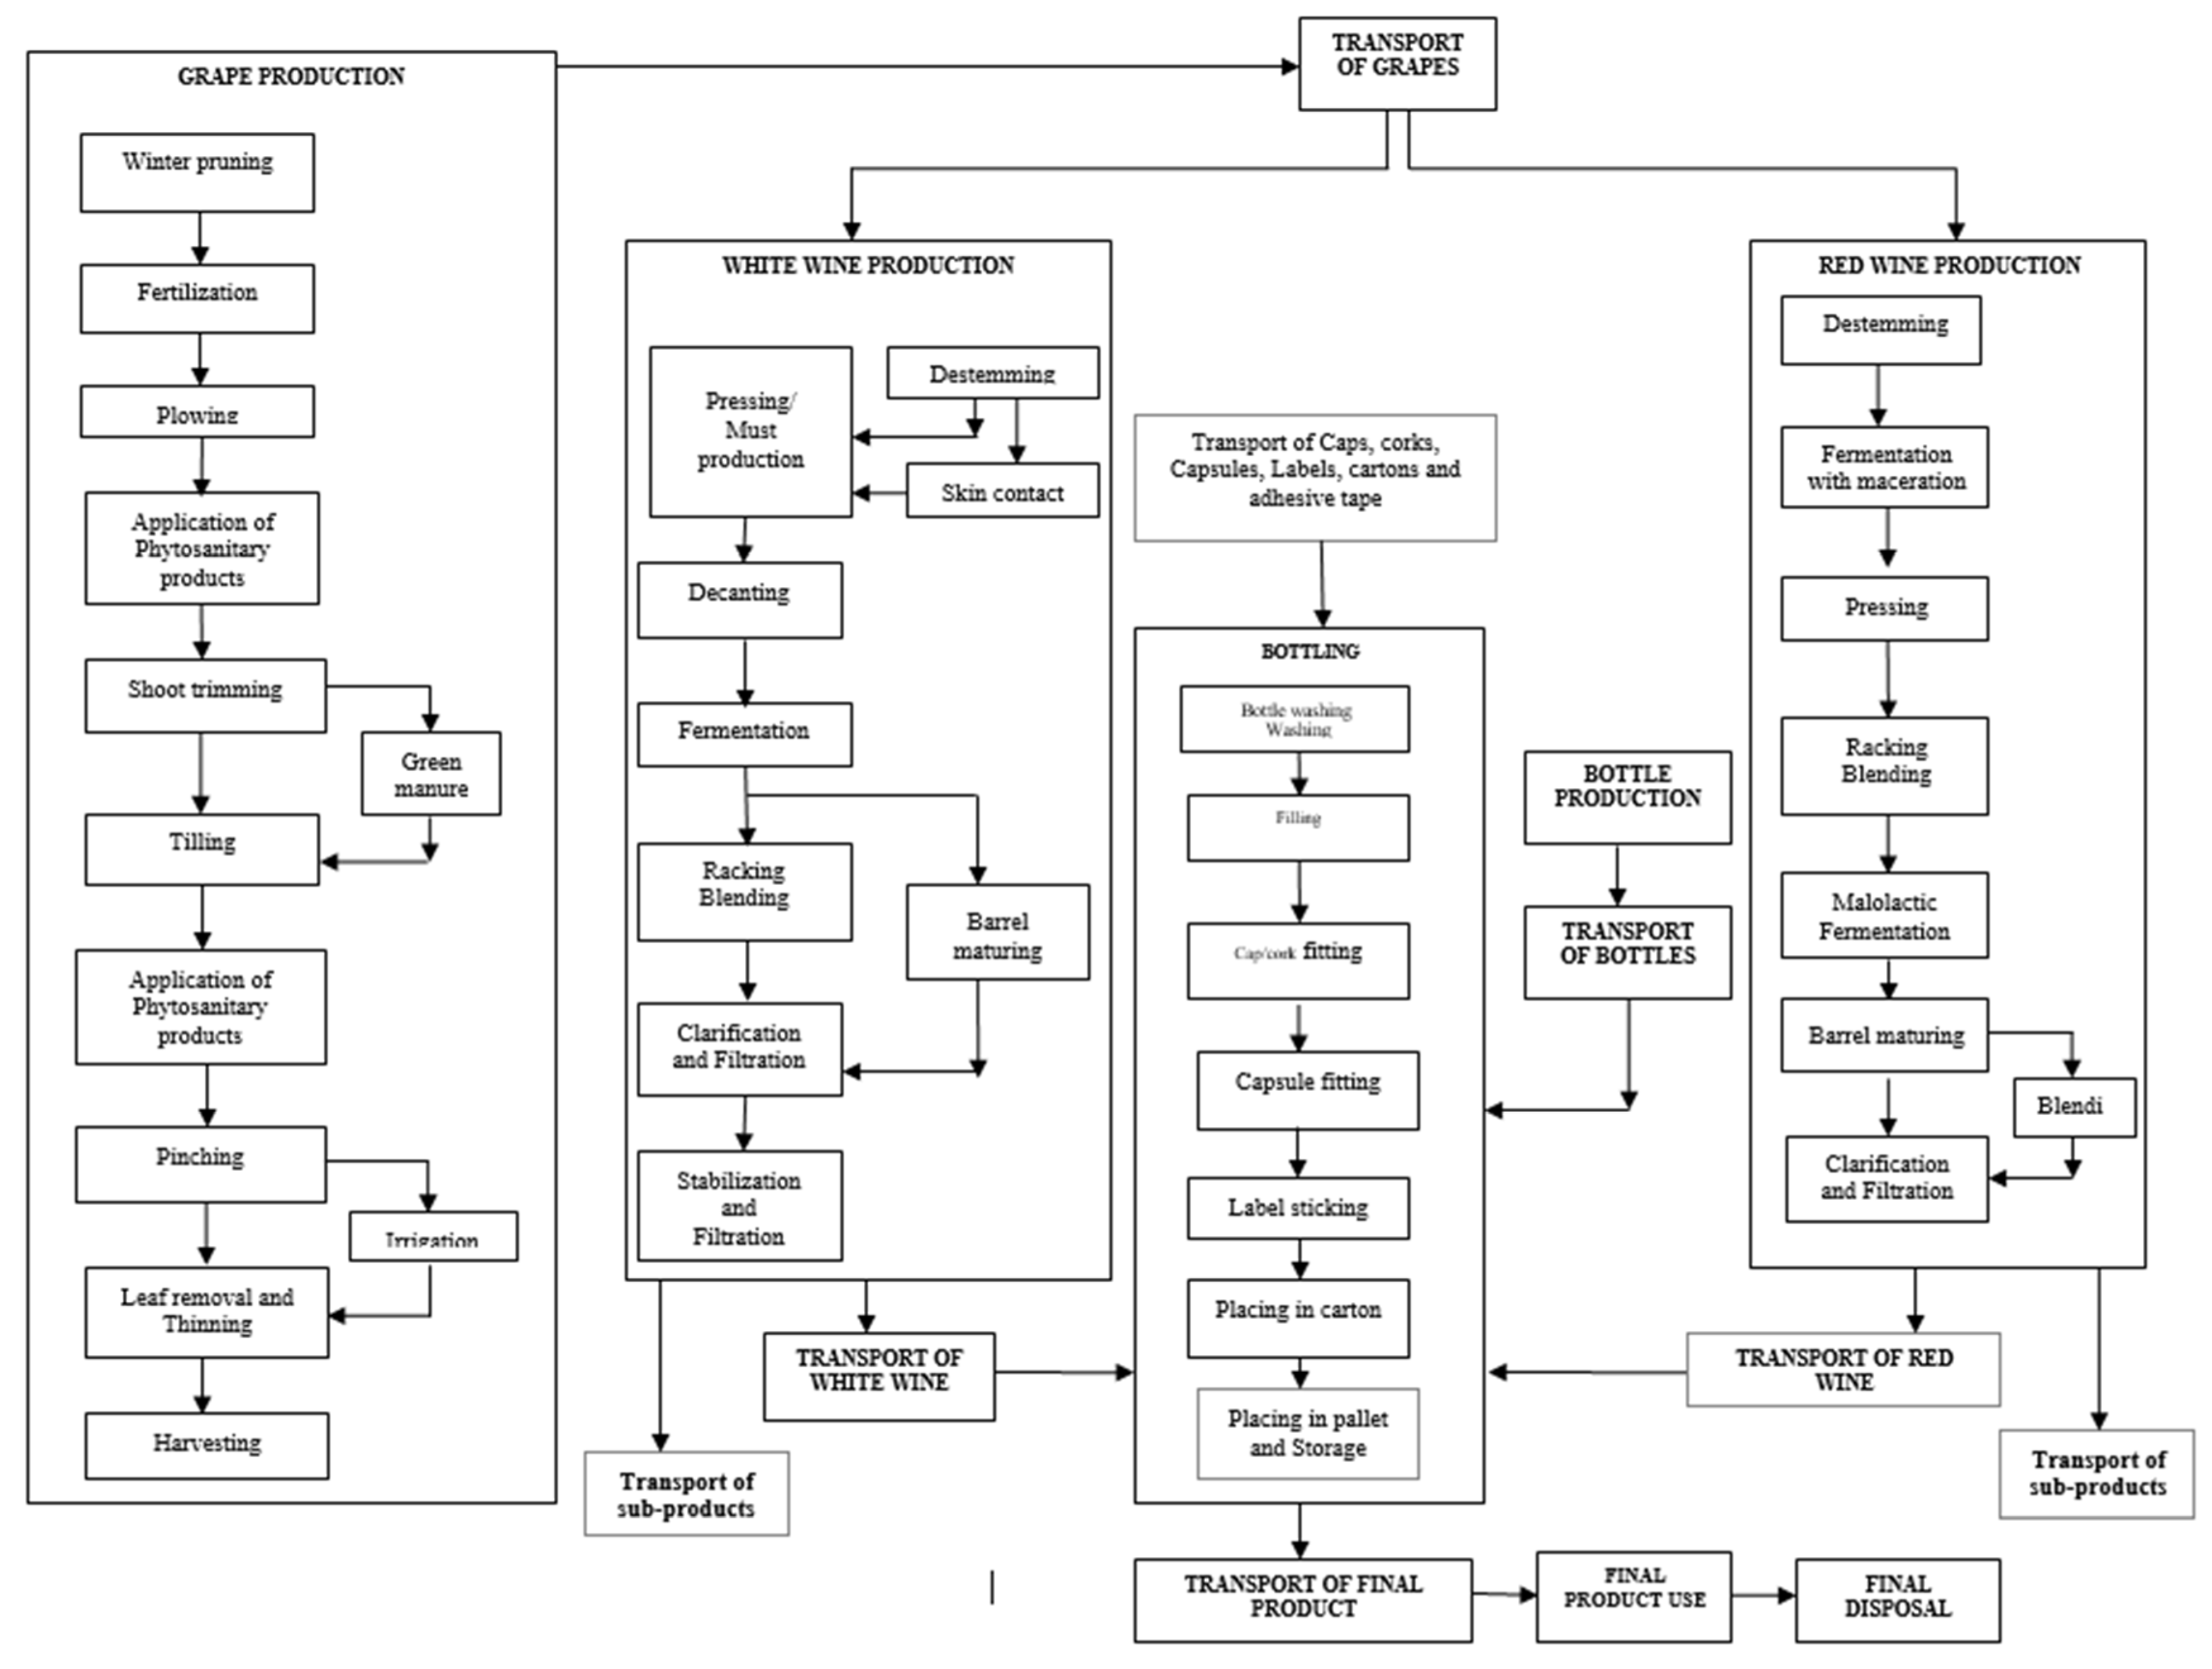
Data were collected through the use of a detailed questionnaire mailed to the winemakers of Arcadia, and directly through the realization of interviews on site at the wineries. The questionnaire was designed to obtain information concerning: (1) vineyard size and yields, (2) vineyard operations, fertilization, phytosanitary products, worker transportation, machinery, and water use in the grape production phase, (3) transport of grapes for wine-making, (4) wine-making, maturation or aging, enological products, and mechanical equipment for wine production and water used, (5) transport of the wine to bottling facilities, (6) transport of bottles, (7) transport of caps, corks, capsules, labels, cartons, and adhesive tape, (8) bottling, and (9) transport of the final product. In addition, data collection also concerned waste management from the grape production phase and wastewater and sub-product management from the wine production phase. For the purpose of the study, a flow chart was designed in order to depict the lifecycle stages of all wines under examination (Figure 1). Some of the phases were not included in the lifecycle of all the wines.
2.2.1. Grape Production
The grape production subsystem includes all of the work in the vineyard. Specifically, it includes the following: winter pruning, fertilization, plowing, application of phytosanitary products, tilling, green pruning (shoot trimming, pinching, leaf removal, thinning), and harvesting. Some winemakers produce wines from their own vineyard grapes, while others purchase a quantity or the total of the grapes from other vine-growers whose vineyards are located within the demarcated areas for the production of the wines in question. For the purpose of the analysis, we have assumed that, in cases where data about grape production were not available, the practices of the other vine-growers are similar to the winemakers under consideration who provided such data. However, operational processes and the number of operations during the grape production phase vary among the winemakers such as, for instance, the number of applications of phytosanitary products carried out to protect vines from diseases or the application process for fertilizers, either utilizing workers or a tractor. Some activities were not considered, including the production and the transport of fertilizers and phytosanitary products. Further, field emissions due to the application of the phytosanitary products were excluded.
The transportation of workers during plowing, application of phytosanitary products, shoot trimming, and tilling was excluded. This is due to the fact that these operations were carried out using tractors. The power of the tractors used is from 62 to 75 HP.
Fertilization was performed by workers without the use of a tractor in the cases of Wine 18, Wine 19 and Wine 20, thus fuel consumption for workers’ transportation has been included. In the other cases, it was carried out using a tractor.
“Pinching” was performed by workers in the case of Wine 21, while in the other cases it was carried out using a tractor.
The transportation of workers to the vineyards to perform winter pruning, pinching, leaf removal, and thinning was carried out using agricultural vehicles with fuel consumption ranging from 0.09 to 0.12 L per km. The grapes were transported in a tractor trailer, or in some cases by agricultural vehicle or a lorry. As mentioned above, some of the phases were not included in the lifecycle of all the wines in question. Specifically:
- “Plowing” is not included in the lifecycle of Wine 15 and Wine 16 as it was not performed.
- “Tilling” is not included in the lifecycle of Wine 2 and Wine 3. In addition, in the cases of the Wine 1 and Wine 4–Wine 9, it was performed only by vine growers who supplied winemaker A with grapes.
- “Shoot trimming” is not included in the lifecycle of Wine 18 as it was not performed.
- “Leaf removal” is not included in the lifecycle of Wine 21. “Thinning”, during which superabundant bunches of grapes are removed in order to meet the product specification regarding yield per hectare and obtain a better quality for the remaining bunches, is included in the lifecycle of Wine 21. However, as the operation was carried out by the owner of the vineyards and not by workers, data for fuel consumption is not mentioned. In addition, the application of “green manure” was performed in the grape production phase for the enrichment of the soil with nitrogen only in the case of organic Wine 21.
- “Thinning” was performed along with “leaf removal” in the cases of Wine 1, Wine 2, Wine 3 Wine 4, Wine 5, Wine 6, Wine 7, Wine 8, and Wine 9. Data for this operation were not mentioned in the other wines. Nitrogen emissions, ammonia NH3 and nitrous oxide N2O, due to the use of fertilizers in the case of the wines from conventionally grown grapes, were estimated using methods derived from the scientific literature [17].
In the case of organic wines, emissions were not estimated because fertilization was performed with organic fertilizers. Canes from “winter pruning” and shoots from “shoots trimming” were used as organic fertilizer.
2.2.2. Wine Production
The wine production phase starts with grape transportation to the winery, proceeds with the winemaking processes, and ends when the wine is ready to be bottled and packaged. It includes the stages for both white wine production and for red wine production. However, some stages are not included in the lifecycle of all wines, because of variations in winemaking techniques.
White Wine Production
Specifically regarding white wine production:
- In the case of Wine 1 and Wine 4 the grapes were transported to the press as follows: 60% of the grapes, after completion of the destemming phase, and 40% after the destemming and the skin contact phases. During the skin contact phase, the crushed grapes, along with the grape juice, were transferred to a tank for 8 to 10 h for better extraction of the grape skin components that contribute to the aroma. The temperature was set to 8 °C.
- In the case of Wine 3, the total of the grapes was transported to the press after the destemming phase and skin contact phase, while in the cases of Wine 2, Wine 18, Wine 19, and Wine 20, the grapes were transported to the press without destemming.
- In the other cases, the grapes were transported to the press after stem removal.
After the pressing phase, SO2 is added to the must, which is then transferred by pump to a tank. The must is subject to the decanting phase before being transferred to the fermentation tank. Fermentation turns sugars contained in must into alcohol and carbon dioxide. It is realized either by yeast inoculation, or by indigenous yeasts in the case of Wine 21. Fermentation is carried out under controlled temperatures. After fermentation, the wine is separated from the lees and racked in a proper tank. During this phase SO2 is supplemented. “Blending” is the process wherein the contents of different tanks are blended in order to produce the final product. This phase is included in the lifecycles of Wine 1, Wine 3, and Wine 4. The phase “barrel maturing” is included only in the lifecycles of Wine 2 and Wine 18. Specifically, after fermentation, the wines were separated from the lees and transferred to oak barrels, where they remained in the case of Wine 2 for at least three months and for 6 months for Wine 18. A cooling system was utilized to control temperature and humidity conditions for Wine 2. In both cases, after the completion of the process, the wine was transported to a proper tank where SO2 was supplemented.
Subsequently, the clarification phase was realized in order to achieve greater clarity. During this phase, material such as bentonite is added in order to absorb and then precipitate the suspended material. Filtration is realized after the clarification phase, with appropriate filters. The stabilization phase in most cases was realized with refrigeration of the wines for a certain period, in order to allow the precipitation of tartaric salts. During the final process, the wines underwent filtration, followed by bottling and packaging.
Red Wine Production
After stem removal, the crushed grapes, consisting of the juice, skin and seeds, are transferred to a proper tank and SO2 is added. Fermentation occurs together with maceration, and is activated by yeast inoculation. The temperature is controlled during fermentation. Subsequently, following the pressing phase, the wine is transferred to a proper tank. After completing alcoholic fermentation, the wines are separated from the lees. During this phase SO2 is supplemented. The next treatment is blending, a process where the contents of different tanks are blended in order to produce the final product. Afterward, the wine is subjected to malolactic fermentation with the use of a pure culture of lactic bacteria.
Following this, the wines were transferred to oak barrels where they remained for nine months under controlled temperature and humidity conditions. The clarification phase was realized using a proteinaceous fining agent, such as gelatin. The last process the wine underwent was filtration, followed by bottling and packaging. The “blending phase” after maturation was included only in the lifecycle of Wine 5. During fermentation, CO2 emissions were excluded. Regarding sub-products, the marc and stems were transported to vineyards and used as organic compost, while the lees were transported for distillation.
2.2.3. Transport and Bottling
Transport of wine to bottling facilities was referred to for Wine 10, Wine 11, and Wine 21. Specifically, the transport of Wine 10–Wine 14 was realized by road tanker, while Wine 21 was by agricultural vehicle. In the other cases, bottling took place in facilities inside the wineries where wine production occurred. In bottling, in the first stage wine is bottled in glass containers that have been previously washed. The filled bottle is then sealed with a cap or a cork. Afterwards, the capsule is fitted at the neck and the label is stuck on the bottle. Concerning wines with PDO Mantinia, the filled bottles are sealed only with a cork, and a certification label of reddish color is stuck on the neck. Then, the filled bottles are packaged in cartons, placed on pallets, and finally transferred to storage.
Some activities, such as the transport of the caps, corks, capsules, labels, cartons, and adhesive tape, were not taken into account due to lack of data. The transport of bottles was included and is carried out with vans and lorries. Some activities during the bottling phase took place manually for some wines, and some of them were not included in the lifecycle of all the wines. Specifically:
- The activities “bottle washing”, “cork fitting”, and “label sticking” were realized by workers in the cases of Wine 7 and Wine 9 due to the use of an oversized bottle, which does not fit in the standard machine. In this case, molten wax was applied to the cork.
- In all cases of wines with PDO Mantinia, the certification label was stuck manually.
- “Placing in carton” took place automatically only in Wine 10–Wine 14 and Wine 18–20.
- “Capsule fitting” is not included in the lifecycle of Wine 17, Wine 7, and Wine 9 as it was not performed.
- During the activity “bottle washing”, diesel was consumed for bottle heating in Wine 10–Wine 14.
Most of the winemakers of Arkadia export their wines to EU and other countries. However, due to a lack of data for the transport of the finished product to these destinations, it has been assumed that the largest quantity of wine was sold within Greece. The transport of bottled wines was carried out by van or lorry. Emissions resulting from fuel and energy consumption were calculated using conversion factors derived from the literature [47,48,49].
2.3. The Statistical Framework for Evaluating Wines’ Environmental Performance
Indicative data were collected through the inventory questionnaire from the five wineries for each wine they produce, giving us the average grape yield per hectare (kg/ha), the number of “aging barrels” used and their size, the water consumption for washing the barrels (L), and so forth. The next step, after the confirmation of the collected data (clarifications were requested either by telephone or by sending additional questionnaires to ensure data reliability and quality), was the correlation of the data with the processes in order to obtain the inventory results for each process, and for the specified functional unit of the product systems.
Usually, a lifecycle inventory (LCI) analysis provides a large amount of multi-dimensional data (inputs and outputs) that are difficult to comprehend and to interpret. Therefore, LCI results need to be aggregated to be of much use. Thus, applying the methodology proposed by Georgakellos [50] for the atmospheric emissions and the waterborne waste of each wine, the critical volumes of air and water were calculated. The threshold values for each pollutant used in the calculations can be based on the Greek or the European legislation. After that, the results of the inventory analysis were compressed into five ecological parameters: (X1) consumption of energy, (X2) consumption of water, (X3) air emissions as a critical volume of air, (X4) waterborne waste as a critical volume of water, and (X5) solid waste. These ecological parameters are presented in Table 2.
Subsequently, a further aggregation was needed in order to give a single value solution. This was achieved according to the procedure described below.
Data Analysis
Our aim was to analyse the data (wine measurements) at hand and provide new indices that will permit us to order wines from the most polluting to the less polluting. According to Table 2, the data set consists of five variables, representing consumption and pollution characteristics for 21 wines. The framework proposed by Bersimis and Georgakellos [7] was used for the analysis of the data at hand.
The first problem that we had to deal with in order to build appropriate indices was the fact that the variables are in different units. Thus, a standardization procedure was applied. The following transformation was used:
where:
is the measurement of the product on the variable under study,
is the sample mean of the variable, and finally
is the sample standard deviation of the variable.
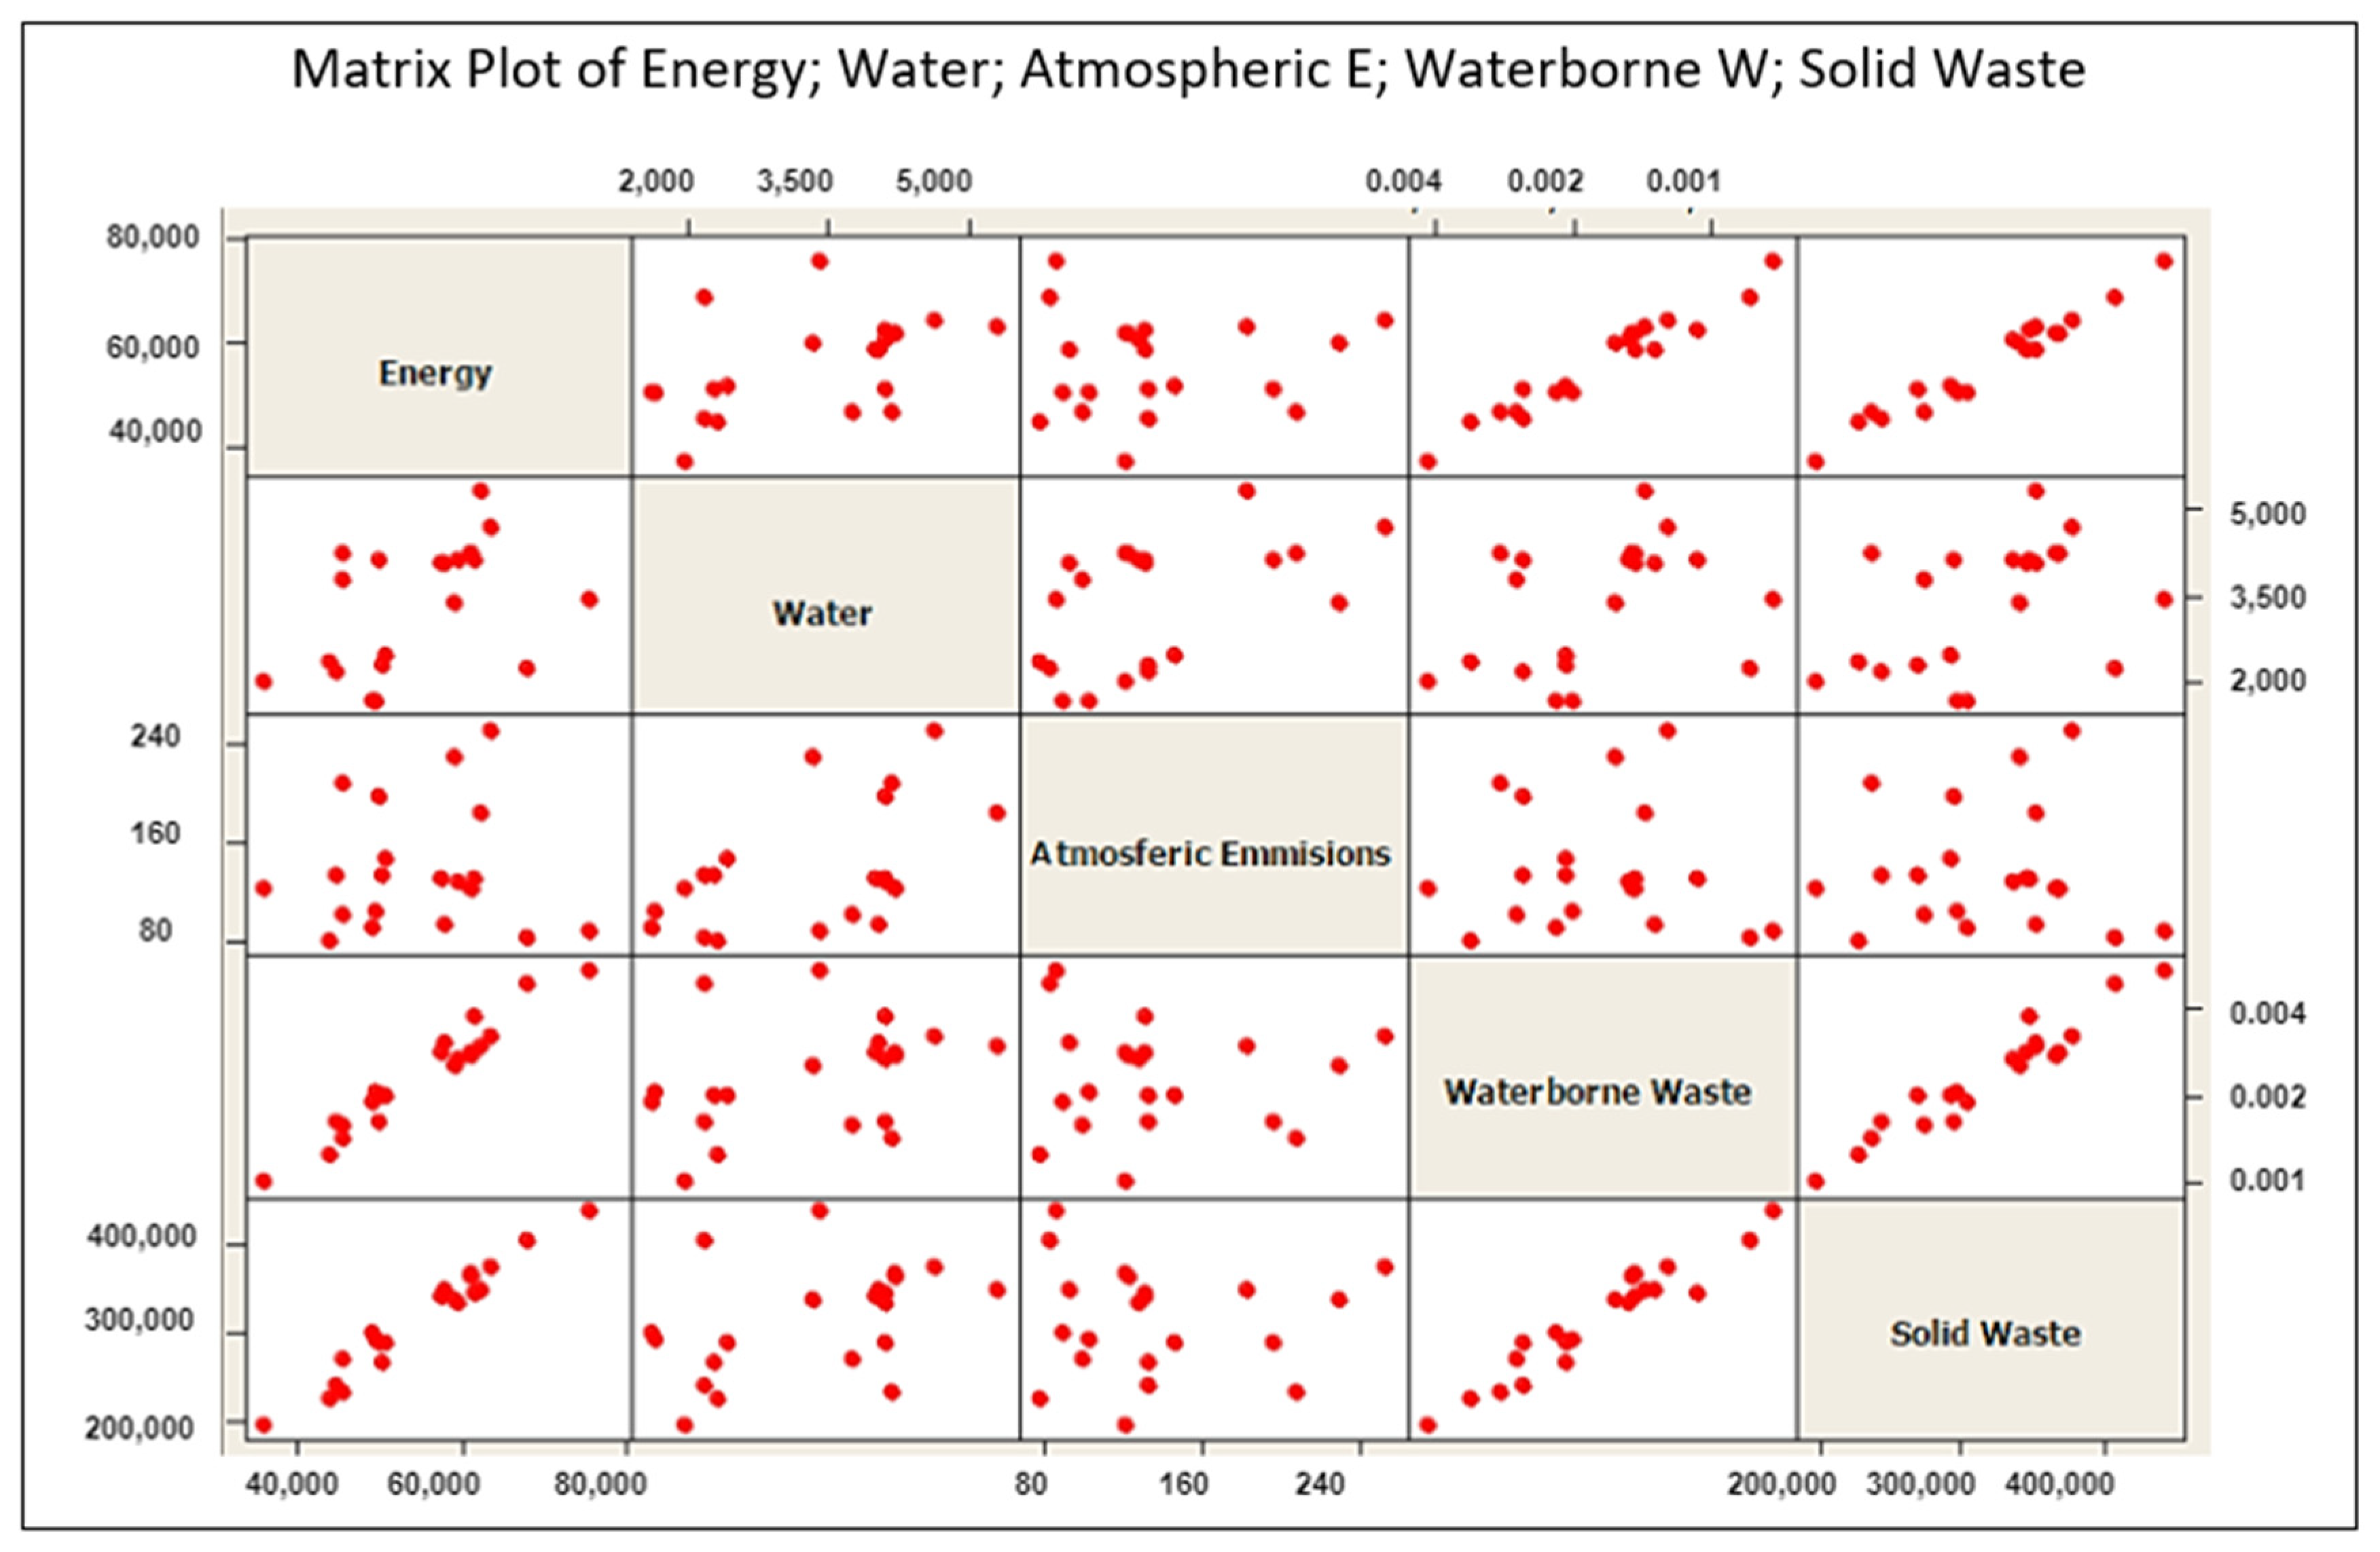
The second problem that we had to deal with in order to establish appropriate indices was the linear dependence among the variables. In the case of the five variables under study, it was evident that they were dependent and specifically linearly correlated (Figure 2). The strength of the correlation between two variables may be measured using the well-known Pearson correlation coefficient. As one may observe in Table 3, most of the correlation coefficients were statistically significant (“NS” means non-significant).
A method that may be used to create appropriate indices is principal component analysis, or PCA. PCA converts a set of observations of possibly correlated variables into a set of values of linearly uncorrelated variables called principal components. PCA is mostly used as a tool for revealing the internal structure of the data in the way that best explains the variance in the data. The number of principal components is less than or equal to the number of original variables, and the first principal component has the largest possible variance. Other authors have given more detail about the method of PCA [22,23,24].
As was revealed by the application of PCA, the two first principal components (PCs) interpreted, in total, 98.5% of the total information (variance) contained in the data set at hand. The first interpreted 63.9% of the total information, while the second interpreted 27.4% of the total information. The two PCs are given in Table 4.
The first PC (PC1) may be interpreted as an “index of pollution severity” that a product causes. It is clear that PC1 is an empirical weighted mean of the five original variables. High values of the first PC correspond to wines that cause severe pollution to the environment. The second PC is a characterization of the “type of pollution” a wine produces. Specifically, large positive values of PC2 indicate wines that cause high volumes of atmospheric emissions, as well as requiring large volumes of water. Furthermore, large (in absolute values) negative values of PC2 indicate products that demand extreme energy consumption, as well as waste (either waterborne or solid).
Thus, the higher a PC1 score is, the greater the damage that a product causes to the environment (mean damage is symbolized with 0). On the contrary, the lower a PC1 score is, the lesser the damage to the environment from a product.
In relation to the second PC, a positive score indicates a wine that causes high volumes of atmospheric emissions and/or high consumption of water, while a negative score indicates a product that demands extreme energy consumption and high volumes of waste (either waterborne or solid). A PC2 score close to 0 indicates a product that has balanced problems, both with atmospheric emissions and water consumption versus waste and energy consumption. A graphical categorization of the twenty products using the two PCs is given in Figure 3. In Figure 3, Wine 2 and Wine 11 have a major impact on the environment, and cause problems mainly related to air emissions and/or high consumption of water, while Wine 16 and Wine 15 have less impact on the environment, and their effects are mainly associated with waste.
As already mentioned, the two PCs are uncorrelated and independent in the case that they are also normally distributed. For that reason, a normality test was applied to both the PCs. The analysis revealed for the first PC that the normality assumption is not rejected (p-value = 0.194). The same is also true for the second PC (p-value = 0.070). A multivariate test of normality found the same results. Thus, it is clear from the analysis that these two indexes are excellent for categorizing wines as heavy pollutant, medium pollutant, and low pollutant, as well as water pollutant or atmosphere pollutant and high water user. Furthermore, using the fact that the two PCs are distributed according to a standard normal distribution, we may construct appropriate confidence limits and explore for the presence of possible outliers (products with an excess rate of pollution or products with unusually low pollution rates).
For a new product, first we standardize the initial values of the product, then we use the standardized values as an input into the two PC equations, and finally we interpret the scores.
3. Results
As the analysis revealed, the glass bottle volume is related to the index of pollution severity. The application of the ANOVA technique gave a significant relationship between pollution severity and the bottle volume (p-value = 0.047). Specifically, smaller volumes have more severe environmental effects, while larger volumes have smaller environmental effects (see Table 5). The type of wine is not related to the index of pollution severity (p-value > 0.10).
3.1. A Theoretical Graphical Approach
Based on the evidence found in the previous section, we may define an appropriate procedure for the instant pollution rate evaluation, as well as for the instant identification of the pollution mark of a product. This method was first proposed by Bersimis and Georgakellos [13].
3.1.1. A Model Based on a Normal Distribution
Let us assume that the two PCs are represented by two independent random variables, say Y1 and Y2, that follow a standard normal distribution. Using this fact, we may use appropriate percentiles of the standard normal distribution in order to categorize the PC values of each product, and finally the products themselves [51].
Specifically, we may define three categories for each of the two PCs, as follows:
for , where is an appropriate upper percentile of the standard normal distribution.
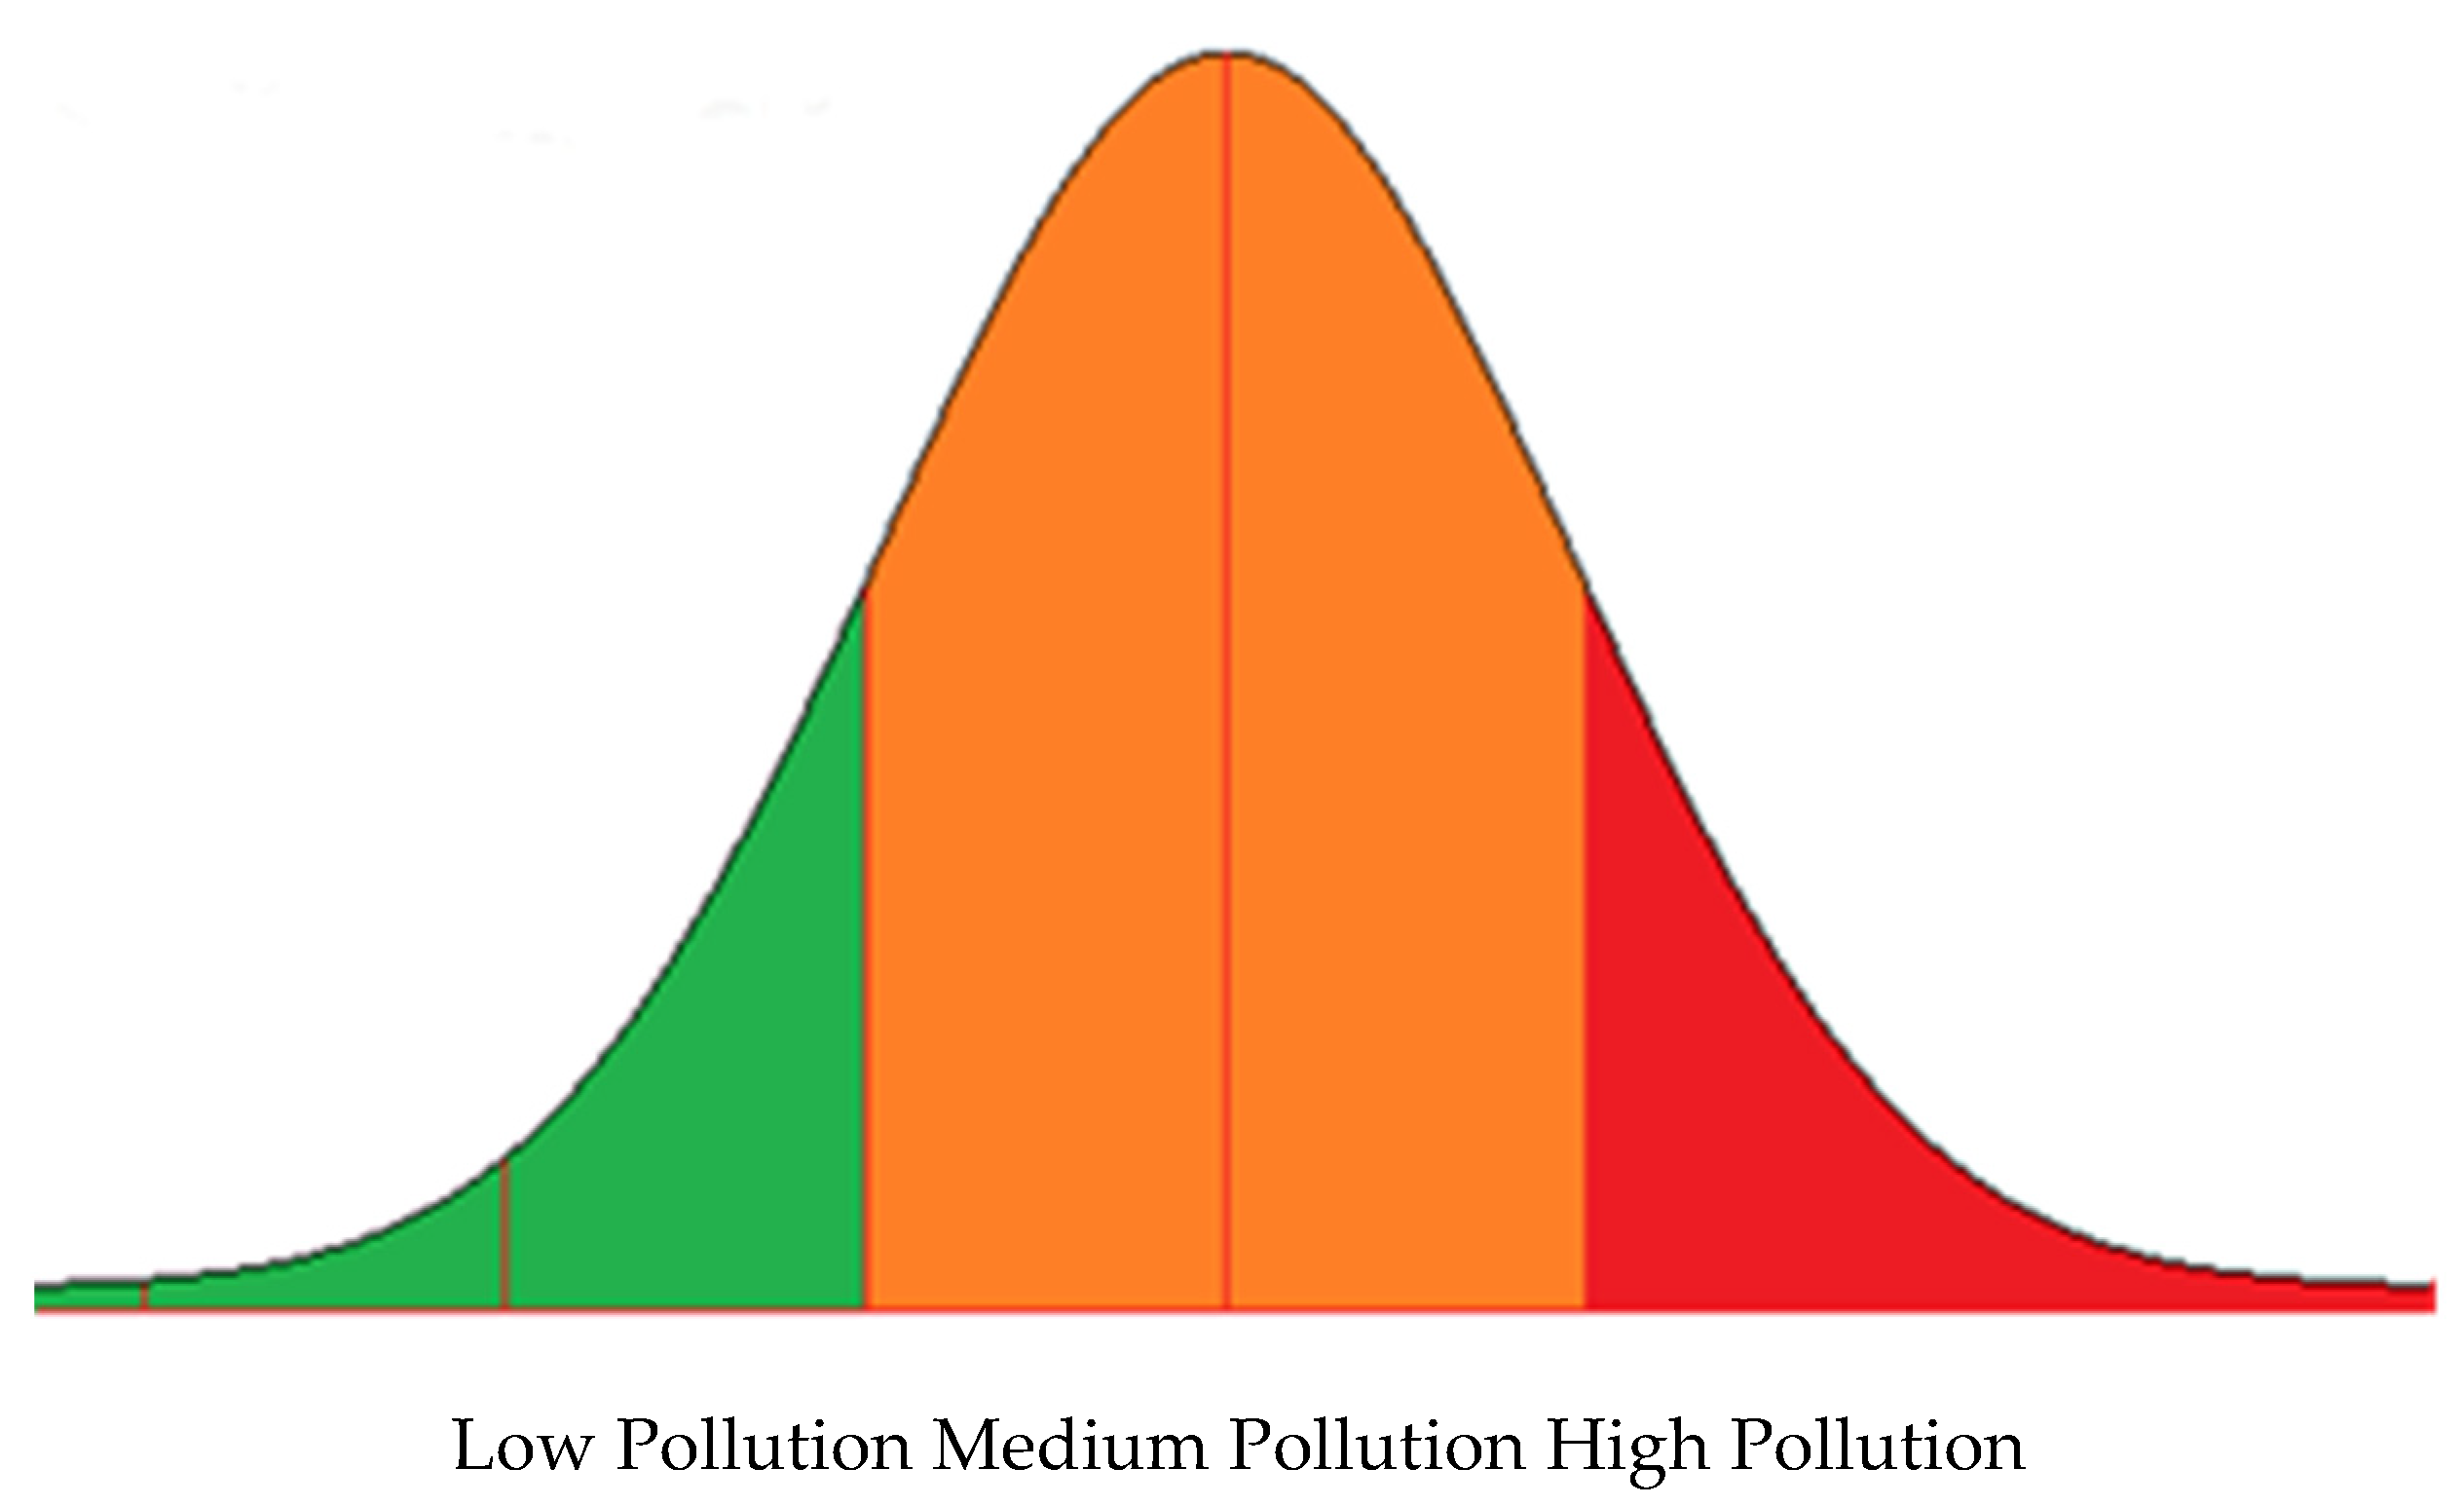
As far as the first PC is concerned, c = 1 corresponds to products of “low pollution rates” (where ), c = 2 corresponds to products with “usual pollution rates” (where ), and c = 3 corresponds to products with “high pollution rates” (where ). A straightforward choice for α is the value 0.10 (10%). Using we categorize 10% of the products with the most extreme values (either negative or positive), as products with low or high pollution rates, depending on the sign of . A graphical representation of the proposed categorization method is given in Figure 4.
As far as the second PC is concerned, c = 1 corresponds to products with “high atmospheric emissions and water consumption” (where , c = 2 corresponds to “balanced” products, associated both with atmospheric emissions and/or water consumption and waste (where ), and c = 3 corresponds to products with “high volumes of waste” (where ).
3.1.2. An Inversed Model and Environmental Performance Tag
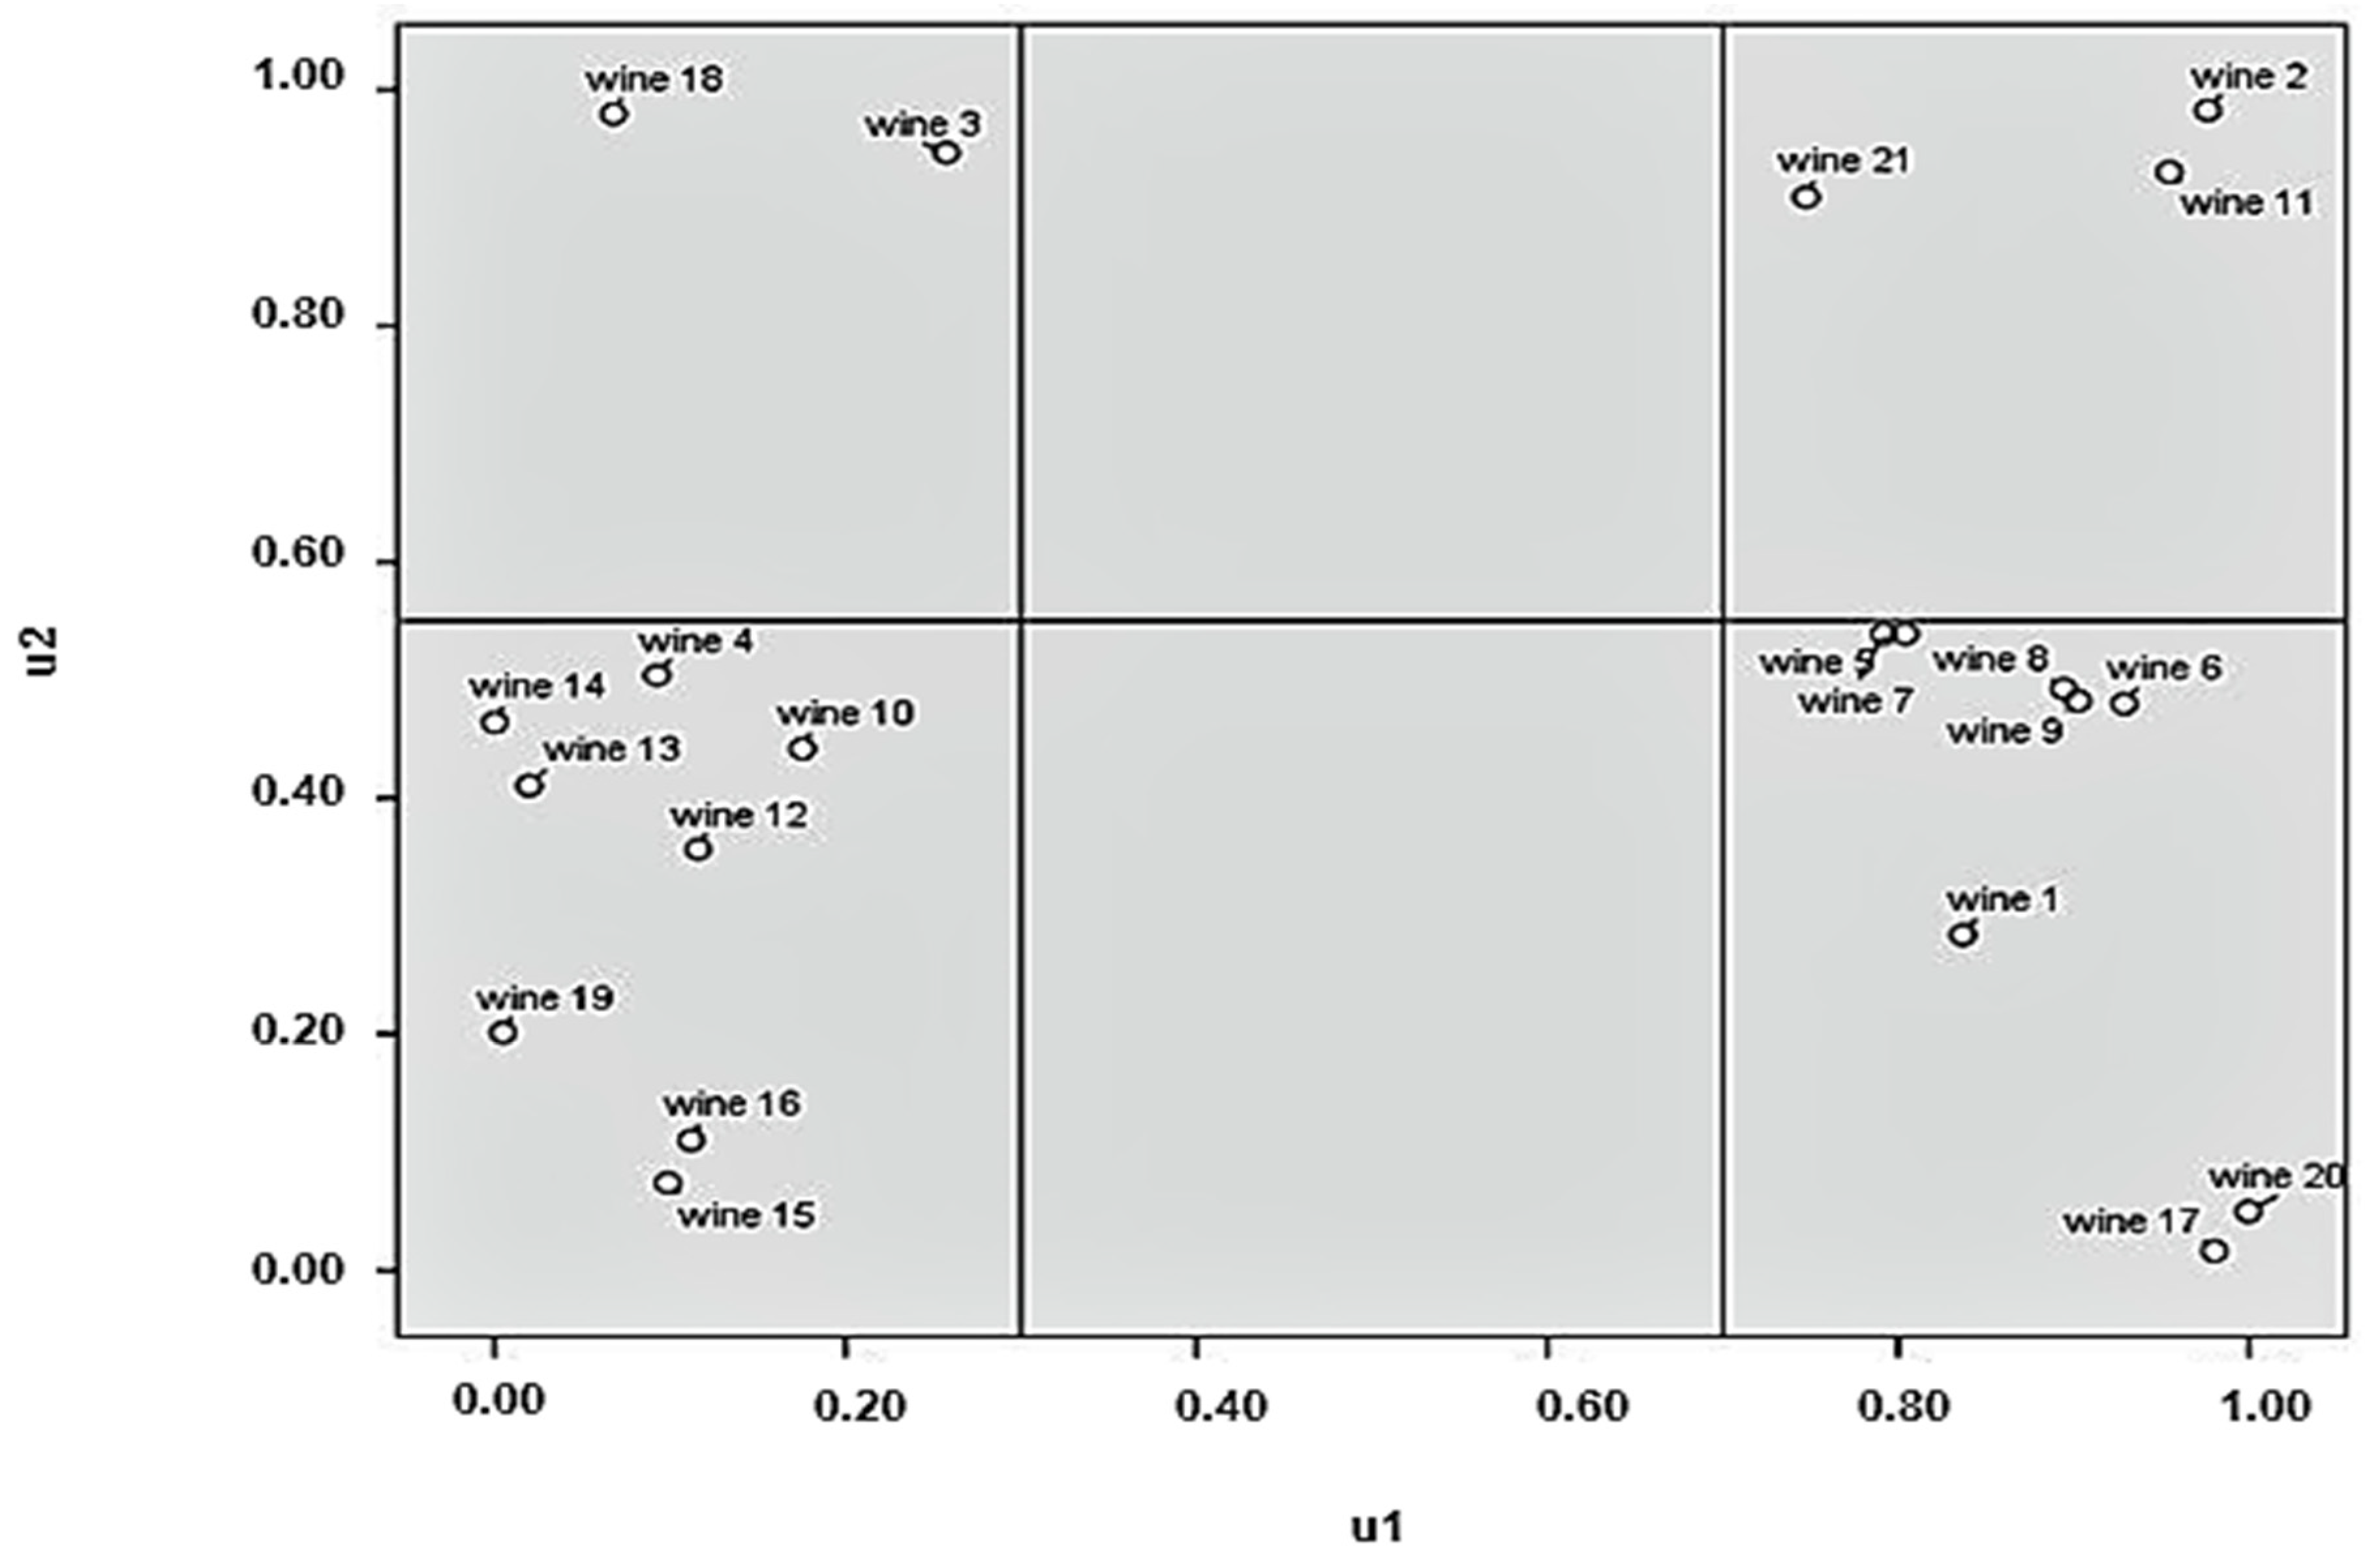
In order to develop a graphical representation that may be used as a tag for each wine bottle, providing to the customer information about the environmental efficiency of the product, we could use the two score variables that follow a normal distribution (the x-axis of Figure 4). The problem with using this approach is that the domain of the normal distribution is [−∞, +∞] thus, following Georgakelos and Bersimis [7], we use two p-value like statistics, say , by defining and , where each follows a uniform distribution in [0, 1]. Using these transformations, as in Figure 5, we can observe the ordering of the variables, as well as their relative distances. Furthermore, the domain of , is [0, 1].
In Figure 5, the x-axis describes the impact type (atmospheric emissions and water consumption and waste), and the y-axis describes the impact severity (overall environmental impact). In this graph, Wine 2, Wine 11 and Wine 21 are products with high pollution severity and increased atmospheric emissions and water consumption, and wines in the bottom left quadrilateral are products with less overall environmental impact versus products that are in the top right quadrilateral. The level of the impact severity is related mainly to a high volume of waste.
4. Discussion and Conclusions
Wine production is not an environmentally impact-free procedure. Lifecycle thinking has been used to examine the environmental performance of wine in various case studies [52]. On the other hand, PCA has been used as an approach to study relationships among different environmental criteria which may be defined via lifecycle assessment metrics, as in various previous studies, as for instance in the environmental impact of hydrogen infrastructure [53], the sustainability performance assessment of electric vehicle technologies [54], and the assessment of the sustainability performance of United States manufacturing and transportation industries [55]. The PCA approach was also applied for classification of Greek red wines in terms of their geographical origin [56]. These results were broadly in line with the findings of our study; this approach can be used for the evaluation of sustainability performance of the addressed system.
In this study, PCA was adapted in order to create appropriate indicators for the categorization of specific wine products, in relation to the environmental effects of their production. The assumptions could be addressed in future studies. The proposed approach can be easily adapted to handling the data of wine production outside of Greece.
Regarding the present study, the LCA methodology was used, together with an appropriate tool based on PCA and on probability distributions, providing an objective framework for the evaluation of the environmental performance of products. Specifically, this framework is a well-defined probabilistic method based on the celebrated PCA method. It is robust and does not heavily depend on the size of the data set at hand, it is quite simple to use, and it offers an easy to understand graphical representation. From the application of the proposed framework, as presented above, the tool was used for categorizing the examined wines according to their environmental impact severity, as well as the impact types associated with them. Moreover, it is easily customizable depending on the demands of the comparison. It could be standardized and easily integrated into most LCA software. Finally, it gives a comprehensible outcome, as it leads to a single tag that could inform about environmental performance of a given product in a clearly comparable way.
Author Contributions
Conceptualization, methodology, writing—review and editing D.D., E.D., S.B. and D.G. All authors have read and agreed to the published version of the manuscript.
Funding
The APC was funded by the University of Piraeus Research Center.
Acknowledgments
The publication of this paper was partly supported by the University of Piraeus Research Center.
Conflicts of Interest
The authors declare no conflict of interest. The funders had no role in the design of the study; in the collection, analyses, or interpretation of data; in the writing of the manuscript, or in the decision to publish the results.
References
- Beltrán-Esteve, M.; Picazo-Tadeo, A.J. Assessing environmental performance trends in the transport industry: Eco-innovation or catching-up? Energy Econ. 2015, 51, 570–580. [Google Scholar] [CrossRef]
- Ingram, D.L. HO-90: Life Cycle Assessment—Implications for the Green Industry 4; University of Kentucky College of Agriculture: Lexington, KY, USA, 2011. [Google Scholar]
- Alkhayyal, B.; Labib, W.; Alsulaiman, T.; Abdelhadi, A. Analyzing Sustainability Awareness among Higher Education Faculty Members: A Case Study in Saudi Arabia. Sustainability 2019, 11, 6837. [Google Scholar] [CrossRef] [Green Version]
- Herghiligiu, I.V.; Robu, I.-B.; Pislaru, M.; Vilcu, A.; Asandului, A.L.; Avasilcăi, S.; Balan, C. Sustainable Environmental Management System Integration and Business Performance: A Balance Assessment Approach Using Fuzzy Logic. Sustainability 2019, 11, 5311. [Google Scholar] [CrossRef] [Green Version]
- Gharizadeh Beiragh, R.; Alizadeh, R.; Shafiei Kaleibari, S.; Cavallaro, F.; Zolfani, S.H.; Bausys, R.; Mardani, A. An integrated Multi-Criteria Decision Making Model for Sustainability Performance Assessment for Insurance Companies. Sustainability 2020, 12, 789. [Google Scholar] [CrossRef] [Green Version]
- Zamagni, A. Life cycle sustainability assessment. Int. J. Life Cycle Assess. 2012, 17, 373–376. [Google Scholar] [CrossRef] [Green Version]
- Huybrechts, D.; Berloznik, R.; Wouters, G.; Marion, J.-Y.; Valenduc, G.; Vendramin, P. The role of ecobalances in environmental decision-making. J. Clean. Prod. 1996, 4, 111–119. [Google Scholar] [CrossRef]
- Steen, B. Environmental costs and benefits in life cycle costing. Manag. Environ. Qual. Int. J. 2005, 16, 107–118. [Google Scholar] [CrossRef]
- Georgakellos, D.A. Climate change external cost appraisal of electricity generation systems from a life cycle perspective: The case of Greece. J. Clean. Prod. 2012, 32, 124–140. [Google Scholar] [CrossRef]
- Rowland-Jones, R.; Pryde, M.; Cresser, M. An evaluation of current environmental management systems as indicators of environmental performance. Manag. Environ. Qual. Int. J. 2005, 16, 211–219. [Google Scholar] [CrossRef]
- Hermann, B.G.; Kroeze, C.; Jawjit, W. Assessing environmental performance by combining life cycle assessment, multi-criteria analysis and environmental performance indicators. J. Clean. Prod. 2007, 15, 1787–1796. [Google Scholar] [CrossRef] [Green Version]
- Publications Office of the EU. Monitor-Sast Activity: Strategic Analysis in Science and Technology Technological Innovation in the Plastics Industry and Its Influence on the Environmental Problems of Plastic Waste (Sast Project No 7) Strategic Dossier. Available online: http://op.europa.eu/en/publication-detail/-/publication/21aa6ef9-d1a7-11e6-ad7c-01aa75ed71a1 (accessed on 22 September 2020).
- Bersimis, S.; Georgakellos, D. A probabilistic framework for the evaluation of products’ environmental performance using life cycle approach and Principal Component Analysis. J. Clean. Prod. 2013, 42, 103–115. [Google Scholar] [CrossRef]
- Principal Component Analysis—An Overview|ScienceDirect Topics. Available online: https://0-www-sciencedirect-com.brum.beds.ac.uk/topics/medicine-and-dentistry/principal-component-analysis (accessed on 26 October 2020).
- Chu, K.; Liu, W.; She, Y.; Hua, Z.; Tan, M.; Liu, X.; Gu, L.; Jia, Y. Modified Principal Component Analysis for Identifying Key Environmental Indicators and Application to a Large-Scale Tidal Flat Reclamation. Water 2018, 10, 69. [Google Scholar] [CrossRef] [Green Version]
- Borsellino, V.; Migliore, G.; D’Acquisto, M.; Franco, C.P.D.; Asciuto, A.; Schimmenti, E. ‘Green’ Wine through a Responsible and Efficient Production: A Case Study of a Sustainable Sicilian Wine Producer. Agric. Agric. Sci. Procedia 2016, 8, 186–192. [Google Scholar] [CrossRef] [Green Version]
- Merli, R.; Preziosi, M.; Acampora, A. Sustainability experiences in the wine sector: Toward the development of an international indicators system. J. Clean. Prod. 2018, 172, 3791–3805. [Google Scholar] [CrossRef]
- Santiago-Brown, I.; Metcalfe, A.; Jerram, C.; Collins, C. Sustainability Assessment in Wine-Grape Growing in the New World: Economic, Environmental, and Social Indicators for Agricultural Businesses. Sustainability 2015, 7, 8178–8204. [Google Scholar] [CrossRef] [Green Version]
- Schäufele, I.; Hamm, U. Consumers’ perceptions, preferences and willingness-to-pay for wine with sustainability characteristics: A review. J. Clean. Prod. 2017, 147, 379–394. [Google Scholar] [CrossRef]
- Lockshin, L.; Corsi, A.M. Consumer behaviour for wine 2.0: A review since 2003 and future directions. Wine Econ. Policy 2012, 1, 2–23. [Google Scholar] [CrossRef] [Green Version]
- Baird, T.; Hall, C.M.; Castka, P. New Zealand Winegrowers Attitudes and Behaviours towards Wine Tourism and Sustainable Winegrowing. Sustainability 2018, 10, 797. [Google Scholar] [CrossRef] [Green Version]
- Pomarici, E.; Vecchio, R. Will sustainability shape the future wine market? Wine Econ. Policy 2019, 8, 1–4. [Google Scholar] [CrossRef]
- Fotopoulos, C.; Krystallis, A.; Ness, M. Wine produced by organic grapes in Greece: Using means—End chains analysis to reveal organic buyers’ purchasing motives in comparison to the non-buyers. Food Qual. Prefer. 2003, 14, 549–566. [Google Scholar] [CrossRef]
- Poulsen, C.; Mønsted, M. Identity markers for wine producers: Terroir and beyond. J. Wine Res. 2020, 31, 194–217. [Google Scholar] [CrossRef]
- Sellers, R. Would you Pay a Price Premium for a Sustainable Wine? The Voice of the Spanish Consumer. Agric. Agric. Sci. Procedia 2016, 8, 10–16. [Google Scholar] [CrossRef] [Green Version]
- Nowak, L.I.; Washburn, J.H. Building Brand Equity: Consumer Reactions to Proactive Environmental Policies by the Winery. Int. J. Wine Mark. 2002, 14, 5–19. [Google Scholar] [CrossRef]
- Gabzdylova, B.; Raffensperger, J.F.; Castka, P. Sustainability in the New Zealand wine industry: Drivers, stakeholders and practices. J. Clean. Prod. 2009, 17, 992–998. [Google Scholar] [CrossRef]
- Fusi, A.; Guidetti, R.; Benedetto, G. Delving into the environmental aspect of a Sardinian white wine: From partial to total life cycle assessment. Sci. Total Environ. 2014, 472, 989–1000. [Google Scholar] [CrossRef] [Green Version]
- Heller, M. Food Product Environmental Footprint Literature Summary: Wine. Available online: https://www.oregon.gov/deq/FilterDocs/PEF-Wine-FullReport.pdf (accessed on 26 November 2020).
- Rinaldi, S.; Bonamente, E.; Scrucca, F.; Merico, M.C.; Asdrubali, F.; Cotana, F. Water and Carbon Footprint of Wine: Methodology Review and Application to a Case Study. Sustainability 2016, 8, 621. [Google Scholar] [CrossRef] [Green Version]
- Iannone, R.; Miranda, S.; Riemma, S.; De Marco, I. Improving environmental performances in wine production by a life cycle assessment analysis. J. Clean. Prod. 2016, 111, 172–180. [Google Scholar] [CrossRef]
- Point, E.; Tyedmers, P.; Naugler, C. Life cycle environmental impacts of wine production and consumption in Nova Scotia, Canada. J. Clean. Prod. 2012, 27, 11–20. [Google Scholar] [CrossRef]
- Scrucca, F.; Bonamente, E.; Rinaldi, S. Chapter 7—Carbon Footprint in the Wine Industry. In Environmental Carbon Footprints; Muthu, S.S., Ed.; Butterworth-Heinemann: Oxford, UK, 2018; pp. 161–196. ISBN 978-0-12-812849-7. [Google Scholar] [CrossRef]
- Aivazidou, E.; Tsolakis, N. A Water Footprint Review of Italian Wine: Drivers, Barriers, and Practices for Sustainable Stewardship. Water 2020, 12, 369. [Google Scholar] [CrossRef] [Green Version]
- Bonamente, E.; Scrucca, F.; Asdrubali, F.; Cotana, F.; Presciutti, A. The Water Footprint of the Wine Industry: Implementation of an Assessment Methodology and Application to a Case Study. Sustainability 2015, 7, 12190–12208. [Google Scholar] [CrossRef] [Green Version]
- Gierling, F.; Blanke, M. Carbon reduction strategies for regionally produced and consumed wine: From farm to fork. J. Environ. Manag. 2020, 278, 111453. [Google Scholar] [CrossRef] [PubMed]
- Muñoz-González, C.; Rodríguez-Bencomo, J.J.; Martín-Álvarez, P.J.; Moreno-Arribas, M.V.; Pozo-Bayón, M.Á. Recovery of Aromatic Aglycones from Grape Pomace Winemaking By-Products by Using Liquid-Liquid and Pressurized-Liquid Extraction. Food Anal. Methods 2014, 7, 47–57. [Google Scholar] [CrossRef] [Green Version]
- Christ, K.L.; Burritt, R.L. Critical environmental concerns in wine production: An integrative review. J. Clean. Prod. 2013, 53, 232–242. [Google Scholar] [CrossRef]
- Ginon, E.; Ares, G.; Laboissière, L.H.E.; Dos, S.; Brouard, J.; Issanchou, S.; Deliza, R. Logos indicating environmental sustainability in wine production: An exploratory study on how do Burgundy wine consumers perceive them. Food Res. Int. 2014, 62, 837–845. [Google Scholar] [CrossRef] [Green Version]
- Environmental Friendly Wines: A Consumer Segmentation Study|Elsevier Enhanced Reader. Available online: https://0-reader-elsevier-com.brum.beds.ac.uk/reader/sd/pii/S2210784316300675?token=DEEA6FB661CD58D2E2BBA90A1EE8B4A09037B5EB2A8AE922BBE32411BB60728AAB571C73A62A541EB7F0402218D7F0A0 (accessed on 21 September 2020).
- Ene, S.A.; Teodosiu, C.; Robu, B.; Volf, I. Water footprint assessment in the winemaking industry: A case study for a Romanian medium size production plant. J. Clean. Prod. 2013, 43, 122–135. [Google Scholar] [CrossRef]
- Devesa-Rey, R.; Vecino, X.; Varela-Alende, J.L.; Barral, M.T.; Cruz, J.M.; Moldes, A.B. Valorization of winery waste vs. the costs of not recycling. Waste Manag. 2011, 31, 2327–2335. [Google Scholar] [CrossRef]
- Oliveira, M.; Duarte, E. Integrated approach to winery waste: Waste generation and data consolidation. Front. Environ. Sci. Eng. 2016, 10, 168–176. [Google Scholar] [CrossRef]
- Muhlack, R.A.; Potumarthi, R.; Jeffery, D.W. Sustainable wineries through waste valorisation: A review of grape marc utilisation for value-added products. Waste Manag. 2018, 72, 99–118. [Google Scholar] [CrossRef]
- Ahmad, B.; Yadav, V.; Yadav, A.; Rahman, M.U.; Yuan, W.Z.; Li, Z.; Wang, X. Integrated biorefinery approach to valorize winery waste: A review from waste to energy perspectives. Sci. Total Environ. 2020, 719, 137315. [Google Scholar] [CrossRef]
- Landi, D.; Germani, M.; Marconi, M. Analyzing the environmental sustainability of glass bottles reuse in an Italian wine consortium. Procedia CIRP 2019, 80, 399–404. [Google Scholar] [CrossRef]
- Staffell, I. The Energy and Fuel Data Sheet 11; University of Birmingham: Birmingham, UK, 2011. [Google Scholar]
- Spielmann, M.; Bauer, C.; Dones, R.; Institut, P.S.; Tuchschmid, M. Transport Services; Ecoinvent Report, No. 14; Swiss Centre for Life Cycle Inventories: Dübendorf, Switzerland, 2007. [Google Scholar]
- Georgakellos, D.A. Impact of a possible environmental externalities internalisation on energy prices: The case of the greenhouse gases from the Greek electricity sector. Energy Econ. 2010, 32, 202–209. [Google Scholar] [CrossRef]
- Georgakellos, D.A. Evaluation of life cycle inventory results using critical volume aggregation and polygon-based interpretation. J. Clean. Prod. 2005, 13, 567–582. [Google Scholar] [CrossRef]
- Feller, W. An Introduction to Probability Theory and Its Applications, 3rd ed.; Wiley Series in Probability and Statistics; Wiley: New York, NY, USA, 1968; Volume 1. [Google Scholar]
- Petti, L.; Arzoumanidis, I.; Benedetto, G.; Bosco, S.; Cellura, M.; De Camillis, C.; Fantin, V.; Masotti, P.; Pattara, C.; Raggi, A.; et al. Life Cycle Assessment in the Wine Sector. In Life Cycle Assessment in the Agri-Food Sector; Notarnicola, B., Salomone, R., Petti, L., Renzulli, P.A., Roma, R., Cerutti, A.K., Eds.; Springer: Cham, Germany, 2015; pp. 123–184. ISBN 978-3-319-11939-7. [Google Scholar]
- Sabio, N.; Kostin, A.; Guillén-Gosálbez, G.; Jiménez, L. Holistic minimization of the life cycle environmental impact of hydrogen infrastructures using multi-objective optimization and principal component analysis. Int. J. Hydrogen Energy 2012, 37, 5385–5405. [Google Scholar] [CrossRef]
- Onat, N.C.; Kucukvar, M.; Afshar, S. Eco-efficiency of electric vehicles in the United States: A life cycle assessment based principal component analysis. J. Clean. Prod. 2019, 212, 515–526. [Google Scholar] [CrossRef]
- Park, Y.S.; Egilmez, G.; Kucukvar, M. A Novel Life Cycle-based Principal Component Analysis Framework for Eco-efficiency Analysis: Case of the United States Manufacturing and Transportation Nexus. J. Clean. Prod. 2015, 92, 327–342. [Google Scholar] [CrossRef]
- Kallithraka, S.; Arvanitoyannis, I.S.; Kefalas, P.; El-Zajouli, A.; Soufleros, E.; Psarra, E. Instrumental and sensory analysis of Greek wines; implementation of principal component analysis (PCA) for classification according to geographical origin. Food Chem. 2001, 73, 501–514. [Google Scholar] [CrossRef]
Figure 1.
The wine life cycle assessment (LCA) system.

Figure 2.
The correlation structure.

Figure 3.
Products in the principal component (PC) space.

Figure 4.
Categories based on a normal distribution.

Figure 5.
Products in the u1, u2 space.


Table 1.
The wines under examination.
| Wine | Wine Name | Glass Bottle Volume |
|---|---|---|
| Wine Producer A | ||
| 1 | Dry white wine with PDO Mantinia (variety Moschofilero) | 0.75 L |
| 2 | Dry white wine with PGI Arkadia (variety Chardonnay) | 0.75 L |
| 3 | Dry white wine with PGI Arkadia (variety Gewürztraminer) | 0.75 L |
| 4 | Dry white wine with PGI Arkadia (variety Moschofilero) | 0.75 L |
| 5 | Dry red wine with PGI Arkadia (varieties Cabernet Sauvignon 60% & Merlot 40%) | 0.75 L |
| 6 | Dry red wine with PGI Arkadia (variety Cabernet Sauvignon) | 0.75 L |
| 7 | Dry red wine with PGI Arkadia (variety Cabernet Sauvignon) | 1.5 L |
| 8 | Dry red wine with PGI Arkadia (variety Merlot) | 0.75 L |
| 9 | Dry red wine with PGI Arkadia (variety Merlot) | 1.5 L |
| Wine Producer B | ||
| 10 | Dry white wine with PDO Mantinia (variety Moschofilero) | 0.75 L |
| 11 | Dry white wine with PGI Peloponnese (variety Moschofilero) | 0.187 L |
| 12 | Dry white wine with PGI Peloponnese (variety Moschofilero) | 0.75 L |
| 13 | Dry white wine with PGI Peloponnese (variety Moschofilero) | 1 L |
| 14 | Dry white wine with PGI Peloponnese (variety Moschofilero) | 1.5 L |
| Wine Producer C | ||
| 15 | Dry white wine with PDO Mantinia (variety Moschofilero) | 0.75 L |
| 16 | Dry white wine with PGI Arkadia (variety Moschofilero) | 0.75 L |
| 17 | Dry white wine with PGI Arkadia (variety Moschofilero) | 0.187 L |
| Wine Producer D | ||
| 18 | Dry white wine with PGI Arkadia Organic wine (variety Chardonnay) | 0.75 L |
| 19 | Dry white wine with PDO Mantinia Organic wine (variety Moschofilero) | 0.75 L |
| 20 | Dry white wine with PDO Mantinia Organic wine (variety Moschofilero) | 0.187 L |
| Wine Producer E | ||
| 21 | Dry white wine with PDO Mantinia Organic wine (variety Moschofilero) | 0.75 L |
Table 2.
The ecological parameters of the examined wines.
| Wine Case | Energy Consumption | Water Consumption | Atmospheric Emissions | Waterborne Waste | Solid Waste |
|---|---|---|---|---|---|
| 1 | 58,409.62 | 4062.936 | 93.56119 | 0.003603 | 350,469.5 |
| 2 | 63,947.32 | 4673.311 | 253.5669 | 0.003689 | 375,899.3 |
| 3 | 50,201.67 | 4131.753 | 197.9424 | 0.002649 | 292,629.2 |
| 4 | 45,905.83 | 3786.492 | 100.8182 | 0.002610 | 274,069.4 |
| 5 | 60,009.37 | 4145.206 | 128.6781 | 0.003419 | 335,532.0 |
| 6 | 61,758.98 | 4131.451 | 132.1308 | 0.003916 | 346,109.4 |
| 7 | 57,901.07 | 4055.615 | 132.1335 | 0.003463 | 342,653.3 |
| 8 | 61,628.46 | 4251.451 | 123.4663 | 0.003443 | 364,126.7 |
| 9 | 61,581.27 | 4258.551 | 122.5133 | 0.003471 | 366,971.4 |
| 10 | 50,895.07 | 2441.274 | 147.1317 | 0.002960 | 291,183.6 |
| 11 | 62,781.08 | 5341.114 | 184.2812 | 0.003544 | 351,428.9 |
| 12 | 50,690.39 | 2303.374 | 134.2814 | 0.002962 | 269,301.2 |
| 13 | 44,942.03 | 2178.969 | 133.6862 | 0.002651 | 243,021.8 |
| 14 | 36,052.20 | 1990.055 | 122.6803 | 0.001959 | 198,568.1 |
| 15 | 49,535.25 | 1638.338 | 89.9062 | 0.002891 | 301,749.6 |
| 16 | 49,744.29 | 1662.948 | 104.3814 | 0.002997 | 295,637.8 |
| 17 | 68,311.02 | 2205.762 | 82.75477 | 0.004305 | 405,062.8 |
| 18 | 45,924.65 | 4215.047 | 208.8663 | 0.002485 | 236,961.7 |
| 19 | 43,965.65 | 2350.547 | 78.93158 | 0.002269 | 228,084.3 |
| 20 | 75,836.32 | 3438.415 | 86.34699 | 0.004459 | 438,746.3 |
| 21 | 59,311.02 | 3366.230 | 230.8571 | 0.003320 | 339,412.8 |
Table 3.
Correlations.
| Variables | Energy Consumption | Water Consumption | Atmospheric Emissions | Waterborne Waste | Solid Waste |
|---|---|---|---|---|---|
| Energy Consumption | 1.000 | 0.472 | 0.036 NS,* | 0.972 | 0.979 |
| Water Consumption | 1.000 | 0.492 | 0.363 | 0.435 | |
| Atmospheric Emissions | 1.000 | −0.064 NS | −0.014 NS | ||
| Waterborne Waste | 1.000 | 0.962 | |||
| Solid Waste | 1.000 |
* NS: non-significant.
Table 4.
Principal component analysis (PCA) results.
| PC | Variance Explained | Energy Consumption | Water Consumption | Atmospheric Emissions | Waterborne Waste | Solid Waste | PC Interpretation |
|---|---|---|---|---|---|---|---|
| PC1 | 63.9% | 0.55 | 0.33 | 0.07 | 0.54 | 0.55 | Pollution Severity |
| PC2 | 27.4% | –0.10 | 0.57 | 0.78 | −0.20 | −0.14 | Pollution Mark |
Table 5.
Means of index of pollution severity per glass bottle volume.
| Glass Bottle Volume | N | Mean | StDev | 95% CI |
|---|---|---|---|---|
| 0.187 L | 3 | 2.348 | 0.840 | (0.444, 4.252) |
| 0.75 L | 14 | −0.248 | 1.399 | (−1.130, 0.633) |
| 1.5 L | 3 | −0.50 | 2.71 | (−2.41, 1.40) |
Pooled StDev = 1.56310.
Publisher’s Note: MDPI stays neutral with regard to jurisdictional claims in published maps and institutional affiliations. |
© 2020 by the authors. Licensee MDPI, Basel, Switzerland. This article is an open access article distributed under the terms and conditions of the Creative Commons Attribution (CC BY) license (http://creativecommons.org/licenses/by/4.0/).
Share and Cite
MDPI and ACS Style
Dede, D.; Didaskalou, E.; Bersimis, S.; Georgakellos, D. A Statistical Framework for Assessing Environmental Performance of Quality Wine Production. Sustainability 2020, 12, 10246. https://0-doi-org.brum.beds.ac.uk/10.3390/su122410246
AMA Style
Dede D, Didaskalou E, Bersimis S, Georgakellos D. A Statistical Framework for Assessing Environmental Performance of Quality Wine Production. Sustainability. 2020; 12(24):10246. https://0-doi-org.brum.beds.ac.uk/10.3390/su122410246
Chicago/Turabian StyleDede, Despoina, Eleni Didaskalou, Sotirios Bersimis, and Dimitrios Georgakellos. 2020. "A Statistical Framework for Assessing Environmental Performance of Quality Wine Production" Sustainability 12, no. 24: 10246. https://0-doi-org.brum.beds.ac.uk/10.3390/su122410246
Note that from the first issue of 2016, this journal uses article numbers instead of page numbers. See further details here.