Article

Influence of Tree Vegetation on Soil Microbial Communities in Temperate Forests and Their Potential as a Proactive Indicator of Vegetation Shift Due to Climate Change

1
Division of Environmental Science & Ecological Engineering, College of Life Sciences & Biotechnology, Korea University, Seoul 02841, Korea
2
Department of Environmental Science and Engineering, Kyung Hee University, Yongin 17104, Korea
3
Microorganism Resources Division, National Institute of Biological Resources, Incheon 22689, Korea
*
Author to whom correspondence should be addressed.
These authors contributed equally to this work.
Sustainability 2020, 12(24), 10591; https://0-doi-org.brum.beds.ac.uk/10.3390/su122410591
Submission received: 23 November 2020 / Revised: 15 December 2020 / Accepted: 16 December 2020 / Published: 18 December 2020
(This article belongs to the Special Issue Fungal Diversity and Sustainability)

Abstract

:
Unexpected vegetation shift is a serious problem caused by climate change, resulting in considerable damage to local communities. It is necessary to be continuously monitored, and the soil microbial community is expected to reflect the pressure on forest ecosystems due to climate change. We investigated soil bacterial and fungal communities in Odaesan at a four-year interval through eDNA meta-barcoding and analyzed the compositional and functional differences between forest types (Mongolian oak (Quercus mongolica) forest with and without Manchurian firs (Abies holophylla)) and sampling years. As a result, denitrifiers predominated in the presence of Manchurian firs, but there was no difference in the influence of climate change by forest type. Although tree vegetation remained stable, the microbial communities significantly changed over four years. This result demonstrates that climate change significantly shifts the microbial communities, even if not enough to trigger a vegetation shift, thus a microbial indicator can be developed to assess the press disturbance accumulated on the forest ecosystem. Through this study, we identified the influence of Manchurian firs and that of climate change on soil microbial communities in temperate forests and demonstrated the potential of the microbial community as a proactive indicator of vegetation shift due to climate change.

1. Introduction

Currently, climate change is one of the greatest concerns for humanity. It is causing a variety of problems, one of which is forest vegetation shift. The vegetation shift due to climate change causes direct or indirect economic damage to local communities, such as the loss of indigenous bioresources and cultural tourism resources, which can be fatal depending on the country or region. It can also increase the probability, intensity and extension of ecological perturbations, and even affect local climate. Therefore, it is necessary to continuously monitor, manage and respond vegetation shifts appropriately. Recently, the mortality rate of conifers in the subalpine zone in Odaesan National Park, such as Korean fir (Abies koreana), Khingan fir (Abies nephrolepis), and Yezo spruce (Picea jezoensis), has increased rapidly due to climate change [1]. The colonies of Manchurian fir (Abies holophylla), the main subalpine conifer of Odaesan, are still stable, but many experts warn that they are under threat as climate change continues [1]. Monitoring vegetation itself is effective in detecting vegetation shifts and responding to subsequent changes but not for predicting and assessing them in advance. Vegetation shift occurs when the selection pressure exerted on forest ecosystems exceeds the limit of adaptation of existing vegetation. We expected that the soil microbial community could reflect the pressure on forest ecosystems due to climate change because they are more sensitive to environmental disturbances than plants [2].
Understanding the structure and characteristics of soil microbial communities in forests and their responses to climate change is important for sustainable forest management. Soil microorganisms are essential components involved in a variety of important processes in forest ecosystems [3]. They have various relationships with plants, such as litter decomposition and nitrogen fixation, which makes nitrogen available to plants, and until now it has been assumed that their composition varies depending on the vegetation [2]. In this context, soil microbial communities are considered to reflect the state of the forest ecosystem, and the influence of climate change on soil microbial communities has been studied in various ways. However, since most of the studies have analyzed microbial communities using techniques with low taxonomic specificity, such as phospholipid fatty acid analysis and denaturing gradient gel electrophoresis analysis, it was not possible to accurately identify microorganisms affected by climate change [4,5]. This might be due to the short read length and high cost of the meta-sequencing techniques in the past, but continuous technological progress has greatly enhanced the read length and cost of high-throughput sequencing (HTS) [4]. Since the maximum read length of the current HTS technology is long enough to read most of the barcode sequences, environmental microorganisms can be identified to a low taxonomic level through eDNA meta-barcoding using HTS. This technological advance enabled more accurate and detailed analysis of the forest soil microbial community. Furthermore, the improved taxonomic specificity of meta-barcoding has enabled genome-based prediction of the functional abundance of microbial communities.
To study the influence of long-term factors such as climate change in natural environments other than laboratory facilities, unpredictable variables should be excluded as much as possible. In this respect, stable forests are advantageous in controlling the variables. Odaesan has well-preserved forests with more advanced ecological succession than that in other forest areas in central South Korea [6]. The broad-leaved trees and conifers in the forests of Odaesan mostly consist of Mongolian oaks (Quercus mongolica) and Manchurian firs, respectively, which are shade-tolerant trees [7,8]. Since the shade-tolerant trees are relatively free from canopy competition due to their low need for light, the two species coexist in many areas of Odaesan, and the mixed forest is the main type of forest distributed in Odaesan along with the Mongolian oak forest. These shade-tolerant forests are regarded as the last stage of forest succession, formally called climax, where vegetation reaches equilibrium and remains stable [9]. Besides, the annual climate data in Odaesan region showed that annual precipitation has been steadily decreasing and that the sunshine duration has been increasing over the past 15 years, resulting in a continuous decrease in relative humidity and an increase in temperature (Figure 1). Therefore, the forests of Odaesan are highly suitable for studying the influence of climate change on soil microbial communities.
Here, we investigated the soil bacterial and fungal communities in 15 areas of Odaesan at a four-year interval through amplicon-based MiSeq sequencing of the 16S V3–V4 region and internal transcribed spacer 2 (ITS2) region, respectively. Then, we analyzed the compositional and functional differences in the soil microbial communities between the forest types and the sampling years using various biostatistical techniques. The goals of this study were to investigate the differences in the structure and functions of soil microbial communities between the two main types of forest in Odaesan and to reveal the impact of climate change on them and evaluate the microbial community as a proactive indicator of vegetation shift.

2. Materials and Methods

2.1. Study Areas and Soil Sampling

Odaesan is a 1563 m a.s.l. high mountain at the border of Gangneung-si, Pyeongchang-gun, and Hongcheon-gun in Gangwon-do, South Korea (37°42′–52′ N 128°28′–46′ E) (Figure 2). It is located in the center of Baekdu-Daegan (1400 km in length), the largest mountain range, which crosses the Korean Peninsula from Baekdusan (2744 m a.s.l.) in North Korea to Jirisan (1563 m a.s.l.) in South Korea [2]. Fifteen sampling points were selected to capture differences in forest and topographical characteristics.
Decadal data are suitable for understanding trends in long-term factors, and three to five years is an appropriate sampling interval when targeting natural ecosystems, where controlling the variables is difficult [10]. Thus, we studied forest soil microbial communities at a four-year interval, which was sufficient to identify the factors that contribute to long-term changes. Sampling was conducted in September 2013 and 2017 to analyze the effect of long-term changes in the stable temperate forest. To exclude the temporary effects of rainfall, sampling was performed at least five days after rainfall events of over one millimeter. The climate data were obtained from the National Climate Data Center of the Korea Meteorological Administration. The mean annual temperatures in 2013 and 2017 were 7.5 and 7.3 °C, respectively. Fifty grams of topsoil (0–10 cm) samples were collected using a sterile 50 mL conical tube. The collected soil samples were filtered using a 2 mm sieve and stored at −80 °C until use.

2.2. Soil Properties Analysis

Environmental parameters in the forest soil samples were measured at the National Instrumentation Center for Environmental Management (NICEM, Seoul, Korea). The samples were air-dried and filtered through a 150 μm sieve and then used for analysis. The pH was measured in a 1:5 dilution of soil and distilled water using an HM-30R pH meter (DKK-TOA, Tokyo, Japan). The total organic carbon (TOC) contents were measured according to the Walkley–Black method [11]. The total nitrogen (TN) content was determined by the Kjeldahl method using a Kjeltec auto 2400/8400 system (Tecator AB, Hoganas, Sweden).

2.3. DNA Library Preparation and Amplicon Sequencing

Environmental DNA was extracted from 0.5 g of soil using a Power Soil DNA Isolation Kit (MoBio, Carlsbad, CA, USA) following the manufacturer’s instructions. Using the Illumina MiSeq platform, a DNA library was constructed by analyzing bacterial and fungal communities with 16S rRNA and ITS gene amplicons, respectively. The extracted DNA was amplified with primers specific to the V3-V4 region of the 16S rRNA gene (forward primer 5′-CCTACGGGNGGCWGCAG-3′; reverse primer 5′-GACTACHVGGGTATCTAATCC-3′) and to the ITS2 region (between 5.8S and 28S) of the fungal rRNA gene (forward primer 5′-GCATCGATGAAGAACGCAGC-3′; reverse primer 5′-TCCTCCGCTTATTGATATGC-3′) including the Illumina overhang adaptor (forward, 5′-TCGTCGGCAGCGTCAGATGTGTATAAGAGACAG-3′; reverse, 5′-GTCTCGTGGGCTCGGAGATGTGTATAAGAGACAG-3′). The PCR thermal cycling program consisted of 25 (bacterial amplification) and 8 cycles (fungal amplification) of denaturation at 95 °C for 30 sec, primer annealing at 55 °C for 30 sec, and extension at 72 °C for 30 sec, followed by 72 °C for five minutes. Paired-end read sequences were generated by HTS technology. The data underlying this article are available in the GenBank BioProject Database at https://0-www-ncbi-nlm-nih-gov.brum.beds.ac.uk/bioproject/679161, and can be accessed with PRJNA679161.

2.4. Sequence Processing and OTU Clustering

The sequences obtained from MiSeq were processed using QIIME 2 2019.10 [12]. Raw sequence data produced by the Illumina platform were demultiplexed and quality filtered using the q2-demux plugin followed by denoising with DADA2 [13] (via q2-dada2). All amplicon sequence variants (ASVs) were aligned with mafft [14] (via q2-alignment) and used to construct a phylogeny with fasttree2 [15] (via q2-phylogeny). Taxonomy was assigned to ASVs using the q2-feature-classifier [16] classify-sklearn naïve Bayes taxonomy classifier against the SILVA 132 and UNITE version 18.11.2018 99% OTU reference sequences [17,18]. Operational taxonomic units (OTUs) were clustered using VSEARCH [19] (via q2-vsearch). Functional abundances were predicted from the amplicon sequences using PICRUSt2 v2.3.0 [20].

2.5. Bioinformatics and Statistical Analysis

Bioinformatics and statistical analysis were performed with R version 3.5.3 [21]. Alpha diversity analysis, nonmetric multidimensional scaling (NMDS), and permutational multivariate analysis of variance (adonis2) were performed using the package “vegan” [22]. Indicator species analysis (ISA) and randomForest analysis were performed using the packages “labdsv” and “caret”, respectively [23,24]. The PICRUSt2 results were analyzed using STAMP v2.1.3 [25].

3. Results

3.1. Environmental Properties

The environmental properties of the soil samples collected from Odaesan are shown in Figure 3. There were significant differences in the soil properties by forest type. The soil pH was significantly higher and slightly acidic (range 4.6–6.5) in the mixed forests than in the broad-leave forests (range 4.0–5.1). TOC and TN were significantly lower in the mixed forest soils (4.8% and 0.37%, respectively) than in the broad-leaved forest soil (10.0% and 0.78%, respectively). On the other hand, there were no significant differences in any soil properties between the soil samples collected in 2013 and 2017.

3.2. Illumina Sequencing Results and Diversity Indices

The HTS of the bacterial and fungal DNA generated 2,698,341 and 3,930,234 reads and then were assembled into 892,389 and 3,066,202 OTUs, respectively (Table S1). The GC percentages in the sequence reads of the 16S rRNA V3-V4 region and the ITS2 region ranged from 45.6%–48.7% and 54.9%–57.2%, respectively. All downstream analyses were performed using these data.
The Shannon–Weiner and Gini–Simpson indices were estimated using the integrated microbial community data, including both bacterial and fungal OTUs of the forest soils, and were summarized in Table 1. Shannon–Weiner index values in the forest soils ranged from 4.20–5.32 (mean 4.72, n = 30), and Gini–Simpson index values ranged from 0.93–0.98 (mean 0.97, n = 30). The variation in the Shannon–Weiner index was only significant between the forest types, which was significantly higher (p = 0.05) in the mixed forests than in the broad-leaved forests. On the other hand, the variation in the Gini–Simpson index of the forest soils was not significant (p > 0.05). The maximum alpha diversity was observed in the soil sample P15 collected in 2017 and minimum in P9 in 2013 and P14 in 2017.
The NMDS plots were constructed based on the composition of the OTUs by calculating the Bray–Curtis dissimilarity index (Figure 4). The microbial communities were clustered by forest vegetation type and sampling year and showed more similarity in taxonomic composition. Similar results were obtained when only bacteria or fungi were analyzed separately, but the ordination of the bacterial communities (stress = 0.109) was more reliable than that of fungal communities (stress = 0.235). Permutational multivariate analysis of variance showed that the dissimilarity between the microbial communities by sampling vegetation (p = 0.001) or year (p = 0.001) was significant, and there was no significant interaction (p = 0.243) between the two variables. In addition, the influence of environmental factors, soil pH, TOC, TN, and altitude, on the composition of the microbial communities was elucidated by plotting the fitted data on the NMDS plot. As a result, soil pH, TOC and altitude appeared to be strong predictors of mixed forest and broad-leaved forest cluster directions, respectively. The mixed forests were found to be distributed at lower altitudes (approximately 900 m a.s.l.) than the broad-leaved forests, which is consistent with a report that Manchurian firs are rarely found above 1000 m in Korea, and the optimal potential habitat elevation was 903.2 m (Figure 2 and Figure 4) [26].

3.3. Microbial Community Compositions

The taxonomic distribution and relative abundance of the major genera are summarized in Figure 5, and the detailed composition of the soil samples is presented in Figure S1 and S2. In the case of bacteria, over half (53.2%) of the 16S rRNA sequences were related to Proteobacteria (29.0%) and Acidobacteria (24.2%), and they dominated all soil samples. In addition to these two phyla, Actinobacteria (11.1%), Verrucomicrobia (9.6%), and Bacteroidetes (7.6%) occupied a major portion of the mixed forest soils, while the broad-leaved soils were dominated by Chloroflexi (9.4%), Verrucomicrobia (9.1%), and Actinobacteria (7.7%). Actinobacteria (11.4%), Chloroflexi (9.9%), and Verrucomicrobia (9.5%) occupied a major portion of the 2013 samples, while the 2017 samples were dominated by Verrucomicrobia (9.2%), Bacteroidetes (8.7%), and Planctomycetes (8.1%), in addition to Proteobacteria and Acidobacteria. In the case of fungi, most (86.5%) of the ITS region sequences were related to Basidiomycota (42.4%), Ascomycota (32.5%), and Mortierellomycota (11.5%), and they dominated all soil samples. The relative abundance of Basidiomycota was higher in the broad-leaved forest soils (45.8%) than in the mixed forest soils (37.3%) and higher in the 2017 samples (45.3%) than in the 2013 samples (39.5%).
Furthermore, the sequences classified at the genus level varied among the sample groups, and the major genera (relative abundance of above 2%) of both bacteria and fungi occupied a higher proportion of the total abundance in the broad-leaved forest soils (85.6% and 96.9%) compared with the mixed forest soils (60.8% and 71.8%). Bacterial genera such as Candidatus Udaeobacter (10.4%), a Xanthobacteraceae genus (8.1%), Candidatus Solibacter (6.7%), Bryobacter (5.7%), an Acidobacteriia Subgroup 2 genus (5.4%), and an HSB OF53-F07 genus dominated the forest soil samples. In the case of the fungal genera, Mortierella (22.3%), Russula (10.8%), Sebacina (10.0%), and Solicoccozyma (6.9%) dominated.

3.4. Biomarkers and Their Correlations with Environmental Factors

The microbial communities were analyzed by forest type and sampling year using ISA and randomForest. To avoid statistical errors as much as possible, the microbial taxa of interest were selected considering the results of both analyses (Table S2 and Figure S3). In both analyses, most indicator genera represented mixed forest by forest type and 2017 by sampling year. As a result, Terrimonas, Helicodendron, Mesorhizobium, a Chloroflexi KD4-96 genus, Hyphomonadaceae SWB02, Pyrinomonadaceae RB41, and a genus of Pirellulaceae Pir4 lineage were identified as biomarkers for the mixed forest soils, and Fluviicola, Arcticibacter, a Parachlamydiaceae genus, Arachidicoccus, Asticcacaulis, a Sphingobacteriales env.OPS 17 genus, Mucilaginibacter, Massilia, and a Planctomycetes vadinHA49 genus for the soils in 2017.
To evaluate the correlation of the selected biomarkers and environmental factors, the Pearson correlation test was used. As shown in Figure 6, there were no significant correlations between the abundance of the biomarkers for soils in 2017 and any of the environmental variables. On the other hand, all the environmental factors with the abundance of the biomarkers for the mixed forest soils were significantly correlated. They were positively correlated with pH and negatively correlated with TOC, TN, and altitude. However, it is difficult to claim that these microbial genera have a specific causal relationship with the soil properties, since the soil properties were significantly different between the two forest types.

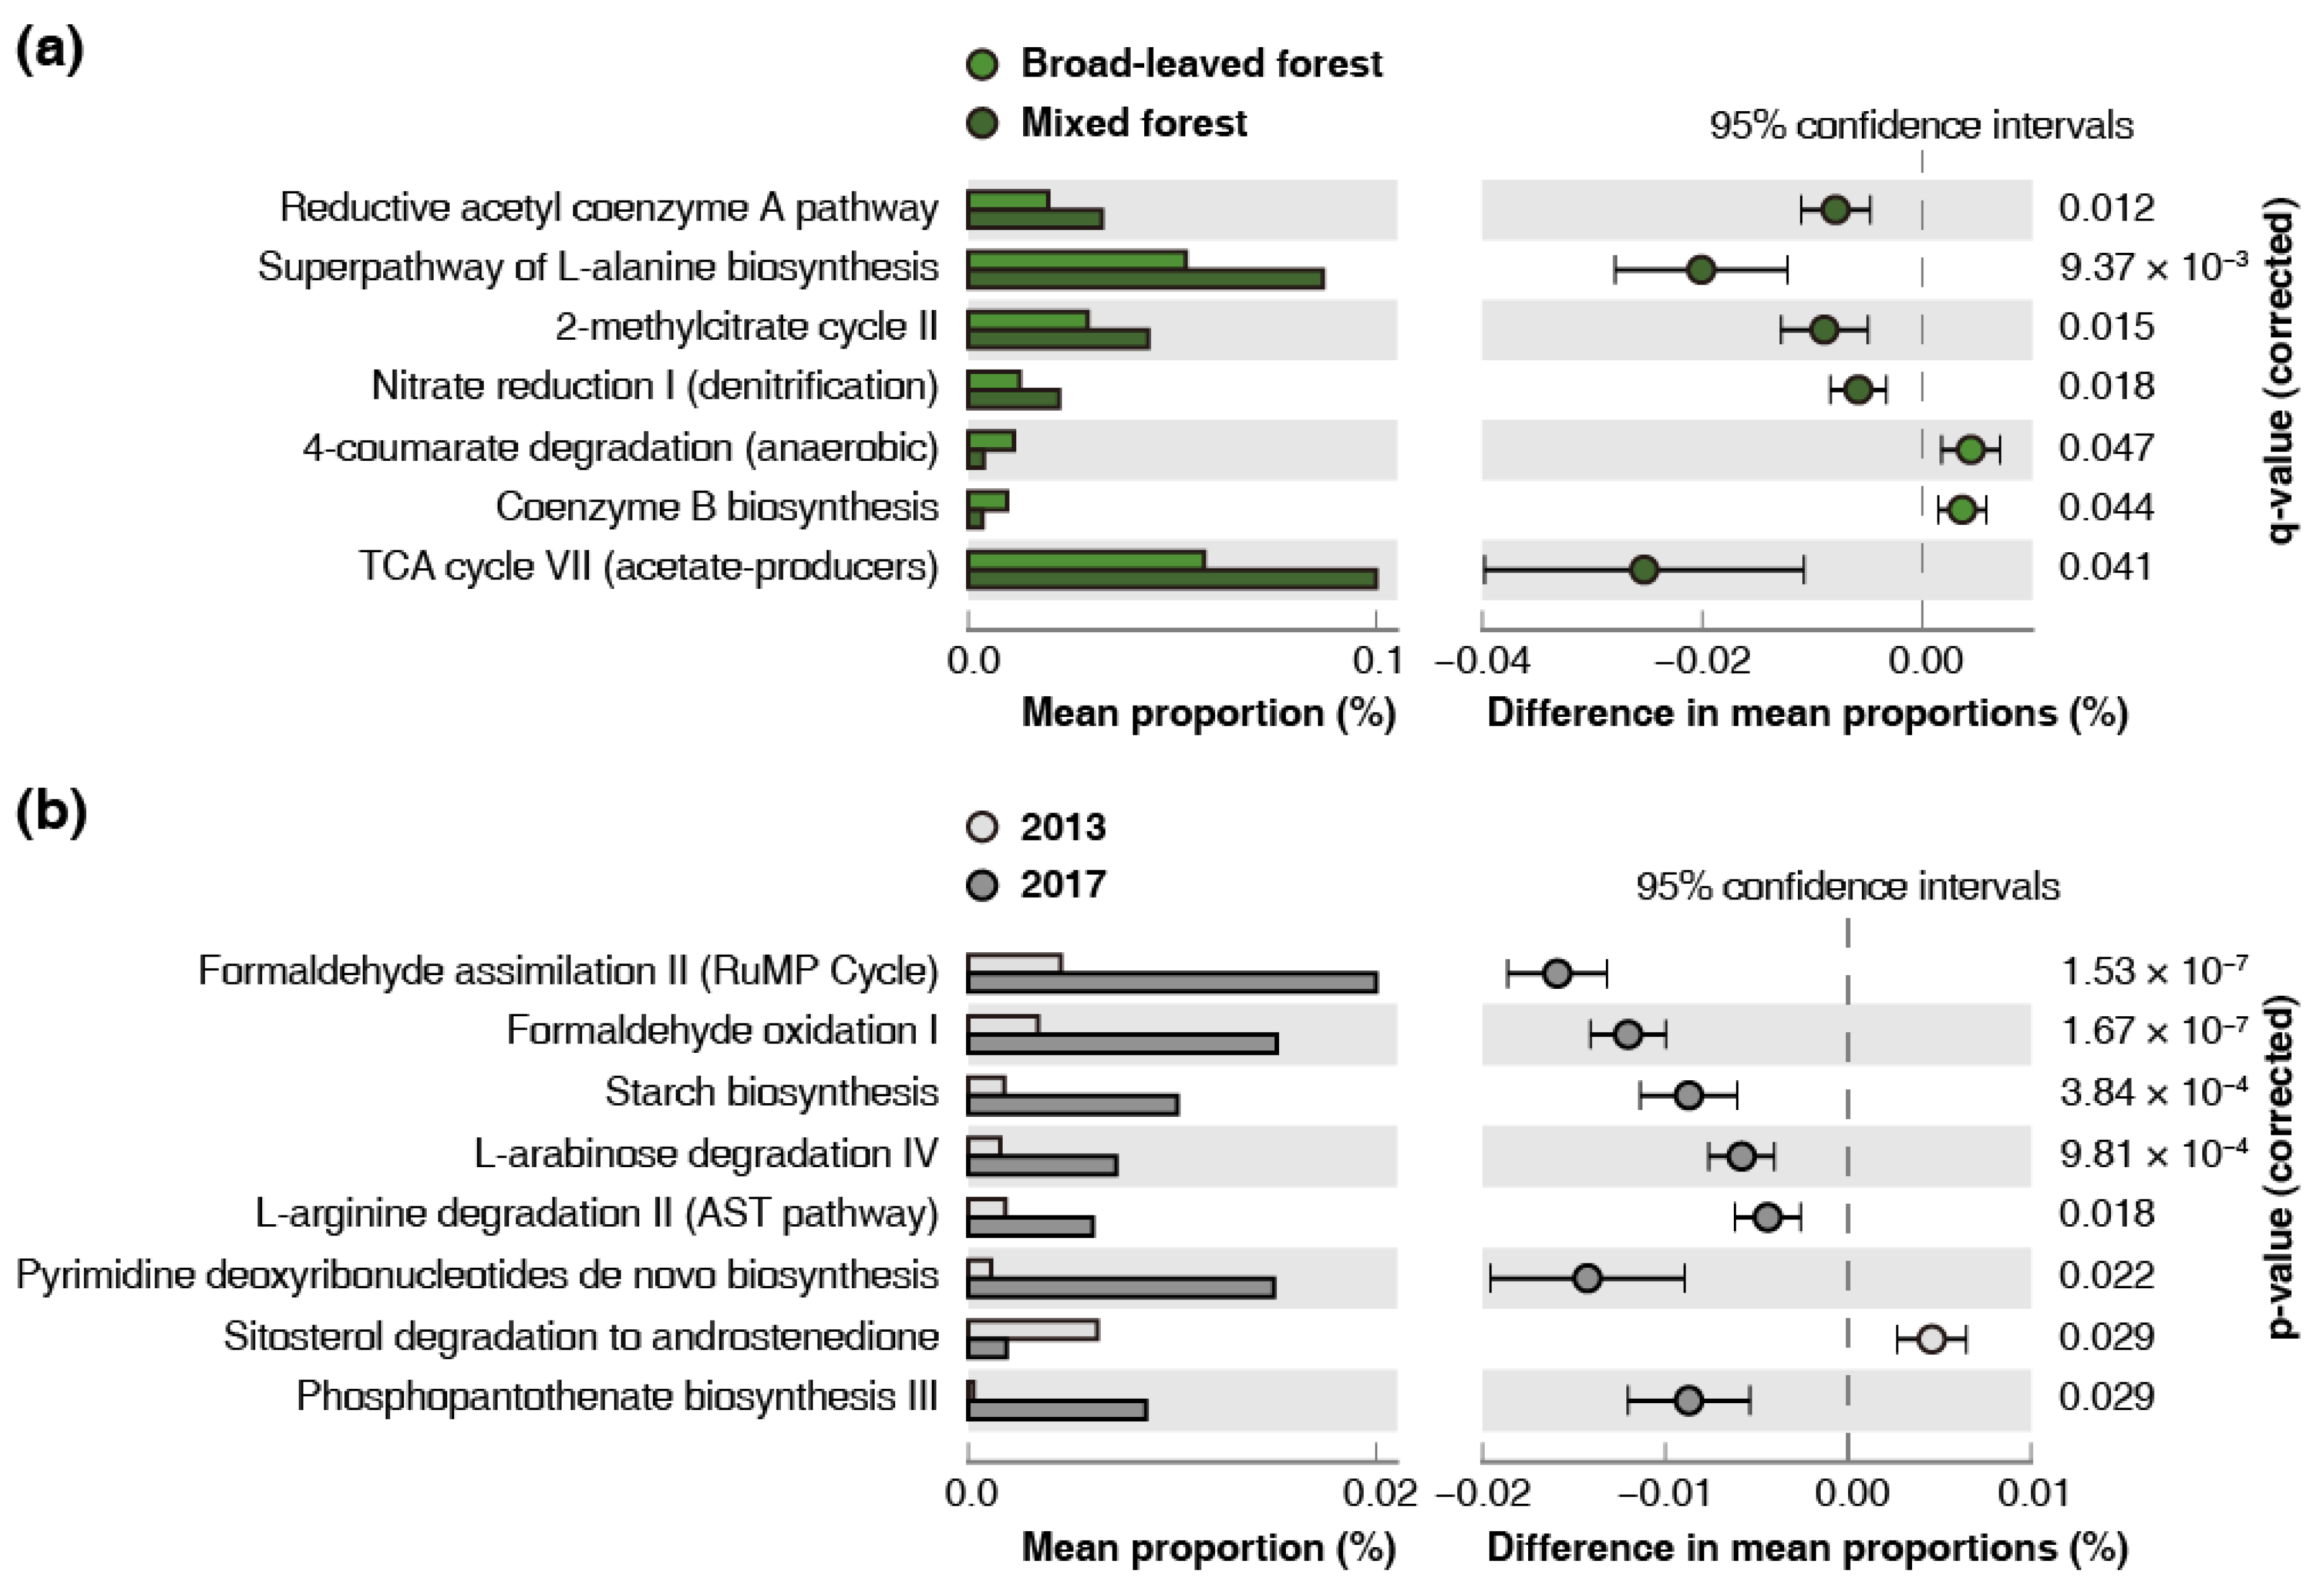
3.5. Genome-Based Prediction of Functional Abundance

Functional abundances in the microbial communities were predicted using PICRUSt2, and the biological pathways that differed significantly by forest type or sampling year are summarized in Figure 7. Seven pathways showed significant differences by forest type. The 4-Coumarate degradation (anaerobic) and coenzyme B biosynthesis were more abundant in the broad-leaved forest soils, and the other five pathways were more abundant in the mixed forest soils. Another seven pathways showed significant differences by sampling year. Sitosterol degradation to androstenedione was more abundant in the 2013 samples, and the other six pathways were more abundant in the 2017 samples.
We further investigated the microbial genera that contributed the most to the differences in the predicted abundance of the pathways representing ecological functions, such as nitrate reduction I (denitrification), formaldehyde assimilation II (RuMP cycle) and formaldehyde oxidation I (dissimilatory RuMP cycle). In the case of nitrate reduction I, the top five contributors to the higher abundance of the pathway accounted for the majority (70.0%) of the total contribution. The highest contribution was from Flavobacterium (20.86%), followed by Pedomicrobium (15.93%), a Gemmatimonadaceae genus (15.20%), Terrimonas (8.45%), and Nitrospira (7.54%). Since both the RuMP cycle and dissimilatory RuMP cycle are directly related to the utilization of formaldehyde, most contributors to the increase in these pathways appeared to be redundant. In both pathways, the top five contributors accounted for approximately half (47.3% and 51.5%, respectively) of the total contribution. The highest contributions were from Candidatus Udaeobacter (10.1% and 15.5%, respectively), Mucilaginibacter (14.4% and 10.2%, respectively), an Acidobacteriales genus (9.1% and 12.5%, respectively), a Chitinophagaceae genus (7.6% and 6.6%, respectively), and Bryobacter (6.1% and 6.6%, respectively).

4. Discussion

Studies on microbial communities in forest soils have shown their importance in forest ecosystems and how they respond to various patterns of environmental change [27]. However, few studies have been conducted in natural environments, perhaps due to the difficulty in controlling variables, and fewer have analyzed their response to climate change below the genus level. For example, Deltedesco et al. studied the indirect effects of climate change through a manipulation experiment, and Barnard et al. revealed the influence of different precipitation patterns through a simulation over four months [28,29]. In fact, common traits at a high taxonomic level, such as phylum, class, and order, are too broad to interpret their ecological meaning [30]. Therefore, this study provides a comprehensive assessment of forest soil microbial communities and the influence of climate change on them through HTS analysis at the genus level where ecologically significant physiological characteristics begin to be grouped and distinguished.
First, we investigated the overall composition of microbial communities in the forest soils and compared the structural and functional differences between the two types of forests in Odaesan. As a result, microorganisms that are closely related to plants were dominant in the forest soils. The Xanthobacteraceae genus, the second most abundant bacterial genus, is most likely to be a nitrogen-fixing bacterium, since this family belongs to Rhizobiales that fixes nitrogen and lives symbiotically with plant roots [31]. The fungal genera Russula and Sebacina, the second and third most dominant genera in the forest soils, are ectomycorrhizal fungi that have a symbiotic relationship with plant roots, allowing plants to survive in environments with limited water and nutrients [32]. The overall composition of microbial communities varied significantly depending on the forest type, and the Shannon–Weiner index of the soil microbial community was significantly higher in the mixed forests, where Manchurian firs and Mongolian oaks coexist, than in the Mongolian oak forests (Table 1). The Shannon–Weiner index is strongly affected by species richness and rare species, whereas the Gini–Simpson index gives more weight to species evenness and common species [33]. The results suggest that the mixed forest soils had a number of microbial species that were selectively present at low abundance, and the biomarkers for the mixed forest soils were analyzed. Among the biomarkers, the microorganisms involved in the nitrogen cycle were more abundant in mixed forests than in Mongolian oak forests; the genus Mesorhizobium and the family Pirellulaceae include nitrogen-fixing bacteria and ammonia oxidizers, respectively [34,35]. There was a significant positive correlation between the abundance of the biomarkers and soil pH. Interestingly, the soil pH was significantly higher in the mixed forests (Figure 3). Pine needles have a pH of approximately 4, so conifers are generally known to lower soil pH. However, the amount of calcium in the leaves was an important variable affecting soil pH [36]. Trees with calcium-rich leaves absorb a large amount of calcium from the soil, increasing the capacity of calcium circulation in the forest ecosystem. This prevents the leaching of calcium and retains more calcium in the forest ecosystem, which is introduced by weathering or lateral flux of groundwater [37]. Calcium occupies spaces on the surface of soil particles that are otherwise occupied by acidic ions, so the higher the calcium content is, the higher the soil pH becomes. The high pH in the soils of the mixed forests in Odaesan can be explained by the fact that the conifers in the mixed forest are Manchurian firs, one of the conifers with calcium-rich leaves. The difference in the microbial communities between the forest types is most likely due to the relatively high pH (mean 5.32) of the mixed forest soils (Figure 3 and Figure 6); nitrification and denitrification generally increase as the pH approaches neutral, and the abundance of microorganisms involved follows the same pattern [38]. Considering that the TN in the soil of the mixed forests was significantly lower than that in the soil of the broad-leaved forests, the denitrification process, which causes nitrogen loss in soils, was expected to prevail. As expected, the PICRUSt2 analysis showed that nitrate reduction I (denitrification) was significantly more abundant in the mixed forest than in the broad-leaved forest (Figure 7A). Nitrate reduction I is a part of the denitrification process that occurs in anoxic conditions, which indicates that the presence of Manchurian fir influenced the development of anoxic conditions in the topsoil. The most likely cause of this influence is leaf litter; the fallen conifer needles provide an anoxic microsite in which denitrification occurs [39]. Furthermore, dissimilatory nitrate reduction to ammonium (DNRA), a competitive process in nitrate reduction, is promoted under high-carbon conditions; the mixed forests had significantly lower TOC, and in general, the soil around conifers contains less organic matter because the decomposition rate of conifer needles is slower than that of broad leaves [40]. Therefore, denitrification has a competitive advantage in the mixed forest soils [41]. Unlike DNRA, which reduces nitrate or nitrite to ammonium, denitrification causes nitrogen loss in the soil by reducing nitrate or nitrite to N2 or N2O, which contributes to the low TN content of mixed forest soils [42]. Among the biomarkers for the mixed forest soils, Terrimonas (8.45%) contributed the most to the increase in the abundance of nitrate reduction I, followed by Pyrinomonadaceae RB41 (1.24%) and Mesorhizobium (0.17%) (Table S3). We suggest that Terrimonas does function as a denitrifying bacteria in the topsoil, given that most Terrimonas species have been isolated from plant rhizospheres [43]. If Manchurian firs disappear from Odaesan as climate change continues, their relative abundance is expected to decrease significantly.
Although Odaesan is composed of stable forests in the late successional stage, the differences between the 2013 and 2017 sample groups showed clear shifts in the microbial ecosystem over the four years (Figure 4). The forests of Odaesan have been well preserved without being affected by particular natural phenomena, disasters, or human interference. We have confirmed that there have been no significant changes in environmental variables for four years, and there were no predictors in the dimension 2 direction where the communities shift over time. (Figure 4). Moreover, there was no significant interaction in dissimilarity between forest type and sampling year, which implied that the four-year change had the same effect on the soil microbial community regardless of the forest type. Microbial community shifts were only caused by environmental conditions that deviated significantly from the usual, implying that the environmental conditions of the Odaesan region have changed significantly over the years [27]. The equilibrium of the soil microbial community may fail to recover after being broken due to press disturbances (long-term), and climate change is the only press disturbance acting on the natural environment that is not directly affected by human activity. Since there were no extreme pulse (short-term) disturbances around the sampling date in either year, we concluded that climate change eventually led to the microbial community shifting to an alternative equilibrium.
The pattern of climate change is different depending on the location and topography of the region. According to the European State of the Climate (http://climate.copernicus.eu/ESOTC/2019), the climate change pattern in Odaesan region is similar to that in Europe, where the sunshine duration and temperature have increased steadily over the past 40 years, resulting in a decrease in soil moisture (Figure 1). Likewise, this pattern of climate change accelerates the loss of moisture in the soil pores, resulting in a prolonged aerobic state of the topsoil. The soil microbial communities in Odaesan have changed significantly over four years as they adapt to climatic conditions that have changed. Among the selected biomarkers for the soils in 2017, Arachidicoccus includes the plant-growth-promoting bacteria A. rhizosphaerae, and Massilia and Mucilaginibacter are root-colonizing bacteria [44,45,46]. The increase in the abundance of these plant symbiotic bacteria can be interpreted as having benefited from the increased amount of photosynthetic product provided by plants due to the increased sunshine duration. However, if photosynthesis had increased, the TOC in the soils would have increased, but it did not. (Figure 3). It was presumed that the lack of water due to the decreased precipitation and increased transpiration of plants suppressed photosynthesis. Rather, it is possible that microorganisms with aerobic metabolic capabilities have benefited from these climatic trends. Therefore, the pathways of which abundance increased significantly were investigated. The predicted pathway analysis showed that the abundance of the RuMP cycle and the dissimilatory RuMP cycle were significantly higher in the soils in 2017 (Figure 7B). These methanotrophic pathways belong to type I and type X methanotrophs, the aerobic methanotrophs that use oxygen as an electron acceptor for CH4 oxidation [47]. Thus, the increase in the predicted abundance of these two pathways indicates that the aerobic methanotrophs became more active and abundant as climate change strengthened the aerobic conditions in the forest topsoil in Odaesan. They oxidize atmospheric CH4 and CH4 produced by methanogens to HCHO and use it for assimilation or dissimilation [48]. They condense HCHO and RuMP to D-arabino-3-hexulose 6-phosphate and finally to pyruvate or dihyroxyacetone phosphate, the three-carbon intermediates of central metabolism, and generate reducing power by forming NADH and NADPH using HCHO through the D-ribulose 5-phosphate (RuMP) cycle and the dissimilatory RuMP cycle, respectively [49]. Among the biomarkers for the soils in 2017, Mucilaginibacter contributed the most to the increase in the abundance of these pathways, followed by Sphingobacteriales env.OPS 17 genus, the Planctomycetes vadinHA49 genus, and Massilia (Table S4). None of them is a member of Gammaproteobacteria to which type I and type X methanotrophs are known to belong, but we suggest that Mucilaginibacter does function as an aerobic methanotroph in the topsoil, given that its methylotrophic strains have been reported [50]. We expect Mucilaginibacter to be used as an indicator of the level of press disturbance accumulated in the ecosystem due to a continuous decrease in precipitation and an increase in sunshine duration in temperate forests.

5. Conclusions

In this study, we analyzed and compared the composition, diversity, and function of soil microbial communities in northern temperate forests in Odaesan using various biostatistical techniques. The microbial communities were significantly different by forest type and sampling year. First, the presence of Manchurian firs had various effects on soil properties, consequently affecting the microbial communities and their functions. The calcium-rich leaves of Manchurian firs raise soil pH, lower TOC due to their relatively slow decomposition rate, and create anoxic microsites in the center. This results in increased denitrifying bacteria, thereby lowering TN in the soil. The microbe that benefited most from the presence of Manchurian firs was Terrimonas. Terrimonas was a biomarker whose abundance was significantly higher in the presence of Manchurian fir and was also one of the bacteria that contributed most to the high abundance of the denitrification pathway. We suggest that this rhizobacterium is the major denitrifying bacterium in Manchurian fir forests. To date, the vegetation communities remain stable in this region, but regardless of the forest type, the soil microbial communities were significantly shifted in the 2017 soils. This result demonstrates that continuous climate change in a certain direction has a significant effect on the microbial community, causing the shift of equilibrium, even though its intensity is weak to change vegetation. The forest ecosystem in the Odaesan region has been affected by press disturbance due to climate change. Over the past decades, the precipitation in the region has been decreasing, while the sunshine duration has been increasing, which has consequently increased the persistence of aerobic conditions in the topsoil. This phenomenon resulted in a significant increase in aerobic methanotrophs that belong to type I and type X methanotrophs over 4 years. The microorganism that benefited the most from this climate change was Mucilaginibacter, a biomarker in soil in 2017 that also contributed the most to the increase in both the RuMP cycle and dissimilatory RuMP cycle. We suggest this bacterium as the aerobic methanotroph that most reflects climate change in the region. Mucilaginibacter is expected to increase in abundance as climate change continues and to be used as an indicator of the level of press disturbance accumulated in the ecosystem due to this pattern of climate change in temperate forests. This study revealed the influence of the presence of Manchurian firs on Mongolian oak forest soil microbial communities for a better understanding of forest ecosystems and revealed the impact of climate change on soil microbial communities in temperate forests. We demonstrated that microbial communities can be developed to assess the press disturbance accumulated in forest ecosystems by climate change to proactively warn of vegetation shifts in temperate forests.

Supplementary Materials

The following are available online at https://0-www-mdpi-com.brum.beds.ac.uk/2071-1050/12/24/10591/s1, Figure S1: Relative abundances of the bacterial (A) and fungal (B) communities in forest soils presented at the phylum level. Bacterial and fungal phyla above 2% relative abundance were presented., Figure S2: Relative abundances of the bacterial (A) and fungal (B) communities in forest soils presented at the genus level. Bacterial and fungal genera above 1% relative abundance were presented., Figure S3: Importance plot of randomForest analysis using Odaesan forest soil microbial abundance by (a) forest vegetation type and (b) sampling year. Out of bag (OOB) estimate is a score that assesses the prediction performance of the model. In this study, the genera above the bold dotted line were considered the key taxa., Table S1: Summarized results of high-throughput sequencing by Illumina MiSeq platform., Table S2: Summarized results of indicator species analysis by forest type and sampling year. Microbial genera above 0.9 and 0.8 IndVal are presented, respectively., Table S3: Contributions of microbial genera to the predicted functional abundance by forest vegetation type. Genera with a (relative contribution in mixed forest/relative contribution in broad-leaved forest) of less than 1.5 were excluded. Genera with a weighted contribution of above 0.1% are presented., Table S4: Contributions of microbial genera to the predicted functional abundance by sampling year. Genera with a (relative contribution in 2017/relative contribution in 2013) ratio of less than 3 were excluded. Genera with a weighted contribution of above 0.1% are presented.

Author Contributions

Conceptualization, Y.-M.H. and H.L.; Methodology, Y.-M.H. and H.L.; Validation, S.-I.H.; Formal Analysis, Y.-M.H. and H.L.; Investigation, S.-L.K., Y.Y., and D.K.; Resources, C.K. and J.-J.K.; Writing—Original Draft Preparation, Y.-M.H.; Writing—Review and Editing, H.L., S.-I.H., and A.-H.L.; Visualization, Y.-M.H. and H.L.; Supervision, G.-H.K. and J.-J.K.; Project Administration, J.-J.K.; Funding Acquisition, J.-J.K. All authors have read and agreed to the published version of the manuscript.

Funding

This research was funded by the project for the survey and excavation of Korean indigenous species of the National Institute of Biological Resources, grant number NIBR201902113. This research was also funded by a Korea University Grant.

Acknowledgments

Special thanks to Jaejung Lee, Seokyoon Jang, and Yeongseon Jang from the Korea Forest Research Institute for participating in sampling.

Conflicts of Interest

The authors declare no conflict of interest.

References

  1. Kim, C.-H.; Oh, J.-G.; Kang, E.-O.; Yun, C.-S.; Lim, J.-K. Community Distribution on Mountain Forest Vegetation of the Gyebangsan Area in the Odaesan National Park, Korea. Korean J. Ecol. Environ. 2014, 47, 135–145. [Google Scholar] [CrossRef]
  2. Lee, H.; Oh, S.-Y.; Lee, Y.M.; Jang, Y.; Jang, S.; Kim, C.; Lim, Y.W.; Kim, J. Successional Variation in the Soil Microbial Community in Odaesan National Park, Korea. Sustainability 2020, 12, 4795. [Google Scholar] [CrossRef]
  3. Lladó, S.; López-Mondéjar, R.; Baldrian, P. Forest Soil Bacteria: Diversity, Involvement in Ecosystem Processes, and Response to Global Change. Microbiol. Mol. Biol. Rev. 2017, 81, e00063-16. [Google Scholar] [CrossRef] [Green Version]
  4. Nkongolo, K.K.; Narendrula-Kotha, R. Advances in monitoring soil microbial community dynamic and function. J. Appl. Genet. 2020, 61, 249–263. [Google Scholar] [CrossRef]
  5. Clark, J.S.; Campbell, J.H.; Grizzle, H.; Acosta-Martìnez, V.; Zak, J.C. Soil Microbial Community Response to Drought and Precipitation Variability in the Chihuahuan Desert. Microb. Ecol. 2008, 57, 248–260. [Google Scholar] [CrossRef]
  6. Office of Odaesan; Korea National Park Service. Odaesan National Park Resource Monitoring (4th Year); Korea National Park Service: Pyeongchang-gun, Korea, 2008. [Google Scholar]
  7. Imaji, A.; Seiwa, K. Carbon allocation to defense, storage, and growth in seedlings of two temperate broad-leaved tree species. Oecologia 2009, 162, 273–281. [Google Scholar] [CrossRef]
  8. Lee, D.-H. Above-and below-ground biomass of Abies holophylla under different stand conditions. Life Sci. J. 2013, 10, 751–758. [Google Scholar]
  9. Johnson, E.A.; Miyanishi, K. Disturbance and succession. In Plant Disturbance Ecology—The Process and the Response; Academic Press: Cambridge, MA, USA, 2007; pp. 1–14. [Google Scholar]
  10. Keith, D.A.; Rodoreda, S.; Bedward, M. Decadal change in wetland-woodland boundaries during the late 20th century reflects climatic trends. Glob. Chang. Biol. 2009, 16, 2300–2306. [Google Scholar] [CrossRef]
  11. De Vos, B.; Lettens, S.; Muys, B.; Deckers, J.A. Walkley? Black analysis of forest soil organic carbon: Recovery, limitations and uncertainty. Soil Use Manag. 2007, 23, 221–229. [Google Scholar] [CrossRef]
  12. Bolyen, E.; Rideout, J.R.; Dillon, M.R.; Bokulich, N.A.; Abnet, C.C.; Al-Ghalith, G.A.; Alexander, H.; Alm, E.J.; Arumugam, M.; Asnicar, F.; et al. Reproducible, interactive, scalable and extensible microbiome data science using QIIME 2. Nat. Biotechnol. 2019, 37, 852–857. [Google Scholar] [CrossRef]
  13. Callahan, B.J.; McMurdie, P.J.; Rosen, M.J.; Han, A.W.; Johnson, A.J.A.; Holmes, S.P. DADA2: High-resolution sample inference from Illumina amplicon data. Nat. Methods 2016, 13, 581–583. [Google Scholar] [CrossRef] [Green Version]
  14. Katoh, K.; Standley, D.M. MAFFT multiple sequence alignment software version 7: Improvements in performance and usability. Mol. Biol. Evol. 2013, 30, 772–780. [Google Scholar] [CrossRef] [Green Version]
  15. Price, M.N.; Dehal, P.S.; Arkin, A.P. FastTree 2—Approximately Maximum-Likelihood Trees for Large Alignments. PLoS ONE 2010, 5, e9490. [Google Scholar] [CrossRef]
  16. Bokulich, N.A.; Kaehler, B.; Rideout, J.R.; Dillon, M.; Bolyen, E.; Knight, R.; Huttley, G.A.; Caporaso, J.G. Optimizing taxonomic classification of marker-gene amplicon sequences with QIIME 2′s q2-feature-classifier plugin. Microbiome 2018, 6, 90. [Google Scholar] [CrossRef]
  17. Quast, C.; Pruesse, E.; Yilmaz, P.; Gerken, J.; Schweer, T.; Yarza, P.; Peplies, J.; Glöckner, F.O. The SILVA ribosomal RNA gene database project: Improved data processing and web-based tools. Nucleic Acids Res. 2013, 41, D590–D596. [Google Scholar] [CrossRef]
  18. UNITE Community. UNITE QIIME Release for Fungi; 2018-11-18 Edition; UNITE Community: London, UK, 2019. [Google Scholar]
  19. Rognes, T.; Flouri, T.; Nichols, B.; Quince, C.; Mahé, F. VSEARCH: A versatile open source tool for metagenomics. PeerJ 2016, 4, e2584. [Google Scholar] [CrossRef]
  20. Douglas, G.M.; Maffei, V.J.; Zaneveld, J.; Yurgel, S.N.; Brown, J.R.; Taylor, C.M.; Huttenhower, C.; Langille, M.G.I. PICRUSt2: An improved and customizable approach for metagenome inference. BioRxiv 2020. [Google Scholar] [CrossRef] [Green Version]
  21. R Development Core Team. R: A Language and Environment for Statistical Computing; R Foundation for Statistical Computing: Vienna, Austria, 2013. [Google Scholar]
  22. Oksanen, J.; Blanchet, F.G.; Kindt, R.; Legendre, P.; Minchin, P.R.; O’hara, R.; Simpson, G.L.; Solymos, P.; Stevens, M.H.H.; Wagner, H. Package ‘vegan’. Community ecology package, version. J. Stat. Softw. 2013, 2, 1–295. [Google Scholar]
  23. Roberts, D.W. Labdsv: Ordination and Multivariate Analysis for Ecology, R Package Version 2.0-1. 2019. Available online: https://cran.r-project.org/web/packages/labdsv/labdsv.pdf (accessed on 3 June 2020).
  24. Liaw, A.; Wiener, M. Classification and regression by randomForest. R News 2002, 2, 18–22. [Google Scholar]
  25. Parks, D.H.; Tyson, G.W.; Hugenholtz, P.; Beiko, R.G. STAMP: Statistical analysis of taxonomic and functional profiles. Bioinformatics 2014, 30, 3123–3124. [Google Scholar] [CrossRef] [Green Version]
  26. Choi, B.-K.; Lee, C.-W. Distribution Status and Age Structure of Abies holophylla Population in Sudo-Am Temple Forest. Korean J. Ecol. Environ. 2014, 47, 160–166. [Google Scholar] [CrossRef]
  27. Cruz-Martínez, K.; Suttle, K.B.; Brodie, E.L.; Power, M.E.; Andersen, G.L.; Banfield, J.F. Despite strong seasonal responses, soil microbial consortia are more resilient to long-term changes in rainfall than overlying grassland. ISME J. 2009, 3, 738–744. [Google Scholar] [CrossRef]
  28. Deltedesco, E.; Keiblinger, K.M.; Piepho, H.-P.; Antonielli, L.; Pötsch, E.M.; Zechmeister-Boltenstern, S.; Gorfer, M. Soil microbial community structure and function mainly respond to indirect effects in a multifactorial climate manipulation experiment. Soil Biol. Biochem. 2020, 142, 107704. [Google Scholar] [CrossRef]
  29. Barnard, R.L.; Osborne, C.A.; Firestone, M.K. Changing precipitation pattern alters soil microbial community response to wet-up under a Mediterranean-type climate. ISME J. 2014, 9, 946–957. [Google Scholar] [CrossRef] [Green Version]
  30. De Biasi, A.M.; Bianchi, C.N.; Morri, C. Analysis of macrobenthic communities at different taxonomic levels: An example from an estuarine environment in the Ligurian Sea (NW Mediterranean). Estuarine Coast. Shelf Sci. 2003, 58, 99–106. [Google Scholar] [CrossRef]
  31. Carvalho, F.M.; Souza, R.C.; Barcellos, F.G.; Hungria, M.; De Vasconcelos, A.T.R. Genomic and evolutionary comparisons of diazotrophic and pathogenic bacteria of the order Rhizobiales. BMC Microbiol. 2010, 10, 37. [Google Scholar] [CrossRef] [Green Version]
  32. Trappe, J.M. Fungus associates of ectotrophic mycorrhizae. Bot. Rev. 1962, 28, 538–606. [Google Scholar] [CrossRef]
  33. Gering, J.C.; Crist, T.O.; Veech, J.A. Additive Partitioning of Species Diversity across Multiple Spatial Scales: Implications for Regional Conservation of Biodiversity. Conserv. Biol. 2003, 17, 488–499. [Google Scholar] [CrossRef]
  34. De Celis, M.; Belda, I.; Ortiz-Álvarez, R.; Arregui, L.; Marquina, D.; Serrano, S.; Santos, A. Tuning up microbiome analysis to monitor WWTPs’ biological reactors functioning. Sci. Rep. 2020, 10, 4079. [Google Scholar] [CrossRef]
  35. Kaneko, T.; Nakamura, Y.; Sato, S.; Asamizu, E.; Kato, T.; Sasamoto, S.; Watanabe, A.; Idesawa, K.; Ishikawa, A.; Kawashima, K. Complete genome structure of the nitrogen-fixing symbiotic bacterium Mesorhizobium loti. DNA Res. 2000, 7, 331–338. [Google Scholar] [CrossRef] [Green Version]
  36. Reich, P.B.; Oleksyn, J.; Modrzynski, J.; Mrozinski, P.; Hobbie, S.E.; Eissenstat, D.M.; Chorover, J.; Chadwick, O.A.; Hale, C.M.; Tjoelker, M.G. Linking litter calcium, earthworms and soil properties: A common garden test with 14 tree species. Ecol. Lett. 2005, 8, 811–818. [Google Scholar] [CrossRef]
  37. Eriksson, H.M.; Jönsson, C. Four tree species and the calcium, magnesium and potassium budgets of a Swedish forest site. N. Z. J. For. Sci. 1994, 24, 415–426. [Google Scholar]
  38. Ying, J.; Li, X.; Wang, N.; Lan, Z.; He, J.; Bai, Y. Contrasting effects of nitrogen forms and soil pH on ammonia oxidizing microorganisms and their responses to long-term nitrogen fertilization in a typical steppe ecosystem. Soil Biol. Biochem. 2017, 107, 10–18. [Google Scholar] [CrossRef]
  39. Van Der Lee, G. Anoxic microsites in Douglas fir litter. Soil Biol. Biochem. 1999, 31, 1295–1301. [Google Scholar] [CrossRef]
  40. Zhang, D.; Hui, D.; Luo, Y.; Zhou, G. Rates of litter decomposition in terrestrial ecosystems: Global patterns and controlling factors. J. Plant Ecol. 2008, 1, 85–93. [Google Scholar] [CrossRef] [Green Version]
  41. Giblin, A.E.; Tobias, C.R.; Song, B.; Weston, N.; Banta, G.T.; Rivera-Monroy, V.H. The Importance of Dissimilatory Nitrate Reduction to Ammonium (DNRA) in the Nitrogen Cycle of Coastal Ecosystems. Oceanography 2013, 26, 124–131. [Google Scholar] [CrossRef] [Green Version]
  42. Wang, H.; Shu, D.; Liu, D.; Liu, S.; Deng, N.; An, S. Passive and active ecological restoration strategies for abandoned farmland leads to shifts in potential soil nitrogen loss by denitrification and soil denitrifying microbes. Land Degrad. Dev. 2020, 31, 1086–1098. [Google Scholar] [CrossRef]
  43. Han, S.-I.; Lee, Y.-R.; Kim, J.-O.; Whang, K.-S. Terrimonas rhizosphaerae sp. nov., isolated from ginseng rhizosphere soil. Int. J. Syst. Evol. Microbiol. 2017, 67, 391–395. [Google Scholar] [CrossRef]
  44. Madhaiyan, M.; Poonguzhali, S.; Senthilkumar, M.; Pragatheswari, D.; Lee, J.-S.; Lee, K.-C. Arachidicoccus rhizosphaerae gen. nov., sp. nov., a plant-growth-promoting bacterium in the family Chitinophagaceae isolated from rhizosphere soil. Int. J. Syst. Evol. Microbiol. 2015, 65, 578–586. [Google Scholar] [CrossRef]
  45. Ofek, M.; Hadar, Y.; Minz, D. Ecology of Root Colonizing Massilia (Oxalobacteraceae). PLoS ONE 2012, 7, e40117. [Google Scholar] [CrossRef]
  46. Hardoim, P. The Ecology of Seed Microbiota. In Seed Endophytes; Springer Science and Business Media LLC: Secaucus, NJ, USA, 2019; pp. 103–125. [Google Scholar]
  47. Knief, C. Diversity and Habitat Preferences of Cultivated and Uncultivated Aerobic Methanotrophic Bacteria Evaluated Based on pmoA as Molecular Marker. Front. Microbiol. 2015, 6, 1346. [Google Scholar] [CrossRef] [Green Version]
  48. Kalyuzhnaya, M.G.; Gomez, O.A.; Murrell, J.C. The Methane-Oxidizing Bacteria (Methanotrophs). Taxon. Genom. Ecophysiol. Hydrocarb.-Degrad. Microbes 2019, 245–278. [Google Scholar] [CrossRef]
  49. Müller, J.E.N.; Heggeset, T.M.B.; Wendisch, V.F.; Vorholt, J.A.; Brautaset, T. Methylotrophy in the thermophilic Bacillus methanolicus, basic insights and application for commodity production from methanol. Appl. Microbiol. Biotechnol. 2014, 99, 535–551. [Google Scholar] [CrossRef]
  50. Kelly, D.P.; McDonald, I.R.; Wood, A.P. The Family Methylobacteriaceae. In The Prokaryotes: Alphaproteobacteria and Betaproteobacteria; Rosenberg, E., DeLong, E.F., Lory, S., Stackebrandt, E., Thompson, F., Eds.; Springer: Berlin/Heidelberg, Germany, 2014; pp. 313–340. [Google Scholar]
Figure 1. Annual climate data for the Odaesan region (Daegwallyeong, 832 m a.s.l.) during 2003–2017. The dotted lines show the linear trend of each variable.
Sustainability 12 10591 g001
Figure 2. Map showing the sampling locations, altitudes, and forest types.
Sustainability 12 10591 g002
Figure 3. Environmental properties of forest soils in Odaesan by sampling year and tree vegetation type. Asterisks indicate significant differences at t-test (*** = p < 0.001). Green and gray color represent forest types and sampling years, respectively.
Sustainability 12 10591 g003
Figure 4. Non-metric multidimensional scaling plot based on Bray–Curtis distances generated for (a) integrated microbial communities and (b) bacterial (left) and fungal (right) communities in the forest soils in Odaesan. Fitted environmental variables are scaled by Pearson correlation coefficient.
Sustainability 12 10591 g004
Figure 5. Community composition of the major genera that contributed more than 2% of the total abundances. In each kingdom, the group with the highest total abundance of the major genera was presented as maximum.
Sustainability 12 10591 g005
Figure 6. Correlation between the biomarkers contributing to the differences in the microbial communities by (a) sampling year and (b) forest vegetation type. Statistical analysis of correlation was performed by the Pearson test. The X symbol indicates that the correlation is not significant (p > 0.05).
Sustainability 12 10591 g006
Figure 7. Extended error bar plots for the pathways that passed Welch’s t-test (Bonferroni correction and Benjamini–Hochberg FDR correction applied, respectively) performed on the PICRUSt2 analysis by (a) forest vegetation type and (b) sampling year. Pathways with effect size (ratio of proportions) of less than 1.5 and 3, respectively, and with mean abundance of less than 1000 were excluded.
Sustainability 12 10591 g007
Table 1. Alpha diversity comparison for the soil microbial community in Odaesan.
YearStudy AreaAlpha Diversity Index
Forest Vegetation TypeLocationShannon 1Simpson 2
2013Mixed forestP014.7870.980
(Mongolian oak & Manchurian fir)P064.9650.977
P075.0440.982
P134.8210.973
P145.0460.980
P155.1190.976
mean4.9640.978
Broad-leaved forestP024.8320.976
(Mongolian oak)P034.4030.966
P044.4290.959
P054.9120.982
P084.9880.983
P094.1950.943
P104.9630.983
P114.5640.961
P124.4050.935
mean4.6320.966
2017Mixed forestP015.1400.980
P064.8620.977
P074.4520.946
P134.2880.942
P144.3260.926
P155.3230.983
mean4.7320.959
Broad-leaved forestP024.7550.969
P034.4400.964
P044.6690.970
P054.4080.956
P084.8240.974
P094.8340.972
P104.7950.979
P114.6650.973
P124.2960.950
mean4.6320.967
1 Shannon–Weiner diversity index (>0, higher, more diverse). 2 Gini–Simpson diversity index (0–1, 0 = most simple).
Publisher’s Note: MDPI stays neutral with regard to jurisdictional claims in published maps and institutional affiliations.

