Application of Factor Analysis for Characterizing the Relationships between Groundwater Quality and Land Use in Taiwan’s Pingtung Plain


Abstract
:1. Introduction
2. Materials and Methods
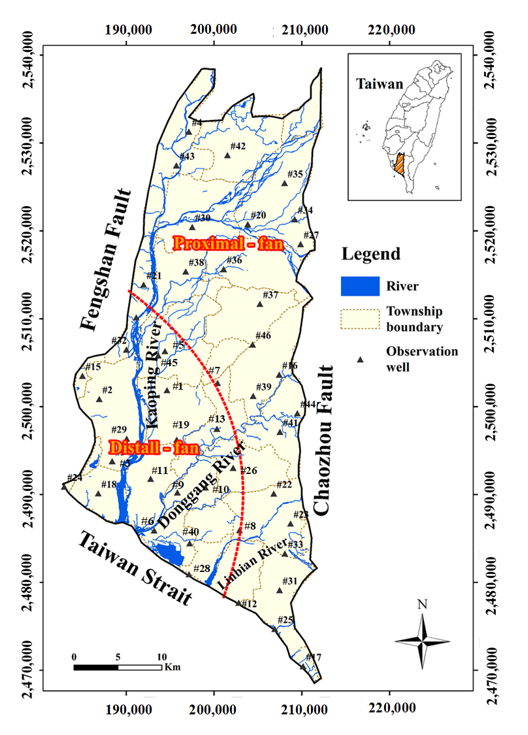
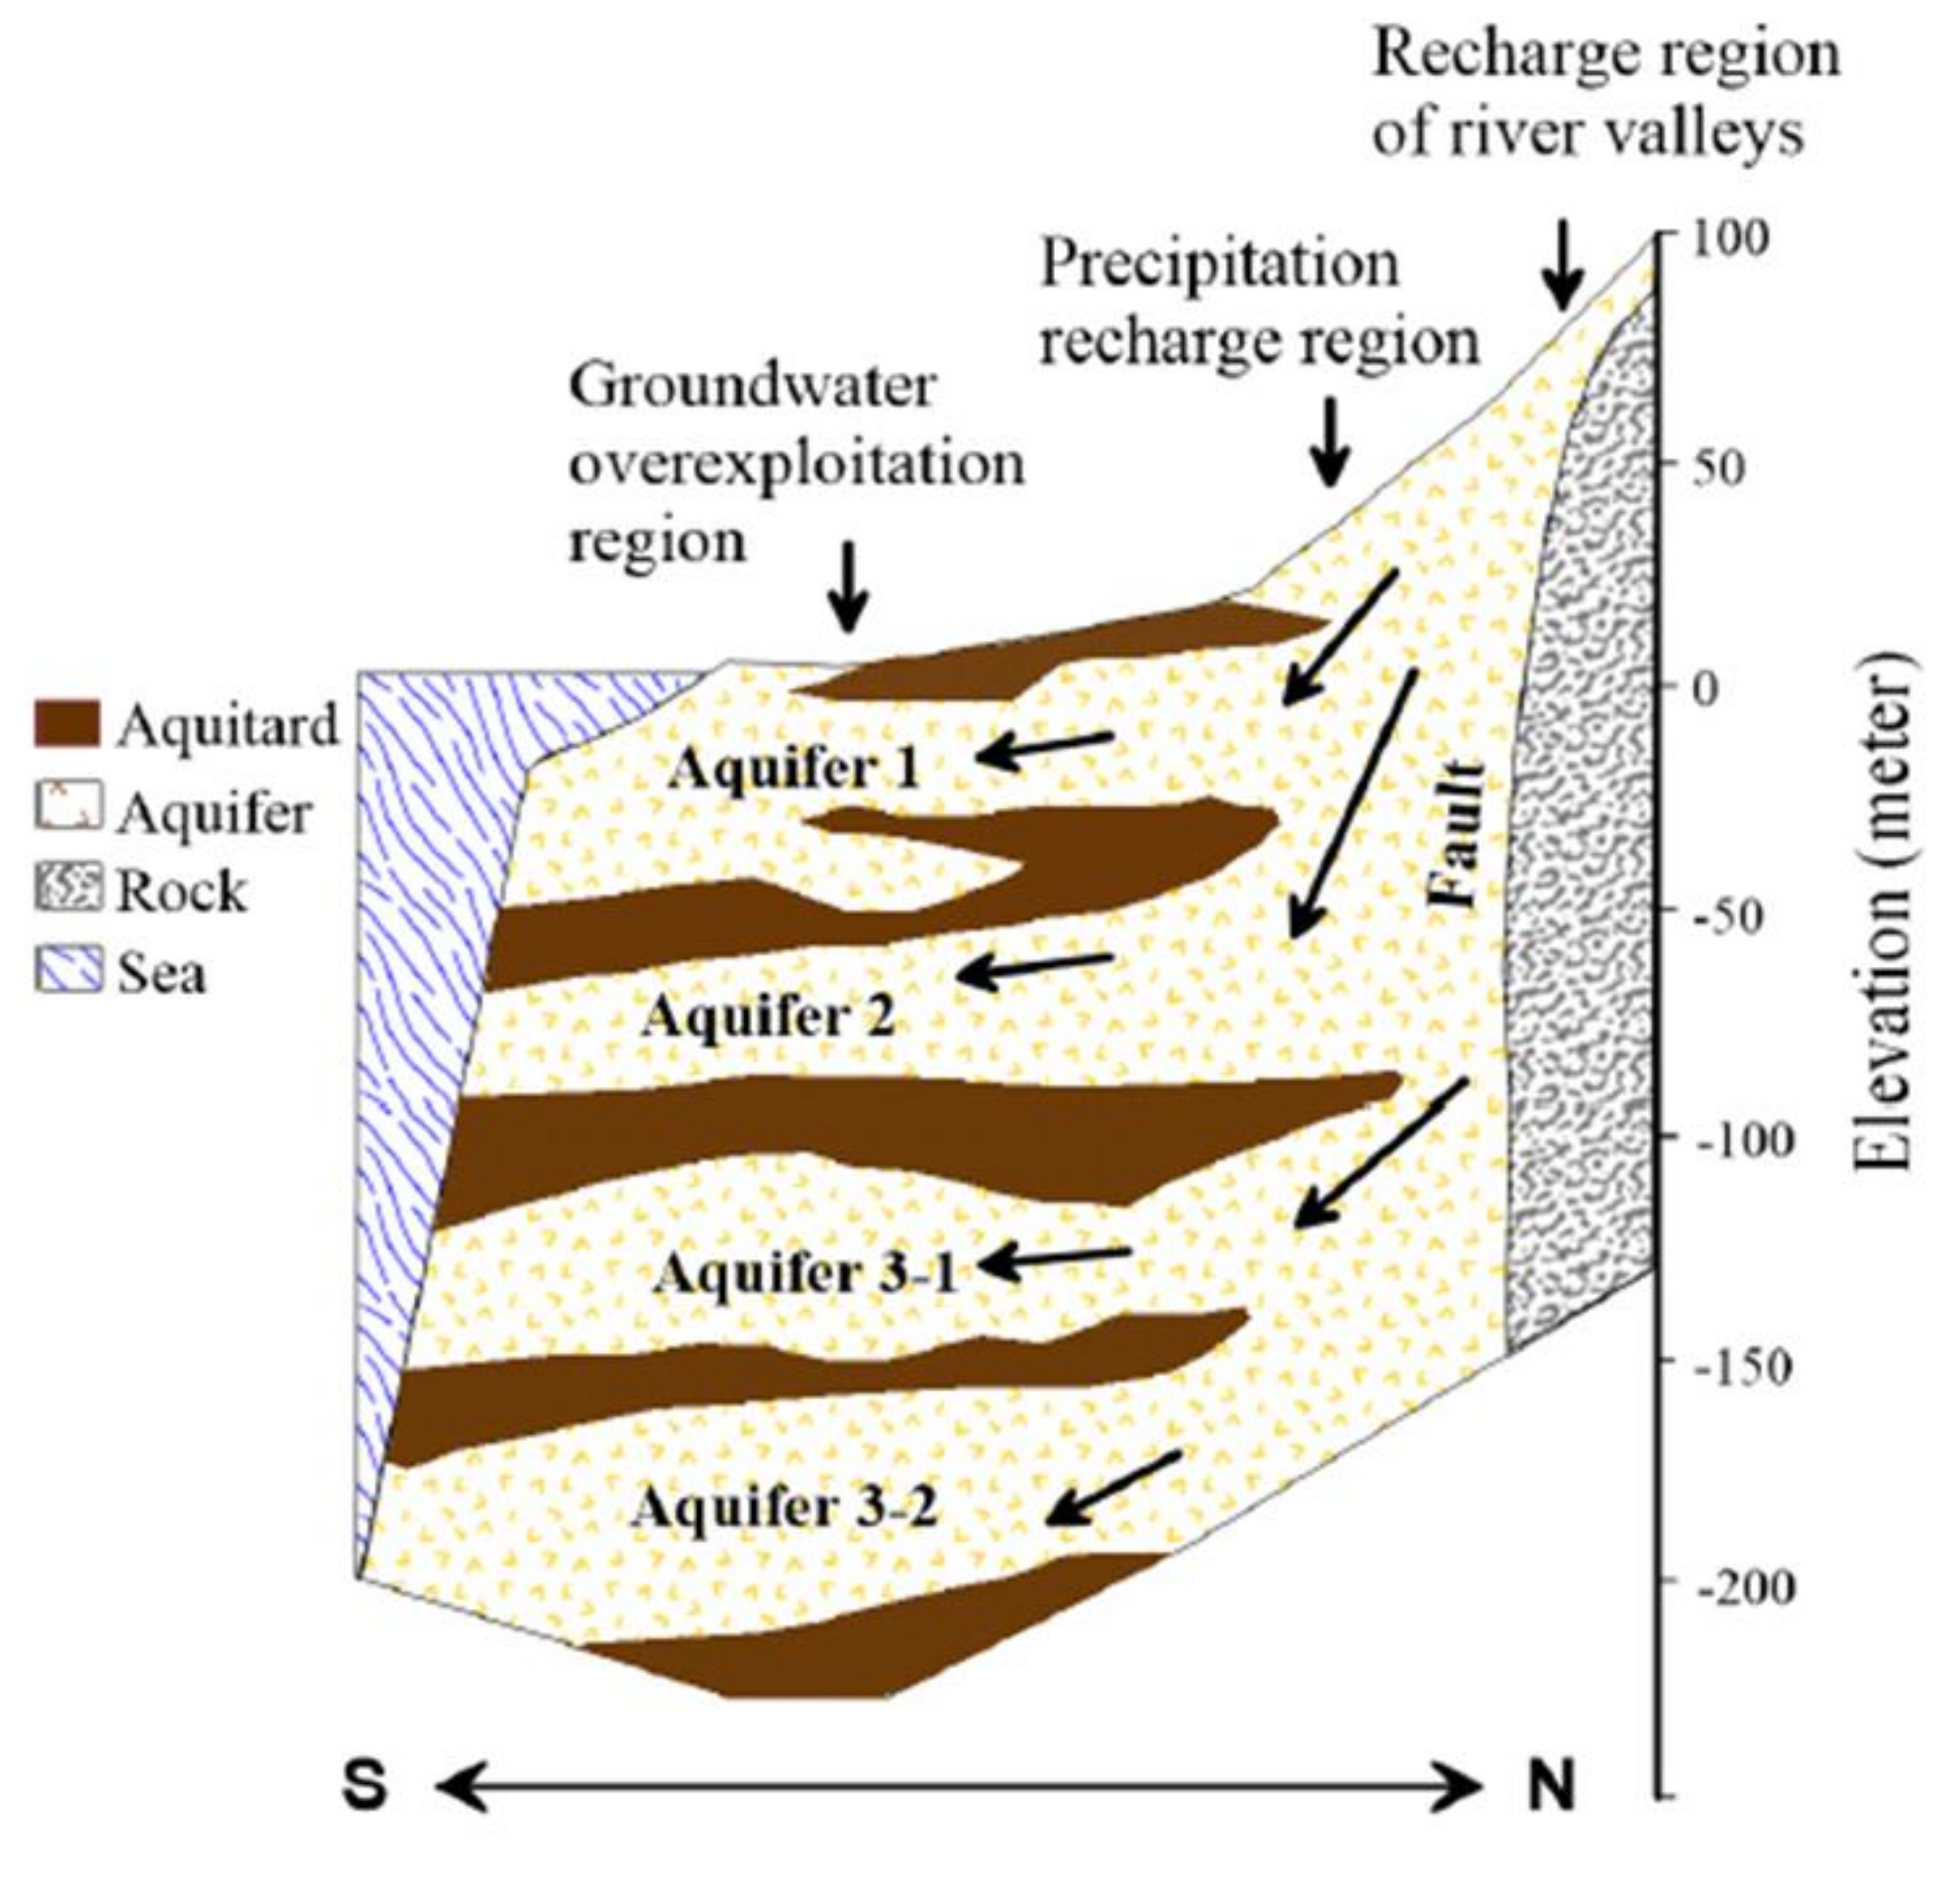
2.1. Study Area
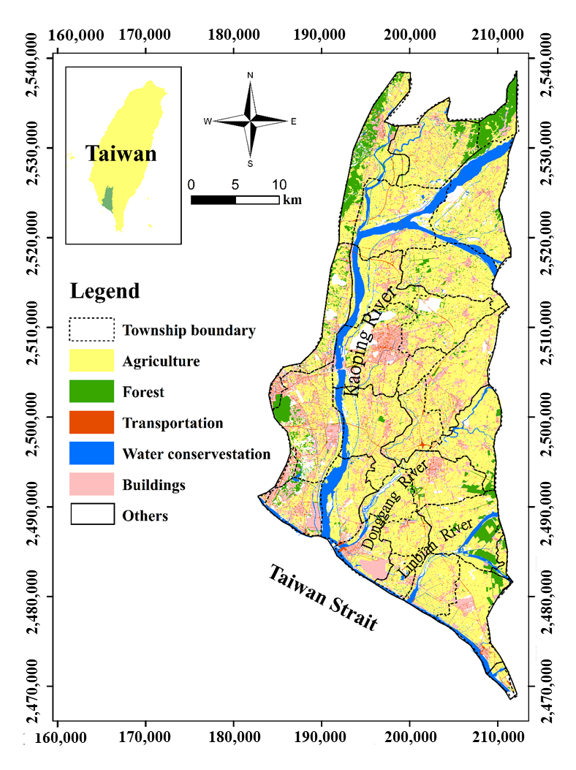
2.2. Data Collection and Processing
2.3. Factor Analysis
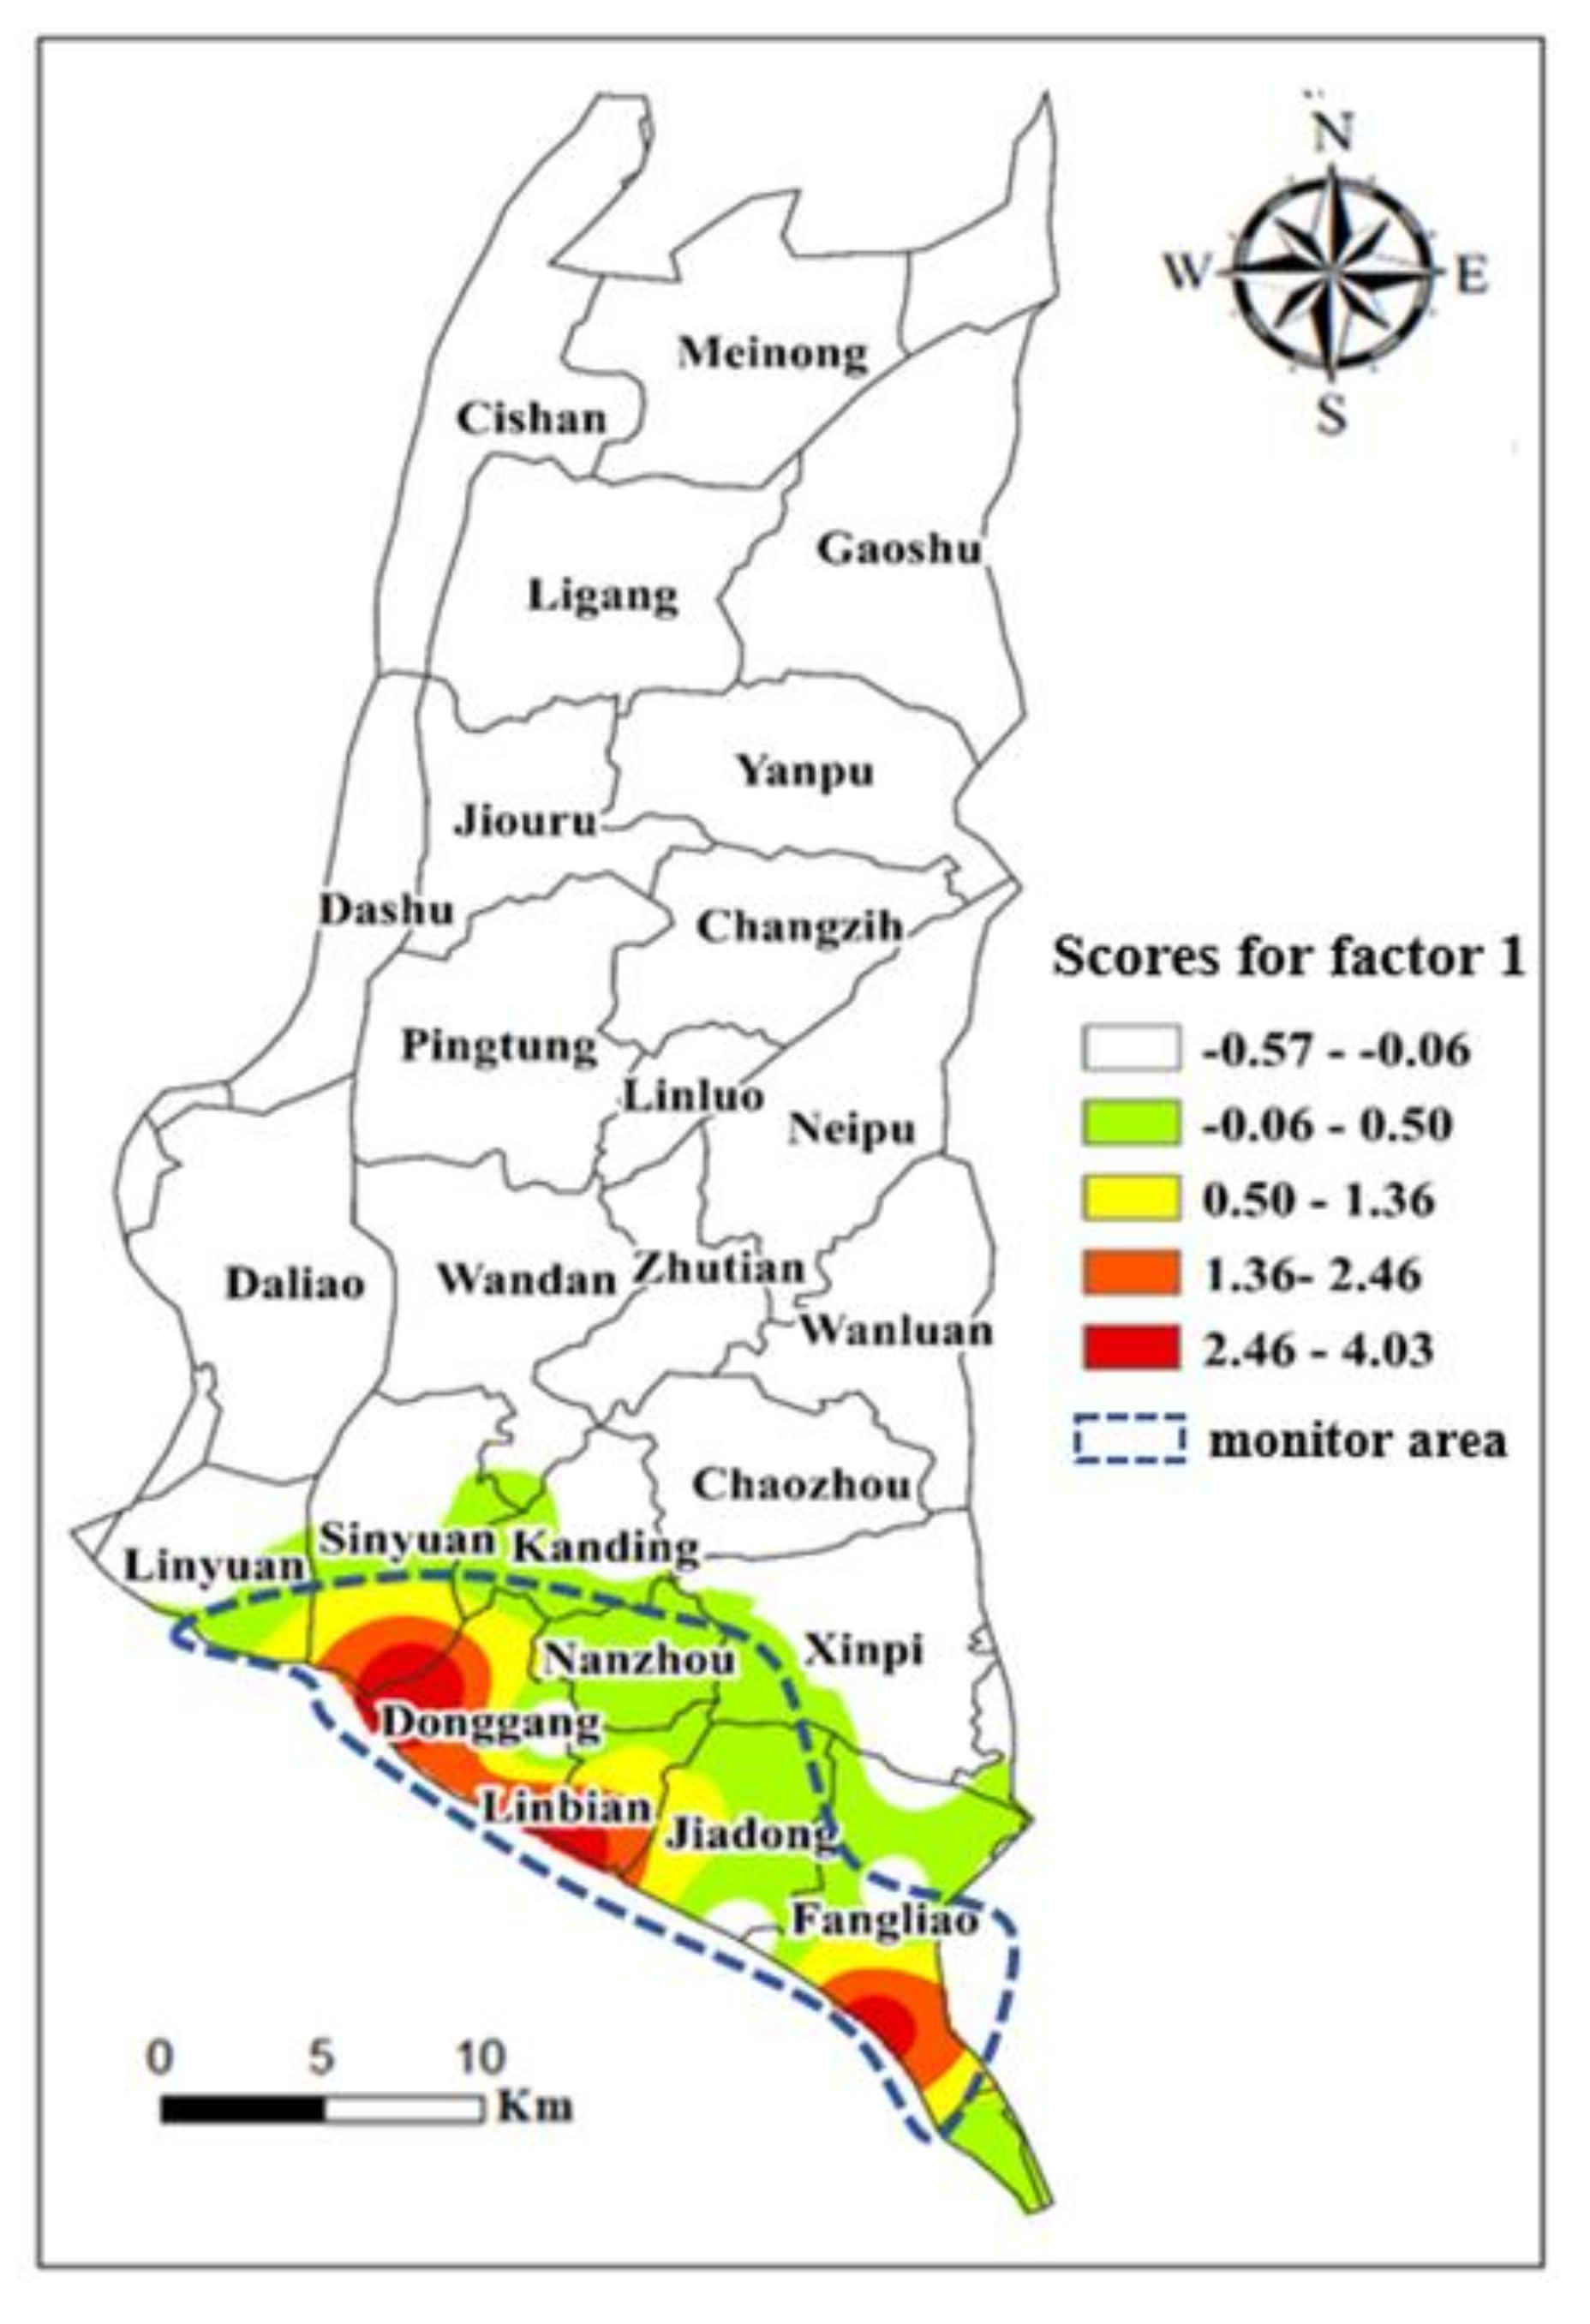
3. Results and Discussion
4. Conclusions
Author Contributions
Funding
Acknowledgments
Conflicts of Interest
Appendix A

| Wells | E.C. (μ S/cm) | HCO3− (mg/L) | E. Coli (CFU/100mL) | Cl− (mg/L) | SO42- (mg/L) | NO3−-N (mg/L) | TOC (mg/L) | As (mg/L) | Fe3+ (mg/L) | Mn2+ (mg/L) | Ca2+ (mg/L) | Mg2+ (mg/L) | Na+ (mg/L) | K+ (mg/L) |
|---|---|---|---|---|---|---|---|---|---|---|---|---|---|---|
| #1 | 993 | 314.0 | 4 | 50.5 | 159 | 0.048 | 0.55 | 0.008 | 4.305 | 0.600 | 151.000 | 22.975 | 34.275 | 4.503 |
| #2 | 542 | 139.0 | 70 | 27.7 | 59.5 | 0.005 | 0.50 | 0.004 | 0.474 | 1.160 | 45.600 | 22.700 | 35.550 | 3.120 |
| #3 | 752 | 274.8 | 100 | 109.5 | 1.033 | 0.122 | 0.72 | 0.017 | 114.335 | 2.619 | 78.433 | 37.133 | 73.467 | 15.908 |
| #4 | 700 | 213.5 | 63 | 17.5 | 69.4 | 1.905 | 0.60 | 0.001 | 0.025 | 0.373 | 104.250 | 22.800 | 21.150 | 15.650 |
| #5 | 10,385 | 217.0 | 3 | 16.6 | 58.05 | 0.005 | 0.35 | 0.010 | 3.080 | 0.408 | 115.000 | 13.600 | 18.450 | 7.465 |
| #6 | 35,541 | 262.4 | 14 | 16,562.5 | 1971.25 | 0.026 | 0.30 | 0.008 | 0.977 | 1.311 | 304.000 | 1002.500 | 7947.500 | 318.625 |
| #7 | 498 | 165.0 | 238 | 18.3 | 107 | 1.310 | 0.35 | 0.001 | 0.102 | 0.106 | 105.000 | 15.650 | 12.900 | 1.800 |
| #8 | 4700 | 195.5 | 198 | 19.0 | 40.1 | 0.005 | 0.95 | 0.009 | 6.140 | 0.450 | 76.800 | 22.050 | 22.400 | 4.350 |
| #9 | 780 | 307.7 | 9 | 31.6 | 102.843 | 0.604 | 0.67 | 0.068 | 4.929 | 0.246 | 122.571 | 24.257 | 75.243 | 2.490 |
| #10 | 411 | 81.0 | 3 | 3.9 | 28.75 | 1.005 | 0.50 | 0.001 | 3.685 | 0.291 | 34.550 | 8.340 | 19.600 | 1.385 |
| #11 | 634 | 215.0 | 275 | 84.9 | 59.35 | 2.815 | 0.50 | 0.001 | 0.403 | 0.826 | 118.000 | 21.500 | 39.400 | 19.800 |
| #12 | 453 | 133.5 | 205 | 79.6 | 10.95 | 0.005 | 0.80 | 0.076 | 0.565 | 0.137 | 48.250 | 18.200 | 46.700 | 2.930 |
| #13 | 515 | 175.0 | 9,345 | 17.0 | 72.933 | 3.190 | 0.40 | 0.004 | 0.903 | 0.167 | 82.067 | 14.867 | 14.233 | 1.513 |
| #14 | 405 | 154.0 | 50 | 18.9 | 51.55 | 5.740 | 0.25 | 0.000 | 0.181 | 0.194 | 59.750 | 20.300 | 23.600 | 4.660 |
| #15 | 3036 | 184.5 | 75 | 28.0 | 10.35 | 0.005 | 0.35 | 0.010 | 0.882 | 0.306 | 45.800 | 8.015 | 65.900 | 1.970 |
| #16 | 436 | 19.3 | 28 | 5.3 | 35.25 | 2.615 | 0.15 | 0.003 | 0.431 | 0.029 | 9.295 | 7.350 | 12.850 | 1.091 |
| #17 | 629 | 171.0 | 13 | 72.1 | 36.25 | 0.105 | 0.40 | 0.043 | 1.530 | 0.107 | 84.250 | 16.700 | 46.700 | 1.535 |
| #18 | 869 | 340.9 | 23 | 1178.4 | 108.4 | 0.256 | 0.61 | 0.063 | 4.821 | 0.122 | 111.000 | 30.800 | 45.222 | 6.772 |
| #19 | 494 | 177.0 | 600 | 25.0 | 103.8 | 0.445 | 0.50 | 0.024 | 3.750 | 0.517 | 86.150 | 12.585 | 19.350 | 2.425 |
| #20 | 592 | 171.5 | 88 | 4.5 | 151.25 | 2.688 | 0.20 | 0.000 | 0.018 | 0.002 | 95.200 | 16.750 | 14.000 | 1.465 |
| #21 | 534 | 54.0 | 700 | 10.3 | 12.55 | 8.095 | 0.15 | 0.001 | 0.062 | 0.001 | 28.700 | 8.435 | 12.850 | 2.030 |
| #22 | 475 | 118.7 | 22 | 3.5 | 64.5 | 1.033 | 0.17 | 0.000 | 0.018 | 0.001 | 55.033 | 13.533 | 6.120 | 0.908 |
| #23 | 10,145 | 76.0 | 385 | 4.7 | 18.3 | 2.535 | 0.20 | 0.000 | 0.013 | 0.001 | 30.400 | 11.400 | 7.775 | 0.764 |
| #24 | 816 | 334.5 | 5 | 26.7 | 157 | 0.060 | 0.58 | 0.050 | 4.050 | 0.094 | 151.250 | 18.600 | 34.250 | 2.518 |
| #25 | 16,728 | 97.5 | 3 | 14,450.0 | 1690 | 0.060 | 0.25 | 0.017 | 3.300 | 1.545 | 289.500 | 833.500 | 6435.000 | 230.500 |
| #26 | 571 | 169.5 | 5,500 | 50.5 | 61.5 | 0.005 | 0.70 | 0.001 | 3.025 | 0.604 | 89.000 | 17.250 | 29.750 | 5.305 |
| #27 | 515 | 145.7 | 33 | 2.4 | 100.2 | 0.650 | 0.13 | 0.000 | 0.196 | 0.004 | 63.467 | 17.533 | 6.527 | 0.944 |
| #28 | 32,787 | 202.4 | 8 | 16,402.5 | 2104.425 | 0.036 | 0.37 | 0.024 | 0.351 | 0.077 | 260.325 | 891.500 | 6982.500 | 279.900 |
| #29 | 660 | 158.5 | 75 | 38.8 | 118 | 0.025 | 0.50 | 0.009 | 4.135 | 0.550 | 117.000 | 19.850 | 33.350 | 4.400 |
| #30 | 571 | 107.0 | 250 | 5.5 | 102.3 | 1.090 | 0.30 | 0.005 | 0.110 | 0.001 | 80.150 | 13.900 | 12.350 | 1.920 |
| #31 | 436 | 201.7 | 8 | 6.4 | 32 | 4.700 | 0.40 | 0.000 | 0.063 | 0.004 | 66.800 | 23.667 | 11.033 | 1.423 |
| #32 | 400 | 261.1 | 2930 | 7.9 | 6.533 | 0.083 | 0.23 | 0.022 | 11.530 | 0.586 | 64.782 | 9.186 | 12.797 | 2.154 |
| #33 | 500 | 124.3 | 60 | 3.4 | 33.133 | 1.777 | 0.20 | 0.000 | 0.068 | 0.002 | 45.200 | 15.300 | 6.613 | 0.960 |
| #34 | 281 | 38.2 | 90 | 6.2 | 14.15 | 6.600 | 0.08 | 0.000 | 0.107 | 0.001 | 19.550 | 6.960 | 7.715 | 1.373 |
| #35 | 606 | 195.2 | 83 | 3.9 | 138.8 | 2.282 | 0.36 | 0.000 | 0.135 | 0.003 | 94.160 | 17.940 | 10.448 | 1.630 |
| #36 | 591 | 101.0 | 8 | 4.8 | 60.35 | 4.600 | 0.15 | 0.000 | 0.041 | 0.001 | 64.100 | 14.900 | 8.200 | 1.130 |
| #37 | 10,333 | 114.5 | 10 | 4.5 | 121.5 | 6.335 | 0.25 | 0.000 | 0.032 | 0.001 | 89.550 | 16.800 | 8.360 | 1.850 |
| #38 | 724 | 237.6 | 5 | 8.8 | 120.4 | 0.790 | 0.30 | 0.007 | 1.219 | 0.284 | 141.200 | 25.700 | 27.200 | 3.140 |
| #39 | 669 | 80.0 | 650 | 3.4 | 32.85 | 3.230 | 0.20 | 0.002 | 2.045 | 2.567 | 38.850 | 8.115 | 14.500 | 1.013 |
| #40 | 592 | 290.0 | 120 | 26.3 | 2.2 | 0.030 | 3.35 | 0.291 | 0.646 | 0.029 | 20.200 | 27.900 | 78.250 | 45.000 |
| #41 | 637 | 102.0 | 28 | 4.4 | 32.1 | 7.135 | 0.20 | 0.000 | 0.143 | 0.009 | 52.850 | 15.750 | 9.120 | 1.225 |
| #42 | 587 | 211.2 | 90 | 4.2 | 127.86 | 1.292 | 0.18 | 0.000 | 0.034 | 0.002 | 92.220 | 18.460 | 14.480 | 1.980 |
| #43 | 502 | 118.5 | 50 | 7.2 | 93.85 | 0.860 | 0.15 | 0.001 | 1.940 | 0.100 | 74.350 | 13.150 | 14.650 | 1.715 |
| #44 | 251 | 113.0 | 355 | 1.9 | 19.4 | 0.185 | 0.50 | 0.011 | 2.230 | 0.498 | 20.050 | 7.160 | 43.850 | 1.169 |
| #45 | 369 | 127.7 | 100 | 3.9 | 1.6 | 0.005 | 0.35 | 0.001 | 0.325 | 0.239 | 42.150 | 4.855 | 30.350 | 1.570 |
| #46 | 520 | 169.5 | 175 | 8.4 | 47.05 | 9.380 | 0.20 | 0.000 | 0.481 | 0.013 | 103.700 | 18.300 | 8.570 | 1.840 |
| Wells | Rice Field,% | Dryland, % | Fruit Farm,% | Uncultivated Land,% | Aquaculture, % | Livestock, % | Forest, % | Water Conservation, % | Human Settlement, % |
|---|---|---|---|---|---|---|---|---|---|
| #1 | 17 | 12 | 22 | 0 | 3 | 10 | 0 | 2 | 14 |
| #2 | 1 | 6 | 1 | 0 | 0 | 0 | 25 | 0 | 44 |
| #3 | 0 | 62 | 0 | 0 | 0 | 2 | 12 | 0 | 27 |
| #4 | 0 | 0 | 32 | 5 | 0 | 0 | 0 | 4 | 45 |
| #5 | 0 | 2 | 22 | 0 | 0 | 0 | 1 | 2 | 4 |
| #6 | 0 | 2 | 2 | 0 | 52 | 0 | 0 | 22 | 8 |
| #7 | 1 | 4 | 66 | 0 | 6 | 4 | 0 | 6 | 8 |
| #8 | 5 | 17 | 0 | 0 | 63 | 0 | 0 | 1 | 13 |
| #9 | 20 | 3 | 20 | 0 | 2 | 0 | 0 | 18 | 3 |
| #10 | 0 | 56 | 4 | 0 | 0 | 0 | 0 | 1 | 36 |
| #11 | 23 | 7 | 11 | 0 | 19 | 16 | 0 | 8 | 8 |
| #12 | 23 | 11 | 11 | 0 | 19 | 15 | 0 | 8 | 8 |
| #13 | 15 | 4 | 38 | 0 | 9 | 4 | 0 | 0 | 27 |
| #14 | 0 | 0 | 64 | 0 | 0 | 0 | 5 | 3 | 25 |
| #15 | 0 | 1 | 4 | 0 | 0 | 0 | 1 | 5 | 68 |
| #16 | 0 | 1 | 89 | 1 | 0 | 1 | 0 | 0 | 5 |
| #17 | 0 | 0 | 5 | 0 | 7 | 0 | 0 | 71 | 1 |
| #18 | 3 | 52 | 9 | 0 | 1 | 0 | 0 | 0 | 33 |
| #19 | 41 | 12 | 11 | 0 | 3 | 4 | 0 | 1 | 25 |
| #20 | 0 | 12 | 35 | 0 | 15 | 0 | 16 | 9 | 5 |
| #21 | 0 | 2 | 1 | 0 | 0 | 0 | 7 | 3 | 1 |
| #22 | 0 | 0 | 98 | 0 | 0 | 0 | 0 | 0 | 2 |
| #23 | 0 | 0 | 0 | 0 | 0 | 0 | 18 | 0 | 73 |
| #24 | 0 | 0 | 0 | 0 | 0 | 0 | 0 | 31 | 59 |
| #25 | 0 | 0 | 0 | 0 | 0 | 0 | 0 | 77 | 0 |
| #26 | 0 | 6 | 8 | 0 | 9 | 3 | 0 | 0 | 62 |
| #27 | 0 | 18 | 59 | 0 | 0 | 0 | 0 | 0 | 4 |
| #28 | 0 | 0 | 4 | 0 | 2 | 0 | 0 | 8 | 6 |
| #29 | 8 | 34 | 9 | 4 | 2 | 2 | 0 | 0 | 40 |
| #30 | 0 | 10 | 30 | 0 | 20 | 4 | 4 | 36 | 4 |
| #31 | 0 | 60 | 0 | 0 | 0 | 0 | 1 | 0 | 37 |
| #32 | 0 | 0 | 55 | 0 | 0 | 0 | 3 | 0 | 40 |
| #33 | 0 | 0 | 99 | 0 | 0 | 0 | 0 | 0 | 0 |
| #34 | 0 | 3 | 77 | 0 | 3 | 3 | 0 | 0 | 1 |
| #35 | 5 | 21 | 48 | 0 | 0 | 0 | 0 | 2 | 24 |
| #36 | 3 | 9 | 21 | 2 | 9 | 9 | 12 | 3 | 23 |
| #37 | 1 | 3 | 74 | 4 | 0 | 7 | 1 | 0 | 7 |
| #38 | 1 | 34 | 19 | 1 | 25 | 4 | 1 | 0 | 8 |
| #39 | 0 | 1 | 64 | 1 | 0 | 5 | 0 | 5 | 23 |
| #40 | 6 | 14 | 9 | 0 | 20 | 0 | 0 | 3 | 5 |
| #41 | 1 | 3 | 84 | 0 | 3 | 1 | 0 | 0 | 4 |
| #42 | 34 | 17 | 23 | 1 | 12 | 0 | 0 | 3 | 2 |
| #43 | 0 | 9 | 6 | 3 | 0 | 0 | 0 | 1 | 79 |
| #44 | 0 | 0 | 91 | 2 | 0 | 1 | 1 | 0 | 4 |
| #45 | 0 | 44 | 14 | 0 | 0 | 0 | 12 | 0 | 14 |
| #46 | 0 | 15 | 52 | 0 | 3 | 15 | 0 | 0 | 10 |
| Wells | Types of Unsaturated Soil | ||||
|---|---|---|---|---|---|
| Depth (m) | Gravel,% | Coarse Sand,% | Fine Sand,% | Clay,% | |
| #1 | 39.2 | 4 | 9 | 4 | 0 |
| #2 | 63.0 | 0 | 0 | 3 | 15 |
| #3 | 39.2 | 0 | 3 | 1 | 4 |
| #4 | 27.3 | 18 | 3 | 0 | 23 |
| #5 | 24.0 | 18 | 0 | 1 | 0 |
| #6 | 24.5 | 0 | 0 | 1 | 1 |
| #7 | 36.2 | 0 | 7 | 3 | 7 |
| #8 | 30.9 | 0 | 0 | 6 | 6 |
| #9 | 55.6 | 0 | 0 | 3 | 0 |
| #10 | 36.5 | 0 | 0 | 4 | 5 |
| #11 | 29.4 | 0 | 1 | 2 | 2 |
| #12 | 47.5 | 0 | 2 | 0 | 0 |
| #13 | 33.8 | 0 | 5 | 1 | 5 |
| #14 | 42.1 | 5 | 16 | 3 | 0 |
| #15 | 53.0 | 0 | 7 | 3 | 6 |
| #16 | 47.3 | 25 | 4 | 4 | 0 |
| #17 | 35.8 | 3 | 3 | 0 | 0 |
| #18 | 44.0 | 0 | 3 | 0 | 2 |
| #19 | 38.2 | 0 | 5 | 5 | 0 |
| #20 | 114.2 | 17 | 34 | 0 | 1 |
| #21 | 35.5 | 22 | 0 | 7 | 0 |
| #22 | 71.5 | 44 | 0 | 0 | 0 |
| #23 | 66.9 | 13 | 0 | 8 | 15 |
| #24 | 49.4 | 0 | 1 | 3 | 6 |
| #25 | 25.3 | 3 | 0 | 0 | 0 |
| #26 | 24.0 | 0 | 0 | 0 | 16 |
| #27 | 78.3 | 59 | 12 | 3 | 1 |
| #28 | 26.0 | 0 | 0 | 3 | 0 |
| #29 | 27.0 | 3 | 5 | 0 | 0 |
| #30 | 71.9 | 0 | 23 | 1 | 15 |
| #31 | 62.0 | 31 | 0 | 0 | 0 |
| #32 | 116.4 | 13 | 0 | 14 | 0 |
| #33 | 70.5 | 45 | 0 | 0 | 0 |
| #34 | 108.9 | 63 | 0 | 0 | 4 |
| #35 | 75.8 | 65 | 0 | 0 | 0 |
| #36 | 112.0 | 30 | 4 | 1 | 1 |
| #37 | 100.0 | 44 | 0 | 0 | 0 |
| #38 | 111.6 | 20 | 10 | 4 | 1 |
| #39 | 149.5 | 3 | 10 | 2 | 8 |
| #40 | 66.5 | 0 | 0 | 0 | 3 |
| #41 | 95.8 | 9 | 4 | 0 | 16 |
| #42 | 126.1 | 45 | 7 | 0 | 2 |
| #43 | 117.8 | 9 | 5 | 12 | 13 |
| #44 | 51.8 | 2 | 8 | 5 | 11 |
| #45 | 242.1 | 14 | 4 | 0 | 0 |
| #46 | 77.7 | 37 | 0 | 0 | 0 |
| EC | HCO3− | E. Coli | Cl− | SO42− | NO3−-N | TOC | As | Fe3+ | Mn2+ | Ca2+ | Mg2+ | Na+ | K+ | Rice Field | Dry-Land | Fruit Farm | Uncultivated Land | Aqua-Culture | Live-Stock | Forest | Water Conservation | Human Settlement | Gravel | Coarse Sand | Fine Sand | Clay | |
|---|---|---|---|---|---|---|---|---|---|---|---|---|---|---|---|---|---|---|---|---|---|---|---|---|---|---|---|
| EC | 1.00 | 0.09 | −0.10 | 0.91 | 0.91 | −0.16 | −0.08 | −0.03 | −0.05 | 0.18 | 0.75 | 0.91 | 0.92 | 0.92 | −0.16 | −0.22 | −0.24 | −0.04 | 0.31 | −0.15 | −0.06 | 0.26 | −0.13 | −0.15 | −0.22 | −0.01 | −0.13 |
| HCO3− | 1.00 | 0.02 | 0.09 | 0.11 | −0.43 | 0.42 | 0.41 | 0.26 | 0.11 | 0.43 | 0.09 | 0.08 | 0.13 | 0.25 | 0.24 | −0.39 | −0.16 | 0.21 | −0.03 | −0.17 | 0.03 | 0.11 | −0.30 | −0.07 | −0.05 | −0.17 | |
| E. Coli | 1.00 | −0.08 | −0.09 | 0.01 | 0.01 | −0.06 | −0.01 | 0.02 | −0.06 | −0.09 | −0.08 | −0.09 | 0.12 | −0.14 | 0.01 | −0.11 | 0.02 | 0.06 | −0.08 | −0.12 | 0.22 | −0.17 | −0.04 | 0.05 | 0.15 | ||
| Cl− | 1.00 | 0.99 | −0.20 | −0.07 | 0.00 | −0.04 | 0.26 | 0.83 | 0.99 | 0.99 | 0.99 | −0.13 | −0.17 | −0.25 | −0.12 | 0.24 | −0.15 | −0.13 | 0.43 | −0.19 | −0.20 | −0.17 | −0.08 | −0.17 | |||
| SO42− | 1.00 | −0.21 | −0.09 | −0.02 | −0.06 | 0.23 | 0.86 | 0.99 | 0.99 | 0.98 | −0.10 | −0.18 | −0.24 | −0.09 | 0.24 | −0.15 | −0.14 | 0.42 | −0.19 | −0.18 | −0.13 | −0.08 | −0.17 | ||||
| NO3−-N | 1.00 | −0.30 | −0.26 | −0.16 | −0.25 | −0.27 | −0.20 | −0.20 | −0.21 | −0.15 | −0.12 | 0.38 | 0.10 | −0.19 | 0.29 | 0.04 | −0.23 | −0.18 | 0.44 | 0.01 | −0.13 | −0.04 | |||||
| TOC | 1.00 | 0.92 | 0.10 | 0.02 | −0.10 | −0.06 | −0.07 | 0.02 | 0.14 | 0.14 | −0.29 | −0.07 | 0.28 | −0.03 | −0.10 | −0.04 | −0.02 | −0.33 | −0.17 | −0.13 | 0.03 | ||||||
| As | 1.00 | 0.01 | −0.08 | −0.06 | 0.00 | 0.00 | 0.07 | 0.14 | 0.03 | −0.22 | −0.14 | 0.15 | −0.05 | −0.14 | 0.10 | −0.11 | −0.27 | −0.16 | −0.11 | −0.12 | |||||||
| Fe3+ | 1.00 | 0.59 | 0.00 | −0.03 | −0.04 | −0.02 | −0.06 | 0.44 | −0.17 | −0.07 | −0.07 | −0.04 | 0.21 | −0.06 | 0.07 | −0.16 | −0.05 | 0.00 | −0.02 | ||||||||
| Mn2+ | 1.00 | 0.25 | 0.28 | 0.27 | 0.27 | −0.03 | 0.13 | −0.19 | −0.04 | 0.06 | 0.05 | 0.14 | 0.16 | 0.08 | −0.38 | −0.06 | 0.01 | 0.09 | |||||||||
| Ca2+ | 1.00 | 0.84 | 0.83 | 0.82 | 0.05 | −0.09 | −0.36 | −0.04 | 0.28 | 0.01 | −0.23 | 0.49 | −0.13 | −0.23 | −0.08 | −0.15 | −0.21 | ||||||||||
| Mg2+ | 1.00 | 0.99 | 0.99 | −0.12 | −0.17 | −0.25 | −0.11 | 0.27 | −0.15 | −0.12 | 0.44 | −0.19 | −0.20 | −0.17 | −0.08 | −0.17 | |||||||||||
| Na+ | 1.00 | 0.99 | −0.12 | −0.18 | −0.24 | −0.11 | 0.27 | −0.15 | −0.13 | 0.43 | −0.19 | −0.20 | −0.17 | −0.07 | −0.16 | ||||||||||||
| K+ | 1.00 | −0.12 | −0.17 | −0.26 | −0.11 | 0.30 | −0.14 | −0.13 | 0.40 | −0.20 | −0.22 | −0.18 | −0.09 | −0.15 | |||||||||||||
| Rice field | 1.00 | 0.00 | −0.19 | −0.08 | 0.14 | 0.37 | −0.20 | −0.08 | −0.14 | −0.11 | −0.02 | −0.02 | −0.22 | ||||||||||||||
| Dryland | 1.00 | −0.35 | −0.07 | −0.01 | −0.05 | 0.09 | −0.24 | 0.12 | −0.01 | −0.01 | −0.18 | −0.20 | |||||||||||||||
| Fruit farm | 1.00 | 0.15 | −0.26 | 0.04 | −0.22 | −0.27 | −0.39 | 0.51 | 0.16 | −0.09 | −0.02 | ||||||||||||||||
| Uncultivated land | 1.00 | −0.15 | 0.04 | −0.09 | −0.15 | 0.20 | 0.13 | −0.01 | −0.01 | 0.28 | |||||||||||||||||
| Aquaculture | 1.00 | 0.12 | −0.11 | 0.08 | −0.23 | −0.22 | 0.07 | −0.03 | −0.02 | ||||||||||||||||||
| Livestock | 1.00 | −0.11 | −0.09 | −0.17 | −0.03 | 0.00 | −0.16 | −0.14 | |||||||||||||||||||
| Forest | 1.00 | −0.12 | 0.22 | −0.07 | 0.22 | 0.11 | 0.20 | ||||||||||||||||||||
| Water conservation | 1.00 | −0.21 | −0.26 | 0.05 | −0.18 | −0.08 | |||||||||||||||||||||
| Human Settlement | 1.00 | −0.26 | −0.13 | 0.39 | 0.50 | ||||||||||||||||||||||
| Gravel | 1.00 | −0.07 | −0.21 | −0.26 | |||||||||||||||||||||||
| Coarse sand | 1.00 | −0.06 | 0.06 | ||||||||||||||||||||||||
| Fine sand | 1.00 | 0.14 | |||||||||||||||||||||||||
| Clay | 1.00 |
References
- Consuming Water Resources Database of Taiwan. Available online: http://wuss.wra.gov.tw (accessed on 30 June 2019).
- Agriculture Engineering Research Center. Survey, Analysis and Assessment of Groundwater Quality in Taiwan Areas in 2009; Water Resources Agency, Ministry of Economic Affairs, Executive Yuan: Taiwan, 2009; pp. 100–102. [Google Scholar]
- Agriculture Engineering Research Center. Survey, Analysis and Assessment of Groundwater Quality of Taiwan in 2010; Water Resources Agency, Ministry of Economic Affairs, Executive Yuan: Taiwan, 2010; pp. 151–158. [Google Scholar]
- Agriculture Engineering Research Center. Survey, Analysis and Assessment of Groundwater Quality of Taiwan in 2011; Water Resources Agency, Ministry of Economic Affairs, Executive Yuan: Taiwan, 2011; pp. 191–203. [Google Scholar]
- Agriculture Engineering Research Center. Survey, Analysis and Assessment of Groundwater Quality of Taiwan in 2012–2014 (1/3); Water Resources Agency, Ministry of Economic Affairs, Executive Yuan: Taiwan, 2012; pp. 85–101. [Google Scholar]
- Hsu, L.I.; Chen, G.S.; Lee, C.H.; Yang, T.Y.; Chen, Y.H.; Wang, Y.H.; Hsueh, Y.M.; Chiou, H.Y.; Wu, M.M.; Chen, C.J. Use of Arsenic-Induced Palmoplantar Hyperkeratosis and Skin Cancers to Predict Risk of Subsequent Internal Malignancy. Am. J. Epidemiol. 2013, 177, 202–212. [Google Scholar] [CrossRef] [PubMed] [Green Version]
- Liang, C.P.; Jang, C.S.; Chen, C.F.; Chen, J.S. Zonal Management of Multi-Purposes Groundwater Utilization Based on Water Quality and Impact on the Aquifer. Environ. Monit. Assess. 2016, 188, 431. [Google Scholar] [CrossRef] [PubMed]
- Liang, C.P.; Chien, Y.C.; Jang, C.S.; Chen, C.F.; Chen, J.S. Spatial Analysis of Human Health Risk Due to Arsenic Exposure through Drinking Groundwater in Taiwan’s Pingtung Plain. Int. J. Environ. Res. Public Health 2017, 14, 81. [Google Scholar] [CrossRef] [PubMed] [Green Version]
- Liang, C.P.; Chen, J.S.; Chien, Y.C.; Chen, C.F. Spatial Analysis of the Risk to Human Health from Exposure to Arsenic Contaminated Groundwater: A Kriging Approach. Sci. Total Environ. 2018, 627, 1048–1057. [Google Scholar] [CrossRef]
- Liang, C.P.; Hsu, W.S.; Chien, Y.C.; Wan, S.W.; Chen, J.S. The Combined Use of Groundwater Quality, Drawdown Index and Land Use to Establish a Multi-Purpose Groundwater Utilization Plan. Water Resour. Manag. 2019, 33, 4231–4247. [Google Scholar] [CrossRef]
- Bulka, C.M.; Jones, R.M.; Turyk, M.E.; Stayner, L.T.; Argos, M. Arsenic in Drinking Water and Prostate Cancer in Illinois Counties: An Ecologic Study. Environ. Res. 2016, 148, 450–456. [Google Scholar] [CrossRef] [Green Version]
- States, J.C. Disruption of Mitotic Progression by Arsenic. Biol. Trace Elem. Res. 2015, 166, 34–40. [Google Scholar] [CrossRef]
- Chen, C.; Jiang, X.; Zhang, Z. MicroRNA-155 Regulates Arsenite-Induced Malignant Transformation by Targeting Nrf2-Mediated Oxidative Damage in Human Bronchial Fepithelial Cells. Toxicol. Lett. 2017, 278, 38–47. [Google Scholar] [CrossRef]
- Liang, C.P.; Jang, C.S.; Liu, C.W.; Lin, K.H.; Lin, M.C. An Integrated GIS-Based Approach in Assessing Carcinogenic Risks via Food-Chain Exposure in Arsenic-Affected Groundwater Areas. Environ. Toxicol. 2010, 25, 113–123. [Google Scholar] [CrossRef]
- Liang, C.P.; Liu, C.W.; Jang, C.S.; Wang, S.W.; Lee, J.J. Assessing and Managing the Health Risk Due to Ingestion of Inorganic Arsenic from Fish and Shellfish Farmed in Blackfoot Disease Areas for General Taiwanese. J. Hazard. Mater. 2011, 186, 622–628. [Google Scholar] [CrossRef]
- Liang, C.P.; Jang, C.S.; Chen, J.S.; Wang, S.W.; Lee, J.J.; Liu, C.W. Probabilistic Health Risk Assessment for Ingestion of Seafood Farmed in Arsenic Contaminated Groundwater in Taiwan. Environ. Geochem. Health 2013, 35, 455–464. [Google Scholar] [CrossRef] [PubMed]
- Lerner, D.N.; Harris, R.C. The Relationship between Land Use and Groundwater Resources and Quality. Land Use Policy 2009, 26, 265–273. [Google Scholar] [CrossRef]
- Jang, C.S.; Lin, C.W.; Liang, C.P.; Chen, J.S. Developing a Reliable Model for Aquifer Vulnerability. Stoch. Environ. Res. Risk Assess. 2016, 30, 175–187. [Google Scholar] [CrossRef]
- Liang, C.P.; Hsu, S.Y.; Chen, J.S. An Analytical Model for Solute Transport in an Infiltration Tracer Test in Soil with a Shallow Groundwater Table. J. Hydrol. 2016, 540, 129–141. [Google Scholar] [CrossRef]
- Liu, C.W.; Lin, C.N.; Jang, C.S.; Ling, M.P.; Tsai, J.W. Assessing Nitrate Contamination and Its Potential Health Risk to Kinmen Residents. Environ. Geochem. Health 2011, 33, 503–514. [Google Scholar] [CrossRef]
- Wang, X. The Relationship of Land Use and Groundwater Quality: A Case Study of Rhode Island. Master’s Thesis, University of Rhode Island, Kingston, RI, USA, 1989. [Google Scholar]
- Eckhardt, D.V.A.; Stackelberg, P.E. Relation of Ground-Water Quality to Land Use on Long Island, New York. Ground Water 1995, 33, 1019–1031. [Google Scholar] [CrossRef]
- Jeong, C.H. Effect of Land Use and Urbanization on Hydrochemistry and Contamination of Groundwater from Taejon Area, Korea. J. Hydrol. 2001, 253, 194–210. [Google Scholar] [CrossRef]
- Ouyang, Y.; Zang, J.E.; Cui, L. Estimating Impact of Land Use on Groundwater Quality Using Trilinear Analysis. Environ. Monit. Assess. 2014, 186, 5353–5362. [Google Scholar] [CrossRef]
- Penha, A.M.; Chambel, A.; Murteira, M.; Morais, M. Influence of Different Land Use on Groundwater Quality in Southern Portugal. Environ. Earth Sci. 2016, 75, 622. [Google Scholar] [CrossRef]
- Water Resource Agency, Taiwan. Available online: https://www.wra.gov.tw/ (accessed on 30 June 2019).
- Heißerer, T.; Haslauer, C.; Bárdossy, A. Including Land Use Information for the Spatial Estimation of Groundwater Quality Parameters—1. Local Estimation Based on Neighbourhood Composition. J. Hydrol. 2016, 535, 688–698. [Google Scholar] [CrossRef]
- Central Geological Survey, Taiwan. Available online: https://www.moeacgs.gov.tw/ (accessed on 30 June 2019).
- Kaiser, H.F. The Varimax Criterion for Analytic Rotation in Factor Analysis. Psychometrika 1958, 23, 187–201. [Google Scholar] [CrossRef]
- Liu, C.W.; Lin, K.H.; Kuo, Y.M. Application of Factor Analysis in the Assessment of Groundwater Quality in a Blackfoot Disease Area in Taiwan. Sci. Total Environ. 2003, 313, 77–89. [Google Scholar] [CrossRef]
- Jang, C.S.; Chen, S.K. Integrating Indicator-Based Geostatistical Estimation and Aquifer Vulnerability of Nitrate-N for Establishing Groundwater Protection Zone. J. Hydrol. 2015, 523, 441–451. [Google Scholar] [CrossRef]
- Chen, W.F.; Liu, T.K. Dissolved Oxygen and Nitrate of Groundwater in Choshui Fan-Delta, Western Taiwan. Environ. Geol. 2003, 44, 731–737. [Google Scholar] [CrossRef]


| Parameter | Average (mg/L) | Maximum (mg/L) | Minimum (mg/L) | Standard Deviation (-) | Coefficient of Variation (-) | Exceed the Standard for Drinking | Percentage,% | Exceed the Standard for Agriculture | Percentage,% | Exceed the Standard for Aquaculture | Percentage,% |
|---|---|---|---|---|---|---|---|---|---|---|---|
| EC | 3155.60 | 35,541.13 | 251.00 | 7486.01 | 2.4 | -- | -- | 13 | 28 | -- | -- |
| HCO3− | 170.89 | 340.89 | 19.30 | 77.46 | 0.5 | 9 | -- | -- | -- | -- | -- |
| E. Coli | 503.07 | 9345.00 | 2.50 | 1608.82 | 3.2 | 15 | 33 | -- | -- | 0 | 0 |
| Cl− | 1075.45 | 16,562.50 | 1.85 | 3945.15 | 3.7 | 4 | 9 | 4 | 9 | -- | -- |
| SO42− | 185.86 | 2104.43 | 1.03 | 467.96 | 2.5 | 3 | 7 | 3 | 7 | -- | -- |
| NO3−-N | 1.86 | 9.38 | 0.01 | 2.47 | 1.3 | 0 | 0 | -- | -- | -- | -- |
| TOC | 0.44 | 3.35 | 0.08 | 0.48 | 1.1 | 0 | 0 | -- | -- | -- | -- |
| As | 0.02 | 0.29 | 0.00 | 0.05 | 2.6 | 12 | 26 | 4 | 9 | 4 | 9 |
| Fe3+ | 4.08 | 114.34 | 0.01 | 16.77 | 4.1 | 29 | 63 | 3 | 7 | -- | -- |
| Mn2+ | 0.37 | 2.62 | 0.00 | 0.60 | 1.6 | 29 | 63 | 20 | 44 | -- | -- |
| Ca2+ | 88.51 | 304.00 | 9.30 | 63.23 | 0.7 | -- | -- | -- | -- | -- | -- |
| Mg2+ | 74.97 | 1002.50 | 4.86 | 223.61 | 3.0 | -- | -- | -- | -- | -- | -- |
| Na+ | 488.15 | 7947.50 | 6.12 | 1778.95 | 3.6 | -- | -- | -- | -- | -- | -- |
| K+ | 22.13 | 318.63 | 0.76 | 68.91 | 3.1 | -- | -- | -- | -- | -- | -- |
| Rice field | 4.52 | 40.68 | 0.00 | 9.47 | 2.09 | ||||||
| Dryland | 12.26 | 61.56 | 0.00 | 17.21 | 1.40 | ||||||
| Fruit farm | 30.21 | 99.33 | 0.00 | 31.40 | 1.04 | ||||||
| Uncultivated land | 0.51 | 5.18 | 0.00 | 1.21 | 2.36 | ||||||
| Aquaculture | 6.70 | 63.39 | 0.00 | 12.94 | 1.93 | ||||||
| Livestock | 2.39 | 15.66 | 0.00 | 4.22 | 1.77 | ||||||
| Forest | 2.62 | 24.94 | 0.00 | 5.57 | 2.12 | ||||||
| Water conservation | 7.25 | 76.96 | 0.00 | 16.30 | 2.25 | ||||||
| Human Settlement | 20.47 | 78.96 | 0.00 | 21.49 | 1.05 | ||||||
| Gravel | 14.44 | 64.74 | 0.00 | 19.07 | 1.32 | ||||||
| Coarse sand | 4.22 | 34.34 | 0.00 | 6.60 | 1.56 | ||||||
| Fine sand | 2.26 | 13.52 | 0.00 | 3.05 | 1.35 | ||||||
| Clay | 4.09 | 22.54 | 0.00 | 5.85 | 1.43 |
| Common Factor | Eigenvalues | Percentages of Variance,% | Cumulative Eigenvalues,% |
|---|---|---|---|
| 1 | 7.42 | 28 | 28 |
| 2 | 3.36 | 12 | 40 |
| 3 | 2.50 | 9 | 49 |
| 4 | 1.83 | 7 | 56 |
| 5 | 1.55 | 6 | 62 |
| 6 | 1.38 | 5 | 67 |
| Parameter | Factor 1 | Factor 2 | Factor 3 | Factor 4 | Factor 5 | Factor 6 |
|---|---|---|---|---|---|---|
| Water quality | ||||||
| EC | 0.945 | 0.022 | −0.005 | −0.046 | −0.029 | 0.007 |
| HCO3− | 0.074 | 0.667 | 0.294 | 0.137 | 0.101 | −0.147 |
| E. Coli | −0.095 | −0.003 | −0.020 | 0.099 | 0.147 | −0.041 |
| Cl− | 0.986 | 0.031 | 0.000 | 0.041 | −0.052 | −0.058 |
| SO42− | 0.983 | 0.053 | −0.032 | 0.004 | −0.034 | −0.049 |
| NO3−-N | −0.153 | −0.669 | −0.212 | −0.122 | 0.223 | 0.017 |
| TOC | −0.079 | 0.213 | 0.947 | 0.050 | 0.050 | 0.019 |
| As | −0.027 | 0.168 | 0.923 | −0.053 | −0.041 | −0.104 |
| Fe3+ | −0.076 | 0.161 | 0.015 | 0.858 | −0.076 | −0.098 |
| Mn2+ | 0.244 | 0.089 | −0.020 | 0.833 | 0.064 | 0.101 |
| Ca2+ | 0.838 | 0.304 | −0.117 | 0.054 | 0.146 | −0.012 |
| Mg2+ | 0.989 | 0.030 | 0.008 | 0.051 | −0.038 | −0.053 |
| Na+ | 0.989 | 0.024 | 0.005 | 0.043 | −0.042 | −0.053 |
| K+ | 0.985 | 0.034 | 0.086 | 0.050 | −0.024 | −0.041 |
| Land use | ||||||
| Rice field | −0.146 | 0.341 | 0.017 | −0.106 | 0.612 | −0.219 |
| Dryland | −0.220 | 0.389 | −0.015 | 0.372 | 0.013 | −0.180 |
| Fruit farm | −0.250 | −0.742 | −0.148 | −0.090 | −0.135 | −0.039 |
| Uncultivated land | −0.067 | −0.077 | −0.123 | −0.066 | 0.044 | 0.803 |
| Aquaculture | 0.312 | 0.146 | 0.322 | −0.154 | 0.467 | −0.077 |
| Livestock | −0.113 | −0.162 | −0.054 | 0.084 | 0.837 | 0.033 |
| Forest | −0.126 | 0.006 | −0.111 | 0.171 | −0.138 | 0.012 |
| Water conservation | 0.415 | 0.094 | 0.061 | 0.051 | −0.123 | −0.050 |
| Human settlement | −0.186 | 0.494 | −0.167 | 0.033 | −0.240 | 0.495 |
| Geological material | ||||||
| Gravel | −0.176 | −0.494 | −0.289 | −0.249 | −0.123 | −0.177 |
| Coarse sand | −0.217 | −0.002 | −0.196 | −0.085 | 0.085 | −0.029 |
| Fine sand | −0.072 | 0.287 | −0.213 | −0.191 | −0.239 | 0.017 |
| Clay | −0.140 | −0.012 | 0.061 | 0.045 | −0.144 | 0.724 |
Publisher’s Note: MDPI stays neutral with regard to jurisdictional claims in published maps and institutional affiliations. |
© 2020 by the authors. Licensee MDPI, Basel, Switzerland. This article is an open access article distributed under the terms and conditions of the Creative Commons Attribution (CC BY) license (http://creativecommons.org/licenses/by/4.0/).
Share and Cite
Liang, C.-P.; Wang, C.-H.; Wang, S.-W.; Chang, T.-W.; Chen, J.-S. Application of Factor Analysis for Characterizing the Relationships between Groundwater Quality and Land Use in Taiwan’s Pingtung Plain. Sustainability 2020, 12, 10608. https://0-doi-org.brum.beds.ac.uk/10.3390/su122410608
Liang C-P, Wang C-H, Wang S-W, Chang T-W, Chen J-S. Application of Factor Analysis for Characterizing the Relationships between Groundwater Quality and Land Use in Taiwan’s Pingtung Plain. Sustainability. 2020; 12(24):10608. https://0-doi-org.brum.beds.ac.uk/10.3390/su122410608
Chicago/Turabian StyleLiang, Ching-Ping, Chia-Hui Wang, Sheng-Wei Wang, Ta-Wei Chang, and Jui-Sheng Chen. 2020. "Application of Factor Analysis for Characterizing the Relationships between Groundwater Quality and Land Use in Taiwan’s Pingtung Plain" Sustainability 12, no. 24: 10608. https://0-doi-org.brum.beds.ac.uk/10.3390/su122410608