Article

Evaluating the Relationship between Freight Transport, Economic Prosperity, Urbanization, and CO2 Emissions: Evidence from Hong Kong, Singapore, and South Korea

1
Department of Architecture and Civil Engineering, City University of Hong Kong, Hong Kong, China
2
Architecture and Civil Engineering Research Center, Shenzhen Research Institute of City University of Hong Kong, Shenzhen 518057, China
3
School of Economics and Management, North China Electric Power University, Beijing 102206, China
4
Department of Electrical Engineering, University of Engineering and Technology, Taxila 47050, Pakistan
*
Author to whom correspondence should be addressed.
Sustainability 2020, 12(24), 10664; https://0-doi-org.brum.beds.ac.uk/10.3390/su122410664
Submission received: 25 July 2020 / Revised: 15 September 2020 / Accepted: 16 September 2020 / Published: 21 December 2020
(This article belongs to the Special Issue Innovative Mobility Solutions for Sustainable Transportation)

Abstract

:
This paper analyzes the relationship between freight transport, economic prosperity, carbon dioxide (CO2) emissions, energy consumption, and urbanization for three top Asian economies, namely, Hong Kong, Singapore, and South Korea during 1995–2017. For this purpose, we use the augmented Dickey-Fuller test for the stationary of the series, Johansen co-integration approach, and fully modified ordinary least squares and Granger causality model to infer the causal relationship between the study variables. The results show that economic prosperity (GDP) and energy consumption (EC) have a significant impact on freight transport (FT) for all three economies. In addition, the results also manifest the existence of bidirectional causality between GDP and FT in Singapore but a unidirectional causality running from GDP to FT in the case of Hong Kong and South Korea. As a quick policy option, controlling fossil fuel energy consumption in the transport sector may result in a remarkable reduction in CO2 emissions. The present study provides new insights to decision-makers for designing comprehensive energy and environmental policies for future sustainable freight transport growth in the long run.

1. Introduction

The transport sector is prominent because it plays a vital role in our daily lives and the country’s development. In addition, it helps the connection between the different locations which promotes trade and development. On the other hand, it is also a major source of fossil fuel energy consumption, which has a detrimental effect on the environment and has an enormous and increasing share of global carbon emissions [1]. As a result, there is an enormous amount of greenhouse gas (GHG) and CO2 emissions, especially in Asian countries, which are alarming. The transport sector is one of the mjor sector for CO2 emissions around the globe [1,2]. There is no doubt that transport is among the broadly growing economic sectors with substantial carbon emissions around the globe. Moreover, the upsurge in the number of highway automobiles is one reason for the rise in pollution. Presently, the number of vehicles worldwide is estimated at around 1.2 billion, using around 13.5 billion barrels of petroleum fuel per year and emitting 6.1 billion tons of CO2 per annum into the atmosphere [3]. Global CO2 emissions are projected to grow by about 50% in 2030 to about 80% in 2050 as energy demand rises and the number of road vehicle numbers increases [2].
Asia is a region with varying levels of economic prosperity and the endowment of energy resources. Swift economic growth in the region is raising primary energy demand from 4025 Mtoe in 2005 to 7215 Mtoe by 2030. Asia’s transportation sector is growing hastily, and the annual energy consumption is expected to increase by 2.9 percent by 2030 [3]. China is the largest transportation user in Asia (12.3 quadrillions Btu), followed by India (3.3 quadrillions Btu). Like India and China, the other countries in this region also demonstrate a significant rise in the transportation energy demand from 5.5 quadrillions Btu in 2008 to 8.6 quadrillions Btu in 2017 [3]. The Asian region’s energy-related CO2 emissions will rise from 10.065 billion tons in 2005 to 17.763 billion tons by 2030, with a yearly increase of 2.3 percent from the transport sector is increasing very rapidly with a growth rate of 2.8% per year [3]. This growth shows that the total CO2 emissions will grow from 12.5% in 2005 to 13.7% in 2030 [3]. Therefore, the environmental impacts of transportation fuel consumption through CO2 emissions were some of the primary concerns in recent sustainable transport policies in Hong Kong, Singapore, and South Korea. Consequently, significant consideration has been paid to decreasing energy use and restricting pollutant emissions to encourage environmental protection [4,5]. The majority of previous studies indicated that energy demand and economic prosperity are the two main factors of carbon emissions [6]. However, GDP and energy consumption (EC) alone may not reflect the correct result of carbon emissions [7,8]. Therefore, there is a great need to explore other variables that might affect carbon emissions. In the present study, we incorporate the transportation sector by including freight transport (FT) as a key factor through understanding its association with economic prosperity (GDP), energy consumption (EC), urbanization (URBN), and CO2 emissions.

1.1. Literature Gap(s) and the Contribution of the Study

According to the International Energy Agency (IEA) estimates [9], global CO2 emissions reached a historical high of 33.5 gigatonnes of CO2 in 2018 due to increased growth in population and economic activity around the globe. Transportation is a major energy field that depends on oil and generates significant global CO2 emissions. Besides, the freight transport sector is heavily dependent on fuel (oil and natural gas) consumption, resulting in serious oil security problems and environmental pressures in Asian countries. Moreover, the swift development of the economy and consequential urbanization has caused higher growth of CO2 emissions [10]. Nevertheless, the previous studies [8,11] analyze the causality between FT, GDP, and CO2 emissions together for economic analysis. Thus, we are strongly enthused to examine the long-term causal relationship between transportation, GDP, URBN, and transport CO2 emissions, specifically in Hong Kong, Singapore, and South Korea.
The correlation among FT, GDP, EC, URBN, and CO2 emissions have been addressed in three lines. (i) Initially, examine the interaction between GDP, energy consumption, and freight transportation. During the past few decades, connection/convergence among development and freight transport is studied and well handled in several studies [12,13,14,15,16]. (ii) In the second line, we noticed that improved GDP means more energy consumptioninduces greater pollutant emissions, mainly CO2 emissions. Besides, economists utilized multiple methods and tools to analyze the implications of connections between GDP and environmental degradation (ED) under the Kuznets curve (EKC) hypothesis [17,18,19]. (iii) This research explores the causal connection between freight transport, urbanization, and CO2 emissions. The orientation of the long-term causal relationship between variables also leads policymakers to make effective methods in developing better freight transport systems to enhance safety and sustainability for the future system. Furthermore, we consider the real effect of transportation and economic prosperity on country quality, which helps economists recognize whether economic development is more detrimental to the environmental quality or whether the transportation sector contributes more to CO2 emissions.
For the economic analysis, we utilize the annual data of selected economies from 1995 to 2017. The approach allows simultaneous analysis of the interconnectedness determined by Johansen co-integration approach, fully modified ordinary least squares (FMOLS), and Granger causality model between freight transport, GDP, EC, URBN, and CO2 emissions. This paper begins with an introduction accompanied by a conceptual analysis in which we summarize previous works concerning our subject. The method section is explained in Section 2. Then, Section 3 presents the results and analysis of the study. Finally, the conclusions and study implications are presented in the last section.

1.2. Literature Review

The transportation sector is considered as one of the major pollutant emissions sectors worldwide [20]. In addition, freight transport is still going to increase, requiring more energy in the future. Rail transport energy use (passenger and freight) is projected to rise by almost 72% in 2050, causing more CO2 emissions in the future [21]. Currently, global policy developments have sought to lower transport fossil energy volumes. We aim to advance new resources’ performance, including biofuels, compressed natural gas (CNG), liquefied natural gas (LPG), and electricity. Drastically reducing CO2 emissions and other common transportation air pollutants require enforcing sustainable transport strategies and environmentally friendly policies, including economic leverage and technological advancement. Steenhof et al. [22] used the decomposition analysis to the Canadian FT to analyze the important factors of GHG emissions. We recognize that, if the rise of freight transportation in Canada continues to rise, technological advancement becomes an insufficient option for growing GHG emissions. Sorrell et al. [23] in England assert that enhanced car transportation efficiency and decreased average passenger energy consumption are viable strategies that could reduce CO2 pollution and improve environmental quality. In an analysis of Germany, Spain, France, Italy, and Britain, Gleave [24] revealed that the deterioration of the natural environment is influenced favorably by high volumes of CO2 emissions and the elimination of freight traffic in these nations, by minimizing CO2 emissions, helps environmental sustainability to be enhanced. Over recent years, Banister and Stead [25] have found strong links between transport activity, economic activity, and CO2 emissions and their environmental impact. The close relationship between economic activity and transport considerably increases energy demand and CO2 emissions. Hao et al. [26] have shown that freight transport is one of China’s leading causes of growing GHG emissions. In South Africa, transportation energy is a leading factor in the proliferation of GHG emissions [27]. Shahbaz et al. [28] investigated the connection between the transport sector CO2 emissions, transportation sector energy demand in Tunisian transport systems. The findings reported that using the vector error correction model (VECM) analysis shows a link between EC and CO2 emissions. Mustapa and Bekhet [29] have addressed some valuable strategy options to reduce Malaysia’s CO2 emissions. The practical results derived using a linear programming method and sensitivity analysis have shown that 28% of the overall carbon dioxide emissions are produced in the transport industry.
For several years, the subject of coupling/decoupling between GDP and freight transport is studied and well handled in multiple studies [30,31,32,33,34,35]. For example, Hensher analyzed the effect of passenger transport and the consequent effects of freight transportation on growing GHG pollution in the Sydney Metropolitan Area and suggested various policy measures to reduce emissions of GHGs, including transport sector resilience, logistics capacity, and environmental qualities [36]. According to McKinnon [12], the number of foreign road freight companies, the fall in road transport’s share of the modal breakdown, and the rise in road freight cargo prices are the three main factors liable for two-thirds of UK decoupling. Kveiborg and Fosgerau [37] examined the correlation between economic growth and freight transport in Denmark, based on 19 industries and 26 commodity groups for the period 1981–1992. Their conclusions figure out that the differentiation between industries is a good idea that can enable robust and effective results to be achieved. Bennathan et al. [38] performed a bend-sectional analysis of a group of 33 countries at different stages of development and showed a very close relationship between GDP and freight transport.
Another group of articles examined transport demand using a number of techniques, including elasticity estimates. Most of these studies confirm the concept of a positive relationship between transportation and GDP. The co-integrating vector autoregressive (VAR) model was used in India by Kulsreshtha and Nag [39] to approximate the relationship between GDP and FT in the railways. Yao [40] examines the ties between FT, industrial production, and investment in inventory by using the causality test of Granger and the VAR system’s impulse response method. Both indicate an important feedback effect between freight movements and expenditure in output and inventory inputs. The logistics role as a critical factor in understanding the relationship between transport and GDP is included in the research [41,42]. By undertaking the analysis of the evolving demands of 88 major British producers on FT, McKinnon and Woodburn [42] suggest that control of transport infrastructure is a more important cause of the increase in freight traffic. McKinnon and Woodburn [42] also believe that producers forecast that their demand for road freight would increase substantially in line with profits and that road transport prices would generally remain unchanged at the rate currently proposed.
Many previous studies [43,44,45] have been concerned with urbanization impact on transport CO2 emissions. Hasan et al. [44] result indicated that, with the increase of the urban population, CO2 emissions from the New Zealand transport sector have increased. Liu et al. [46] refer to the ports as the center of human activities and they have implemented the three-dimensional risk management model to monitor port activities, which will allow for sustainable port development. Reckien et al. [45] results showed that the total built area and total traffic area are the leading factors for higher CO2 emissions in Berlin city. Wang et al. [47] results also manifested that urban form is the main factor for transport CO2 emissions.
Although the influential factor behind CO2 emissions in the transport sector has been discussed in previous literature, few studies have evaluated the relationship between transport, urbanization, energy consumption, and CO2 emissions. Saidi and Hammami [8] analyzed the transport, GDP, and environmental degradation using panel data. Similarly, Nadia and Rochdi [48] evaluated the relationship between FT, GDP, EC, and GHG emissions using the vector autoregressive (VAR) model in Tunisia. However, no recent study evaluates multiple factors such as FT, GDP, EC, urbanization, and CO2 emissions, specifically in Hong Kong, Singapore, and South Korea. To fill this research gap, the current study investigates the relationship between freight transport energy consumption, urbanization, economic prosperity, and CO2 emissions in Hong Kong, Singapore, and South Korea since these regions are already developed and utilize greater fossil fuel energy for freight transport as compared to other Asian countries. In this regard, certain empirical studies found that urbanization and energy consumption of transportation has an impact on carbon emissions [49]. Intriguingly, no study evaluates freight transport’s impact on urbanization, CO2 emissions, and energy consumption for transportation policy implications. Therefore, in Hong Kong, Singapore, and South Korea, where well-developed freight transport and good accessibility are omnipresent, further investment in the transport sector could lead to marginal economic and long term environmental benefits. On the other hand, this research can help other Asian countries invest in the freight transport sector by adopting sustainable energy practices and promoting sustainability in the transport sector.

2. Materials and Methods

Data Sources

The purpose of this study is to analyze the impact of freight transport (FT) on economic prosperity (GDP), carbon dioxide (CO2) emissions, energy consumption (EC), and urbanization (URBN) for Hong Kong, South Korea, and Singapore. The data source for the series is mined from World Development Indicators (WDI) and Energy Information Administration (EIA) database and annual data from 1995–2017 [50,51]. The information of all variables with their source is illustrated in Table 1.
Multiple recent studies [28,52,53,54] have jointly observed the nexus of energy consumption and economic growth. Based on the Cobb–Douglas production function, the econometric model in which the various explanatory variables such as economic growth, carbon dioxide emissions, energy consumptions, and urbanization, trade openness can be used [52,55,56,57]. The current study investigates the impact of freight transport (FT) on economic prosperity (GDP), carbon dioxide emissions (CO2), and energy consumption (EC) by taking urbanization (URBN) as an additional variable. However, no current study comprehensively investigates the linkage of freight transport and economic prosperity, EC, URBN, with CO2 emissions, especially in Asian countries. To cover the research gap, the present study investigates the linkage of transportation and economic prosperity with carbon dioxide emissions for Hong Kong, Singapore, and South Korea. Moreover, our model uniquely incorporated disaggregated energy consumption, urbanization, carbon dioxide emissions and economic prosperity as explanatory variables. The functional form and econometric model specification are as follows:
FT = f ( GDP , CO 2 , EC , URBN )
The linear form of Equation (1) can be re-written to include error terms and presented as follows:
F T t = α 0 + α 1 GDP t + α 2 CO 2 t + α 3 EC t + α 4 URBN t + ε t
The data is transformed into a natural logarithm for reliable and consistent results. The log-linear form of Equation (2) is presented in Equation (3) as follows:
l n FT t = α 0 + α 1 lnGDP t + α 2 lnCO 2 t + α 3 lnEC t + α 4 lnURBN t + ε t
Here, ln is the natural logarithm, t is the time, FT indicates the freight transport, GDP denotes the economic prosperity, CO2 is the carbon dioxide emissions, EC is the energy consumption, and URBN is the urbanization, α 0 and ε t indicates the constant and classical error term. The estimated coefficients for freight transport with respect to economic prosperity, carbon dioxide emissions, energy consumption, and urbanization are α 1 , α 2   ,   α 3 , and α 4 , respectively. The expected sign for α 1 is positive; the sign for α 2 can be either positive or negative. While the sign for α 3 should be positive, the sign for α 4 should be positive or negative. The parameter α0 permits for possible state fixed effect, and εt denotes normally distributed error term.
For econometric methodology, the first step is to determine the existence of a unit root in each variable to find the order of integration. For this, we will use the augmented Dickey-Fuller (ADF) test [58], if the variables are integrated of order one I(1). Next, this study will use Johansen test to identify the long-run equilibrium relationship in the data. After the cointegration test, this study will utilize the fully modified ordinary least square (FMOLS) method to determine whether GDP, CO2 emissions, EC, and URBN positively or negatively influence FT. Finally, our study will apply the Granger causality test to infer the direction of causality between series.

3. Empirical Results and Discussion

3.1. Unit Root Test Results

In the econometric analysis, the variables stationery is crucial to avoid spurious regression results. Therefore, the ADF standard time series unit root test is applied in this study to ensure the robustness of the series for each economy. This can be done by including a constant term and a time trend in the ADF equation of the unit root test when determining it at the level and first difference. The lag length is selected according to the Schwarz information criterion (SIC). The expected outcomes for this test are that the series will be I(0) at levels and I(1) at their first difference because the precondition for testing the Johansen co-integrating test requires that the variables should be in the same order I(1), i.e., stationary at first difference. The null hypothesis of the ADF unit root test is that data is non-stationary in order of integration I(0), where the alternative hypothesis is that the data contains no unit root. The results of the ADF unit root test are summarized in Table 2. The study considers the estimation under the intercept with trend to exploit potential hidden features. The ADF method fails to reject the null hypotheses that all the variables are non-stationary at levels for three economies, while rejecting the null hypotheses that all the variables are non-stationary at first difference for three economies. It shows strong and consistent outcomes that series contains unit root at levels, but they have no unit root at their first difference; however, the series are integrated in the same order I(1) for each economy. Since the ADF test results show that variables are non-stationary, we precede Johansen co-integration test to analyze the long-run equilibrium relationship amid the variables.

3.2. Co-Integration Test Results

The Johansen co-integration method is used to test the presence of a long-run equilibrium relationship between series [59]. This test contains two likelihood statistics, namely trace statistics and the maximum Eigenvalue statistics. Both trace and maximum Eigenvalue test statistics indicate the number of co-integrating vectors of equations (r). As the Johansen co-integration test suggested choosing the optimal lag length for the vector autoregressive (VAR) selected using the Schwarz information criterion (SIC). The co-integration exists if both trace test and maximum Eigenvalue statistical test shows one co-integrating vector at a 5% significance level. The Johansen co-integration equation can be calculated as Equation (4).
Δ W t =   α 0 + α 1 t + φ 1 w t 1 + φ 2 w t 2 + + φ K w t k + ε t
Where ∆ is the difference operator, the endogenous variable Wt is an n × 1 vector, φk is the number of regressors, the parameters α 0 + α 1 for the deterministic term representing the constant and time trend (t) variables. The residual εt indicates the random disturbance error terms. The coefficients estimations are φ1, φ2, φk, which contains the long-run relationship information amid the series in the Wt vector. The summary of results from the Johansen co-integration test is further illustrated in Table 3. The outcomes indicate that all the variables for the individual sample groups are co-integrated since no co-integration hypothesis is rejected at a 5% significance level. However, the results of our study give a stronger proof of co-integration amid the studied variables. Thus, we can conclude that the series being analyzed embrace a long-run relationship.

3.3. Fully Modified Ordinary Least Squares (FMOLS) Regression Outcomes

Since the variables are co-integrated, we then implemented the FMOLS tactic, which shows the long run FMOLS estimation of explanatory variables. This method was initially proposed by Pedroni for assorted co-integration vectors [60]. This study prefers FMOLS because it considers the indigeneity, serial correlation problem [61], and the most appropriate method to be used for small sample size [62]. Table 4 contains the results of three top economies; for the case of Hong Kong, the outcomes indicate that GDP is a positive and statistically significant influence on FT in the long run at a 1% level. The positive and significant coefficient of GDP indicates that there is a strong relationship between FT and GDP. A magnitude of 0.97 implies that freight transport increases by 0.97% when there is an increase of 1% in the GDP in Hong Kong. Also, we found that URBN have a positive but insignificant effect on FT. While EC is a positive and significant effect on FT, the coefficient of 1.69 reveals that FT increases by 1.69% if the EC volume increases by 1%.
For the Singapore case, economic prosperity positively affects freight transport at a 1% significance level. A magnitude of 0.42 indicates that freight transport may increase by 0.42% if the GDP increases by 1%. It is also found that FT increases if the CO2 emissions increase because the effect is positive and significant. The significant coefficient indicates that FT increases by 2.17% if CO2 emissions increase by 1%. Similarly, for the EC, we found that the effect of EC is positive and statistically significant at 1% level. Finally, the findings of South Korea indicate that FT is strongly accelerated by the GDP, CO2 emissions, and EC. The magnitude of these indicators is positive and statistically significant at 1% level. For the GDP, the coefficient of 0.48 indicates that FT augments by 0.48% if the GDP increase by 1%. The coefficients of 1.17 and 1.27 indicate that FT increases by 1.17% and 1.27% if CO2 emissions and EC increase by 1%.

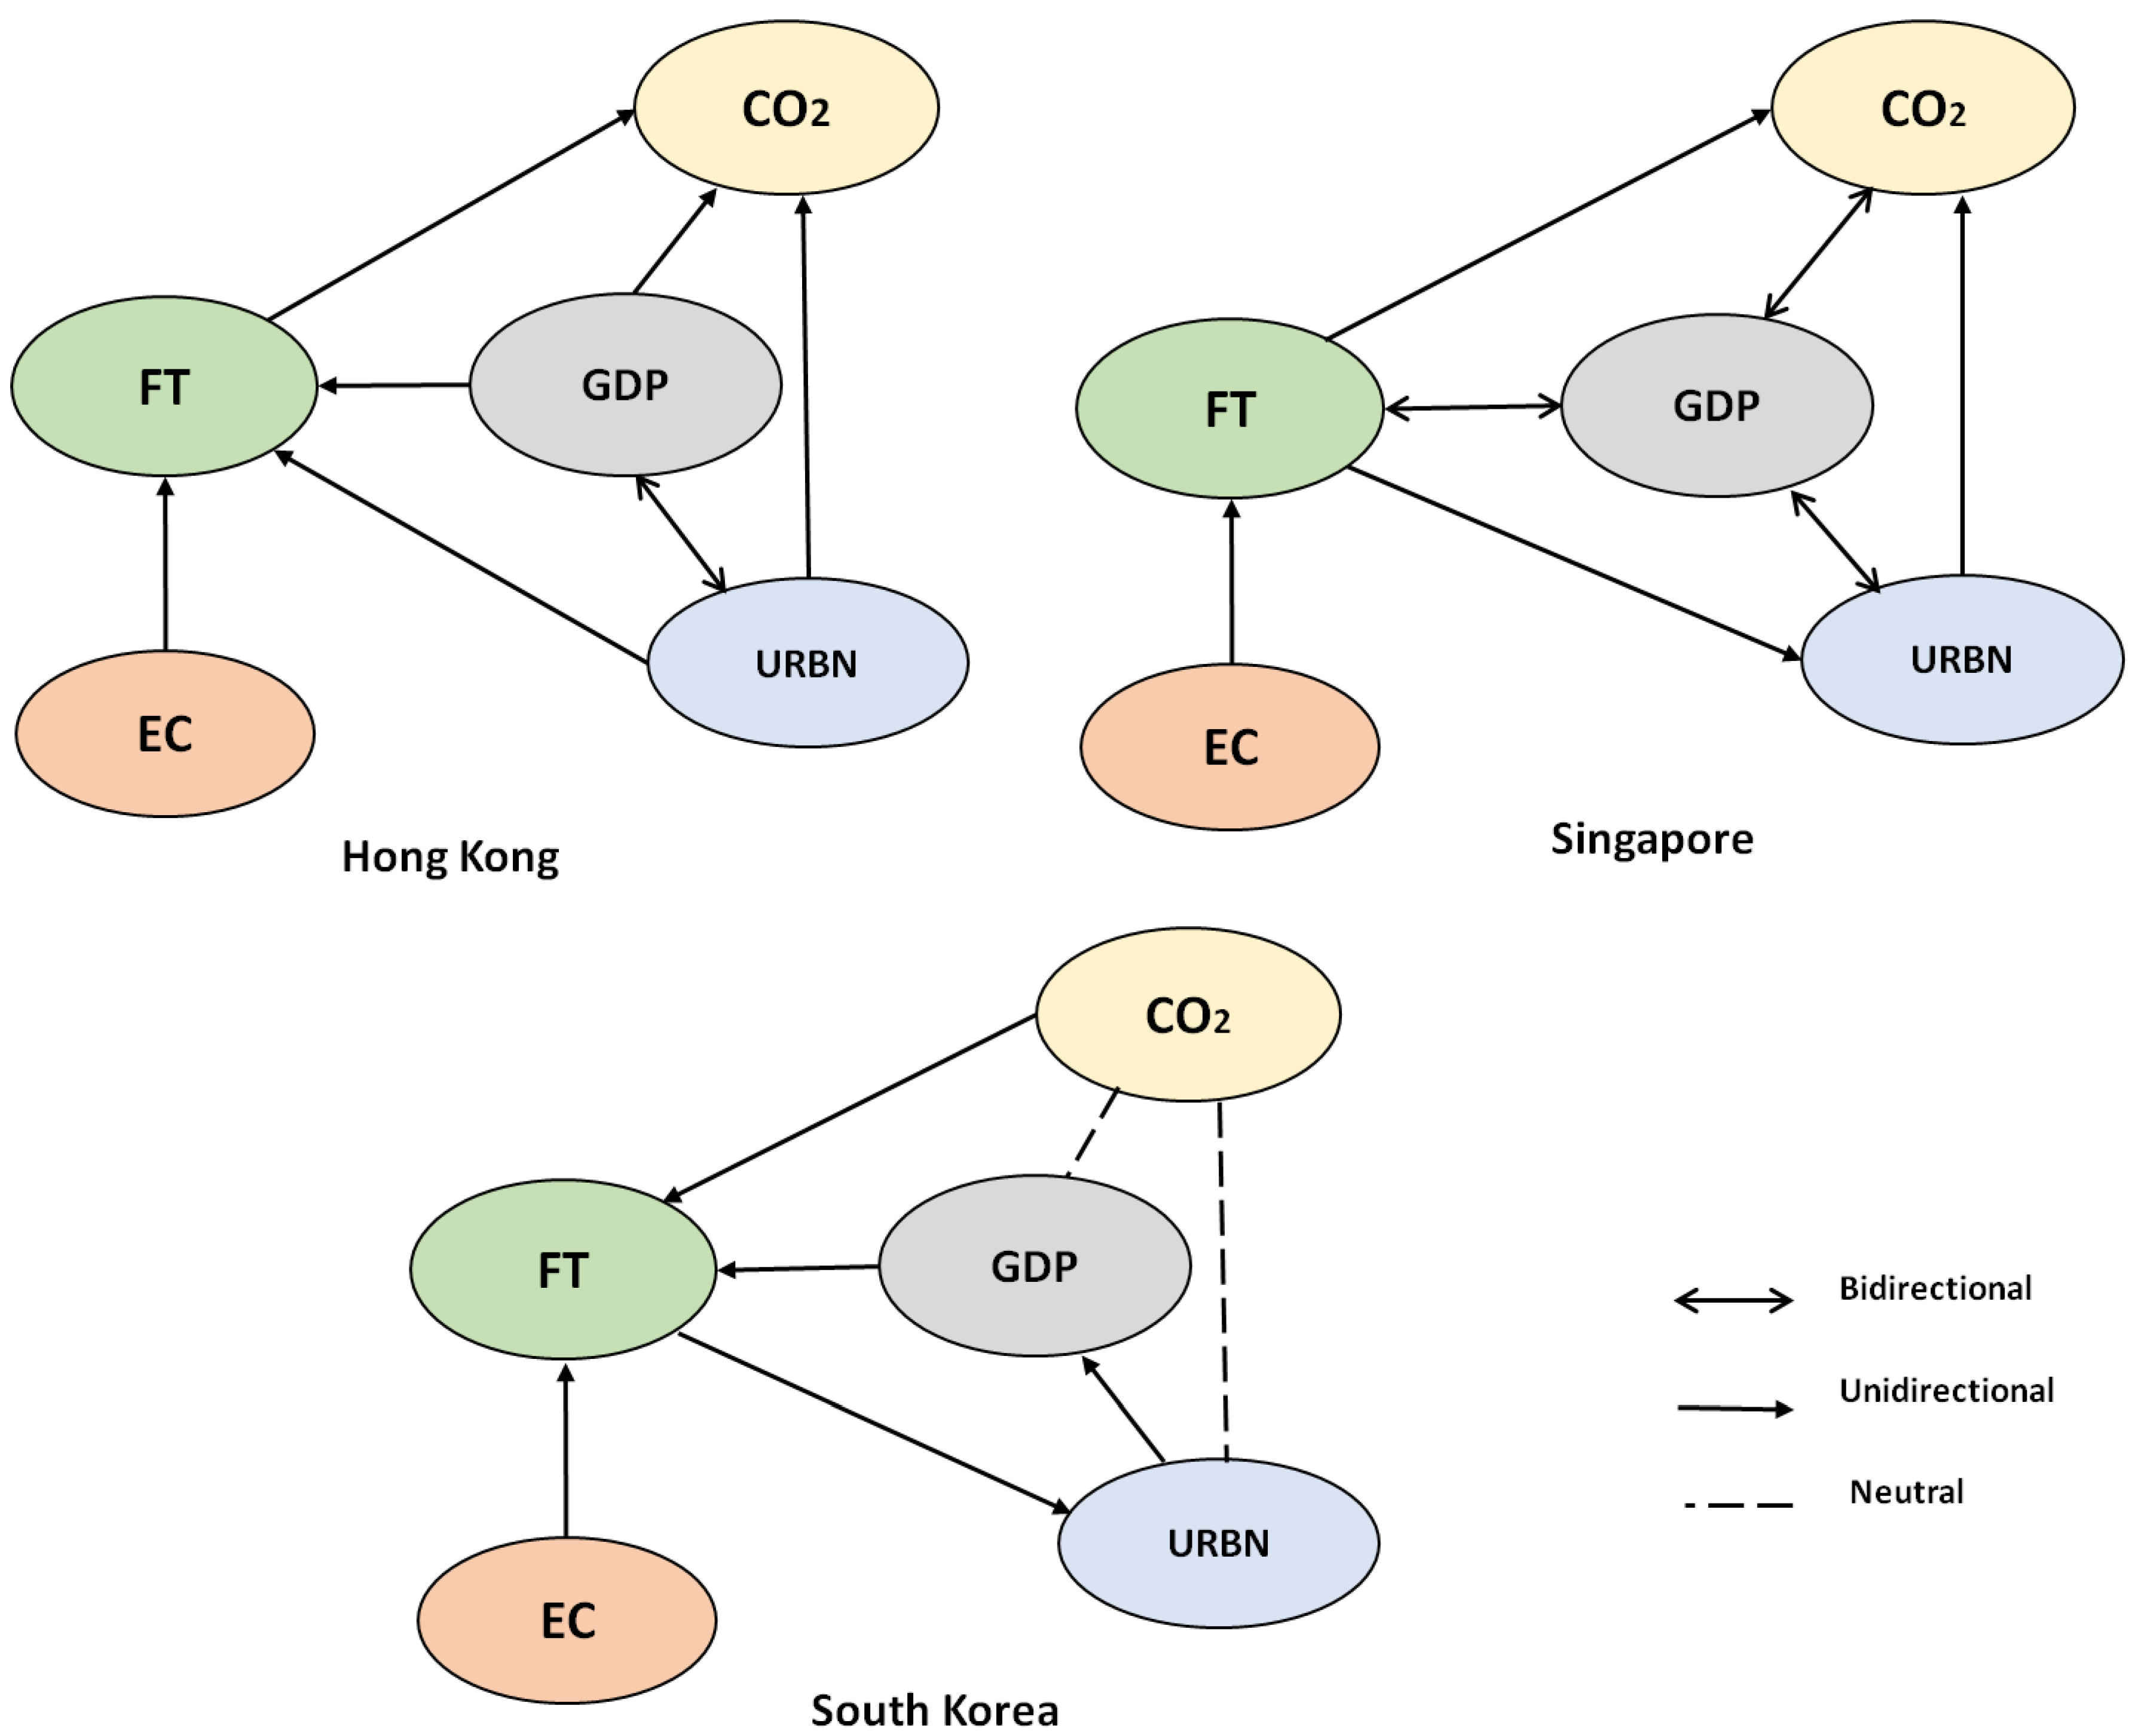
3.4. Granger Causality Results

To infer the direction of causal association amid the variables, the Granger 1969 was the first to test for causality from X to Y and Y to X in a clear and straightforward term [63]. According to the Granger causality test, if the past value of variable X leads to the current value of variable Y and provides statistically significant information about Y’s future values, then the causality exists from X to Y. The following Equation of the Granger causality test is used to evaluate the direction of causality between variables:
                X t = j = 1 m β j X t j + j = 1 m φ j Y t j + ε 1 t
                      Y t = j = 1 m α j Y t j + j = 1 m γ j X t j + ε 2 t
where, Xt and Yt represent observed values at time t, m shows the number of lags, the estimated coefficients are β ,   φ   a , and γ in this study, and ε t is an error term. Equation (5) is used to test the null hypothesis that Y does not Granger-causes X ( φ 1 = φ 2 = … = φ m = 0) using t-test. If the null hypothesis is rejected, the alternative hypothesis H1 is in favor, indicating that at least one φ i 0   . Similarly, Equation (6) is used to test the null hypothesis that X does not Granger-causes Y. The equations above can be set as the causal relationship between series X and Y.
The econometric models are useful to find out the causality relationship between different variables such as EC, GDP, CO2 emissions [64,65,66]. Table 5 summarizes the Granger causality test results of three Asian economies, whereas Figure 1 presents the causality direction amid all variables. According to the empirical results, we found that FT is driven by the GDP and energy consumption for all three economies. Also, bidirectional causality between GDP and FT exists in Singapore, indicating that GDP causes freight transport and as a result, freight transport causes GDP, which supports the feedback effect. In the case of Hong Kong and South Korea, GDP contributes significantly to freight transport, while the effect is insignificant in the opposite direction. The results follow the previous studies of Saidi and Hammami [8], Arvin et al. [67], Achour and Belloumi [68], who argue that a high level of GDP augments transport and vice versa. Concerning the causal relationship between URBN and GDP, we found bidirectional causality between the two series in Hong Kong and Singapore. The results also show bidirectional causality between GDP and CO2 emissions in Singapore. The pairwise Granger causality confirms that there is a relationship that exists among freight transport, GDP, urbanization and CO2 emissions for these selected economies. In addition, there is a unidirectional causality running from EC to FT in all three economies.
According to our results, we can say that there is a significant relationship between economic prosperity and freight transport in the three economies. The results indicate that freight transport and economic prosperity increase transport CO2 emissions in Hong Kong and Singapore. Thus, it is crucial to improve and develop sustainable freight transport (air, rail, and road), improve infrastructure, increase transportation ease and overall productivity of production units. The results of our study show that the freight transport causes environmental degradation. Thus, these findings recommend should encourage the use of green and sustainable practices (green fuel) in freight transport sector by providing specific financing mechanisms. The results also manifests that the Korean government must develop strategies to establish and encourage the development of rail (utilizing the biofuels) for good transportation. For example, to achieve future CO2 emissions reduction targets, these three economies are suggested to reduce freight transport’s dependency on fossil fuels. The government should upgrade the freight industry from a traditional one to a modern one that can enhance transportation and energy efficiency. Besides, these economies should optimize the energy structure and freight transportation structure. Energy structure plays a significant role due to the heavy oil consumption. Therefore, effective and sustainable development (i.e., sustainable fuels) in the transport sector could enhance its sustainability. Moreover, urbanization growth is indispensable for the freight transport sector; therefore, governments should develop new ecological industry cities and well-planned compact cities. The main implication of our study is that improving economic prosperity and freight transport is a very challenging issue, and the impact of micro, as well as macro-level factors such as logistics and economic policies, should not be neglected for a comprehensive analysis.

4. Conclusions

The purpose of this study is to investigate the relationship between freight transport (FT), economic prosperity (GDP), carbon dioxide (CO2) emissions, energy consumption (EC), and urbanization (URBN) for three top Asian economies, namely Hong Kong, South Korea, and Singapore, in a multivariate framework using annual data from 1995 to 2017. The empirical findings indicate that GDP and EC have positive and significant effects on freight transport for all three economies. It is found that freight transport is mainly influenced by GDP and energy consumption. Besides, there is unidirectional causality from FT to CO2 emissions in Hong Kong and Singapore. The main results note the existence of bidirectional causality between GDP and FT in Singapore but a unidirectional causality running from GDP to FT in the case of Hong Kong and South Korea. Concerning the relationship between GDP and CO2 emissions, there is bidirectional causality in the case of Singapore. Moreover, the results also show bidirectional causality between GDP and URBN for Hong Kong and Singapore.
This present study provides important policy implications and contributes to accelerating the current literature. First, the significant impact of GDP on freight transport suggests the vital role of the transport sector in economic development. It represents that the nexus between freight transport and GDP may be affected by technological advancements. However, the literature suggests that efficient and sustainable technologies in the transportation sector can enhance sustainability over the long term in Asian countries. Freight transport mainly influences energy consumption (fossil fuels); thus, the usage of green technologies in the transport sector intensifies energy efficiency. These policies allow a greater significant role of transport in the global economic activity. On the other hand, some instruments (such as fiscal, economic, regulatory, and technological factors) should be adopted, because the amendment of energy efficiency in the transport sector depends on these factors. Simultaneously, energy efficiency and environmental influence of transport are impacted by several useful transport planning decisions, land usage, taxes, prices, fuel quality, subsidies, and investment in innovations. Further, to mitigate transport energy consumption, the government should implement environmental regulatory policies to deal with energy consumption and road emissions reduction, especially for the commercial freight transport sector. Finally, urban areas play an essential role in increasing the freight transport sector; therefore, they need to implement sustainable urbanization growth policies and reduce the unplanned urban sprawls.
However, there are also some limitations that future studies could pay more attention. As this study only used freight transport by air for the analysis, a future study could include data of freight transport by road and rail. Moreover, as Hong Kong and Singapore freight transport include significant portions of international freight, future research could include the overall CO2 emissions, including international aviation carbon emissions. By conducting further research in these directions, an improved understanding of the causal relationship between freight transport, CO2 emissions, energy consumptions and GDP will be obtained, and the planning of future transport systems will be conducted under proper advice.
Besides, Maziarz [69] stated that the Granger causality is not necessarily a true causality. For future research, all micro-level factors, as well as macro-level ones (i.e., oil types, future energy policies, vehicle types, and advancement and incentives for green technologies, etc.) which directly and indirectly impact the freight and economic prosperity should be included for comprehensive policy implications in the transport sector.

Author Contributions

Data curation, M.S., A.A., and M.R.; formal analysis, A.A., M.S. and X.L.; investigation, M.S., A.A., and M.R.; methodology, M.S., A.A., and M.R.; project administration, X.L.; resources, M.R.; software, A.A.; supervision, X.L.; writing—original draft, M.S. and A.A.; writing—review and editing, M.R. and X.L. All authors have read and agreed to the published version of the manuscript.

Funding

This work was supported by the City University of Hong Kong Grant # 9680139. The conclusions herein are those of the authors and do not necessarily reflect the views of the sponsoring agencies.

Conflicts of Interest

The authors declare no conflict of interest.

References

  1. Timilsina, G.R.; Shrestha, A. Transport sector CO2 emissions growth in Asia: Underlying factors and policy options. Energy Policy 2009, 37, 4523–4539. [Google Scholar] [CrossRef]
  2. International Energy Agency (IEA). Key World Energy Statistics 2017 Energy Statistics; International Energy Agency: Paris, France, 2017. [Google Scholar]
  3. Nasreen, S.; Mbarek, M.B.; Atiq-ur-Rehman, M. Long-run causal relationship between economic growth, transport energy consumption and environmental quality in Asian countries: Evidence from heterogeneous panel methods. Energy 2020, 192, 116628. [Google Scholar] [CrossRef]
  4. Herold, D.M.; Lee, K.H. The influence of internal and external pressures on carbon management practices and disclosure strategies. Australas. J. Environ. Manag. 2019, 26, 63–81. [Google Scholar] [CrossRef]
  5. Herold, D.M.; Farr-Wharton, B.; Lee, K.H.; Groschopf, W. The interaction between institutional and stakeholder pressures: Advancing a framework for categorising carbon disclosure strategies. Bus. Strateg. Dev. 2019, 2, 77–90. [Google Scholar] [CrossRef]
  6. Begum, R.A.; Sohag, K.; Abdullah, S.M.S.; Jaafar, M. CO2 emissions, energy consumption, economic and population growth in Malaysia. Renew. Sustain. Energy Rev. 2015, 41, 594–601. [Google Scholar] [CrossRef]
  7. Ozturk, I.; Acaravci, A. The long-run and causal analysis of energy, growth, openness and financial development on carbon emissions in Turkey. Energy Econ. 2013, 36, 262–267. [Google Scholar] [CrossRef]
  8. Saidi, S.; Hammami, S. Modeling the causal linkages between transport, economic growth and environmental degradation for 75 countries. Transp. Res. Part D Transp. Environ. 2017, 53, 415–427. [Google Scholar] [CrossRef]
  9. IEA. CO2 Emissions from Fuel Combustions: Overview; International Energy Agency: Paris, France, 2020; p. 3. [Google Scholar]
  10. Anwar, A.; Mustafa, Y.; Inayat, U. Impact of urbanization and economic growth on CO2 emission: A case of far east Asian countries. Intern. J. Environ. Res. Pub. Health 2020, 17, 2531. [Google Scholar] [CrossRef] [Green Version]
  11. Zhang, C.; Nian, J. Panel estimations for transport sector CO2 emissions and it affecting factors: A regional analysis in China. Energy Policy 2013, 63, 918–926. [Google Scholar] [CrossRef]
  12. McKinnon, A.C. Decoupling of road freight transport and economic growth trends in the UK: An exploratory analysis. Transp. Rev. 2007, 27, 37–64. [Google Scholar] [CrossRef]
  13. Alises, A.; Vassallo, J.M. Comparison of road freight transport trends in Europe. Coupling and decoupling factors from an Input-Output structural decomposition analysis. Transp. Res. Part A Policy Pract. 2015, 82, 141–157. [Google Scholar] [CrossRef]
  14. Wu, H.M.; Xu, W. Cargo Transport Energy Consumption Factors Analysis: Based on LMDI Decomposition Technique. IERI Procedia 2014, 9, 168–175. [Google Scholar] [CrossRef] [Green Version]
  15. Pérez, A.A.; Magro, J.M.V.; Valderrama, A.F.G. Road freight transport decoupling: A comparative analysis between the United Kingdom and Spain. Transp. Policy 2014, 32, 186–193. [Google Scholar]
  16. Chandran, V.G.R.; Tang, C.F. The impacts of transport energy consumption, foreign direct investment and income on CO2 emissions in ASEAN-5 economies. Renew. Sustain. Energy Rev. 2013, 24, 445–453. [Google Scholar] [CrossRef]
  17. Koilo, V. Evidence of the Environmental Kuznets Curve: Unleashing the Opportunity of Industry 4.0 in Emerging Economies. J. Risk Financ. Manag. 2019, 12, 122. [Google Scholar] [CrossRef] [Green Version]
  18. Dogan, E.; Turkekul, B. CO2 emissions, real output, energy consumption, trade, urbanization and financial development: Testing the EKC hypothesis for the USA. Environ. Sci. Pollut. Res. 2016, 23, 1203–1213. [Google Scholar] [CrossRef]
  19. Narayan, P.K.; Narayan, S. Carbon dioxide emissions and economic growth: Panel data evidence from developing countries. Energy Policy 2010, 38, 661–666. [Google Scholar] [CrossRef]
  20. Linton, C.; Grant-Muller, S.; Gale, W.F. Approaches and techniques for modelling CO2 emissions from road transport. Transp. Rev. 2015, 35, 533–553. [Google Scholar] [CrossRef]
  21. IEA. The Future of Rail Opportunities for Energy and the Environment; International Energy Agency: Paris, France, 2019. [Google Scholar]
  22. Steenhof, P.; Woudsma, C.; Sparling, E. Greenhouse gas emissions and the surface transport of freight in Canada. Transp. Res. Part D Transp. Environ. 2006, 11, 369–376. [Google Scholar] [CrossRef]
  23. Sorrell, S.; Lehtonen, M.; Stapleton, L.; Pujol, J.; Champion, T. Decomposing road freight energy use in the United Kingdom. Energy Policy 2009, 37, 3115–3129. [Google Scholar] [CrossRef]
  24. Gleave, S.D. Freight Transport Intensity of Production and Consumption; Report no EUR 20864EN; Institute for Prospective Technological Studies, Joint Research Centre: Seville, Spain, 2003. [Google Scholar]
  25. Banister, D.; Stead, D. Reducing transport intensity. Eur. J. Transp. Infrastruct. Res. 2002, 2, 161–178. [Google Scholar]
  26. Hao, H.; Geng, Y.; Li, W.; Guo, B. Energy consumption and GHG emissions from China’s freight transport sector: Scenarios through 2050. Energy Policy 2015, 85, 94–101. [Google Scholar] [CrossRef]
  27. Tongwane, M.; Piketh, S.; Stevens, L.; Ramotubei, T. Greenhouse gas emissions from road transport in South Africa and Lesotho between 2000 and 2009. Transp. Res. Part D Transp. Environ. 2015, 37, 1–13. [Google Scholar] [CrossRef]
  28. Shahbaz, M.; Khraief, N.; Jemaa, M.M. Ben On the causal nexus of road transport CO2 emissions and macroeconomic variables in Tunisia: Evidence from combined cointegration tests. Renew. Sustain. Energy Rev. 2015, 51, 89–100. [Google Scholar] [CrossRef] [Green Version]
  29. Mustapa, S.I.; Bekhet, H.A. Analysis of CO2 emissions reduction in the Malaysian transportation sector: An optimisation approach. Energy Policy 2016, 89, 171–183. [Google Scholar] [CrossRef]
  30. Beyzatlar, M.A.; Karacal, M.; Yetkiner, H. Granger-causality between transportation and GDP: A panel data approach. Transp. Res. Part A Policy Pract. 2014, 63, 43–55. [Google Scholar] [CrossRef] [Green Version]
  31. Iacono, M.; Levinson, D. Mutual causality in road network growth and economic development. Transp. Policy 2016, 45, 209–217. [Google Scholar] [CrossRef] [Green Version]
  32. Mraihi, R. Transport Intensity and Energy Efficiency: Analysis of Policy Implications of Coupling and Decoupling. In Energy Efficiency—The Innovative Ways for Smart Energy, the Future Towards Modern Utilities; Eissa, M., Ed.; BoD—Books on Demand: Norderstedt, Germany, 2012. [Google Scholar]
  33. Lee, M.K.; Yoo, S.H. The role of transportation sectors in the Korean national economy: An input-output analysis. Transp. Res. Part A Policy Pract. 2016, 93, 13–22. [Google Scholar] [CrossRef]
  34. Herold, D.M.; Lee, K.H. Carbon management in the logistics and transportation sector: An overview and new research directions. Carbon Manag. 2017, 8, 79–97. [Google Scholar] [CrossRef]
  35. Nasreen, S.; Saidi, S.; Ozturk, I. Assessing links between energy consumption, freight transport, and economic growth: Evidence from dynamic simultaneous equation models. Environ. Sci. Pollut. Res. 2018, 25, 16825–16841. [Google Scholar] [CrossRef]
  36. Hensher, D.A. Climate change, enhanced greenhouse gas emissions and passenger transport—What can we do to make a difference? Transp. Res. Part D Transp. Environ. 2008, 13, 95–111. [Google Scholar] [CrossRef] [Green Version]
  37. Kveiborg, O.; Fosgerau, M. Decomposing the decoupling of Danish road freight traffic growth and economic growth. Transp. Policy 2007, 14, 39–48. [Google Scholar] [CrossRef]
  38. Bennathan, E.; Fraser, J.; Thompson, L.S. What Determines Demand for Freight Transport; World Bank Publications: Washington, DC, USA, 1992. [Google Scholar]
  39. Kulsreshtha, M.; Nag, B. Structure and dynamics of non-suburban passenger travel demand in Indian railways. Transportation 2000, 27, 221–241. [Google Scholar] [CrossRef]
  40. Yao, V.W. The Causal Linkages Between Freight and Economic Fluctuations. Int. J. Transp. Econ. 2005, 32, 143–159. [Google Scholar]
  41. Hayaloglu, P. The impact of developments in the logistics sector on economic growth: The case of OECD countries. Int. J. Econ. Financ. Issues 2015, 5, 523–530. [Google Scholar]
  42. McKinnon, A.C.; Woodburn, A. Logistical restructuring and road freight traffic growth: An empirical assessment. Transportation 1996, 23. [Google Scholar] [CrossRef]
  43. Sun, H.; Li, M.; Xue, Y. Examining the factors influencing transport sector CO2 emissions and their efficiency in central China. Sustainability 2019, 11, 4712. [Google Scholar] [CrossRef] [Green Version]
  44. Hasan, M.A.; Frame, D.J.; Chapman, R.; Archie, K.M. Emissions from the road transport sector of New Zealand: Key drivers and challenges. Environ. Sci. Pollut. Res. 2019, 26, 23937–23957. [Google Scholar] [CrossRef]
  45. Reckien, D.; Ewald, M.; Edenhofer, O.; Lüdeke, M.K.B. What parameters influence the spatial variations in CO2 emissions from road traffic in Berlin? Implications for urban planning to reduce anthropogenic CO2 emissions. Urban. Stud. 2007, 44, 339–355. [Google Scholar] [CrossRef]
  46. Liu, J.; Zhou, H.; Sun, H. A three-dimensional risk management model of port logistics for hazardous goods. Marit. Policy Manag. 2019, 46, 715–734. [Google Scholar] [CrossRef]
  47. Wang, S.; Fang, C.; Guan, X.; Pang, B.; Ma, H. Urbanisation, energy consumption, and carbon dioxide emissions in China: A panel data analysis of China’s provinces. Appl. Energy 2014, 136, 738–749. [Google Scholar] [CrossRef]
  48. Benali, N.; Feki, R. Evaluation of the relationship between freight transport, energy consumption, economic growth and greenhouse gas emissions: The VECM approach. Environ. Dev. Sustain. 2018, 22, 1039–1049. [Google Scholar] [CrossRef]
  49. Saidi, S.; Shahbaz, M.; Akhtar, P. The long-run relationships between transport energy consumption, transport infrastructure, and economic growth in MENA countries. Transp. Res. Part A Policy Pract. 2018, 111, 78–95. [Google Scholar] [CrossRef]
  50. World Development Indicators Database: 2017; World Bank Group: Washington, DC, USA, 2017.
  51. Annual Energy Outlook 2019 with Projections to 2050; US Energy Information Administration: Washington, DC, USA, 2019.
  52. Omri, A.; Daly, S.; Rault, C.; Chaibi, A. Financial development, environmental quality, trade and economic growth: What causes what in MENA countries. Energy Econ. 2015, 48, 242–252. [Google Scholar] [CrossRef] [Green Version]
  53. Zoundi, Z. CO2 emissions, renewable energy and the Environmental Kuznets Curve, a panel cointegration approach. Renew. Sustain. Energy Rev. 2017, 72, 1067–1075. [Google Scholar] [CrossRef]
  54. Sarker, S.A.; Wang, S.; Adnan, K.M.M. Energy Consumption and Economic Growth Nexus in Bangladesh. J. Syst. Sci. Inf. 2019, 7, 497–509. [Google Scholar] [CrossRef]
  55. Lotfalipour, M.R.; Falahi, M.A.; Ashena, M. Economic growth, CO2 emissions, and fossil fuels consumption in Iran. Energy 2010, 35, 5115–5120. [Google Scholar] [CrossRef]
  56. Lee, J.W. The contribution of foreign direct investment to clean energy use, carbon emissions and economic growth. Energy Policy 2013, 55, 483–489. [Google Scholar] [CrossRef]
  57. Shahbaz, M.; Solarin, S.A.; Mahmood, H.; Arouri, M. Does financial development reduce CO2 emissions in Malaysian economy? A time series analysis. Econ. Model. 2013, 35, 145–152. [Google Scholar] [CrossRef] [Green Version]
  58. Dickey, D.A.; Fuller, W.A. Distribution of the estimators for autoregressive time series with a unit root. J. Am. Stat. Assoc. 1979, 74, 427–431. [Google Scholar]
  59. Johansen, S. Statistical analysis of cointegration vectors. J. Econ. Dyn. Control. 1988, 12, 231–254. [Google Scholar] [CrossRef]
  60. Pedroni, P. Purchasing power parity tests in cointegrated panels. Rev. Econ. Stat. 2001, 83, 727–731. [Google Scholar] [CrossRef] [Green Version]
  61. Bashier, A.; Siam, A.J. Immigration and economic growth in Jordan: FMOLS approach. Int. J. Humanit. Soc. Sci. Educ. 2014, 1, 85–92. [Google Scholar]
  62. Mensah, C.N.; Long, X.; Boamah, K.B.; Bediako, I.A.; Dauda, L.; Salman, M. The effect of innovation on CO2 emissions of OCED countries from 1990 to 2014. Environ. Sci. Pollut. Res. 2018, 25, 29678–29698. [Google Scholar] [CrossRef]
  63. Granger, C.W.J. Investigating Causal Relations by Econometric Models and Cross-spectral Methods. Econometrica 1969, 37, 424. [Google Scholar] [CrossRef]
  64. Mahadevan, R.; Asafu-Adjaye, J. Energy consumption, economic growth and prices: A reassessment using panel VECM for developed and developing countries. Energy Policy 2007, 35, 2481–2490. [Google Scholar] [CrossRef]
  65. Pao, H.-T.; Yu, H.-C.; Yang, Y.-H. Modeling the CO2 emissions, energy use, and economic growth in Russia. Energy 2011, 36, 5094–5100. [Google Scholar] [CrossRef]
  66. Ang, J.B. Economic development, pollutant emissions and energy consumption in Malaysia. J. Policy Model. 2008, 30, 271–278. [Google Scholar] [CrossRef]
  67. Arvin, M.B.; Pradhan, R.P.; Norman, N.R. Transportation intensity, urbanization, economic growth, and CO2 emissions in the G-20 countries. Util. Policy 2015, 35, 50–66. [Google Scholar] [CrossRef]
  68. Achour, H.; Belloumi, M. Investigating the causal relationship between transport infrastructure, transport energy consumption and economic growth in Tunisia. Renew. Sustain. Energy Rev. 2016, 56, 988–998. [Google Scholar] [CrossRef]
  69. Maziarz, M. A review of the Granger-causality fallacy. J. Philos. Econ. Reflect. Econ. Soc. Issues 2015, 8, 86–105. [Google Scholar]
Figure 1. Summary of the Granger causalities in Hong Kong, Singapore, and South Korea.
Sustainability 12 10664 g001
Table 1. Variables source and description.
VariableDescription UnitSource
FTFreight transport by air Million ton-kilometersWDI
GDPGross domestic product US$ based on purchasing power parity (PPP) 2005 priceWDI
CO2Total Carbon dioxide emissions from transport% of total fuel combustionWDI
ECEnergy consumptionKg of oil equivalent per capitaEIA, WDI
URBNPopulation in urban agglomerations of more than 1 million% of the total populationWDI
Table 2. Results of the augmented Dickey–Fuller (ADF) unit root test.
SampleVariablesADF Test LevelADF Test ∆
InterceptIntercept with TrendInterceptIntercept with Trend
Hong Kong ln FT−1.621595−2.112267−3.482117 **−3.372594 ***
ln GDP1.793236−0.836424−3.752647 **−5.684279 *
ln CO2−1.746876−1.833922−2.770019 ***−4.779845 *
ln EC−2.341277−1.952472−3.084842 ***−4.124641 **
ln URBN−2.490371−2.987367−3.485382 **−8.588034 ***
Singapore ln FT−2.637976−0.927751−3.173189 **−4.933238 ***
ln GDP0.192578−2.646660−3.292680 **−3.326197 ***
ln CO2−0.575660−2.190968−4.022784 *−3.968516 **
ln EC−0.938232−1.654182−5.009670 ***−5.328170 ***
ln URBN−1.799816−2.121417−3.684012 **−3.526451 ***
South Korea ln FT−1.929051−2.724326−6.477435 *−6.373907 *
ln GDP−0.418006−2.763469−4.523819 *−4.466164 *
ln CO2−1.796247−1.243045−3.063300 *−1.648152 ***
ln EC−0.706494−1.863644−6.577959 *−6.248520 *
ln URBN−1.211805−2.276505−2.730032 ***−2.224946 **
*, **, *** indicate significance at 1%, 5%, 10% level, respectively.
Table 3. Results of the Johansen co-integration test.
SamplesYearsLagsHypothesisJohansen Test StatisticsNote
H0H1Trace5%Max-Eigen5%
Hong Kong1995–20171r = 0
r ≤ 1
r > 0
r > 1
109.1362
54.99742
27.14683
8.069588
0.910491
69.81889
47.85613
29.79707
15.49471
3.841466
54.13882
27.85060
19.07724
7.159097
0.910491
33.87687
27.58434
21.13162
14.26460
3.841466
Trace test indicates 2 cointegrating equations at the 0.05 level
Max-eigenvalue test indicates 2 cointegrating equations at the 0.05 level
Singapore1995–20171r = 0
r ≤ 1
r > 0
r > 1
92.95562
46.45274
26.18081
11.00769
2.171486
69.81889
47.85613
29.79707
15.49471
3.841466
46.50288
20.27193
15.17312
8.836204
2.171486
33.87687
27.58434
21.13162
14.26460
3.841466
Trace test indicates 1 cointegrating equation at the 0.05 level
Max-eigenvalue test indicates 1 cointegrating equation at the 0.05 level
South Korea1995–20171r = 0
r ≤ 1
r > 0
r > 1
98.36770
57.25285
25.21879
12.37046
0.022893
69.81889
47.85613
29.79707
15.49471
3.841466
41.11485
32.03406
12.84833
12.34756
0.022893
33.87687
27.58434
21.13162
14.26460
3.841466
Trace test indicates 2 cointegrating equations at the 0.05 level
Max-eigenvalue test indicates 2 cointegrating equations at the 0.05 level
Notes: All the variables are with logarithms.
Table 4. Summary of fully modified ordinary least square (FMOLS) regression results.
Dependent Variable l n FT
Sample l n GDP l n CO 2 l n EC l n URBN R2Adj-R2
Hong Kong0.979376 *0.7790051.697001 **11.871480.830.81
Singapore0.428509 *2.173917 *0.340190 *7.250403 **0.650.57
South Korea0.482706 *1.175235 *1.274457 *8.535497 *0.820.77
* and ** indicate significance at 1%, 5% level, respectively. GDP = Gross Domestic Product, FT = Freight transport, CO2 = carbon dioxide emissions, EC = Energy consumption, URBN = Urbanization.
Table 5. Results of pairwise Granger causality test.
SampleOptimal LagNull-HypothesisF-StatisticsP-Value Causality
Hong Kong2GDP does not Cause FT
FT does not Cause GDP
CO2 does not Cause FT
FT does not Cause CO2
EC does not Cause FT
FT does not Cause EC
URBN does not Cause FT
FT does not Cause URBN
GDP does not Cause CO2
CO2 does not Cause GDP
URBN does not Cause CO2
CO2 does not Cause URBN
URBN does not Cause GDP
GDP does not Cause URBN
4.04714
0.61626
1.75135
2.71448
2.78494
0.61255
8.20787
1.64829
12.0554
0.40146
9.15104
1.83883
4.30323
4.81873
0.0378 **
0.5523
0.2152
0.0913 ***
0.0917 ***
0.5542
0.0035 *
0.2234
0.0006 *
0.6759
0.0022 *
0.1911
0.0320 **
0.0230 **
GDP→FT
 
FT→ CO2
 
EC→FT
 
URBN→FT
 
GDP→ CO2
 
URBN→ CO2
 
URBN↔GDP
Singapore2GDP does not Cause FT
FT does not Cause GDP
CO2 does not Cause FT
FT does not Cause CO2
EC does not Cause FT
FT does not Cause EC
URBN does not Cause FT
FT does not Cause URBN
GDP does not Cause CO2
CO2 does not Cause GDP
URBN does not Cause CO2
CO2 does not Cause URBN
URBN does not Cause GDP
GDP does not Cause URBN
5.19789
3.71778
0.50776
3.98627
12.5516
0.00684
0.50822
4.11550
11.8325
7.22831
3.18001
0.32960
4.68480
4.96431
0.0182 **
0.0472 **
0.4848
0.0604 ***
0.0005 *
0.9932
0.6110
0.0361 **
0.0027 *
0.0145 **
0.0905 ***
0.5726
0.0250 **
0.0210 **
GDP↔FT
 
FT→ CO2
 
EC→FT
 
FT→URBN
 
GDP↔ CO2
 
URBN→CO2
 
URBN↔ GDP
South Korea2GDP does not Cause FT
FT does not Cause GDPCO2 does not Cause FT
FT does not Cause CO2
EC does not Cause FT
FT does not Cause EC
URBN does not Cause FT
FT does not Cause URBN
GDP does not Cause CO2
CO2 does not Cause GDP
URBN does not Cause CO2
CO2 does not Cause URBN
URBN does not Cause GDP
GDP does not Cause URBN
3.27051
0.68637
0.47439
2.99148
1.71035
0.95653
4.71228
1.57714
0.01810
0.65539
0.43036
0.05279
4.13482
2.36175
0.0864 ***
0.4177
0.0699 ***
0.4993
0.0999 ***
0.2065
0.3404
0.0428 **
0.2007
0.8944
0.4282
0.8204
0.0357 **
0.1263
GDP→FT
 
CO2→ FT
 
EC→FT
 
FT→URBN
 
GDP ~CO2
 
URBN~CO2
 
URBN→GDP
*, **, *** indicates 1%, 5%, and 10% significance levels respectively. → indicates unidirectional causality, ↔ denotes bidirectional causality, ~ means no causality. GDP =Gross Domestic Product, FT = Freight transport, CO2 = carbon dioxide Emissions, EC = Energy consumption, URBN = Urbanization.
Publisher’s Note: MDPI stays neutral with regard to jurisdictional claims in published maps and institutional affiliations.

