Article

Experimental Study on Physical-mechanical Properties and Fracture Behaviors of Saturated Yellow Sandstone Considering Coupling Effect of Freeze-Thaw and Specimen Inclination

1
State Key Laboratory for Geomechanics and Deep Underground Engineering, China University of Mining and Technology, Xuzhou 221116, China
2
School of Mechanics and Civil Engineering, China University of Mining & Technology, Xuzhou 221116, China
3
State Key Laboratory of Coal Resources and Safe Mining, China University of Mining and Technology, Xuzhou, Jiangsu 221116, China
*
Authors to whom correspondence should be addressed.
Sustainability 2020, 12(3), 1029; https://0-doi-org.brum.beds.ac.uk/10.3390/su12031029
Submission received: 4 January 2020 / Revised: 26 January 2020 / Accepted: 29 January 2020 / Published: 31 January 2020
(This article belongs to the Special Issue Sustainability Issues in Civil Engineering and Management)

Abstract

:
The effect of freeze-thaw on the physical-mechanical properties and fracture behavior of rock under combined compression and shear loading was crucial for revealing the instability mechanism and optimizing the structure design of rock engineering in cold regions. However, there were few reports on the failure behavior of rock treated by freeze-thaw under combined compression and shear loading due to the lack of test equipment. In this work, a novel combined compression and shear test (C-CAST) system was introduced to carry out a series of uniaxial compression tests on saturated yellow sandstone under various inclination angles (θ = 0°, 5°, 10°, and 15°) and the number of freeze-thaw cycles (N = 0, 20, 40, and 60). The test results showed that the P-wave velocity dramatically decreased, while the rock quality and porosity increased gradually as N increased; the peak compression strength and elastic modulus obviously decreased with the increasing θ and N, while the peak shear stress increased gradually with the increasing θ and decreased with the increase of N, indicating that the shear stress component can accelerate the crack propagation and reduce its resistance to deformation. The acoustic emission (AE) results revealed that the change of crack initiation (CI) stress and crack damage (CD) stress with the θ and N had a similar trend as that of the peak compression strength and elastic modulus. Particularly, the CI and CD thresholds at 60 cycles were only 81.31% and 84.47% of that at 0° cycle and indicated a serious freeze-thaw damage phenomenon, which was consistent with the results of scanning electron microscopy (SEM) with the appearance of some large-size damage cracks. The fracture mode of sandstone was dependent on the inclination angle. The failure mode developed from both the tensile mode (0°) and combined tensile-shear mode (5°) to a pure shear failure (10°–15°) with the increasing inclination angle. Meanwhile, the freeze-thaw cycle only had an obvious effect on the failure mode of the specimen at a 5° inclination. Finally, a novel multivariate regression analysis method was used to predict the peak compression strength and elastic modulus based on the initial strength parameters (θ = 0°, N = 0). The study results can provide an important reference for the engineering design of rock subjected to a complex stress environment in cold regions.

1. Introduction

Studies on the freeze-thaw effect of rock or rock-like material have attracted extensive attention in many geological engineering fields, such as the tunnel and end-slope coal pillar located in the extremely cold environment, etc. [1,2]. Many studies have indicated that the freeze-thaw effect has an extremely important influence on the physical-mechanical properties and fracture behaviors of rock material [3,4]. Therefore, a comprehensive understanding of the failure behavior of rock material under the freeze-thaw effect is crucial for the related engineering design in cold regions. In general, rock located in geological bodies is often subjected to a complex in-situ stress environment, which is affected by combined compression and shear loading. Compared with the pure compression state, the shear stress component is not conducive to the stability of rock [5,6,7]. Once this rock engineering is exposed to the freeze-thaw effect, it will induce freeze-thaw damage to the rock construction, worsen the mechanical properties, and increase the instability risk of rock engineering. Hence, studies on the effect of freeze-thaw on the physical-mechanical properties and fracture behaviors of rock under combined compression and shear loading are extremely important for revealing the instability mechanism and optimizing the structure design of rock engineering in cold regions.
The physical properties (mass, wave velocity, porosity, electrical resistivity, etc.), mechanical properties (compressive strength, elastic modulus, internal friction angle, etc.), and microstructure characteristics of rocks were all significantly influenced by the number of freeze-thaw cycles [8,9,10,11,12,13], which have been widely discussed by many scholars. Fu et al. studied the influence of the number of freeze-thaw cycles on the mechanical properties of slate under pure uniaxial compression, and the results indicated that the elastic modulus, shear modulus, and uniaxial compressive strength of slate all took on an exponential downward trend with the increasing freeze-thaw cycles. Compared with that, Poisson’s ratio presented a linear upward trend. Based on a pure uniaxial compression test, Zhang et al. [8] tested the influence of freeze-thaw cycles on the mechanical properties of rocks with different properties, and the results demonstrated that the elastic modulus and compressive strength of the two rocks gradually decreased as the freeze-thaw cycles increased. However, the freeze-thaw durability of shale was higher than that of sandstone. Moreover, when there were more than 20 freeze-thaw cycles, sandstone began to change from brittle failure to ductile failure, while shale did not show an obvious plastic deformation. Regarding coarse sandstone and fine sandstone as research objects, Sass et al. [9] analyzed the triaxial compressive mechanical properties of rock, holding that the triaxial compressive strength of rocks decreased exponentially as the number of freeze-thaw cycles increased. Yang et al. [11] conducted research on the creep characteristics of quartz sandstone under pure uniaxial compression with different numbers of freeze-thaw cycles and chemical corrosion conditions; they observed the microstructure of the tested specimen by SEM, revealing the influence of the number of freeze-thaw cycles on the creep rupture of quartz sandstone. Uniaxial compression, splitting tension, and angle-changed shear tests on red sandstone with different freeze-thaw cycles (F-T cycles) were carried out by Wang et al. [12] with ultrasonic detections. Liu et al. [13] conducted the triaxial tests and the freeze-thaw tests on Qinghai-Tibet silty sand to investigate the failure strength and the strength parameters (elastic modulus, cohesion, and angle of internal friction). The results indicated that the freeze-thaw number has a prominent influence on the aforementioned mechanical behaviors. However, the freezing low temperature effect is negligible. The above analysis showed that experimental conditions were one of the most important factors affecting the mechanical properties and fracture behaviors of rock materials. However, many previous studies focused mainly on the freeze-thaw effects of rocks under pure uniaxial compression or triaxial compression. Only a few researchers investigated the mechanical response of rock material subjected to the effect of freeze-thaw cycles under combined compression and shear loading.
Studies on the mechanical and failure behaviors of rock, rock-like, or synthetic materials under dynamic combined compression and shear loading through the modified Split Hopkinson Pressure Bar (SHPB) system [5,6] have been widely carried out. However, it is critical to keep the long-term stability of rock engineering consistent with the field condition. Hence, it is extremely important to study the mechanical and fracture behaviors of rock under combined compression and shear loading at a low strain rate. However, few reports have been presented on combined compression and shear testing under a static loading condition in previous research, and it is a challenge to innovative experimental techniques. He et al. [7] developed the Combined Compression and Shear Test (C-CAST) system, and briefly analyzed the mechanical properties and fracture behaviors of basalt specimens under combined compression and shear loading. However, they failed to consider the influence of the freeze-thaw effect and reveal the micro-fracture behavior by acoustic emission (AE) techniques.
In this paper, saturated yellow sandstone is taken as the research object, and the innovative C-CAST system is employed to study the mechanics and fracture behaviors of saturated sandstone under the coupling action of the freeze-thaw cycle and inclination angle at a low strain rate; combined with the SEM results, the influence of freeze-thaw cycles on the microstructure of saturated sandstone is revealed. The crack initiation (CI) and crack damage (CD) stress thresholds are also analyzed and determined by AE techniques. Finally, an innovative multivariate regression equation is established to accurately predict the peak compression strength and elastic modulus of sandstone based on the initial strength parameter (θ = 0°, N = 0). The research results can offer a significant reference basis for the stability evaluation of rock engineering or highwall coal pillars under complex geological conditions [14,15]. Meanwhile, it can also provide an important theoretical basis for the sustainable mining of end-slope coal in open-pit mines.

2. Materials and Methods

2.1. Materials

The yellow sandstone is taken from an open-pit coal mine in Inner Mongolia. Its composition principally includes quartz (65.5%), muscovite (28.7%), kaolinite (3.4%), boron muscovite (1.5%), and montmorillonite (0.9%). Following the standards of the International Society for Rock Mechanics (ISRM) [16,17], the specimen is first processed into a cylinder with a diameter of 50 mm and a height of 100 mm. Its aspect ratio is 2:1. Sandpaper is used to polish the upper and lower end faces of the specimen to ensure its flatness. After that, the quality, diameter, height, and wave velocity of the specimen are measured. Specimens with a larger difference are removed, and 80 yellow sandstone specimens with a similar wave velocity are selected as test specimens. The basic physical parameters of yellow sandstone measured in their natural state in this test are displayed in Table 1.

2.2. Methods

Figure 1 shows the experimental process and equipment. The specific steps are as follows:
  • Dividing 80 specimens into 16 groups on average. Each group is numbered A1–A4, B1–B4, C1–C4, and D1–D4 respectively. The letters A, B, C, and D correspond to 0, 20, 40, and 60 freeze-thaw cycles, and the digital numbers 1 to 4 respectively correspond to specimen inclinations of 0°, 5°, 10°, and 15°. For instance, the number of freeze-thaw cycles is 40, the specimen inclination is 15°, and the number is C4.
  • Placing all specimens in a 105 °C drying box and drying them for 24 h. After cooling them to room temperature, they are taken out, and their dry mass was md. Then, all specimens are placed in a vacuum saturator, and the air pressure is controlled to 0.1 MPa. Then, 2 h for drying tap and 4 h for wetting tap. They are soaked for 24 h after the wetting tap. Following that, they are taken out, and the surface is dried. When the change of the specimen mass per hour is less than 0.01 g, it is at this time deemed to have reached the saturated state. Then, its saturated mass is mws.
  • Putting the saturated specimen after freeze-thaw treatment into a freeze-thaw box to conduct freeze-thaw experiments. The freezing temperature is set to −25 °C, and the melting temperature is set to 25 °C. The temperature range is consistent with the actual environment in northwest China. The temperature is lowered for 2 h, and the constant temperature time of freezing is 6 h. The temperature is raised for 1 h, and the melting constant temperature time is 6 h. Each freeze-thaw cycle totals 15 h. The temperature history curve of the freeze-thaw experiments is displayed in Figure 2. After the freeze-thaw treatment, the quality, porosity, and P-wave velocity of each specimen will be measured and analyzed. Then, three samples with similar test results will be selected to carry out the compression test for each of the group specimens.
  • Conducting inclined uniaxial compression tests on the specimen after the freeze-thaw treatment by using the C-CAST system. During the test, the displacement loading is adopted with a loading rate of 0.003 mm/s. The vertical load and deformation are recorded simultaneously via MTS at an interval of 0.1 s until failure occurs. A DS5 full-information acoustic emission (AE) measurement system with an 8-channel transient-recorder will be used to investigate the micro-fracture behavior of the specimen. It should be noted that the AE system should keep the synchronization of the data acquisition with MTS to ensure the accuracy of the acoustic emission data.

2.3. C-CAST System and Strength Calculation Method

The structural diagram of the C-CAST system is shown in Figure 3. This system mainly includes four parts: the upper platen, top adaptor, bottom adaptor, and lower platen. The structure of the top adaptor is the same as that of the bottom adaptor, which is mainly composed of a rotatable calibration device and fixed connection device. A dial is engraved on the rotating calibration device to adjust the angle of the specimen loading. During the specimen installation, we need to rotate the top and bottom calibration device to the designed inclination angle, and then insert the specimen into the device. Following this, the C-CAST system will be fixed to the Material Testing System (MTS) to apply the vertical load to the tested specimen. In order to investigate the micro-fracture behavior of the specimen, two symmetrical probes are mounted in the middle of the specimen by transparent solid glue to obtain the AE signal. The vertical displacement and force applied to the specimen surface will be monitored and collected by MTS. According to the test results, the effect of the freeze-thaw cycles and inclination angles on the mechanical properties and AE activities of the specimen will be analyzed and discussed in detail in this work.
As shown in Figure 4a, in the traditional uniaxial compression test, the vertical load applied to the tested specimen end by MTS is parallel to the axial direction of the specimen. At this state, the axial stress and axial strain of the specimens can be written as follows:
σ θ = F / A ,
ε θ = d / l ,
where σ θ and ε θ are respectively the axial stress and axial strain of the specimens. F is the vertical force applied to the end of the specimen by MTS. A is the cross-sectional area of the tested specimen; d is the vertical displacement of the specimen after the test, which can be monitored by MTS; l is the initial height of the specimen.
As shown in Figure 4b, with the increase of the inclination angle, the vertical load applied to the specimen surface by MTS is not parallel to the axial direction of the specimen, which leads to an additional shear stress component in the specimen end. Hence, Equations (1) and (2) are no longer applicable at this loading condition. He et al. [7] presented a simplified calculation method to obtain the axial stress component and axial strain of the specimen under combined compression and shear loading. It can be written as follows:
σ θ = F cos θ / A ,
ε θ = d / l cos θ ,
where θ is the inclination angle. According to the Figure 4b, the shear stress component ( τ θ ) and shear displacement ( s θ ) during the loading can also be deduced as follows:
τ θ = F sin θ / A ,
s θ = d tan θ / cos θ .
In fact, Equations (3)–(5) are only a simplified calculation method of the stress component and deformation of the specimen during the loading. However, it can reflect the stress state of the specimen to a certain degree. The values of the compression and shear strength properties of the tested specimens under various freeze-thaw cycles and inclination angles can be obtained by the above equations.

3. Experimental Results and Analysis

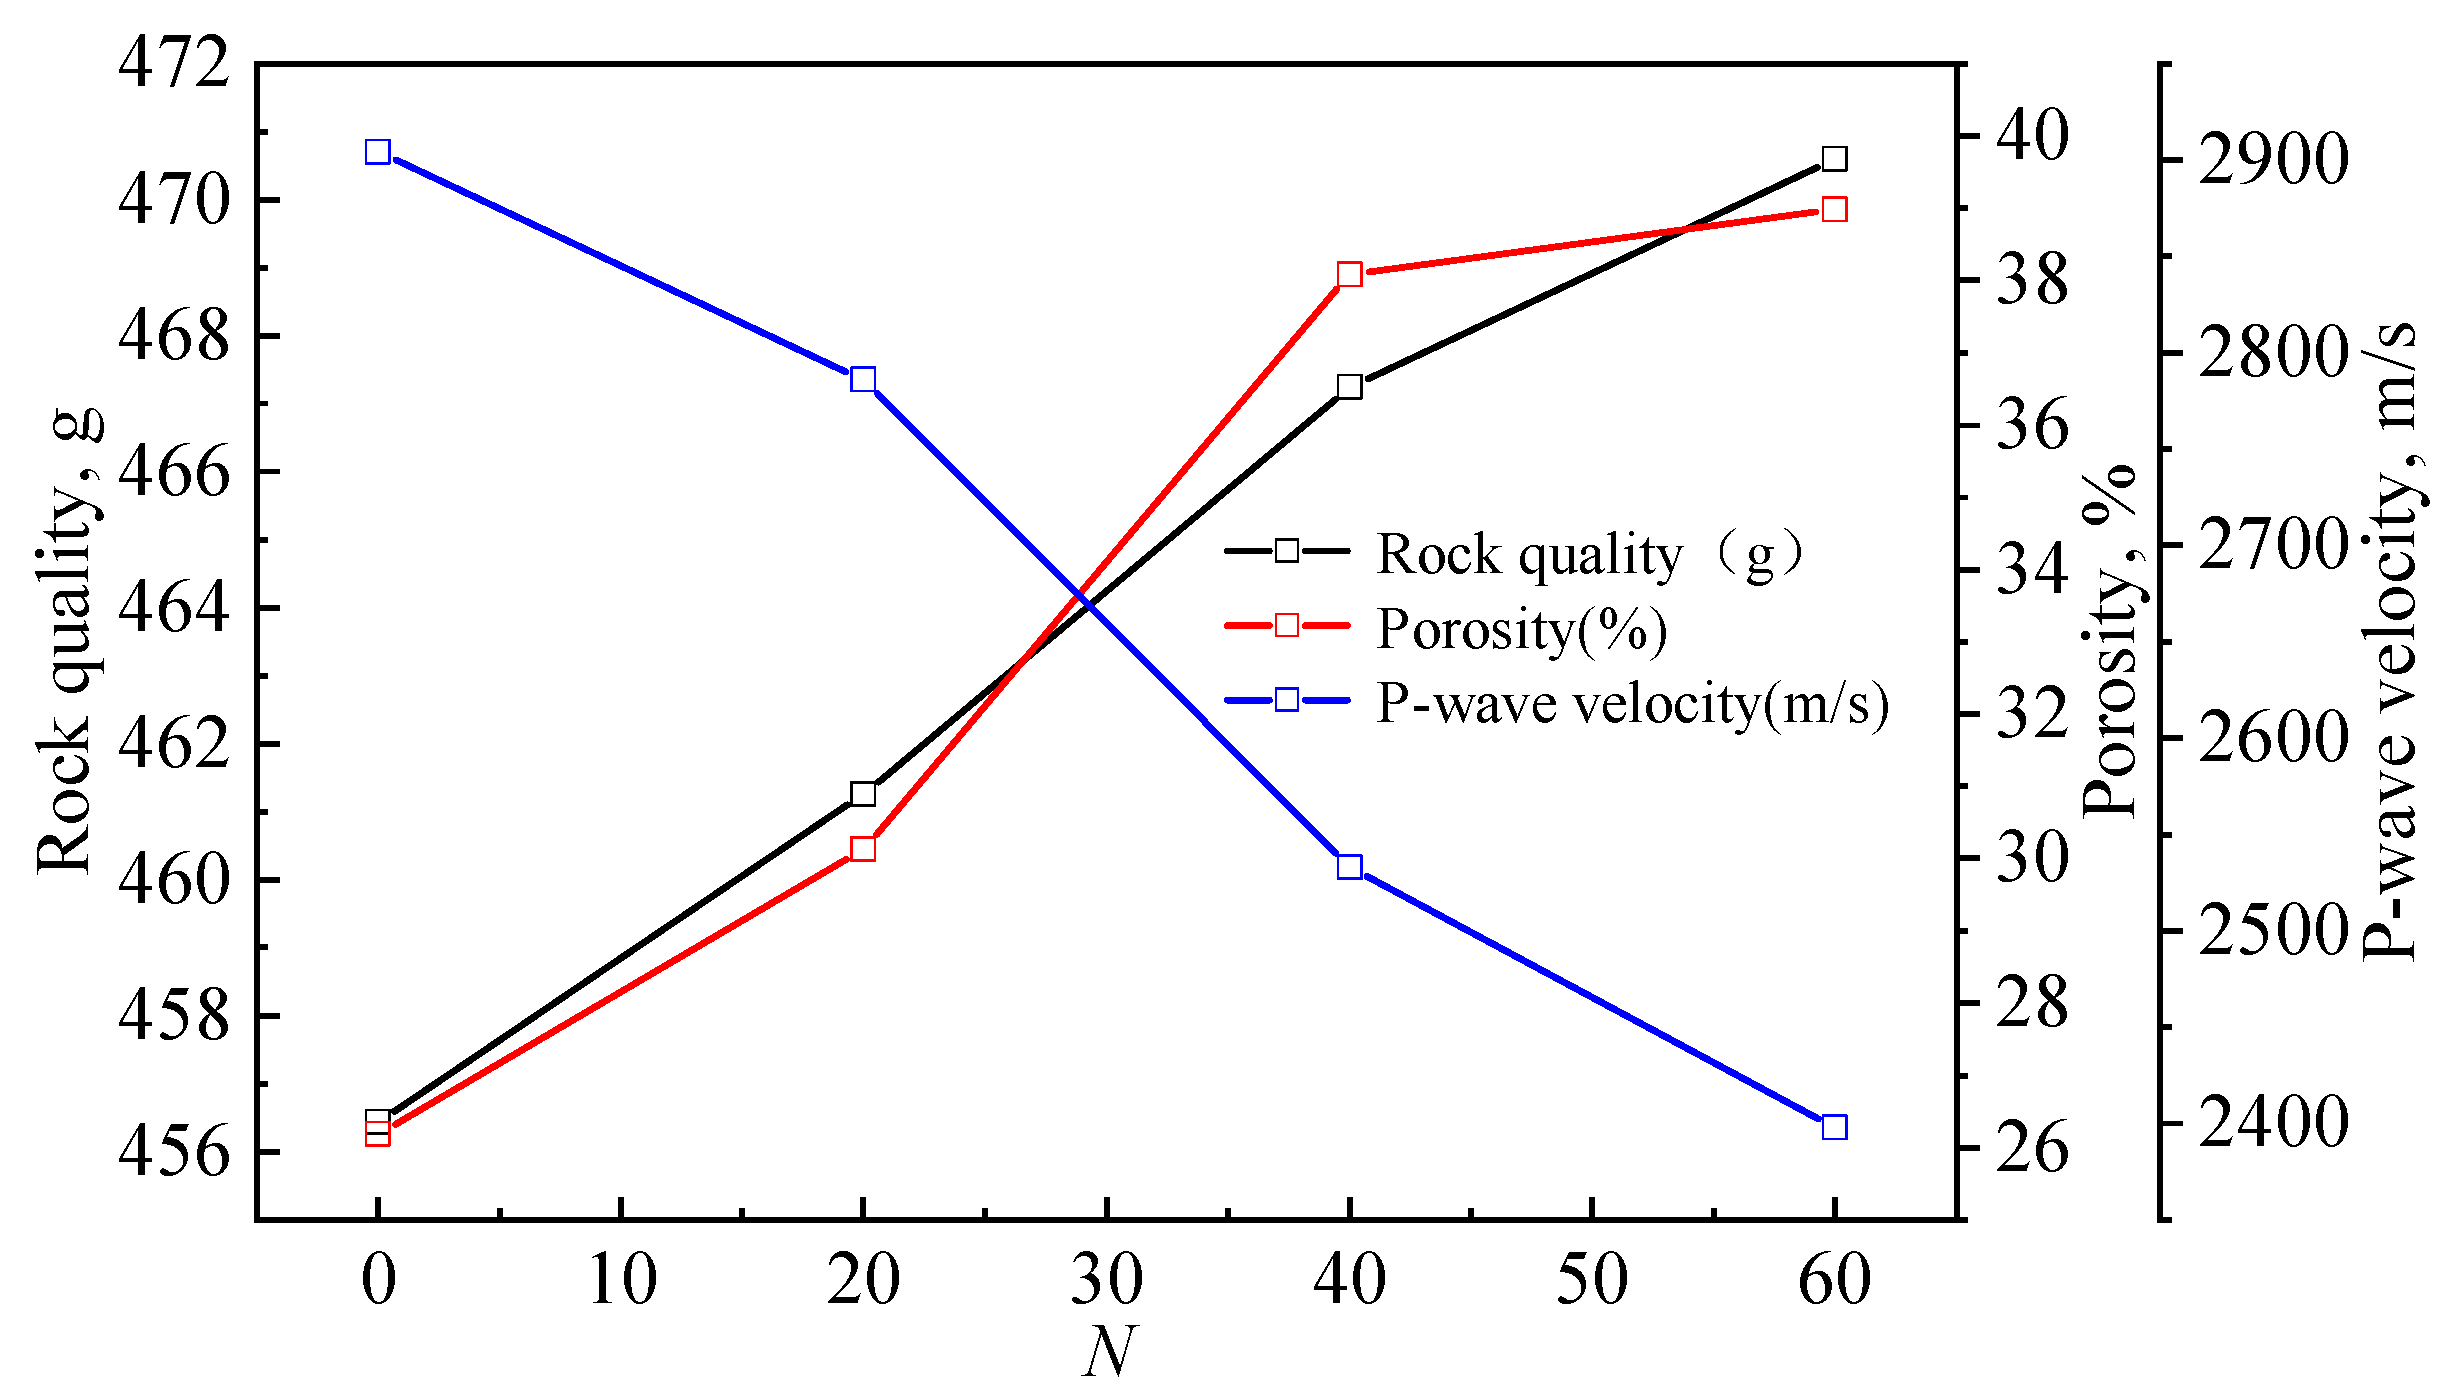
3.1. Influence of Freeze-Thaw Cycles on the Physical Properties of Yellow Sandstone

The changes of the quality, porosity, and longitudinal wave velocity of yellow sandstone, along with the number of freeze-thaw cycles, are displayed in Figure 5. With the increasing number of freeze-thaw cycles, the quality and porosity of the specimens take on an approximately linear increasing trend, while the longitudinal wave velocity presents an approximately linear decreasing trend. After 20, 40, and 60 freeze-thaw cycles, the specimen mass increases by 4.81 g, 10.80 g, and 14.15 g respectively, with the increase rates being 1.05%, 2.37%, and 3.10% respectively; the porosity rate is increased by 3.93%, 11.89%, and 12.79% respectively, with the increasing rates being 15.01%, 45.40%, and 48.84% respectively; the longitudinal wave is decreased by 118 m/s, 371 m/s, and 506 m/s respectively, with the decreasing rates being 4.06%, 12.78%, and 17.42% respectively. The decrease of the longitudinal wave velocity may be attributed to the increase of the porosity rates and microcracks of the rocks. The porosity of yellow sandstone under a saturated water condition is comparatively large, with a value of 26.19%. During the freezing stage, the water in the specimens is solidified into ice, and the volume increases. Frost-heaving force causes the original crack to continue to expand and new cracks to occur. The pore volume of the specimens enlarges, and the porosity increases; despite the fact that there is particle spalling on the surface of the specimens, the quality of water absorption of the rocks in the melting stage is greater than that of the particle spalling, resulting in an increase in the quality of the specimen after the freeze-thaw cycles; as the velocity of the longitudinal wave propagating in water is less than that in rocks, the longitudinal wave will lose some energy when passing through the medium containing pores. The velocity of the longitudinal wave gradually decreases.

3.2. Analysis of Meso-Damage Characteristics of Freeze-Thaw Yellow Sandstone

The mechanical properties and fracture behaviors of rock are closely associated with the micro-damage characteristics of rock. The number of freeze-thaw cycles will cause different damage degrees to the microstructure of rock [18,19,20]. In this paper, the microstructure characteristics of saturated yellow sandstone under different numbers of freeze-thaw cycles are studied by scanning electron microscope (SEM). Special attention is paid so that all SEM tests are conducted before the combined compression and shear tests. Figure 6 presents the typical SEM surface images of specimens when the number of freeze-thaw cycles are 0, 20, 40, and 60, respectively, with a magnification of 2000 times. The observation results reveal that there are certain initial pores and microcracks with an uneven surface, and some penetrating cracks can be found locally in SEM image when the freeze-thaw cycle is 0 times (Figure 6a). This is principally associated with the natural environment where the yellow sandstone is situated, and the inside of the specimen is relatively compact. With the number of freeze-thaw cycles increasing, the original crack in the specimen continuously develops, expands, and penetrates under the action of the frost-heaving force, with an increase in the crack width.
It is observed that the maximum crack width increases gradually from 2 μm at 20 freeze-thaw cycles (Figure 6b) to 10 μm at 40 cycles (Figure 6c) and to 12 μm at 60 cycles (Figure 6d), indicating that the samples have the most damaged degree at 60 freeze-thaw cycles. Frost-heaving cracks have occurred in the specimen at 20 cycles, and the cracks are distributed alternately and interpenetrated with each other, gradually forming connected cracks. Then, the internal structure, integrity, and mechanical properties of the specimens will be damaged. It should be noted that the cracks’ widths in the SEM image are the approximate value and can be determined according to the plotting scale in the SEM image.

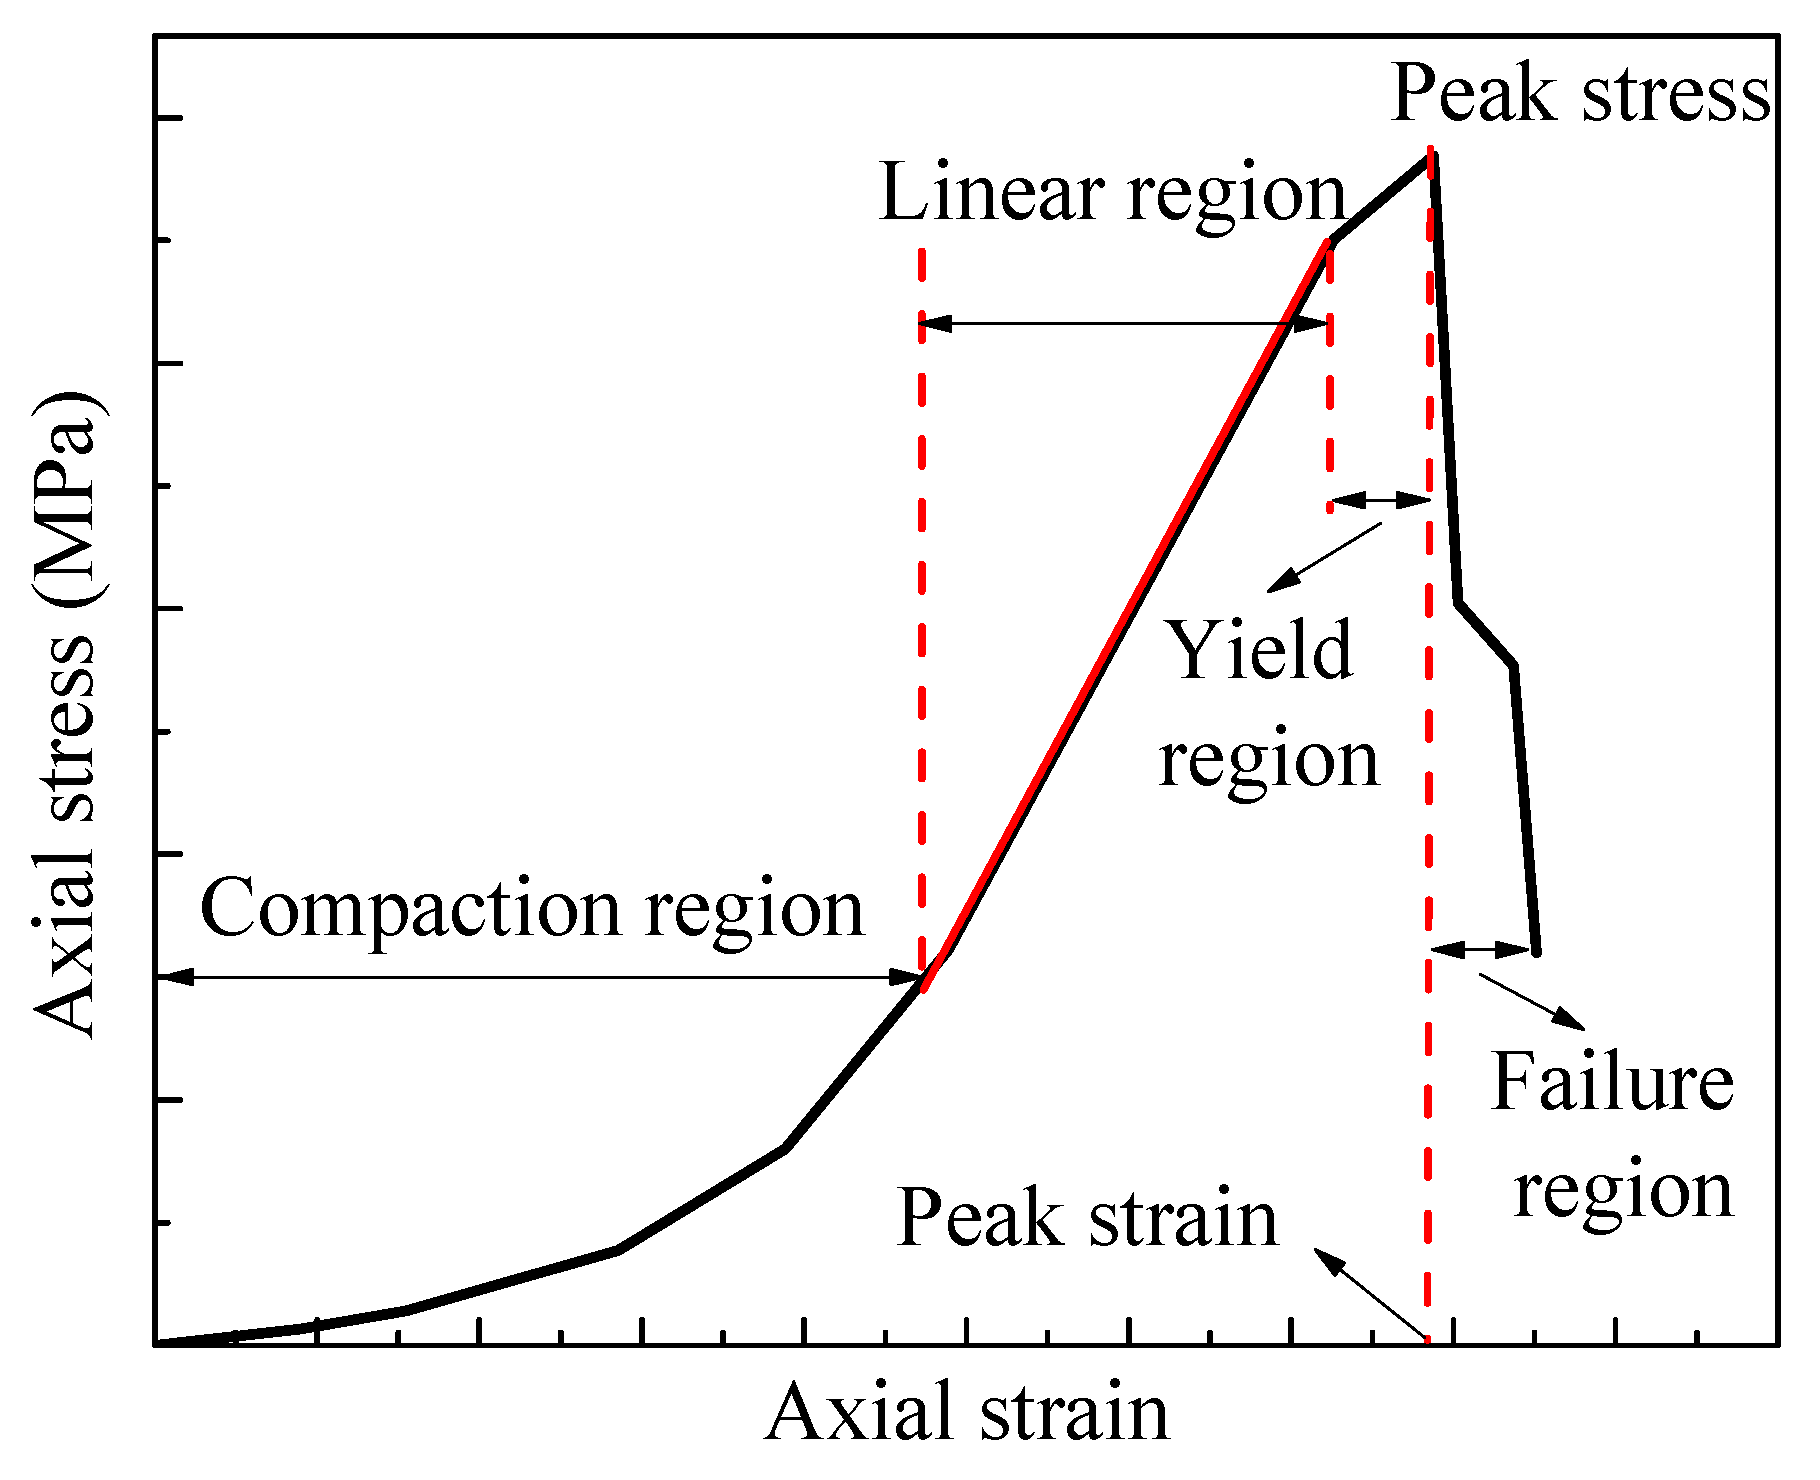
3.3. Influence of Freeze-Thaw Cycles and Inclination Angle on Axial Stress-Strain Curve

Figure 7 presents the axial stress-strain curve of yellow sandstone under different inclinations and numbers of freeze-thaw cycles. The typical curve is drawn in Figure 8. From Figure 8, we find that the axial stress-strain curve can be principally classified into four stages: (I) compaction stage, (II) linear elasticity stage, (III) crack nonlinear stretching stage, (IV) and unloading stage. As a whole, the curve is relatively smooth until it reaches peak compression stress, and then shows obvious drop characteristics with a slight fluctuation. This is not consistent with the hard rock. Furthermore, with the increasing number of freeze-thaw cycles, the compaction stage is obviously prolonged, and the ranges of crack nonlinear stretching stage gradually increase at any inclination angle, indicating that the failure mode of the specimens after the freeze-thaw treatment gradually develops from brittle failure to ductile failure. Meanwhile, the peak compression stress and the slope of the axial stress-strain curve change dramatically as the inclination angle and number of freeze-thaw cycles increase, which indicates that the inclination angle and freeze-thaw effect have a important influence on the mechanical properties of the saturated yellow sandstone. In fact, the mechanical properties of the specimen depend not only on the properties of the specimen itself, but also on the external environment and external loading mode. In the following section, the influence of the number of freeze-thaw cycles and the inclination angle on the peak compression stress and elastic modulus of the specimen will be specifically analyzed with reference to experimental data.

3.4. Effect of Freeze-Thaw Cycles and Inclination Angle on Peak Compression Stress

According to Equation (3), the values of the peak compression stress of each specimen are obtained under the coupling effect of the freeze-thaw cycle and inclination angle. Figure 9 presents the curve of the average peak compression stress of yellow sandstone varying with the specimen inclination angle (Figure 9a) and the number of freeze-thaw cycles (Figure 9b). In each group test, the data with the largest coefficient of variation is presented in Table 2. According to Table 2, the standard deviation and coefficient of variation of the data are in the range of 0.25–2.41MPa and 6.8%–14.9% respectively, which indicate the rationality of the test data. Figure 10 shows that the freeze-thaw cycles and inclination angles have an extremely important effect on the peak compression stress. The value decreases nonlinearly with the widening of the specimen inclination, and there is a roughly linear reduction as the number of freeze-thaw cycles increases. When the inclination angle θ increases from 0° to 15°, the peak compression strength decreases respectively by 57.12% for N = 0, 52.00% for N = 20, 68.81% for N = 40, and 83.61% for N = 60. Meanwhile, as the number of freeze-thaw cycles N increases from 0 to 60, the peak compression strength of the specimen decreases respectively by 30.48 MPa for θ = 0°, 24.62 MPa for θ = 5°, 17.38 MPa for θ =10°, and 14.98 MPa for θ = 15°, with the decreasing rates being 80.83%, 85.57%, 87.31%, and 92.67% respectively. The above analysis indicates that the shear stress component caused by the specimen inclination can effectively reduce the peak compression strength and accelerate the rock instability. At a high freeze-thaw damage level in particular (N = 60), the peak compression strength is more sensitive to the shear stress component.

3.5. Effect of Freeze-Thaw Cycles and Inclination Angle on Elastic Modulus

According to the axial stress-strain curve, the values of the average elastic modulus of each specimen are obtained. It should be noted that the straight-linear section of the axial stress-strain curve is taken as the elastic modulus of the specimen, which approximately corresponds to 40%–60% of the peak compression stress. Table 3 gives a series of dates with the largest coefficient of variation in each group test. We can find that the coefficient of variation of the data is in the range of 10.0%–13.2%, which indicates the reliability of the test data. From Figure 10, the elastic modulus of saturated yellow sandstone takes on a non-linear decreasing trend with the variation of inclination of the specimen (Figure 10a) and with the number of freeze-thaw cycles (Figure 10b). As the inclination angle θ increases from 0° to 15°, the elastic modulus decreases respectively by 3.7 GPa for N = 0, 3.05 GPa for N = 20, 1.17 GPa for N = 40, and 0.4 GPa for N = 60, with reduction rates of 63.88%, 74.20%, 84.80%, and 89.63% respectively. Meanwhile, when the number of freeze-thaw cycles N increases from 0 to 60, the elastic modulus of the specimen decreases by 92.30% for θ = 0°, 95.38% for θ = 5°, 96.27% for θ = 10°, and 97.79% for θ = 15° respectively. In fact, the magnitude of the elastic modulus is correlated with the friction force between the microcracks. The freeze-thaw effect can aggravate the damage of rocks and reduce the friction among particles (see SEM image in Figure 6), resulting in a decrease in the elastic modulus. In addition, the shear stress component caused by the specimen inclination can also intensify the sliding between microcracks, which leads to a decrease in the elastic modulus [7].

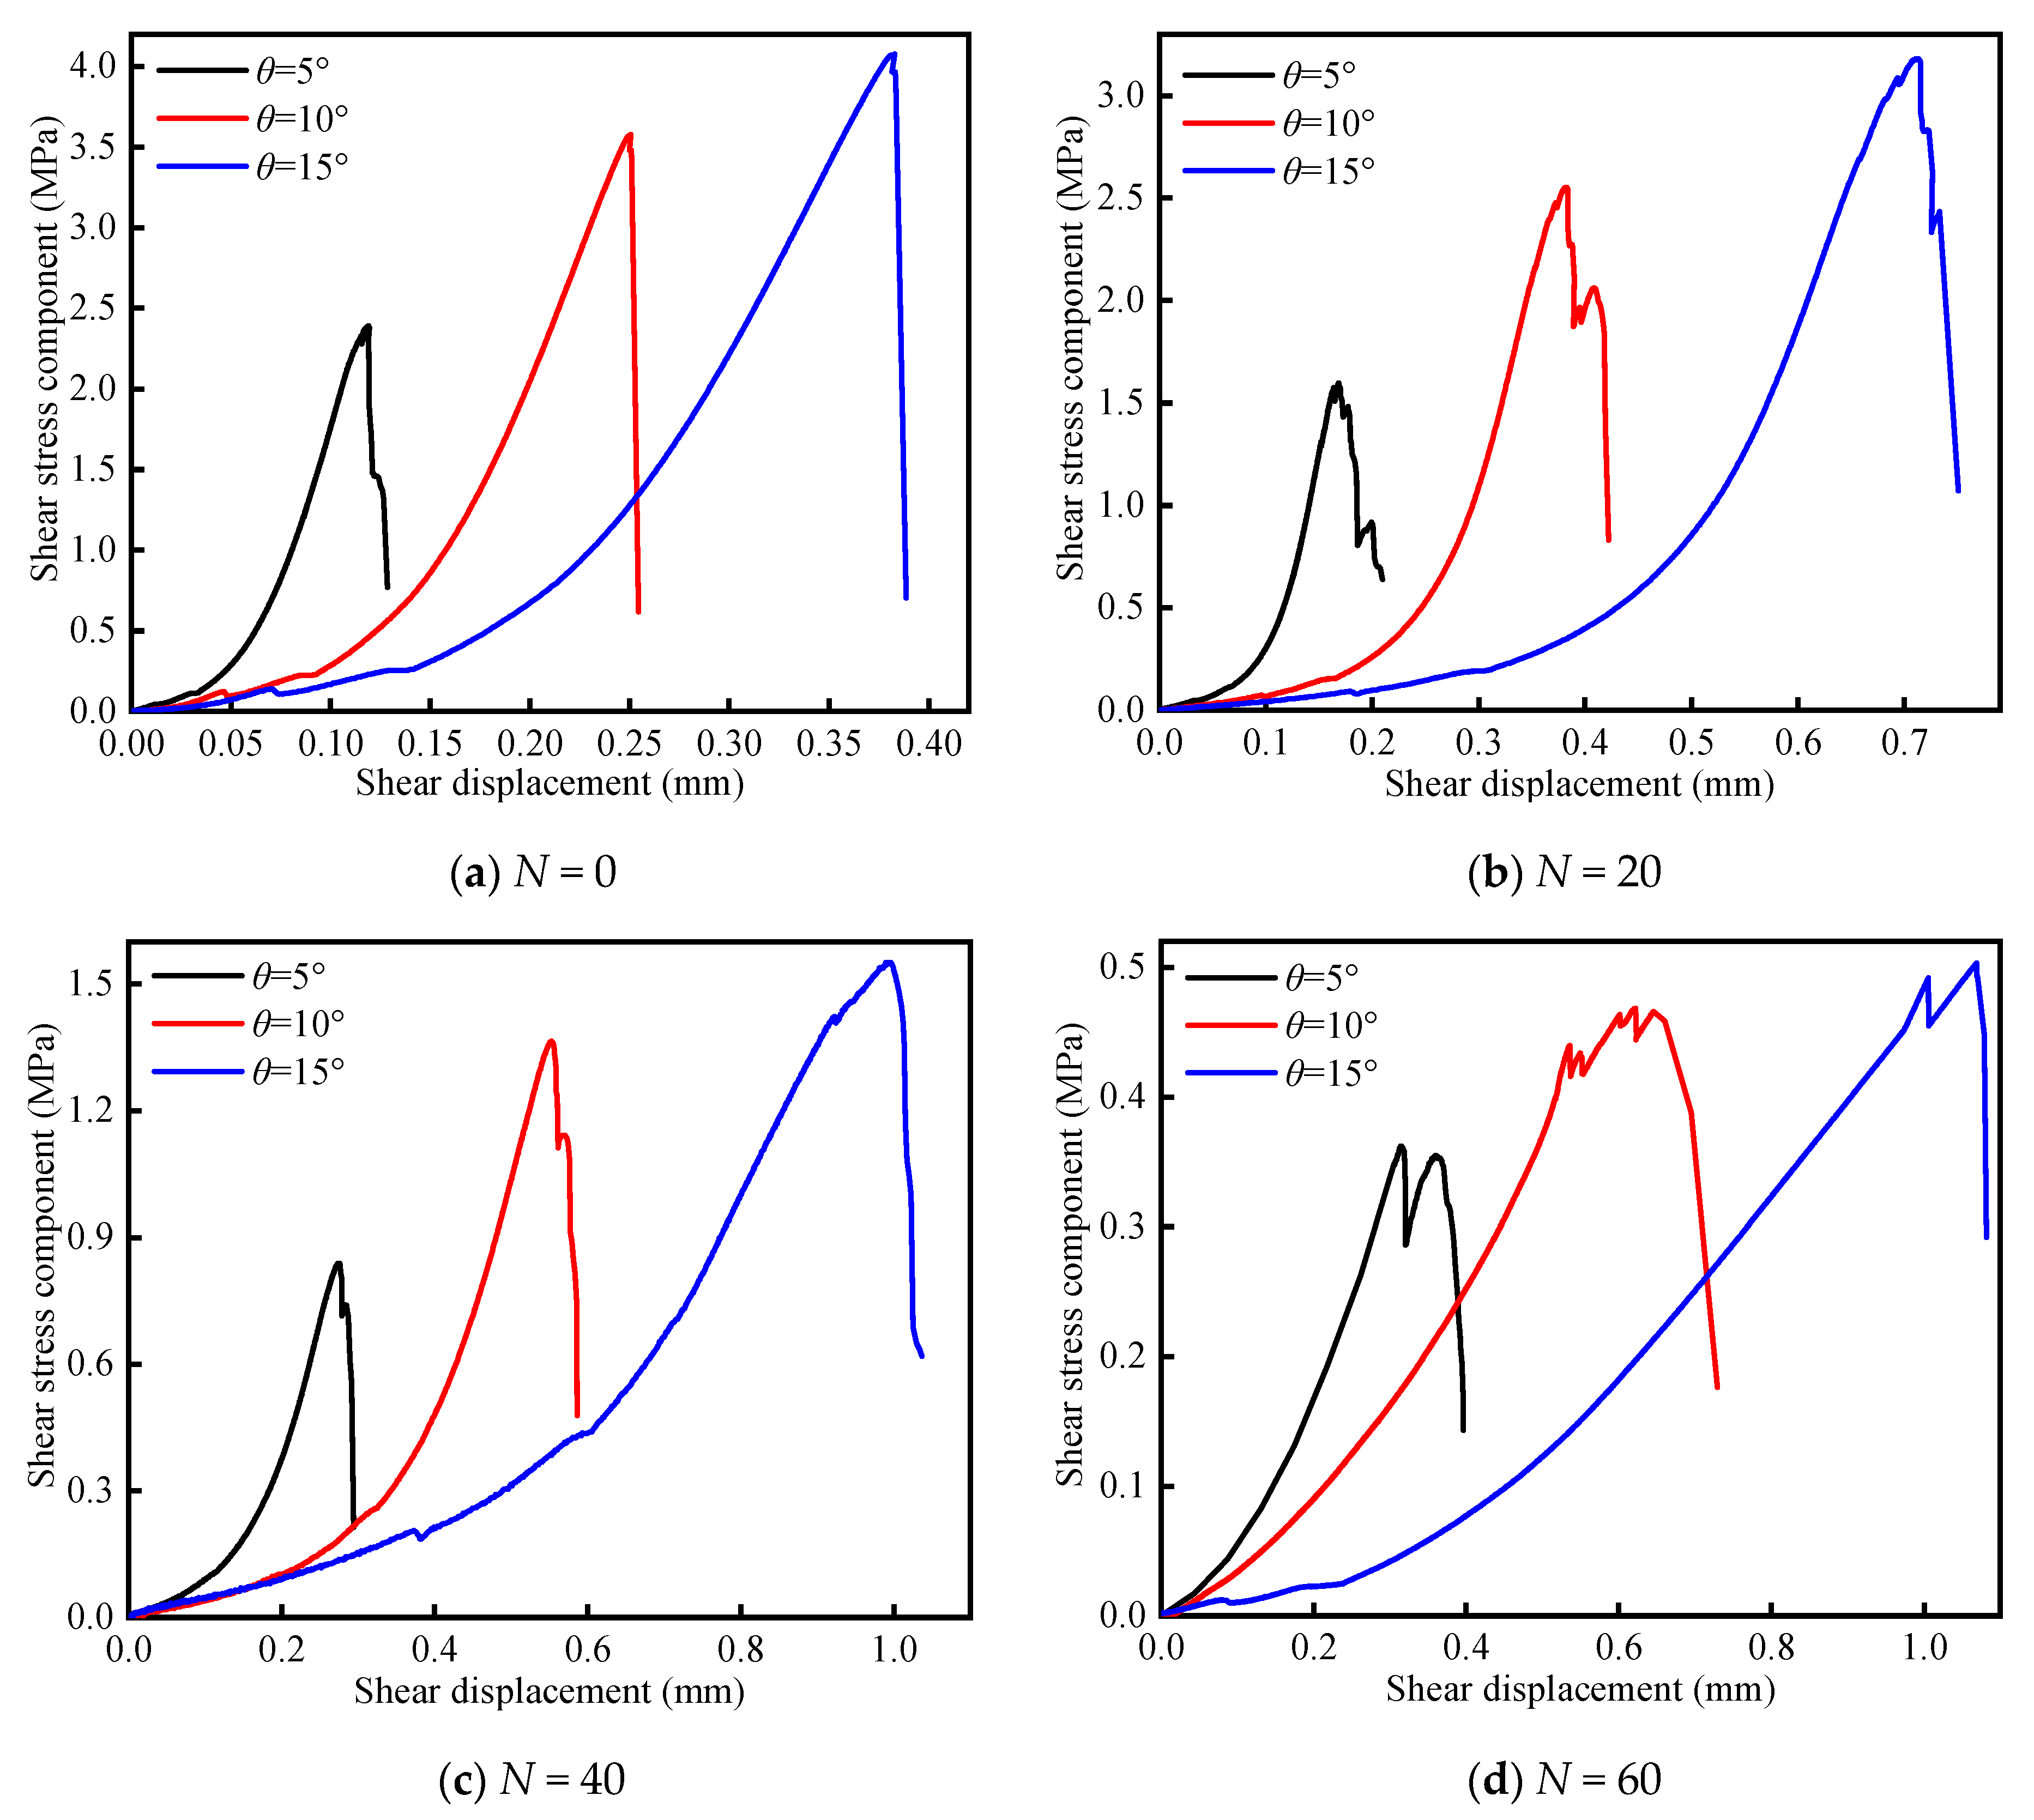
3.6. Effect of Freeze-Thaw Cycles and Inclination Angle on Peak Shear Stress

According to Equations (5) and (6), the shear stress-displacement curve can be drawn, as shown in Figure 11. It should be noted that when the specimen inclination angle is 0, the vertical load by MTS is parallel to the axial direction of the specimen. Therefore, the shear stress component is 0 at this state. Furthermore, the shear stress-displacement curve only reflects the change of the shear stress component during the loading, and the shear modulus cannot be obtained from this curve. From Figure 11, it is found that the curve of shear stress-displacement is relatively smooth before the peak shear stress and then sudden drops with a slight fluctuation, which is similar to that of the axial stress-strain. With the increase of the inclination angles, the nonlinear compression stage obviously increases at any freeze-thaw cycle, which indicates that the shear stress component is not conducive to the closure of the initial crack within the specimen. In addition, as the number of freeze-thaw cycles and the inclination angle increase, the peak shear stress component and shear displacement change observably, which shows that the shear parameters of the specimen are closely related to the external environment and to the external load mode applied to the specimen.
Table 4 presents the value of the peak shear stress of the specimens in Figure 11. The “peak shear stress vs. inclination angle and the number of freeze-thaw cycles” curves are shown in Figure 12. From Figure 12, it is found that with an increasing inclination angle, the peak shear stress increases approximately nonlinearly at any freeze-thaw cycle, while the increasing value obviously decreases. Notably, at 60 cycles, the increasing amplitude is only 0.15 MPa. Furthermore, when the inclination angle increases from 5°to 15°, the peak shear stress increases by 1.81 MPa for N = 0, 1.63 MPa for N = 20, and 0.62 MPa for N = 40 respectively. In addition, as the number of freeze-thaw cycles increases, the peak shear stress gradually decreases at the same inclination angle. In combination with Section 3.4 and Section 3.5, we can find that the peak compression stress and elastic modulus of the specimens are dependent on the shear stress component. With the increase of the shear stress component, the peak component stress and elastic modulus gradually decrease, indicating that the shear stress is beneficial to crack initiation and propagation, and that it reduces the deformation resistance ability of the specimen. In other words, the elastic modulus related to the external loading conditions may not be an intrinsic property of rock material.

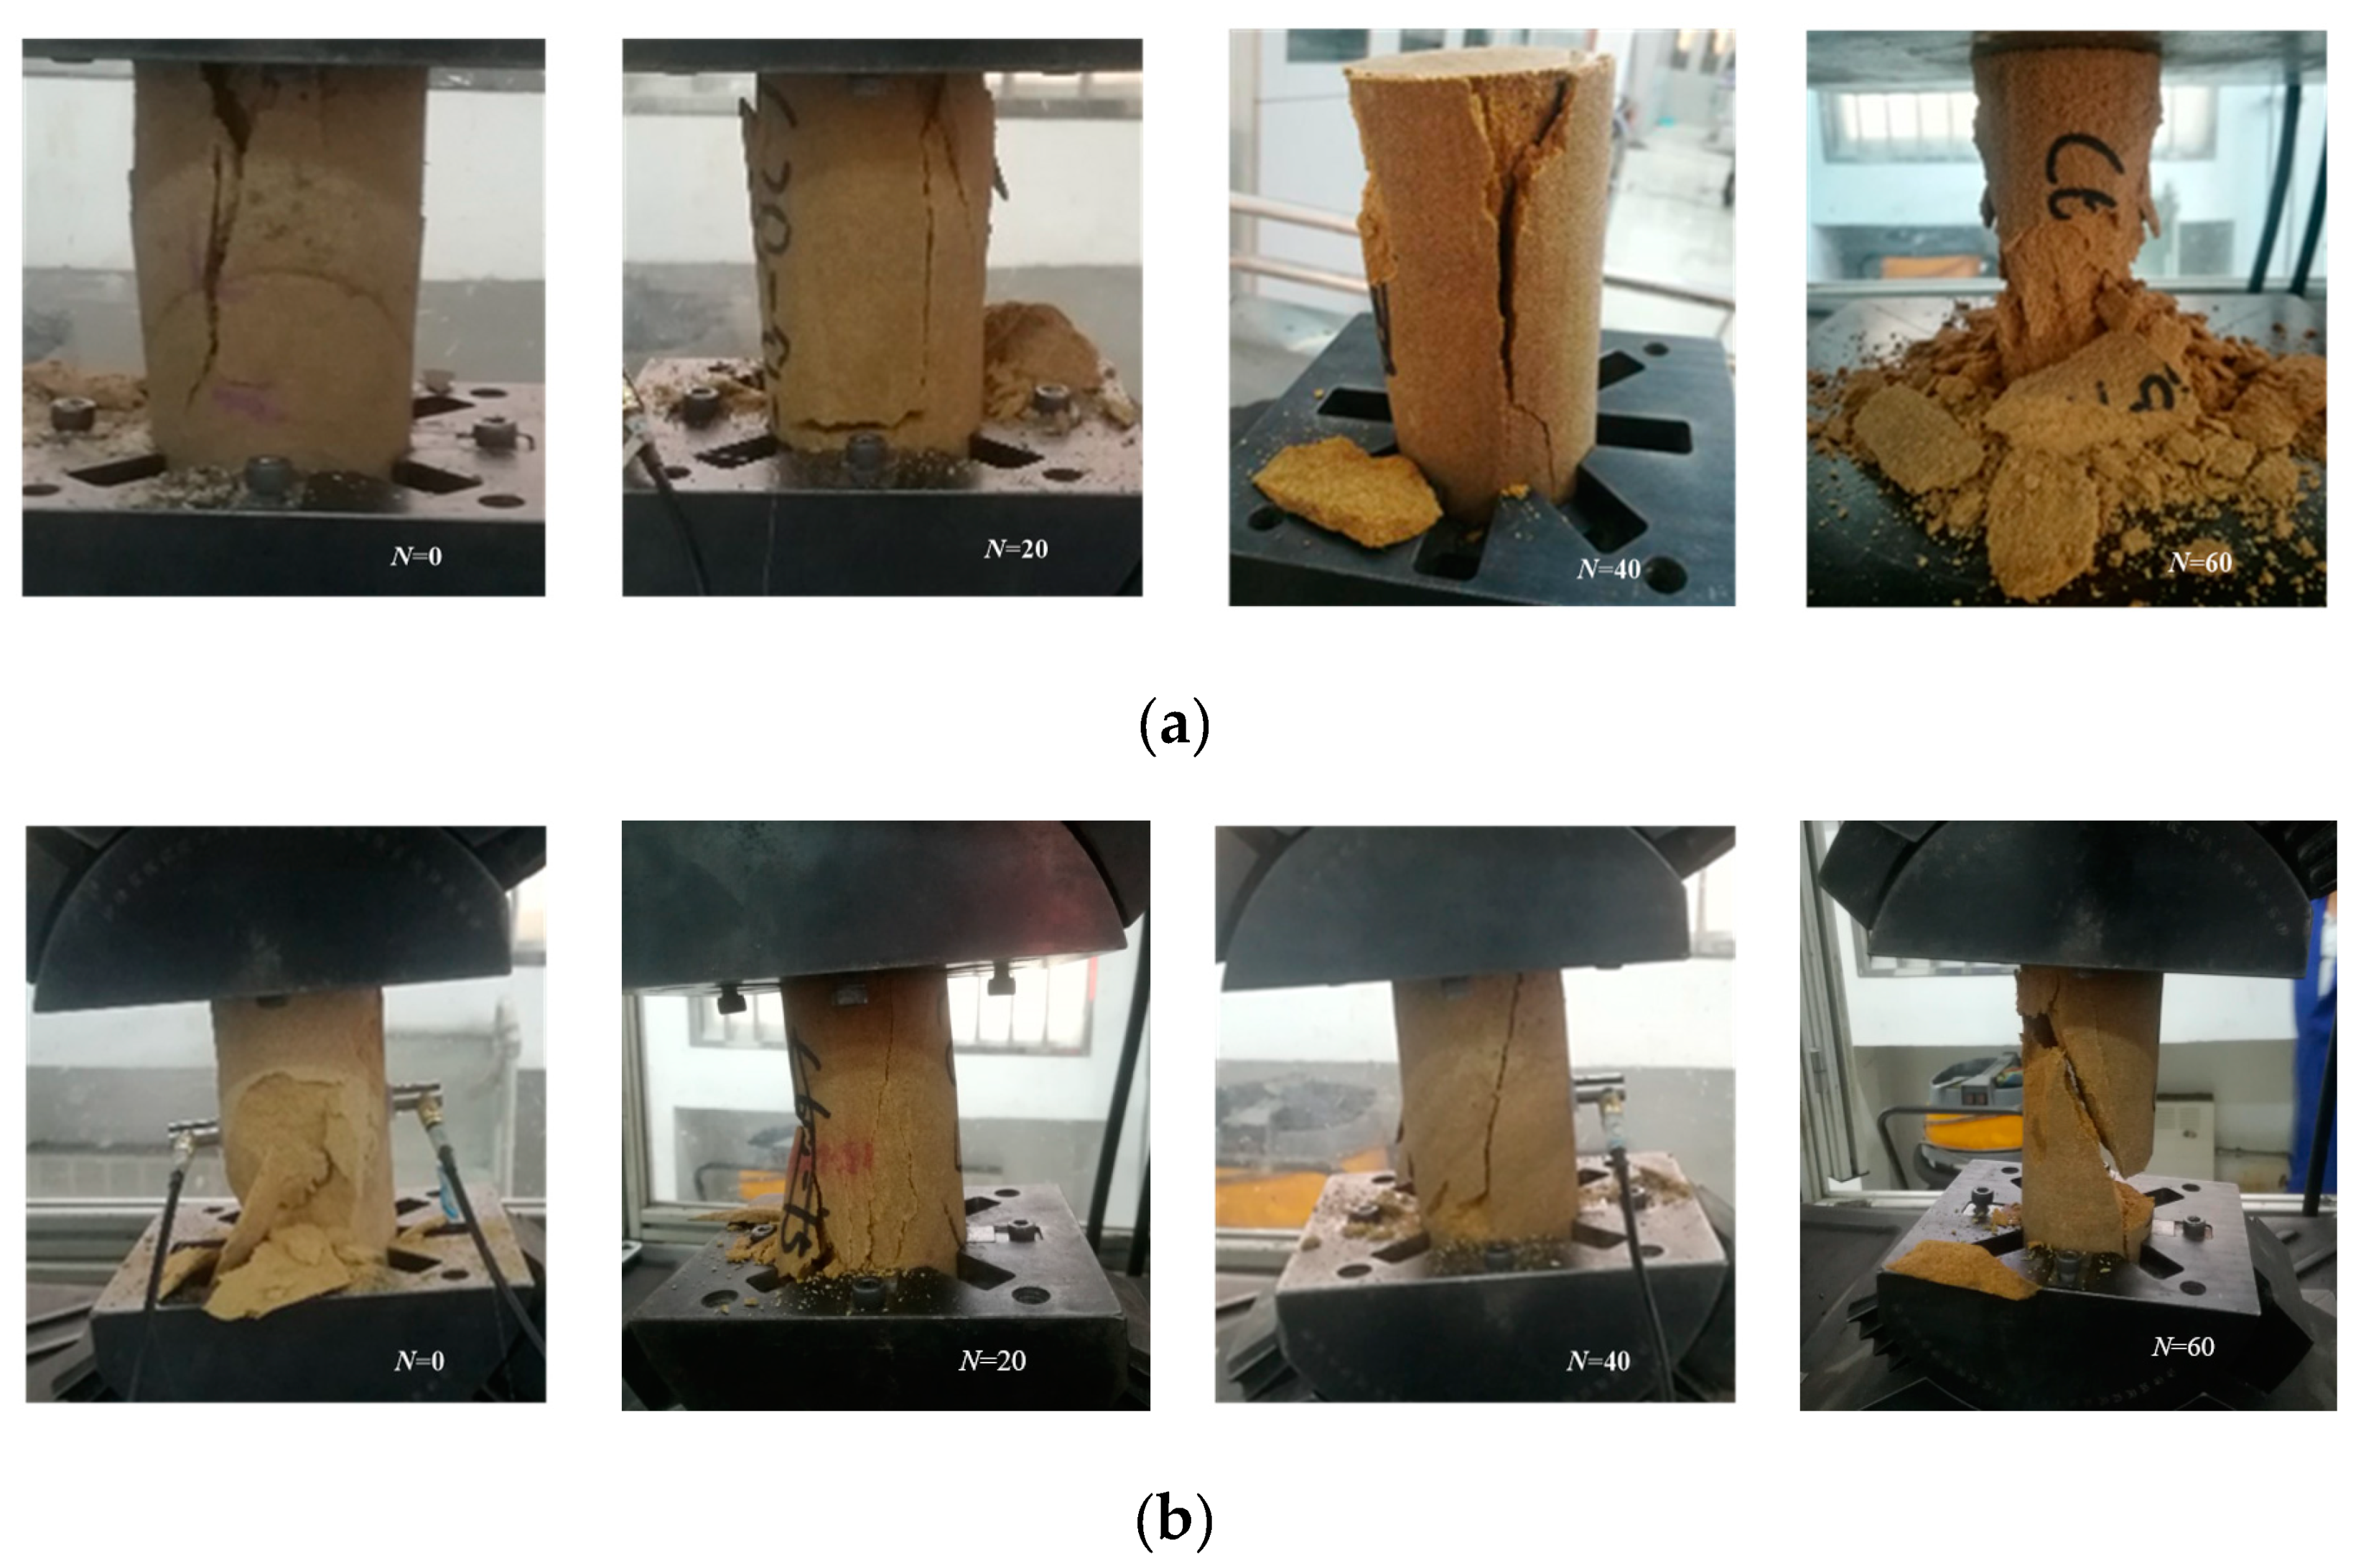
4. Macroscopic Failure Characteristics of the Specimen

The failure characteristics of frozen-thawed yellow sandstone under combined compression and shear loading are shown in Figure 13 and Figure 14. It should be noted that Figure 14 can be drawn according to the surface crack distribution of the specimen in Figure 13. The failure characteristics of frozen-thawed yellow sandstone have been widely researched in a traditional uniaxial compression test [21,22,23]. The most basic failure modes of cylindrical specimens are tensile failure or shear failure [23]. As displayed in Figure 13, when the specimen is in the pure uniaxial compression condition (θ = 0°), one or more major splitting cracks penetrate the upper and lower ends of the specimen, no matter the number of freeze-thaw cycles, which indicates that the specimen shows a typical tensile failure mode. Notably, at 40 and 60 cycles, the tensile failure is more significant with the spalling of the block surface. When the inclination angle is 5°, some spalling blocks and vertical cracks are distributed on the specimen surface for N = 0 and N = 20, belonging to a typical tensile failure. Once the number of freeze-thaw cycles reaches 40 and 60, an obvious shear failure ramp will be observed in the specimen surface, indicating that the failure mode of the specimens begins to transform from a tensile failure to a shear failure with the increasing number of freeze-thaw cycles at a 5° inclination. This means that the failure type of the specimen at a 5° inclination should belong to a combined tensile-shear failure mode. As the inclination angle further increases to 10° and 15°, a macroscopic shear crack penetrates the specimen surface for all saturated yellow sandstone (Figure 13c,d and Figure 14c,d), no matter the number of freeze-thaw cycles, indicating that the failure mode of the specimen at a 10° and 15° inclination has nothing to do with the freeze-thaw effect. Meanwhile, the fracture degree of the shear plane at 60 cycles is larger than for other freeze-thaw cycle conditions at 10° and 15° inclinations, which indicates that the number of freeze-thaw cycles has a slight importance in relation to the fracture degree.
The above analysis shows that the failure mode of the specimen belongs to a typical tensile failure for any freeze-thaw cycle conditions under a pure compression condition. When the inclination angle reaches 5°, the failure mode of the specimen under N = 0 and N = 20 is the same as for a 0° inclination, while the shear failure will be observed under N = 40 and N = 60. Therefore, the failure mode of the specimen at a 5° inclination should belong to a combined tensile-shear failure. Once the inclination angle reaches 10° and 15°, the failure mode of the specimen will be transformed from a combined tensile-shear failure (5°) to a single shear failure (10° and 15°) under any freeze-thaw cycle condition. The above analysis indicates that the influence of the inclination angle on the failure mode of saturated yellow sandstone is more significant than that of the freeze-thaw effect. The additional shear load can effectively increase the trend of shear failure of the specimen [7]. Furthermore, Xu [5] and Sun et al. [6] analyzed the dynamic failure characteristics of unconventional inclined specimens under combined compression and shear loading by means of a numerical calculation. Sun holds that the failure of specimens with different inclinations occurs at obtuse angles of the specimens, and that the propagation of macro cracks caused by shear loads proceeds along short diagonal lines, which is basically consistent with the research results of Xu [5]. The study results by Xu [5] and Sun et al. [6] also verify the correctness of this study. The above results also reveal that the failure mode of rocks is closely associated with the loading conditions and the external environment in which the specimen is situated, which do not constitute intrinsic properties of rock material.

5. Multivariate Regression Analysis of Peak Strength and Elastic Modulus

5.1. Multivariate Regression Model

Based on the study results, a regression analysis is employed to reveal the correlation among the mechanical parameters of rocks, which is one of the commonly used methods for studying rock mechanics. In previous studies, one single factor was generally used to study the relationship between the mechanical properties and external variables, such as the relationship between UCS and N [24]. However, this kind of research still has some shortcomings, because the mechanical properties of rocks are also associated with the initial strength parameters, such as the initial elastic modulus and compression strength, etc. As a result, a new regression method is adopted herein to determine the relationship among the following mechanical properties of saturated yellow sandstone: (1) the relationship between the peak compression strength ( σ θ ) for any inclination angle, initial UCS ( σ N c ) (θ = 0°) and θ; (2) the relationship between the peak compression strength ( σ N ) for any number of freeze-thaw cycles, initial UCS ( σ θ c ) (N = 0) and N; (3) the relationship between the elastic modulus (Eθ) for any inclination angle, initial elastic modulus ( E N c ) (θ = 0°) and θ; (4) the relationship between the elastic modulus ( E N ) for any number of freeze-thaw cycles, initial elastic modulus ( E θ c ) (N = 0) and N.
The experimental results in Section 3 reveal that the peak compression strength and elastic modulus of yellow sandstone are not merely associated with N and θ. In fact, they are linked to the initial peak compression strength and elastic modulus for θ = 0° and N = 0. Therefore, it is necessary to conduct a regression analysis on the initial peak compression strength and elastic modulus respectively. It should be noted that the average values of the strength parameters are selected in order to carry out the multivariate regression analysis in this work. Taking the peak compression strength as an example, the peak compression strength at any inclination angle is equal to the difference between the conventional uniaxial compressive strength and the strength reduction incurred by the inclination of the specimen, as demonstrated in Equation (7), where Δ σ is proportional to the conventional uniaxial compressive strength σ c and the inclination angle. Then, Equation (7) can be rewritten as Equation (8):
σ θ = σ c Δ σ
σ θ = m σ c + n σ c θ
where m and n are the constant, which can be determined by fitting the test results.

5.2. Results of Multivariate Regression Analysis as Well as the Relevant Tests

According to the experimental data, Equations (9)–(12) can be deduced by fitting Equation (8). Figure 15 shows the “observed strength parameters vs. predicted strength parameters” curve for N = 0 or θ = 0°. As shown in Figure 15, a 1:1 inclined line is given in the figure, and the distance between the predicted value and the 1:1 inclined line represents the difference between the predicted value and the observed value. It shows that the predicted value is basically distributed near the 1:1 inclined line, indicating that these regression equations are credible and can effectively reflect the relationship between the strength parameters ( σ θ ,   σ N ,   E θ ,   and   E N ), initial parameters ( σ N c ,   σ θ c ,   E N c ,   and   E θ c ), and external variables (N and θ).
σ θ = 0.96 σ N c 0.004 σ N c θ ,   R 2 = 0.9811   f o r   N = 0 ,
σ N = 0.85 σ θ c 0.04 σ θ c N ,   R 2 = 0.9864   f o r   θ = 0 ° ,
E θ = 0.94 σ N c   0.05 E N c   θ ,   R 2 = 0.9722   f o r   N = 0 ,
E N = 0.94 E θ c 0.05 E θ c N ,   R 2 = 0.9694   f o r   θ = 0 ° .
The strength parameter changes of yellow sandstone are closely dependent on the N and θ. Here, we propose a new function to reflect the coupling effect of the freeze-thaw cycles and inclination angles on the peak compression strength. Figure 16a presents the average value of the peak compression strength in this test at various inclination angles and freeze-thaw cycle numbers. The fitting function of the average value is shown as follows:
σ = 44.57 e θ / 23.61 e N / 56.41 7.14 .
Figure 16b presents the comparison chart of the predicted value and observed value of the peak compression strength under the coupling effect of the inclination angle and the number of freeze-thaw cycles. It shows that the difference between the predicted value and the observed value is within the acceptable range. It should be noted that this equation meets certain limitations and can only predict the experimental data in this paper. When the rock lithology is changed, Equation (13) needs to be further revised. The function can provide an important reference for rock strength assessments under a complex load environment in cold regions.

6. Analysis of AE Behavior

6.1. Determination Methods of CI and CD Thresholds

The crack initiation and propagation of rock materials are often accompanied by the release of elastic waves, which can be recorded as an AE signal. The AE signal can be analyzed by an AE monitoring system, after which AE data can be obtained. In fact, the continuous release of elastic waves during loading reflects the evolution of microcracks within the specimen, as shown in Figure 17. Originally, many microcracks with pores are distributed in the specimen. With the increase of the vertical load, these microcracks gradually close, corresponding to the compaction stage of the axial stress-strain curve. Then, the specimen will enter the linear elastic stage with no new microcrack propagation. Once the vertical load reaches a crack initiation (CI) stress, the new microcrack will appear and enter a stable propagations stage. With the further increase of the vertical load, when the vertical load reaches a crack damage (CD) stress, these new microcracks gradually interpenetrate and enter an unstable propagation stage. The above phenomenon can be reflected by the AE signal. Different stages correspond to various AE behaviors.
Many studies have shown that AE activity can provide an accurate prediction for the CI and CD thresholds [25,26,27,28]. However, the determination methods of the CI and CD thresholds are different. Wang [25] pointed out that the stress level where the first tensile crack is triggered in the opening can be used as a CI threshold. Eberhardt [26] demonstrated that the “sharp point” of the “AE signal vs. axial stress” curves can effectively reflect the change of the CI and CD thresholds. The initial stress corresponding to the point where the AE properties suddenly change for the first time can be used as the CI threshold. After the CI threshold, the axial stress at the point where the slope of the “cumulative AE property vs. axial stress” curve further obviously increases can be regarded as the CD threshold. Kim [27] and Zhao [28] proposed that the abrupt slope point of the “cumulative AE property vs. normalized axial stress” curves can be used to determine the above two thresholds. In this work, the methods by Kim and Zhao will be used to determine the CI and CD thresholds of specimens at different inclination angles and freeze-thaw cycles.

6.2. Effect of Inclination Angle on CI and CD Thresholds

In order to simplify the analysis process, in this section, the AE data of specimens under N = 20 will be used to study the influence of the inclination angles on the CI and CD thresholds. Figure 18 shows the “normalized axial stress vs. AE properties and cumulative AE properties” curves. The AE properties mainly include the average AE counts and AE energy. The normalized axial stress can be calculated via the ratio of the axial stress to the peak compression stress. The σ C I and σ C D in Figure 18 are the average CI threshold and CD threshold of the specimen, respectively, which can be determined by the AE count and AE energy. The values of σ C I , σ C D , cumulative AE properties, and shear stress at the σ C I and σ C D points under different inclination angles for N = 20 are listed in Table 5. Some meaningful conclusions can be drawn as follows:
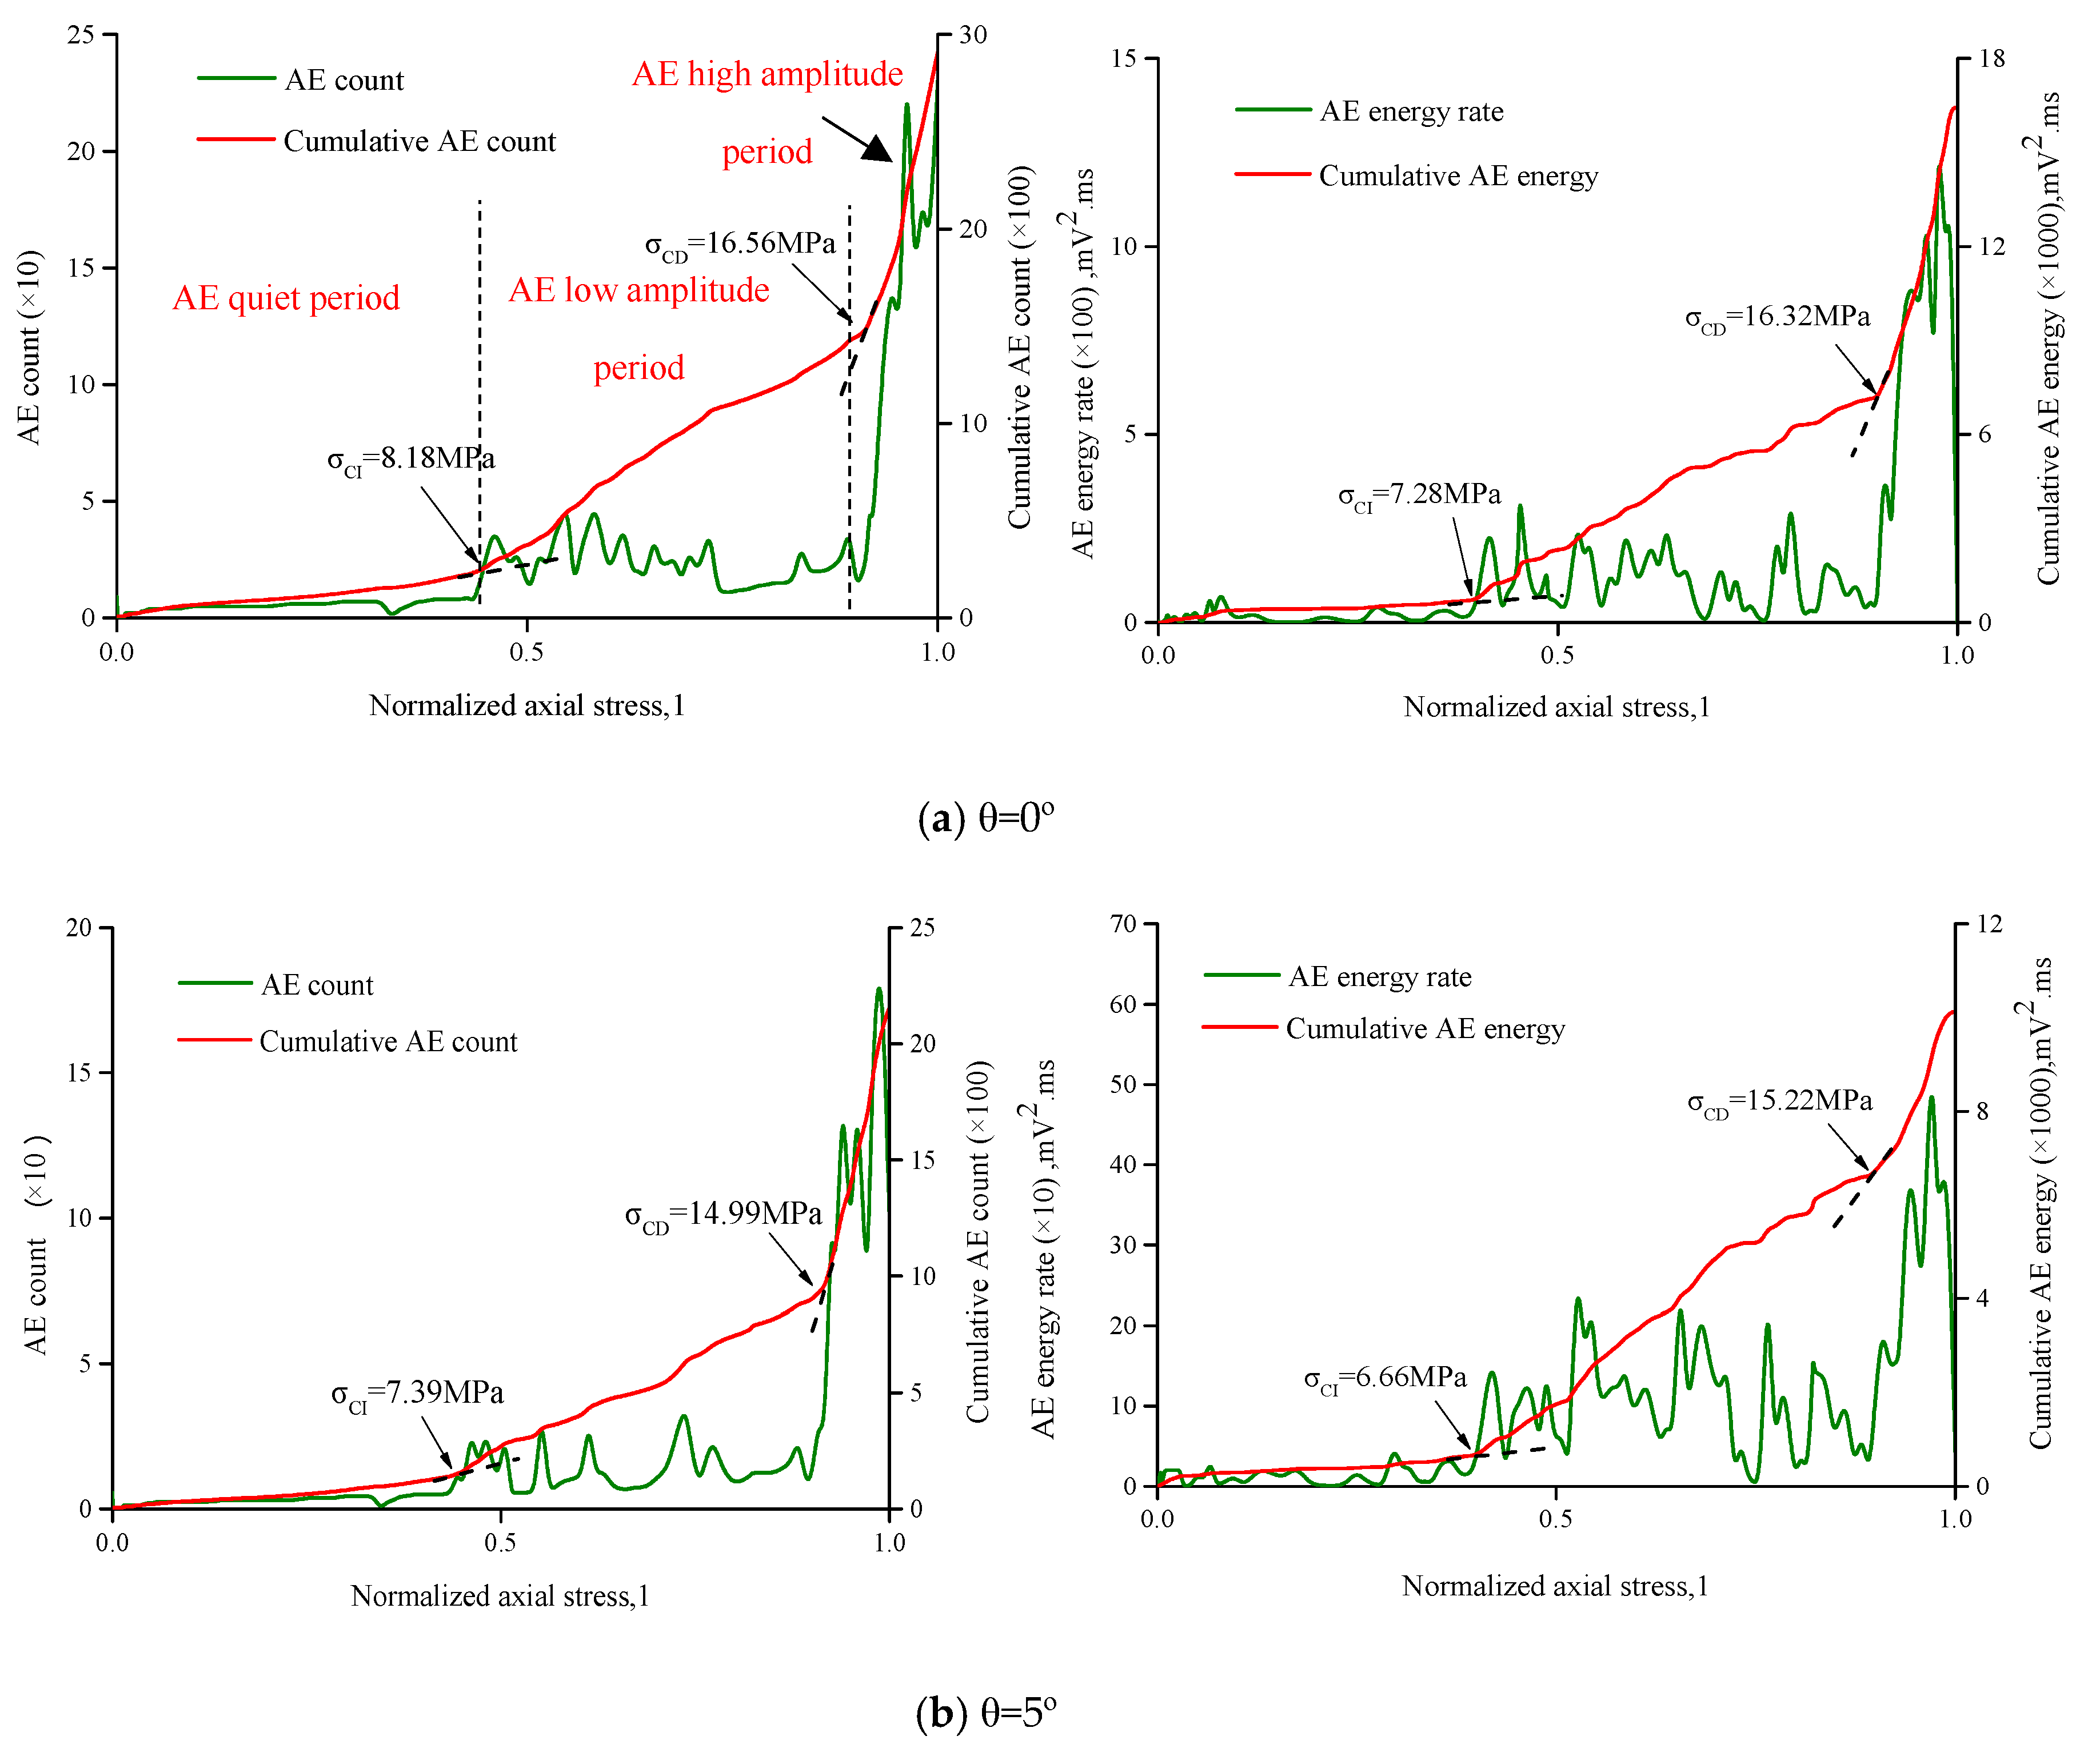
  • Regarding inclination angles, the AE signal characteristics are similar as the vertical load increases. Originally, the slope of the “cumulative AE properties vs. normalized axial stress” curve is always at a lower level before 35%–45% of peak compression stress. The amplitude of AE counts and AE energy is also obviously lower, which indicates that less elastic energy is released at this stage. The stage can be described as the AE quiet period.
  • With the further increase of the vertical load, once the crack initiation stress threshold ( σ C I ) is reached, slightly large AE events occur intermittently before 75%–90% of peak compression stress. The amplitude of the AE signal begins to increase slightly. At this point, the curve slopes of the cumulative AE properties also gradually increase, which indicates that many new microcracks start to appear and develop. Meanwhile, the amplitude of the AE signal is relatively lower than that of the AE signal near peak point. Hence, it can be called the AE low amplitude period. When the vertical load reaches the crack damage stress threshold ( σ C D ), a large number of large AE events occur sharply with a high amplitude of the AE signal, which new microcracks have interlocked, finally forming macrocracks through interpenetration. This stage can be regarded as the AE high amplitude period.
  • Although the trend of the AE signal at different inclination angles is similar and shows the change characteristic of being J-shaped, the inclination angle has an extremely important effect on the stress thresholds, cumulative AE properties, and shear stresses at the stress threshold points. From Figure 18, it is found that the values of σ C I , σ C D and the cumulative AE counts and energy decrease gradually, while the shear stresses at the CI and CD thresholds point increase slowly with the increasing inclination angle. For example, when the inclination angle increases to 10°, the values of σ C I , σ C D and the cumulative AE counts and energy decrease by 25.79%, 30.47%, 77.7%, and 85.74% compared with that at a 0° inclination, respectively. Meanwhile, the shear stresses corresponding to the σ C I and σ C D points increase by 0.99 MPa and 1.06 MPa, respectively. This means that the shear stress component under combined compression and shear loading is beneficial to the microcrack initiation and propagation of specimens, which will reduce the occurrence of large AE events. Hence, the cumulative AE properties will decrease with the increase of the inclination angles.
  • As shown in Table 5, the ratio of σ C I and σ C D to its peak compression stress is also calculated at various inclination angles. The ratio of σ C I / σ θ p e a k is in the range of 34.26%–42.97% approximately. Meanwhile, the ratio of σ C D / σ θ p e a k is at a higher level, corresponding to 79.9%–92.39% of the peak compression stress, which indicates that the CD stress threshold generally appears near the peak compression strength of the specimen with the occurrence of large AE events. Hence, the value may be used to predict the occurrence of rockburst.

6.3. Effect of Freeze-Thaw Cycles on CI and CD Thresholds

To simplify the analysis process, here, the AE behavior of the specimen at a 5° inclination angle will be used to analyze the influence of freeze-thaw cycles on the AE properties. Figure 19 shows the relationship curves between the normalized axial stress, AE properties, and cumulative AE properties for the different numbers of freeze-thaw cycles. The values of σ C I , σ C D , cumulative AE properties, and shear stresses at σ C I and σ C D points under various freeze-thaw cycles for θ = 5° are also presented in Table 6. Some important conclusions are summarized as follows:
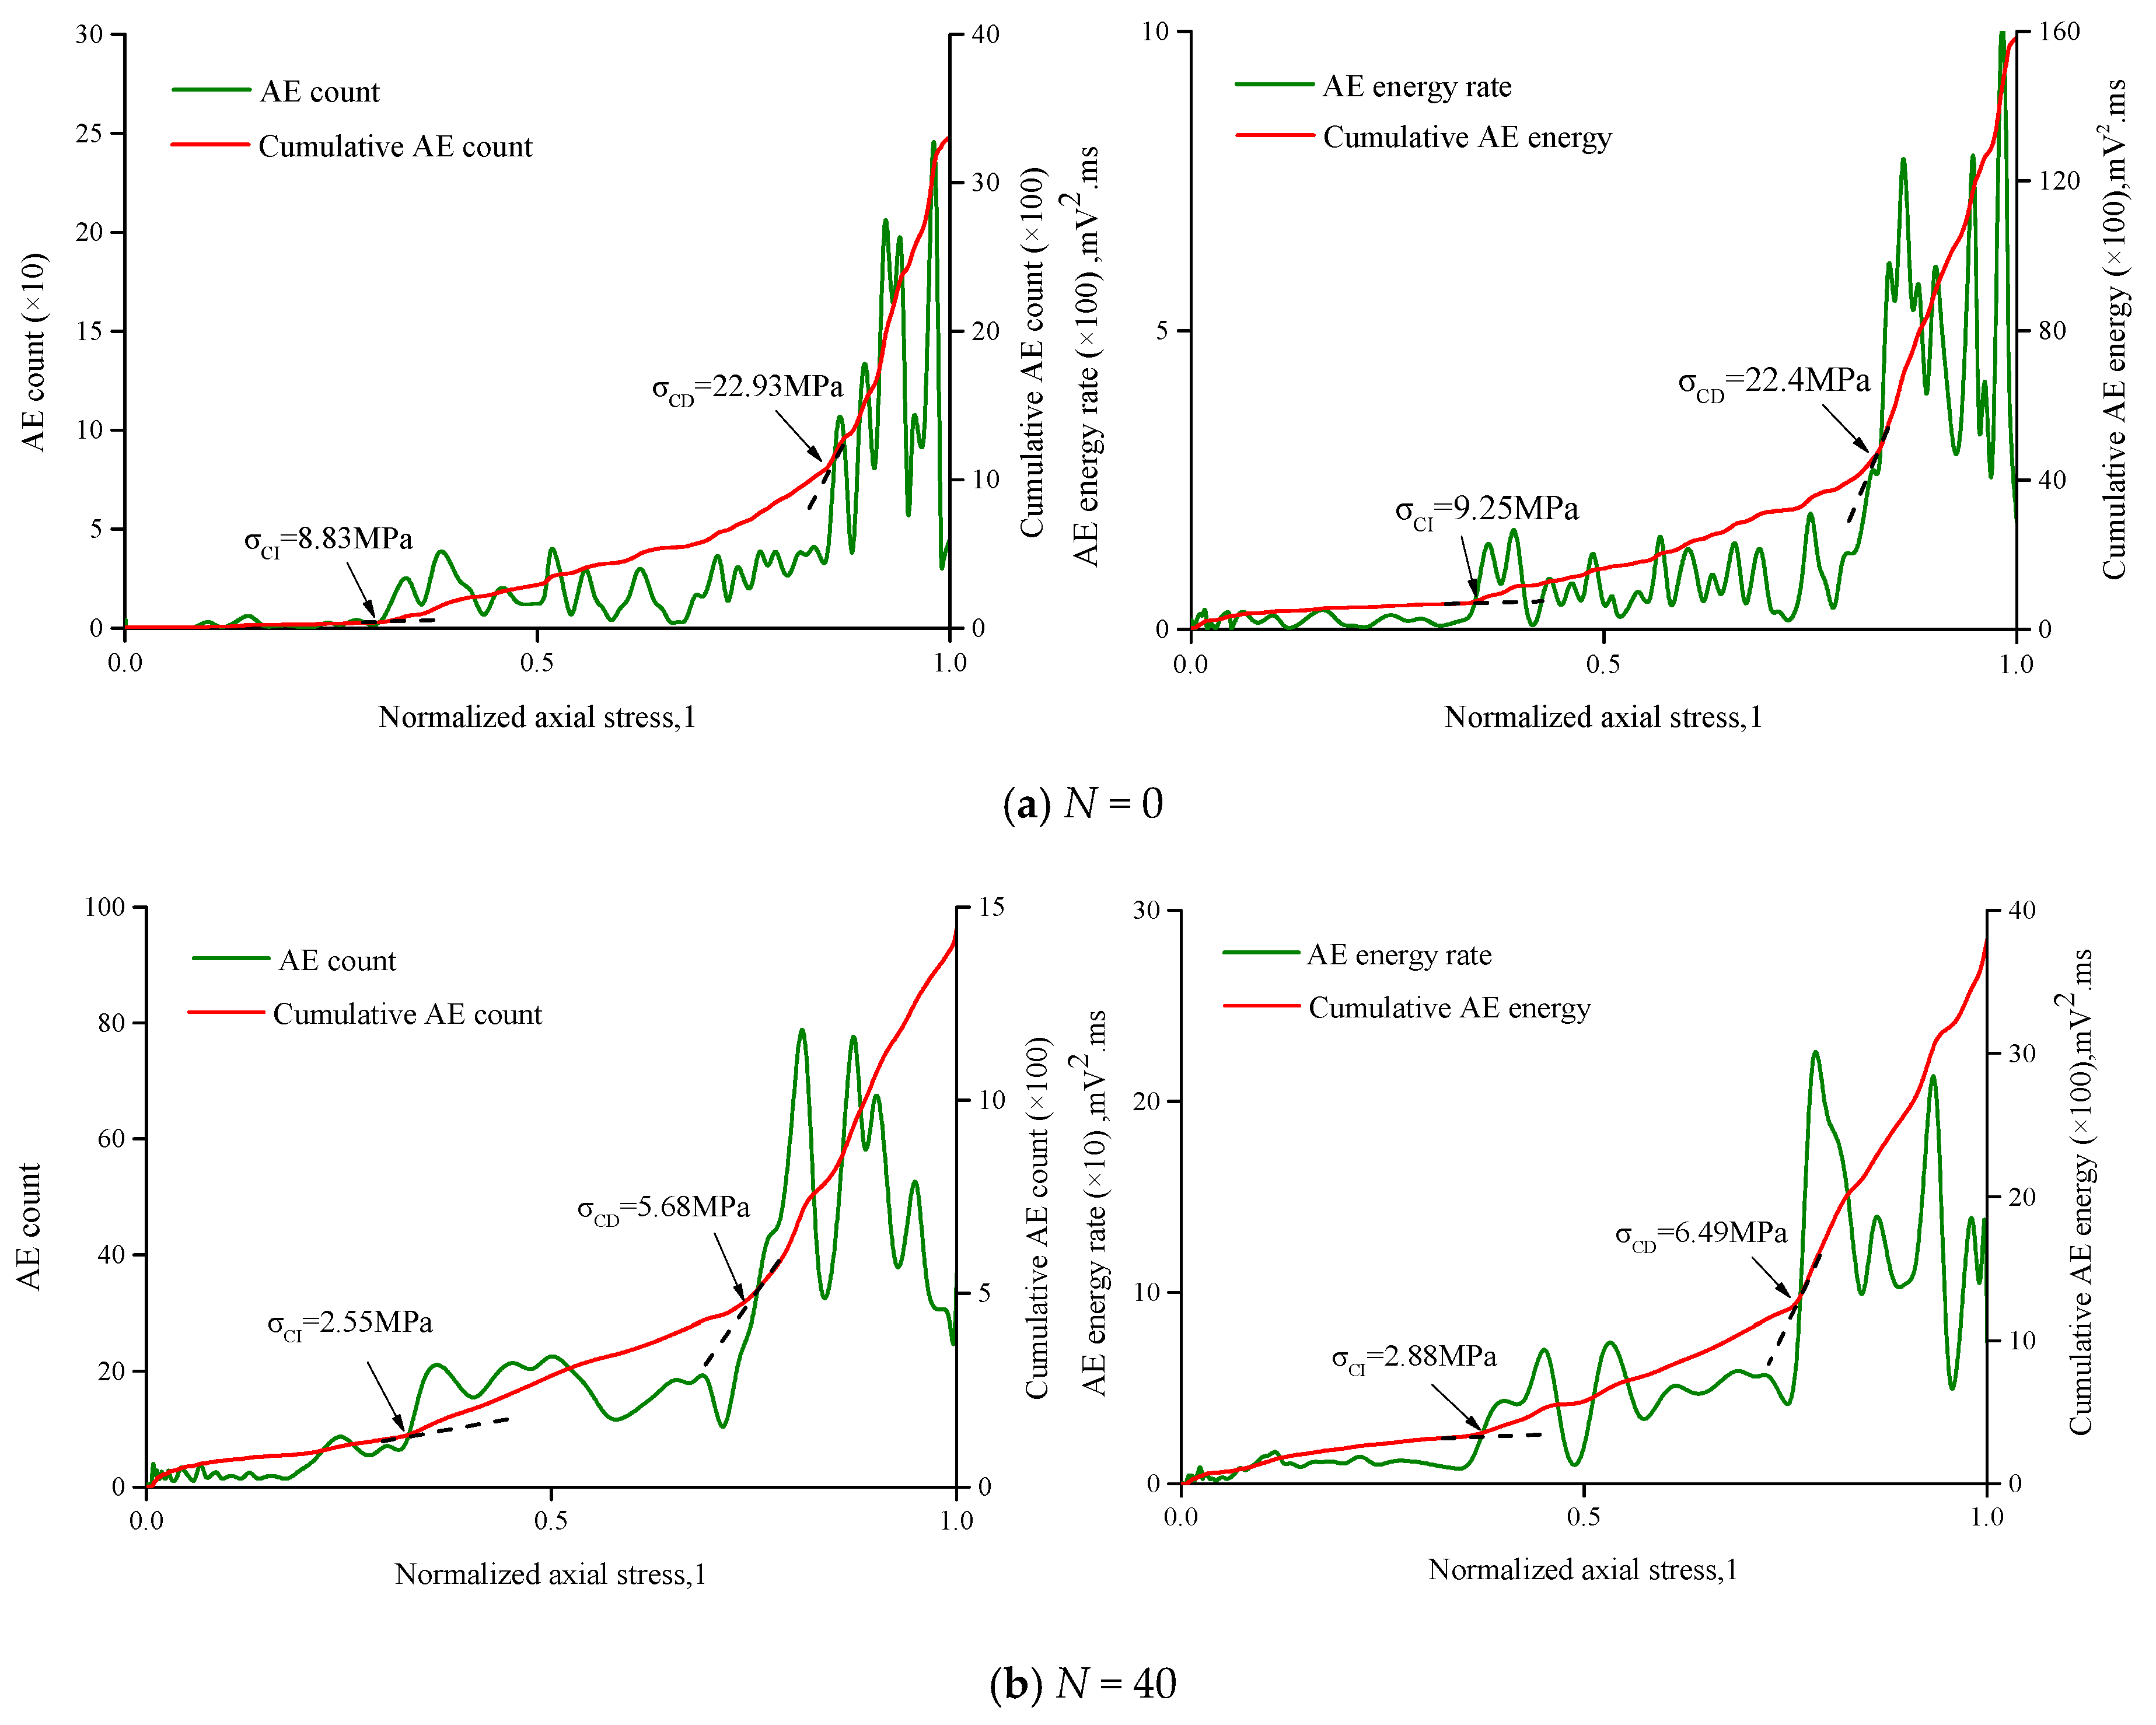
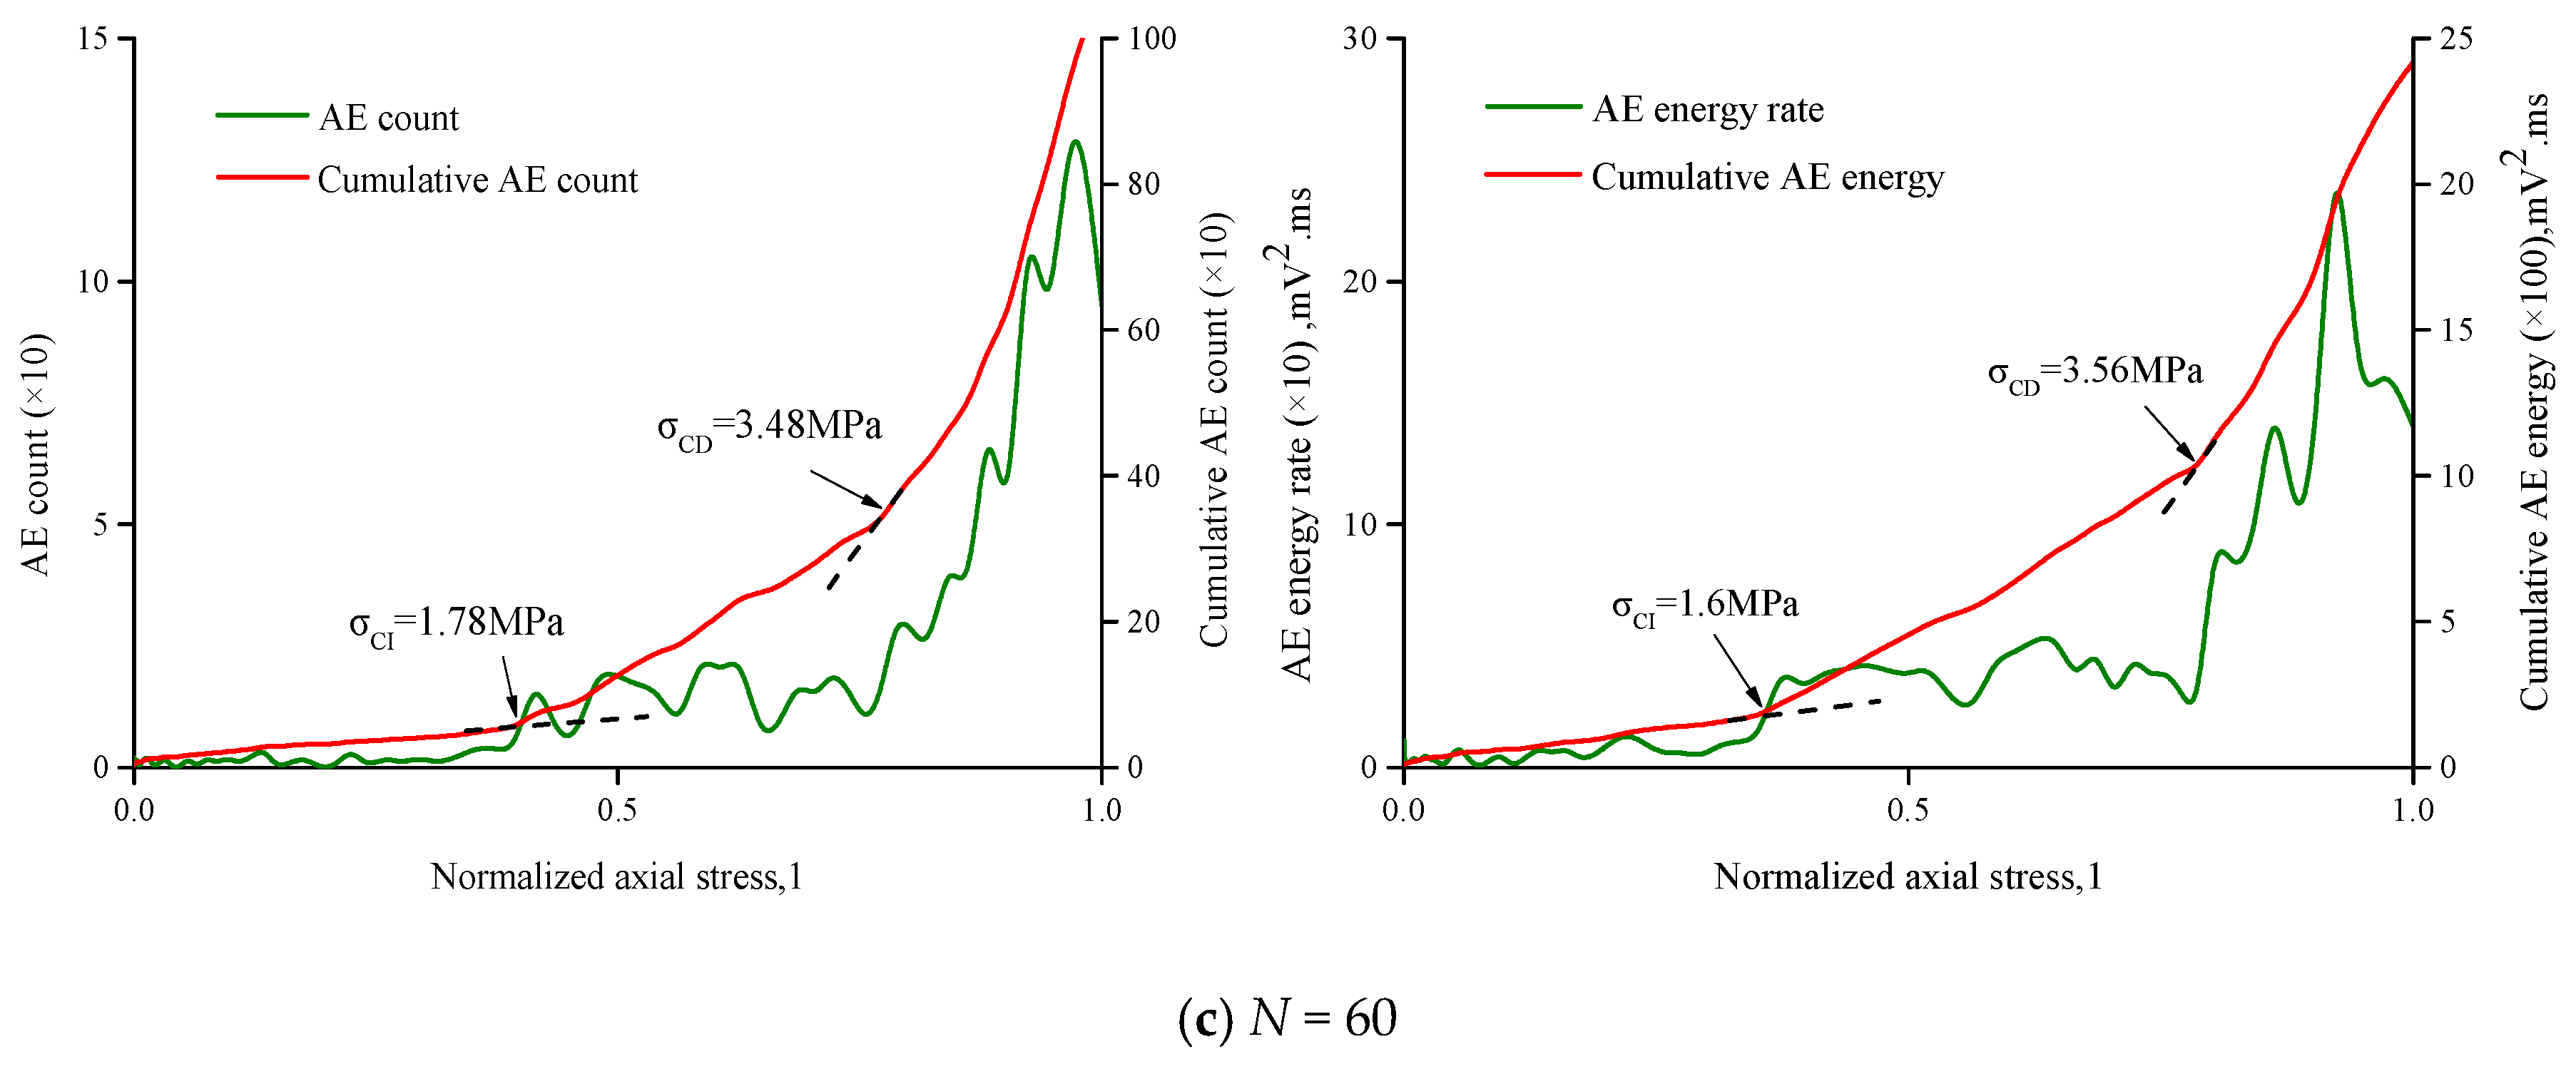
  • According to Figure 19, it is found that the trend of the AE signal is consistent with that of the AE signal presented in Figure 18, and roughly experiences three stages: AE quiet period, AE low amplitude period, and AE high amplitude period, showing that the evolution rule of the AE signal is not dependent on the freeze-thaw cycles effect.
  • As the number of freeze-thaw cycles increases, the values of σ C I and σ C D gradually decrease. Notably, when the number of freeze-thaw cycles reaches 40, the reduction amplitude of σ C I and σ C D is more pronounced (see Figure 20). For instance, when N reaches 20 and 40, the values of σ C I and σ C D respectively decrease from 28.59% to 69.91% and from 33.35% to 73.97%, compared with those under N = 0. This indicates that the internal structures of the specimen under N = 40 have changed significantly and that the damage degree of the specimen obviously increases. The SEM images in Figure 6 also reflect this phenomenon with an occurrence of large-size frost crack (10 μm). Furthermore, as the number of freeze-thaw cycles increases, the cumulative AE counts, AE energy, and shear stresses corresponding to the CI and CD thresholds also gradually decrease. When N increases to 60, the cumulative AE counts and AE energy respectively decrease by 67.74% and 84.70%, compared to those under N = 0. Meanwhile, the shear stresses corresponding to the CI and CD thresholds also decrease by 81.01% and 84.34%, respectively. The above analysis indicates that the freeze-thaw effect has a significant importance in relation to the crack initiation and propagation of specimens. The higher the damage degree of the specimen, the lower the crack initiation and damage stresses.
  • Regardless of the number of freeze-thaw cycles, the ratios of σ C I / σ θ p e a k and σ C D / σ θ p e a k are always in the range of 33.64%–37.47% and 73.78%–92.39%, which is consistent with those under various inclination angles. This indicates that the ratio of the CI and CD thresholds to their peak compression stress may be intrinsic to the rock material and have nothing to do with the external environment.

7. Discussion

Many studies have indicated that the peak compression strength is not an inherent property of rock material, which is dependent on the external environment and loading form [3,4]. The failure process of rock material can be influenced by the distribution form of microcrack and friction resistance among particles within the specimen. Meanwhile, the additional shear stress is beneficial to the microcrack initiation and propagation, which cause the internal microcrack to crack at a lower load level [6,7,29]. This means that the microcracks within the specimen will interconnect at a lower vertical load and then form macroscopic cracks, resulting in the failure of the specimen. This is why the peak compression strength gradually decreases as the inclination angle increases. In addition, Bieniawski [29] pointed out that the microcrack propagation direction within the specimen was approximately parallel to the direction of the maximum principal stress. Under traditional uniaxial compression, the direction of the maximum principal stress is parallel to the axial direction of the specimen. Hence, the splitting failure will occur. As the inclination angle increases, the direction of the maximum principal stress deviates from the axial direction of the specimen, resulting in an increase in the shear failure trend. This is basically consistent with the results of this paper.
The freeze-thaw effect is one of the important factors influencing the mechanical properties of rock materials. The analysis of the AE activities of the specimen can effectively reveal the influence of freeze-thaw cycles on the micro-fracture behavior. During the freeze-thaw cycle, as thermal expansion coefficients of the mineral particles are different, uneven shrinkage occurs during the water-ice phase change. Meanwhile, the frost heaving force generated by pore water also increases the pore volume and weakens the connection between the mineral particles. As the number of freeze-thaw cycles increases, the internal pore volume of the specimen continues to increase, which results in serious damage to the internal structure of the specimen. Hence, the strength parameters (i.e., peak compression strength and elastic modulus, etc.) of the rock gradually decreases [21]. Furthermore, the microcrack initiation and propagation within the specimen are closely related to the adhesion and friction among particles. The higher the number of freeze-thaw cycles, the higher the damage degree of specimens, and the worse the cementation among particles. Hence, the CI and CD thresholds will be reached at a lower stress level for a high-damage specimen. This means that the CI and CD thresholds gradually decrease with the increasing number of freeze-thaw cycles.

8. Conclusions

A novel C-CAST system is employed to investigate the influence of freeze-thaw cycles on the physical-mechanical properties and micro-damage behaviors of saturated yellow sandstone under combined compression and shear loading. The microstructure of saturated sandstone after freeze-thaw treatment is revealed by SEM. The influence of the inclination angles and freeze-thaw cycles on the microcrack initiation and damage stress of the specimen are analyzed and discussed via AE techniques. Finally, an innovative multivariate regression equation is established to accurately predict the peak compression strength and elastic modulus of the sandstone. The main conclusions are drawn as follows:
  • As the number of freeze-thaw cycles increases, the P-wave velocity decreases obviously, while the quality and porosity of the rock mass increase in a roughly linear manner. The peak compression strength and elastic modulus of the specimen gradually decrease with the increasing inclination angle and the number of freeze-thaw cycles, while the peak shear stress increases nonlinearly with the increasing inclination angle and decreases gradually with the increasing number of freeze-thaw cycles. This indicates that the shear stress component can effectively accelerate crack propagation and reduce the peak strength and deformation resistance of the specimen.
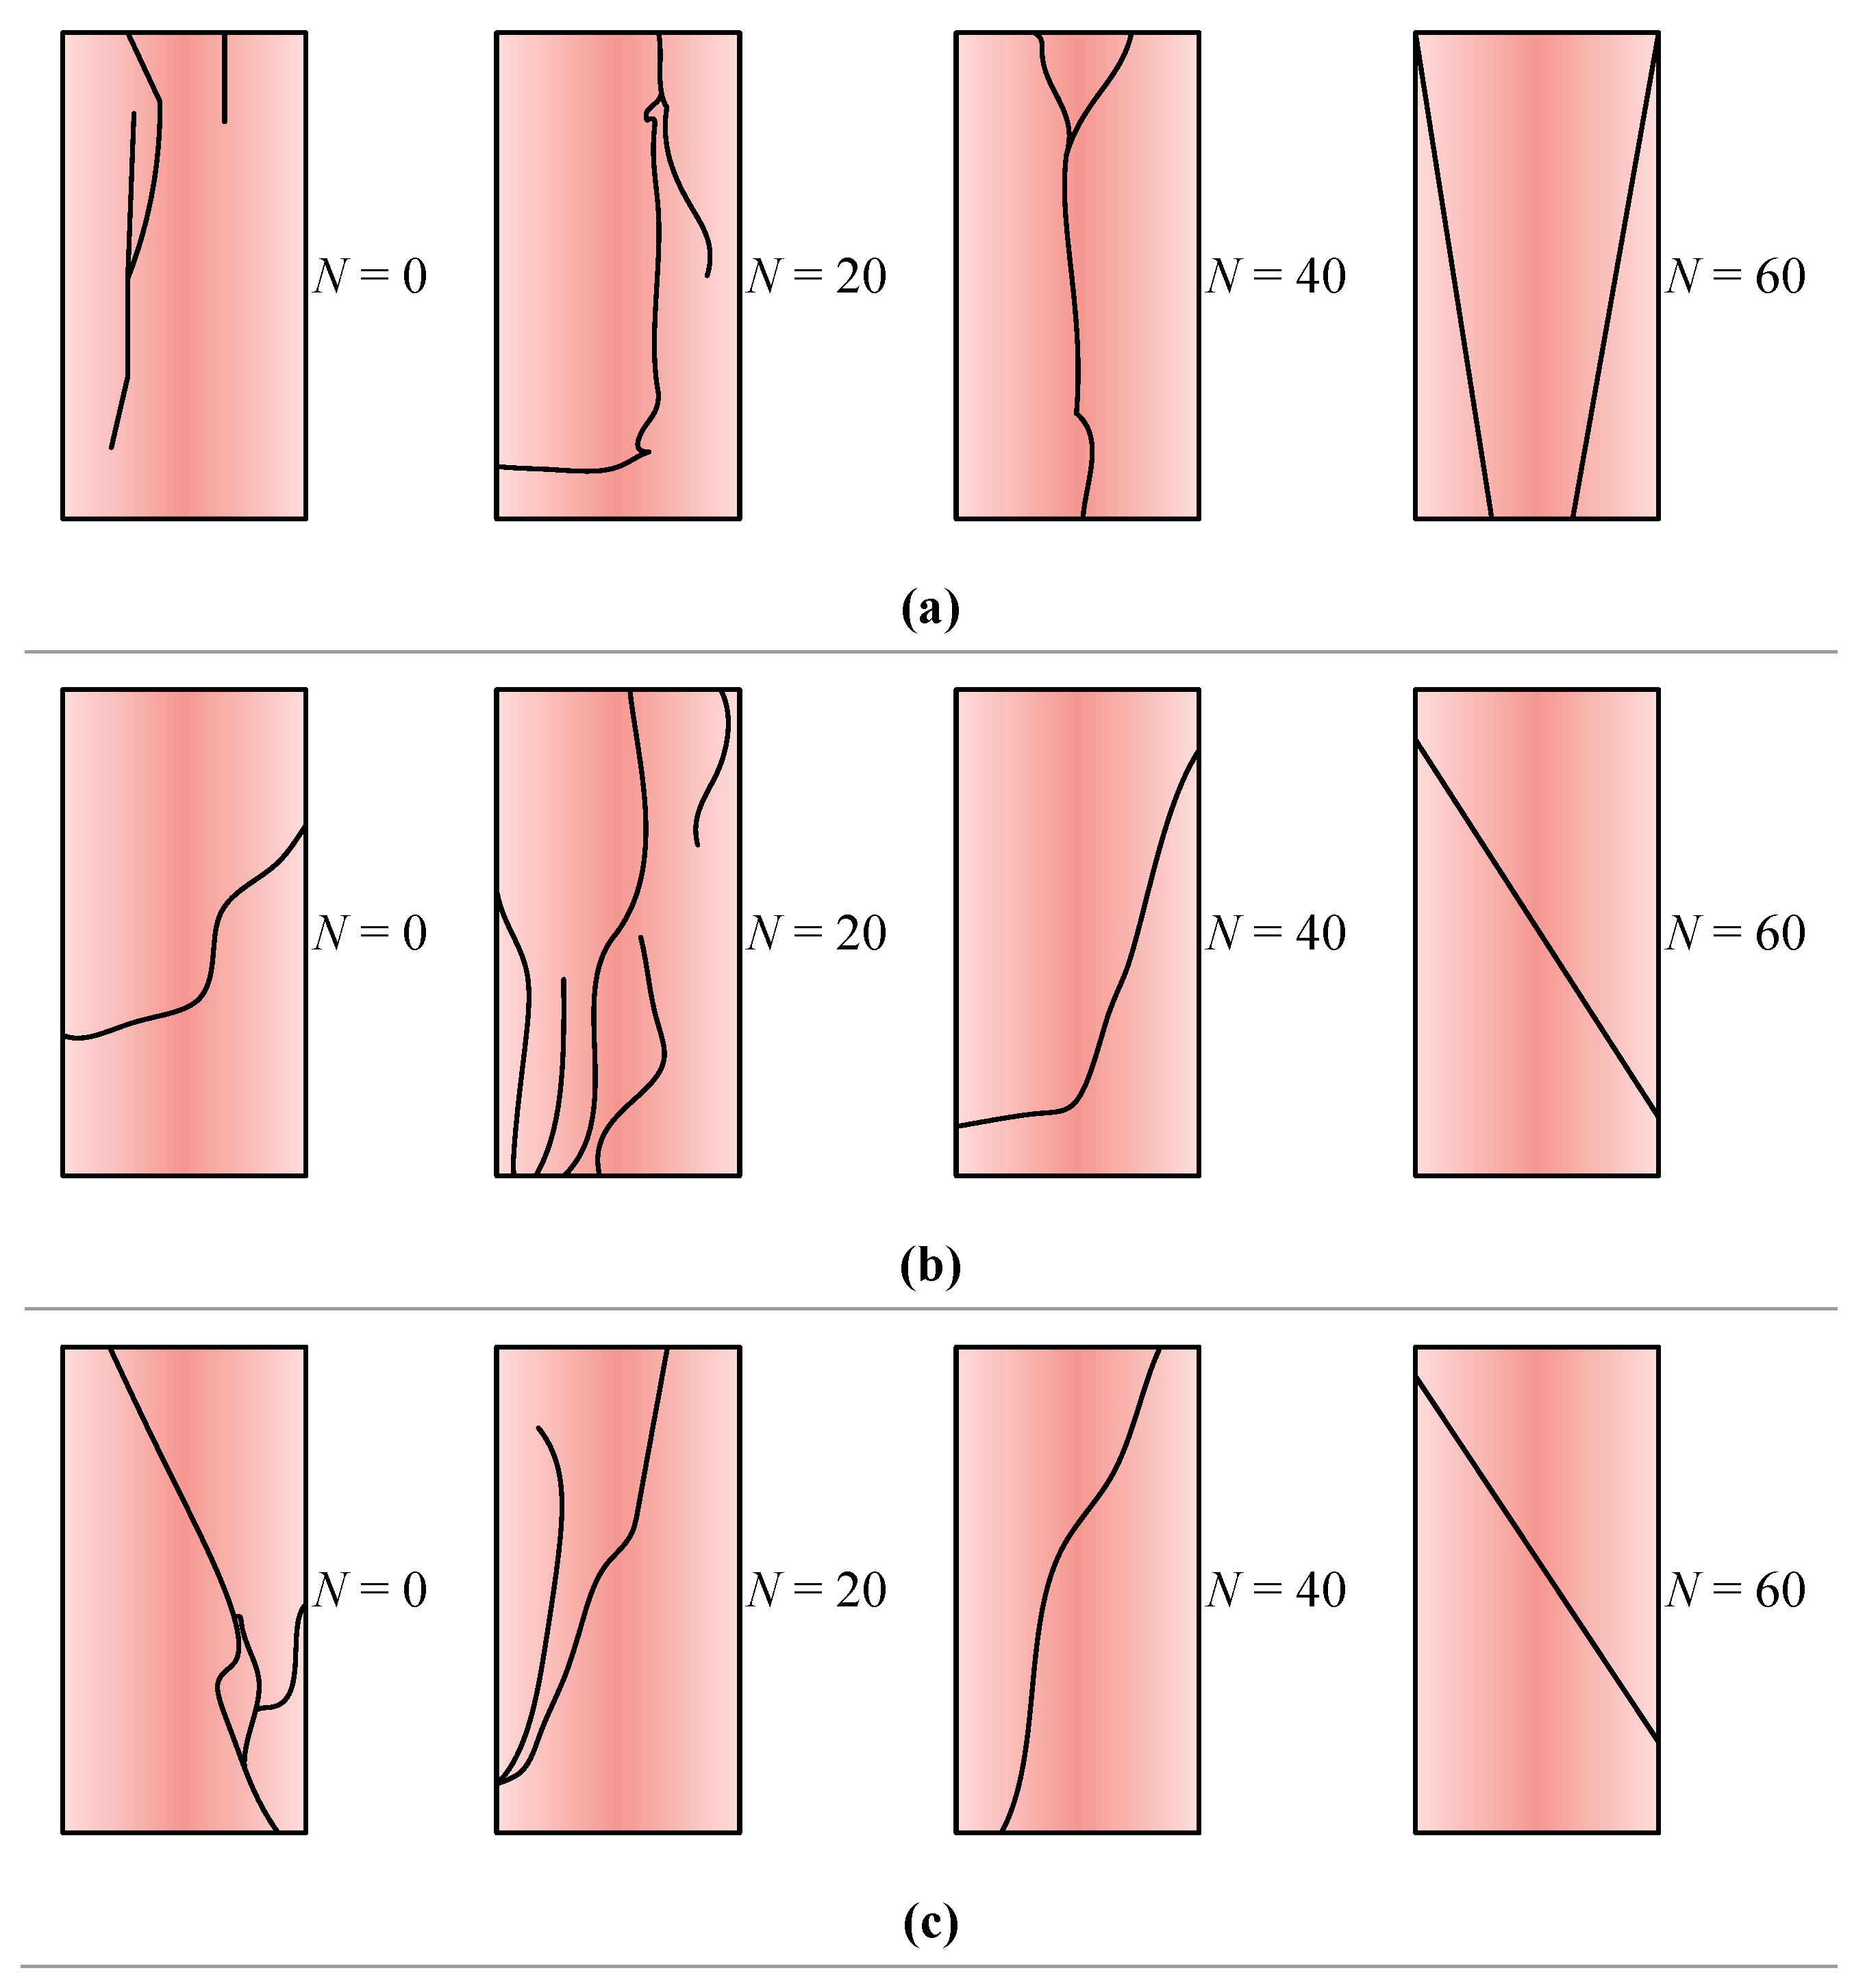
  • The failure mode of saturated yellow sandstone is highly dependent on the inclination angle. With an increasing inclination angle, the failure mode of the specimen changes from tensile failure (θ = 0°) and combined tensile-shear failure (θ = 5°) to signal shear failure (θ = 10° and θ = 15°). Furthermore, the freeze-thaw cycles only have an obvious influence on the failure mode of the specimen at a 5° inclination, at which point the failure mode shows a trend from tensile failure (N = 0, 20) to shear failure (N = 40, 60).
  • Both the inclination angle and freeze-thaw cycles have an extremely important effect on the AE activities of saturated yellow sandstone. As the inclination angle increases, the values of the CI, CD thresholds and cumulative AE properties (i.e., AE counts and AE energy) gradually decrease, while the shear stresses corresponding to the CI and CD thresholds gradually increase, indicating that the shear stress component is beneficial to the microcrack initiation and propagation. As the number of freeze-thaw cycles increases, the values of the CI, CD thresholds, cumulative AE properties, and shear stresses corresponding to the CI and CD thresholds decrease. Particularly, the CI and CD thresholds at 60 cycles are only 81.31% and 84.47% of those at 0 cycles, indicating a serious freeze-thaw damage phenomenon which is consistent with the results of the SEM, with the appearance of some large-size damage cracks.
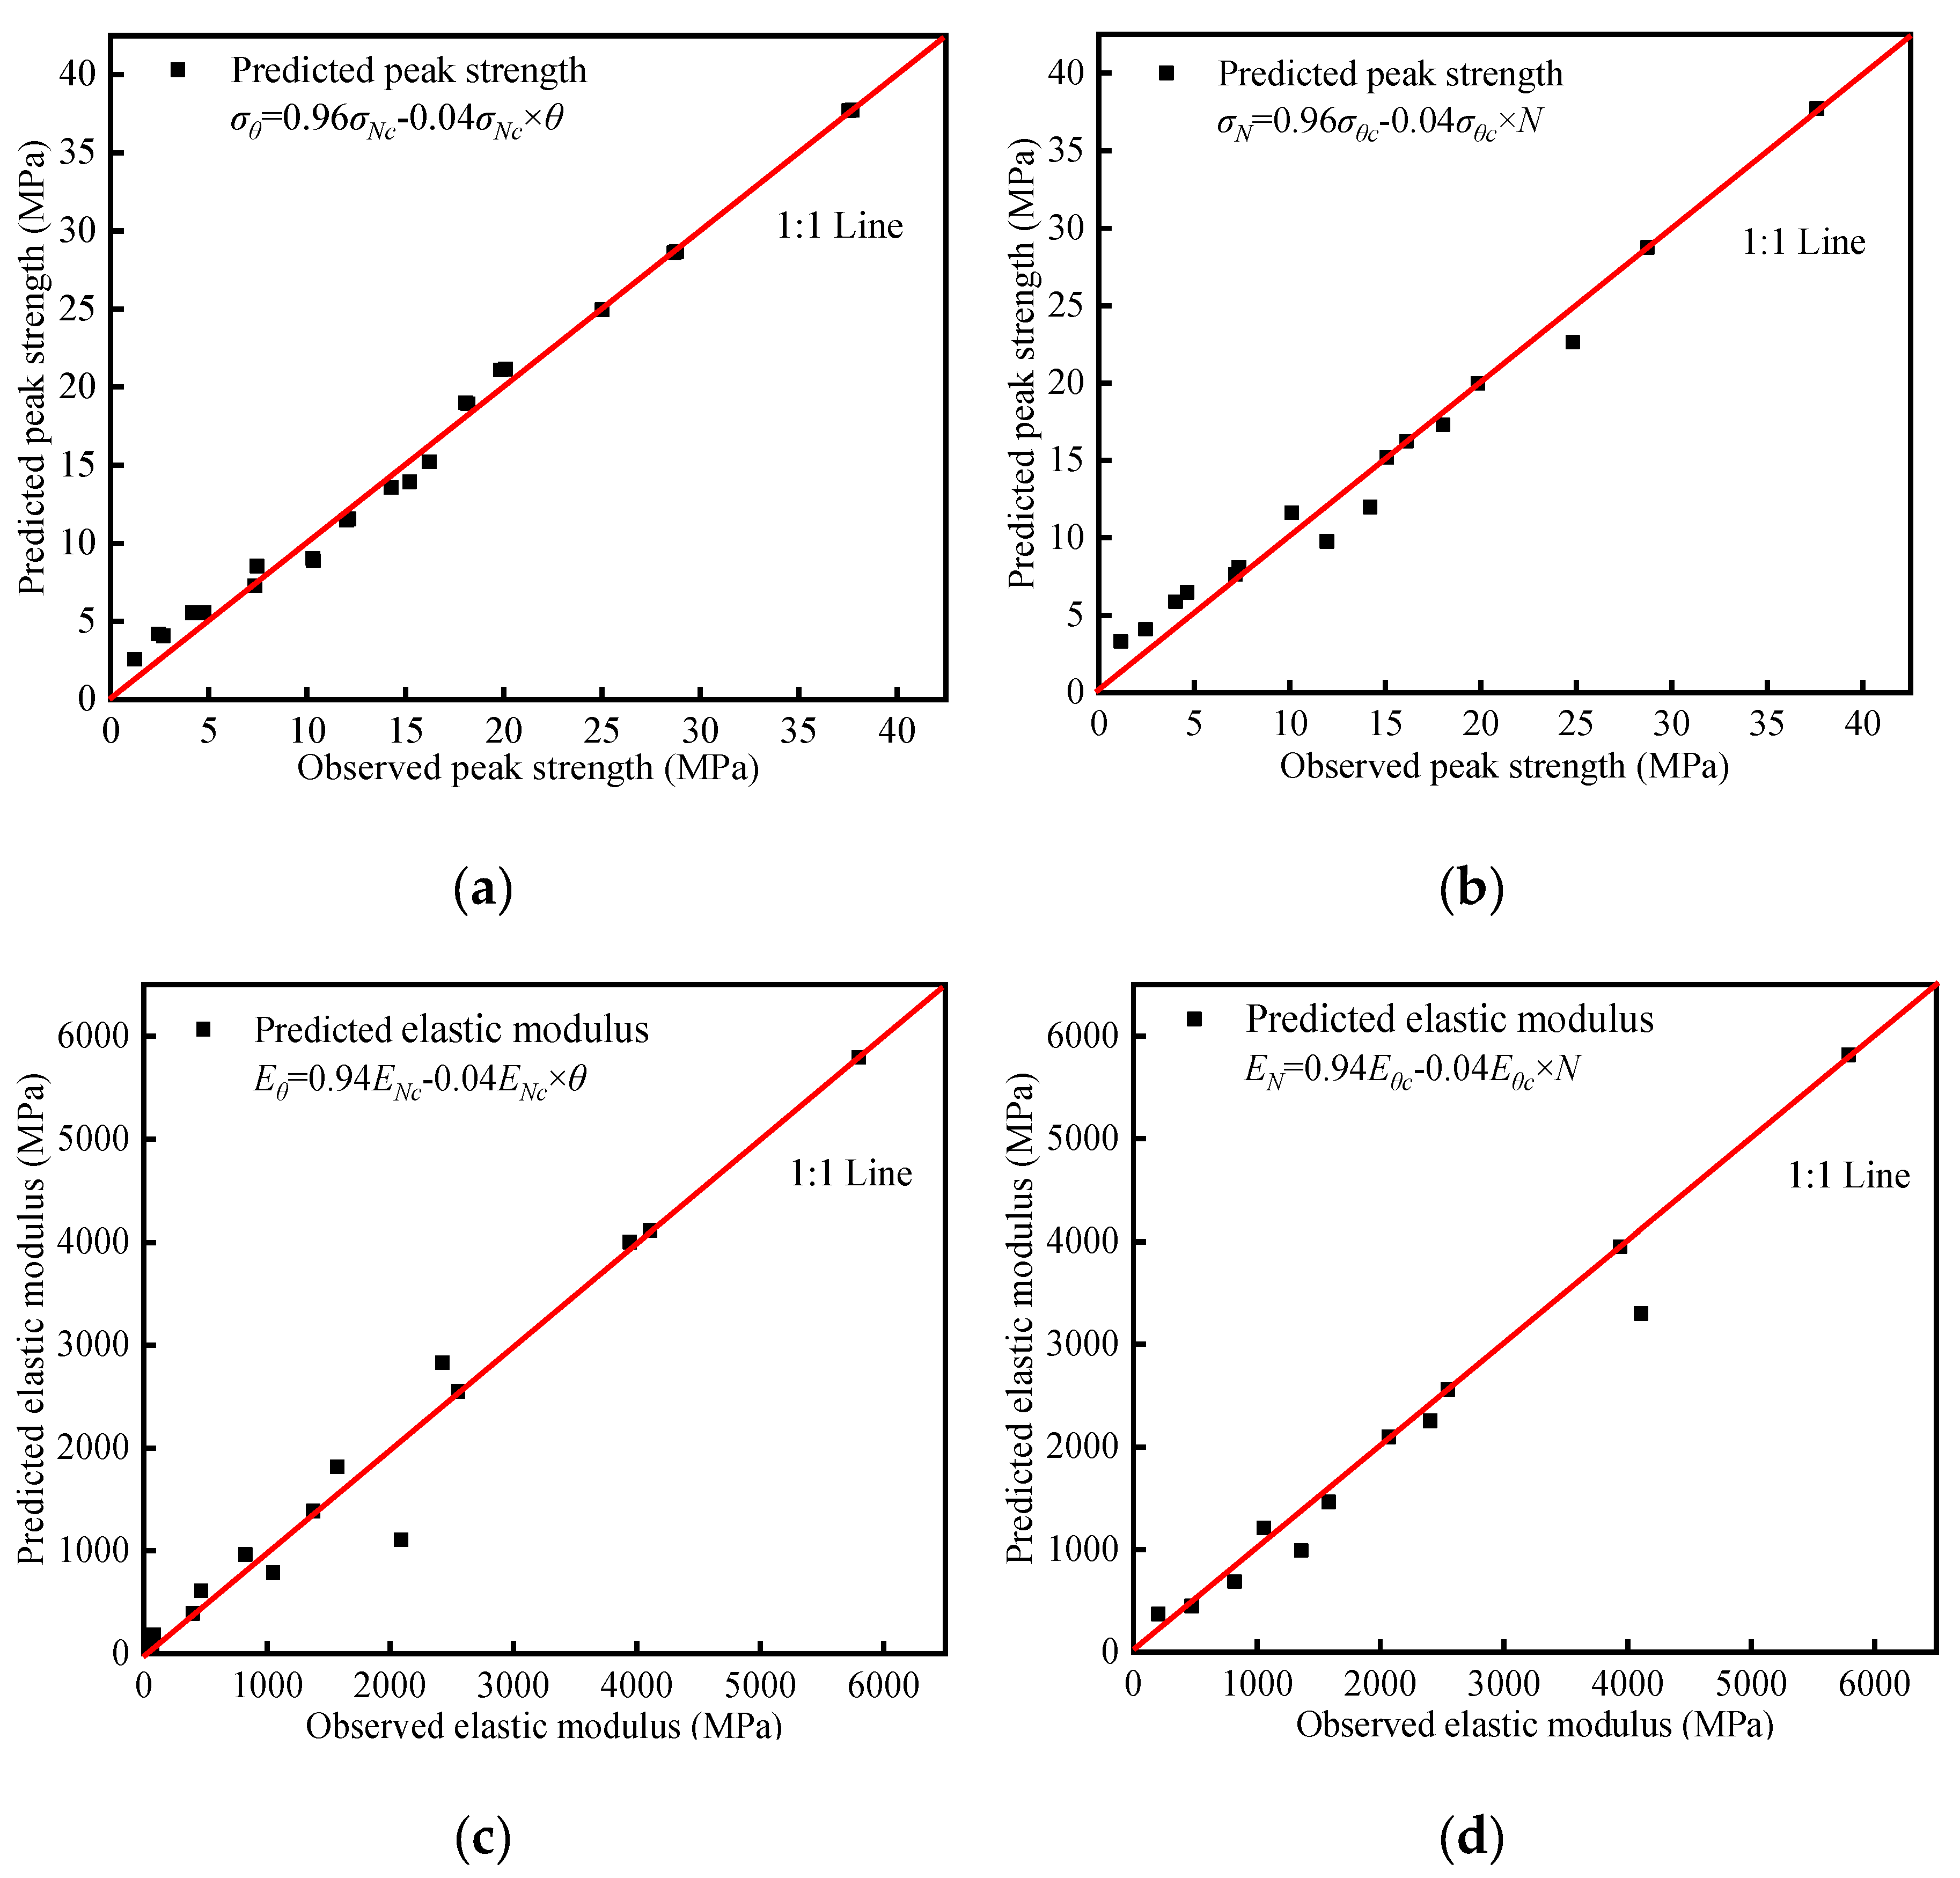
  • Premised on the initial peak compression strength and elastic modulus (θ = 0°, N = 0), the method of multivariate regression analysis is used to predict the peak compression strength and elastic modulus of the specimen under various inclination angles and the numbers of freeze-thaw cycles. Then, the prediction results are compared with the test results, verifying the accuracy of the method. This research can offer a significant reference basis for the strength design and stability evaluation of tunnel or highwall coal pillars subjected to the effect of a complex loading environment in cold regions.

Author Contributions

Methodology, Y.C. and P.W.; data curation and funding acquisition, L.C.; writing—original draft preparation, W.Z. All authors have read and agreed to the published version of the manuscript.

Funding

This research was funded by outstanding Innovation Scholarship for Doctoral Candidate of “Double First Class” Construction Disciplines of CUMT.

Conflicts of Interest

The authors declare no conflict of interest.

References

  1. Khanlari, G.; Reza, Z.S.; Yasin, A. The effect of freeze–thaw cycles on physical and mechanical properties of Upper Red Formation sandstones, central part of Iran. Arab. J. Geosci. 2015, 8, 5991–6001. [Google Scholar] [CrossRef]
  2. Thomachot, C.; Jeannette, D. Evolution of the petrophysical properties of two types of Alsatian sandstone subjected to simulated freeze-thaw conditions. Geol. Soc. Spec. Publ. 2005, 1, 19–32. [Google Scholar] [CrossRef]
  3. Chen, L.; Mao, X.; Yang, S.; An, C.; Wu, P. Experimental Investigation on Dynamic Fracture Mechanism and Energy Evolution of Saturated Yellow Sandstone under Different Freeze-Thaw Temperatures. Adv. Civ. Eng. 2019, 2019, 2375246. [Google Scholar] [CrossRef] [Green Version]
  4. Han, T.; Shi, J.; Cao, X. Fracturing and damage to sandstone under coupling effects of chemical corrosion and freeze–thaw cycles. Rock Mech. Rock Eng. 2016, 49, 4245–4255. [Google Scholar] [CrossRef]
  5. Xu, Y.; Dai, F. Dynamic response and failure mechanism of brittle rocks under combined compression-shear loading experiments. Rock Mech. Rock Eng. 2018, 51, 747–764. [Google Scholar] [CrossRef]
  6. Sun, X.; Liu, W.N.; Chen, W.N.; Templeton, D. Modeling and characterization of dynamic failure of borosilicate glass under compression/shear loading. Int. J. Impact Eng. 2009, 36, 226–234. [Google Scholar] [CrossRef]
  7. He, Q.Y.; Li, Y.C.; She, S. Mechanical properties of basalt specimens under combined compression and shear loading at low strain rates. Rock Mech. Rock Eng. 2019, 52, 4101–4112. [Google Scholar] [CrossRef]
  8. Zhang, H.M.; Yang, G.S. Experimental study of damage deterioration and mechanical properties for freezing-thawing rock. J. China Coal Soc. 2013, 38, 1756–1762. [Google Scholar]
  9. Sass, O. Rock moisture fluctuations during freeze-thaw cycles: Preliminary results from electrical resistivity measurements. Polar Geogr. 2004, 28, 13–31. [Google Scholar] [CrossRef]
  10. Fu, H.L.; Zhang, J.B.; Huang, Z.; Huang, H.W.; Shi, Y. Experimental study on elastic parameters and uniaxial compressive strength of slate under freeze-thaw cycles. Rock Soil Mech. 2017, 38, 2203–2212. [Google Scholar]
  11. Yang, X.R.; Jiang, A.N.; Li, M.X. Experimental investigation of the time-dependent behavior of quartz sandstone and quartzite under the combined effects of chemical erosion and freeze-thaw cycles. Cold Reg. Sci. Technol. 2019, 161, 51–62. [Google Scholar] [CrossRef]
  12. Wang, P.; Xu, J.Y.; Fang, X.Y.; Wang, P.X.; Zheng, G.H.; Wen, M. Ultrasonic time-frequency method to evaluate the deterioration properties of rock suffered from freeze-thaw weathering. Cold Reg. Sci. Technol. 2017, 143, 13–22. [Google Scholar] [CrossRef]
  13. Liu, J.K.; Chang, D.; Yu, Q.M. Influence of freeze-thaw cycles on mechanical properties of a silty sand. Eng. Geol. 2016, 210, 23–32. [Google Scholar] [CrossRef]
  14. Wang, H.W.; Poulsen, B.A.; Shen, B.T.; Xue, S.; Jiang, Y.D. The influence of roadway backfill on the coal pillar strength by numerical investigation. Int. J. Rock Mech. Min. Sci. 2011, 48, 443–450. [Google Scholar] [CrossRef]
  15. Mortazavi, A.; Hassani, F.P.; Shabani, M. A numerical investigation of rock pillar failure mechanism in underground openings. Comput. Geotech. 2009, 36, 691–697. [Google Scholar] [CrossRef]
  16. Ulusay, R. (Ed.) The ISRM Suggested Methods for Rock Characterization, Testing and Monitoring: 2007–2014; Springer International Publishing: New York, NY, USA, 2015; p. 293. [Google Scholar]
  17. Kahraman, S. Evaluation of simple methods for assessing the uniaxial compressive strength of rock. Int. J. Rock Mech. Min. 2001, 38, 981–994. [Google Scholar] [CrossRef]
  18. Zhu, Z.D.; Memetyusup, S.; Fang, R.J. Unloading strength characteristics and damage characteristics of sandstone under freeze-thaw cycles. J. Yangtze River Sci. Res. Inst. 2018, 35, 1–5+12. [Google Scholar]
  19. Li, J.L.; Zhou, K.P.; Liu, W.J.; Deng, H.W. NMR research on deterioration characteristics of microscopic structure of sandstones in freeze-thaw cycles. T. Nonferr. Metal. Soc. 2016, 26, 2997–3003. [Google Scholar] [CrossRef]
  20. Zhou, K.P.; Li, B.; Li, J.L.; Deng, H.W.; Bin, F. Microscopic damage and dynamic mechanical properties of rock under freeze-thaw environment. T. Nonferr. Metal. Soc. 2015, 25, 1254–1261. [Google Scholar] [CrossRef]
  21. Fang, X.Y.; Xu, J.Y.; Wang, P.X. Compressive failure characteristics of yellow sandstone subjected to the coupling effects of chemical corrosion and repeated freezing and thawing. Eng. Geol. 2018, 233, 160–171. [Google Scholar] [CrossRef]
  22. Fang, W.; Jiang, N.; Luo, X.D. Establishment of damage statistical constitutive model of loaded rock and method for determining its parameters under freeze-thaw condition. Cold Reg. Sci. Technol. 2019, 160, 31–38. [Google Scholar] [CrossRef]
  23. Qu, D.X.; Li, D.K.; Li, X.P.; Luo, Y.; Xu, K. Damage evolution mechanism and constitutive model of freeze- thaw yellow sandstone in acidic environment. Cold Reg. Sci. Technol. 2018, 155, 174–183. [Google Scholar] [CrossRef]
  24. Wen, L.; Li, X.B.; Su, W. Study of physico-mechanical characteristics of slope hard rocks of metal mine influenced by freeze-thaw cycles. J. Min. Saf. Eng. 2015, 32, 689–696. [Google Scholar]
  25. Wang, X.; Wen, Z.; Jiang, Y.; Huang, H. Experimental study on mechanical and acoustic emission characteristics of rock-like material under non-uniformly distributed loads. Rock Mech. Rock Eng. 2018, 51, 729–745. [Google Scholar] [CrossRef]
  26. Eberhardt, E.; Stead, D.; Stimpson, B. Quantifying progressive pre-peak brittle fracture damage in rock during uniaxial compression. Int. J. Rock Mech. Min. 1999, 36, 361–380. [Google Scholar] [CrossRef]
  27. Kim, J.S.; Lee, K.S.; Cho, W.J.; Choi, H.J.; Cho, G.C. A comparative evaluation of stress–strain and acoustic emission methods for quantitative damage assessments of brittle rock. Rock Mech. Rock Eng. 2015, 48, 495–508. [Google Scholar] [CrossRef]
  28. Zhao, X.G.; Cai, M.; Wang, J.; Li, P.F.; Ma, L.K. Objective determination of crack initiation stress of brittle rocks under compression using AE measurement. Rock Mech. Rock Eng. 2015, 48, 2473–2484. [Google Scholar] [CrossRef]
  29. Bieniawski, Z.T. Mechanism of brittle fracture of rock: Part I-theory of the fracture process. Int. J. Rock Mech. Min. Sci. Geomech. Abstr. 1967, 4, 395–406. [Google Scholar] [CrossRef]
Figure 1. The experimental process and equipment.
Sustainability 12 01029 g001
Figure 2. The temperature profile of sandstone undergoing during a Freeze-Thaw cycle. Stage-1: temperature-fall stage; stage-2: freezing stage; stage-3: temperature rise stage; and stage-4: thawing stage.
Sustainability 12 01029 g002
Figure 3. The C-CAST system structure diagram.
Sustainability 12 01029 g003
Figure 4. The stress and deformation states of the specimen before and after the test.
Sustainability 12 01029 g004
Figure 5. The variation curve of the rock quality, porosity, and P-wave velocity under a different number of freeze-thaw cycles.
Sustainability 12 01029 g005
Figure 6. The microstructural characteristics of yellow sandstone under a different number of freeze-thaw cycles: (a) N = 0; (b) N = 20; (c) N = 40; and (d) N = 60.
Sustainability 12 01029 g006
Figure 7. The stress-strain curve under different freeze-thaw cycles and specimen inclinations: (a) N = 0; (b) N = 20; (c) N = 40; and (d) N = 60.
Sustainability 12 01029 g007
Figure 8. Typical axial stress-strain curve of saturated yellow sandstone.
Sustainability 12 01029 g008
Figure 9. The variation curve of the peak compression strength: (a) the peak compression strength varies with the inclination angle; (b) the peak compression strength varies with the number of freeze-thaw cycles.
Sustainability 12 01029 g009
Figure 10. The variation curve of the elastic modulus of yellow sandstone: (a) the elastic modulus varies with the inclination angle; (b) the elastic modulus varies with the number of freeze-thaw cycles.
Sustainability 12 01029 g010
Figure 11. The shear stress-displacement curve under different numbers of freeze-thaw cycles and specimen inclinations: (a) N = 0; (b) N = 20; (c) N = 40; and (d) N = 60.
Sustainability 12 01029 g011
Figure 12. The variation curve of the peak shear stress of yellow sandstone.
Sustainability 12 01029 g012
Figure 13. Typical failure mode of the specimen: (a) the inclination of the specimen is 0°; (b) the inclination of the specimen is 5°; (c) the inclination of the specimen is 10°; and (d) the inclination of the specimen is 15°.
Sustainability 12 01029 g013aSustainability 12 01029 g013b
Figure 14. The simplified specimen failure mode: (a) the inclination angle is 0°; (b) the inclination angle is 5°; (c) the inclination angle is 10°; and (d) the inclination angle is 15°.
Sustainability 12 01029 g014aSustainability 12 01029 g014b
Figure 15. A comparison between the predicted value and observed value for N = 0 or θ = 0°: (a) a comparison of the predicted and observed peak compression strength at any inclination; (b) a comparison of the predicted and observed peak compression strength under any number of freeze-thaw cycles; (c) a comparison of the predicted and observed elastic modulus at any inclination; and (d) a comparison of the predicted and observed elastic modulus under any number of freeze-thaw cycles.
Sustainability 12 01029 g015
Figure 16. (a) The average value of the peak compression strength under the coupling effect of the inclination angle and the number of freeze-thaw cycles; (b) a comparison of the predicted and observed peak compression strength.
Sustainability 12 01029 g016
Figure 17. A schematic diagram of the crack evolution law during loading. (I) Crack initial stage before the test; (II) crack compression stage; (III) crack stable propagation stage corresponding to CI stress threshold; and (IV) crack instable propagation stage corresponding to CD stress threshold.
Sustainability 12 01029 g017
Figure 18. The relationship curve between the normalized axial stress and AE activities (AE count and AE energy) at various inclination angles: (a) θ = 0°; (b) θ = 5°; (c) θ = 10°; and (d) θ = 15°.
Sustainability 12 01029 g018aSustainability 12 01029 g018b
Figure 19. The relationship curve between the normalized axial stress and AE activities (AE count and AE energy) at various number of freeze-thaw cycles: (a) N = 0; (b) N = 40; and (c) N = 60.
Sustainability 12 01029 g019aSustainability 12 01029 g019b
Figure 20. The relationship curve between the number of freeze-thaw cycles and stress thresholds.
Sustainability 12 01029 g020
Table 1. The basic physical parameters of yellow sandstone (average).
Dry Density (g/cm3)Saturation Density (g/cm3)Percentage of Saturated Water Content (%)Porosity (%)
2.2362.3746.1713.80
Table 2. Experimental results of peak compression strength.
Test ScenarioTest CaseStrength (MPa)Absolute Deviation (MPa)Relative Deviation (%)Mean Value (MPa)Standard Deviation (MPa)Coefficient of Variation (%)
A4Case 1 15.220.955.916.172.4114.9
Case 218.912.7416.9
Case 414.381.7911.0
B2Case 216.950.945.218.041.236.8
Case 318.921.055.8
Case 418.261.015.6
C3Case 27.730.354.87.380.8511.5
Case 48.000.628.3
Case 56.420.9613.1
D3Case 12.680.156.02.530.259.9
Case 22.240.2911.4
Case 32.660.135.0
Table 3. Experimental results of the specimens’ elastic moduli.
Test ScenarioTest CaseElasticity Modulus (MPa)Absolute Deviation (MPa)Relative Deviation (%)Mean Value (MPa)Standard Deviation (MPa)Coefficient of Variation (%)
A2Case 23680.23264.516.73944.74395.3810.0
Case 34399.25454.5111.5
Case 43754.74190.014.8
B2Case 22753.27332.5213.72420.75288.1011.9
Case 32263.20157.556.5
Case 42245.79174.967.2
C1Case 11415.8036.002.61379.80181.7513.2
Case 21540.86161.0611.7
Case 51182.74197.0614.3
D3Case 1104.889.8510.495.0310.1610.7
Case 284.5810.4511.0
Case 395.620.590.6
Table 4. The experimental results of the peak shear stress component.
Test Scenarioθ10°15°
NN = 02.523.514.33
N = 201.582.523.21
N = 400.901.301.52
N = 600.360.450.51
Table 5. The values of σ C I , σ C D and the cumulative AE properties at different inclination angles for N = 20. It should be noted that σ C I and σ C D are the average value, which can be calculated via the stress thresholds determined by the AE counts and AE energy.
θ10°15°
σ C I ( M P a ) / R a t i o   ( % ) 7.60/41.857.03/42.975.64/39.443.96/34.26
σ C D ( M P a ) / R a t i o   ( % ) 16.44/90.5815.11/92.3911.43/79.909.53/82.4
Cumulative AE counts (×100)29.1021.566.494.84
Cumulative AE energy (mV2, ms) (×100)164.29101.2823.4214.68
τ θ   at   σ C I   and   σ C D   points (MPa)0/00.62/1.320.99/2.021.06/2.55
Table 6. The values of σ C I , σ C D and the cumulative AE parameters at various freeze-thaw cycles for θ = 5°.
N04060
σ C I ( M P a ) / R a t i o   ( % ) 9.04/33.642.72/33.981.69/37.47
σ C D ( M P a ) / R a t i o   ( % ) 22.67/84.355.90/73.783.52/78.05
Cumulative AE counts (×100)33.0714.4310.67
Cumulative AE energy (mV2, ms) (×100)158.2237.9524.20
τ θ   at   σ C I   and   σ C D   points (MPa)0.79/1.980.24/0.520.15/0.31

