An Integrated Methodological Analysis for the Highest Best Use of Big Data-Based Real Estate Development


1
Major in Real Estate Studies, Faculty of Regional Development, Kongju National University, Chungnam 32439, Korea
2
Department of Spatial Environment System Engineering, Handong Global University, Pohang 37554, Korea
3
National Housing Organization, Ho Chi Minh City 700000, Vietnam
*
Authors to whom correspondence should be addressed.
Sustainability 2020, 12(3), 1144; https://0-doi-org.brum.beds.ac.uk/10.3390/su12031144
Submission received: 22 December 2019
/
Revised: 30 January 2020
/
Accepted: 31 January 2020
/
Published: 5 February 2020
(This article belongs to the Special Issue Sustainable Real Estate: Management, Assessment and Innovations)
Abstract
:This study investigates the integration of methods for real estate development planning and feasibility studies in the changing business environments of emerging big-data. It examines high-rise mixed-use development projects for the highest best use by combining fuzzy theory; thus, it identifies a big data-based innovative decision-making method for systemizing the various factors expected to influence real estate development. In this context, the study creates new evaluation fields and factors by integrating both conventional and big-data based high-rise mixed-use projects. The weight of each value was calibrated by relative significance and fuzzy measure using the Analytic Hierarchy Process (AHP) method. A measuring technique that applies analysis methodology to the evaluation areas was developed for more objective and clearer evaluation, and its application in the field was proposed. Evaluators can systematically assess the concerned evaluation areas during development project planning by examining the process. The findings also provided implications for the evaluation system’s operation by reflecting the variability of specific conditions of the varying projects in real estate and urban and land use planning.
1. Introduction
With advances in information and communications technology (ICT), the amount of data being disseminated is growing exponentially; as a result, big data technology has become one of the most innovative, garnering much attention among other recent information technologies [1]. Accordingly, firms are interested in introducing big data systems to analyze and use various types of data and create new businesses [2]. In response to this change, real estate developers who oversee the planning of development projects are making efforts to create and implement a data-based decision-making system in their primary areas of real estate development planning and feasibility studies [3]. In particular, high-rise building mixed-use development projects, which are one of the most recognizable types of sustainable real estate development, are the ultimate method of development; they encompass all situations, including policy legislation, business entities’ planning, and the modification of consumer patterns to implement a compact city, one of the future urban strategies [4].
Throughout history, humans have sought to construct increasingly higher buildings. Since urban population has escalated with intensive land use development in cities, high-rise building construction has been a driving force to change skylines of cities and boost real estate development. South Korean high-rise building construction began in the 1980s with the 63 Building and the Convention and Exhibition Center (COEX). Since the 2000s, South Korean cities have witnessed a growing number of high-rise buildings for mixed use development due to the market and technological proficiency boom. In particular, super high-rise tower developments boomed because of various financing projects, until the global financial crisis occurred in 2008. However, such developments resulted in negative perceptions of high-rise buildings, as monotonous tower groups spoil the urban skylines and lead to serious traffic congestion in project areas. Such perceptions of high-rise buildings have mostly been examined through personal interviews of building and neighborhood residents, and from research on high-rise buildings.
This study investigated the integrated methods of conducting feasibility studies for the highest best use of high-rise mixed-use building development in the emerging big-data era. We identified a big data-based innovative evaluation method for systemizing various factors that are expected to influence real estate and urban land use planning projects. Moreover, the study used big data to distinguish those factors preferred by business entities planning to implement high-rise building mixed-use development projects, and by consumers who look at such projects, to determine evaluation items. By doing so, the study aims to suggest a system for evaluating high-rise building mixed-use development projects, and to develop a decision-making method that can evaluate these projects more objectively and clearly by combining fuzzy theory with big data-based customized evaluation. Ultimately, this study aims to increase methodological utility for the feasibility study of high-rise building mixed-use development projects in the future amid rapidly changing business environments. Moreover, the research methods used in this study involve categorizing the influence factors expected in high-rise building mixed-use development projects by unit, conducting analysis with the Analytic Hierarchy Process (AHP) technique to set priorities based on the factors in each hierarchy, and applying fuzzy theory to compensate for relativity [5], thus proposing a more objective and systematic computation method. Figure 1 illustrates the analysis process of this study.
2. Literature Review
2.1. Definition and Elements of Big Data
“Big data” refers to data that are bigger and more diverse than those in the past in terms of quantity, data generation cycle (i.e., produced in real time), and format (including not only numerical but also non-structured data such as texts), which are difficult to collect, store, search, and analyze using traditional methods [6]. The term big data is changing to include tools, platforms, and analytic methods for systematization and refers to the information technology that extracts valuable information by using and analyzing large volumes of data and predicting changes based on generated knowledge [7]. It creates new values that cannot be obtained from conventional approaches. In general, the size of big data differentiates it from other traditional data in terms of its volume, velocity, and variety (see Table 1) [8].
2.2. Characteristics and Forms of Big Data
A characteristic of big data known as Volume, Velocity, Variety (3V) can add value or complexity to the data depending on the researcher (see Table 2) [9]. In other words, big data is composed of, not only a database management system (DBMS), but also real-time data, such as social data. Big data contains a huge amount of information beyond the existing data units, including various types of unstructured data such as photographs and moving pictures, and the speed with which data is generated and flows is accelerating data processing [10]. Additionally, big data is not standardized, a fact that intensifies the complexity of data management and processing and requires the development of new techniques [11]. The fundamental purpose of big data is to identify flows and patterns hidden in vast amounts of data that exist in the technical, social, and economic environments.
One of the biggest differences between big data and general data analysis is that big data utilizes semi-structured or unstructured data in real time. The data generated in the information age can take various forms—such as documents, images, videos, and maps—in either analog or digital format [12]. Big data can be classified into fixed, irregular, and semi-fixed data according to the degree of shaping. The main sources of these informal data are smart devices, social network services, and the Internet of Things (IoT). In particular, informal conversation data centered on communication, which contains personal meaning among users, is increasing exponentially. In Korea, the amount of non-standardized data is more than three times greater than formal data [13]. Additionally, as smart technology and mobile use have continued to spread, social data has become a typical form of unstructured data, which is generated by the voluntary participation of users through the Social Network System and helps users understand the world [14]. These social data can be utilized by governments and corporations as a means of two-way communication to create a moment of empathy with customers in real time. In fact, the social data collected through the Social Network System represents emotional information based on empathy, which is meaningful and highly relevant data [15].
2.3. Development of High-Rise Mixed-Use Buildings
The Council on Tall Buildings and Urban Habitat (CTBUH) defines high-rise buildings not according to their height or number of stories but rather by the direct effects they have on building design, use, and city planning. As the construction environments and impacts of such buildings are considerably different from those of common buildings, high-rise development projects have been highly scrutinized by society and particularly by neighborhood communities in project areas.
There are many different opinions about when and where the first high-rise buildings were built, but they are usually considered to have originated in American cities. Particularly, major cities in the United States have been developed with matrixes of high-rise towers through the real estate development boom, which has significantly influenced the local economies of modern cities. Additionally, the matrix network deeply impacted the social and cultural values for integrating urban infrastructure [16]. In addition, high-rise mixed-use buildings were further constructed using high-performance materials and advanced construction technologies, including elevators. Better building security and safety systems for disaster prevention further supported the development.
High-rise building mixed-use development projects have had positive effects on urban land use and sustainable development. This development highlights the intensity of land use, and thus, leads to sustainable city spaces in a compact city. This is considered to minimize land use by avoiding horizontal urban expansion, and comprehensively underlines vertical urbanism with intensive land use for environmental and economic sustainability. This concept allows more people to walk, with improved pedestrian environments, because high-rise development of an area encourages the inclusion of more open spaces for public use by limiting the building-to-land ratio in downtown districts. Thus, this can expand a sense of openness in cities [17].
According to a literature review, the perceptions of high-rise mixed-use building development were investigated through interviews of building designers and residents, and can be summarized based on the following factors: Height, shape, profit, location, sustainability, evacuation, density, structure for safety, and usability [18]. In addition, the following planning components for increasing publicity can be found in these elements: Site location, green landscape, neighborhood context, secure infrastructure, connectivity to amenities, street environment, and safety from disasters [19]. Several studies have investigated the influences of high-rise building projects in terms of economic, cultural, technological, and building institutional aspects on the society, and argued that investors and developers should significantly regard their projects as both private and public assets in a city [20], because skyscrapers play a crucial role to integrate with the city center of dynamic life and culture [21]. A previous study examined the locations of super high-rise buildings globally and found that Chinese major cities have the largest number of towers, followed by the United States, United Arab Emirates, and South Korea [22]. A study of Manhattan’s high-rise buildings, constructed within the last century, reported increased significance of building code establishment to control costs and benefits in the market conditions, rather than other economic factors such as building height, block number, and housing price [23].
3. Research Methods
For further investigation of the effects of high-rise mixed-use building development, this study collected information from stakeholders such as investors, developers, and end-users of the projects. The data collection procedure focused on a list of influential factors for the project effects that were seriously considered by stakeholders. Thereafter, the qualitative factors were quantitively customized for more practical and feasible evaluation and reasonable decision making.
3.1. Composition of Expected Effects of High-Rise Mixed-Use Development Projects
The evaluation fields and factors in higher categories are necessary for systemical organization to measure the qualitative and quantitative effects of high-rise mixed-use building development projects. Therefore, in this study, the evaluation elements from previous studies in the major categories were reorganized in Table 3.
Table 3 outlines the evaluation system, which consists of four categories (Economy and Industry, Society and Culture, Technology and Environment, and Reputation). First, the Economy and Industry category comprises three evaluation fields: National Economy, Local Economy, Industrial Effects, and Information and Communications Technology, which consists mainly of national and local economies and industrial effects. The Society and Culture category considers socio-cultural effects in two evaluation fields: Society and Cities, and Cultural Ripple Effects. The Technology and Environment category comprises five evaluation fields, concerning the national image and perception of people in connection with the development of high-rise mixed-use projects, in the following fields: Environment, Architectural Institutions and Standards, Costs, Architectural Technological Level and Land Usage, and Reputation.
3.2. Quantification Procedure of Evaluation Fields
As shown in Table 3, each evaluation factor should be reset by the integrated methods for the qualitative and quantitative effects. In particular, establishing evaluation items involves a process that identifies the innovative method of big data analytics. The following analysis flowchart of the feasibility study of evaluation items in high-rise building mixed-use development projects ultimately precedes business decision-making. In this study, the measurement of expected effects from fuzzy theory were systemically arranged [24] based on the following process: (1) Calculating the significance of each evaluation field, (2) compiling the influence results, and (3) prioritizing the evaluation fields and factors.
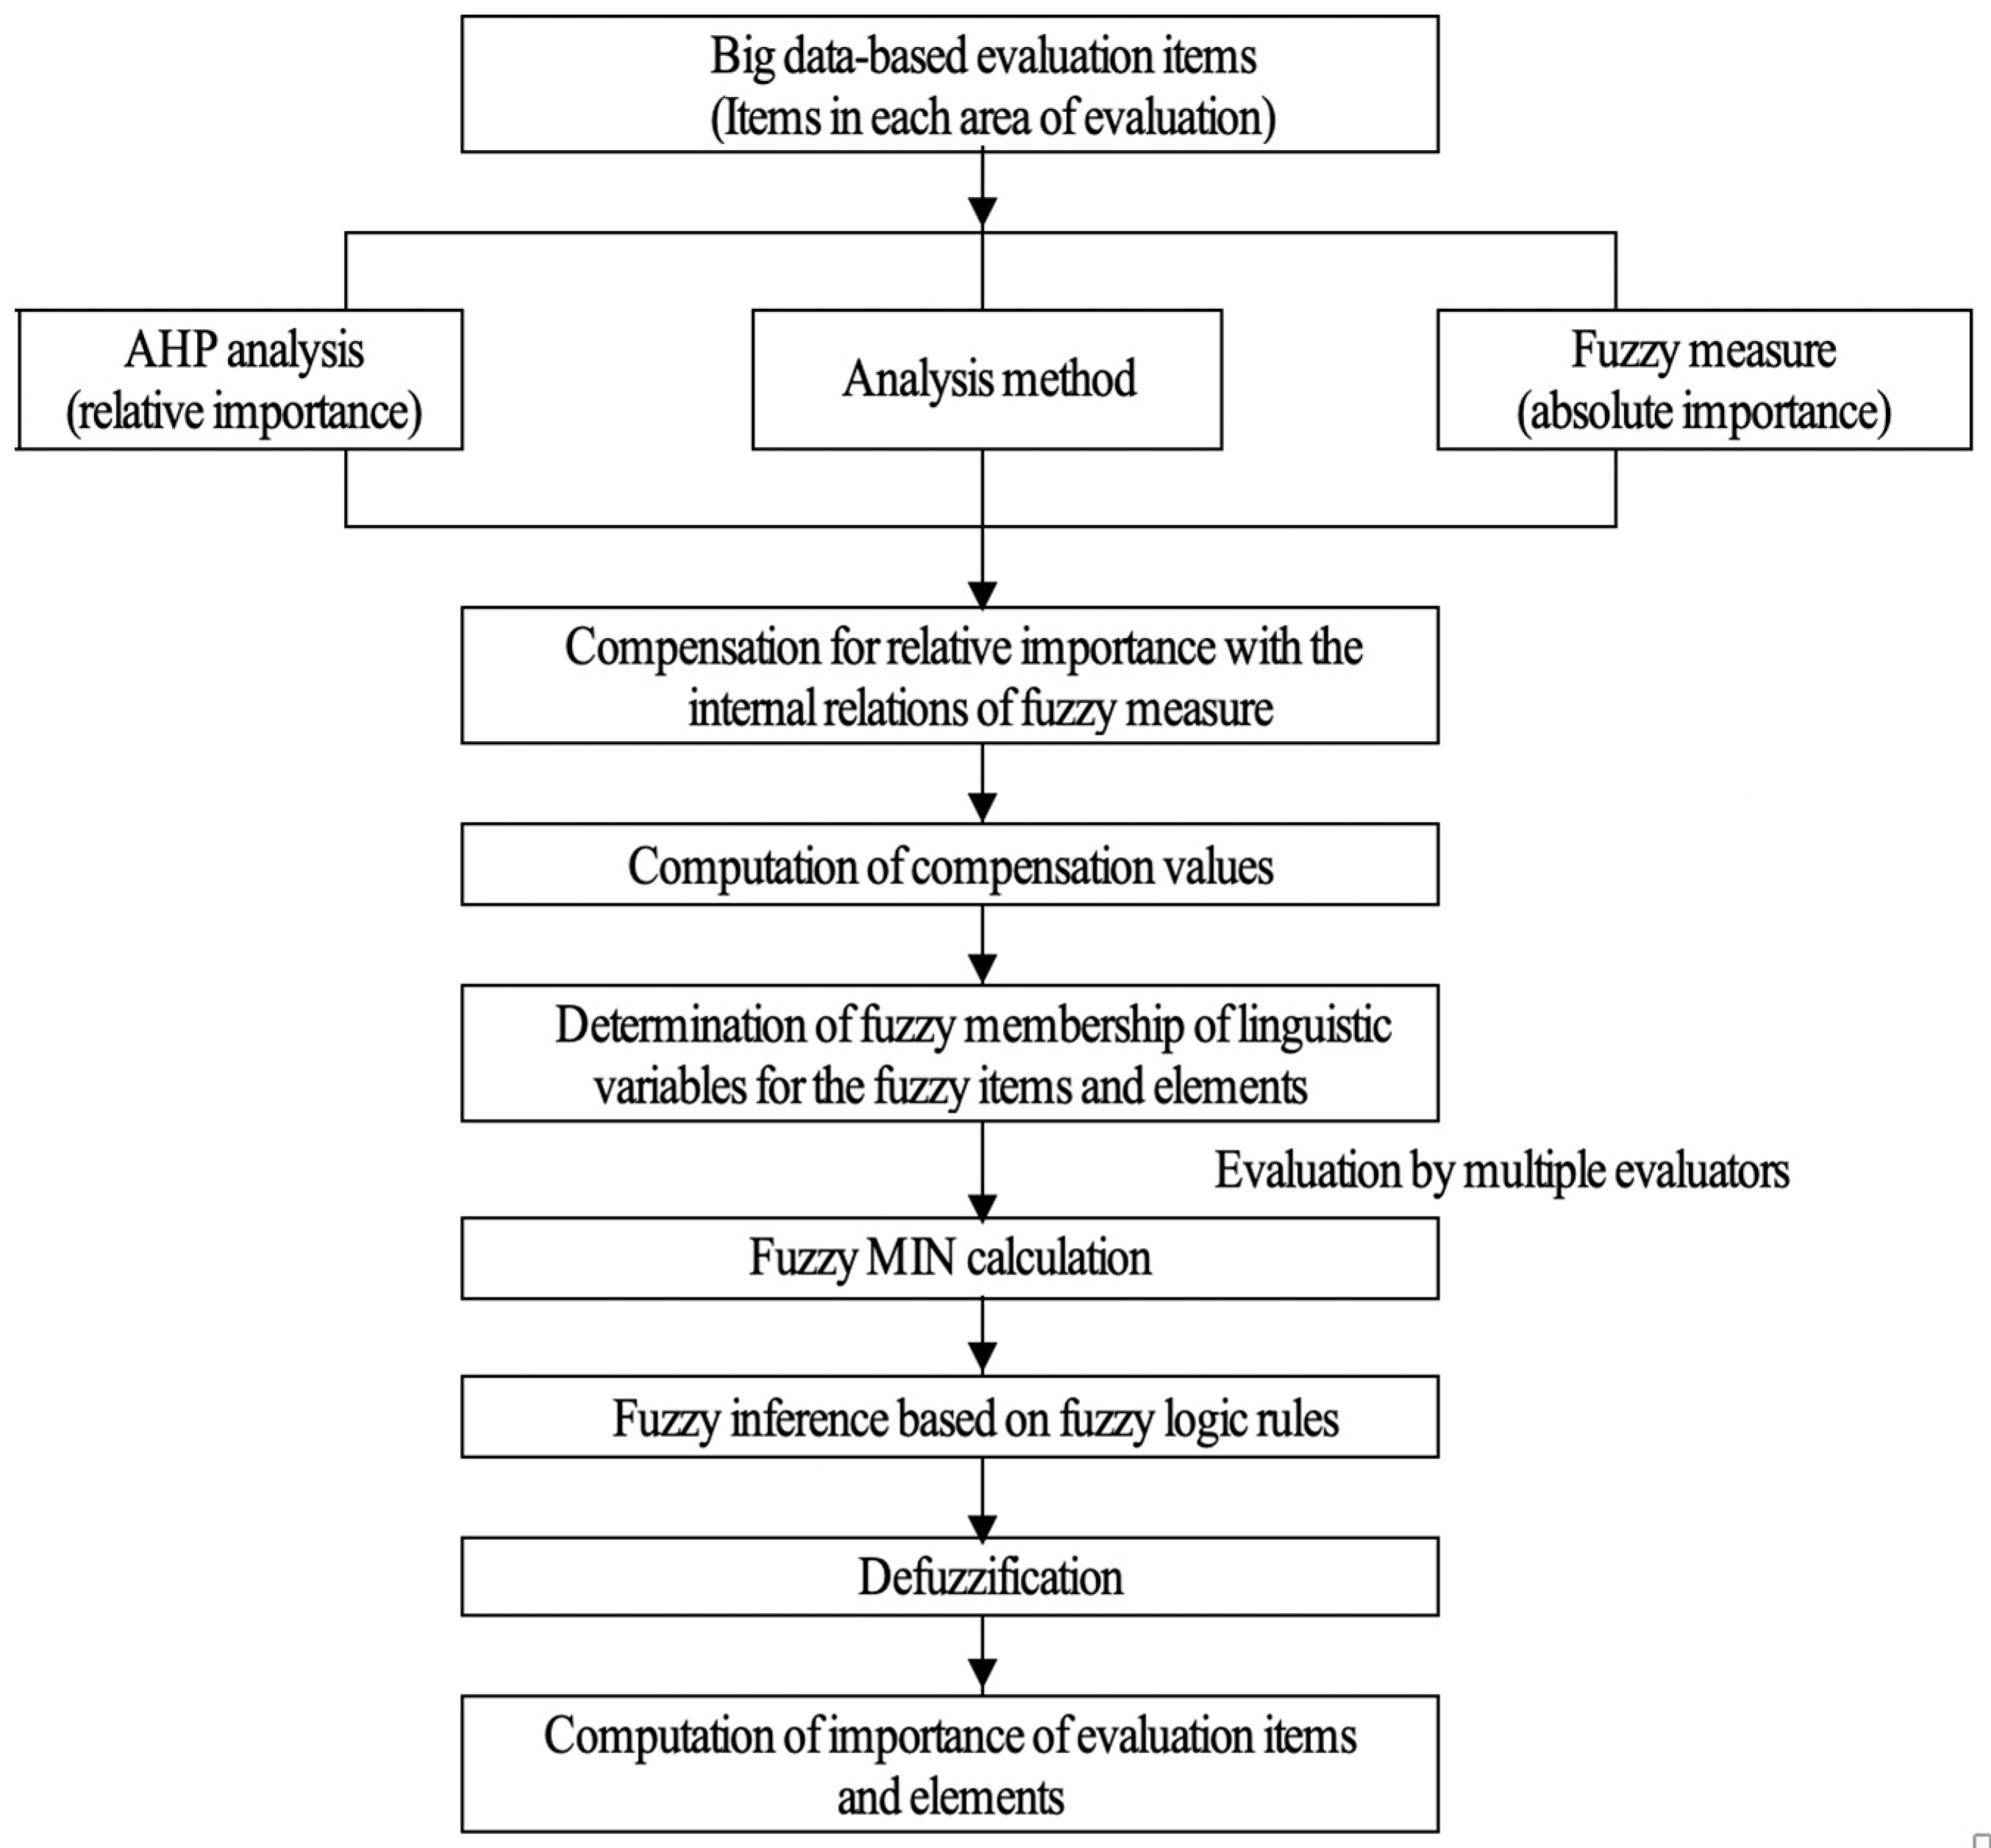
Figure 2 shows the methods for analyzing the evaluation factors. As most cases generated qualitive evaluation elements for investigation, it is necessary to quantify these qualitive outputs for measuring the influence of evaluation factors in high-rise mixed-use building development projects. Therefore, this study selected the evaluation items by categorizing them, calculated the fuzzy effect and the influence from the fuzzy measurement and Analytic Hierarchy Process, and applied the Choquet fuzzy integral.
3.3. Calculation of Influence on Evaluation Fields
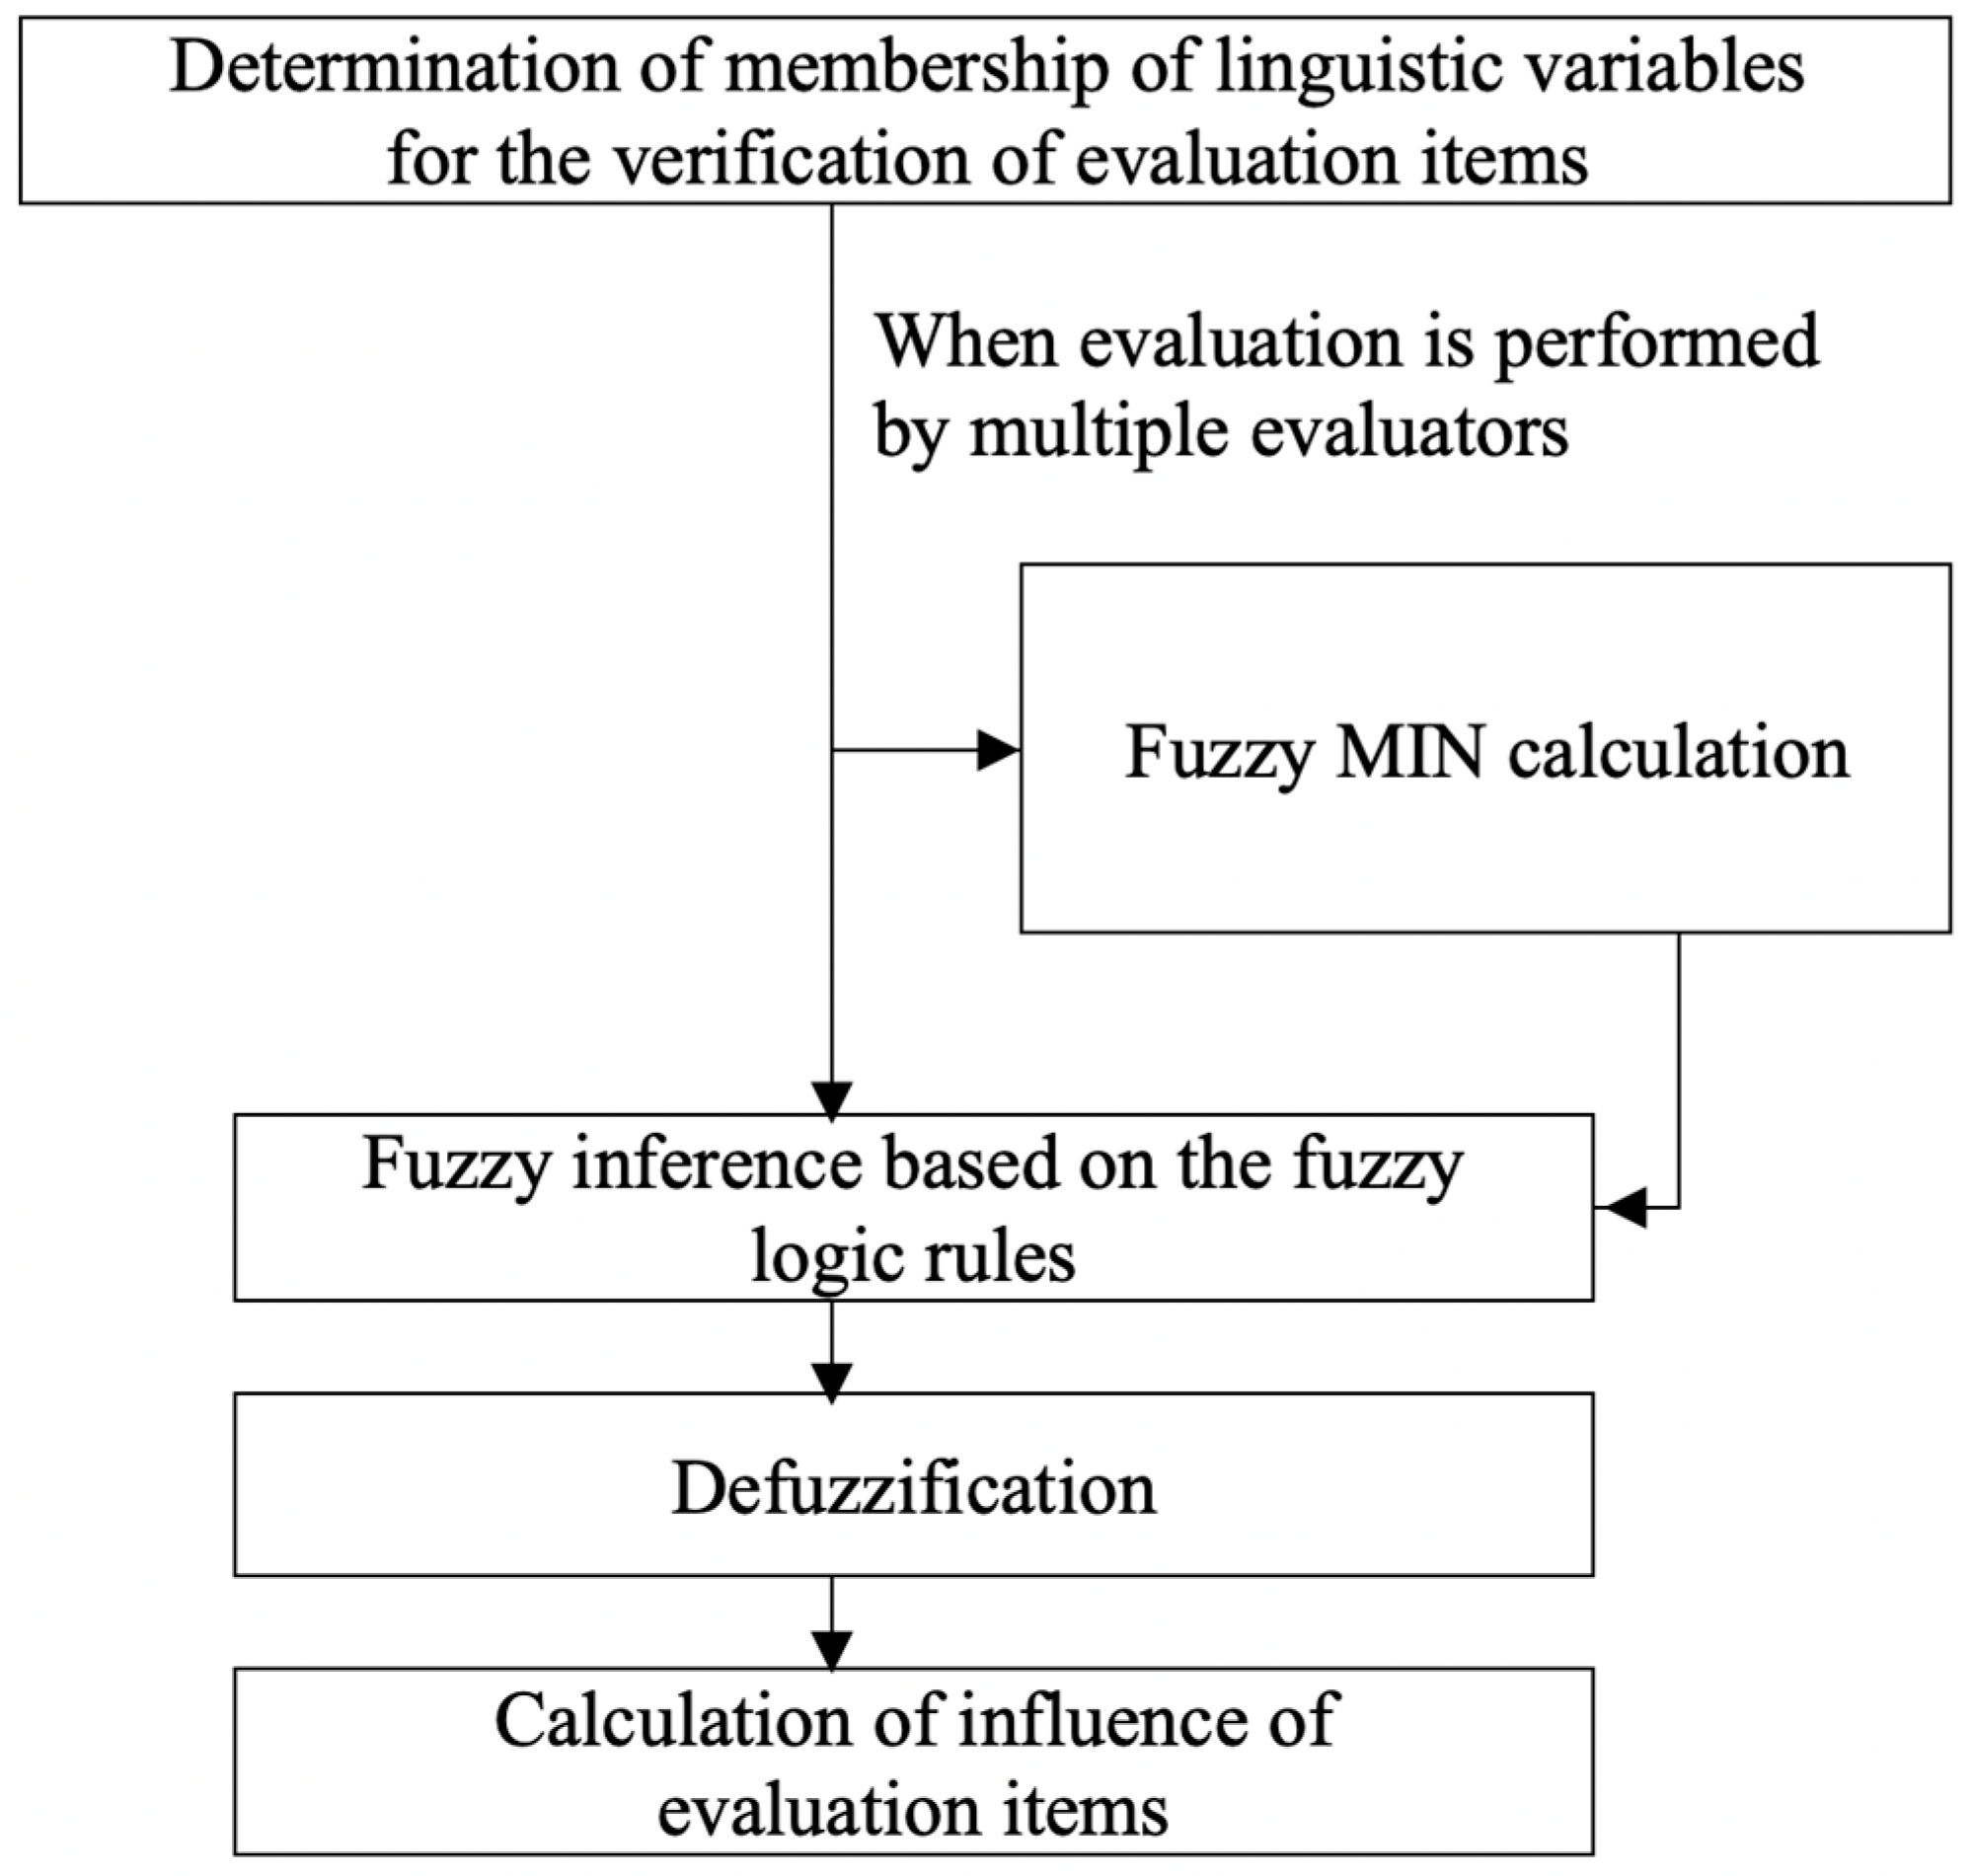
In this study, fuzzy inference was used to measure the influence factors of each category of the projects based on the fuzzy set theory. This indicates an ambiguity level for the measurement of each evaluation factor [25]. The process is shown in Figure 3. In addition, this process selects the importance of items to suggest the optimal feasibility study method for business decision-making, which ultimately can be understood as a process to develop a user interface business decision-making platform in the future. This study uses fuzzy inference to discover the significance levels of the evaluation items. The significance levels of the evaluation items are identified with a linguistic variable through the fuzzy set theory that can describe ambiguity in the evaluation and verification processes. The quantified value is then identified after de-fuzzying the fuzzy inference based on the patterns of fuzzy logic [26]. Table 4 shows the linguistic variables for indicating the degree of verification of evaluation items.
When the items have a low degree of verification, or are not verified in the evaluation areas, their need should be lowered for calculating the influence on the evaluation areas. In the present study, a higher degree of verification of evaluation subjects led to greater importance in the fuzzy sets (see Table 5).
If there are two or more experts to assess the degree of verification of items in the evaluation areas, the means of their evaluation results will be based on a MIN calculation.
Evaluation of items and element verification by evaluation area
= MIN (evaluation results of Expert A, evaluation results of Expert B, …)
= Evaluation results of Expert A ∧ evaluation results of Expert B ∧ …
Based on evaluating the degree of verification of items in the evaluation areas, the study calculated the influence distribution for each evaluation result through fuzzy inference with the If-Then rule [27]. Then, triangular fuzzy sets functioned as forming membership to the linguistic variable showing the significance of each item, and these were measured by the center of area method, which is a defuzzification procedure, as following in Equation (1).
Fuzzy integration is used to make ambiguous decisions that require the absolute importance of the endpoints. The fuzzy scale is a contribution to the higher endpoints of an individual endpoint and is not reliable. On the other hand, the importance obtained from the comparative comparison of evaluation items is relatively high in reliability. For this reason, Equation (1) was used. In the present study, the final importance was calculated by considering the redundancy, which is the relative relationship between the evaluation items obtained from the fuzzy scale, in the relative importance using AHP.
3.4. Calculation of Total Influence of Evaluation Items
The overall significance level of each factor was measured by the Choquet fuzzy integration method, as shown at Equation (2). This can indicate the λ- fuzzy values representing the significance levels between conflicted evaluation factors.
This study set up an area of the urban outskirts to measure overall significance levels of the evaluation factors from high-rise building development projects. Each category was arranged into urban condition, traffic condition, pedestrian condition, and environmental protection. Fuzzy inferences resulted in the influence of each factor, such as 0.300, 0.574, 0.404, and 0.300, respectively, and their importance was 0.508, 0.621, 0.501, and 0.425, respectively. Table 6 shows the importance levels of evaluation factors, which were regarded simultaneously.
The Choquet fuzzy integral was applied based on (4). There was the total influence level of the environment, 0.407, in the evaluation areas. The results were as follows:
3.5. Data Collection and Analysis Settings
By utilizing the influence factors of high-rise building mixed-use development projects, this study examined real estate development firms, construction companies, financial firms, trust companies, real estate investment trusts and fund-related firms, and credit rating companies for 15 days from April 5 to 19, 2019. Based on the judgmental and non-probability sampling methods, 200 experts were selected from these professional fields for their individual interview responses. Table 7 provides the attributes of the interviewees, including their professional fields and career duration. Of the total respondents, 73.5% were directly related to real estate development, and 79% had worked for over five years in their real estate development careers.
A questionnaire was distributed, which consisted of items concerning relative importance based on AHP and absolute importance based on fuzzy measure, in the evaluation areas of the qualitative indicators. The relative importance scale of AHP had an interval of two, as in, 1, 3, 5, and 7 (see Table 8) [19].
The present study also considered the effects of individual lower evaluation elements on the upper evaluation items based on absolute importance via fuzzy measure (see Table 9).
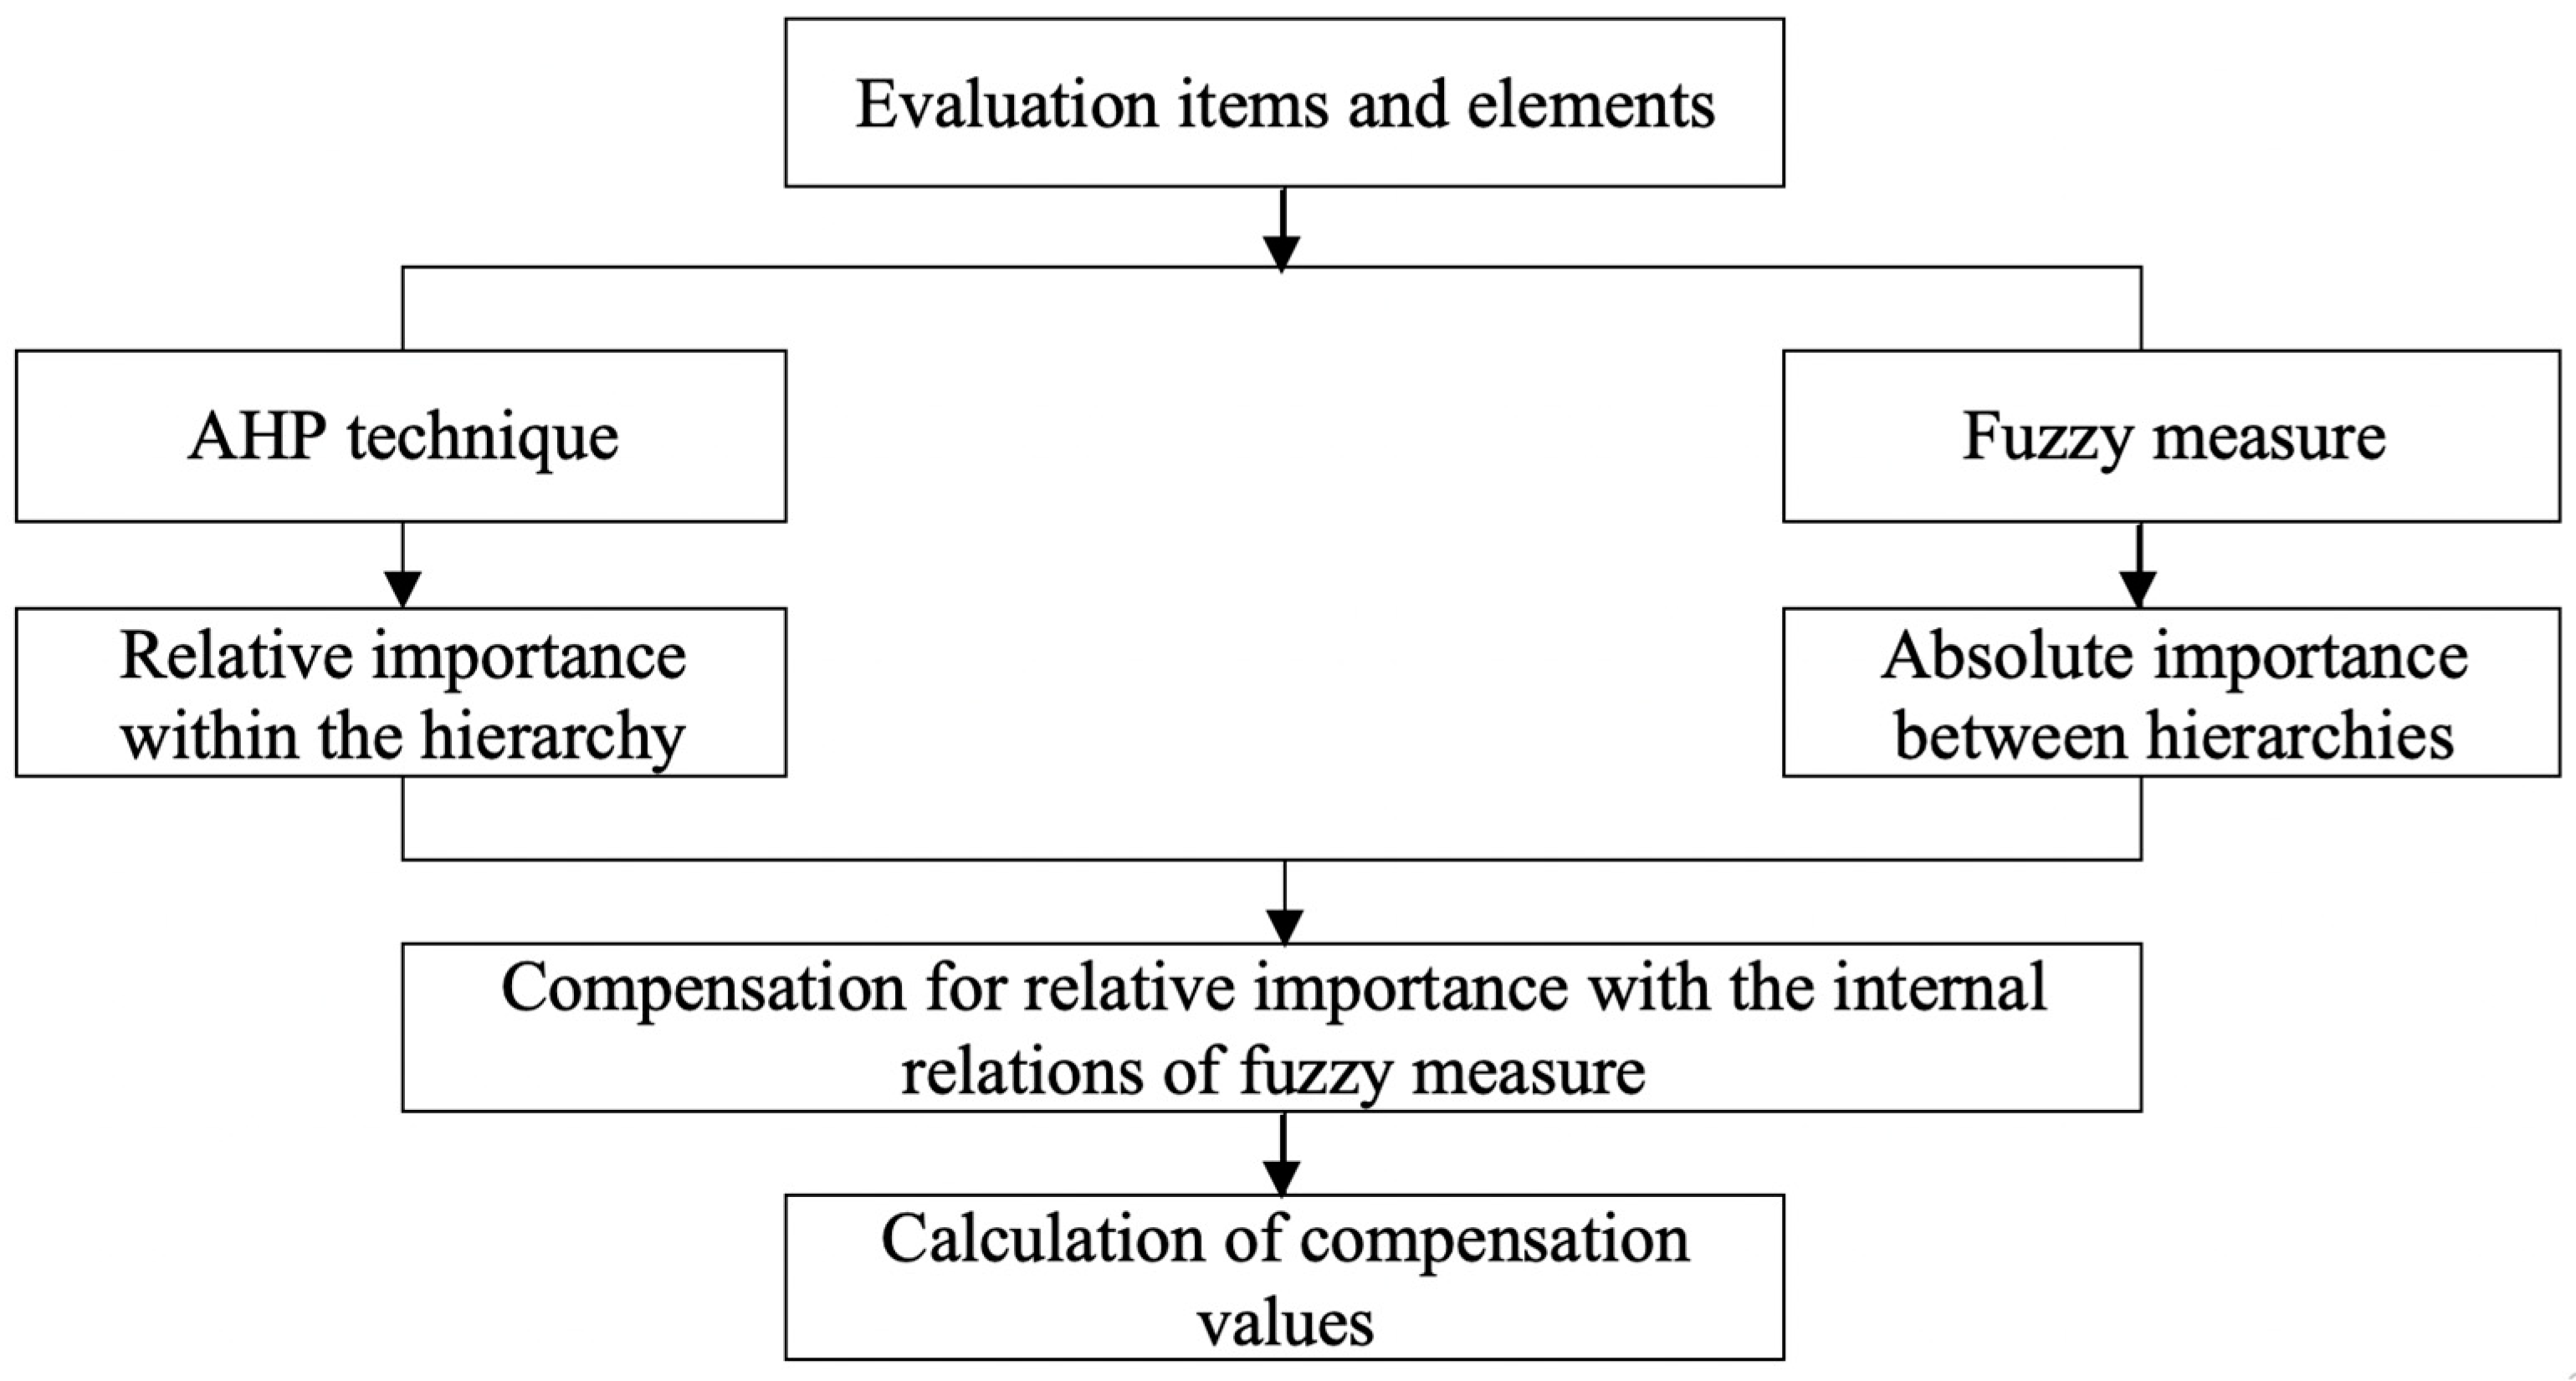
Calculating the importance of items by evaluation area is a critical operation in analyzing evaluation areas. Especially in subjective evaluations, it is almost impossible to calculate importance in clear expressions. In such a case, the experiences and knowledge of experts play significant roles. The present study employed the AHP technique, known for its excellent testing power for subjective evaluations. The absolute importance of items in the evaluation areas is also needed for the fuzzy integral to make subjective decisions, which was why the concept of fuzzy measure was used in the present study. This process is shown in Figure 4. The final comprehensive value is calculated from Figure 4, and the major point in this process is to measure the relative weight according to the AHP method by the project evaluator, and to deduce objective evaluation results by complementing the absolute weight through fuzzy measurements.
4. Findings and Discussions
4.1. Calculation of Influence with the Fuzzy Integral
This study calculated the importance of items by evaluation area using the Choquet fuzzy integral. When evaluating a subject across many different items, the fuzzy integral uses fuzzy measure for the evaluation value of each item. The range is broad—from 0.1 to 1.0—obtained through fuzzy inference based on the center of area method. Table 10 shows the influence of corresponding values for the unnecessariness of items in the evaluation areas.
In the Choquet fuzzy integral, a change in the evaluation value of an evaluation item will always lead to the consideration of influences on other evaluation items. There is, thus, no abrupt change to the evaluation results. Since the Choquet fuzzy integral reflects the influence of evaluation values sequentially, errors to a couple of evaluation items will not immediately influence the entire evaluation. They will result in a gradual reduction of effects in their interactions with the evaluation values of other evaluation items. This is able to alleviate the extreme effects of examination results with strong subjective tendency, and secure some degree of objectivity.
4.2. Utilization of Evaluation by Innovative Methods for Big Data Analytics: Suggested Decision-Making Method through User Interface Big Data Analytics
Based on the calculation values of items in the evaluation areas, total influences were obtained due to the varying importance of items among the evaluation areas (see Table 11). In addition, evaluators varied in subjectivity and scale among high-rise building mixed-use development projects. Considering that evaluation results vary according to project uniqueness, there is a need for methodological alternatives that will put these results to universal use.
This study estimated the influence of the evaluation area by using the fuzzy integral and identified the implications for each item. The evaluator in the above project was able to carry out a tailored evaluation that could overcome the limitations of generality for qualitative indicators in each area. When the evaluator of a particular evaluation area selects “Very important” on the “Recognition of landmarks” item in the evaluation area of “Society and cities,” based on influence by unnecessariness, the total influence will be 0.544, assuming evaluation index and unnecessariness values of 0.9 and 0.196, respectively. This process can mitigate the fierce interests of subjects involved in a development project and help to apply a scientific technique to quantify qualitative indices objectively. Therefore, this study established an evaluation system that can enhance the methodological utility of the feasibility study of high-rise building mixed-use development projects in the future, amid rapidly changing business environments, through an innovative and quantified decision-making method that combines big data and fuzzy theory.
4.3. Effectiveness Validation and Appreciation
Table 12 shows the evaluation using the study’s methodology conducted by an evaluator in charge of the project who works for the Korea Land and Housing Corporation (LH), a public organization in Korea. The evaluation results calculated the unnecessariness using fuzzy reasoning, and suggested the influence of the evaluation fields. The evaluation fields were simplified by limiting them to Environment, Architectural technological level, and Awareness. The results were suggested in the following order: Environment (0.787), Awareness (0.322), and Architectural technological level (0.178). This order considered the weight of the items according to the areas in the evaluation categorization system of future projects by measuring the language variables according to each evaluation item. In this evaluation field, Environment has a high influence, indicating the importance of considering factors from the Environment evaluation fields for this project; thus, these should be the major factors considered during future evaluations of the project. Within Environment, the pedestrian environment was the factor with the highest evaluation (0.544), Design technology was highest among Architectural technological level (0.549), and Awareness of design offices and construction companies was highest among Awareness (0.568). The results showed that custom-made evaluations are possible.
4.4. Suggestions and Tasks on the Evaluation Method
This study suggested a method to evaluate the factors and characteristics of the detailed evaluation areas of a particular project that can be applied onsite. An appropriate project evaluation is the most important aspect to ensure that the project runs smoothly from start to finish. In particular, the evaluator must sufficiently consider the individual nature and particularities of the project before conducting the evaluation. These evaluators can select the final items and factors for the evaluation areas by assessing them under consideration of the unnecessariness and importance suggested in this study. Therefore, the evaluator can evaluate project appropriateness by putting together an evaluation method according to the purpose of the project. However, to continuously use the evaluation method suggested in this study, the following issues should be taken into account.
The evaluation areas should be continuously monitored to increase the effectiveness of this evaluation method. The major problem in terms of applying the evaluation method is that the evaluation areas cannot be set according to either the project type and characteristics or the economic environment. In other words, evaluation areas that may be appropriate at a certain point in time may later lose their effectiveness. Therefore, to consider the variability, processes should be established to improve the evaluation areas, and periodic inspections conducted to improve the considered factors on the foundation that influences the evaluation standards. A user-friendly program should also be developed to allow evaluators easy use of the study model. In addition, the evaluation factors generated by this fuzzy-AHP technique can be integrated with a multiple criteria decision analysis (MCDA). As practical projects in the field will be faced with many conflicting factors, MCDA can help simplify the multiple different criteria by discerning the relative significance for better judgment.
5. Conclusions
This study focused on a decision-making method in the feasibility study of real estate development planning, amid the rapidly changing business environments faced by real estate development firms. At a time when big data are used across all industries due to advances in ICT, this study was conducted through a convergent process that established an evaluation method based on big data for high-rise building mixed-use development projects, and combined it with fuzzy theory. In particular, this study focused on the process of quantitatively converting qualitative data using scientific analytical methods by organizing the evaluation factors to complement the limitations of subjective evaluations of existing studies. Based on the problem that the existing evaluation analysis makes it difficult to exclude subjectivity in the qualitative process, this study proposed a methodology for minimizing the subjectivity of the evaluator and proposed an alternative that can be applied to actual projects. In addition, we proposed an evaluation method that is practically applicable in projects by the If-Then rule for evaluating the degree of verification of each evaluation field. In this regard, the evaluator can calculate the degree of influence by indicating the degree of verification for each evaluation factor in language variables. Thus, the evaluator can objectively quantify uncertain or ambiguous subjective measures. The present study focused on the application of evaluation methods to compensate for qualitative project evaluation using a classification system for influence factors expected in future projects when considering the old high-rise building mixed-use development projects; thus, it lacks specific measures for evaluation methods that will be easily applicable in the field and will reflect user convenience. In particular, more evaluations and tests are needed regarding the usefulness of the model. In addition, there was a problem with lower statistical consistency according to questionnaire structural differences due to the characteristics of AHP and fuzzy theory, despite the improved application of evaluation methods, which calls for further research. Authors should discuss the results and how they can be interpreted considering the previous studies and working hypotheses. The findings and their implications should be discussed in the broadest context possible. Future research directions may also be highlighted. In particular, as the Fuzzy-AHP technique, which works on specific projects, collects more evaluation factors, these can be categorized based on certain patterns by certain projects in big data sets for homogeneity and heterogeneity. This mechanism can be consolidated by patterning the evaluation system and risk management through big data analysis for the highest best use of real estate development.
One of the study’s limitations is its use of non-universal evaluation criteria. As this study produced evaluation factors based on a specific typology, such as the high-rise mixed-use building development project, the findings of the evaluation methods may not be applicable to generic development type projects. Further research should adjust the evaluation methods to include specifications and evaluation conditions of other types of real estate development and land use planning.
Author Contributions
J.K. conceived, designed, analyzed, and wrote this paper. D.S. advised on this research, from concept to writing. Y.S.C. was also involved in research design and analysis of the big data, and wrote this paper. All authors have read and agreed to the published version of the manuscript
Funding
This research received no external funding.
Acknowledgments
This research was supported by a research grant from Kongju National University in 2019.
Conflicts of Interest
The authors declare there are no conflict of interest.
References
- Patel, B.; Roy, S.; Bhattacharyya, D.; Kim, T.H. Necessity of big data and analytics for good e-governance. Int. J. Grid Distrib. Comput. 2017, 10, 11–20. [Google Scholar] [CrossRef]
- Chi, J.H.; Shim, E.S.; Hwang, J.H.; Shin, M.S. Mobile application curation service based on big data platform. Int. J. Grid Distrib. Comput. 2018, 11, 99–108. [Google Scholar] [CrossRef]
- Kim, J.H. A study on evaluation methods to select a developer for private public partnership project in Korea. J. Resid. Environ. 2014, 12, 1–13. [Google Scholar]
- Kim, J.; Shim, H. A study on the methodological application of feasibility evaluation of mixed-use development project to the fourth industrial revolution. World J. Account. Finance Eng. 2018, 3, 27–34. [Google Scholar]
- Zhang, H.; Tam, C.M.; Shi, J.J. Application of fuzzy logic to simulation for construction operations. J. Comput. Civ. Eng. 2003, 17, 38–45. [Google Scholar] [CrossRef]
- Byun, S. Design of efficient index management for column-based big databases. Int. J. Internet Things Big Data 2017, 2, 59–64. [Google Scholar] [CrossRef]
- Sekhar, C.; Suneetha, N. Study on data categorization for data analytics. Int. J. Internet Things Big Data 2018, 3, 1–6. [Google Scholar] [CrossRef]
- Swain, S.K.; Prasad, S.; Senapati, M.R. A review paper on architecture of big data. Int. J. Adv. Res. Big Data Manag. Syst. 2017, 1, 1–10. [Google Scholar]
- Manekar, A.S.; Pradeepini, G. Cloud based big data analytics: A review. Int. J. Cloud-Comput. Super-Comput. 2016, 3, 7–12. [Google Scholar] [CrossRef]
- Kong, W. Analyzing the usage of data mining in spatial database. Int. J. Internet Things Appl. 2017, 1, 1–12. [Google Scholar] [CrossRef]
- Kim, J.-J.; Lee, Y.-S.; Moon, J.-Y.; Park, J.-M. Big data based network traffic feature extraction. Int. J. Softw. Eng. Smart Device. 2017, 4, 13–18. [Google Scholar] [CrossRef]
- Balaji Prabhu, B.V.; Dakshayini, M. An efficient data analytics-cloud integrated decision support service for smart agriculture. Int. J. Internet Things Big Data. 2018, 3, 1–12. [Google Scholar]
- Chai, S.-S.; Suh, D. Design of risk analysis database system based on open data for South Korea. J. Stat. Comput. Algorithm 2018, 2, 1–6. [Google Scholar]
- Memon, S.; Changfeng, W.; Rasheed, S.; Pathan, Z.H.; Saddozai, S.K.; Yixin, Q.; Yanping, L. Adoption of big data technologies for communication management in large projects. Int. J. Future Gener. Commun. Netw. 2016, 9, 73–82. [Google Scholar] [CrossRef]
- Sahal, R.; Khafagy, M.H.; Omara, F.A. Comparative study of multi-query optimization techniques using shared predicate-based for big data. Int. J. Grid Distrib. Comput. 2016, 9, 229–240. [Google Scholar] [CrossRef]
- Chung, K.G.; Yoo, S.H. Structural design and construction of mega braced frame system for tall buildings. Int. J. High-rise Build. 2019, 8, 169–175. [Google Scholar]
- Aminmansour, A. Sustainability impact of tall buildings: Thinking outside the box! Int. J. High-rise Build. 2019, 8, 155–160. [Google Scholar]
- Zhou, X.; Ye, Y.; Wang, Z. Tall buildings as urban habitats: A quantitative approach for measuring positive social impacts of tall buildings’ lower public space. Int. J. High-rise Build. 2019, 8, 57–69. [Google Scholar]
- Kim, S.H.; Hong, S.H.; Choi, Y.K. Foundation design practice for high-rise buildings in Korea. Int. J. High-rise Build. 2015, 4, 219–310. [Google Scholar]
- Wan, K.K.W.; Chan, M.-H.; Cheng, V.S.Y. Considerations of sustainable high-rise building design in different climate zones of China. Int. J. High-rise Build. 2012, 1, 301–310. [Google Scholar]
- Elbakheit, A.R. Why tall buildings? The potential of sustainable technologies in tall buildings. Int. J. High-rise Build. 2012, 1, 117–123. [Google Scholar]
- Al-Kodmany, K. The logic of vertical density: Tall buildings in the 21st century city. Int. J. High-rise Build. 2012, 1, 131–148. [Google Scholar]
- Lai, S.Y.F. Sustainable design and its cost: Case study of Nanning China Resources Tower. Int. J. High-rise Build. 2017, 6, 323–326. [Google Scholar]
- Cheng, C.H. Evaluating naval tactical missile systems by fuzzy AHP based on the grade value of membership function. Eur. J. Oper. Res. 1997, 96, 343–350. [Google Scholar] [CrossRef]
- Sugeno, M. Theory of Fuzzy Integrals and its Applications. Ph.D. Dissertation, Tokyo Institute of Technology, Tokyo, Japan, 1974. [Google Scholar]
- Pedrycz, W.; Gomide, F. An Introduction to Fuzzy Sets: Analysis and Design; MIT Press: Boston, MA, USA, 1998. [Google Scholar]
- Langari, G.; Tomizuka, M. Stability of fuzzy linguistic control systems. In Proceedings of the 29th IEEE Conference on Decision and Control, Honolulu, HI, USA, 9 December 1990; Volume 4, p. 2185. [Google Scholar]
Figure 1.
Flow of research.

Figure 2.
Analysis flowchart for the feasibility study of evaluation items in high-rise mixed-use building development projects.
Figure 2.
Analysis flowchart for the feasibility study of evaluation items in high-rise mixed-use building development projects.

Figure 3.
Analysis flowchart for the feasibility study of evaluation items in high-rise building mixed-use development projects.
Figure 3.
Analysis flowchart for the feasibility study of evaluation items in high-rise building mixed-use development projects.

Figure 4.
Calculation process of compensation values.


Table 1.
The role of big data in future society.
| Characteristics of Future Society | Role of Big Data |
|---|---|
| Uncertainty |
|
| Risk |
|
| Smart |
|
| Convergence |
|
Source: Swain, Prasad, and Senapati, 2017, p.7 [8].
Table 2.
Components of big data.
| Division | Contents |
|---|---|
| Volume |
|
| Variety |
|
| Complexity |
|
| Velocity |
|
| Value |
|
Source: Manekar and Pradeepini, 2016, p. 9 [9].
Table 3.
Evaluation factors of influence factors in high-rise building mixed-use development projects based on big data with information and communications technology (ICT).
Table 3.
Evaluation factors of influence factors in high-rise building mixed-use development projects based on big data with information and communications technology (ICT).
| Categories | Evaluation Fields | Evaluation Factors |
|---|---|---|
| Economy and industry | National economy | Increased tourist revenues |
| Expanded size of national economy | ||
| Increased cash flow | ||
| Local economy | Formation of business districts | |
| Influx of tourists | ||
| Recirculation according to increased tax revenues | ||
| Industrial effects | Impact on the construction industry | |
| Linkage effects with other industries and mobile resources | ||
| Increased global competitiveness of the construction industry | ||
| Information and communications technology | Convenience of living environment | |
| Ease of use ability of residents | ||
| Infrastructure compatibility based on big data analysis | ||
| Society and culture | Society and cities | Recognition of landmarks |
| Effects of urban redevelopment | ||
| Cultural ripple effects | Brand positioning of national, social, and corporate leaders | |
| Cultural products and Korean Wave effects | ||
| Technology and environment | Environment | Urban environment |
| Traffic environment | ||
| Pedestrian environment | ||
| Environment protection in the outskirts | ||
| Architectural institutions and standards | Introduction of advanced architectural institutions | |
| Advancement of standards | ||
| Export of standards | ||
| Costs | Environment costs | |
| Traffic costs | ||
| Infrastructure costs | ||
| Architectural technological level | Design technology | |
| Engineering technology | ||
| Construction technology | ||
| Land usage | Efficiency of land usage | |
| Complexity of land usage | ||
| Diversity of land usage | ||
| Reputation | Awareness | Awareness of nation |
| Awareness of area | ||
| Awareness of investors, including owners | ||
| Awareness of design offices and construction companies | ||
| National sentiment | People’s interest | |
| Pride | ||
| Local economy |
Table 4.
Linguistic variables to show the degree of verification of evaluation items.
| Linguistic Variable | ||
|---|---|---|
| Very low | VL | 0.1 |
| Low | L | 0.3 |
| Medium | M | 0.5 |
| High | H | 0.7 |
| Very high | VH | 0.9 |
Table 5.
Linguistic variables to show the importance of evaluation items.
| Linguistic Variable | ||
|---|---|---|
| Very Low Contraction Value | VL | 0.1 |
| Low | L | 0.4 |
| Medium | M | 0.6 |
| High | H | 0.8 |
| Very good | VG | 0.9 |
Table 6.
Importance when evaluation items are considered simultaneously.
| Set | Importance | Set | Importance |
|---|---|---|---|
| ∅ | 0 | {} | 0.834 |
| {} | 0.508 | {} | 0.801 |
| {} | 0.621 | {} | 0.729 |
| {} | 0.501 | {} | 0.949 |
| {} | 0.425 | {} | 0.932 |
| {} | 0.837 | {} | 0.893 |
| {} | 0.773 | {} | 0.930 |
| {} | 0.733 | {} | 1.000 |
Table 7.
Characteristics of the data set.
| Interviewee Characteristics | Interviewee Numbers | Ratio | |
|---|---|---|---|
| Company Fields | Real Estate Development Company | 56 | 28.0% |
| Construction Company | 46 | 23.0% | |
| Financial Company | 45 | 22.5% | |
| Real Estate Investment Trusts and Fund-related Company | 39 | 19.5% | |
| Credit Rating Company | 14 | 7.0% | |
| Total | 200 | 100% | |
| Career Duration | Less than 3 years | 10 | 5.0% |
| 3 years to 5 years | 32 | 16.0% | |
| 5 years to 10 years | 67 | 33.5% | |
| More than 10 years | 91 | 45.5% | |
| Total | 200 | 100% | |
Table 8.
AHP scale.
| Scale | Definition | Explanation |
|---|---|---|
| 1 | The same | The two items have the same contribution to the goal. |
| 3 | A little bit important | One item is a little bit more important than the other. |
| 5 | Important | One item is more important than the other. |
| 7 | Very important | One item is very important compared with the other. |
Table 9.
Fuzzy measure.
| Measure | Definition | Evaluation Index |
|---|---|---|
| 6 | Very important | 0.90 |
| 5 | Important | 0.75 |
| 4 | A little bit important | 0.60 |
| 3 | Average | 0.45 |
| 2 | Less important | 0.30 |
| 1 | Not important | 0.15 |
| 0 | Never important | 0 |
Table 10.
Influence of unnecessariness.
| Evaluation Index | 0.1 | 0.2 | 0.3 | 0.4 | 0.5 |
| Unnecessariness | 0.950 | 0.833 | 0.762 | 0.700 | 0.606 |
| Evaluation index | 0.6 | 0.7 | 0.8 | 0.9 | 1.0 |
| Unnecessariness | 0.574 | 0.404 | 0.300 | 0.196 | 0.100 |
Table 11.
Example of an evaluation method based on influence by evaluation area.
| Evaluation Areas | Influence | Evaluation Areas | Influence | Evaluation Results | Evaluation Indices | Unnecessariness |
|---|---|---|---|---|---|---|
| Society and cities | 0.587 | Recognition of landmarks | 0.544 | VG | 0.900 | 0.196 |
| Effects of urban redevelopment | 0.458 | H | 0.800 | 0.300 | ||
| Cultural ripple effects | 0.413 | Brand positioning of nation, society, and corporate leaders | 0.549 | H | 0.800 | 0.300 |
| Cultural products and Korean Wave effects | 0.440 | M | 0.600 | 0.574 |
Table 12.
Effects of the evaluation areas by the evaluator.
| Evaluation Fields | Influence | Evaluation Results | Evaluation Index | UNNECESSARINESS | Evaluation Factors | Influence | Evaluation Results | Evaluation Index | Unnecessariness |
|---|---|---|---|---|---|---|---|---|---|
| Environment | 0.787 | VG | 0.900 | 0.196 | Urban environment | 0.442 | VG | 0.900 | 0.196 |
| H | 0.800 | 0.300 | |||||||
| M | 0.600 | 0.574 | |||||||
| L | 0.400 | 0.700 | |||||||
| H | 0.800 | 0.300 | Traffic environment | 0.458 | VG | 0.900 | 0.196 | ||
| H | 0.800 | 0.300 | |||||||
| M | 0.600 | 0.574 | |||||||
| M | 0.600 | 0.574 | Pedestrian environment | 0.544 | VG | 0.900 | 0.196 | ||
| H | 0.800 | 0.300 | |||||||
| M | 0.600 | 0.574 | |||||||
| L | 0.400 | 0.700 | Environment protection in the outskirts | 0.417 | VG | 0.900 | 0.196 | ||
| H | 0.800 | 0.300 | |||||||
| M | 0.600 | 0.574 | |||||||
| L | 0.400 | 0.700 | |||||||
| Architectural technological level | 0.178 | H | 0.800 | 0.300 | Design technology | 0.549 | VG | 0.900 | 0.196 |
| H | 0.800 | 0.300 | |||||||
| M | 0.600 | 0.574 | |||||||
| L | 0.400 | 0.700 | |||||||
| M | 0.600 | 0.574 | Engineering technology | 0.440 | VG | 0.900 | 0.196 | ||
| H | 0.800 | 0.300 | |||||||
| M | 0.600 | 0.574 | |||||||
| M | 0.600 | 0.574 | Construction technology | 0.370 | VG | 0.900 | 0.196 | ||
| H | 0.800 | 0.300 | |||||||
| M | 0.600 | 0.574 | |||||||
| Awareness | 0.322 | VG | 0.900 | 0.196 | Awareness of nation | 0.508 | VG | 0.900 | 0.196 |
| H | 0.800 | 0.300 | |||||||
| M | 0.600 | 0.574 | |||||||
| L | 0.400 | 0.700 | |||||||
| VG | 0.900 | 0.196 | Awareness of area | 0.381 | VG | 0.900 | 0.196 | ||
| H | 0.800 | 0.300 | |||||||
| M | 0.600 | 0.574 | |||||||
| VL | 0.100 | 0.950 | Awareness of investors, including owners | 0.386 | VG | 0.900 | 0.196 | ||
| H | 0.800 | 0.300 | |||||||
| M | 0.600 | 0.574 | |||||||
| H | 0.800 | 0.300 | Awareness of design offices and construction companies | 0.568 | VG | 0.900 | 0.196 | ||
| H | 0.800 | 0.300 | |||||||
| M | 0.600 | 0.574 | |||||||
| L | 0.400 | 0.700 |
© 2020 by the authors. Licensee MDPI, Basel, Switzerland. This article is an open access article distributed under the terms and conditions of the Creative Commons Attribution (CC BY) license (http://creativecommons.org/licenses/by/4.0/).
Share and Cite
MDPI and ACS Style
Kim, J.; Seo, D.; Chung, Y.S. An Integrated Methodological Analysis for the Highest Best Use of Big Data-Based Real Estate Development. Sustainability 2020, 12, 1144. https://0-doi-org.brum.beds.ac.uk/10.3390/su12031144
AMA Style
Kim J, Seo D, Chung YS. An Integrated Methodological Analysis for the Highest Best Use of Big Data-Based Real Estate Development. Sustainability. 2020; 12(3):1144. https://0-doi-org.brum.beds.ac.uk/10.3390/su12031144
Chicago/Turabian StyleKim, Jaehwan, Ducksu Seo, and You Seok Chung. 2020. "An Integrated Methodological Analysis for the Highest Best Use of Big Data-Based Real Estate Development" Sustainability 12, no. 3: 1144. https://0-doi-org.brum.beds.ac.uk/10.3390/su12031144
Note that from the first issue of 2016, this journal uses article numbers instead of page numbers. See further details here.