Article

Investigating the Relationship between the Industrial Structure and Atmospheric Environment by an Integrated System: A Case Study of Zhejiang, China

1
Institute of Environmental Economics Research, Ningbo Polytechnic, Ningbo 315800, China
2
School of Physical Education, China University of Geosciences, Wuhan 430074, China
*
Authors to whom correspondence should be addressed.
Sustainability 2020, 12(3), 1278; https://0-doi-org.brum.beds.ac.uk/10.3390/su12031278
Submission received: 10 January 2020 / Revised: 6 February 2020 / Accepted: 8 February 2020 / Published: 10 February 2020

Abstract

:
Under the dual pressure of industrial structure upgrade and atmospheric environment improvement, China, in a transition period, is facing the challenge of coordinating the relationship between the industry and the environment system to promote the construction of a beautiful China. Based on system theory and coupling coordination model, the interaction analysis framework between industrial structure (IS) and atmospheric environment (AE) was constructed. An integrated system with 24 indicators was established by the pressure–state–response (PSR) model of IS and level–quality–innovation (LQI) model of AE. Then, we analyzed trends observed in coupling coordination degree (CCD) and dynamic coupling coordination degree (DCCD) for 11 cities in Zhejiang Province, China, using statistical panel data collected from 2006 to 2017. Conclusions were as follows: (1) the 11 cities’ comprehensive level of the IS system shows a trend of stable increase, yet the comprehensive level of AE demonstrated a trend of fluctuation and transition. There are significant spatial variations among cities; (2) The CCD analysis results found that Hangzhou, Ningbo, and Wenzhou take the lead in realizing the transformation from barely coordinated development to superior coordinated pattern, while other cities were still in the stage of barely coordinated development; (3) the DCCD phase of 11 cities can be roughly divided into three types: upgraded—utmost development type (only Hangzhou), stable—harmonious development type (Wenzhou, Lishui, and Zhoushan) and transitional—harmonious development type (the remaining seven cities). This means, for most cities, the contradiction between the transformation process of IS and the AE has become increasingly prominent and intensified. Finally, three necessary and sustainable strategies were proposed to environmental policy makers.

1. Introduction

With the acceleration of industrialization and urbanization in China, the motor vehicle exhaust emission has increased rapidly, resulting in increasingly serious regional air pollution problems. Extensive and persistent haze weather occurs more and more frequently, especially in economically-developed urban agglomerations with high urban density and concentrated energy consumption, such as the Yangtze River Delta, Pearl River Delta, and Beijing–Tianjin–Hebei region [1,2,3]. Therefore, it is a common focus of the current society and academia to explore the mechanisms of social and economic factors influencing urban air environmental pollution. Among them, the factor of industrial structure, as a critical social–economic indicator of concern, is more and more favored by researchers [4,5,6].
The industrial structure, also known as the sector structure of the national economy, is usually used to reflect the degree of economic development of a country or region. It refers to the proportion of different industrial sectors in a country’s economic structure, which can be divided into primary industries, secondary industries, and tertiary industries, according to the Fisher’s three-sector theory [7,8]. This classical theory divides the types of industries based on the property of the industry and the characteristics of the production process. The sector in which products are taken directly from nature is called the primary industry, the sector in which primary products are reprocessed is called the secondary industry, and the sector in which services are provided for production and consumption is called the tertiary industry. Among them, the secondary industry can be divided into construction and industry, while the tertiary industry includes service industry and circulation industry (such as the transportation industry, the software and information services industry, and the scientific research and technical services industries). With the progress of technology and the improvement of social productivity, the evolution of the industrial structure presents the change of upgrading and optimization [9]. The upgrading of the industrial structure refers to the process where the industrial structure transforms from a low-level pattern (primary industry) to a high-level pattern (secondary industry or tertiary industry) [10]. Industrial structure optimization mirrors the coordinated development degree among different industries [9,11]. At the same time, as the core tool to coordinate economy and environment, industrial structure is directly related to how the economic system utilizes resources and emits pollutants. In contrast, destroying the eco-environment would largely confine the sustainable economic development and slow down the evolution of industrial structure [12]. At present, China’s economy presents a “new normal” of shifting growth speed and painful industrial restructuring. It has a great theoretical and practical significance to investigate the relevance between industrial structure and atmospheric environment [13,14].
The studies on industrial structure evolution and air quality assessment are complex and comprehensive, with many influencing factors and wide coverage. Grossman and Krueger (1995) classified the impacts of international trade on industrial structure into three types: structural effects, scale effects, and technology effects [15]. Then, based on the Environmental Kuznets Curve theory, a large number of studies included industrial structure index as one of the explanatory variables of social and economic impact into the analysis of eco-environmental impact [16,17]. On this basis, many scholars have used econometric models to empirically study the impact of industrial structure adjustment on pollutant emissions, but there are some differences in research conclusions. Some studies showed that industrial upgrading could bring about an improvement of energy efficiency rate and technology level, further improving the environmental quality [10,18,19]. However, some scholars found that industrial restructuring had little or no significance on environmental pollution, and some provinces’ environment improvement deteriorated the circumstances of others [20]. In addition, other scholars considered the impact of industrial structure adjustment on pollutant emission had significant heterogeneity of varying pollutants and varying regions [21,22,23]. There is no doubt that these studies have provided beneficial exploration and help to reveal the relationship between the industrial structure and ecological environment. However, there are two problems in the existing studies: (1) The industrial structure contains many aspects and dimensions [4], including proportion of output value, number of employees, industry types, energy consumption, and industrial technological progress. Most studies only took the proportion of the secondary industry as an evaluation index to measure the industrial structure and construct the econometric regression model [13,16,19], which might lead to certain deviation and incompleteness of the analysis results. Thus, it was difficult to systematically reveal the complex influence of industrial structure evolution on the environmental system; (2) Increasing studies have centered on the relationship between industrial structure and carbon dioxide emission [9,10,11,14,18,24], as well as the relationship between industrial structure and the ecological environment system [4,23], but there is a lack of detailed study on the dimension of the air environment system. On the basis of the pressure–state–response model, it was gradually pursued by scholars to treat the air environment as a whole system from the system theory [25,26,27,28]. Meanwhile, strengthening environmental regulation, reducing air pollution emission, and improving air quality are the unswerving goals of urban air environment governance in China. Therefore, Zhejiang province, the research region we chose, is a typical example of China in the transition period, which is facing the dual pressure of industrial structure upgrade and air environment improvement. The analysis of the influence rules and coordinated development characteristics between industrial structure and atmospheric environment could provide reference for regional environmental policy formulation [29].
In comparison with the available studies, this paper mainly makes the following contributions: (1) The relationship between industrial structure and atmospheric environment is discussed from the integrated systems, instead of the former urbanization system and eco-environmental system. This is favorable to the construction of a beautiful China in a transitional period; (2) Technological innovation and advancement indicators are incorporated into the industrial structure system, rather than a single indicator by proportion of secondary industrial output and employment. This is beneficial to recognize the industrial transformation and green development under the pressure of atmospheric environment; (3) the coupling coordination degree model (CCDM) and dynamic coupling coordination degree model (DCCDM) are selected to investigate the interaction between them, and the relationship at city-level differences will be discussed further. In all, the main purpose of this research is to discuss the evolution characteristics of the relationship between industrial structure change and atmospheric environment from the perspective of system theory, so as to provide a basis for regional sustainable development in the dimension of industry and environmental system.

2. Methods and Data Sources

2.1. Study Area

Zhejiang is a developed province in the southeast coast of China, including 11 prefecture-level cities: Hangzhou (capital city), Ningbo, Wenzhou, Jiaxing, Huzhou, Shaoxing, Jinhua, Quzhou, Zhoushan, Taizhou, and Lishui. Because of the fast-growing nature of the economy and industrialization, the resource consumption and environmental destruction are inevitably intensified [30]. For instance, the emission of air pollutants is increasing [28,29] and the air pollution reduction situation is grim. Figure 1 shows the data of industry structure and waste gas discharged for Zhejiang province from 1990 to 2017.
In the past decades, the industrial structure of Zhejiang province has undergone tremendous changes, reflecting the process of Zhejiang’s economic transformation and development. As shown in Figure 1, Zhejiang’s primary industry ratio fell by 41.4%, from 53.2% in 1990 to 11.8% in 2017, which means the dominant position of traditional agriculture has been fundamentally changed. Zhejiang’s secondary industry presented a trend of continuously raising and then descending after 2013. In 2001, the proportion of the secondary industry surpassed that of the primary industry for the first time and became the leading industry, affecting the economic development of Zhejiang. In 2012, the proportion of the secondary industry reached its peak, accounting for 51%, and then dropped, accounting for 46.2% in 2017. Correspondingly, the proportion of the tertiary industry grew steadily, more than doubling from 17% in 1990 to 42% in 2017. At present, Zhejiang is in the critical period of economic transformation, the economic structure led by industry will continue to weaken, and accordingly the ecological environment, including the atmospheric environment, will still face severe challenge and pressure [31,32]. Improving air quality is an important part of building the beautiful Zhejiang [33]. Thus, it is important to choose Zhejiang as a study subject to investigate the relationship between its industrial structure and atmospheric environment.

2.2. Data Pre-Processing

The industrial structure and the atmospheric environment data were mainly collected from the Zhejiang Statistical Yearbook (2007–2018) [34], Zhejiang Natural Resources and Environment Statistical Yearbook (2007–2018) [35], Zhejiang’s prefecture-level cities’ Statistical Yearbook (2007–2018), and the National Economic and Social Development Bulletin (2007–2018). A few additional data were acquired from Zhejiang’s and 11 cities’ Environmental Quality Bulletin, as well as related official websites. Considering Particulate Matter2.5 (PM2.5) ground monitoring in various cities was implemented only after 2012, and long-term sequence results of PM2.5 quality monitoring were missing, we chose satellite remote sensing data to replace ground monitoring data [36]. As PM2.5 was one of the pollutants most concerning to the public, although PM2.5 mass concentration of satellite monitoring might be lower than that of the actual ground monitoring, it would make the atmospheric environment system more scientific and reasonable by supplementing PM2.5 mass concentration as an indicator datum.
In order to eliminate the influences of different indicators’ magnitudes, dimensions, and characters, the data were normalized by Equations (1) and (2) [4,26,28].
For the positive indicators:
X i j = x i j min x j / ( max x j min x j ) ,
for the negative indicators:
X i j = max x j x i j / ( max x j min x j ) ,
where x i j refers to the value of indicator variable x, indexed by j, in year i; max x j and min x j denote the maximum value and minimum value of indicator x j in overall years, respectively. After calculation, the Xij values were normalized in the range of [0,1].

2.3. Methods

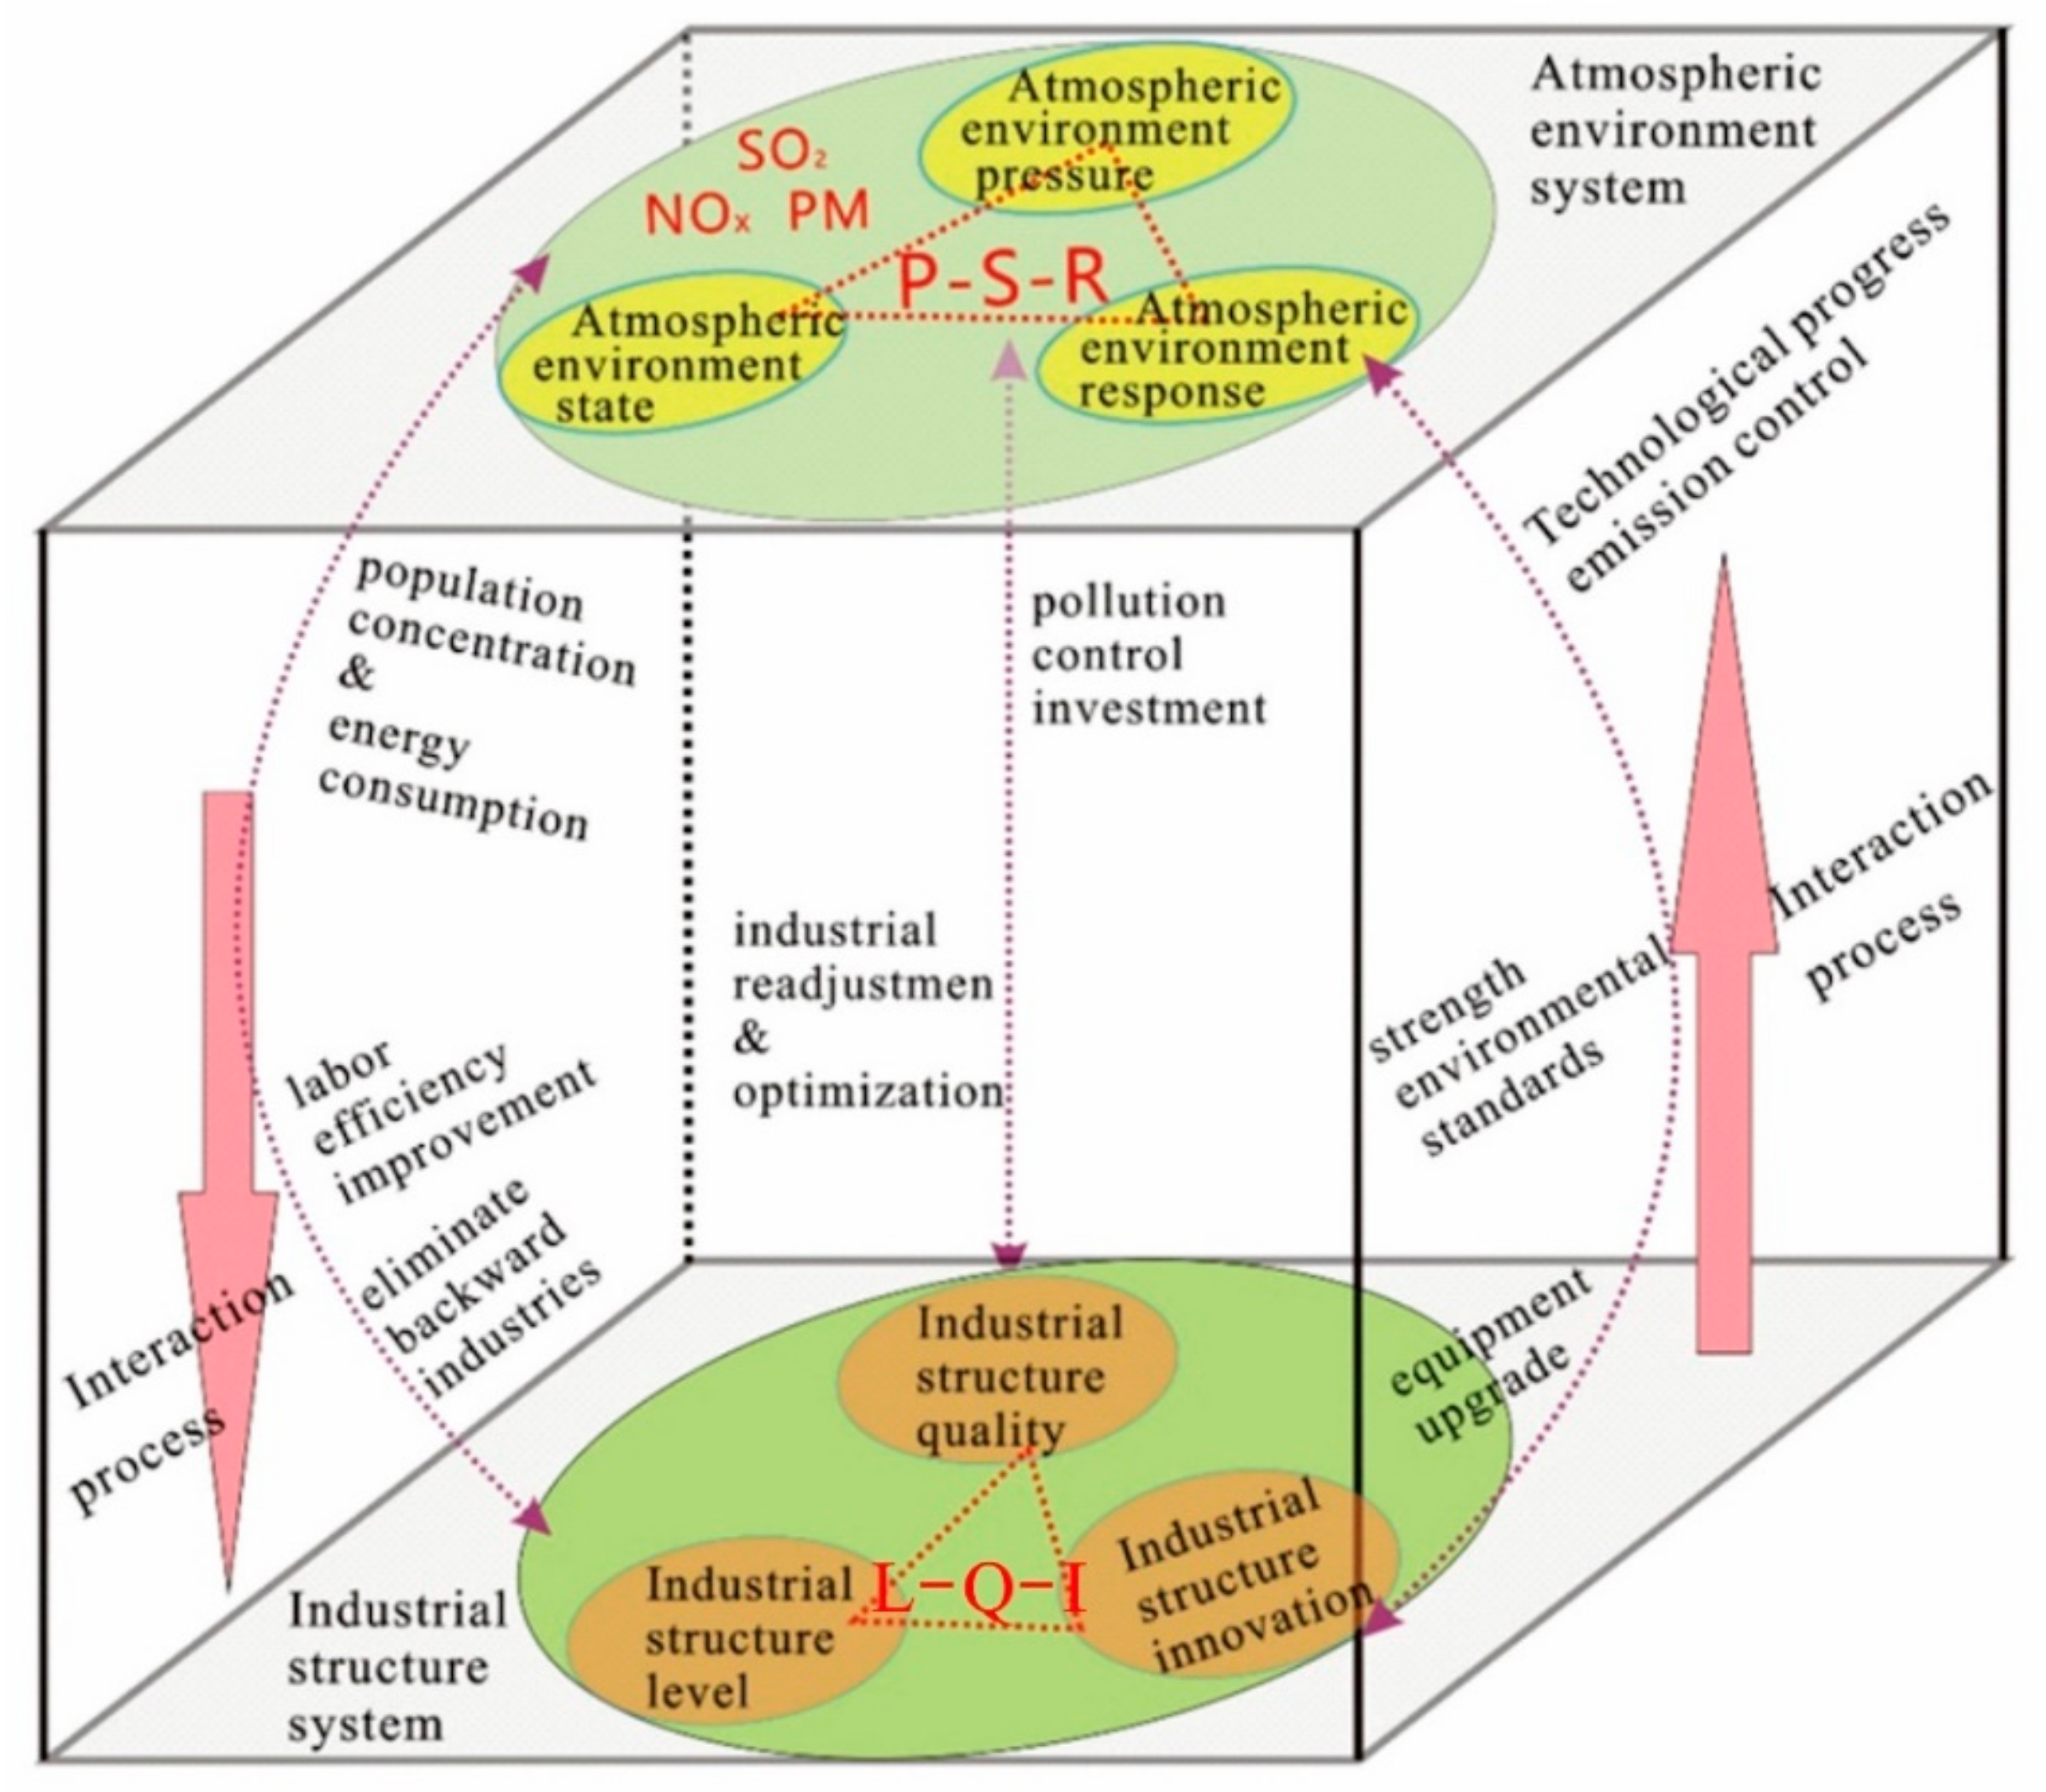
2.3.1. Theoretical Framework and Indicator Evaluation System of Industrial Structure and Atmospheric Environment system

Existing studies pointed out that the relationship between urban economic development and air pollution was dialectical, and industrial structure was a linchpin to resolve the contradiction between them and achieve their coordinated development [37,38]. Firstly, the rapid development of industry, especially the secondary industry, would bring pressure to the atmospheric environment system. The aggravation of energy consumption brought about by industrial development is an important factor to increase pollutant emission and worsen air environment quality. In particular, the development of labor-intensive industries or pollution-intensive industries would bring about an increase in the intensity of air pollution emissions [6]. With the improvement of the country’s pursuit of environmental quality, in turn, it would force the upgrading of industrial structure, improve labor efficiency, and eliminate backward industries (as shown in Figure 2).
Secondly, the technological innovation of the industry could provide support for the improvement of the atmospheric environment system. On one hand, the upgrading of industrial structure (the proportion of tertiary industry and high-tech industry are increasing), technological progress, and the improvement of labor quality improve the efficiency of resource utilization, which is conducive to the improvement of air quality. On the other hand, if the resource utilization rate is ignored during this process, air pollution would occur. For instance, if heavy industry with high pollution and high energy consumption became the dominant industry economy, it would inevitably bring high emissions of waste gas, which would aggravate industrial air pollution and damage the atmospheric environment. In turn, the damaged atmospheric environment would no longer provide a free place for the emission of waste gas, resulting in the limitation of industrial emissions and an increase of environmental costs, which would further restrict the development of the industrial economy. Furthermore, with effective environmental regulation means, new technologies could be developed to create high and new technology industries of energy conservation and environmental protection, thus forcing the transformation of the industrial structure.
Thirdly, the strengthening of air quality standards and management requirements could have an effect on industry types and regional distribution. For example, as air quality standards become more stringent, local government has to reform and close high-pollution industries, increasing investment in industrial pollution emission control. At the same time, the deterioration of air environment quality could affect the labor production efficiency, capital entry, and industrial output to a certain extent.
In all, industrial structure, as an important bridge connecting human economic activities with the atmospheric environment, could control the consumption of resources and the generation of air pollutants through the optimization and upgrading of industrial structure. With further improvement of the atmospheric environment system, a beautiful and livable environment would also become an important factor to attract highly skilled talents, which would undoubtedly contribute to the regional talent aggregation, technological innovation, and industrial structure upgrading.
Referring to previous research results [26,28] and combining the principles of scientificity, systematization, integrity, and accessibility of indicator variables, we finally built the integrated indicator system in Table 1 and Table 2, below. Compared with the existing study [4], which only included industrial output and industrial investment in the industrial system, we comprehensively considered the content of three dimensions of industrial structure—level, quality, and innovation (LQI)—and 12 indicators were screened out (Table 1). Industrial structure level reflected the overall economic situation and the proportion of secondary and tertiary industries; industrial structure quality reflected the characteristics of industrial upgrading, including investment optimization, technological improvement, and energy consumption reduction; industrial structure innovation reflected the ability of industrial independent innovation. Considering that construction dust and industrial pollution emissions might worsen the air environment, we set the indicators of the proportion of the secondary industry and proportion of secondary industry investment as a negative effect at the level of industrial structure. At the same time, based on the pressure–state–response model, we constructed the atmospheric environment system with 12 indicators (Table 2). Among them, atmospheric environment pressure reflected the emission level of atmospheric pollutants and the pressure and impact brought by them; atmospheric environment reflected the quality of atmospheric environment, and the PM2.5 index was added to the level of atmospheric environment state; atmospheric environment response reflected the control level and improvement measures of air pollution.
In order to overcome the informational overlap between multiple index variables and the subjectivity of artificial weight determination, we adopted the Structure Entropy Weight (SEW) method and the Mean Squared Deviation (MSD) method to analyze the indicators’ comprehensive weights. The basic principle of the SEW method was to rank the importance degree of each indicator and then use the entropy method to quantitatively analyze the uncertainty of the typical order [28,39,40,41]. The MSD method, an objective weighting method, determined the weight according to the relative dispersion degree of the attribute value of each evaluation index [26,42,43]. Combining a subjective method (SEW) and objective method (MSD), a more scientific and reasonable evaluation result could be obtained.
From the above-mentioned references, we found the detailed procedures of the SEW and MSD methods. Then, we calculated the composite index Si for the industrial structure (IS) and atmospheric environment (AE) systems in year i using Equations (3) and (4):
S i = j = 1 t W 3 × X i j ,
W 3 = W 1 × W 2 ,     W 1 = SEW 1 + MSD 1 / 2 W 2 = SEW 2 + MSD 2 / 2 ,
where Si denotes the comprehensive score of the IS and AE system, which is applied to Equations (5)–(9), Xij is the normalized value of each indicator, W1 and W2 denote the average weight of SEW and MSD at the corresponding indicator level, as shown in Table 1 and Table 2. Furthermore, t denotes the number of indexes: t = 12 in the system of IS, as well as in the system of AE.

2.3.2. The Coupling Coordination Degree Model of the IS-AE System

Coupling coordination evaluation is a crucial approach to survey the relevance and coherence among all systems [44]. Coupling, as a concept in physics, refers to the phenomenon of close cooperation and interaction between two or more systems [4,26]. At the same time, coordination is the process of benign interaction and development between systems or among the elements within the system, while coordination degree is a quantitative index to measure the coordination between systems. Combining the concepts of coupling and coordination, a lot of researchers have adopted coupling coordination degree model (CCDM) to measure different systems’ relationships, such as urbanization and the eco-environment system [45,46,47,48], urbanization and the atmospheric environment system [26,49], industrial structure and the eco-environment system [4], socio-economy and the energy environment [50,51], the economy–resource–environment system [52], etc. However, few studies have explored the coupling and coordination relationship between the industrial structure system and atmospheric environment system. Thus, based on the CCDM, the relationship between the two systems was proposed, and the detailed steps were as follows [26,53]:
Step 1, Calculate the coupling degree:
C = 2 × f I × g A f I + g A 2 1 / 2 ;
Step 2, Calculate the comprehensive evaluation index:
T =   θ f I + β g A ;
Step 3, Calculate the coupling coordination degree:
D = C × T ;
where f I and g A denote the comprehensive level of the industrial structure (IS) and atmospheric environment (AE) systems, respectively; θ and β ( θ   > 0 ; β >   0; θ + β =1) stand for the contributions of IS and AE to the entire system. Considering the degree of coupling was not greatly affected by α and β , we determined the value of θ = β = 0.5 [46,47].
D denotes the coupling coordination degree. The larger the D value is, the higher the coupling coordination degree between the industrial structure system and atmospheric environment system. Furthermore, combined with previous studies [4,26,47], the level of CCD could be divided into four stages and ten sub-types, as shown in Table 3.

2.3.3. The Dynamic Coupling Coordination Degree Model

In order to reflect the dynamic coupling of industrial structure and atmospheric environment, we further constructed the dynamic coupling coordination degree model (DCCDM), considering the dynamic and periodic characteristics of the entire system [4,54]. Based on the general system theory, the evolution equations of this compound system were expressed as [45,55]:
A =   d f I d t =   γ 1 f I + γ 2 g A ,     V A =   d A d t ,
B =   d g A d t =   δ 1 f I + δ 2 g A ,     V B =   d B d t ,
where A and B are the evolution states of the industrial structure (IS) system and the atmospheric environment (AE) system under their internal and external factors, respectively; VA and VB denote the evolutionary speed of the IS system and the AE system, as affected by internal and external factors; γ 1 and γ 2 , δ 1 and δ 2 represent the influence coefficients of the system.
In the whole compound system, A and B interact with each other, and each system’s change would lead to the change of the whole system. VA and VBare functions of the evolutionary speed of the whole system; thus, we obtained V = f (VA, VB), where VA and VB were regarded as control variables. This meant that the coordinated coupling relationship between the IS system and the AE system could be examined by observing the changes in V.
Based on the S-shaped mechanism of sustainable development [56], it could be supposed that the dynamic relationship between IS and AE changed periodically. Therefore, in each cycle, as the changes of V were caused by VA and VB, we could analyze V by projecting the evolution trajectories of VA and VB in a two-dimensional plane. Then, the trajectory of V formed an ellipse in the coordinate system (Figure 3).
The intersection angle between VA and VB satisfied the formula t a n α = V A / V B , thus we got the α as follows:
α = a r c   tan ( V A / V B ) ,
where α denotes the coupling degree, and its value determined the evolutionary state of the whole system and the coupling degree of coordinated development [4,45]. Obviously, in an evolutionary cycle, the whole system would go through four phases: low-grade symbiosis phase (Ⅰ), harmonious development phase (Ⅱ), utmost development phase (Ⅲ), and high-grade symbiosis phase (Ⅳ), as shown in Figure 3a and Table 4.

3. Results and Discussions

3.1. Analysis of the Industrial Structure and Atmospheric Environment Systems

Table 1 and Table 2 displayed index weight coefficients of industrial structure and air environment system, respectively. According to the final weight coefficient in Table 1, it was exhibited that in the second level indicator, industrial structure innovation index (0.358) > industrial structure quality index (0.339) > industrial structure level index (0.304). This implies the innovation and upgrading of industrial structure had the most important influence on the whole industrial structure system. In the primary indicator, the top five index weight coefficients were listed as follows: proportion of research and development (R&D) expenditure in Gross Domestic Product (GDP) (0.108) > Energy consumption per unit of GDP (0.089) > the added value of high-tech industry accounts for the proportion of industries above scale (0.088) > proportion of tertiary industry output to GDP (0.087) > number of patent applications granted (0.086). The five coefficients accounted for 0.458 of the total weight coefficients, reflecting the positive impact of industrial structure innovation, technological progress, and the tertiary industry’s improvement made positive impact on the whole industrial structure system.
In the atmospheric environment system (Table 2), we found that atmospheric environment state index (0.409) > atmospheric environment pressure index (0.316) > atmospheric environment response index (0.275) in the second level indicator. This reflects that the urban ambient air quality had the most important effect on the whole atmospheric environment system, so urban residents had higher pursuit for better living environment and favorable air quality. Furthermore, the top five index weight coefficients were: Particulate Matter 2.5 concentration (0.107) > investment in environmental pollution control (0.099) > volume of smoke and dust emission (0.093) > waste gas treatment facilities of unit industrial output (0.091) > green coverage in built-up areas (0.085), which accounted for 0.475 of the total weight coefficient. This indicates that PM2.5 as a primary pollutant made a huge impact on urban air environment system, and the air pollution control and treatment played a positive and important role in the whole atmospheric environment system.

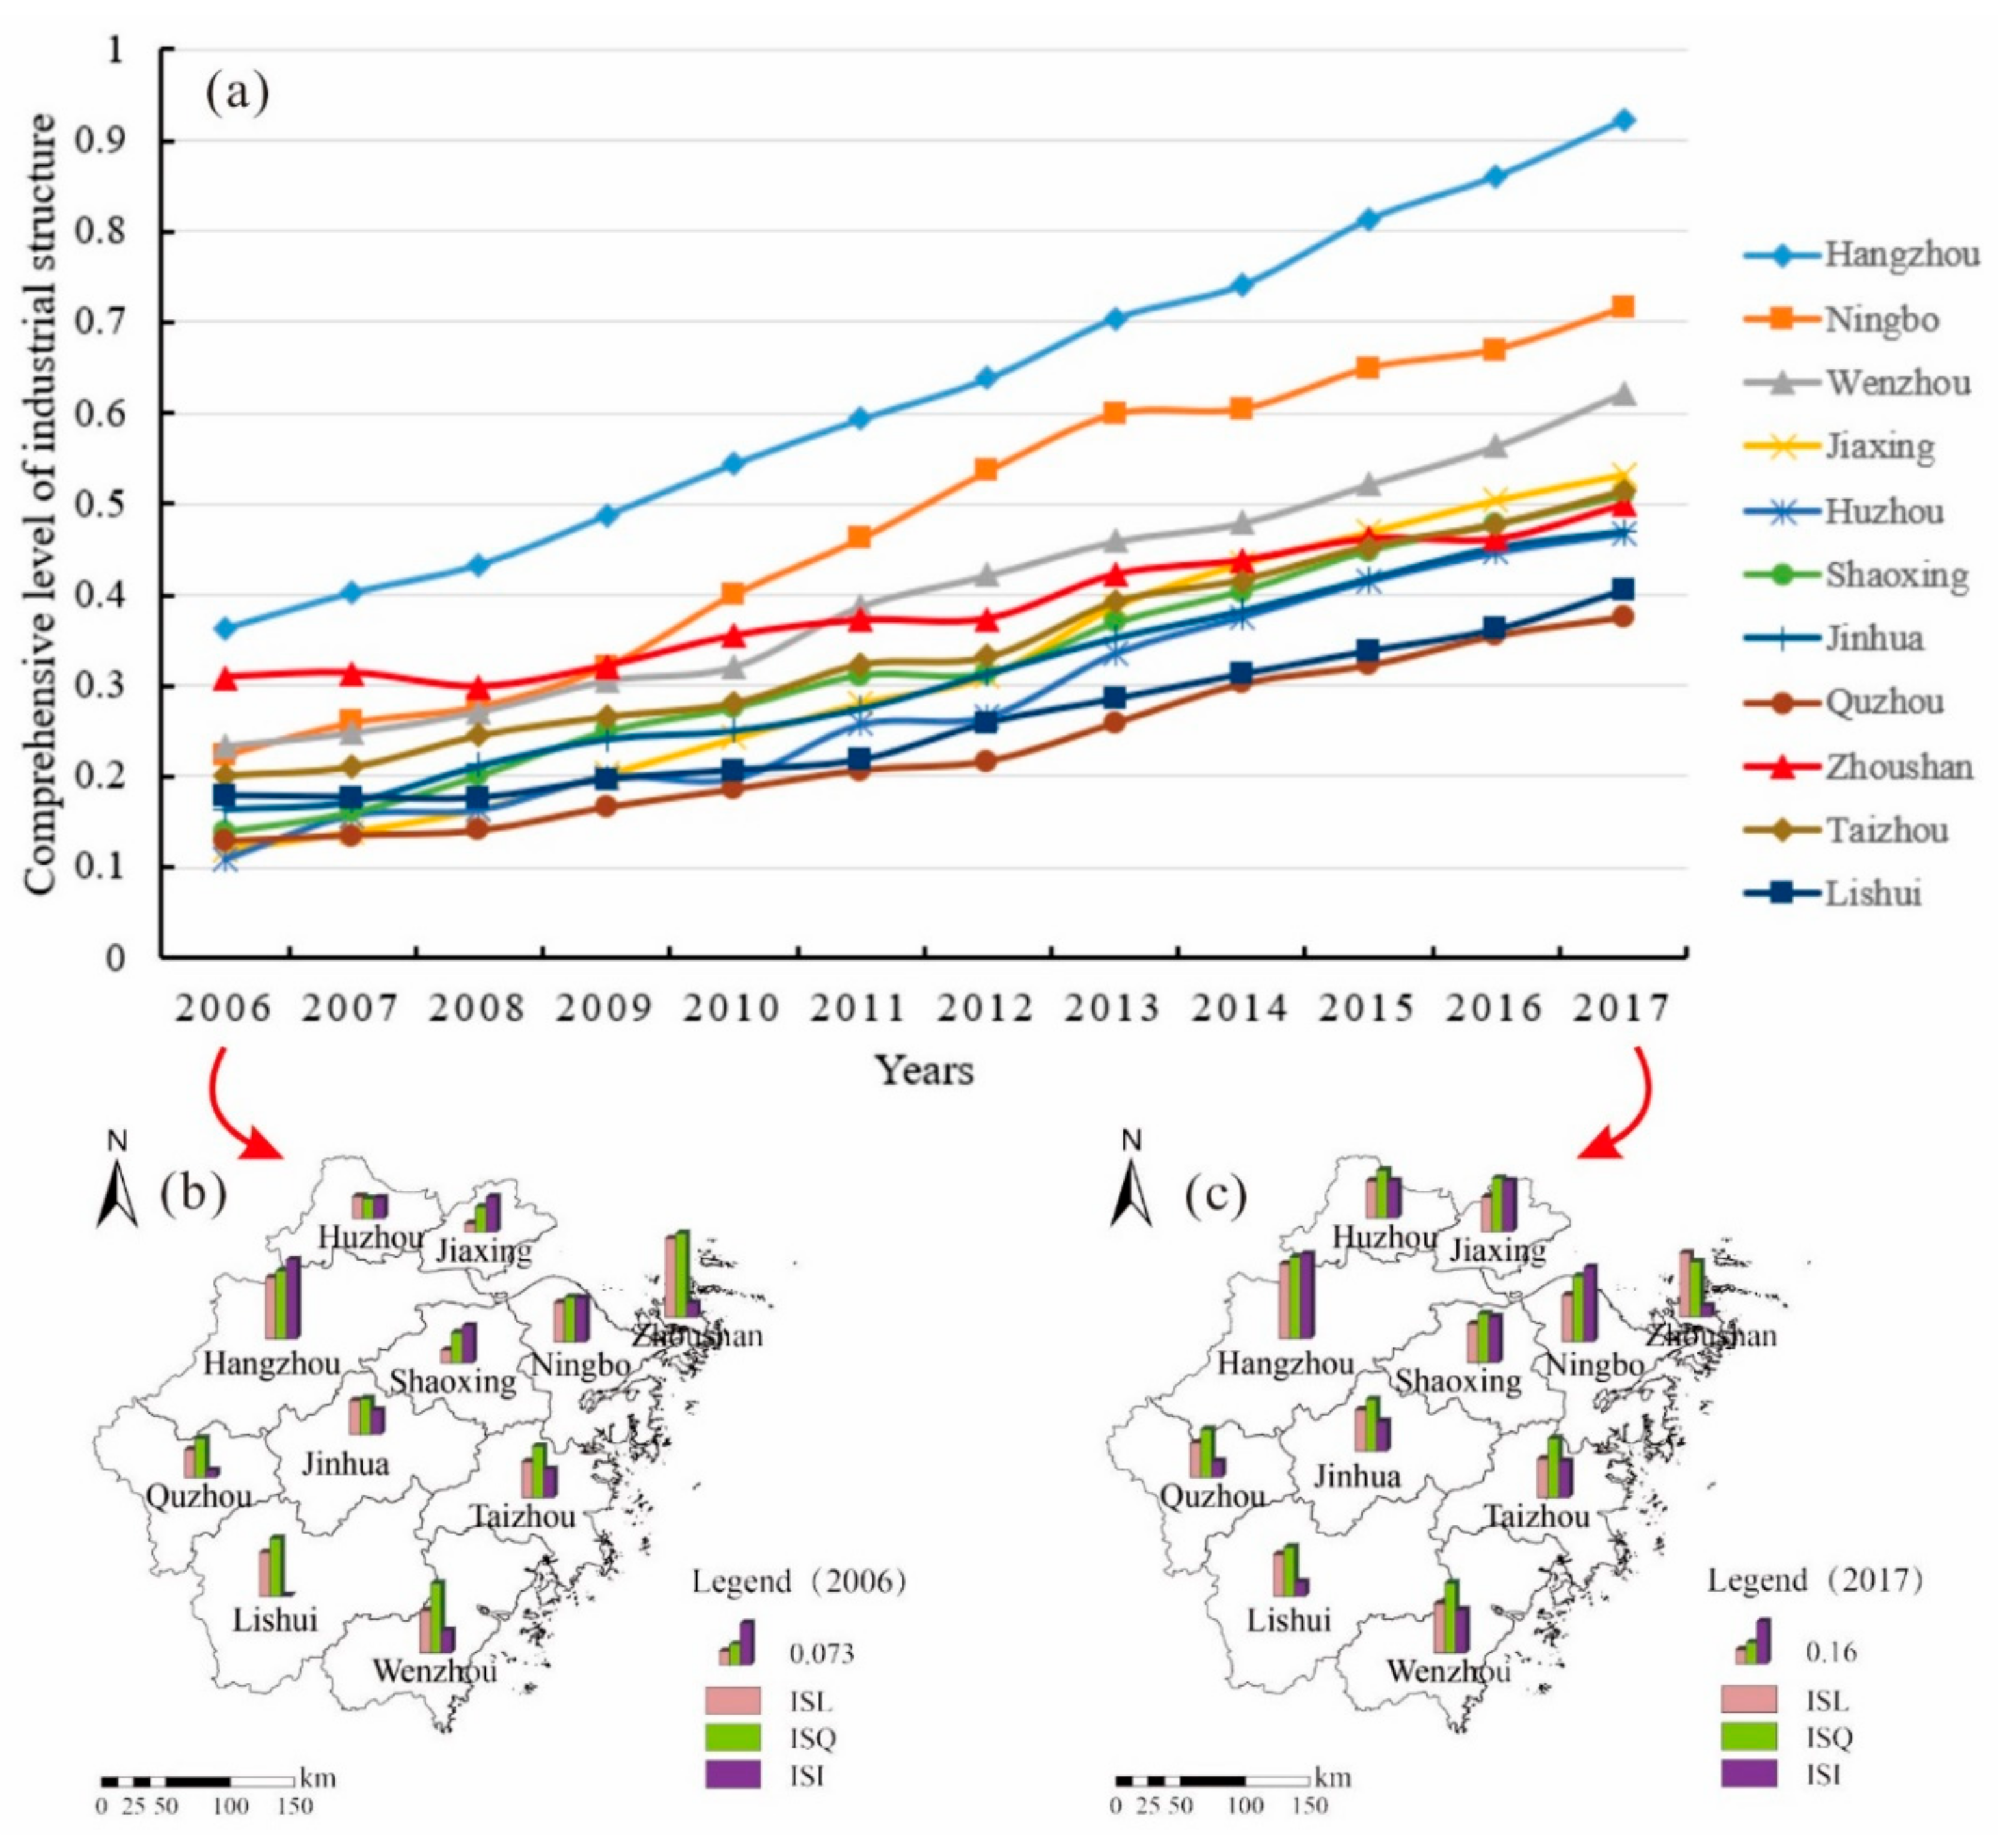
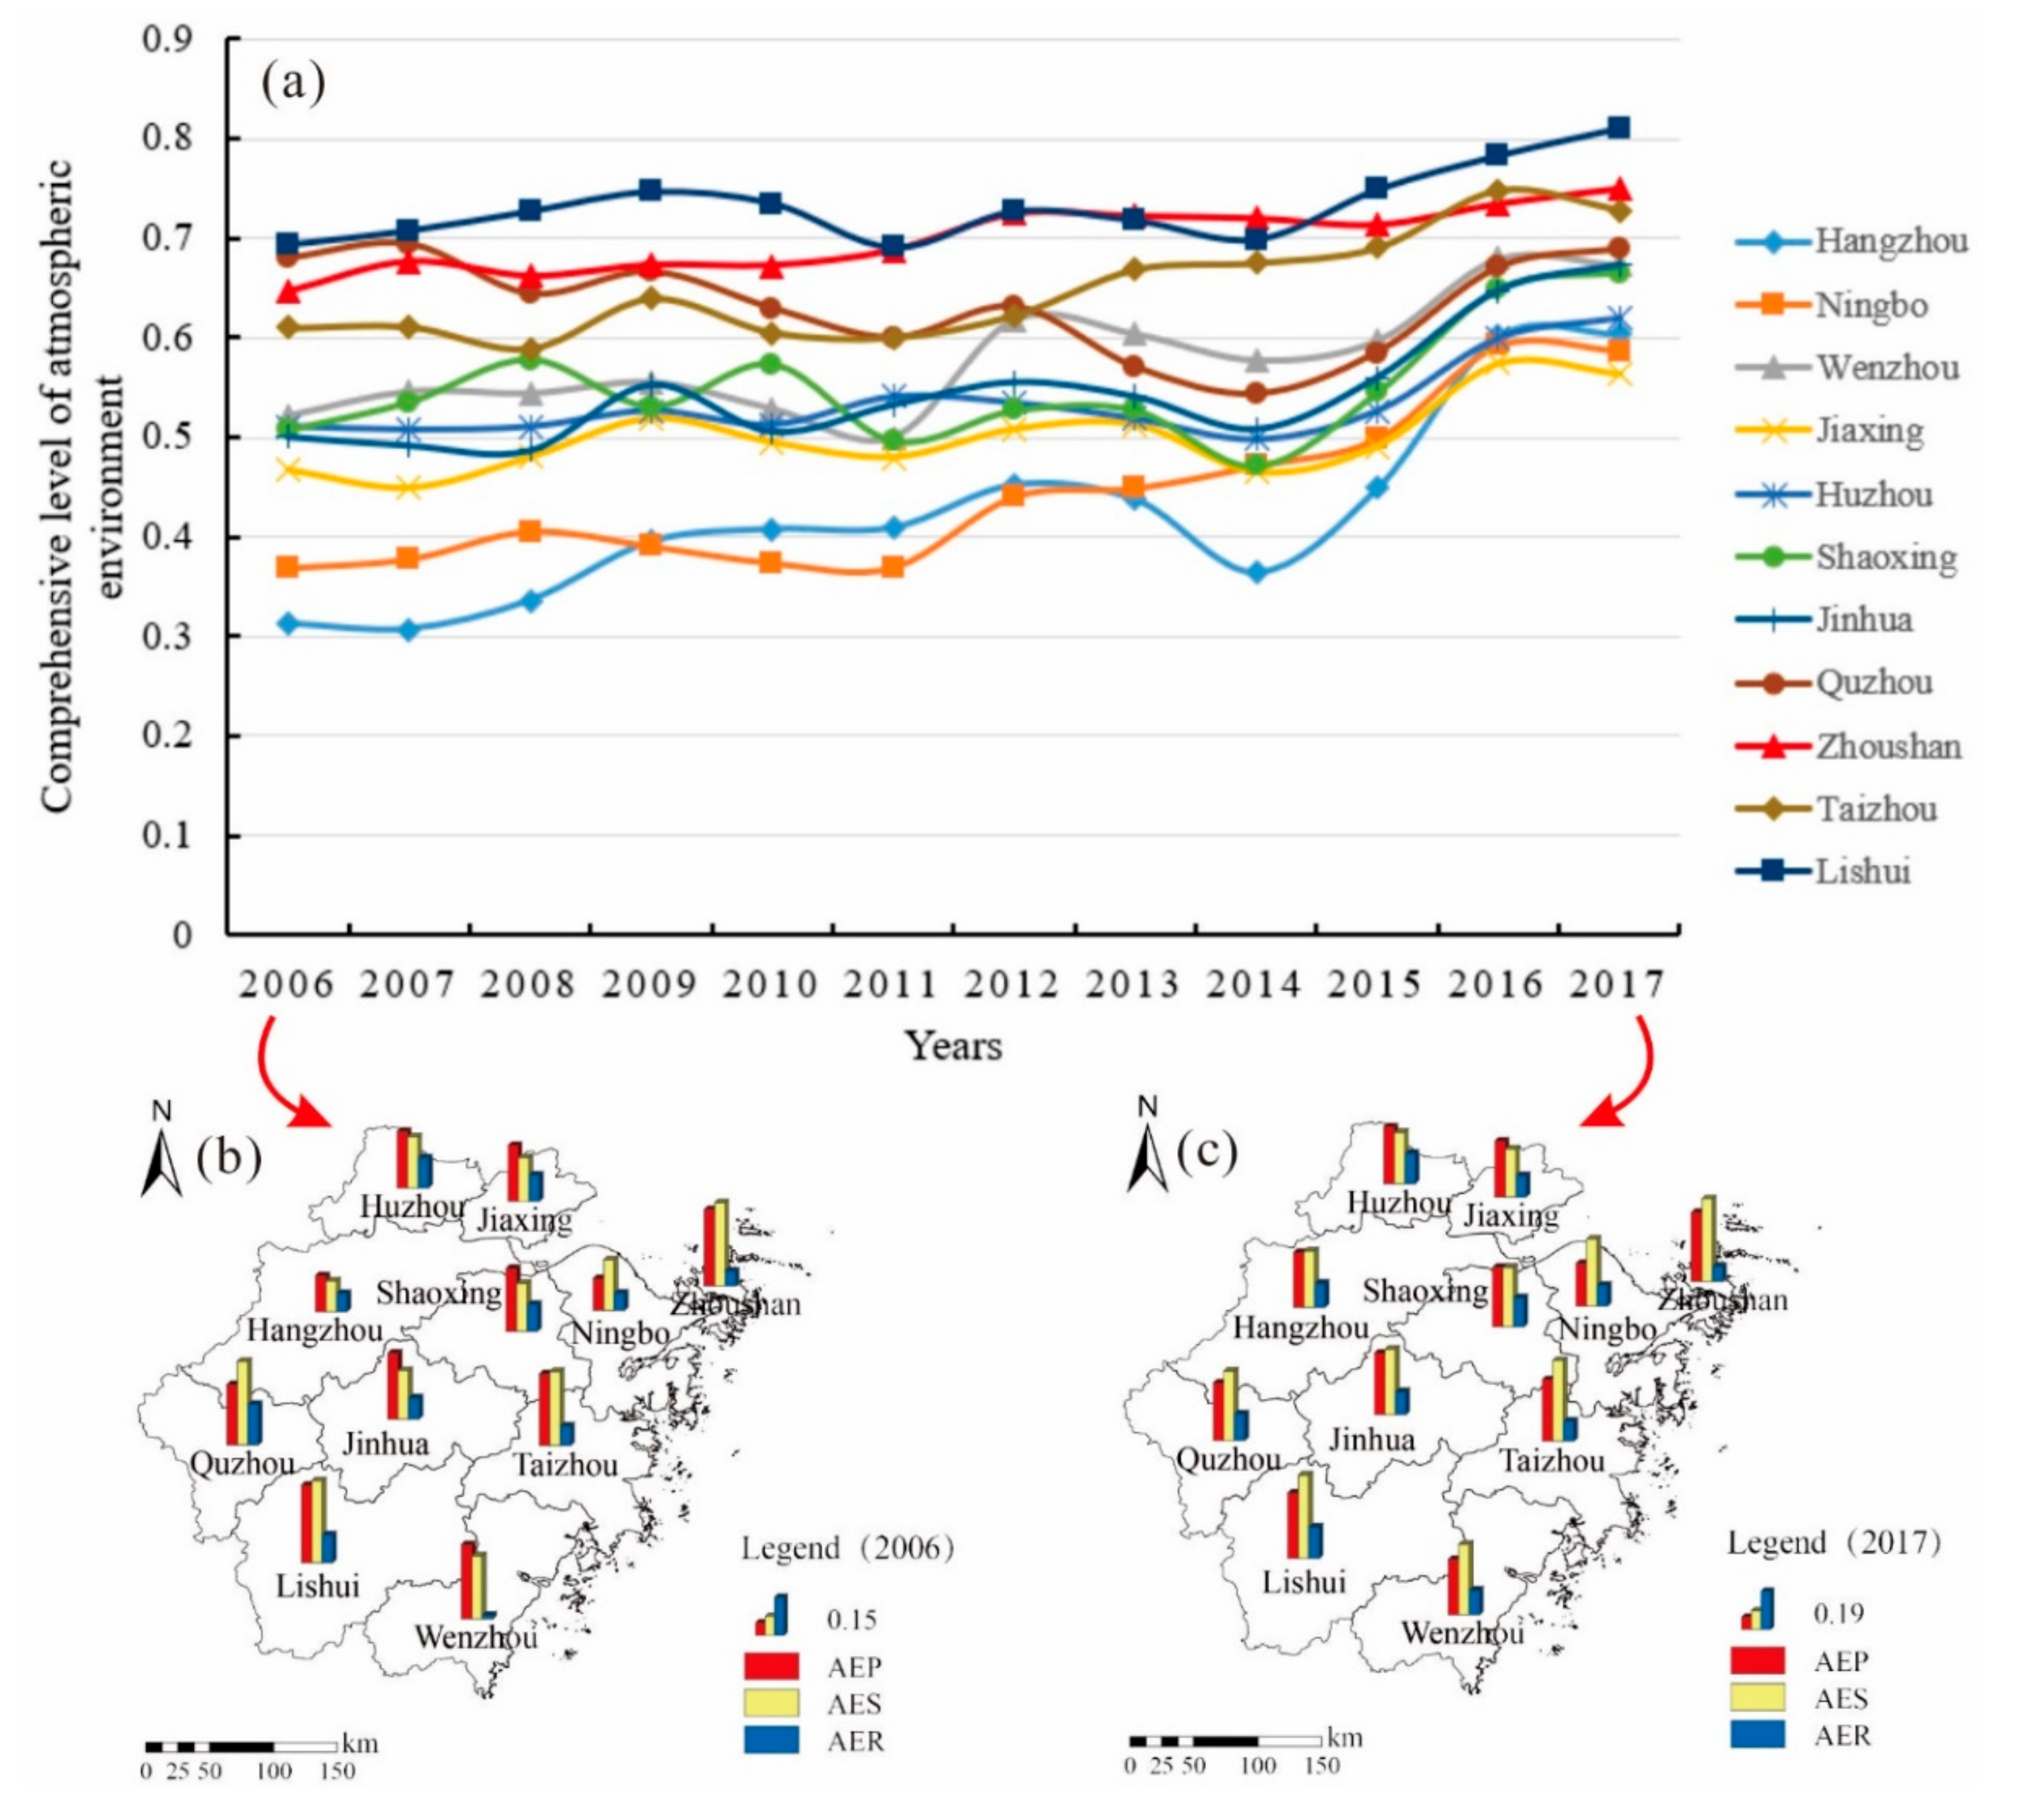
3.2. Variations of Comprehensive Level of Industrial Structure and Atmospheric Environment Systems

According to Equations (3) and (4), we got the final comprehensive scores of industrial structure and atmospheric environment system of the 11 prefecture-level cities in Zhejiang from 2006 to 2017, as seen in Figure 4 and Figure 5.
From 2006 to 2017, the comprehensive level of the industrial structure system of 11 cities displayed a trend of stable increase (Figure 4a). Among them, Hangzhou, the provincial capital in Zhejiang, was the highest, increasing from 0.363 in 2006 to 0.922 in 2017, with an average annual growth rate of 8.88%. In recent years, Hangzhou has pushed deeper reconciliation of the Internet, big data, artificial intelligence, and the real economy, promoted deeper integration of advanced manufacturing and the modern service industry, accelerated the transformation of old growth drivers, and promoted the continuous upgrading of industrial systems [58]. Thus, Hangzhou had the highest score of industrial structure innovation subsystem in Zhejiang (Figure 4b,c). Quzhou, which had the lowest industrial structure score, increased from 0.128 in 2006 to 0.375 in 2017, with an average annual growth rate of about 4.45%. The 12-year average ranking score of each city from high to low was: Hangzhou > Ningbo > Wenzhou > Zhoushan > Taizhou > Shaoxing > Jiaxing > Jinhua > Huzhou > Lishui > Quzhou. At the same time, the ranking results of cities in different years also varied. It was noteworthy that Zhoushan, an island city, had a high comprehensive score in industrial structure, ranking fourth in the whole province, mainly due to its developed tertiary industry (tourism dominated), lower secondary industry, and energy consumption. It was incorporated into the National New Area Construction in 2011, which had mainly developed the blue ocean economy and high-tech industries [59].
Similarly, as shown in Figure 5, the comprehensive level of atmospheric environment in Zhejiang demonstrated a trend of fluctuation and transition during 2006–2017, which was different from the changing features of industrial structure system. This phenomenon was mainly attributed to the fluctuation of the air environment quality and the instability of pollution control [58]. In general, the comprehensive value of each city was mainly distributed between 0.3 and 0.8, and the change in a single city was not obvious, reflecting that the changing difference was smaller than that of the industrial structure system. The 12-year average ranking of each city’s score, from high to low, was: Lishui > Zhoushan > Taizhou > Quzhou > Wenzhou > Shaoxing > Jinhua > Huzhou > Jiaxing > Ningbo > Hangzhou. Because of the good natural conditions (good vegetation in an island or mountainous city) and less-polluted industrial structures, Lishui and Zhoushan had the highest atmospheric environment scores in Zhejiang, at 0.732 and 0.698, respectively. In contrast, cities with more developed economies and higher levels of industrial development scored lower in the atmospheric environment system, such as Hangzhou and Ningbo. High emissions of atmospheric pollutants and poor air quality were the main characteristics of these cities. Meanwhile, the realization of high-quality regional economic development and the construction of a better ecological environment was also a serious challenge for these cities [28,29].

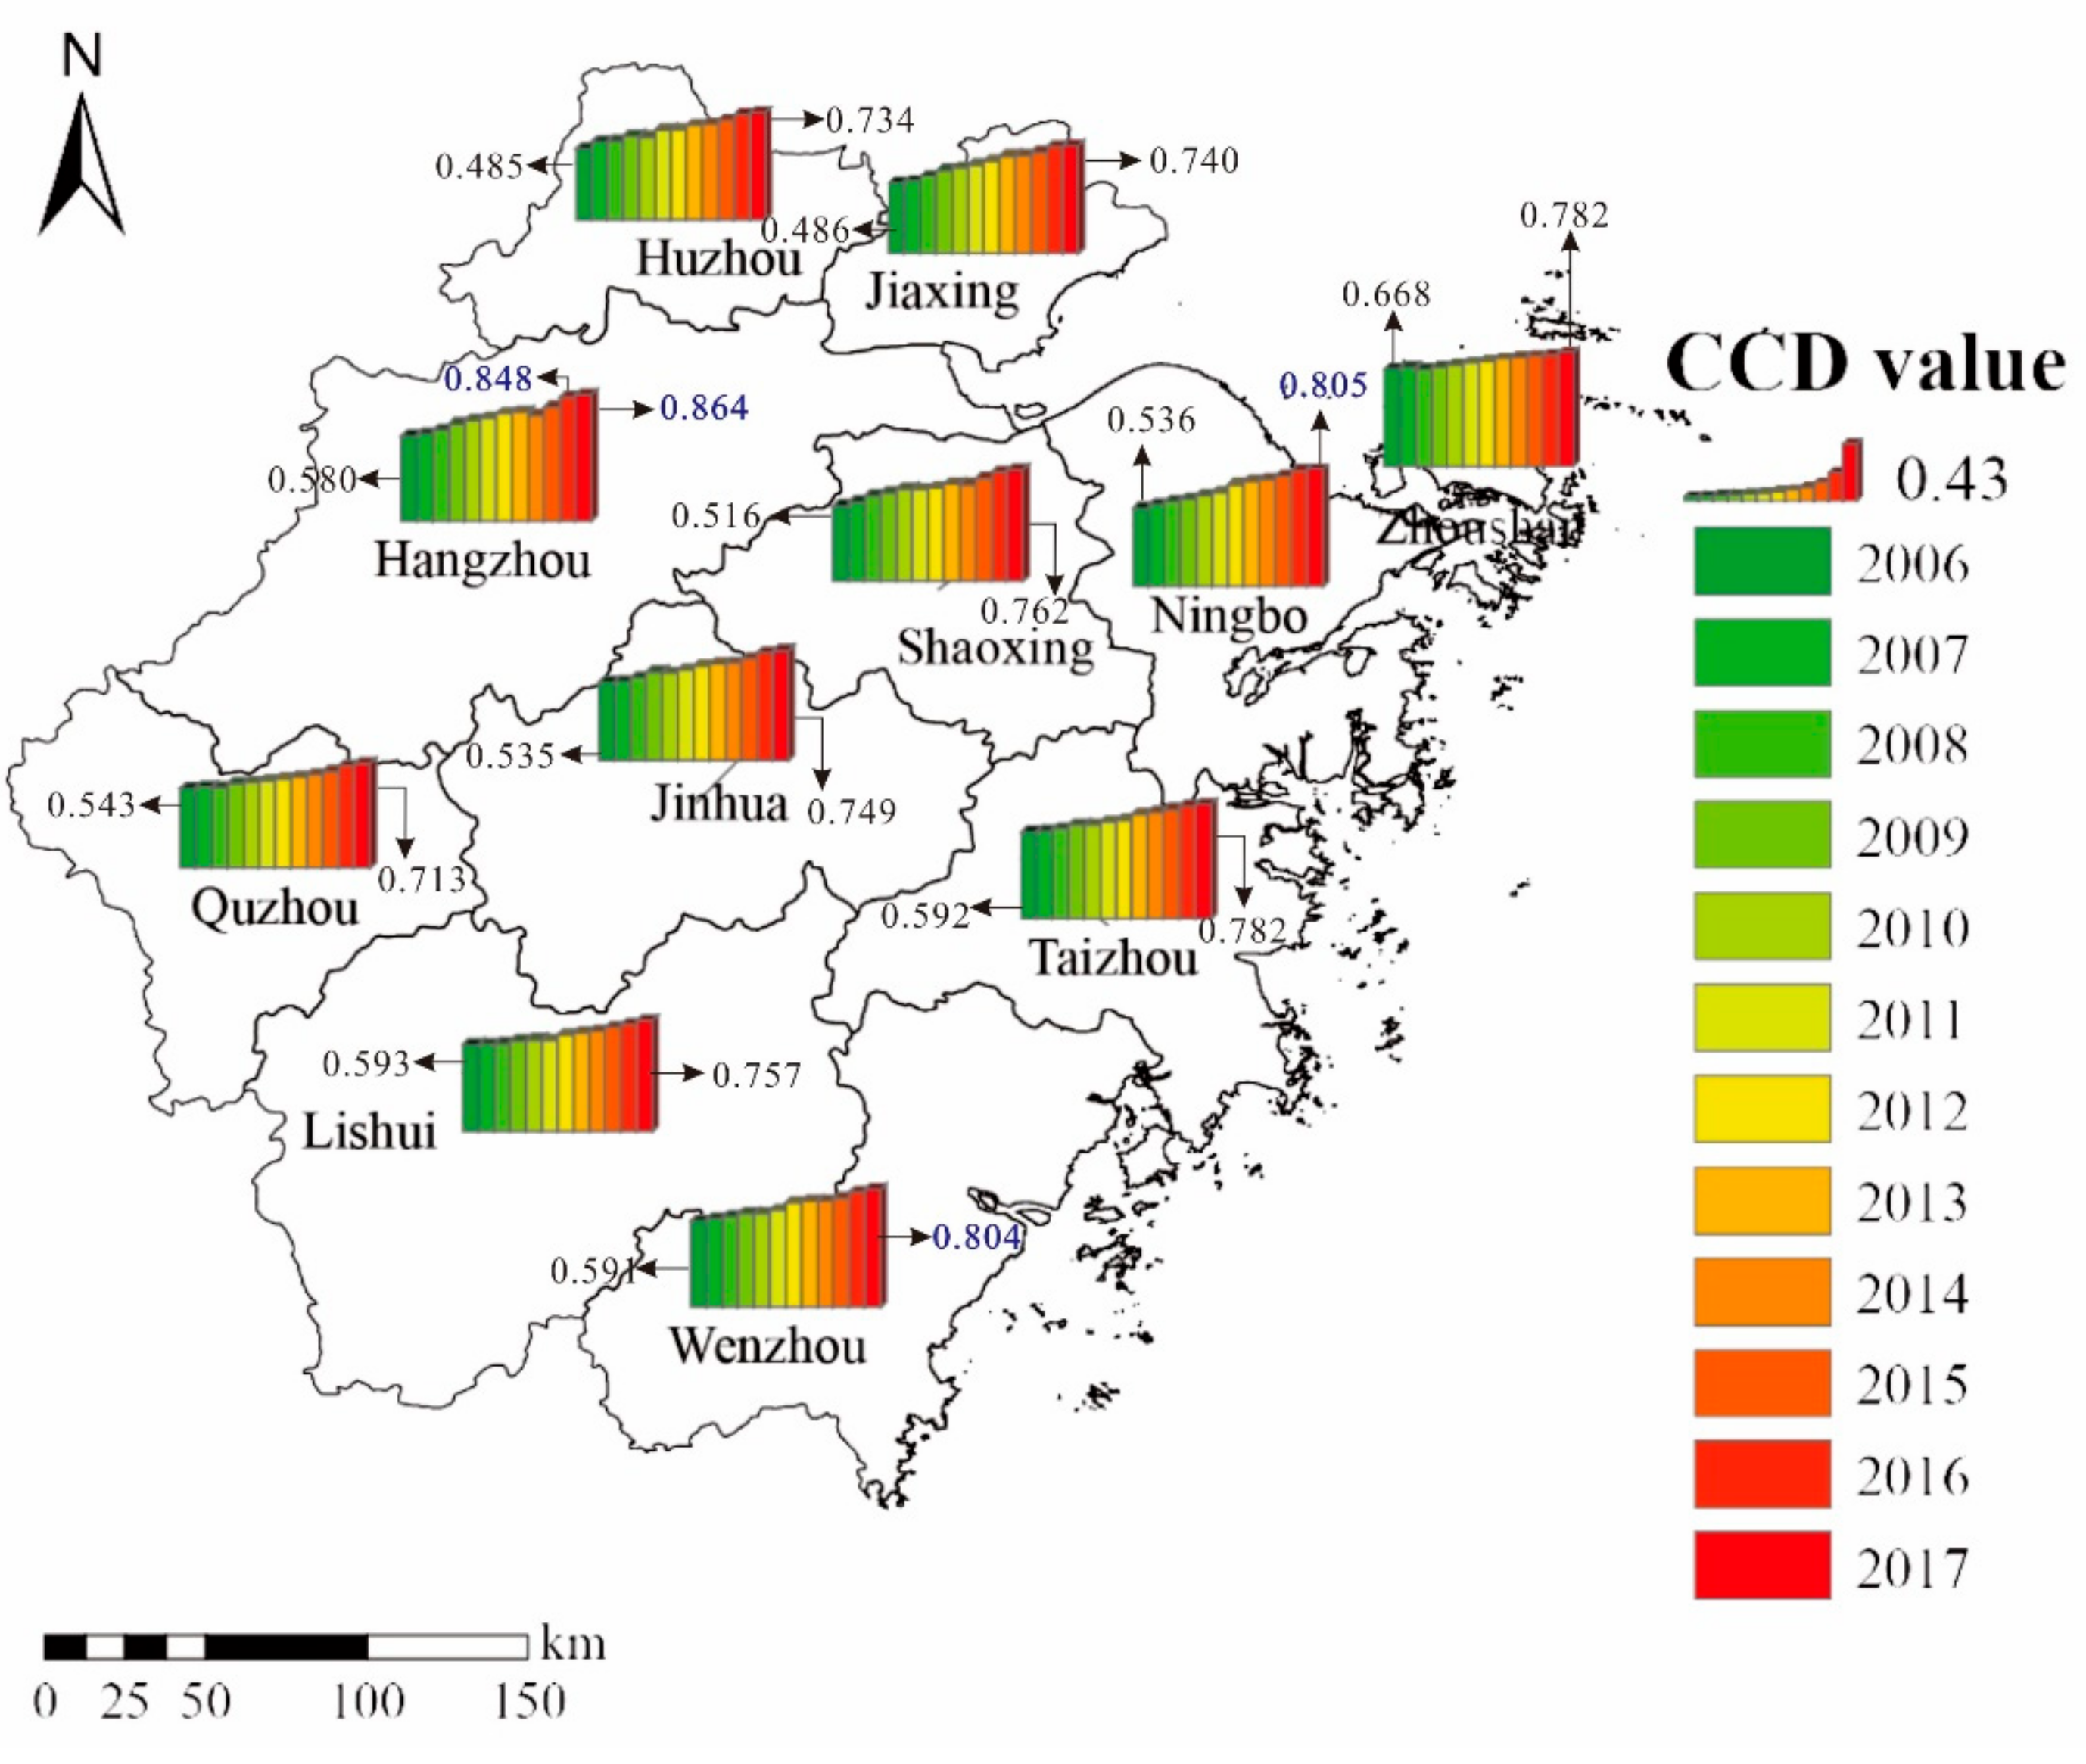
3.3. Variations in CCD of IS and AE Systems

The coupling coordination degree represented the coordinated development behavior of the integrated IS and AE system. Figure 6 shows the spatial distribution of 11 cities by coupling coordination degree type, according to the stages defined in Table 3.
The results showed that:
(1)
There was no serious uncoordinated city in the whole province during 2006–2017, which meant that the relationship between industrial structure and atmospheric environment system in Zhejiang generally maintained a benign development situation. Influenced by the natural environment near the sea, Zhejiang’s overall air circulation was strong and the perennial rain was sufficient, thus the air environment quality of each city was better than that of the whole country. Meanwhile, as a major province of private economy, Zhejiang had been constantly optimizing its industrial structure and gradually developing towards diversification, internationalization, and modernization. The IT industry, electronic equipment, and biological medicine industries had become the main development direction of the secondary industry, and the chemical industry, steel, cement, and other gas-related industries with high pollution had been gradually phased out [60];
(2)
Hangzhou, Ningbo, and Wenzhou took the lead in realizing the transformation from barely coordinated development to superior coordinated pattern, in 2016, 2017, and 2017, respectively. The three cities had the highest levels of economic development in Zhejiang, leading the industrial transformation and upgrading of Zhejiang. Due to the implementation of beautiful Zhejiang construction and air pollution control, the capital input for air environment control in the three cities had been continuously increased, pollutant emission had been gradually reduced, and the effect of air quality improvement had begun to be obvious. The optimized industrial structure and the continuously improved atmospheric environment system embody the superior coordinated pattern;
(3)
Shaoxing, Jinhua, Taizhou, Zhoushan, Lishui, and Quzhou remained at the stage of barely coordinated development. Moreover, the comprehensive level of industrial structure in these six cities was always lower than the atmospheric environment system score. This means that these six cities are facing a more severe challenge of industrial structure upgrading and optimization. For example, Shaoxing, Taizhou, and Jinhua are the leading textile, steel, cement, metallurgy, and power industries in Zhejiang province, the proportion of high-tech industry is relatively low, as well as the research and development (R&D) input and new product output. Therefore, these cities need to make more efforts in optimizing the industrial structure to meet the arrival of the superior coordinated stage [33];
(4)
Jiaxing and Huzhou realized the transformation from slightly uncoordinated development to barely coordinated development after 2007. As shown in Figure 4b, in 2006, the proportion of the secondary industry in Jiaxing and Huzhou exceeded 50%, the proportion of the fixed assets investment in the secondary industry was nearly 60%, and the high proportion of the high-pollution industries, such as chemical fiber, clothing, energy and power, cement and steel aggravated the pollutant emissions. This was the main reason why the two systems were located in a slightly uncoordinated development state. Since the 12th five-year plan, the industrial structure of Jiaxing and Huzhou has been continuously upgraded, the equipment manufacturing industry and strategic emerging industries have been developed rapidly, new energy, new materials, and new technologies have emerged, enterprises with outdated production capacity have been eliminated, pollution emissions have been reduced, and the air environment has been greatly improved [33].

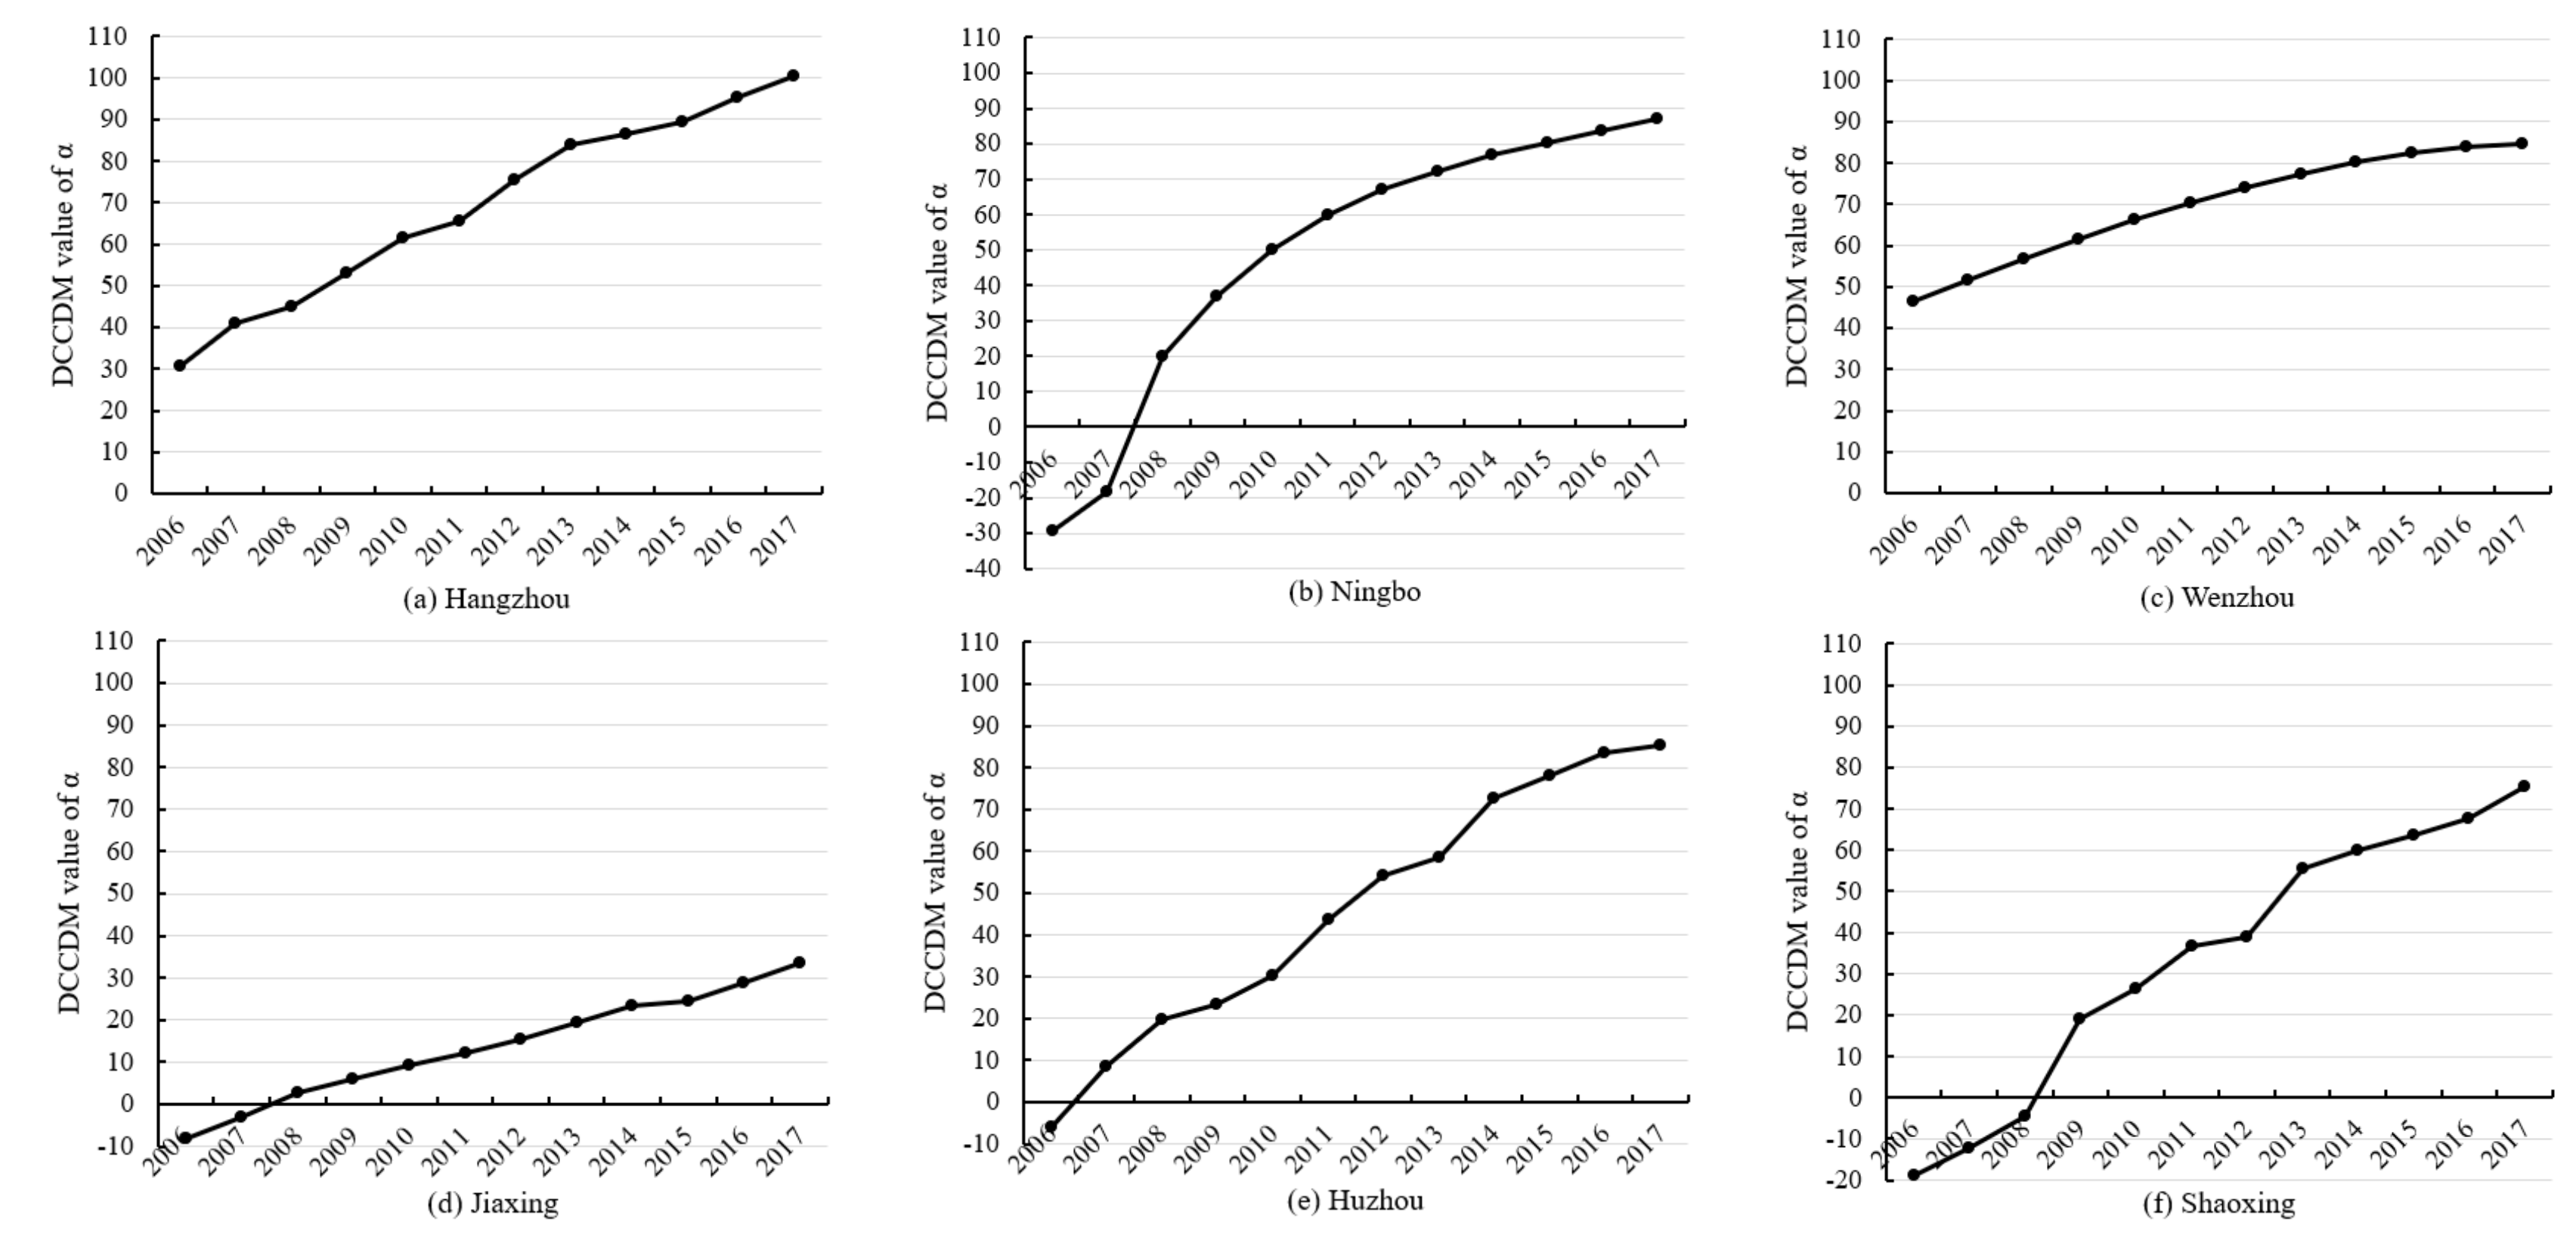
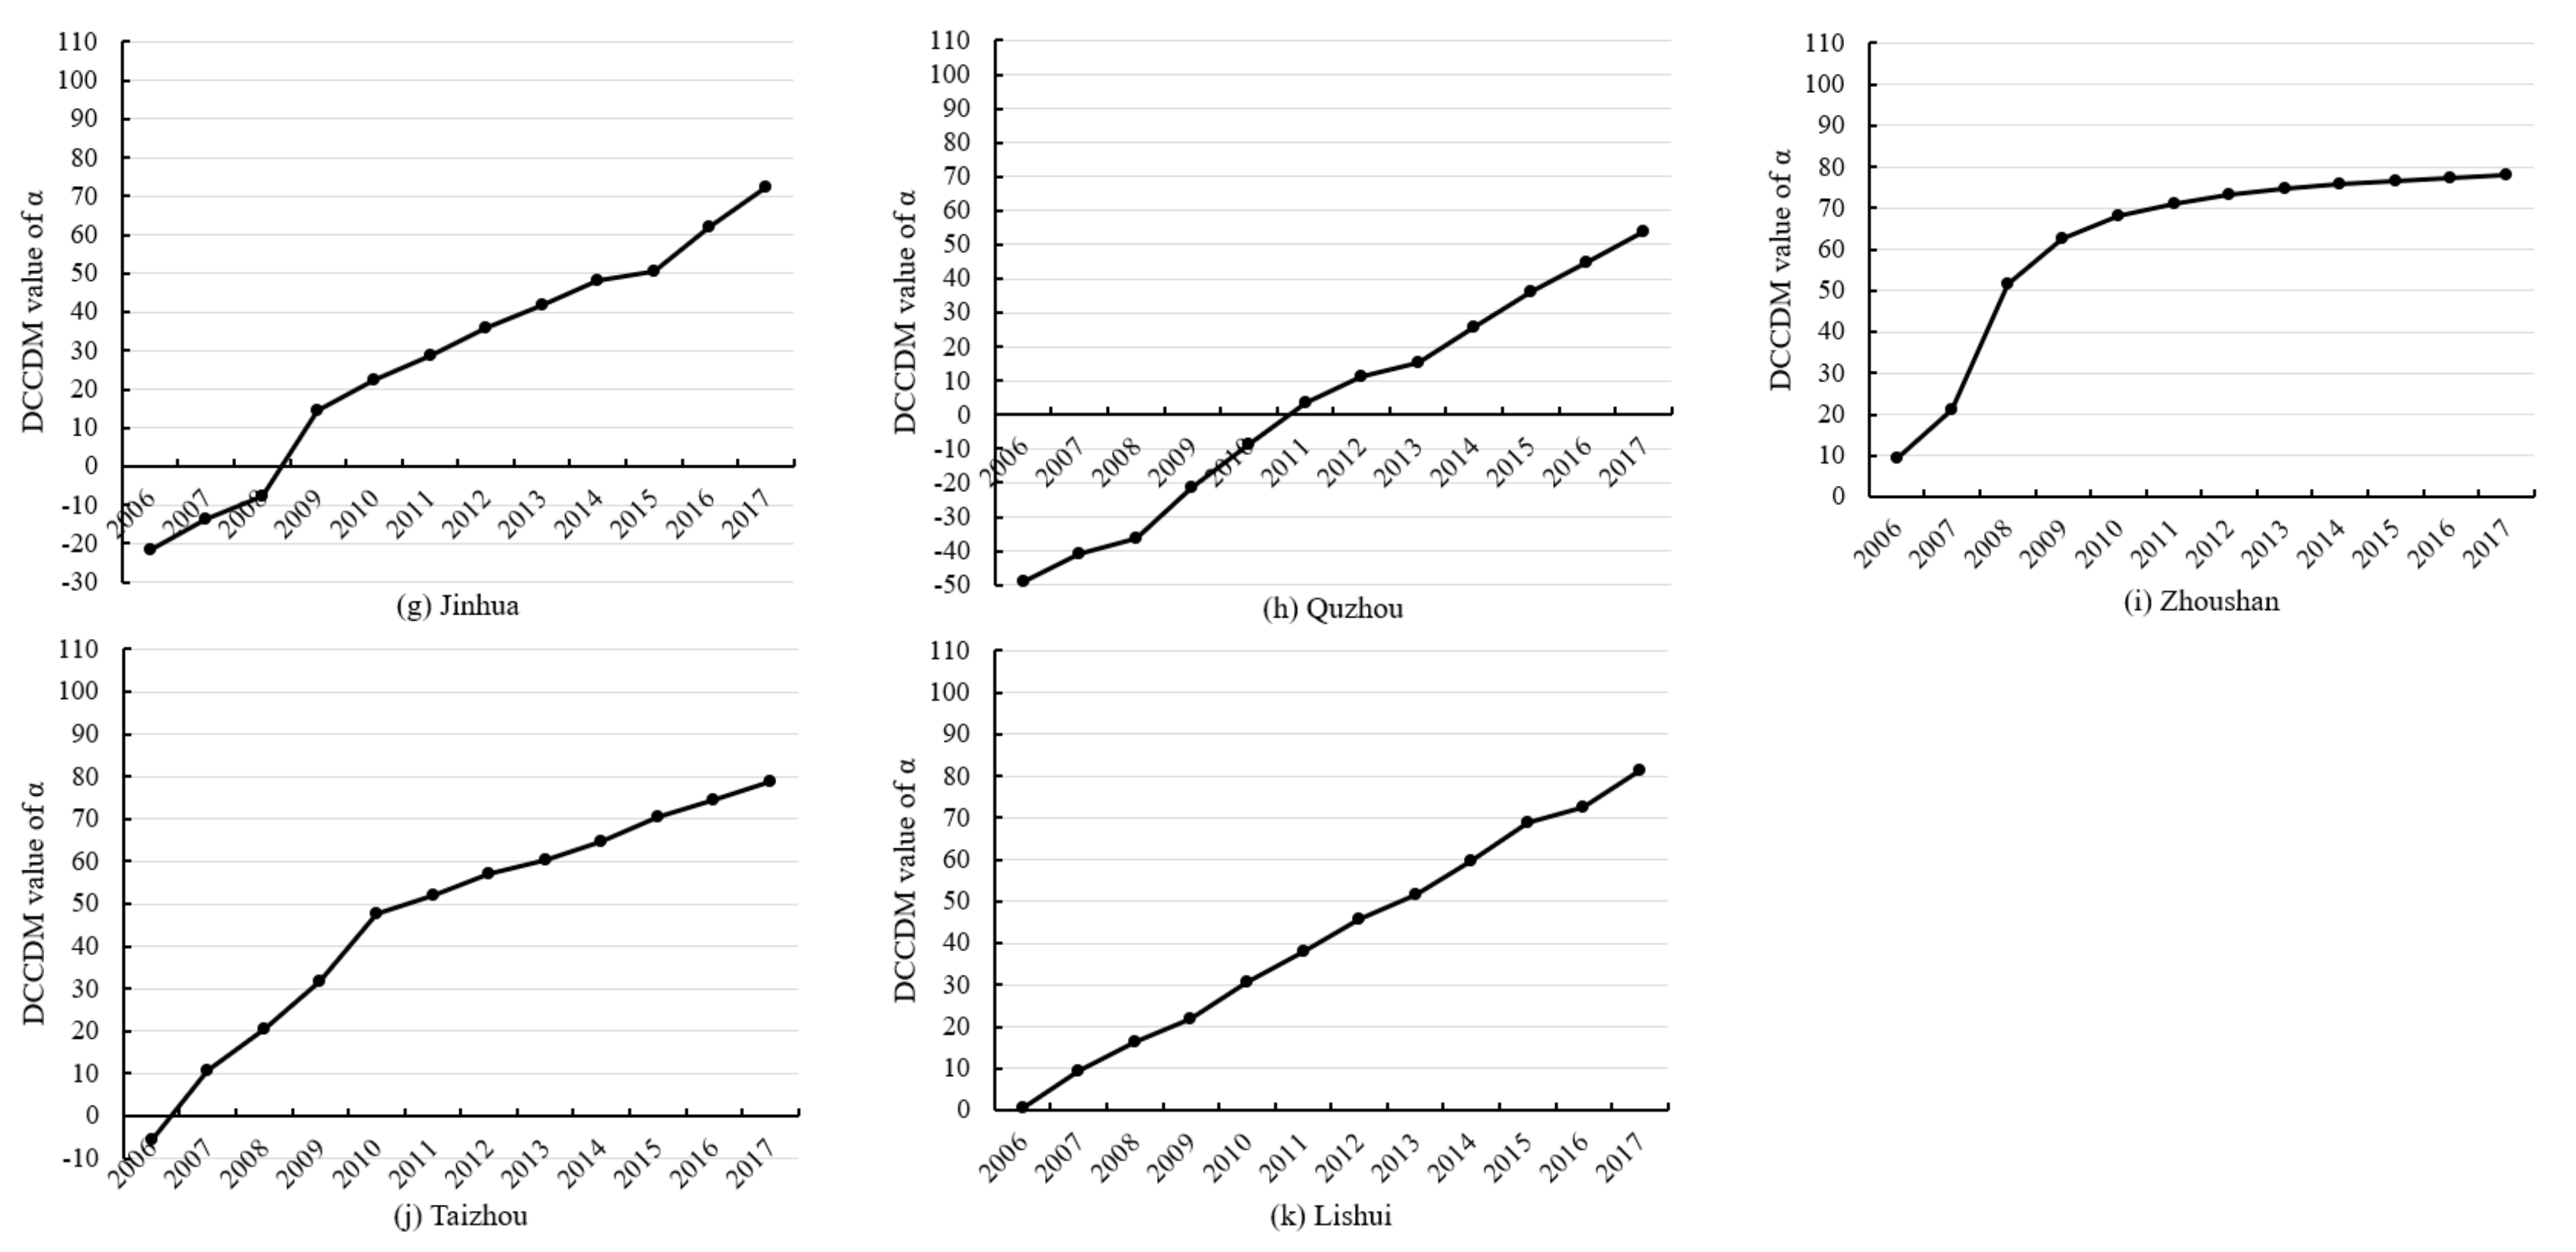
3.4. Variations in DCCD and Evaluation of the Coordinated Pattern

The fitting equations in Table 5 were acquired based on the nonlinear fitting of the scores of comprehensive levels of the IS and AE system of every city in Zhejiang province. VA and VB of the IS and the AE of each city were obtained by calculating Equations (8) and (9) for further processing. Finally, the dynamic coupling coordination degrees of the IS and AE of 11 cities from 2006 to 2017 were obtained through Equation (10). Figure 7 displays the evolution characteristics of dynamic coupling coordination degree of different cities.
As shown in Figure 7, the DCCD phase of 11 cities could be roughly divided into three types:
(1)
Upgraded—utmost development type, only Hangzhou. The phase of DCCD shifted from the harmonious development phase to the utmost development phase after 2016. Since the G20 summit, Hangzhou’s air environment improved drastically, with stricter emissions of air pollutants and more steady improvement in air quality [61,62]. As shown in Figure 5, after 2016, Hangzhou surpassed Ningbo and Jiaxing in the comprehensive score of the atmospheric environment system. Relying on the upgraded industrial structure of the service industry and digital economy industry in Hangzhou, its harmonious relationship between the atmospheric environment system is gradually developing into a positive direction;
(2)
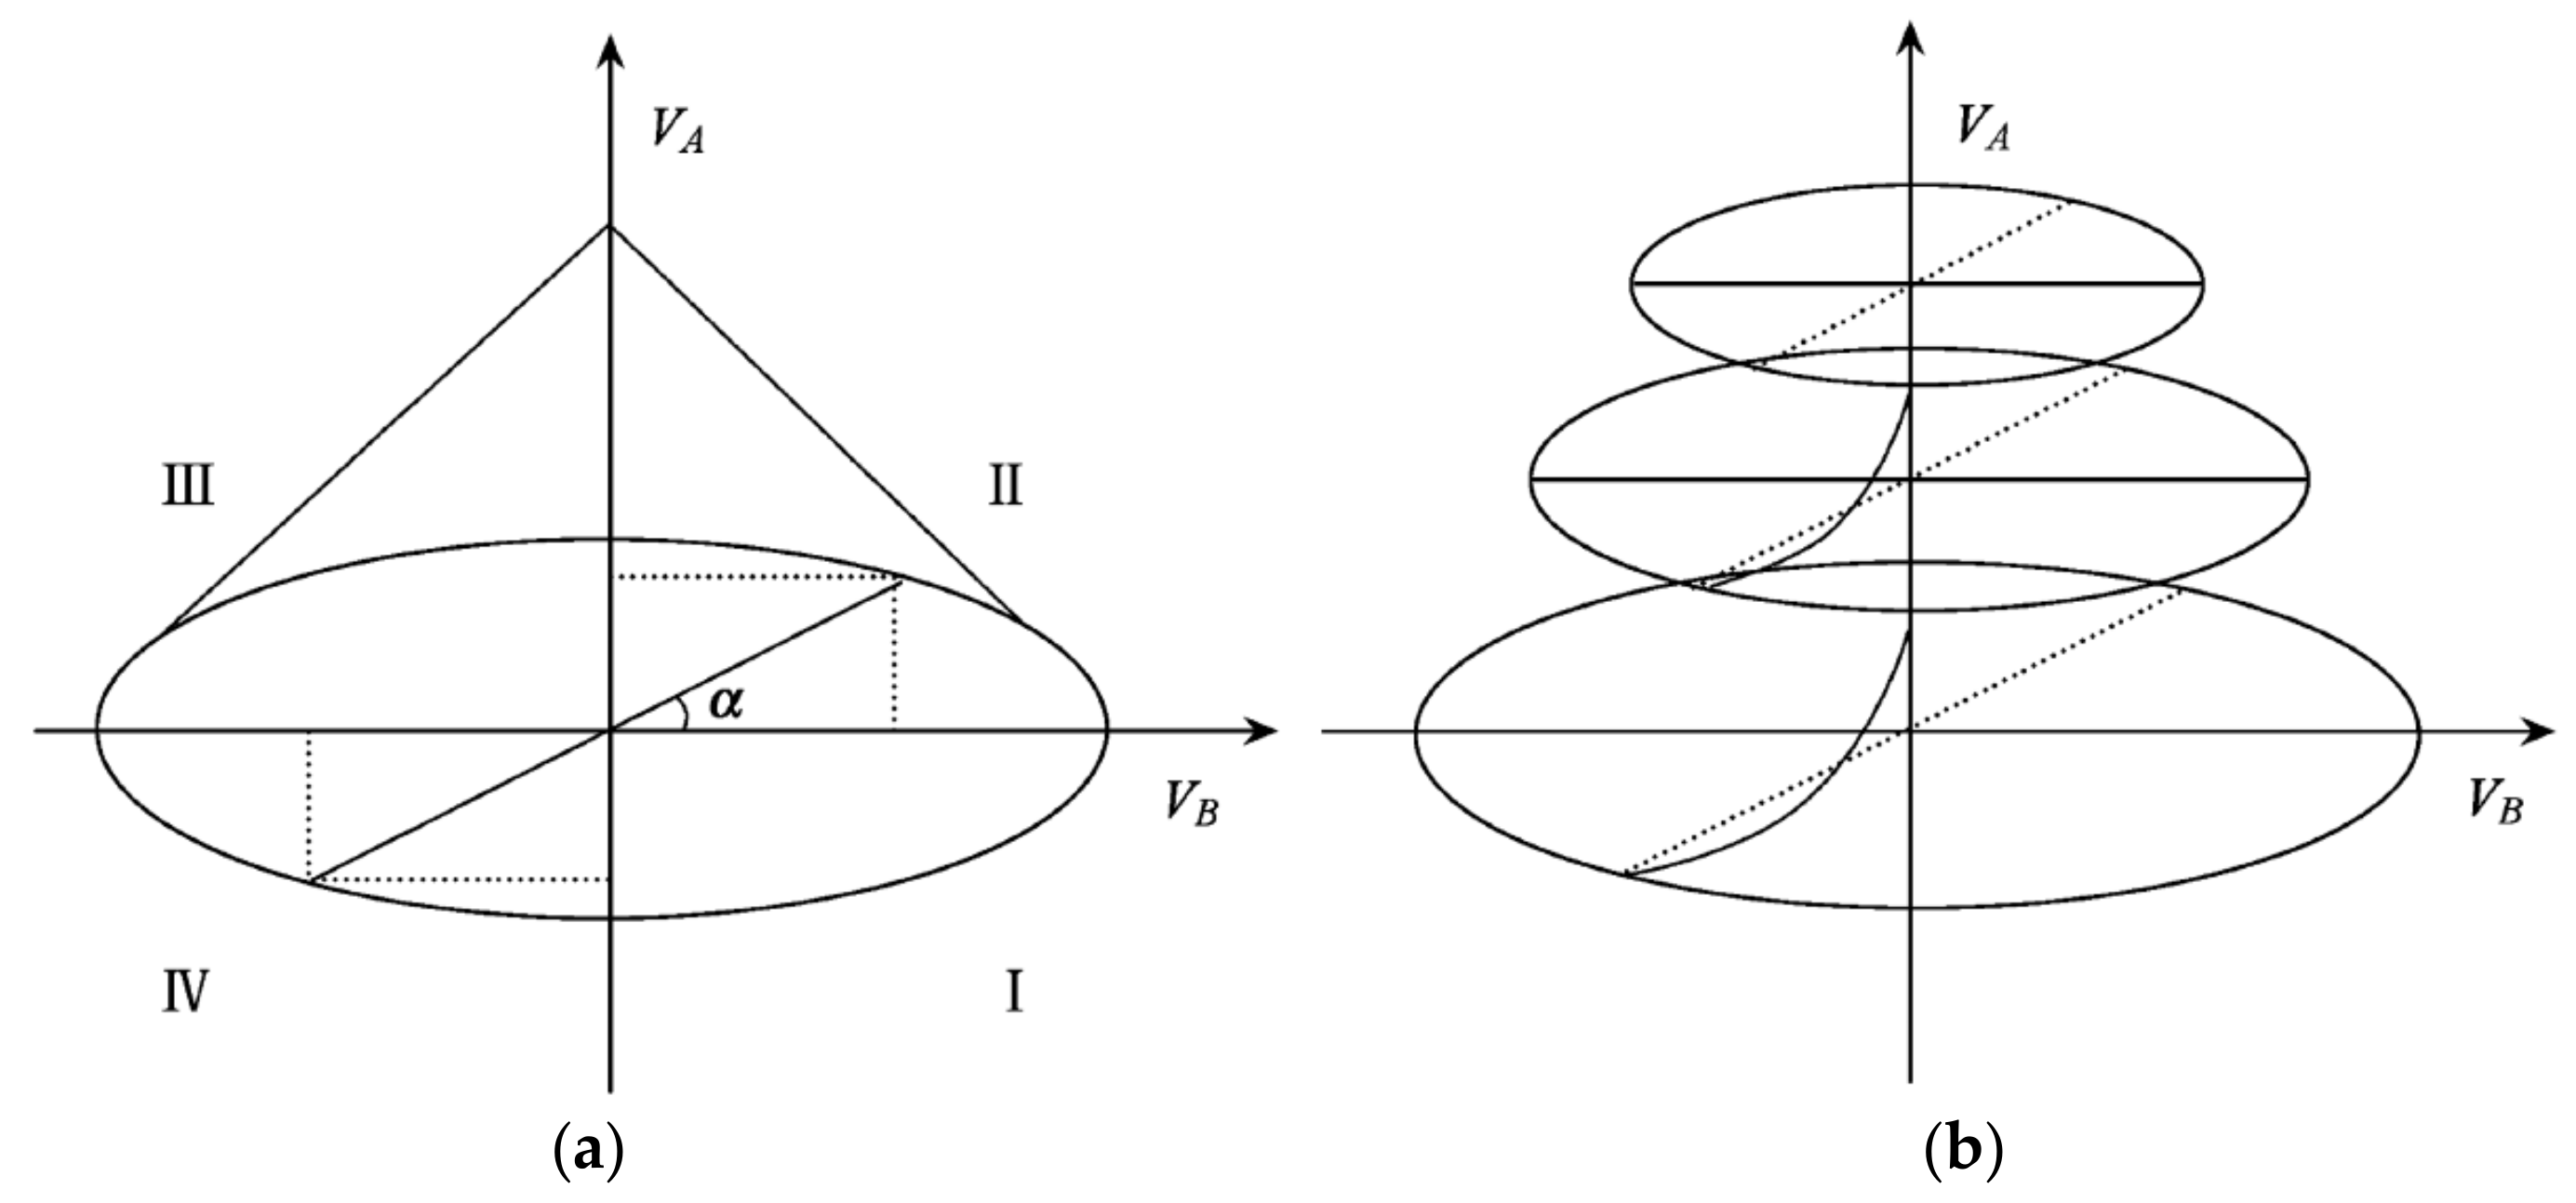
Stable—harmonious development type, including Wenzhou, Lishui, and Zhoushan. These cities are in the stage of harmonious development phase with 0° < α < 90°. With the specific weight of secondary and tertiary industries rising, the contradiction between the transformation process of IS and the AE has become increasingly prominent and intensified [63]. Among them, industrial pollution in Wenzhou is more serious, which has a greater impact on the air environment system. Lishui and Zhoushan have better air environment systems, but relatively backward industrial structure and technology, which has potential development risks;
(3)
Transitional—harmonious development type, including the remaining seven cities. These cities have gone through a transition from low-grade symbiosis to the harmonious development stage. During 2006–2007, Ningbo, Shaoxing, and Jiaxing were in the stage of low-grade symbiosis, with the industrial structure leading by the secondary industry, resulting in the increase of air pollutant emissions and environmental pressure. After 2008, Ningbo, Shaoxing, and Jiaxing entered into the harmonious development phase, and the contradiction between the transformation process of IS and the AE became increasingly prominent and intensified. Apparently, the time span of these features varied in other cities;
(4)
No city has yet entered the stage of high-grade symbiosis. This signifies that there is still a long way before Zhejiang realizes the mutual promotion of industrial structure and atmospheric environment and the advanced coordinated co-development. How to take the air environment as an important factor to attract scientific and technological talents in the future, promote the concentration of talents and technologies, and improve the quality of regional industrial structure is one of the problems that Zhejiang needs to explore and solve in the next stage, especially in the coming 14th five-year plan (2021–2025).
Additionally, considering the limitations of the study period (12 years), there was no typical S-shaped curve in the IS and AE integrated system, which was different from the urbanization and eco-environmental system [45] and the industrial structure and eco-environmental system [4].

3.5. Policy Implication

Based on the above analysis, the following strategies could be adopted for relevant government departments:
(1)
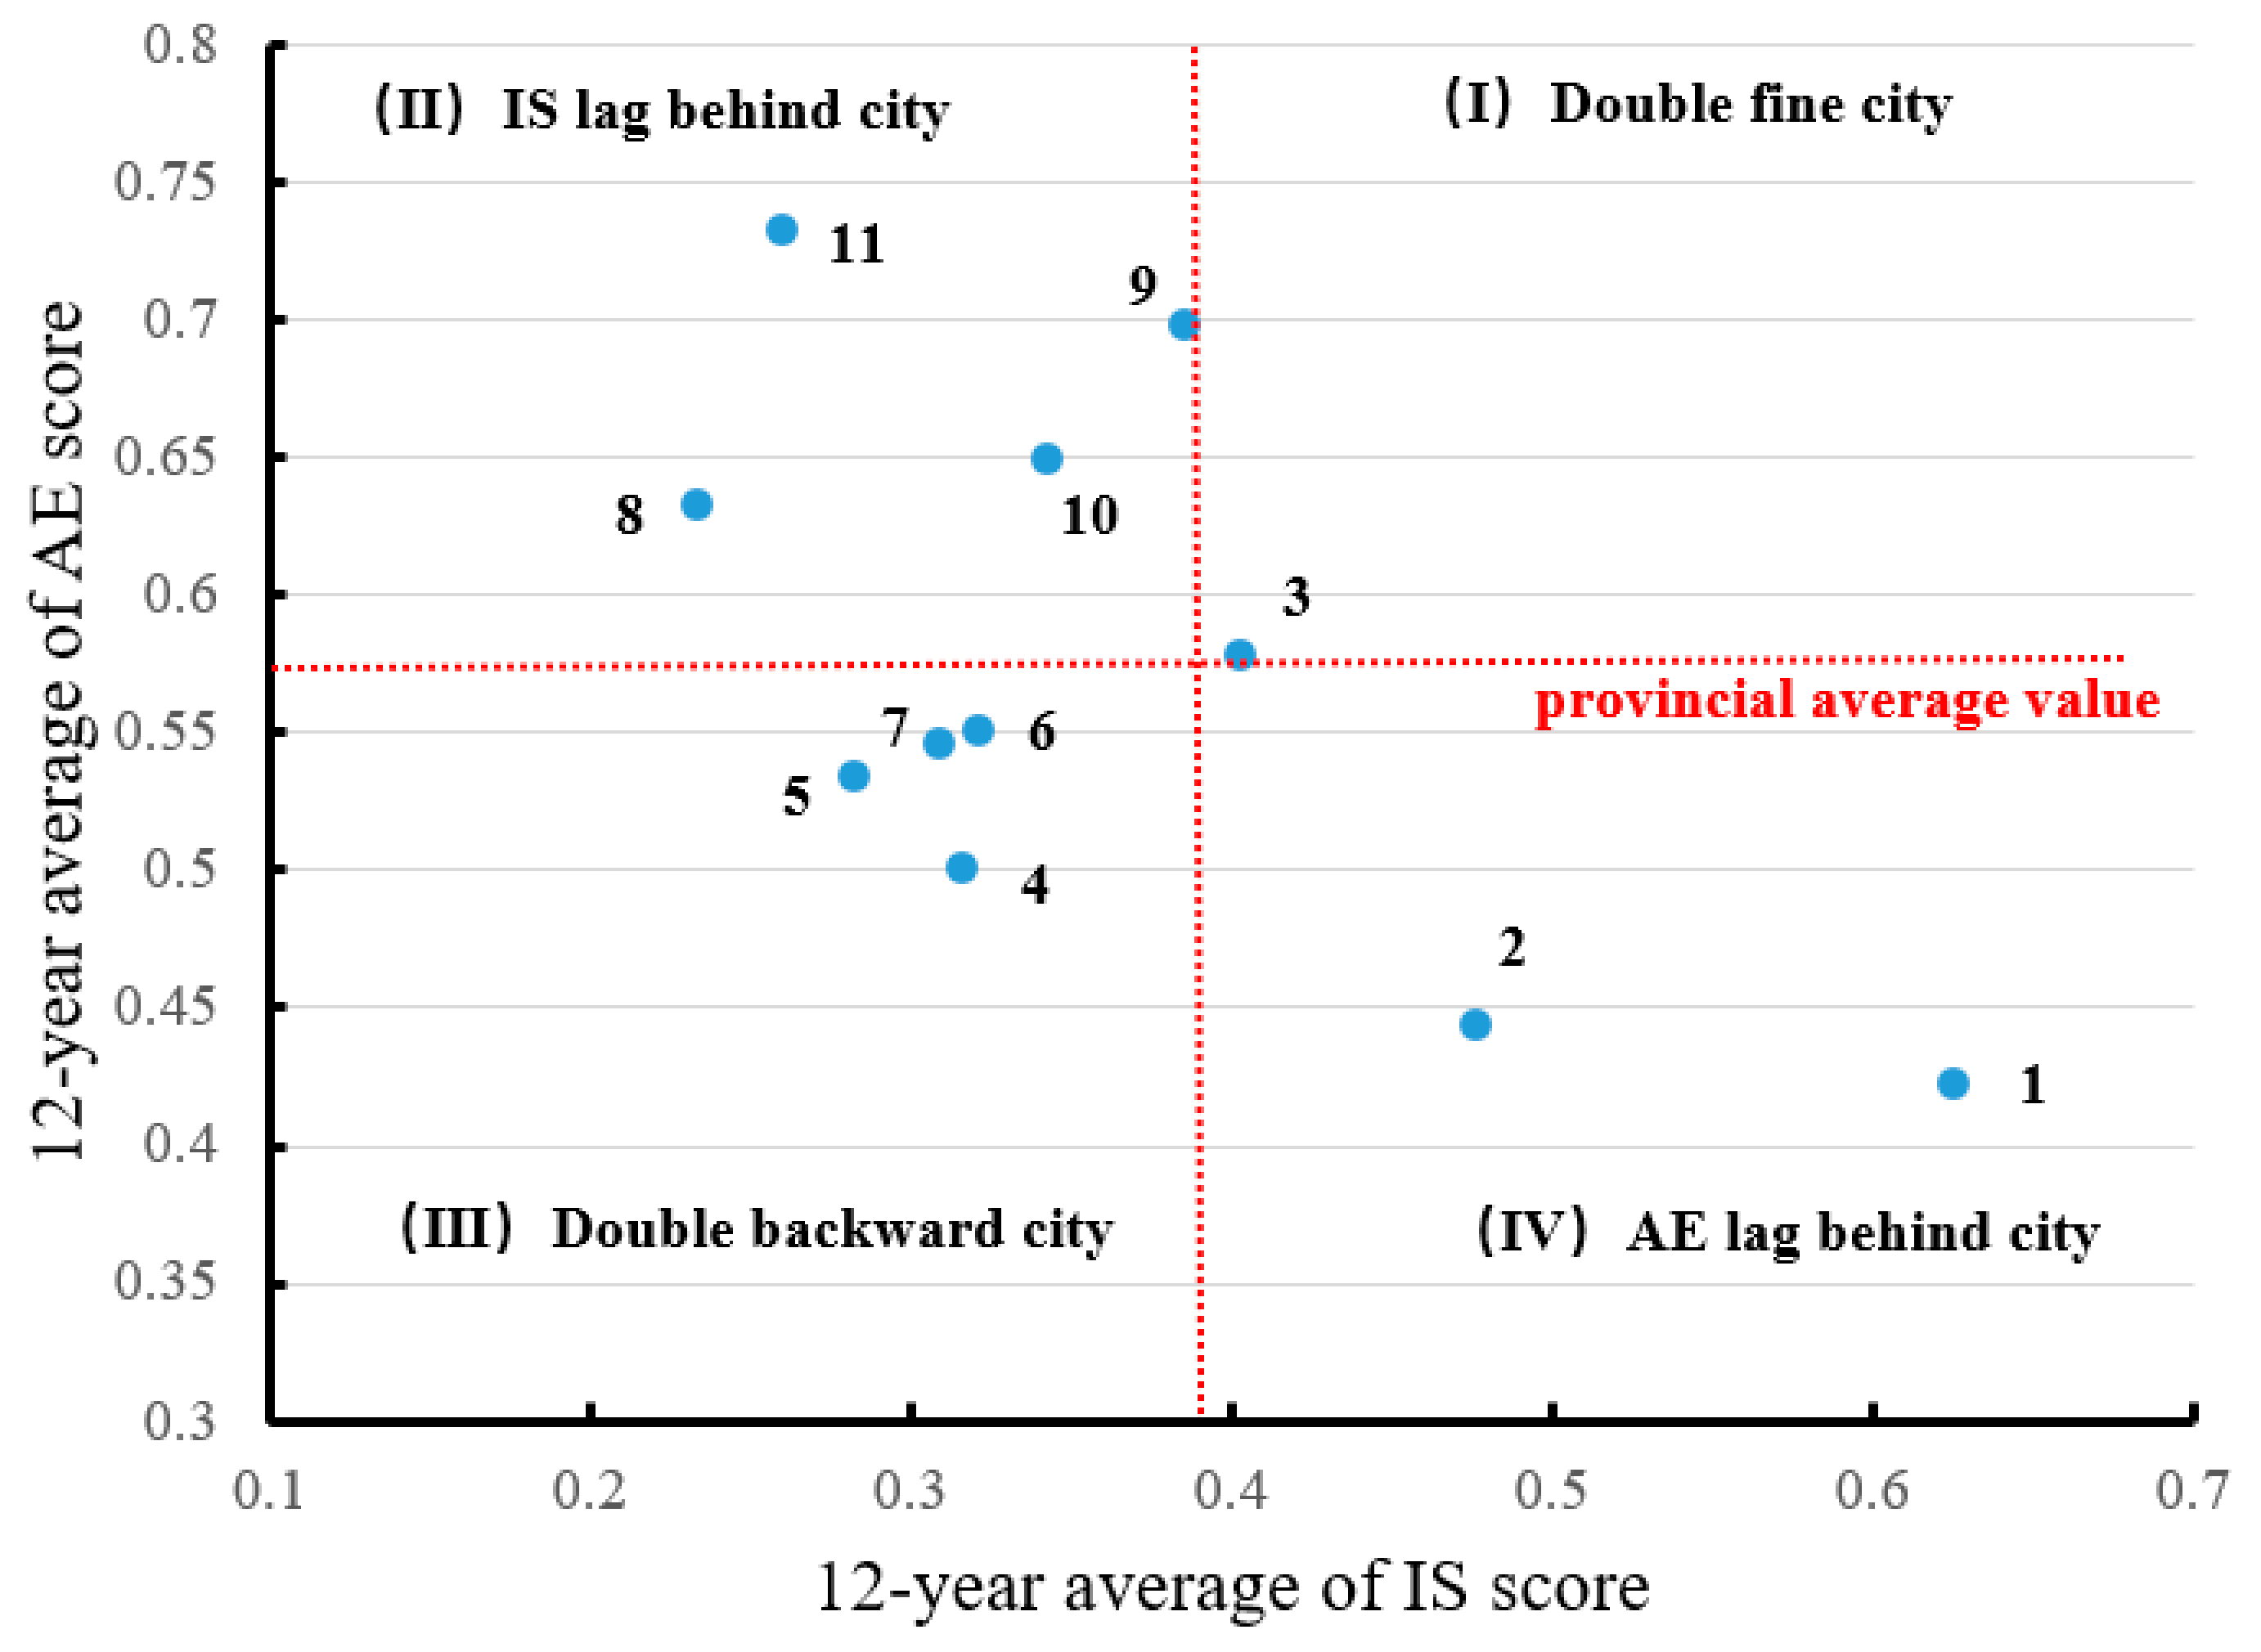
Develop differentiated regional optimization strategies. It could be seen from the previous analysis that both industrial structure and atmospheric environment system scores and the coupling and coordination degree of 11 cities had certain spatial differences. Figure 8 shows the distribution results of 12-year averages of IS and AE comprehensive score of 11 cities. On the basis of the distribution points, the 11 cities could be classified into four types: (Ⅰ) double fine city, only Wenzhou. In the future, Wenzhou should keep the coordinated pace of industrial structure optimization and air environment improvement; (Ⅱ) IS lag-behind city, including Quzhou, Lishui, Taizhou, and Zhoushan; the latter two cities tended to be closer to the double fine city class. In the future, we need to intensify the upgrading of industrial structure and increase investment in scientific and technological innovation; (Ⅲ) double backward city, including Jiaxing, Huzhou, Shaoxing, and Jinhua. These four cities are in the critical period of industrial restructuring, so they need to increase capital investment in technological innovation and resolutely implement the prevention and control of air pollution; (Ⅳ) AE lag-behind city, Hangzhou and Ningbo were listed in this class. As a result, they are obliged to improve their atmospheric environment actively and take the path of sustainable development;
(2)
Eliminate backward industries and reduce the proportion of high-polluting industries. For most cities in Zhejiang, the key task in the next stage is to continue to adjust and upgrade the industrial structure to usher into a high-grade symbiosis phase. Government departments need to increase investment to transform traditional industries, strictly implement the 13th five-year plan (2016–2020) for the prevention and control of industrial pollution in Zhejiang, which came into effect in 2016, and carry out the rectification of heavy-polluting industries, such as steel, cement, lead batteries, electroplating, printing and dyeing, paper-making, leather-making, and chemical industry. In particular, they need to strictly control the production capacity of “high-pollution and high-emission” industries. For instance, urban iron and steel enterprises should effectively adopt such methods as complete closure, transformation and development, local transformation, and overseas relocation to promote transformation and upgrading. Meanwhile, effective air pollution control and strict environmental impact assessments must be carried out before the approval of any new projects in the whole province [53];
(3)
Open up channels for scientific and technological innovation and add impetus to development. There are two dimensions of technological innovation: one is technological innovation of enterprises, through the research and development investment of new technologies and products to reduce the emission of pollutants; the other is technological innovation of atmospheric pollution control, fully co-opting and relying on the regional complex atmospheric pollution control technologies, such as power plant ultra-low emissions technology, coal-fired power plants to take off the white organic waste gas treatment technology. Many advanced applicable treatment technologies and process equipment have been developed and utilized effectively to pursue good social and ecological benefits. In fact, the government actively supports the cultivation of a number of internationally competitive large-scale leading enterprises in energy conservation and environmental protection, supports the development of enterprises’ technological innovation capacity, speeds up the acquisition of major key core technologies, and promotes the industrialization, dissemination, and application of key technologies and equipment for air pollution control.
In addition, other necessary air pollution prevention programs need to be strengthened continuously. In July 2018, Zhejiang province released the “Three-year Action Plan to Win the Blue-Sky Defense War”, which specifically required the province to ban the addition of new chemical parks, intensify the renovation of existing chemical parks. That has significantly reduced the total emission of major air pollutants and enhanced people’s sense of blue-sky happiness.

4. Conclusions

Research on the interaction between industrial structure and environmental system is not only an important part of sustainable economic development, but also a vital foundation for guiding regional industrial structure’s adjustment and formulating environmental policies. In this study, the CCDM and DCCDM were established to evaluate the coupling coordinated relationship between industrial structure and atmospheric environment integrated system, with 11 prefecture-level cities in Zhejiang province as the case.
From 2006 to 2017, the comprehensive level of industrial structure system of the 11 cities showed a trend of stable increase, while the comprehensive level of atmospheric environment demonstrated a trend of fluctuation and transition. Because of the spatial differences among the different cities, we put forward the differentiated regional development strategy, and the 11 cities could be classified into four types: (Ⅰ) double fine city, (Ⅱ) IS lag-behind city, (Ⅲ) double backward city, and (Ⅳ) AE lag-behind city. Various types of cities need to take targeted measures to optimize the industrial structure and improve the air environment.
The coupling coordination degree (CCD) analysis results found that Hangzhou, Ningbo, and Wenzhou took the lead in realizing the transformation from barely coordinated development to superior coordinated pattern, while other cities were still in the stage of barely coordinated development. Fortunately, there was no seriously uncoordinated city in the whole province.
During the study period, the DCCD phase of 11 cities could be roughly divided into three types: upgraded—utmost development type (only Hangzhou), stable—harmonious development type (Wenzhou, Lishui, and Zhoushan), and transitional—harmonious development type (the remaining seven cities). This means for most cities the contradiction between the transformation process of IS and the AE has become increasingly prominent and intensified.
Given the limitations of the study period, there was no typical S-shaped curve in the IS and AE integrated system, differing from urbanization and the eco-environmental system. Future research can expand the time span of the research area, further reveal the coupling and coordinated evolution law between industrial structure and the atmospheric environment system, and provide support for the development of regional ecological civilization and the upgrading of industrial structure. Additionally, this study lacked in-depth discussion on the process mechanism from the pollution industry perspective. Further study should explore the process mechanism of coupling coordination by quantitatively analyzing their relationship.

Author Contributions

L.D. and K.C. designed the study, analyzed the data, and wrote the manuscript. Y.H., H.D. and A.W. collected the data and participated in the data analysis. L.D. and K.C. revised and edited the manuscript. All authors have read and agreed to the published version of the manuscript.

Funding

This research was funded by the Major Humanities and Social Science Projects of Colleges in Zhejiang Province in 2017–2018 (Grant No. 2018QN035).

Conflicts of Interest

The authors declare no conflict of interest.

References

  1. Diao, B.; Ding, L.; Zhang, Q.; Na, J.; Cheng, J. Impact of Urbanization on PM2.5-Related Health and Economic Loss in China 338 Cities. Int. J. Environ. Res. Public Health 2020, 17, 990. [Google Scholar] [CrossRef] [PubMed] [Green Version]
  2. Zhu, L.; Hao, Y.; Lu, Z.; Wu, H.; Ran, Q. Do economic activities cause air pollution? Evidence from China’s major cities. Sustain. Cities Soc. 2019, 49, 101593. [Google Scholar] [CrossRef]
  3. Zheng, J.; Jiang, P.; Qiao, W.; Zhu, Y.; Kennedy, E. Analysis of air pollution reduction and climate change mitigation in the industry sector of Yangtze River Delta in China. J. Clean. Prod. 2016, 114, 314–322. [Google Scholar] [CrossRef]
  4. Chen, Y.; Zhao, L. Exploring the relation between the industrial structure and the eco-environment based on an integrated approach: A case study of Beijing, China. Ecol. Indic. 2019, 103, 83–93. [Google Scholar] [CrossRef]
  5. Wang, K.; Wu, M.; Sun, Y.; Shi, X.; Sun, A.; Zhang, P. Resource abundance, industrial structure, and regional carbon emissions efficiency in China. Resour. Policy 2019, 60, 203–214. [Google Scholar] [CrossRef]
  6. Cheng, Z.H.; Liu, J.; Li L, S. Research on the effects of industrial structure adjustment and technical progress on haze reduction. China Soft Sci. 2019, 1, 146–154. [Google Scholar]
  7. Fisher, A.G. Production, primary, secondary and tertiary. Econ. Rec. 1939, 15, 24–38. [Google Scholar] [CrossRef]
  8. Schafran, A.; McDonald, C.; Lopez Morales, E.; Akyelken, N.; Acuto, M. Replacing the services sector and three-sector theory: Urbanization and control as economic sectors. Reg. Stud. 2018, 52, 1708–1719. [Google Scholar] [CrossRef]
  9. Li, L.; Lei, Y.; Zhao, L.; Li, X. Study on the optimization of the industrial structure in a mining economic region: Taking carbon emissions as a restriction. Minerals 2015, 5, 203–220. [Google Scholar] [CrossRef] [Green Version]
  10. Cheng, Z.; Li, L.; Liu, J. Industrial structure, technical progress and carbon intensity in China’s provinces. Renew. Sustain. Energy Rev. 2018, 81, 2935–2946. [Google Scholar] [CrossRef]
  11. Mi, Z.F.; Pan, S.Y.; Yu, H.; Wei, Y.M. Potential impacts of industrial structure on energy consumption and CO2 emission: A case study of Beijing. J. Clean. Prod. 2015, 103, 455–462. [Google Scholar] [CrossRef] [Green Version]
  12. Almeida, T.A.D.N.; Cruz, L.; Barata, E.; García-Sánchez, I.M. Economic growth and environmental impacts: An analysis based on a composite index of environmental damage. Ecol. Indic. 2017, 76, 119–130. [Google Scholar] [CrossRef]
  13. Zhong, M.C.; Li, M.J.; Du, W.J. Can Environmental regulation force industrial structure adjustment: An empirical analysis based on provincial panel data. China Popul. Resour. Environ. 2015, 25, 107–115. [Google Scholar]
  14. Liu, X.; Bae, J. Urbanization and industrialization impact of CO2 emissions in China. J. Clean. Prod. 2018, 172, 178–186. [Google Scholar] [CrossRef]
  15. Grossman, G.M.; Krueger, A.B. Economic growth and the environment. Quart. J. Econ. 1995, 110, 353–377. [Google Scholar] [CrossRef] [Green Version]
  16. De Bruyn, S.M. Explaining the environmental Kuznets curve: Structural change and international agreements in reducing sulphur emissions. Environ. Dev. Econ. 1997, 2, 485–503. [Google Scholar] [CrossRef] [Green Version]
  17. Li, K.; Lin, B. Economic growth model, structural transformation, and green productivity in China. Appl. Energy 2017, 187, 489–500. [Google Scholar] [CrossRef]
  18. Wang, W.J.; Xiang, Q.F. Adjustment of industrial structure and the potential assessment of energy saving and carbon reduction. China Ind. Econ. 2014, 310, 44–56. [Google Scholar]
  19. Du, G.; Liu, S.; Lei, N.; Huang, Y. A test of environmental Kuznets curve for haze pollution in China: Evidence from the penal data of 27 capital cities. J. Clean. Prod. 2018, 205, 821–827. [Google Scholar] [CrossRef]
  20. Huang, L.X.; Wang, H.; Song, L.Y. Is China’s industrial change green? Nankai Econ. Stud. 2012, 3, 110–127. [Google Scholar]
  21. Fujii, H.; Managi, S. Economic development and multiple air pollutant emissions from the industrial sector. Environ. Sci. Pollut. Res. 2016, 23, 2802–2812. [Google Scholar] [CrossRef] [PubMed]
  22. Zheng, Y.; Peng, J.; Xiao, J.; Su, P.; Li, S. Industrial Structure Transformation and Provincial Heterogeneity Characteristics Evolution of Air Pollution: Evidence of a Threshold Effect from China. Atmos. Poll. Res. 2019, 11, 598–609. [Google Scholar] [CrossRef]
  23. Hao, Y.; Zheng, S.; Zhao, M.; Wu, H.; Guo, Y.; Li, Y. Reexamining the relationships among urbanization, industrial structure, and environmental pollution in China—New evidence using the dynamic threshold panel model. Energy Rep. 2020, 6, 28–39. [Google Scholar] [CrossRef]
  24. Chen, L.; Xu, L.; Xu, Q.; Yang, Z. Optimization of urban industrial structure under the low-carbon goal and the water constraints: A case in Dalian, China. J. Clean. Prod. 2016, 114, 323–333. [Google Scholar] [CrossRef]
  25. Wang, Q.; Yuan, X.; Zhang, J.; Mu, R.; Yang, H.; Ma, C. Key evaluation framework for the impacts of urbanization on air environment–A case study. Ecol. Ind. 2013, 24, 266–272. [Google Scholar] [CrossRef]
  26. Ding, L.; Zhao, W.; Huang, Y.; Cheng, S.; Liu, C. Research on the coupling coordination relationship between urbanization and the air environment: A case study of the area of Wuhan. Atmosphere 2015, 6, 1539–1558. [Google Scholar] [CrossRef] [Green Version]
  27. Guo, Q.; Wang, J.; Yin, H.; Zhang, G. A comprehensive evaluation model of regional atmospheric environment carrying capacity: Model development and a case study in China. Ecol. Ind. 2018, 91, 259–267. [Google Scholar] [CrossRef]
  28. Jiang, B.; Ding, L.; Fang, X. Sustainable development of new urbanization from the perspective of coordination: A new complex system of Urbanization‒Technology Innovation and the Atmospheric Environment. Atmosphere 2019, 10, 652. [Google Scholar] [CrossRef] [Green Version]
  29. Lu, Y.-Y.; He, Y.; Wang, B.; Ye, S.-S.; Hua, Y.; Ding, L. Efficiency Evaluation of Atmospheric Pollutants Emission in Zhejiang Province China: A DEA-Malmquist Based Approach. Sustainability 2019, 11, 4544. [Google Scholar] [CrossRef] [Green Version]
  30. Wang, Y.; Jin, C.; Lu, M.; Lu, Y. Assessing the suitability of regional human settlements environment from a different preferences perspective: A case study of Zhejiang Province, China. Habitat Int. 2017, 70, 1–12. [Google Scholar] [CrossRef]
  31. Chen, Y.; Zang, L.; Du, W.; Shen, G.; Zhang, Q.; Zou, Q.; Chen, J.; Zhao, M.; Yao, D. Ambient air pollution of particles and gas pollutants, and the predicted health risks from long-term exposure to PM 2.5 in Zhejiang province, China. Environ. Sci. Pollut. Res. 2018, 25, 23833–23844. [Google Scholar] [CrossRef] [PubMed]
  32. Wang, X.; Yang, Z. Application of Fuzzy Optimization Model Based on Entropy Weight Method in Atmospheric Quality Evaluation: A Case Study of Zhejiang Province, China. Sustainability 2019, 11, 2143. [Google Scholar] [CrossRef] [Green Version]
  33. Chen, M. The Outlook on Ecological Civilization Leads the Building of a Beautiful Zhejiang. In Chinese Dream and Practice in Zhejiang–Ecology; Springer: Singapore, 2019; pp. 1–28. [Google Scholar]
  34. Zhejiang Provincial Bureau of Statistics. Zhejiang Statistical Yearbook; China Statistics Press: Beijing, China, 2018.
  35. Zhejiang Provincial Bureau of Statistics. Zhejiang Natural Resources and Environment Statistical Yearbook; China Statistics Press: Beijing, China, 2018.
  36. Lin, C.Q.; Liu, G.; Lau, A.K.H.; Li, Y.; Li, C.C.; Fung, J.C.H.; Lao, X.Q. High-resolution satellite remote sensing of provincial PM2. 5 trends in China from 2001 to 2015. Atmos. Environ. 2018, 180, 110–116. [Google Scholar] [CrossRef]
  37. Wang, L.P.; Chen, J. Socio-economic influential factors of haze pollution in China: Empirical study by EBA Model using spatial panel data. Acta Sci. Circumst. 2016, 36, 3833–3839. [Google Scholar]
  38. Yang, H.; Zhang, L. An empirical study of the impact of evolution of industrial structure and urbanization on air quality in Beijing-Tianjin-Hebei Region. China Popul. Res. Environ. 2018, 28, 111–119. [Google Scholar]
  39. Liang, X.; Liang, W.; Zhang, L.; Guo, X. Risk assessment for long-distance gas pipelines in coal mine gobs based on structure entropy weight method and multi-step backward cloud transformation algorithm based on sampling with replacement. J. Clean. Prod. 2019, 227, 218–228. [Google Scholar] [CrossRef]
  40. Liu, F.; Zhao, S.; Weng, M.; Liu, Y. Fire risk assessment for large-scale commercial buildings based on structure entropy weight method. Saf. Sci. 2017, 94, 26–40. [Google Scholar] [CrossRef]
  41. Cheng, Q. Structure entropy weight method to confirm the weight of evaluating index. Syst. Eng. Theory Pract. 2010, 30, 1225–1228. [Google Scholar]
  42. Ji, P.; Zhang, H.; Wang, J. Selecting an outsourcing provider based on the combined MABAC–ELECTRE method using single-valued neutrosophic linguistic sets. Comput. Ind. Eng. 2018, 120, 429–441. [Google Scholar] [CrossRef] [Green Version]
  43. Ren, C.F.; Cheng, Y.M.; Zheng, X.; Zhou, L. Evaluation of ecological carrying capacity in Huaibei City based on the mean square deviation decision method. Ecol. Sci. 2019, 38, 168–177. [Google Scholar]
  44. Mamat, Z.; Yimit, H.; Eziz, M.; Ablimit, A. Analysis of the ecology-economy coordination degree in yanqi basin, Xinjiang, China. Asian J. Chem. 2013, 25, 9034–9040. [Google Scholar] [CrossRef]
  45. Wang, S.J.; Ma, H.; Zhao, Y.B. Exploring the relationship between urbanization and the eco-environment—A case study of Beijing–Tianjin–Hebei region. Ecol. Ind. 2014, 45, 171–183. [Google Scholar] [CrossRef]
  46. He, J.; Wang, S.; Liu, Y.; Ma, H.; Liu, Q. Examining the relationship between urbanization and the eco-environment using a coupling analysis: Case study of Shanghai, China. Ecol. Ind. 2017, 77, 185–193. [Google Scholar] [CrossRef]
  47. Liu, N.; Liu, C.; Xia, Y.; Da, B. Examining the coordination between urbanization and eco-environment using coupling and spatial analyses: A case study in China. Ecol. Ind. 2018, 93, 1163–1175. [Google Scholar] [CrossRef]
  48. Fang, C.; Cui, X.; Li, G.; Bao, C.; Wang, Z.; Ma, H.; Sun, S.; Liu, H.; Luo, K.; Ren, Y. Modeling regional sustainable development scenarios using the Urbanization and Eco-environment Coupler: Case study of Beijing-Tianjin-Hebei urban agglomeration, China. Sci. Total Environ. 2019, 689, 820–830. [Google Scholar] [CrossRef]
  49. Liu, W.; Jiao, F.; Ren, L.; Xu, X.; Wang, J.; Wang, X. Coupling coordination relationship between urbanization and atmospheric environment security in Jinan City. J. Clean. Prod. 2018, 204, 1–11. [Google Scholar] [CrossRef]
  50. Shen, L.; Huang, Y.; Huang, Z.; Lou, Y.; Ye, G.; Wong, S. Improved coupling analysis on the coordination between socio-economy and carbon emission. Ecol. Ind. 2018, 94, 357–366. [Google Scholar] [CrossRef]
  51. Wang, S.; Song, J.; Wang, X.E.; Yang, W. The Spatial and Temporal Research on the Coupling and Coordinated Relationship between Social Economy and Energy Environment in the Belt and Road Initiatives. Sustainability 2019, 11, 407. [Google Scholar] [CrossRef] [Green Version]
  52. Xing, L.; Xue, M.; Hu, M. Dynamic simulation and assessment of the coupling coordination degree of the economy–resource–environment system: Case of Wuhan City in China. J. Environ. Manag. 2019, 230, 474–487. [Google Scholar] [CrossRef]
  53. Fan, Y.; Fang, C.; Zhang, Q. Coupling coordinated development between social economy and ecological environment in Chinese provincial capital cities-assessment and policy implications. J. Clean. Prod. 2019, 229, 289–298. [Google Scholar] [CrossRef]
  54. Zhao, L.; Li, L.; Wu, Y. Research on the coupling coordination of a sea–land system based on an integrated approach and new evaluation index system: A case study in Hainan Province, China. Sustainability 2017, 9, 859. [Google Scholar] [CrossRef] [Green Version]
  55. Bertalanffy, L.V. General system theory: Foundation, development, applications. IEEE Trans. Syst. Man. Cybern. 1968, 4, 592. [Google Scholar] [CrossRef]
  56. Xu, X.R.; Wu, Z.J.; Zhang, J.R. Research on the path and early warning of sustainable development. Math. Prac. Theor. 2003, 33, 31–37. [Google Scholar]
  57. Qiao, B.; Fang, C.L. The dynamic coupling model of the harmonious development between urbanization and eco-environment and its application in arid area. Acta Ecol. Sin. 2005, 25, 3003–3009. [Google Scholar]
  58. Miao, J.T.; Phelps, N.A.; Lu, T.; Wang, C.C. The trials of China’s technoburbia: The case of the Future Sci-tech City Corridor in Hangzhou. Urb. Geogr. 2019, 40, 1–24. [Google Scholar] [CrossRef]
  59. Wu, X. Developing the Marine Economy and Building a Strong Marine Province. In Chinese Dream and Practice in Zhejiang–Economy; Springer: Singapore, 2019; pp. 177–207. [Google Scholar]
  60. Tao, L.; Zhang, S.; Xu, J. Analysis of Industrial Structure Change and Employment Effect in Zhejiang Province. Open J. Soc. Sci. 2019, 7, 426–432. [Google Scholar] [CrossRef] [Green Version]
  61. Feng, R.; Wang, Q.; Huang, C.; Liang, J.; Luo, K.; Fan, J.R. Investigation on air pollution control strategy in Hangzhou for post-G20/pre-Asian-games period (2018–2020). Atm. Pollut. Res. 2019, 10, 197–208. [Google Scholar] [CrossRef]
  62. Li, B.; Wang, F.; Yin, H.; Li, X. Mega events and urban air quality improvement: A temporary show? J. Clean. Prod. 2019, 217, 116–126. [Google Scholar] [CrossRef]
  63. Ma, T.; Duan, F.; He, K.; Qin, Y.; Tong, D.; Guannan, G.; Liu, X.; Li, H.; Yang, S.; Ye, S.; et al. Air pollution characteristics and their relationship with emissions and meteorology in the Yangtze River Delta region during 2014–2016. J. Environ. Sci. 2019, 83, 8–20. [Google Scholar] [CrossRef]
Figure 1. Indicators of industry structure and waste gas discharged in Zhejiang province during 1990–2017.
Sustainability 12 01278 g001
Figure 2. Interaction mechanism between industrial structure and atmospheric environment system.
Sustainability 12 01278 g002
Figure 3. The coupling evolving process between the industrial structure and atmospheric environment system. Note: (a) expresses the coordination degree and coordination phase; (b) expresses the spiral subordination relationship. (Source: references [45,57]).
Sustainability 12 01278 g003
Figure 4. Trends in the comprehensive level of industrial structure in Zhejiang 11 cities. (Note: ISL, ISQ, and ISI represent the score of industrial structure level, industrial structure quality, and industrial structure innovation, respectively; (a) represents the variation characteristics of each city from 2006 to 2017; (b) represents the each city’s three industrial structure subsystem scores in 2006; (c) represents the each city’s three industrial structure subsystem scores in 2017).
Sustainability 12 01278 g004
Figure 5. Trends in the comprehensive level of atmospheric environment in Zhejiang 11 cities. (Note: AEP, AES, and AER represent the score of atmospheric environment pressure, atmospheric environment state, and atmospheric environment response, respectively; (a) represents the variation characteristics of each city from 2006 to 2017; (b) represents the each city’s three atmospheric environment subsystem scores in 2006; (c) represents the each city’s three atmospheric environment subsystem scores in 2017).
Sustainability 12 01278 g005
Figure 6. The spatial distribution of coupling coordination degree (CCD)’s evolutionary stages in Zhejiang in 2006–2017.
Sustainability 12 01278 g006
Figure 7. The dynamic coupling coordination degree model (DCCDM) value between the IS and AE systems in Zhejiang 11 cities.
Sustainability 12 01278 g007aSustainability 12 01278 g007b
Figure 8. Rankings in IS and AE systems of 11 cities in Zhejiang province. (Note: 1. Hangzhou, 2. Ningbo, 3. Wenzhou, 4. Jiaxing, 5. Huzhou, 6. Shaoxing, 7. Jinhua, 8. Quzhou, 9. Zhoushan, 10. Taizhou, 11. Lishui).
Sustainability 12 01278 g008
Table 1. Comprehensive indicator system of industrial structure.
Second Level IndicatorSEW1MSD1W1Primary IndicatorSEW2MSD2W2W3Effect
Industrial Structure Level0.2960.3110.303Gross domestic product (GDP) per capita (Yuan)0.2280.2660.2470.075Positive
Proportion of secondary industry output to GDP (%)0.2060.2460.2260.068Negative
Proportion of tertiary industry output to GDP (%)0.3320.2370.2850.087Positive
Proportion of tertiary industry employment (%)0.2340.2510.2420.073Positive
Industrial Structure Quality0.3690.3090.339Proportion of secondary industry investment (%)0.2120.2680.2400.081Negative
Proportion of tertiary industry investment (%)0.2370.2360.2360.080Positive
The added value of high-tech industry accounts for the proportion of industries above scale (%)0.2660.2540.2600.088Positive
Energy consumption per unit of GDP0.2850.2420.2640.089Negative
Industrial Structure Innovation0.3350.3800.358Number of research and development (R&D) personnel (10,000 people)0.1880.2610.2250.080Positive
Proportion of R&D expenditure in GDP (%)0.3360.2680.3020.108Positive
Number of patent applications granted0.2610.2210.2410.086Positive
Output value of high and new technology industry0.2150.2490.2320.083Positive
Note: SEW denotes the calculation results of the Structure Entropy Weight method; MSD represents the weight coefficient of Mean Squared Deviation method; W1, W2 denote the average weight of SEW and MSD at the corresponding level; W3 is the result of W1 × W2, the final weight of each indicator.
Table 2. Comprehensive indicator system of atmospheric environment.
Second Level IndicatorSEW1MSD1W1Primary IndicatorSEW2MSD2W2W3Effect
Atmospheric Environment Pressure0.2580.3740.316Total volume of waste gas emission (100 million standard cubic meters)0.2370.2720.2550.081Negative
Volume of sulfur dioxide emission (10,000 tons)0.2010.2140.2070.065Negative
Volume of nitrogen oxide emission (ton)0.2480.2380.2430.077Negative
Volume of smoke and dust emission (10,000 tons)0.3140.2760.2950.093Negative
Atmospheric Environment State0.4530.3650.409Sulfur dioxide concentration (μg/m3)0.1740.2050.1900.078Negative
Nitrogen dioxide concentration (μg/m3)0.1910.1930.1920.078Negative
Particulate Matter 10 concentration (μg/m3)0.1730.1930.1830.075Negative
Particulate Matter 2.5 concentration (μg/m3)0.3200.2030.2620.107Negative
Good air quality rate0.1420.2060.1740.071Positive
Atmospheric Environment Response0.2890.2610.275Investment in environmental pollution control0.4530.2650.3590.099Positive
Waste gas treatment facilities of unit industrial output0.2460.4140.3300.091Positive
Green coverage in built-up areas0.3010.3210.3110.085Positive
Table 3. Evolutionary stages of coupling coordination degree between the industrial structure (IS) and atmospheric environment (AE) Systems.
Division of Development StagesDCoordination Types
Seriously uncoordinated development
[0.0, 0.3]
0.0 ≤ D < 0.1Extremely uncoordinated development
0.1 ≤ D < 0.2Seriously uncoordinated development
0.2 ≤ D < 0.3Intermediate uncoordinated development
Slightly uncoordinated development
[0.3, 0.5]
0.3 ≤ D < 0.4Slightly uncoordinated development
0.4 ≤ D < 0.5On the verge of coordinated development
Barely coordinated development
[0.5, 0.8]
0.5 ≤ D < 0.6Barely coordinated development
0.6 ≤ D < 0.7Slightly coordinated development
0.7 ≤ D < 0.8Intermediate coordinated development
Superior coordinated development
[0.8, 1.0]
0.8 ≤ D < 0.9Favorable coordinated development
0.9 ≤ D < 1.0Quality coordinated development
Table 4. The dynamic coupling coordination degree (DCCD) evolutionary process of the whole system.
PhaseSystem StatusRange of αPerformance
Low-grade symbiosis phase−90° < α ≤ 0°The upgrading process of urban industrial structure was slow. During this period, the IS system started to exert pressure on the AE. Contradiction between the IS and the AE system appeared, but was not yet obvious.
Harmonious development phase0° < α ≤ 90°The trend of upgrading and optimizing IS system was gradually emerging. With the proportion of secondary and tertiary industries rising, the contradiction between the transformation process of IS and the AE had become increasingly prominent and intensified.
Utmost development phase90° < α ≤ 180°The industrial structure was undergoing rapid transformation and upgrading. Human beings took various measures to reconcile the contradiction between the IS and the AE. Through the constant adjustment and optimization of all the elements in the whole system, the coupling coordination relationship between them was developing into a benign process.
High-grade symbiosis phase−180° < α ≤ −90°The relationship between the IS and the AE converted from serious interactive coercion to mutual promotion. The whole system tended to reach high-grade coordinated development.
Table 5. Curve fitting of development trend between IS and AE systems in Zhejiang 11 cities.
CityCurve Fitting of IS SystemR2CityCurve Fitting of AE SystemR2
HangzhouI = −8E−05x3 + 0.0024x2 + 0.0323x + 0.32670.999HangzhouA = 0.0008x3 − 0.0143x2 + 0.0885x + 0.20970.841
NingboI = −0.0005x3 + 0.0097x2 + 0.0031x + 0.20870.992NingboA = 8E−05x3 + 0.0011x2 − 0.0064x + 0.38540.934
WenzhouI = −8E−05x3 + 0.0025x2 +0.0149x + 0.21180.994WenzhouA = 9E−05x3 − 0.0001x2 + 0.0018x + 0.53010.747
JiaxingI = −0.0003x3 + 0.0074x2 − 0.0047x + 0.12040.997JiaxingA = 0.0043x3 − 0.008x2 + 0.0454x + 0.41280.650
HuzhouI = −0.0002x3 + 0.0046x2 + 0.0016x + 0.11820.988HuzhouA = 0.0005x3 − 0.0076x2 + 0.0371x + 0.46970.803
ShaoxingI =5E−05x3 − 0.0009x2 + 0.0375x + 0.09860.994ShaoxingA = 0.001x3 − 0.0168x2 + 0.0788x + 0.44560.773
JinhuaI = −0.0001x3 + 0.0027x2 + 0.0102x + 0.15130.995JinhuaA = 0.0005x3 − 0.0081x2 + 0.0426x + 0.44890.832
QuzhouI = −0.0002x3 + 0.0042x2 − 0.0078x + 0.13360.995QuzhouA = 0.0007x3 − 0.011x2 + 0.0322x + 0.65610.787
ZhoushanI = −0.0002x3 + 0.0053x2 − 0.0158x + 0.31880.979ZhoushanA = −3E−05x3 + 0.0005x2 + 0.0062x + 0.64530.881
TaizhouI = −0.0001x3 + 0.0028x2 + 0.0081x + 0.19100.995TaizhouA = −0.0001x3 + 0.0039x2 − 0.0213x + 0.63320.887
LishuiI = −0.0002x3 + 0.0046x2 − 0.0157x + 0.18970.995LishuiA = 0.0006x3 − 0.01x2 + 0.0508x + 0.650.840
Notes: x denotes time. I denote the comprehensive level of industrial structure as f(I). A represents the comprehensive level of atmospheric environment g(A).

