Article

The Novel Paradigm of Economics Driven for Local Smart Sustain Cities Modeling Using Exploratory Factor Analysis and Planning Technique Using Fuzzy Evaluation Decision Making

by
Mode Vasuaninchita
1,
Varin Vongmanee
2 and
Wanchai Rattanawong
2,*
1
Graduate School, University of the Thai Chamber of Commerce Graduate School, 126/1 Vibhavadi Rangsit Road, Din Daeng, Bangkok 10400, Thailand
2
School of Engineering, University of the Thai Chamber of Commerce, Bangkok 10400, Thailand
*
Author to whom correspondence should be addressed.
Sustainability 2020, 12(3), 793; https://0-doi-org.brum.beds.ac.uk/10.3390/su12030793
Submission received: 5 December 2019 / Revised: 29 December 2019 / Accepted: 5 January 2020 / Published: 21 January 2020
(This article belongs to the Special Issue Sustainable Urban Planning Techniques)

Abstract

:
The Smart Cities (SCs) models currently widely employed are identical and inconsiderate of Economics Driven (ED), Local Context (LC), and Sustainability (St) factors. These are key factors to driving, constructing, and developing smart cities. This paper presents a process wherein “the Local Smart Sustain Cities Model (LSSCsM)” is combined and modeled with Exploratory Factor Analysis technique (EFA) to design a smart city that fits the local features of a given area. This particular process creates a Smart Cities Model (SCsM) that has unique sustainability and local context factors. This paper also presents the smart cities Priority Action Ranking (PAR) process using Fuzzy Logic Decision Making (FLDM) to evaluate the strengths and weaknesses of each smart city economics driver and characteristic and prioritize the direction planning of each factor and characteristic. The resulting smart cities model can then be used as the foundation of sustainable smart cities that avoid the pitfall of using incompatible smart cities models as the base and consequently failing, thus avoiding the extravagant costs associated with an unsuccessful project of such scale.

1. Introduction

Originally, Smart Cities (SCs), by definition, were most concerned with using technology to develop a given city towards sustainability. The internationally-acknowledged definition of the word [1] gives the same general definition of the concept. The particulars may vary depending on the way each city developer or architect of SCs defines the word to describe the idea of SCs that fits their sensibility, but the theme remains consistent: SCs improve and develop their communities in the pursuit of quality of life and environment betterment by means of employing extensive Information Communication Technologies (ICT) and Internet of Things (IoT) in all the facilities that the city provides [1].
The first mention of SCs were made in The Technopolis Phenomenon—Smart Cities, Fast Systems and Global Networks [2], in which “Tatsuno” described the concept of SCs as a metaphor for intelligent cities and a distribution of globally-networked cities’ economic nodes that cooperate and converge, linked though airports, tollways, and communications, all reliant on a “knowledge processor” connected to “rapid information exchanges.” Moreover, the book also provides the word “Technopolis,” a city of technology, which is a concept closely linked to SCs [2,3]. Expectation has been set to use the SCs concept to develop and improve the quality of cities and citizens. Kummitha and Crutzen [4] reviewed 211 and studied and concluded that there were only two primary drives of SCs implementation including ICT and IoT technologies [5]. Other studies focused more on the human driven factors, such as convenience and safety [6,7]. Other studies pointed more to the importance of administration and institutions that are critical to a successful SCs [8]. If one were to examine these studies closely, they would find that none of them focused on an important driver, i.e., economics, which is essential to maintaining the well-being of citizens, businesses, and the government. Disregarding economics as a factor potentially brings poverty and social disparity concerns, leading to an imbalanced SCsM [9,10]. Even those studies that mentioned economics failed to address it as anything more than an opportunity that, with the help of technology, can be expanded and capitalized upon [11].
In truth, ED is an important factor of the Sustainability Model (StM), widely lauded as one of the best and most balanced models for multifaceted development that has long been in use [12]. The last two decades saw StM used in developing communities and metropolitans, with the aims to achieve balance in economics, environment, and social condition, as well as developing cities into ones that are attractive and competitive [13,14].
Many studies pointed to the importance of StM to SCsM, as it fills the gaps of SCs, making it more complete. Trindade [12] collected 630 St and SCs related articles from reliable sources (Scopus, Emerald, and Science Direct) and selected 97 of them that are clearly relevant to St and SCs to study on. Twenty-five significant articles were then chosen. Only some of these articles mentioned economics, and mostly in a way that describes economics as an opportunity [7,15,16,17], but not as the main driver to ensure a sustainable SCs. This research thus presents driving Smart Sustain Cities Model (SSCsM) primarily through ED, as an effort to address this flaw of SCsMs.
Neirotti [7] interestingly commented that “a city’s GDP, indicative of a city’s economic growth, influences the creation and development of SCs in many ways, most importantly local economic conditions and development rate, which is a significant drive for continued economic expansion. This directly affects the available financial resource of a city, allowing investment in developing public transportations, basic facilities, or education". A city with a well-developed economy is also one with a clear image of striving towards the betterment of citizens’ quality of life [18,19].
SCsM has been used in many countries, many times disregarding entirely the regions’ LC, or that each country and each city has different characteristics and structure. One of the most popular models is Giffinger’s, which consists of six dimensions, namely smart mobility, smart people, smart economy, smart environment, smart government, and smart living [6] (Figure 1), and is a model conceived through surveys and analysis in an effort to rank 70 small- and medium-sized SCs in Europe. Basing future city models in other areas throughout the world on data collected only from European cities may prove impractical. However, Santana [20] concluded that the SCsMs in wide use in different regions are still based on the six dimensions of Giffinger’s model (Figure 1).
In Figure 1, it is clear that Giffinger’s SCsM has been in wide usage throughout the world, both in its full capacity including the six dimensions of SCs Europe Model, and, in some cases, used partially. Weed, Junkes, and ISO 37122 for example opt to use the model in full. Gramma, Moraes, and Rbeih excluded smart economy from the model. Clark chose only to include the aspects of smart economy, smart people, smart governance, and smart mobility. Intelit chose to include smart governance and smart mobility, while Meijerring chose smart governance, smart mobility, smart environment, and smart living. Guimaraes chose smart people, smart mobility, smart environment, and smart living [20]. The countries selected to be used with Giffinger’s SCs Europe model, however, were fundamentally different from European cities, making application of the model and using the model to create SCs that fit with the needs of each of these countries’ citizens impractical.
The Figure 2; SCs literature review matrix illustrates that only three significant studies took the initiative to consider LC as a factor [6,7,20], and mentioned, although briefly, its importance to a complete SCs and solving issues citizens of SCs may have. The SCsM to be expanded upon thus must be of individual of LC [9,10].
“There is no unique global definition of SCs, and that the current trends and evolution patterns of any individual SCs depend to a great extent on the LC factors” [7]. Santana and Nunes [20] also made an interesting observation on LC and SCs and the evaluation of the model, which fits with this research’s modus operandi “to not use the same solution or standard with all regions and areas as each region has its specific characteristics”. In assessment of each of the SCs’ performance, all characteristics of the SCs must also be classified and evaluated as to produce an accurate and truthful evaluation process, whereupon the best solutions can be had and applied based on each city’s true needs.
This paper thus focuses on ED as the primary drive of SCs, as opposed to a growth opportunity or perk that is born of another aspect of SCs. Driving SCs primarily using ED is a largely an unexplored field, as highlighted in the review matrix Figure 2. Moreover, this research also presents the mathematical modeling of LSSCsM, as can be seen in SCs review matrix, showing that only 4 previous studies were conducted mathematically, while the large majority of existing studies were descriptive in nature. The first part of this research presents an indicator set relating to SCs and St used worldwide (ISO 37120, ISO 37122, ESTI-TS 103-463, ITU-TY 4901, ITU-TY 4902, and SCs ranking of Europe medium-sized cities), totaling at 428 relevant indicators. These indicators are then examined through qualitative research methodologies, including processing the indicators through surveys and grading to select only the most relevant indicators for LSSCsM by experts and local stakeholders. The results are then input into statistical EFA calculation programs to finally create LSSCsM that can serve as a base of a successful and sustainable SCs that truly fits the needs of the local community, while not being prone to failure and the extravagant cost that is to follow.
Furthermore, this paper also presents the SCs-PAR for planning process using FLDM, wherein strengths and weaknesses of each SCs and characteristic are evaluated and prioritized, with recommendation for the direction each of the factors and characteristics should be taken towards.

2. Smart cities driven

Kummitha and Crutzen [4] collected all studies on SCs from 1999–2016 from reliable sources (the Wiley online library, the Oxford Journal database, Taylor and Francis Springer, Scopus, Sage and Elsevier ’s ScienceDirect), totaling at 211 studies. The studies can be separated into two categories, including technology driven studies, and human driven studies. Some outliers focused on additional drives to SCs such as Institution [8]. Mode, Varin and Wanchai [9,10] found some studies made mentions of economics and attempted to link economics with SCsM, but ultimately did so in a way that sees SCs as a driver of economics, when in truth SCsM needs its own ED to remain thriving and sustainable. SSCsM can be summarized hence as shown in Figure 3.
It cannot be denied that StM is an efficient and balanced model that has been in use for a considerable amount of time (three core driven consist of economics, environment and social). SCsM, on the other hand, only began to focus on the driving aspects [4,8] but still did not consider an important core drive that is ED [9]. This research emphasizes ED to complete the core drives of SCs, leading to a model of successful and sustainable SCs as shown in Figure 3. SSCsM, with many studies attempting to consolidate into a single model, lacks the emphasis on the key link that is economic factor. That the aforementioned research was not successful in completely linking SSCsM was due to the complete absence of ED factor in SCs. This resulted in an incomplete linking of the two models.
This research thus focuses on ED, which is an important yet mostly absent driver of SCs found in St, being that a successful SSCsM should be driven by ED. This research gathers 428 SCs and St relevant indicators from various sources (ISO 37120, ISO 37122, ESTI-TS 103-463, ITU-TY 4901, ITU-TY 4902, and SCs ranking of Europe medium-sized cities.) These indicators are then examined by experts and input into statistical calculation programs using EFA method. The results from this process, through calculations of correlation values between the factors and categorization of components using EFA method, are considered important driving factors of LSSCsM. These results are shown in this research.

3. Indicator of Local Smart Sustain Cities and Current Smart Cities Modeling Method

Huovila [21] studied and collected SCs and St relevant indicators in global use and found that the optimal indicator set was one from ISO 37120, ISO 37122, ETSI-TS 103-463, ITU-TY 4901, ITU-TY 4902, (this research does not use ITU-TY 4903 and Sustainable development goal), and one from this research where 74 EU SCs ranking indicators are added, for a total of 428 indicators, 25 duplicated meaning indicators have been found and cut, and the resulting indicator set is complete and optimal for creation of LSSCs to further drive the model’s economy. The below is the area where each indicator set focus on;
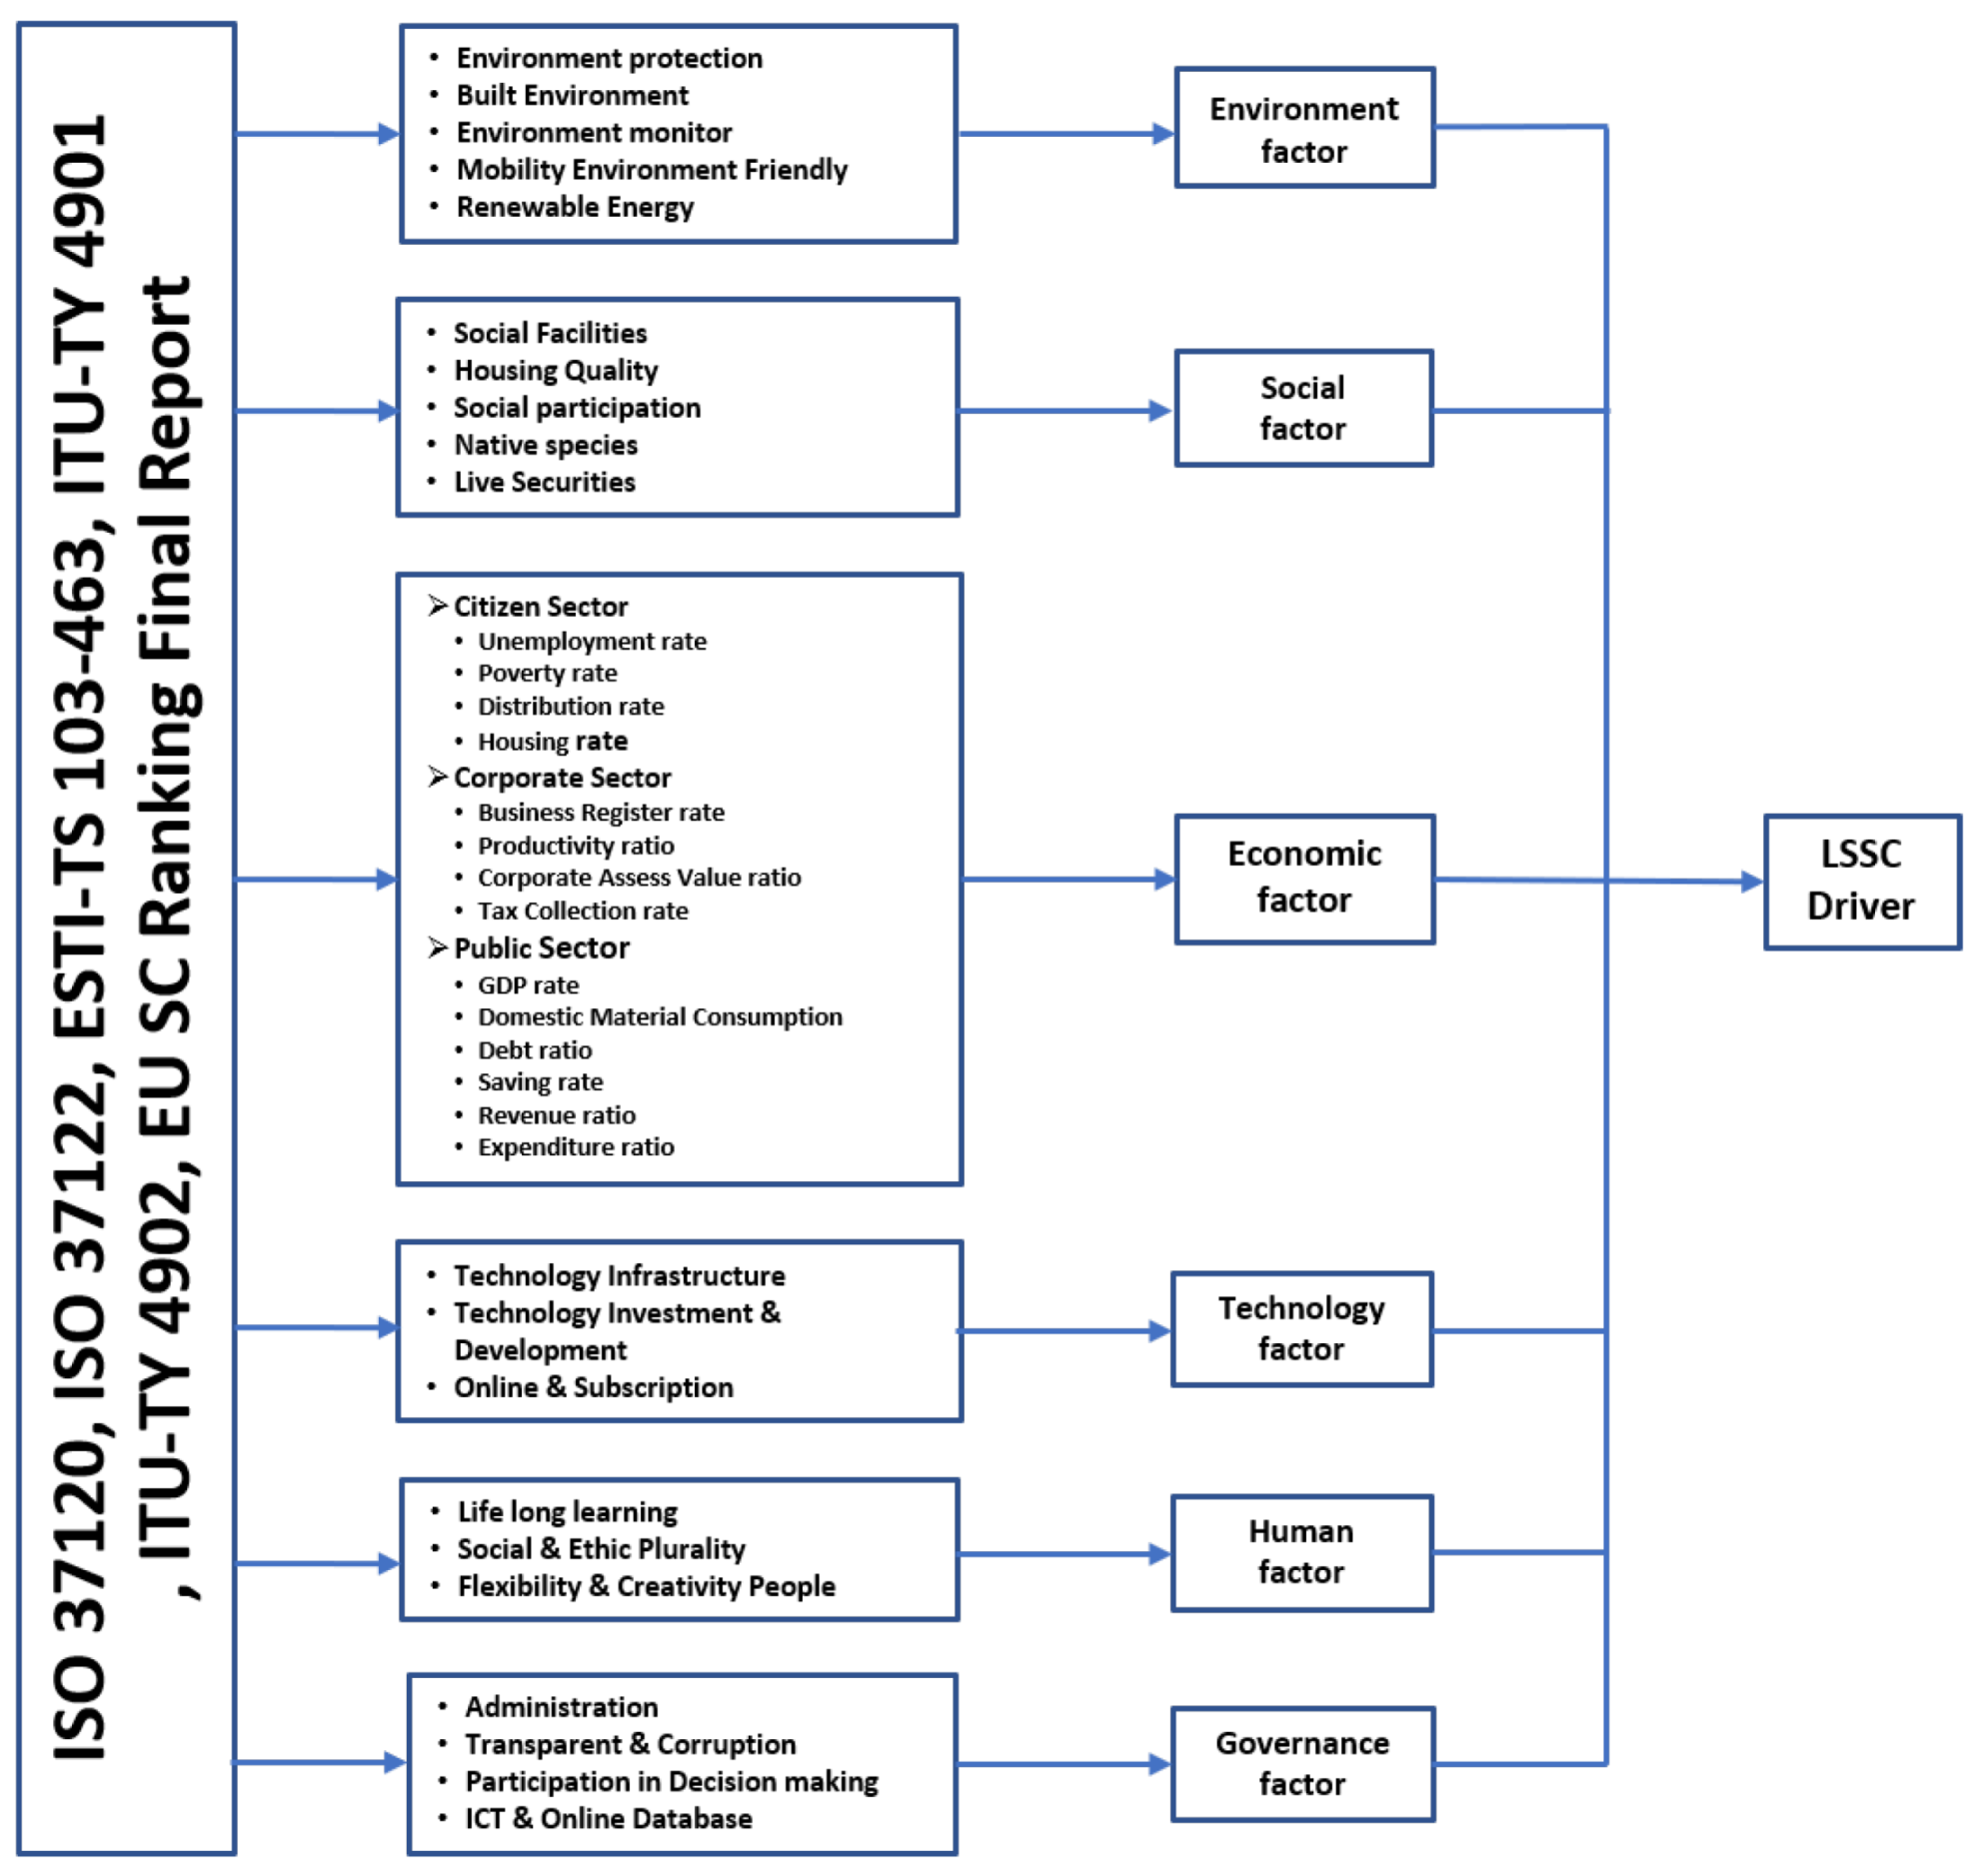
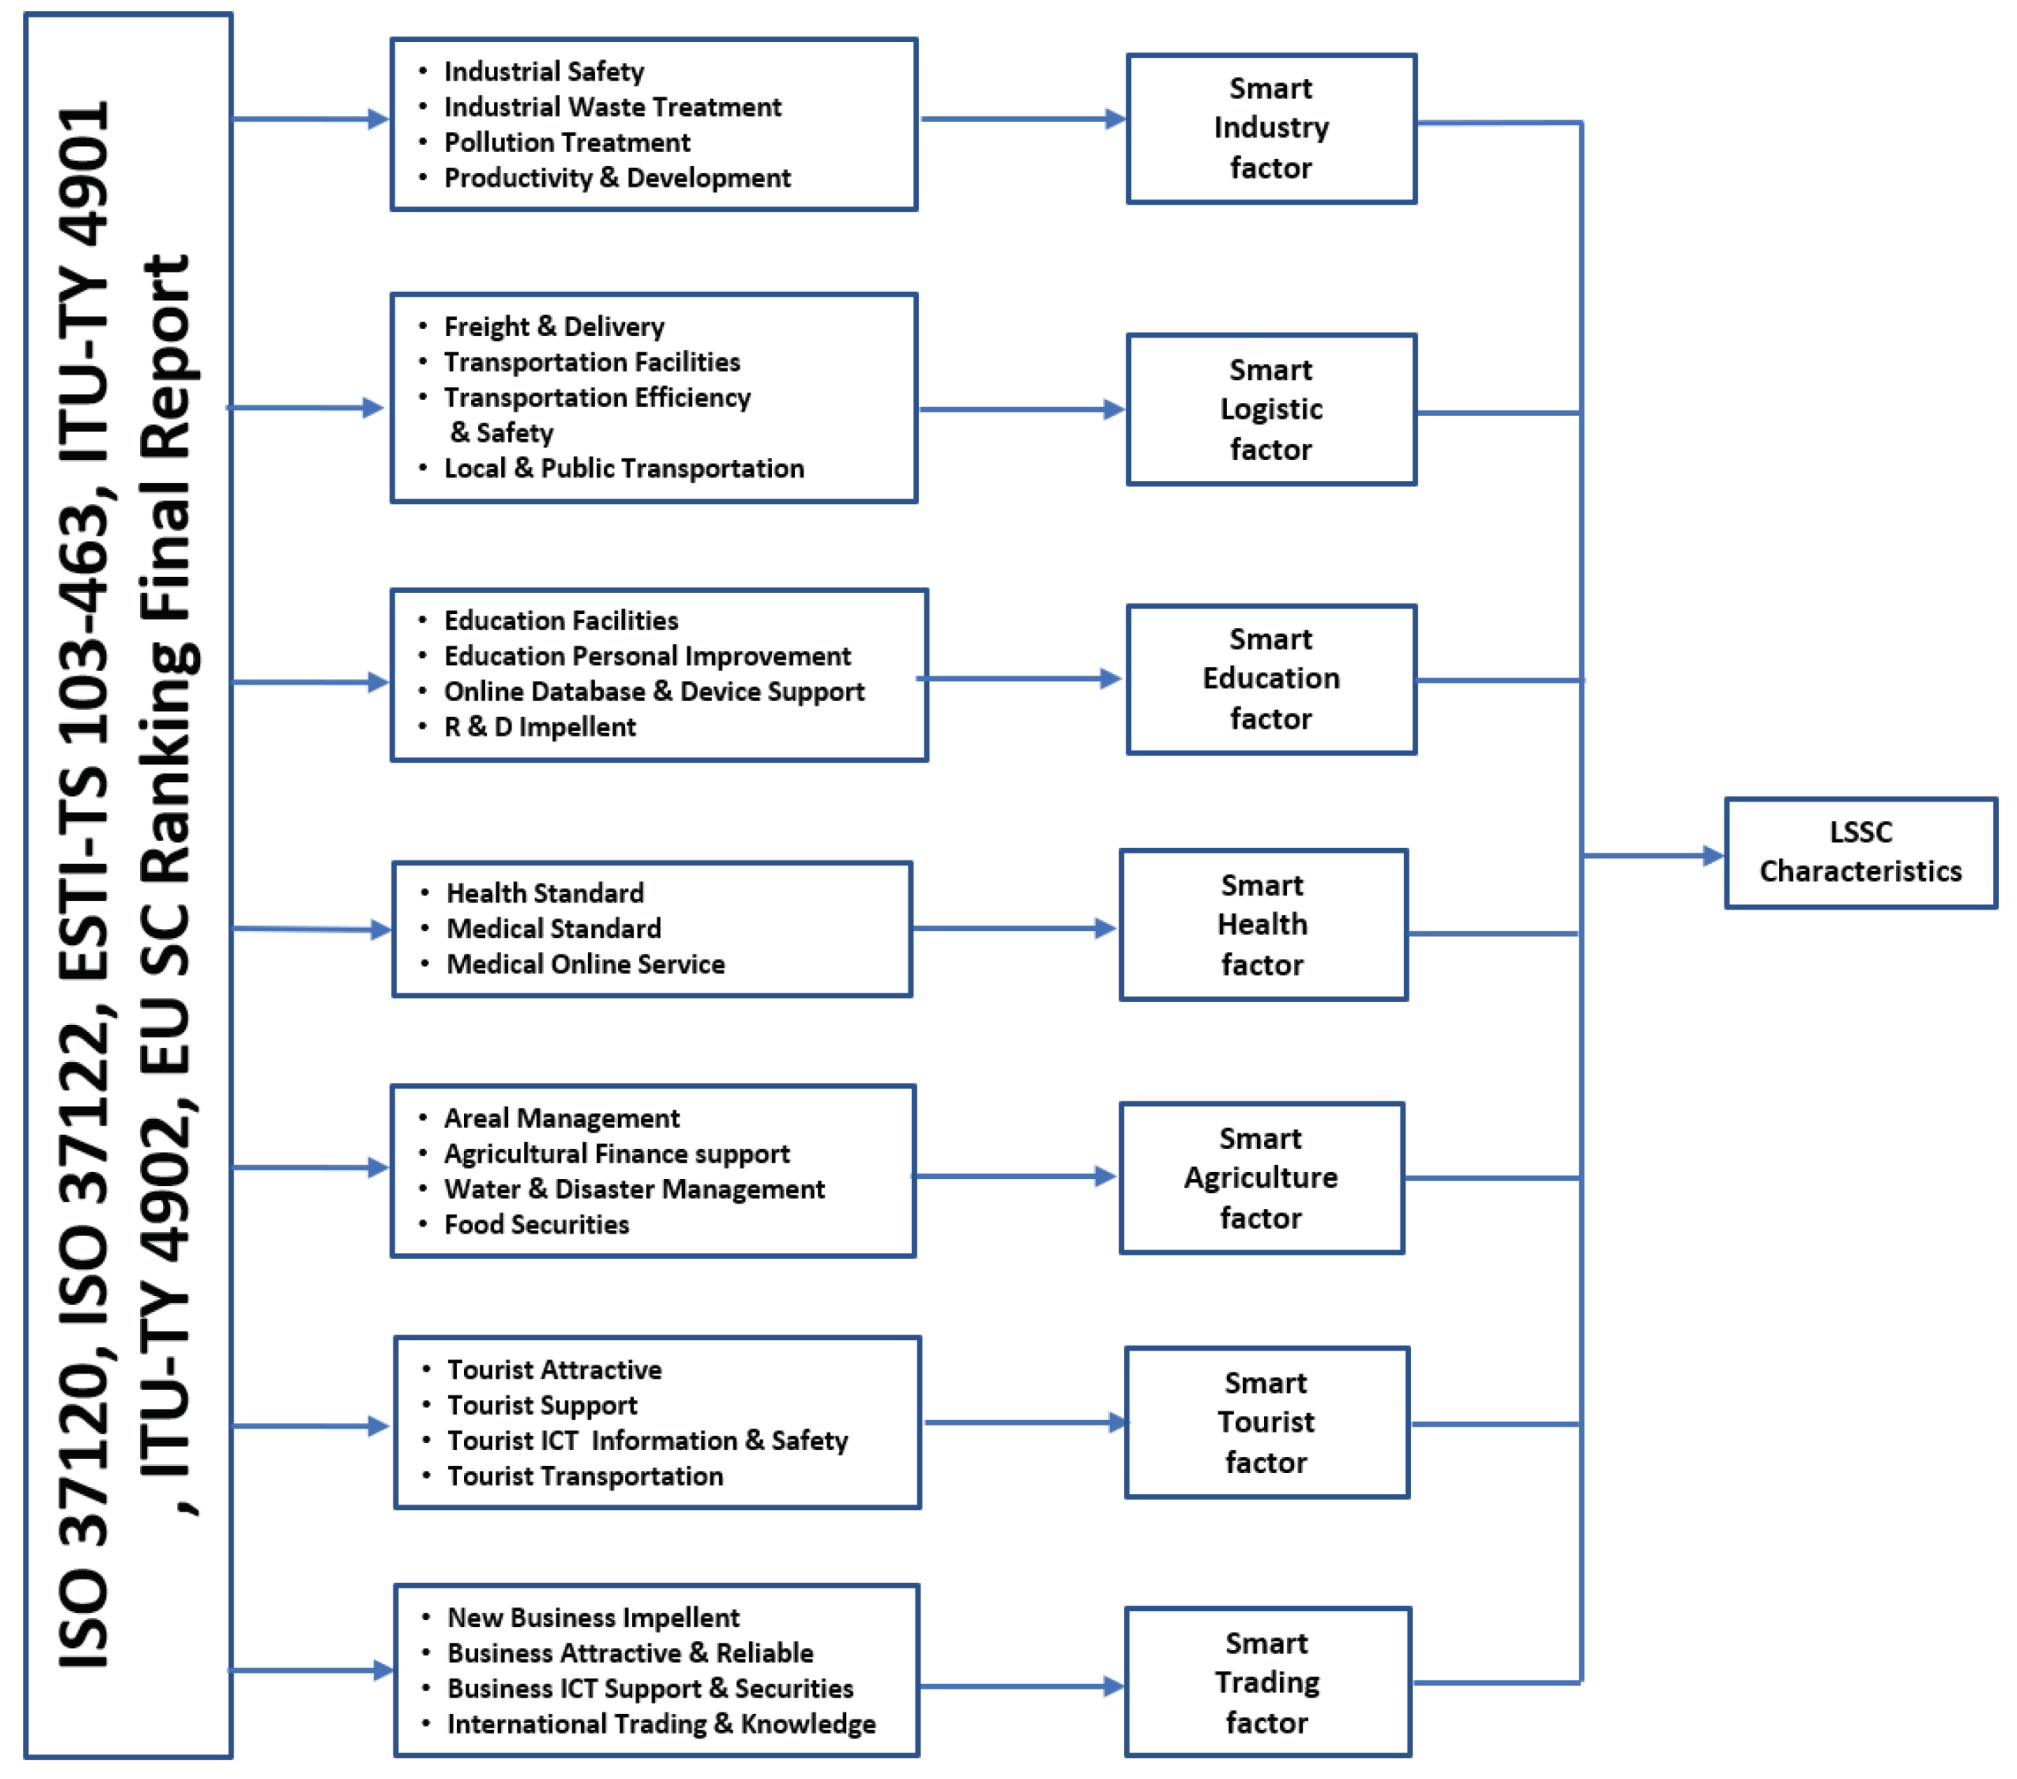
  • ISO 37120; Sustain development of communities—indicators for city services and quality of life [22]
  • ISO 37122; Sustainable development in communities—indicators for smart cities [1]
  • ETSI-TS 103-463 Key performance indicators for sustainable digital multi-service cities [23]
  • ITU-TY 4901; Key performance indicators related to the use of information and communication technology in smart sustain cities [24]
  • ITU-TY 4902; Key performance indicators related to the sustainability impact of information and communication technology in smart sustainable cities [25]
  • SCs Ranking of Europe medium-sized cities [26].
Currently, SCsM methods in use are almost exclusively qualitative, with few recent studies employing quantitative method [7,15,27,28]. Using qualitative modeling method means that the results cannot be achieved using statistics or quantification processes, but the resulting qualitative information group can be used as designs or engineering guidelines, rules, or checklists to further develop the model. The trade-off is that results from qualitative modeling method may vary based on the knowledge of the individual using the model [29,30,31].
Quantitative modeling method, on the other hand, helps identify a critical flaw of a product or process, and can be used to find the best alternative of a process. Results are also easy to decipher, owing to the numerical nature of the method which translates well to graphical display, scoring, or indexing [30,32,33]. This paper looks at the gap in the development of SCsM, and so presents the Factor Analysis (FA) process of LC, St, and SCs, model creation using EFA, model creation using statistical programs, evaluation of decision making for SCs type, and model creation from data of a city’s basic economic structure using Fuzzy Logic Evaluation (FLE) and calculating program. The SCsM from this research, as such, are not one based on vague description or baseless assumption, but one conceived through analysis of statistics and economic information. The numbers presented by the SCsM are thus accurate, clear, grounded in reality, and suitable for the actual community the model is based on.

4. Methodology

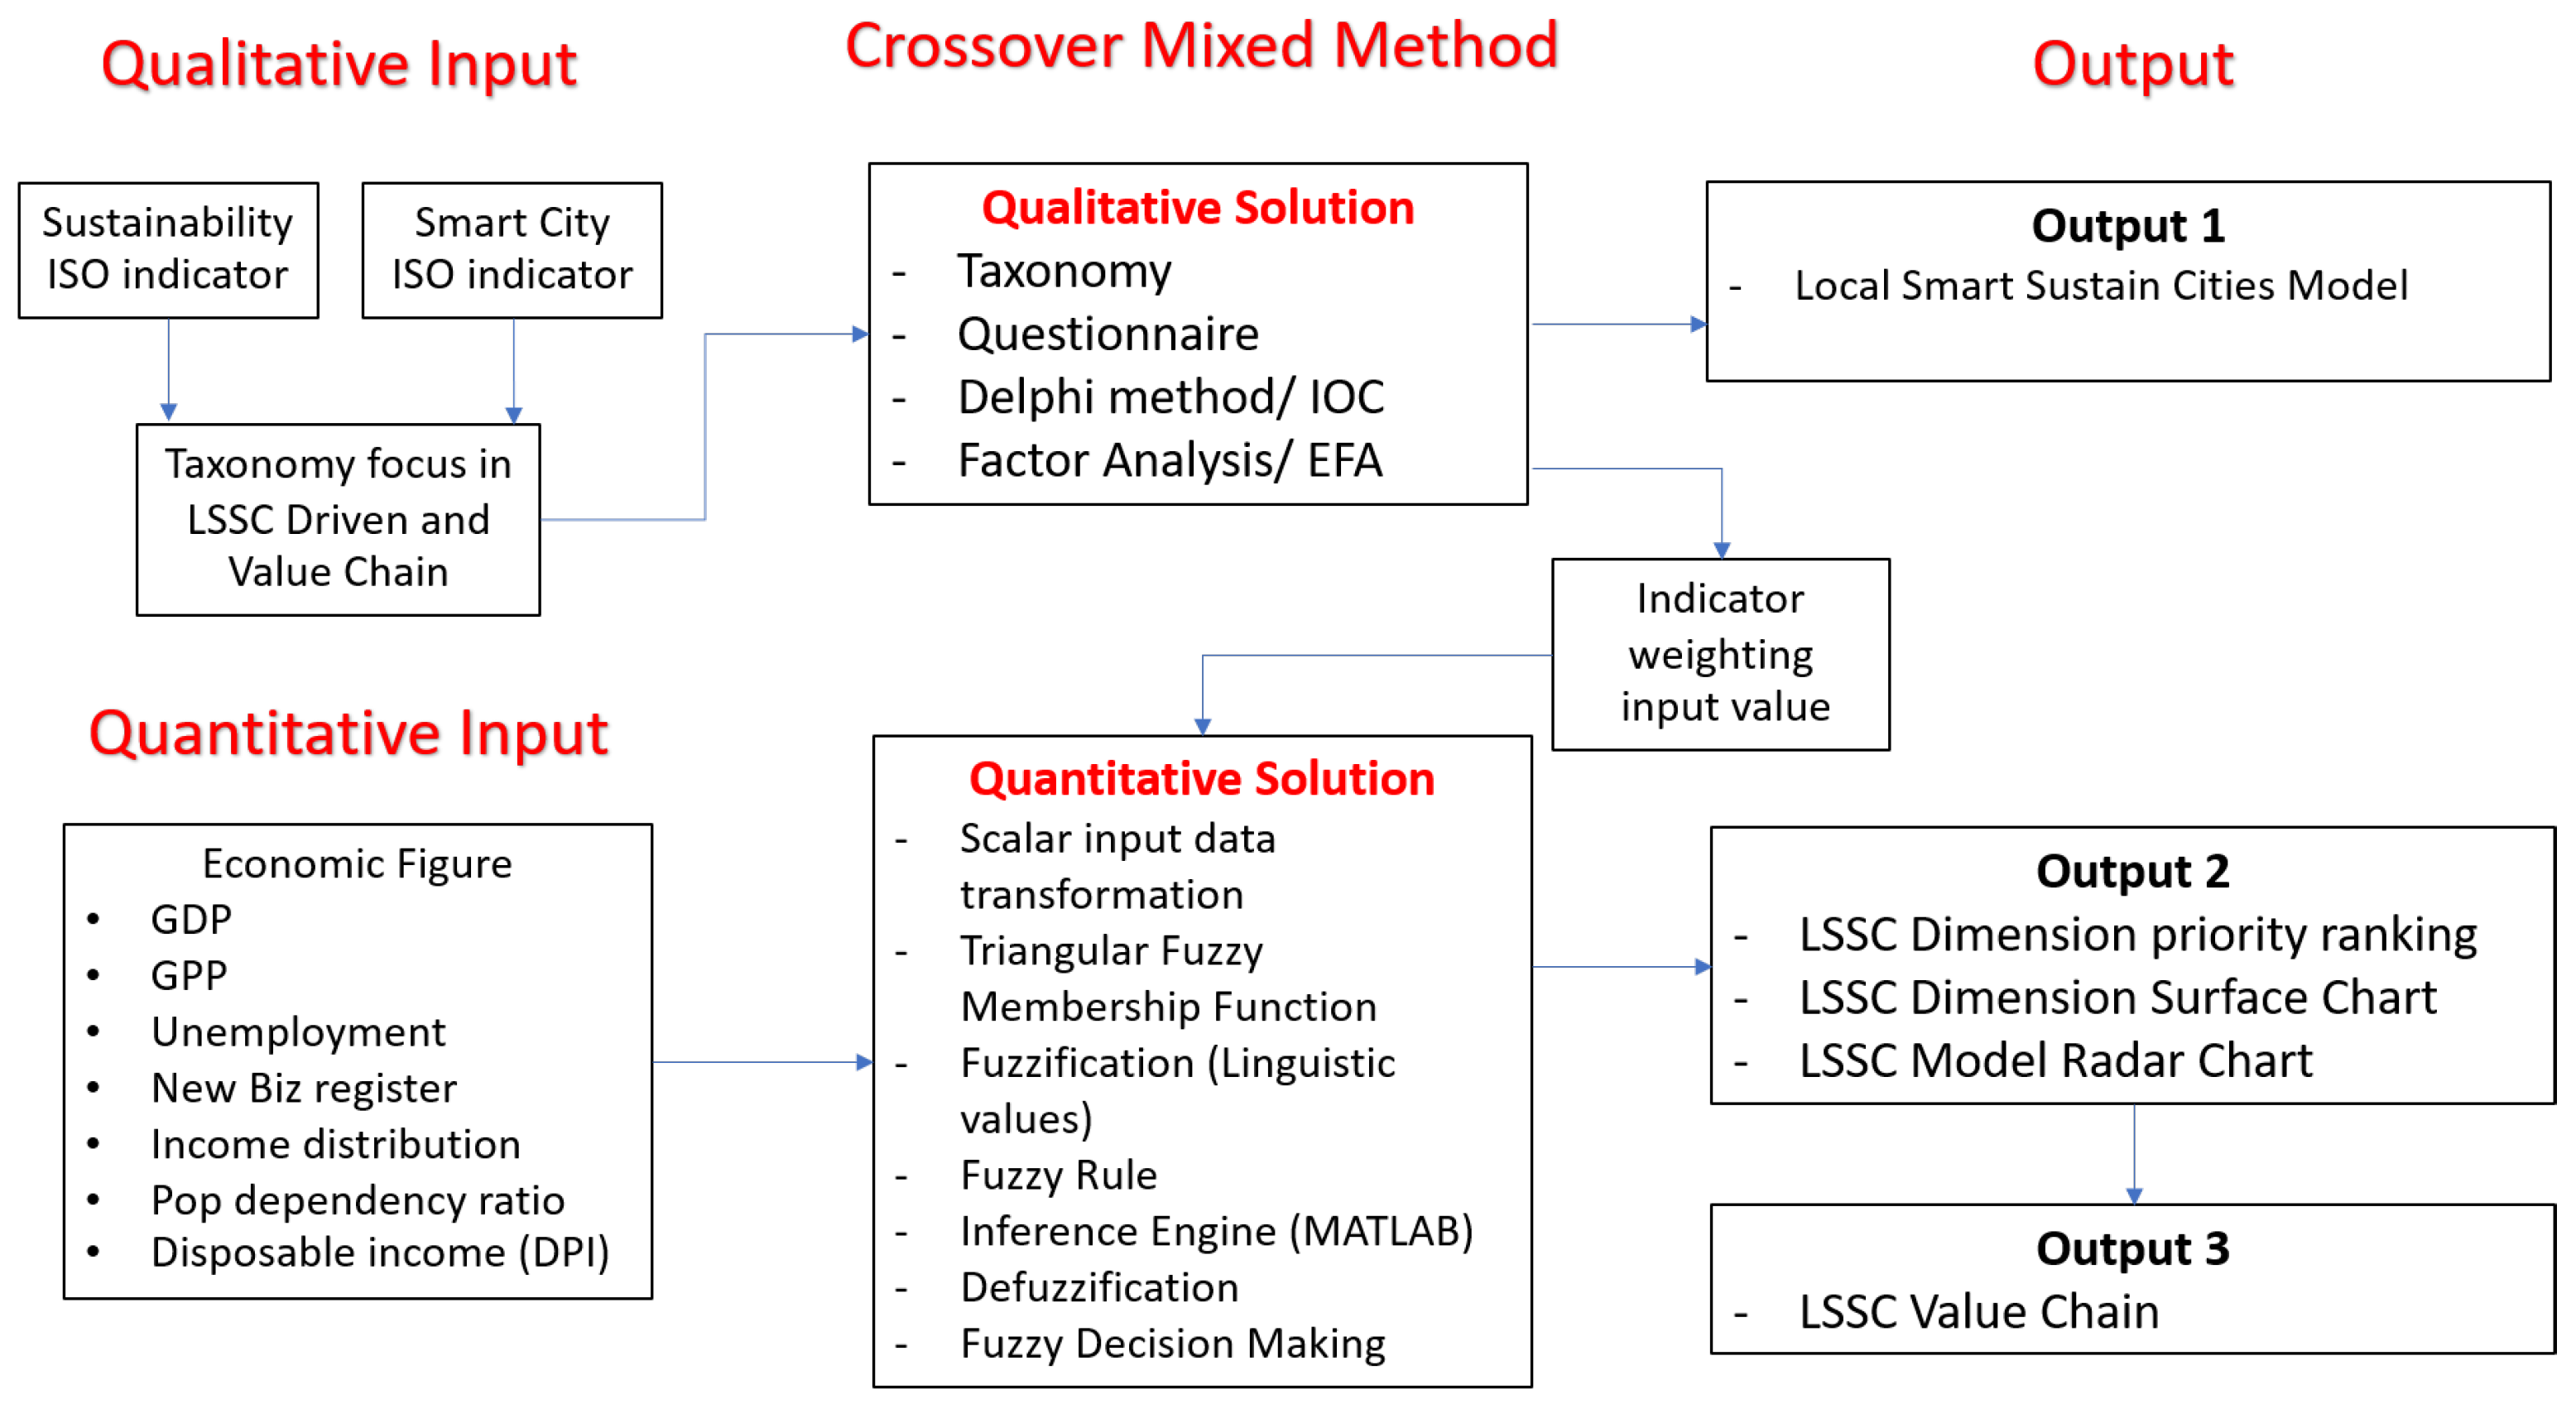
4.1. Research Design: Quantitative Dominant Crossover Mixed Analysis Solution

This research employs a 2-phases research framework, with crossover mixed methodology research design [34], both quantitative and qualitative evaluation tools are used concurrently, Figure 4 illustrate the framework diagram. The first phase of this research is the qualitative analysis phase, aimed to collect and plan the model, and to extract statistical information that is used in the quantitative phase. Activities include
  • collection of relevant indicators collected from reviews
  • creation of questionnaires using suitable indicators for LSSCs selected from reviews and by experts
  • collection of LSSCs information from model cities, data improvement and testing using statistical programs
  • LSSCs modeling with EFA.
In this phase, all 428 SSCs indicators collected and referenced from ISO 37120, ISO 37122, ETSI-TS 103-463, ITU-TY 4902 [21], and EU SCs ranking [26] are examined to find suitable indicators for each work. Experts then select these indicators to create factors, with each factor being defined by 1–6 jointly indicators [6]. The factor sets are then made into a questionnaire using Thailand local expertise, to create LSSCs indicator set that serves as a suitable base to further develop LSSCsM.
The questionnaire is then used to make survey with the stakeholders, which, for this research, is the population of Rayong province, the testbed of the resulting model of this research statistical values are collected from sample groups including government sector, business sector, citizen sector, and relevant stakeholders of Rayong province. The judges are then provided with surveys to select LSSCsM indicators to trim the indicators down to only those with the highest relevance, being that the end goal is to develop Rayong into a SSC. The judges’ input are taken both for consideration of relevant drivers and characteristics.Collected data is then reexamined and shaped into a model using EFA, which is a testing process for indicators’ correlation structure and grouping of components/dimensions of LSSCsM.

4.2. Factor Analysis and EFA Method

FA has been used as an analysis instrument for a long time since the work of Pearson and Spearman; the practical application of this approach has been suggested to be in fact of a modern research [35]. Spearman’s work has shows the origin of the concept and the theory of EFA process. Even though these processes have been pointed to throughout many decades, in reality they were only expansively applied when the computer and software systems in the area of statistics could employ the analysis technology. FA is usually applied in the fields of psychology and education and in the decision-making process for the interpretation of self-reporting questionnaires. FA is the analysis of the data with many statistical variables which is widely applied with 3 principles
  • FA is used to lessen the large quantity of variables or components
  • FA generates the structure of the model from measured variables and latent constructs and it also helps the formation and refinement of the theory
  • FA is used for the validity of structure of self-reporting scales [36].
EFA is the process for testing the correlation structure and lessening the unnecessary variables of the indicator, and this results in the combination of components namely various dimensions in LSSCsM. After the indicator set was achieved, the data will go through the EFA process by applying statistic program to analyze the correlation of factor.

4.2.1. The Kaiser-Meyer-Olkin (KMO)

Equation (1) is the statistical value that is used as the index of the ratio of variance value in variables that are caused by underlying factors [37].
K M O = r i 2 r i 2 + ( p a r t i a l c o r r e l a t i o n ) 2
where r = the correlation matrix. The small value of KMO (going to 0) indicates that the factor analysis did not match with the data; the high KMO value (going to 1) means that the factor analysis is appropriate for the data.

4.2.2. Bartlett’s Test of Sphericity

The hypothesis testing of correlation matrix which would indicate the variables that are not relevant to and suitable for the structure detection, and the Bartlett’s value that is lower than 0.05 is a significant level in FA and is thus acceptable [38].

4.3. Fuzzy Logic Decision Making Method

Apart from shaping the LSSCsM, a developed PAR model also plays a significant role in managing limited time and resources [27]. The Fuzzy Logic (FL) application used in control is widely used in many fields and can solve multiple issues by converting data into Fuzzy Membership Function FMF) whether non-mathematical model, ambiguities, partial quantifications or complex concept. FL can also process the calculation of factors that are in different forms using “Linguistics variable (LV)”. Some factors that are significant but cannot be quantified cannot be used in the traditional mathematical models [30]. These include factors that cannot be numerically defined (e.g., those from qualitative studies.) FL, however, can evaluate these factors, making it a suitable tool for the research, as the primary inputs of this research consist of;
  • Qualitative data input from phase one
  • Quantitative data based on economic information.
With no tools better suited for handling both types of input, FL is the most qualified tool, capable of managing data and knowledge of different natures in mat model, linguistic rules, numerical value or linguistic expressions [30,39,40]. The LSSCs index determine to use in Fuzzy Inference System (FIS) consist of the fuzzification, inference fuzzy learning engine, fuzzy rules and defuzzification.

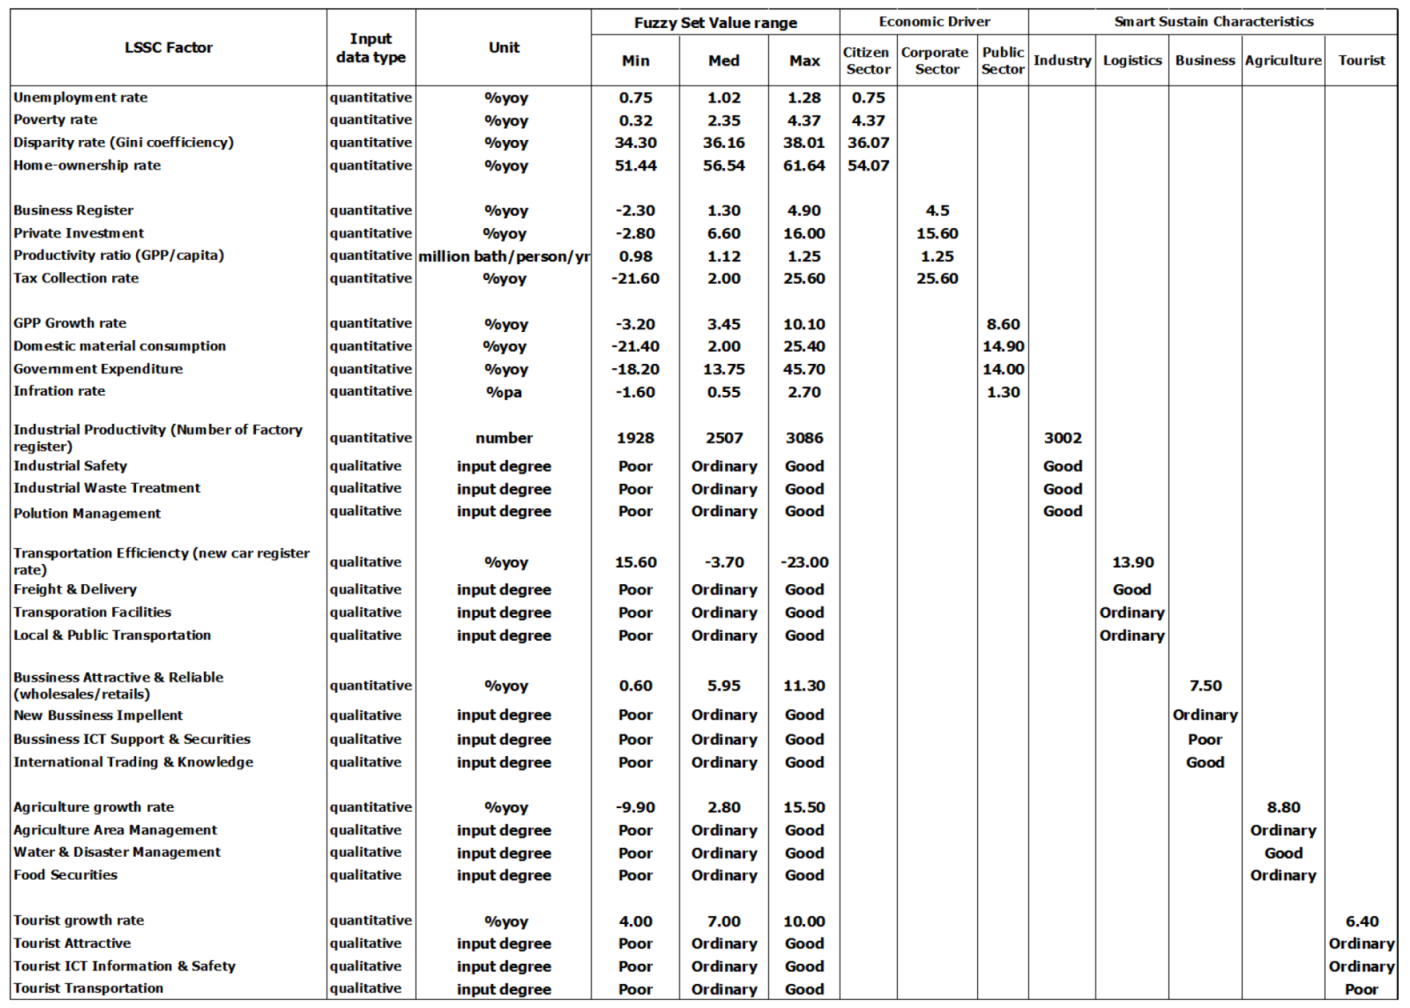
4.3.1. Determination of LSSCs Index Value Fuzzy Input

Determination of the variables on LSSCsM Index is done through FLE using FIS. The details for each step are as follows (Figure 5):
  • Set LV gained from quantitative data e.g., economic information, and qualitative data e.g., environment management priority; poor, ordinary, good (Figure 6). This data will be put into each input/output variable using FMF. This research also uses Triangular Membership Function (TMF).
  • Qualitative data value and quantitative data value are then transformed into LV in FLE, which is then processed under fuzzy rule condition, with the “if-then” rule (AND/OR/NOT)”, this affects the output results from input value calculation using FIS process (Figure 5).
  • Defuzzification then processes fuzzy output using degree of membership in the form of single numerical value [30].

4.3.2. Fuzzy Membership Function

FMF is the key of fuzzy model, critical to transform and set the form of input variables to conform to each other for the sake of calculation regardless of input data’s varying original forms. In this research, TMF is applied, as it is the simplest and most commonly used membership function due to the ability to be adapted for various assessments [30,41,42]. TMF equation (Equation (2)) and input/output FMF chart (Figure 6), in this research use three degree of input variables: poor, ordinary, good (Figure 6).
μ A ( x ) = 0 , i f x a 1 ( x a 1 ) ( a 2 a 1 ) , i f a 1 x a 2 ( a 3 x ) ( a 3 a 2 ) , i f a 2 x a 3 0 , i f x a 2
where A = ( a 1 , a 2 , a 3 ), a 1 = minimum, a 3 = maximum and a 2 = ( a 1 + a 3 )/2.

4.3.3. Fuzzification, Fuzzy Rule and Fuzzy Inference

  • Fuzzification is the action of setting degree of membership u ( x ) of a fuzzy set’s input variable (x) using membership function. The resulting value is a membership value that varies from 0 to 1.
  • Fuzzy rules is the determination of contribution of the input variables to the output responses using linguistic term approaches, separated into two parts. First, a premise (input) is set as part of the “if” rule, then the second part consists of the conclusion, which is a single fact (one output) [30,42]. The number of fuzzy rules depend on the number of variable and degree of input variable (Equation (3)).
    R = n v
    where n = the number of degree of input variables (triangular = 3), v = the number of input variables.
  • Fuzzy inference is the process that consists of two parts. First, the implication process, in which fuzzy conclusions (Ni) of each rule (Ri) is set. Truth value (Tj) for each premise of the proposition in Ri is also set. Premise, in this instance, consists of two or more variables. Truth value is set by logical connectivity operation (fuzzy operator) AND/OR/NOT. Output gained through the implication process is the fuzzy conclusion (Ni) of each rule, as shown in Figure 7, on the horizontal arrow. Next is the aggregation process, which is after the fuzzy conclusion (Ni) is consolidated into a single fuzzy set as shown on Figure 7 on the vertical line [30].

4.3.4. Defuzzification Method

Each fuzzy conclusion from the implication process (horizontal arrow in Figure 7) is then aggregated into a single fuzzy set (downward vertical arrow). A popular and widely accepted defuzzification technique is the Center of Area method (CoA), as it is the most efficient computation process for the multiple output linguistic terms which is to calculate and find the area under the scale of membership function graph which is in range of the output variable (Equation (4)).
C o A = x m i n x m a x f ( x ) x d x x m i n x m a n f ( x ) d x
where CoA = the Center of Area, x = linguistic variable, X m i n and X m a x = range of the linguistic variable.

4.4. Case study Rayong Province Thailand

EFA and FLDM are used in this research to shape the LSSCsM and rank priority for action plan for Rayong respectively. This is done through collecting data from sample groups in Rayong, which is a model city for LSSCsM. The raw data comes from two parts: qualitative data collected from expert-approved questionnaires with the proper indicators for Rayong LSSCsM built in, and qualitative data collected from Rayong’s central treasury database [43], which is used as an input in conjunction with the data from the first part in FLDM to rank LSSCs dimension, assessment and prioritizing each dimension as appropriate.

5. Result and Discussion

5.1. LSSCs Indicator Set

In evaluating and creating LSSCsM for Rayong, 428 indicators collected from indicator database referencing ISO 37120, ISO 37122, ESTI-TS 103-463, ITU-TY 4901, ITU-TY 4902, and EU SCs ranking final report are used. Two processes are employed in the selection and categorizing phase, including expertise’s selection and literature review. The hierarchical structure development (Figure 8), 248 indicators are selected to describe 61 factors to analyze performance of 13 LSSCs dimensions.
Each dimension will be categorized to LSSCs dimension sets as a driver, which is a set of factors that are critical drives of LSSCs and characteristics that are unique to the LSSCs, consisting of 6 drivers including (Figure 9); ED, environment driver, social driver, technology driver, human driver and governance driver.
And Figure 10 is a set of 7 LSSCs characteristics, including; smart industry, smart logistics, smart education, smart health, smart agriculture, smart business, smart tourist.
LSSCs driver and characteristic sets are named as a group using Indicator correlation according to EFA method to set components, as shown on Figure 9 and Figure 10. The results are in line with the Twelfth national economic and social development plan of Thailand [44].

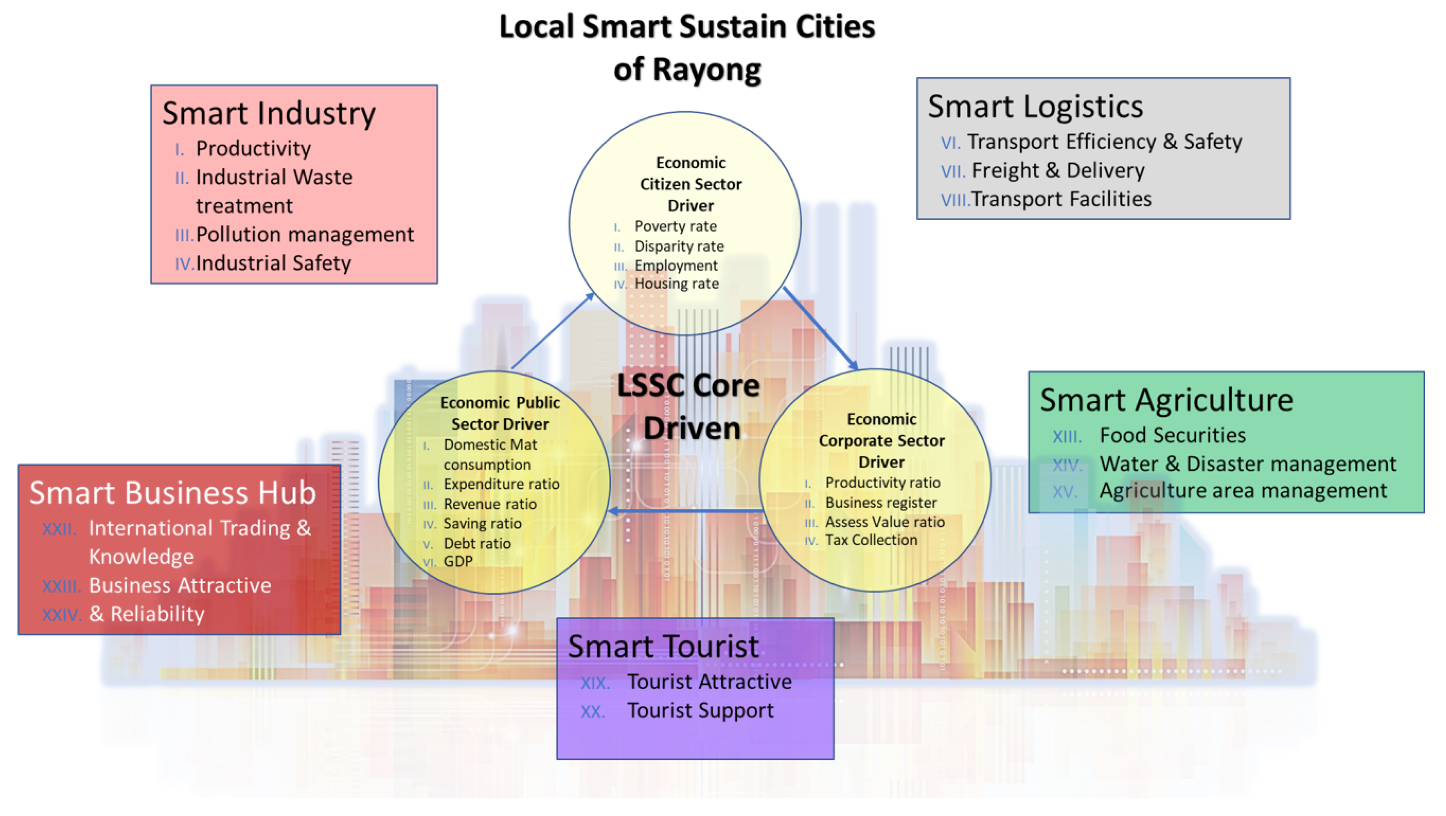
5.2. Economic Driven of LSSCs Modeling

LSSCs factor can be separated into two types, including driver and characteristics. For driver, “this research only focuses on economics”, LSSCs economics factor set to EFA processing to create ED model, the 14 factors of ED show KMO = 0.772 (higher than 0.5), thereby confirming that the factor analysis technique well suits the data on hand. Bartlett’s test of sphericity result is 0.000 (less than 0.5) (Figure 11), which is significant and illustrate that factors used in the test are related and suitable for further testing and creation of LSSCsM. The Principal Component Analysis (PCA) and Varimax Rotation Method (VRM) are employed in this research to create factor structure [36].
The reliability of the tools used are also tested, with the result being Cronbach’s alpha = 0.870 which is higher than 0.800 and should be considered a good value (Figure 11).
Figure 12 the total variance explained, statistical values from before and after factors are extracted are shown. Eigenvalues is the total amount of variance in the variables in the data set that can be explained by the common factor (sum of the squared factor loading). Focus should be given exclusively to components with Eigenvalue higher than 1; for ED, there should only be 4 components.
Then, the numbers are run through the rotated component matrix. The values shown on the matrix are factor loading values subjected to VRM. The resulting values show correlation between factors and components/Economic Driver Sector (EDS). Factor loading for each component or EDS, in this instance, should be higher than 0.400 (Figure 13).
  • EDS 1 consist of revenue ratio, GDP, domestic material consumption, expenditure ratio, debt ratio, saving ratio
  • EDS 2 consist of poverty rate, disparity rate, employment rate, housing rate
  • EDS 3 consist of productivity ration and business register
  • EDS 4 consist of assess value ration and tax collection.
Since EDS 1 is public sector, EDS 2 is citizen sector, and EDS 3 and 4 are corporate sector, then EDS 3 and 4 can be combined.
The result from EFA method calculations via statistical programs of SCs and St indicator sets’ economic factors are collectively considered the ED factor that is SCs and St relevant, and is considered an important driver of LSSCsM.

5.3. Characteristics of LSSCs Modeling

At this stage, LSSCsM is created based on characteristics the data of which is gained from analyzing the correlations between LSSCs factors that are consolidated by the EFA process, with the KMO value being at 0.643 (higher than 0.5) and Bartlett’s test of sphericity being at 0.000 (less than 0.5) which is significant, and the reliability test shows Cronbach’s alpha value at 0.739. All this indicates that proper factor analysis techniques are used, factors tested are correlated, and that the tools used are reliable (Figure 14).
The rotated component matrix of LSSCsM characteristics (Figure 15), subjected to VRM test the correlation between factors and components illustrate as below;
  • Characteristic 1 consist of productivity, industrial waste treatment, pollution management, and industrial safety
  • Characteristic 2 consist of transport efficiency and safety, freight and delivery, and transport facilities
  • Characteristic 3 consist of international trading and knowledge business, attractive and reliability
  • Characteristic 4 consist of food securities, water and disaster management, and agriculture area management
  • Characteristic 5 consist of tourist support, and tourist attractive.
Further analysis on components-characteristics show the characteristics relevant to the model include; characteristic 1; smart industry, characteristic 2; smart logistics, characteristic 3; smart business, characteristic 4; smart agriculture and characteristic 5; smart tourist. Smart Education and smart health characteristics are not reflected on this Rayong-based LSSCsM as qualitative data both gained from experts and sample groups does not prioritize these characteristics. By combining the two parts of the model, namely ED model and characteristics model, Rayong’s LSSCsM is made (Figure 16).

5.4. Priority Action Ranking for LSSCs Planning

With LSSCsM comprising of ED and characteristics modeled by EFA complete, the next step is to evaluate the strengths and weaknesses of each driver and characteristic using PAR process for the direction planning, and then rank each driver and characteristic for policy purpose. This allows one to identify which of the characteristics should be expanded upon first in accordance with the city’s strengths and weaknesses, and to identify which economic sector most needs expansion or improvement to ensure that a sustainable LSSCsM can be achieved.
FLDM-PAR method for LSSCs is used in evaluating, comparing, and ranking ED 3 sectors and the 5 LSSCs characteristics, the raw data (Figure 17) obtained from Rayong’s treasury database [43]. The purpose of evaluating the index using Fuzzy method is to determine the best economic sectors and characteristics of Rayong, doing so by considering the index factor value of each LSSCs characteristic. Ranking by Fuzzy method is done by categorizing input data based on the drivers and characteristics of LSSCsM.Two types of input data are present, including numeric or quantitative data which is obtained from Rayong’s treasury database, and quantitative data from evaluating Rayong stakeholders (as Figure 17). The input data will then be subjected to FIS in sets according to each set’s driver or characteristic category, as illustrate in LSSCs factor matrix of FL input data (Figure 17), smart industry has 4 input data; industrial productivity = 9.10, industrial safety = good, Industrial waste treatment = good, pollution treatment = ordinary. By define FMF, FIS can calculate both quantitative and qualitative data.
Upon aggregating the input data for each driver and characteristic using FIS, the result illustrate in the Figure 18 that the ED group in Rayong has a very strong corporate sector, valuing at 0.855, with public sector and citizen sector scoring 0.611 and 0.471 respectively. This indicates that Rayong’s economic structure is bent towards corporate sector as the driving force behind industry and Business sectors. Rayong’s public sector is moderately strong, but the citizen sector needs improvement to achieve better quality of life and income rates for its citizens. Meanwhile, the FIS characteristics evaluation illustrates in Figure 18 that the smart industry characteristic scores 0.869 in index value, while smart logistics, smart agriculture, and smart business are given nearly identical scores at 0.601, 0.601, and 0.581 respectively. smart tourist, on the other hand, is given the score of 0.346.
This indicates Rayong having a strong infrastructure for industries to thrive, and suitable to be further developed into a smart industrial city. That said, other characteristics including the second and third highest-rated characteristics of smart logistics and smart agriculture can also be expanded upon simultaneously with the industrial side. smart business, as a characteristic, however, requires improvement, and it may be difficult to develop the smart tourist characteristic of Rayong into a notable or strong characteristic.
The research uses radar chart to display the PAR result from FLDM to ensure clarity and that evaluating Rayong’s LSSCsM is done with ease. As illustrate in Figure 19, the yellow line illustrate ED, which consists of three sectors, the strongest sector acting as the driving force of Rayong’s LSSC being the corporate sector, while also showing the weaknesses in ED, including the citizen sector, which is a sector in need of improvement. The red line shows LSSCs characteristics, and here indicates that Smart Industry is the strongest characteristic of Rayong that should be expanded upon. smart logistics and smart agriculture, meanwhile, can also be expanded upon after some improvement. smart tourist as a characteristic is the weakest one, while education and health characteristics are difficult characteristics to improve and elevate.

6. Conclusions

This research presents a solution and the process through which SCsM that is considerate of LC and thus is suitable to a given city can be produced. This is done through a collection of 428 key indicators for development of SCs and St, referenced from ISO 37120, ISO 37122, ESTI-TS 103-463, ITU-TY 4901, ITU-TY 4902 and EU SCs Ranking Final Report. Selection and categorization procedures for these indicators are handled by local expertise. SCsM and StM are thus connected via selected economic factor set and other factor set chosen based on LC. The resulting indicator set is therefore well-rounded and multifaceted. Apart from the initial indicator selection process, EFA technique is also applied to LSSCs modeling to create LSSCsM. The qualitative input data is then subjected to EFA and calculated using statistical programs to build up LSSCs factor correlation structure, resulting in LSSCsM that recognize and fits with the unique features of a given city. Raw data obtained from Rayong’s treasury database is used to determine the best economic sector and characteristic of the province, using the index factor values of each LSSCs in such evaluation. On ranking the factors and characteristics using FLDM-PAR process, input data is separated into various categories based on related drivers and characteristics of LSSCsM. Two types of input data are taken, namely, quantitative data and qualitative data. Results are represented by index values as calculated by FIS, ED, and are separated into index values for citizen sector, corporate sector, and public sector, with the values being at 0.471, 0.855, and 0.611 respectively. This indicates that Rayong’s citizen sector needs improvement if better living condition and income are to be obtained for its citizens, while its corporate sector is already strong and is able to support industrial and business growth. The public sector, while moderately strong, has areas that can be improved upon.
In calculating the FLDM-PAR of Rayong’s characteristics using FIS, the resulting values for smart industry, smart logistics, smart agriculture, smart business, and smart tourist are 0.869, 0.601, 0.601, 0.581, and 0.346 respectively. This indicates Rayong having a strong industrial infrastructure and should strive towards becoming a smart industrial city. smart logistics and smart agriculture are the second and third highest-rated characteristics respectively and can be concurrently expanded upon and improved. Smart Business characteristic, however, needs improvement, and Smart Tourist characteristic is not in a position to be easily made into a strength.
LSSCsM solution used in this research was developed to be one that is generic. To reiterate, the solution is made to be flexible, with the indicator set used being interchangeable depending on the city or region the solution is applied to. Input variable and factors used, as well, are flexible and can be tuned to suit the LC of a given city. The goal of a LSSCsM solution is to create a SCsM that is well suited for the city or the region, and that the resulting SCs are those that are sustainable and ones that truly meet the demands of their communities and citizens.

Author Contributions

M.V. conceived and designed the content. All coauthors contributed equally to this editorial letter. All authors have read and agreed to the published version of the manuscript.

Funding

No external funding was recieved.

Conflicts of Interest

The authors declare no conflict of interest.

Abbreviations

The following abbreviations are used in this manuscript:
CoACentre of Area
EDEconomics Driven
EDSEconomics Driver Sector
EFAExploratory Factor Analysis
FAFactor Analysis
FISFuzzy Inference System
FLFuzzy Logic
FLDMFuzzy Logic Decision Making
FLEFuzzy Logic Evaluation
FMFFuzzy Membership Function
LCLocal Context
LSSCsLocal Smart Sustain Cities
LSSCsMLocal Smart Sustain Cities Model
LVLinguistic Variable
PARPriority Action Ranking
SCsSmart Cities
SCsMSmart Cities Model
StSustainability
StMSustainability Model
TMFTriangular Membership Function
VRMVarimax Rotation Method

References

  1. International Standardization Organization. ISO/DIS37122. Sustainable Cities and Communities—Indicators for Smart Cities; International Standardization Organization: Geneva, Switzerland, 2018. [Google Scholar]
  2. Gibson, D.V.; Kozmetsky, G.; Smilor, R.W. The Technopolis Phenomenon: Smart Cities, Fast Systems, Global Networks; Rowman and Littlefield: Boston, MA, USA, 1992. [Google Scholar]
  3. Lluisa, M.; Segal, M.E. The Intelligenter Method (I) for making “smarter” city projects and plans. Cities 2016, 55, 127–138. [Google Scholar]
  4. Kummitha, R.K.R.; Crutzen, N. How do we understand smart cities? An evolutionary perspective. Cities 2017, 67, 43–52. [Google Scholar] [CrossRef]
  5. Datta, A. A 100 smart cities, a 100 utopias. Dialogue Hum. Geogr. 2015, 5, 49–53. [Google Scholar] [CrossRef] [Green Version]
  6. Giffinger, R.; Fertner, C.; Karmar, H.; Kalasek, R.; Pichler-Milanovic, N.; Meijers, E. Smart Cities: Ranking of European Medium Sized Cities; Center of Regional Science, Vienna University of Technology: Vienna, Austria, 2007. [Google Scholar]
  7. Neirotti, P.; Marco, A.D.; Cagliano, A.C.; Mangano, G.; Scorrano, F. Current trends in smart city initiatives: Some stylised facts. Cities 2014, 33, 25–36. [Google Scholar] [CrossRef] [Green Version]
  8. Nam, T.; Pardo, T.A. Conceptualizing Smart City with Dimensions of Technology, People, and Institutions. Ann. Int. Conf. Dig. Gov. Res. 2011, 282–291. [Google Scholar] [CrossRef]
  9. Mode, V.; Varin, V.; Wanchai, R. The Novel Paradigm of “Economic Driven Smart City” to the Sustainability. In The 6th Asian Academic Society International Conference (AASIC), a Transformative Community: Asia in Dynamism, Innovation and Globalization; Mae Fah Luang University: Chiang Rai, Thailand, 2018. [Google Scholar]
  10. Mode, V.; Varin, V.; Wanchai, R. The Local and Sustainability context of Smart Cities Model, Thailand Prototype; structure formation by EFA-CFA method. In Proceedings of the UAC International Autumn Conference, Tokyo, Japan, 10–18 October 2019; pp. 38–49. [Google Scholar]
  11. Hollands, R.G. Will the real smart city please stand up? City 2008, 12, 303–320. [Google Scholar] [CrossRef]
  12. Trindade, E.P.; Hinnig, M.P.F.; Costa, E.M.; Marques, J.S.; Bastos, R.C.; Yigitcanlar, T. Sustainable development of smart cities: A systematic review of the literature. J. Open Innov. Technol. Market Compl. 2017, 3, 11. [Google Scholar] [CrossRef] [Green Version]
  13. Jong, M.; Joss, S.; Schraven, D.; Zhan, C.; Weijnen, M. Sustainable-smart-resilient-low carbon-eco-knowledge cities: Making sense of a multitude of concepts promoting sustainable urbanization. J. Clean. Prod. 2015, 109, 25–38. [Google Scholar] [CrossRef] [Green Version]
  14. Lee, S.H.; Han, J.H.; Leem, Y.T.; Yigitcanlar, T. Towards Ubiquitous City: Concept, Planning and Experiences. Igi Glob. 2008, 2008, 148–169. [Google Scholar]
  15. Anand, A.; Rufuss, D.W.; Rajkumar, V.; Suganthi, L. Evaluation of Sustainability Indicators in Smart Cities for India Using MCDM Approach. Energy Procedia 2017, 141, 211–215. [Google Scholar] [CrossRef]
  16. Evans, S. Smart cities more than broadband networks. Ottawa Business Journal, 25 September 2002. [Google Scholar]
  17. Graham, S.; Marvin, S. Splintering Urbanism: Networked Infrastructures, Technological Mobilities and the Urban Conditions. In Splintering Urbanism; Routledge: London, UK, 2007. [Google Scholar]
  18. Cheshire, P.; Magrini, S. Population growth in European cities: Weather matters—But only nationally. Reg. Stud. 2006, 40, 23–37. [Google Scholar] [CrossRef]
  19. Lambiri, D.; Biagi, B.; Royuela, V. Quality of life in the economic and urban economic literature. Soc. Indic. Res. 2007, 84, 1–25. [Google Scholar] [CrossRef] [Green Version]
  20. Santana, E.S.; Nunes, E.O.; Santos, L.B. The use of ISO 37122 as standard for assessing the maturity level of a smart city. Int. J. Adv. Eng. Res. Sci. (IJAERS) 2018, 5. [Google Scholar] [CrossRef]
  21. Huovila, A.; Bosch, P.; Airaksinen, M. Comparative analysis of standardized indicators for Smart sustainable cities: What indicators and standards to use and when? Cities 2019, 89, 141–153. [Google Scholar] [CrossRef]
  22. International Standardization Organization. ISO37120. Sustainable Cities and Communities—Indicators for City Services and Quality of Life, 2nd ed.; International Standardization Organization: Geneva, Switzerland, 2018. [Google Scholar]
  23. European Telecommunications Standards Institute. ETSI TS 103-463 Key Performance Indicators for Sustainable Digital Multi-Service Cities; Technical specification V1.1.1; European Telecommunications Standards Institute: Sophia-Antipolis, France, 2017. [Google Scholar]
  24. International Telecommunication Union. Recommendation: ITU-TY.4901/L.1601. Key Performance Indicators Related to the Use of Information and Communication Technology in Smart Sustainable Cities; International Telecommunication Union: Geneva, Switzerland, 2016. [Google Scholar]
  25. International Telecommunication Union. Recommendation: ITU-TY.4902/L.1602. Key Performance Indicators Related to the Sustainability Impacts of Information and Communication Technology in Smart Sustainable Cities; International Telecommunication Union: Geneva, Switzerland, 2016. [Google Scholar]
  26. European Smart Cities. Centre of Regional Science Vienna University of Technology. 2012. Available online: http://www.smart-cities.eu/model.html (accessed on 6 January 2020).
  27. Dall’O, G.; Bruni, E.; Panza, A.; Sarto, L.; Khayatian, F. Evaluation of cities smartness by means of indicators for small and medium cities and communities. Methodol. North. Italy Sustain. Cities Soc. 2017, 34, 193–202. [Google Scholar] [CrossRef]
  28. Lazaroiu, G.C.; Roscia, M. Definition methodology for the smart cities model. Energy 2012, 47, 326–332. [Google Scholar] [CrossRef]
  29. Almeida, P.F.; Barros, H.B. Towards indicators of sustainable product design. In Proceedings of the IEEE International: Engineering Management Conference, Bahia, Brazil, 17–20 September 2006; pp. 274–277. [Google Scholar]
  30. Hemdi, A.R.; Saman, M.Z.; Sharif, S. Sustainability evaluation using fuzzy inference methods. Int. J. Sustain. Energy iFirst 2011, 32, 169–185. [Google Scholar] [CrossRef]
  31. Verghese, K.; Hes, D. Qualitative and quantitative tool development to support environmentally responsible decisions. J. Clean. Prod. 2007, 15, 814–818. [Google Scholar] [CrossRef]
  32. Wefering, F.M.; Danielson, L.E.; White, N.M. Using the AMOEBA approach to measure progress toward ecosystem sustainability within a shellfish restoration project in North Carolina. Ecol. Model. 2000, 130, 157–166. [Google Scholar] [CrossRef]
  33. Zufia, J.; Arana, L. Life cycle assessment to eco-design food products: Industrial cooked dish case study. J. Clean. Prod. 2008, 16, 1915–1921. [Google Scholar] [CrossRef]
  34. Williams, M.; Vogt, W.P. The Sage Handbook of Innovation in Social Research Method; Sage Publications: Southend Oaks, CA, USA, 2011; pp. 365–380. [Google Scholar]
  35. Williams, B.; Onsman, A.; Brown, T. Exploratory factor analysis: A five-step guide for novices. J. Emerg. Prim. Health Care 2010, 8. [Google Scholar] [CrossRef] [Green Version]
  36. Thompson, B. Exploratory and Confirmatory Factor Analysis: Understanding Concepts and Applications; American Psychological Association: Washington, DC, USA, 2004. [Google Scholar]
  37. Kaiser, H.F.; Jiffy, L.; Mark, I.V. Educational and Psychological Measurement. 1974. Available online: ttps://journals.sagepub.com/home/epm (accessed on 6 January 2020).
  38. Bartlett, M.S. A note on the multiplying factors for various chi square approximation. J. R. Stat. Soc. 1954, 16, 296–298. [Google Scholar]
  39. Zadeh, L.A. Is there a need for fuzzy logic? Inf. Sci. 2008, 178, 2751–2779. [Google Scholar] [CrossRef]
  40. Singh, R.P.; Bailey, W.H. Fuzzy logic applications to multi-sensor and multi-target correlations. IEEE Trans. Aerospace Electr. Syst. 1997, 33, 752–769. [Google Scholar] [CrossRef] [Green Version]
  41. Abele, E.; Anderl, R.; Birkhofer, H. Environmentally—Friendly Product Development: Methods and Tools; Springer-Verlag London Ltd.: New York, NY, USA, 2005. [Google Scholar]
  42. Cornelissen, A.M.G.; van den Berg, J.; Koops, W.J.; Grossman, M.; Udo, H.M. Assessment of the contribution of sustainability indicators to sustainable development: A novel approach using fuzzy set theory. Agric. Ecosyst. Environ. 2001, 86, 173–185. [Google Scholar] [CrossRef]
  43. Rayong’s Treasury. Economic Report of Rayong Province; The Rayong Provincial Office of the Comptroller General’s Department. 2019. Available online: https://www.cgd.go.th/ (accessed on 6 January 2020).
  44. Office of the National Economic and Social Development Board. Twelfth National Economic and Social Development Plan Thailand; Office of the Prime Minister: Bangkok, Thailand, 2017. [Google Scholar]
Figure 1. Smart cities model based on the 6 dimensions of Giffinger (blue highlight means using).
Sustainability 12 00793 g001
Figure 2. Smart cities article literature review matrix.
Sustainability 12 00793 g002
Figure 3. Smart cities and sustainability economics core driven connection.
Sustainability 12 00793 g003
Figure 4. Research framework diagram.
Sustainability 12 00793 g004
Figure 5. Fuzzy inference system process flow diagram.
Sustainability 12 00793 g005
Figure 6. Three-degree of fuzzy membership function.
Sustainability 12 00793 g006
Figure 7. Fuzzy inference system (implication, aggregation and defuzzification processes).
Sustainability 12 00793 g007
Figure 8. The hierarchical structure of LSSCM factors.
Sustainability 12 00793 g008
Figure 9. LSSCs driver factor diagram.
Sustainability 12 00793 g009
Figure 10. LSSCs characteristics factor diagram.
Sustainability 12 00793 g010
Figure 11. LSSCsM economics driven: Kaiser-Meyer-Olkin (KMO), Bartlett’s test and reliability statistics from statistics program.
Sustainability 12 00793 g011
Figure 12. LSSCs economic driven: total variance explained from statistics program.
Sustainability 12 00793 g012
Figure 13. LSSCsM economics driven rotated component matrix from statistics program.
Sustainability 12 00793 g013
Figure 14. LSSCsM characteristics: KMO, Bartlett’s test and reliability statistics from statistics program.
Sustainability 12 00793 g014
Figure 15. LSSCsM characteristics: rotated component matrix from statistics program.
Sustainability 12 00793 g015
Figure 16. Local smart sustain cities model of Rayong.
Sustainability 12 00793 g016
Figure 17. LSSCs factor matrix of fuzzy logic input data.
Sustainability 12 00793 g017
Figure 18. LSSCsM economics driven and characteristics PAR by FLDM.
Sustainability 12 00793 g018
Figure 19. LSSCsM radar chart of Rayong.
Sustainability 12 00793 g019

