Assessing Impacts of CAP Subsidies on Financial Performance of Enterprises in Slovak Republic


1
Department of Economics and Economy, Faculty of Management, University of Prešov in Prešov, Konštantínova 16, 080 01 Prešov, Slovakia
2
Department of Informatics, Faculty of Economics, Technical University of Liberec, Voroněžská 13, 460 01 Liberec 1, Czech Republic
*
Author to whom correspondence should be addressed.
Sustainability 2020, 12(3), 948; https://0-doi-org.brum.beds.ac.uk/10.3390/su12030948
Submission received: 20 December 2019
/
Revised: 20 January 2020
/
Accepted: 27 January 2020
/
Published: 28 January 2020
(This article belongs to the Special Issue Trade Policy and Macroeconomic Impacts on Agricultural Sustainability)
Abstract
:Sustainability is a particularly crucial factor in policy formulation and analysis, including in the EU’s common agricultural policy. The common agricultural policy, through a subsidy policy, has caused a significant proportion of public funding to flow to agricultural subsidies, so it is appropriate to focus on the effect of these subsidies in the context of the sustainable development of EU agriculture. The impact of agricultural subsidies on business performance is of interest to policy makers. In agrarian practice, insufficient attention is paid to the legal form of agricultural performance, so our economic analysis focused on this area of research. The aim of the paper was to evaluate the effect of financial support in the form of subsidies resulting from the EU’s common agricultural policy and to verify its connection with the performance of agricultural enterprises in terms of the legal form in the context of sustainable development of the agricultural sector in Slovakia. No statistically significant linear correlation was found between farms’ performance results and the volume of subsidies per hectare of agricultural land for each legal form throughout the reporting period. In each analyzed year, business companies achieved a better overall assessment than agricultural cooperatives based on monitored parameters.
1. Introduction
The accession of the Slovak Republic to the European Union in 2004 brought positive stimulus in the agricultural sector, but also pressures on business. Positive aspects include the contribution of EU funds in the form of subsidies. On the other hand, greater competition from other member states and the higher standards required by the EU may be seen as important aspects of pressure. Over time, it can be seen that the EU’s common agricultural policy has had a certain impact on the development of the agricultural sector in Slovakia, as this sector is significantly regulated compared to the industrial or service sector. A significant part of the professional public deals with the issue of how the Slovak agricultural sector copes with this form of regulation. However, such regulation limits the functioning of agricultural enterprises in accordance with the principles of the market mechanism. The issue is very interesting in view of the above-mentioned context, but also because of the constant pressure to increase competitiveness and strengthen the sustainability of agricultural enterprises.
By joining the European Union in 2004, Slovakia made an important step in its historical development. Integration into the European Union has affected all areas of citizens’ economic and social lives. Structural changes that have occurred in Slovak agriculture after its accession to the EU are reflected in a number of areas. With regard to the size and structure of the area of agricultural land in Slovakia, changes were recorded associated with a decrease of agricultural land at the expense of an increase in built-up and other areas. The relatively high rate of arable land within agricultural lands in regions of Slovakia called for environmental actions focusing on soil conservation, which was mainly reflected in the increase of permanent grasslands [1]. Since 2004, there has been a significant shift in the structure of production. There are dominant commodities in the structure that are not labor-intensive, have lower added value, and allow the use of the economies of scale. The share of plant production has been increasing and the share of animal production significantly decreasing. Livestock production is not profitable, and support in the form of direct payments (SAPS—Single area payment system) favors farms on the basis of cultivated land. Only a small part of subsidies are directed to livestock production. This development also reflects the predominant monocultural-crop cultivation, which is more economically efficient than animal production. After 2004, there was a decline of agricultural holdings, including natural persons and agricultural co-operatives. In addition to co-operatives, limited-liability companies are also important, and their numbers have significantly increased [1,2]. Subsidies were granted under the same criteria and conditions to both legal forms. Business companies became more efficient and achieved lower revenue cost than that of agricultural co-operatives. Persistent differences in management efficiency in both legal forms are mainly due to the structure of production, with a preference for crop production over livestock and higher cost-effectiveness, especially labor costs. In recent years, agricultural co-operatives have internally transformed into capital companies, with majority shareholding of only a few members. Agricultural co-operatives also reduced labor-intensive sectors and employment. Higher management efficiency in business companies may reflect not only economies of scale with a lower share of mainly livestock production, labor-cost savings, but also higher sales of goods than in agricultural co-operatives [3].
The European Union’s agricultural sector is currently highly subsidized. The common agricultural policy (CAP), through various mechanisms, affects a wide range of societal issues, including agricultural production itself, as well as rural development, employment, and environmental protection. Subsidy policy also affects the economic performance of farms to a large extent. It is an essential factor that plays a significant role in farmers making optimal decisions for themselves. Therefore, the CAP is of interest to political leaders throughout the European Union [4]. Agricultural input subsidies, as a form of social protection, are often considered to be an important means of improving agricultural productivity in low- and middle-income countries. However, their effectiveness and efficiency remain contentious with respect to productivity, economic and consumer welfare measures, and food and nutrition security [5].
The persistent instability of the agricultural sector is the fundamental premise of most agricultural policies. The common agricultural policy is a core policy of the European Union, representing 40% of its budget and a cornerstone of the integration process. Due to the path dependency that defined its evolution, it has always been a rather homogeneous and centralized policy [6,7]. Gradual reforms have changed the market incentives for producers, consumers, and industrial users of agricultural commodities. When analyzing the EU’s common agricultural policy, we can focus on several effects. Domestic effects include the profits and losses of producers, consumers, and taxpayers, and effects on employment or performance and the sustainability of the agricultural sector itself. Internationally, the policy affects global commodity prices and the volume and structure of international trade in the agricultural sector. Although the structure of the EU’s common agricultural policy is rather complex, for the majority of production, the basic way it is implemented is through financial support.
In economic terms, a subsidy is defined as a payment by the government (or possibly some private individuals) that forms a wedge between the price that consumers pay and costs incurred by producers, so that price is less than marginal cost. Subsidies are used to transfer societal wealth to a particular class, to influence the supply or demand for a particular good, and most commonly, to complement a price-stabilization program. Classical economic theory holds that subsidies distort the market outcome that would not have occurred “absent the subsidy”, thereby creating inefficiencies in resource allocation that lower global welfare. Because subsidies provide a benefit to manufacturers from one country that competing manufacturers from other countries do not receive, subsidized manufacturers can more effectively compete in an export or domestic market [8]. Standard economic analysis of price subsidies considers the costs and benefits of subsidies in shifting farmers’ supply curves for agricultural produce. If there are no market failures, then a subsidy per unit output increases effective producer price above the market price. If the subsidy is addressing a market failure, then a subsidy per unit output would increase effective producer price above the market price. The increase in effective producer price causes a downward shift in the market-price supply curve. This leads to an expansion in supply and a fall in market or consumer price of the product, with an increase in both producer and consumer surplus [9].
According to Matthews [10], subsidies can have a positive as well as negative impact on farm behavior. On the one hand, subsidies can positively influence agricultural behavior through the wealth effect. Farmers may be more willing to expand production through activities that they would consider too risky in the absence of guaranteed income from direct payments. On the other hand, they can negatively affect agricultural productivity by distorting production structures of receiving farms. An obvious example is coupled subsidies, which maintain the position of farmers engaged in a loss-making business only for the purpose of drawing subsidies. Subsidies can lead to technical inefficiency or a lack of effort to find ways to reduce farm costs. They can also result in slight budgetary constraints, which means that farmers could overinvest and thus inefficiently use resources. More generally, subsidies help to maintain existing resources and channel resources for more productive use in response to new technologies or changing market conditions.
Under the EU’s common agricultural policy, current European agriculture has changed its character beyond recognition. The idea of a small farmer living in close contact with nature is idyllic and borders on the naive view of the contemporary man of the 21st century. In view of the growing population of the planet, laborers working the soil are forced to use hybrid and genetically modified crops for large-scale production. These ultimately pushes original crop types together with organic farms to the very edge of the market. By joining the European Union, the Slovak Republic undertook to comply with superior EU regulations, including those stipulating genetically modified organism (GMO) placement on the market. However, Slovakia continues to maintain a neutral attitude towards the cultivation of genetically modified crops, but advocates a unified approach to agreeing the final verdict at a European Union level. This is confirmed by the fact that GMOs were cultivated on only 100 hectares of agricultural land in Slovakia in 2013. For comparison, in 2018, no genetically modified plants were grown [11].
Efforts to restore the sector to a more competitive nature have led to various reforms of the EU’s common agricultural policy. Their consistent application of which should contribute to reducing the disproportion between supply and demand in the agricultural production market.
In order for the CAP to respond to new challenges, it is necessary to carry out reliable measurements and assessments of the economic development of European agriculture and to assess the impact of the policy on this development, particularly in the context of the sustainability of the agricultural sector. The concept of sustainability in agriculture has been analyzed in many scientific studies; the major approaches for assessing sustainability of farming enterprises have been discussed by Guth and Smędzik-Ambroży [12], Bachev [13], Aceleanu [14], Šťastná et al. [15], El Bilali [16], Agovino et al. [17], Czyzewski et al. [18], Gaillard [19], Bachev [20], Slatmo et al. [21], Mwambo and Furst [22], and others. The question of justice between generations in using exhaustible resources, intergenerational equity, and the theory of sustainable growth was also answered by Solow [23], Hartwick [24], and Common and Perrings [25]. Solow [23] argued that the finite pool of resources should be optimally used up according to the general rules that govern the optimal use of reproducible assets. In general, earlier generations are entitled to optimally draw down the pool so long as they optimally add to stock reproducible capital. From this point of view, the Solow-Hartwick model is also significant as an intuitive solution in keeping total capital constant according to the Hartwick rule of investing all rents from natural capital into renewable capital. This approach is known in the literature as weak sustainability [23,24]. Bachev [13] and Sulewski et al. [26] defined the sustainability of farming enterprises as the ability of farms to maintain their economic, social, and ecological functions over the long term. According to Harris and Goodwin [27], the basic premise of the concept of sustainable development is the conviction that it is necessary to maintain a balance (sustainability) in the three elements of the macrosystem: the economy, the environment, and the social system.
Persistent disagreement on the interpretation to be given to sustainability, and as to the relation between ecological and economic sustainability, has hindered the development of an ecological economics of sustainable resource use [25]. Common and Perrings [25] identified the main concepts of sustainability deriving from the two disciplines in order to explore the difference implied by an ecological approach to the problem. Ecological sustainability requires that the allocation of economic resources should not result in the instability of the economy-environment system as a whole.
It can therefore be said that only CAP subsidies, the value of which depends on production volume, i.e., for crop or livestock production, as well as for intermediate consumption, stimulate farm productivity growth. It means that EU agricultural policy is becoming policy that supports the sustainable development of agriculture. This was analyzed in a study by Madau et al. [28] that was aimed at highlighting the possible relationships between the challenges that the CAP faces if it is to guarantee sustainability in the sector and evaluating how promoting these policy priorities can affect sustainability. Also, according to Latruffe et al. [29], in recent decades, the concept of sustainability has become increasingly prominent in agricultural policy debates. This has led more stakeholders to pay attention to the questions of monitoring and evaluating agricultural practices, and raised the question of what are the appropriate indicators to assess sustainability aspects of given practices. The literature review shows that the environmental pillar has undergone an indicator explosion due to the multitude of themes covered and the attention given by society to this dimension of sustainability. By contrast, economic indicators target a relatively small number of themes. The main approaches for assessing the economic dimension of sustainability of farms are discussed by Zorn et al. [30], Gábor et al. [31], Špička et al. [32], Adamišin et al. [33], Matzembacher and Meira [34], Marcis et al. [35], Kleinman et al. [36], Kotulič et al. [37], Singh [38], and Medeiros et al. [39].
Subsidies from EU agricultural policy such as to less-favored areas (LFAs), agri-environmental areas, and set-aside and other subsidies for rural development increase the quality of the natural capital of rural areas, because farmers receive them for carrying out specific practices for the natural environment. On the other hand, decoupled payments, such as single farm payments, due to the lack of dependence between their value and production volume and their positive impact on the incomes of EU farmers, stimulate an increase in the economic and social sustainability of European agriculture [12,40].
The impact of agricultural subsidies on business performance is of interest to policy makers; economic theory, on the other hand, provides relatively little theoretical knowledge of this relationship. Among the few studies that tested the effect of implementing CAP subsidies on the structure of production, farm income, performance, and sustainability of the agricultural sector are those by Sarov and Kostenarov [41], Garrone et al. [42], Ciaian et al. [43], Kravčáková Vozárová and Kotulič [44], Rizov et al. [45], and Bojnec and Ferto [46].
The results of financial performance in agricultural enterprises are affected by a range of factors that are not present in other sectors. One factor that affects the performance of enterprises is the legal or organizational form of the business. In Slovakia, the specific structure of farms is different from that of almost any other member state of the European Union [47]. In agrarian practice, insufficient attention is paid to the issue of agricultural performance by legal form, so our economic analysis focused on this area of research.
The EU’s common agricultural policy aims to stimulate the sustainable development of agriculture, irrespective of the legal form of the agricultural enterprise. Therefore, the aim of the paper was to evaluate the effect of financial support in the form of subsidies resulting from the essence of the EU’s common agricultural policy and to verify its connection with the performance of agricultural enterprises in terms of legal form in the context of sustainable development of the agricultural sector in Slovakia.
2. Materials and Methods
Agriculture is a sector that spans several areas of life, and is dependent on a huge number of relationships. The state of agriculture in Slovakia is also influenced by relations related to its financing and ownership relations. Developments in this respect have been marked by the period of its transformation, privatization, and accession to the European Union. Since 2004, the most represented in terms of legal form were business companies and agricultural co-operatives. Despite the fact that support was provided to both forms under the same criteria and conditions, there are deepening differences in their economic results for several reasons. Persistent differences in economic results were caused by the impact of the formation of business companies, which mainly originated from the creditworthy parts of the property of the former agricultural co-operatives without adequately taking over liabilities to banks and other business partners, and without compensation of shares, which determined the lower production-cost ratio [48]. However, the agriculture co-operative as a legal form of business is still attractive to farmers. Despite the transformation of agricultural co-operatives into business companies, such co-operatives exist in Slovakia that fulfill their role in the agrosector and are even in profit. It is necessary to measure the performance of agricultural enterprises in terms of several criteria, which is why it is appropriate to use different models of multicriteria decision making. To determine the order of performance of individual farms in terms of legal form, we used a new approach to the ranking of alternatives with interval data for group decision making, the TOPSIS method, where the basic step was to construct a criterion matrix. Ratios of financial analysis were selected as evaluation criteria. Successful business and farm performance are also closely linked to the use of financial support, because it improves the modernization of the whole sector and creates better relations with banks.
On the basis of the mentioned above, two hypotheses were set for the study:
Hypothesis 1.
We assume that there is a statistically significant difference between the monitored parameters of groups of enterprises working the soil in the Slovak Republic for the period 2005–2014 by legal form.
Hypothesis 2.
We assume that there is a statistically significant correlation between the volume of subsidies per hectare of agricultural land and the result of technique for order of preference by similarity to ideal solution (TOPSIS) in 2005–2014 in terms of the legal form of the business.
The data for the analysis were drawn from data of agricultural companies (balance sheets, profit and loss statements) provided by the Ministry of Agriculture and Rural Development of the Slovak Republic in the form of information sheets on anonymized agricultural subjects. The information sheets captured the economic data of the entities that cultivate 81.3% of the agricultural land in Slovakia (1,930,570 ha), and were the basis for the analysis of year-on-year development tendencies of selected economic and financial indicators. This was the main source of information related to the real economic situation of agricultural holdings, therefore it should be noted that this database forms a sufficiently extensive basis for the underlying data and that the statistical sample was representative. The research sample was made up of the enterprises listed in Table 1, which shows the representation of agricultural enterprises in the research sample by legal form. There was higher representation by trading companies, especially limited liability and joint stock companies, which outnumber agricultural cooperatives in Slovakia. The evaluated file included subjects with up to 19 and over 20 employees. Cooperative organizations are emerging by having a philosophy that prioritizes collective rights over individual rights. Currently, cooperativeness can be found in several branches of economic activity, yet there is a great adhesion of cooperativeness in the agricultural sector [49]. From the point of view of time series analysis, the work focuses on the period from 2005 to 2014, since a final and complete database of data was available for this period. All abbreviations are listed in Table A1 in the Appendix A.
The performance of selected companies was quantified based on TOPSIS. In order to quantify the efficiency and financial performance of selected agricultural enterprises, the following ratios for TOPSIS were selected, which characterize the profitability, activity, liquidity, and stability of Slovak agricultural entities (see more in Table A2 in the Appendix B):
Profitability ratios: return on total assets (ROA), return on sales (ROS)
Activity ratio: days payable outstanding (DPO)
Liquidity ratio: quick ratio (QR)
Stability ratios: self-financing ratio (SFR), interest coverage ratio (ICR)
A company’s financial position is determined by its financial balance, indebtedness, solvency, maintenance of real value of equity, and reproductive ability. A bad financial position of a company is a consequence of a lack of financial balance and the inability to maintain an acceptable level of liquidity. A bad financial position of most agricultural companies indicates the problem of the agricultural sector as a whole, which requires systemic measures by strengthening the financial position and therefore the economic position of agricultural activity [50]. Financial metrics systems help managers to generate the concept of development, to choose the right strategy, and to plan all financial aspects in the short or long term [51].
Data on the volume of subsidies also came from information sheets of the Ministry of Agriculture and Rural Development of the Slovak Republic. These were payments received directly by agricultural enterprises of a concrete legal form for a given period of time. When compiling the analysis, we worked with data in the form of subsidies per hectare of agricultural land according to the land parcel identification system (LPIS). These were mainly noninvestment subsidies, which constituted single area payments, separate sugar payments, separate fruit and vegetable payments, dairy cow payments, separate payments for tomatoes, aid for energy crops, complementary national direct payments, area payments for arable crops, payments for hops, payments for tobacco, payments for livestock production, and payments for large livestock units.
Investment subsidies were represented by support according to revenues of the Ministry of Agriculture and Rural Development of the Slovak Republic; the SAPARD program; the sectoral operational program; the Rural Development Plan for 2004–2006, 2007–2013, and 2014–2020 for less-favored areas (LFAs); basic support/scheme; integrated support in fruit production; integrated support in vegetable production; integrated support in viticulture; organic farming; erosion protection; grassing of arable land; conservation of protected grassland habitats; selected habitat protection species of birds; breeding and maintaining endangered animal species for animal welfare; and the Operational Programme for Fisheries.
From the methodological approach, logical methods, financial analysis methods in the form of ratio indicator analysis, and multicriteria TOPSIS analysis were used. Differences between parameters were statistically tested, and linear regression was used to extrapolate significant parameters.
The basic method whose results were further subjected to statistical verification was TOPSIS, which is a multiple-criteria decision-making (MCDM) method [52,53]. Multicriteria decision-making has become a rapidly growing concept in the last decade, reflecting constant changes in individual sectors of the economy [54]. The problem addressed by the MCDM method is to find and evaluate the most optimal variant within the available options according to predetermined parameters [55,56]. TOPSIS, according to Shih et al. [57] and Vavrek and Chovancová [58], allows for solving and analyzing the situation, comparing alternatives, and ordering them. In the empirical part, we evaluated the overall development of six selected financial ratios of agricultural enterprises for the monitored period of 2005 to 2014. The development of these indicators was monitored in enterprises of different legal forms. Subsequently, multicriteria analysis was performed on these indicators using TOPSIS. This method assessed the variants in terms of their distance from ideal and basal variants. It required a cardinal evaluation of the variants according to the individual criteria and their weights. Using TOPSIS, we determined the overall economic performance of agricultural enterprises in Slovakia depending on their legal form.
The calculation of TOPSIS was performed according to Vavrek et al. [59], who described the following six steps:
- (1)
- Compile the criterion matrix:where Ai is the ith alternative, and Xij is the value of the jth parameter achieved by the ith alternative.
- (2)
- Compile the normalized criterion matrix using the following formula:
- (3)
- Assign weights to parameters:where vij is the weight of the normalized value and wij is the weight of the parameter.
- (4)
- Identify positive ideal solution (PIS) and negative ideal solution (NIS) alternatives. These alternatives consist of real values, in most cases hypothetical alternatives:where Hj is PIS and Dj is NIS.
- (5)
- Calculate the distance from these alternatives:where d+ is the distance from PIS alternative and d– is the distance from NIS alternative.
- (6)
- Calculate the relative distance from the PIS alternative:where ci is relative distance from the PIS alternative.
3. Results
Subsidies are part of public finance linked to the existence and activity of the public sector and public administration. The CAP has caused a significant proportion of public funding to flow to agricultural areas, so it is appropriate to focus on the effect of these subsidies in the context of the sustainable development of EU agriculture. It is important to measure the degree of dependence of the economic result and the performance of enterprises themselves with subsidy support. The goal of the empirical part was therefore to clarify the link between the macro level, in the form of EU agricultural policy and its activities, and the micro level, represented by specific selected enterprises in the Slovak Republic. Therefore, in the analytical part we investigated the strength of the interdependence of the performance of agricultural enterprises in Slovakia from subsidies based on the common agricultural policy of the EU, whose planning, implementation, and control are part of public administration at the supranational and national level.
3.1. Development of Results of Ratios of Financial Analysis of Enterprises by Legal Form
By means of selected ratios of financial analysis, we evaluated the overall development of economic results in the period under review for agricultural enterprises by legal form. We looked more closely at the overall development of the six financial ratios, which outline the economic development of enterprises over the reference period of the 10 years examined (Table 2).
We analyzed the economic development of enterprises of two types of legal forms. These were agricultural cooperatives, a historically very important group of agricultural enterprises in Slovakia, and business companies, which were mainly represented by limited liability companies and, to a lesser extent, joint stock companies. The business structure at the beginning of the period under review was influenced by the still ongoing transformation of agricultural primary production entities, the ongoing restructuring of the food sector, and differentiated demand for services. At the beginning of the period, business companies, in particular limited liability companies, were dominant. On the other hand, agricultural cooperatives, despite the continuing decline in the number of entities, retained the largest share, up to 45% of the area under management, and had the highest average area of agricultural land [60].
Differences persisted in business results of the above-mentioned legal forms throughout the reporting period. These differences in the efficiency of management in different legal forms were due to the structure of production, with a preference for crop production over livestock and higher cost-effectiveness, mainly labor costs in business companies [61].
The first parameter in the analysis of economic development by legal form was ROA. The results show that a higher value of this ratio was achieved by business companies during the whole period under review. The highest level of ROA was reached by both legal forms in 2007. Commercial companies achieved ROA at 9.57%; for agricultural cooperatives it was at most 3.52%. Both groups of legal forms had the largest decline in ROA in 2010, due to the fact that the entire agricultural sector achieved a negative economic result in that year.
When looking at the development of ROS ratio, business companies again performed better. In their overall development, there were no major year-on-year changes, as compared to agricultural cooperatives. The development of ROS had a very dynamic trend when looking at agricultural cooperatives. The reason was also a significant decrease in rentability of sales in 2010 and 2013, i.e., in the years when the agricultural sector in Slovakia experienced a significant loss in management. On the other hand, the highest ROS level (14.58%) was reached by business companies in 2009, and for agricultural cooperatives, the highest ROS level in the 10 years surveyed was reached in 2007 (9.40%).
From the point of view of DPO, we could consider 2010 as the least successful year for both types of legal forms, i.e., the year when the global crisis was fully reflected in the agricultural sector, not only in Slovakia. Agricultural cooperatives achieved better DPO results than business companies. Both saw an increase in DPO, and had very similar trends. In 2005, business companies needed only 188 days on average to pay their liabilities, and in 2014 it was 60 days more. The situation was similar for agricultural cooperatives, which settled their commitments in 118 days on average in 2005, while in 2014 they needed 50 days more to pay.
With regard to the quick ratio, business companies achieved better results. Their QR value was lower than that of agricultural cooperatives, and the average was 1.3. Agricultural cooperatives exceeded the optimum value of this indicator each year, and the average value was around 2. In practice, this shows that very high values of this indicator are not desirable, as they indicate that the company is not using its cash productively, which reduces its profitability. In this respect, 2007 was the least successful year for both business companies and agricultural cooperatives.
On the other hand, in the case of SFR, agricultural cooperatives achieved a better position. They were able to cover their own needs up to 60–65%. Worse results were achieved by business companies, whose performance was almost half that level, 32–36%. These lower SFR values also represented an increased credit risk value. Thus, under this indicator, business companies constituted a less financially independent group with lower financial stability and business autonomy than agricultural cooperatives. The share of own funds in assets was the lowest for agricultural cooperatives in 2013, while for business companies it was at the very beginning of the period, 2005.
In the analysis of ICR, business companies reached a better position. They achieved positive values throughout the period under review, above the optimum level, with the exception of 2010 and 2013. On the other hand, a fluctuating trend in the development of the indicator was seen for agricultural cooperatives. Even in 2010 and 2013, values of interest coverage ratio were negative, suggesting that agricultural cooperatives did not have sufficient resources to cover payments of interest expenses. On the other hand, 2007 was the most successful year with regard to this parameter for both legal forms.
3.2. Development of Results of the Volume of Subsidies Provided to Enterprises by Legal Form
In 2005, i.e., the first full year after the accession of the Slovak Republic to the EU, and after implementation of the rules of the EU’s common agricultural policy in Slovakia, the volume of subsidies per hectare of agricultural land amounted to €191.34. An upward trend was registered until 2010, when this value was €353.88 on average.
This was the highest amount of subsidies granted per hectare of agricultural land during the whole period considered, since 2010 was the year when the global financial crisis was peaking and the agricultural sector had a negative economic result. This was also due to a downward trend in yields, which was due to lower production replaced by increasing imports. However, a significant share of farm yields was achieved by support from the European Union. Without these subsidies, agriculture would have been even more unprofitable. The subsidies thus became a motivating factor for and financial stabilizer of agricultural enterprises in that year [62].
Between 2010 and 2014, the value of subsidies per hectare of agricultural land gradually decreased. In 2012, this figure was €299.41 on average, and in 2014 it was only €280.08.
When analyzing the volume of subsidies per hectare of agricultural land in terms of legal form, we observe the same trend as when looking at the results for the whole Slovak Republic. The highest volume of subsidies was received by enterprises of individual legal forms in 2010. In 2005 agricultural cooperatives received €193.51 on average, and in 2010 it was about 103% more, an average of €394.48. This support gradually decreased to €292.08 in 2014. Business companies received an average of €189.56 in 2005, and 42% more in 2010, i.e., €325.33. For business companies, the volume of financial support per hectare of agricultural land also decreased from 2010 to €273.30 in 2014. A greater volume of agricultural subsidies per hectare of agricultural land flowed into agricultural cooperatives, although the subsidy support was granted under the same criteria and conditions for both legal forms.
3.3. Development of TOPSIS Results by Legal Form and Their Relation to the Volume of Subsidies
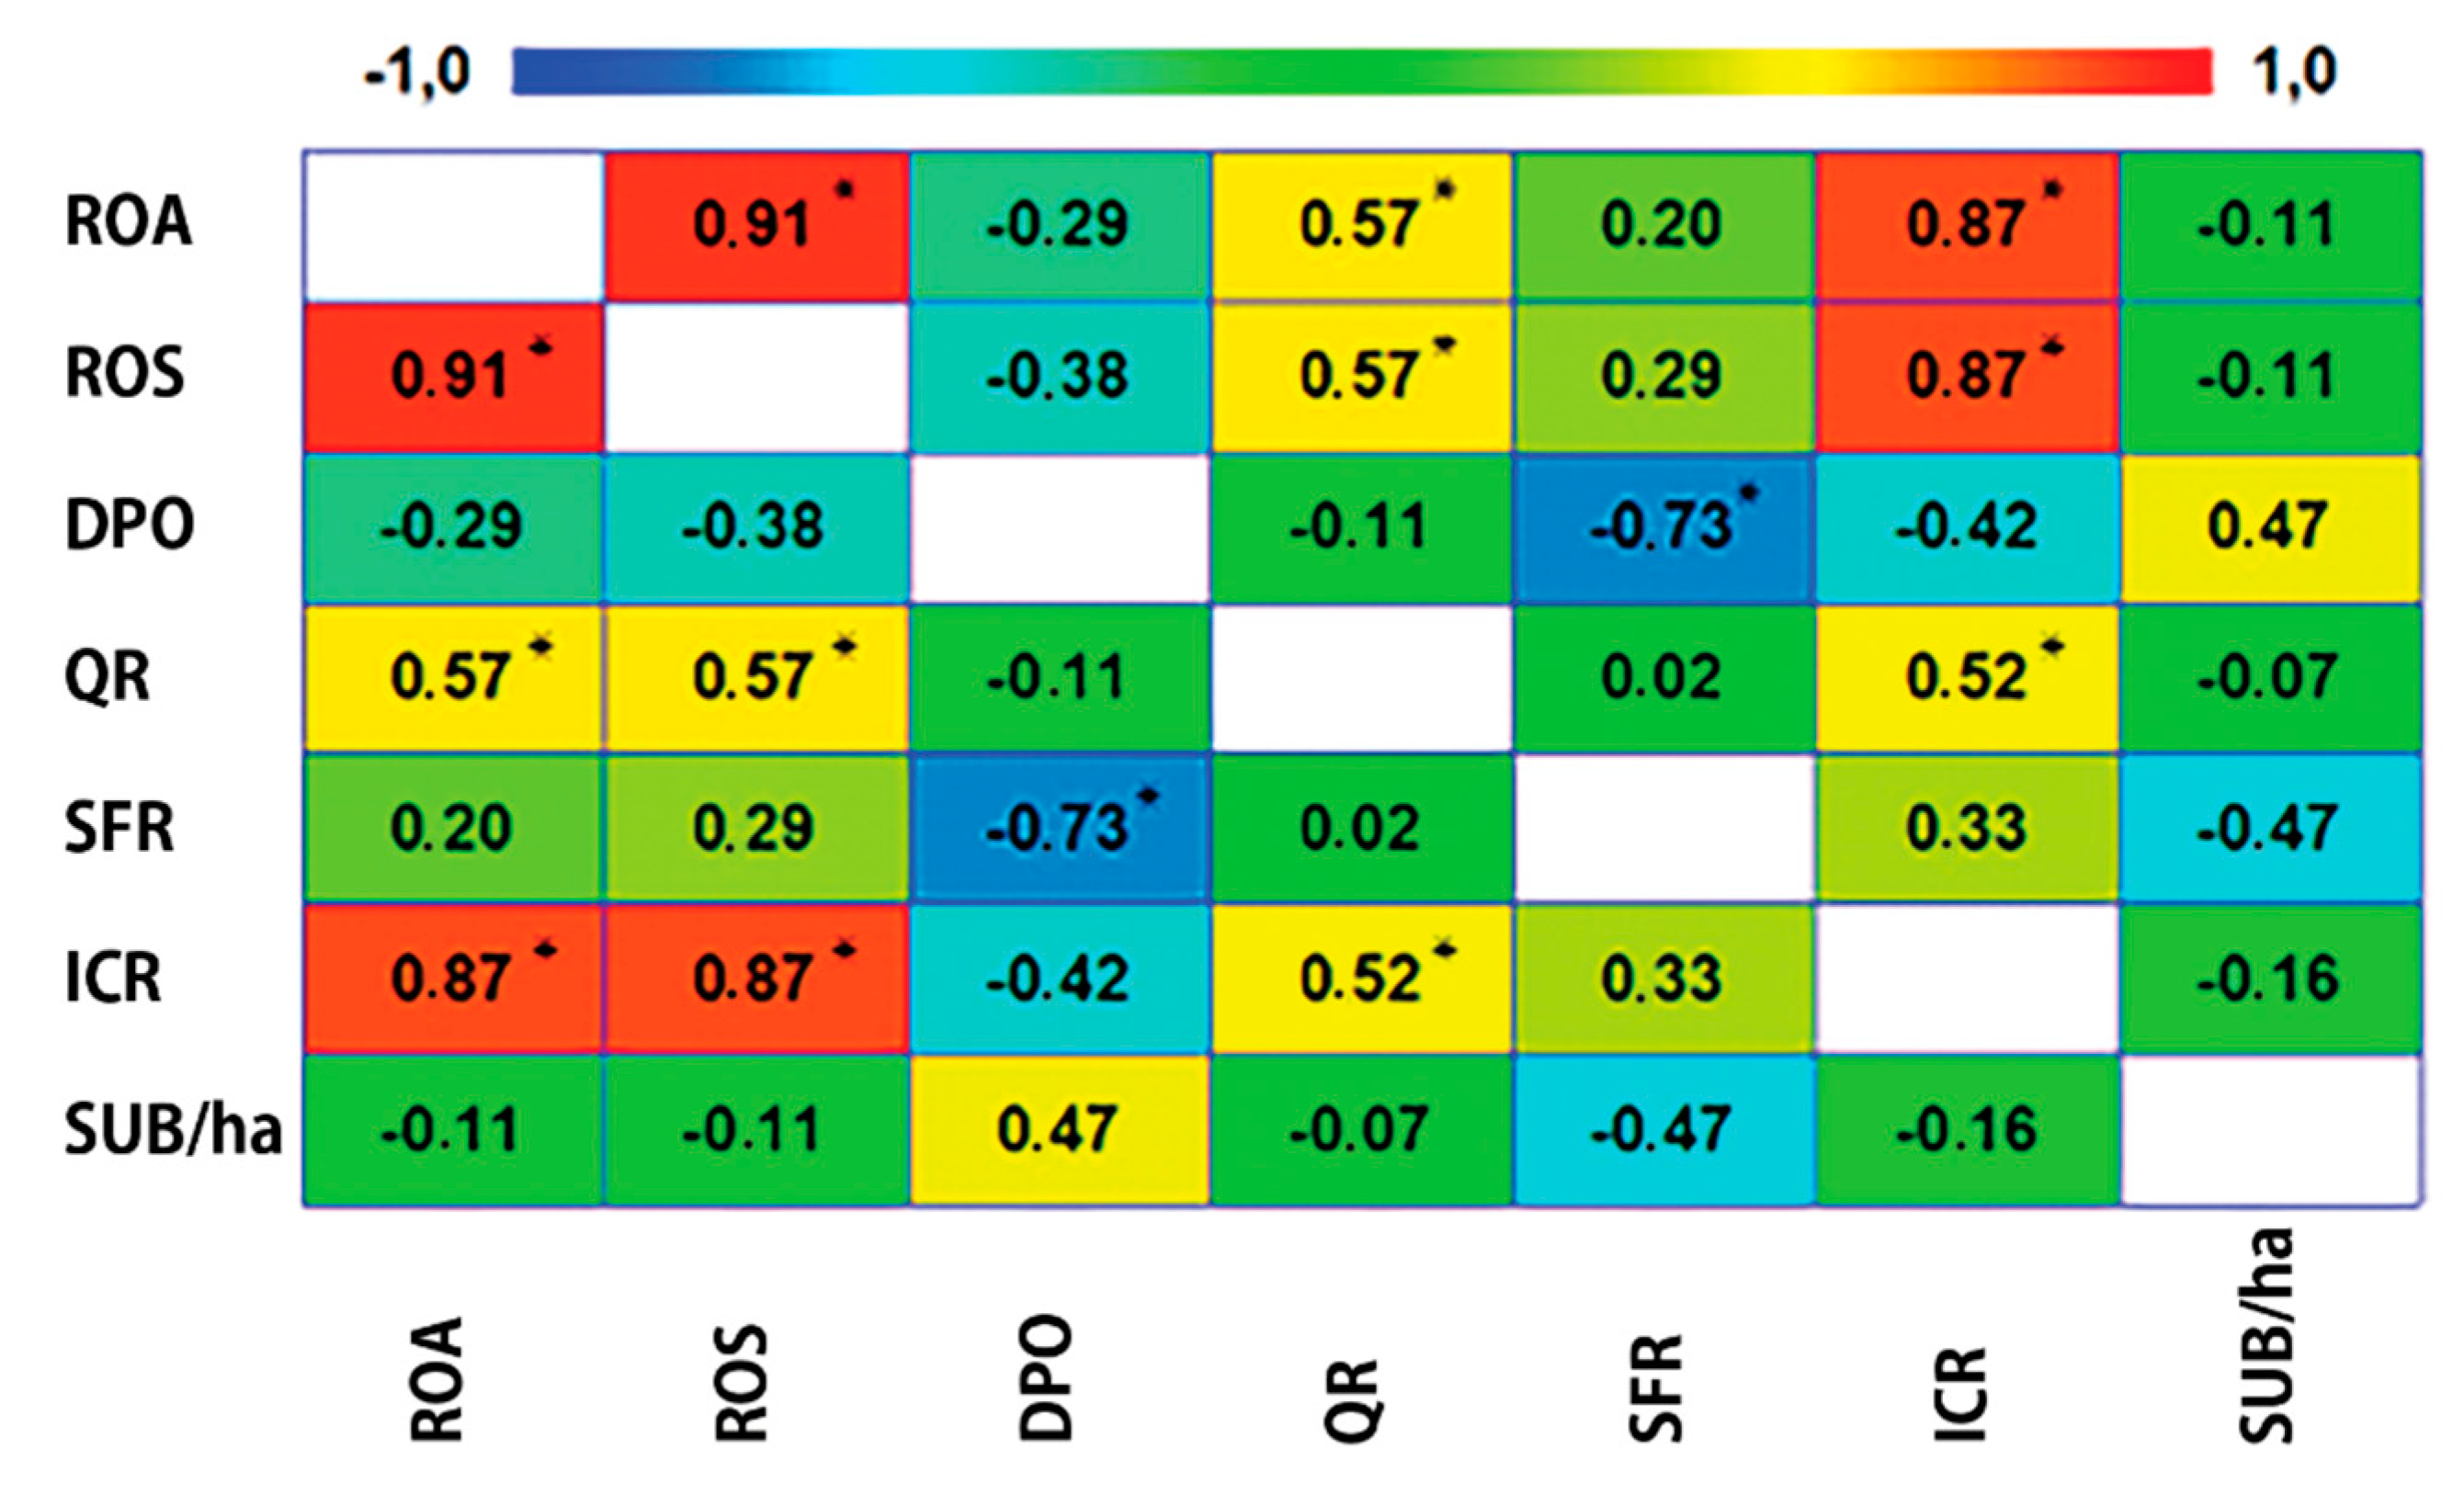
The differences between the legal forms were confirmed for all six parameters. In the group of agricultural cooperatives an almost perfect correlation was observed between ROS and ROA, and a very large correlation between them and ICR. An interesting conclusion was the very large negative correlation between SFR and DPO (Figure 1), i.e., at the same time, companies with higher self-financing rates paid their liabilities in a shorter period of time.
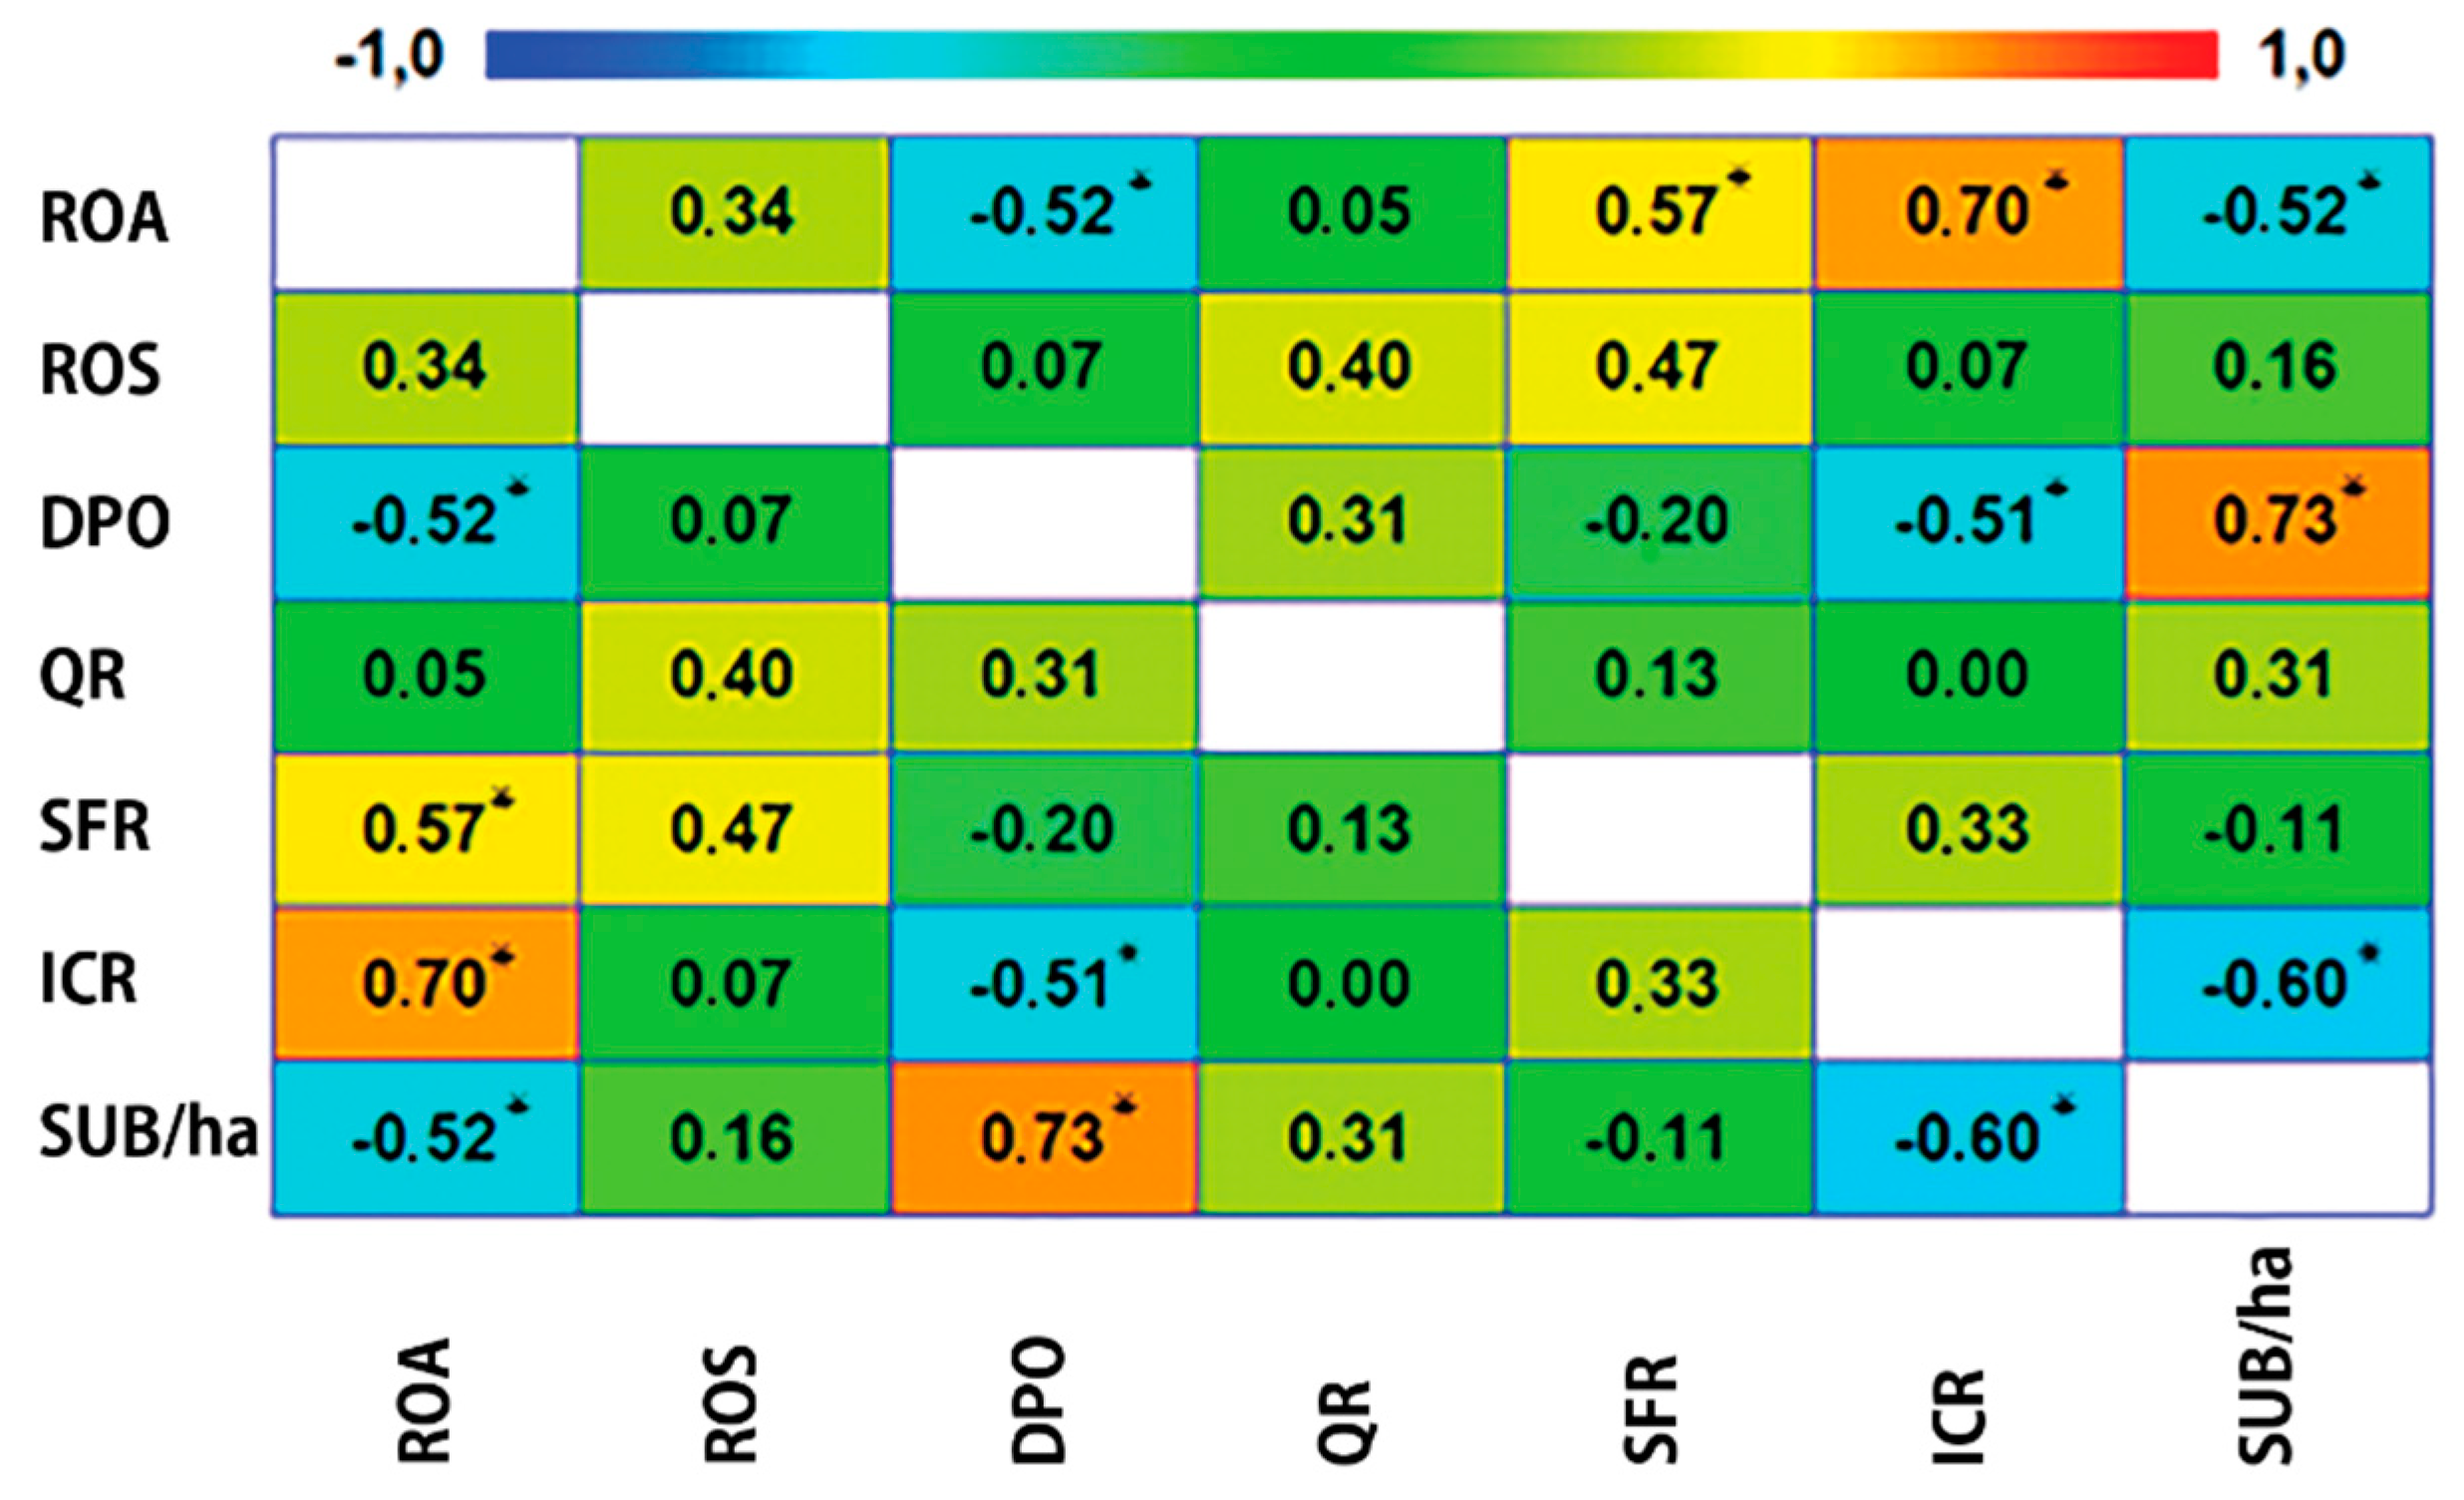
A significantly different situation was documented by the correlation matrix of business companies (Figure 2). ROS did not correlate linearly with any parameter and the relationship between ROA and ICR was confirmed. There was a statistically significant negative correlation between subsidy per hectare of agricultural land and return on total assets and interest coverage ratio, i.e., companies with worse economic results received more subsidies.
The presented correlation matrices point to differences in the management of legal forms in the territory of the Slovak Republic and at the same time confirm the differences between individual parameters observed in this study identified above.
TOPSIS evaluated the variants using the relative distance from the PIS alternative based on established parameters. We evaluated two alternatives (AC and BC) within this section, and their result was determined by the observed differences (Table 3). In each of the 10 years analyzed, business companies achieved a better overall rating based on the monitored parameters. The most significant difference was seen in 2010, while the most balanced was the management of these legal forms in 2012.
Because one result was determined by the other and complementarily their sum was 1, the normal distribution of both files was the same (WAC = WBC = 0.913; p = 0.294). This was also the reason for the full agreement of their variance, which was confirmed by the Levene test (LE = 0; p = 1). Based on the results of one-factor analysis of variance, we concluded the difference between the management of legal forms (Table 4) evaluated using TOPSIS, i.e., hypothesis 1 was confirmed.
Table 5 shows the relationships between the parameters and the legal forms of the subjects analyzed. In the case of agricultural cooperatives, the volume of subsidies recalculated per hectare of agricultural land did not directly or indirectly correlate linearly with any of the six monitored parameters. In the case of business companies, it was possible to observe a significant correlation of subsidies per hrectare of agricultural land with three parameters: ROA, DPO, and ICR.
A separate part of the analysis was conducted by monitoring the dependence of the results of agricultural enterprises of individual legal forms on the volume of provided subsidies per hectare of agricultural land according to LPIS. There was no statistically significant linear correlation at the level of individual legal forms over the whole reporting period, as shown in Table 6, i.e., hypothesis 2 was not confirmed.
4. Discussion
Taking into account the fundamental importance of agriculture in the areas of food security, livelihood, and population income, as well as the importance of the sector in terms of overall economic growth, there is a need for individual countries to implement effective strategies to solve such problems that enterprises in this sector are confronted with. The agricultural sector is subjected to a wide range of policies as well as specific measures throughout the economy. Since it is, in our view, a particularly sensitive sector, there are a number of positive and negative incentives that could affect its performance, productivity, and sustainability.
According to Chovancová and Adamišin [63], such negative incentives in Slovakia include strong competition of agricultural entities against market concentration of entities providing inputs into agriculture and unmanaged transformation of agricultural enterprises, but also significantly less state support than in other developed countries. The authors expanded on the generally accepted premise of the three pillars of sustainable development. According to them, it is not possible to talk about the sustainable development of Slovak agriculture in the monitored period from either the economic, social, or environmental aspect. Typical features of the economic pillar of long-term (un)sustainability are, e.g., the economic result of the sector as whole, the number of companies in liquidation, and the fall in foreign trade in agricultural commodities. It is possible to perceive unsustainability of development from a social point of view in the decline in employment in agriculture and in the growing wage gap between agriculture and other sectors of the national economy. Economic sustainability must also be complemented by environmental sustainability, otherwise it cannot be ensured.
Economic sustainability is also objectively determined by a number of nonfinancial factors, which often cannot be prevented or predicted by a business entity. A typical example of such an impact is weather. Eliminating the negative impacts through various management activities is significantly limited in this case [64].
Chrastinová et al. [65] argued that agricultural subsidy policies influence farmers’ optimal decisions through various mechanisms. There are reasons why a positive relationship between subsidy amounts and farm performance can be expected. If payments help to advance the technological development of the receiving farms, providing an incentive for innovation and a transition to new technologies, then their performance also improves. Rizov et al. [66] stated that subsidies reduce farm credit constraints and reduce risk aversion, which could also have a positive impact on farm productivity.
This study offers an innovative analytical and methodological approach in the field of agricultural sector evaluation in terms of efficiency and economic performance. It combines the micro level in the context of the above-mentioned agricultural enterprises and the subsidies granted to them, along with the macro level in the form of the EU’s common agricultural policy and the analysis of its effects.
Based on an analysis of the differences between the legal forms using mathematical and statistical methods, we can conclude that they are distinguished in all monitored parameters. Also, according to the study of Adamišin et al. [33], the legal form seems to be the key factor, because for business companies, it allows efficient management (also by concentration of company ownership), a higher level of motivation, and a concentration of ownership and responsibility. The differences in the management of these legal forms were also confirmed in the study by Kravčáková Vozárová et al. [67], which was based on the results of one-way analysis of variance and an evaluation of TOPSIS. A similar problem was analyzed by Chrastinová and Burianová [68], who confirmed that legal forms of business operations also contribute to performance differences. The differences between results achieved by individual legal forms have been caused by natural conditions, and by the performance of company management. Ogorodnikov et al. [69] argued that important among the factors that shape the financial stability of the economic entity, is the human factor (decision makers). These results are also consistent with the findings of Adamišin et al. [33], whose conclusions are related to economic theory and the phenomenon known as the principal–agent problem. The analysis results show that in addition to the factors of production (labor, capital, and natural resources), agricultural enterprises also need subjective assumptions such as imagination, ambition, willingness to bear risk, better organizational and management skills, patience, and a sense of innovation. Those who hold these assumptions are mostly companies with management structures that can effectively solve how to organize and manage different business processes to save transaction costs. According to Brandano et al. [70], the resilience of cooperatives and their positive contribution to employment in times of crisis are well established. However, their overall economic performance relative to business companies is still controversial, casting doubt on their ability to govern the fundamental drivers of productivity. The findings of that study, which survive correction for spatial correlations, indicate that cooperatives are less technically efficient than other legal forms.
Wang et al. [71] confirmed that agricultural subsidies are an important strategy to improve farm incomes and alleviate their poverty. However, their application is also very difficult given the socioeconomic dimensions of the receiving farms. Based on the findings of the study, they concluded that the performance results and objectives of the support program through agricultural subsidies were very close to each other. The objective of designing a subsidy policy in the context of ensuring fair access and promoting more productive use of inputs and thus improving performance has not been fully realized. This is confirmed by our analysis of the Slovak Republic.
5. Conclusions
The purpose of the analysis was to verify the validity of the research hypotheses by means of mathematical–statistical methods, subsequently identifying theoretical and practical consequences and possible limitations for the research area, and giving a possible direction for future research. We have come to several conclusions by synthesizing the knowledge resulting from the analysis performed in this study. We confirmed a significant difference in identified correlations between individual parameters, a better overall rating of business companies, and differences between legal forms in all monitored parameters. From the conclusions, we can also confirm a statistically significant negative link between the volume of subsidies per hectare of agricultural land and ROA and ICR, i.e., enterprises with worse economic results received more subsidies. The legal form of the holding was not a determinant affecting the amount of subsidies per hectare of agricultural land. In the case of agricultural cooperatives, subsidies per hectare of agricultural land did not correlate linearly with the result of evaluation using TOPSIS or individual monitored parameters, but in the case of business companies, we observed a significant correlation of subsidies per hectare of agricultural land with ROA, DPO, and ICR.
The common agricultural policy of the European Union is one of its oldest and most controversial policies. Possible scenarios for future reforms of the CAP are currently being discussed. They vary in terms of the extent and type of intervention and consequently the welfare effects on different social groups [72]. The problems of the agrarian market will, in principle, continue to be repeated to a greater or lesser extent, therefore the process of the current reform of the EU’s common agricultural policy is not complete. In order to increase the competitiveness of agricultural production, the necessary pressure should be put on economic rationality, which should manifest itself in particular in the economy and efficiency of resource valorization. Linking subsidies to compliance with legislation on the environment, food safety, plant and animal health, and with the requirement to maintain farmland in good condition must become necessary to guide the activities of agrarian enterprises in the future. For this reason, the support system (subsidies, taxes, budgets) will likely continue to play a fundamental role in stabilizing the agrarian sector in the European Union and Slovakia for a long time.
The analysis presented here deals with a highly topical issue, which has been resonating beyond the European Parliament. The study brings a clear analytical sequence examining the effects of subsidies on the economic results of entities in the agricultural sector in Slovakia. In further research, we recommend including more aspects, such as the amount and type of production, the state of the supply of tangible and intangible resources, the size of farms, technology used, or marketing and management aspects, in order to conduct a comprehensive evaluation that can better reflect the real situation of the management of agricultural entities in the Slovak Republic. A multidimensional analysis could be undertaken, because not only economic but also noneconomic factors are important in the overall economic situation of farms. The results of this study are interesting, especially in the context of the size of the research sample. Due to the scope of the research sample and the time frame for the analysis, we did not record any further studies on this issue to be carried out in the Slovak Republic.
Author Contributions
Conceptualization, I.K.V.; methodology, I.K.V. and R.V.; software, I.K.V., R.V.; validation, R.K.; formal analysis, I.K.V.; resources, I.K.V., R.K.; data curation, R.K.; writing—original draft preparation, I.K.V., R.V.; writing—review and editing, R.K.; visualization, I.K.V., R.V.; supervision, R.K.; project administration, R.K.; funding acquisition, R.K. All authors have read and agreed to the published version of the manuscript.
Funding
This research was funded by the Scientific Grant Agency of the Ministry of Education, Science, Research, and Sport of the Slovak Republic and the Slovak Academy of Sciences, grant numbers VEGA 1/0578/18 and VEGA 1/0082/19; and by the Cultural and Educational Grant Agency of the Ministry of Education, Science, Research and Sport of the Slovak Republic, grant numbers KEGA 011PU-4/2019 and KEGA 024PU-4/2020. This research was also supported by the OP VVV–International Mobilities of Researchers of the TUL [CZ.02.2.69/0.0/0.0/16_027/ 0008493].
Acknowledgments
This research was also supported by the Scientific Grant Agency of the Ministry of Education, Science, Research and Sport of the Slovak Republic and the Slovak Academy of Sciences and the Cultural and Educational Grant Agency of the Ministry of Education, Science, Research and Sport of the Slovak Republic. The authors also thank the journal editor and anonymous reviewers for their guidance and constructive suggestions.
Conflicts of Interest
The authors declare no conflict of interest. The funders had no role in the design of the study; in the collection, analysis, or interpretation of data; in the writing of the manuscript, or in the decision to publish the results.
Appendix A

Table A1.
Abbreviations of variables used.
| Abbreviation | Meaning |
|---|---|
| AC | Agricultural cooperative |
| ANOVA | Analysis of variance |
| BC | Business company |
| CAP | Common agricultural policy |
| DPO | Days payable outstanding |
| EBIT | Earnings before interest and taxes |
| ICR | Interest coverage ratio |
| LFA | Less favored area |
| LPIS | Land parcel identification system |
| MCDM | Multiple-criteria decision-making |
| NIS | Negative ideal solution |
| PIS | Positive ideal solution |
| QR | Quick ratio |
| ROA | Return on total assets |
| ROS | Return on sales |
| SFR | Self-financing ratio |
| SUB/ha | Subsidies per hectare of agricultural land |
| SAPARD | Special accession programme for agricultural and rural development |
| SAPS | Single area payment system |
| TOPSIS | Technique for order of preference by similarity to ideal solution |
Appendix B
Table A2.
Methods of calculating individual ratios.
| Ratio Indicator | Formula |
|---|---|
| ROA | EBIT/total assets |
| ROS | EBIT/total sales |
| DPO | Current liabilities/(total sales/number of days) |
| QR | Current assets—inventory/current liabilities |
| SFR | Equity/total assets |
| ICR | EBIT/interest expense |
| SUB/ha | Total subsidies/hectares of agricultural land |
References
- Némethová, J.; Dubcová, A.; Kramáreková, H. The Impacts of the European Union’s Common Agricultural Policy on Agriculture in Slovakia. Morav. Geogr. Rep. 2014, 22, 51–64. [Google Scholar] [CrossRef]
- Tóth, M. Štrukturálne zmeny v poľnohospodárstve na Slovensku po vstupe do EÚ a dopady stropovania priamych platieb. Ekon. Poľnohospodárstva 2019, 19, 81–90. [Google Scholar]
- MPRV SR 2019. Správa o Poľnohospodárstve a Potravinárstve v Slovenskej Republike za rok 2018. Available online: http://www.mpsr.sk/index.php?navID=122&id=14968 (accessed on 14 January 2020).
- Zbranek, P.; Chrastinová, Z. Vzťah dotácií a ekonomickej výkonnosti slovenských fariem. Ekonomika Poľnohospodárstva 2018, 18, 5–17. [Google Scholar]
- Walls, H.L.; Johnston, D.; Tak, M.; Dixon, J.; Hanefeld, J.; Hull, E.; Smith, R.D. The impact of agricultural input subsidies on food and nutrition security: A systematic review. Food Secur. 2018, 10, 1425–1436. [Google Scholar] [CrossRef]
- Kirwan, B.E. US farm dynamics and the distribution of US agricultural subsidies. Appl. Econ. Lett. 2018, 24, 207–209. [Google Scholar] [CrossRef]
- Henke, R.; Benos, T.; De Filippis, F.; Giua, M.; Pierangeli, F.; D’Andrea, M.R.P. The New Common Agricultural Policy: Ow do Member States Respond to Flexibility? J. Common Mark. Stud. 2018, 56, 403–419. [Google Scholar] [CrossRef]
- Pandey, S. Economics of Subsidy. Available online: https://papers.ssrn.com/sol3/papers.cfm?abstract_id=904564 (accessed on 9 January 2020).
- Chirwa, E.; Dorward, A. Agricultural Input Subsidies: The Recent Malawi Experience; Oxford: Oxford University Press: New York, NY, USA, 2013. [Google Scholar]
- Matthews, A. Impact of CAP Subsidies on Productivity. Available online: http://capreform.eu/impact-of-cap-subsidies-on-productivity (accessed on 16 November 2019).
- Official Journal of the European Union 2016. Stanovisko Európskeho Hospodárskeho a Sociálneho Výboru. Available online: https://eur-lex.europa.eu/legal-content/SK/TXT/PDF/?uri=CELEX:52015AE2913&from=SK (accessed on 10 January 2020).
- Guth, M.; Smędzik-Ambroży, K. Subsidising sustainability by farming types in Poland in the years 2004–2015. In Proceedings of the Conference Proceedings-VII International Scientific Conference Determinants of Regional Development, Piła, Poland, 12–13 April 2018; pp. 288–298. [Google Scholar] [CrossRef]
- Bachev, H. Framework for Assessing Sustainability of Farming Enterprises. J. Appl. Econ. Sci. 2016, 21, 24–26. [Google Scholar]
- Aceleanu, M.I. Sustainability and Competitiveness of Romanian Farms through Organic Agriculture. Sustainability 2016, 8, 245. [Google Scholar] [CrossRef] [Green Version]
- Šťastná, M.; Peřinková, V.; Pokorná, P.; Vaishar, A. New approach to sustainability in rural areas comprising agriculture practices-analysis of demonstration farms in the Czech Republic. Sustainability 2019, 11, 2906. [Google Scholar] [CrossRef] [Green Version]
- El Bilali, H. The multi-level perspective in research on sustainability transitions in agriculture and food systems: A systematic review. Agriculture 2019, 9, 74. [Google Scholar] [CrossRef] [Green Version]
- Agovino, M.; Casaccia, M.; Ciommi, M.; Ferrara, M.; Marchesano, K. Agriculture, climate change and sustainability: The case of EU-28. Ecol. Indic. 2019, 105, 525–543. [Google Scholar] [CrossRef]
- Czyzewski, B.; Matuszczak, A.; Muntean, A. Approaching environmental sustainability of agriculture: Environmental burden, eco-efficiency or eco-effectiveness. Agric. Econ.-Czech 2019, 65, 299–306. [Google Scholar] [CrossRef]
- Gaillard, G. Reliable Assessment of sustainability in Agriculture. Agrar. Schweiz 2018, 9, 331. [Google Scholar]
- Bachev, H. Institutional environment and climate change impacts on sustainability of Bulgarian agriculture. Bulg. J. Agric. Sci. 2018, 24, 523–536. [Google Scholar]
- Slatmo, E.; Fischer, K.; Roos, E. The Framing of Sustainability in Sustainability Assessment Frameworks for Agriculture. Sociol. Rural. 2017, 57, 378–395. [Google Scholar] [CrossRef]
- Mwambo, F.M.; Furst, C.A. Holistic Method of Assessing Efficiency and Sustainability in Agricultural Production Systems. J. Environ. Account. Manag. 2019, 7, 27–43. [Google Scholar] [CrossRef]
- Solow, R. Intergenerational Equity and Exhaustible Resources. Rev. Econ. Stud. 1974, 41, 29–46. [Google Scholar] [CrossRef] [Green Version]
- Hartiwck, J. Investment of Rents from Exhaustible Resources and Intergenerational Equity. Am. Econ. Rev. 1977, 67, 972–974. [Google Scholar]
- Common, M.; Perrings, C. Towards an Ecological Economics of Sustainability. Ecol. Econ. 1992, 6, 7–34. [Google Scholar] [CrossRef]
- Sulewski, P.; Kloczko-Gajewska, A.; Sroka, W. Relations between Agri-Environmental, Economic and Social Dimensions of Farms’ Sustainability. Sustainability 2018, 10, 4629. [Google Scholar] [CrossRef] [Green Version]
- Harris, J.M.; Godddwin, N.R. Introduction Volume; Survey of Sustainable Development: Social and Economic Dimensions; Harris, J.M., Wise, T., Gallagher, K., Goodwin, N.R., Eds.; Island Press: Washington, DC, USA; Covelo, CA, USA; London, UK, 2001. [Google Scholar]
- Madau, F.A.; Furesi, R.; Pulina, P. An Analysis of Sustainability Policies in European Agriculture in the Long Term: Methods and Materials Using the FEEM Indicators. Agroecol. Sust. Food. 2014, 38, 485–501. [Google Scholar] [CrossRef]
- Latruffe, L.; Diazabakana, A.; Bockstaller, C.; Desjeux, Y.; Finn, J.; Kelly, E.; Ryan, M.; Uthes, S. Measurement of sustainability in agriculture: A review of indicators. Stud. Agric. Econ. 2016, 118, 123–130. [Google Scholar] [CrossRef]
- Zorn, A.; Esteves, M.; Baur, I.; Lips, M. Financial Ratios as Indicators of Economic Sustainability: A Quantitative Analysis for Swiss Dairy Firms. Sustainability 2018, 10, 2942. [Google Scholar] [CrossRef] [Green Version]
- Gábor, V.; Fekete-Farkas, M.; Kovács, I. Indicators for the economic dimension of sustainable agriculture in the European Union. Reg. Stat. 2017, 7, 179–196. [Google Scholar] [CrossRef]
- Špička, J.; Hlavsa, T.; Soukupová, K.; Štolbová, M. Approaches to estimation the farm-level economic viability and sustainability in agriculture: A literature review. Agric. Econ.-Czech 2019, 65, 289–297. [Google Scholar] [CrossRef] [Green Version]
- Adamišin, P.; Kotulič, R.; Kravčáková Vozárová, I. Legal Form of Agricultural Entities as a Factor in Ensuring the Sustainability of the Economic Performance of Agriculture. Agric. Econ.-Czech 2017, 63, 80–92. [Google Scholar] [CrossRef] [Green Version]
- Matzembacher, D.E.; Meira, F.B. Sustainability as business strategy in community supported agriculture: Social, environmental and economic benefits for producers and consumers. Brit. Food J. 2019, 121, 616–632. [Google Scholar] [CrossRef]
- Marcis, J.; de Lima, E.P.; da Costa, S.E.G. Indicators of performance and sustainability of cooperative operations agriculture and livestock. Cust. Agronegocio. 2018, 14, 267–289. [Google Scholar]
- Kleinman, P.J.; Spiegal, S.; Rigby, J.R.; Goslee, S.C.; Baker, J.M.; Bestelmeyer, B.T.; Boughton, R.K.; Bryant, R.B.; Cavigelli, M.A.; Derner, J.D.; et al. Advancing the Sustainability of US Agriculture through Long-Term Research. J. Environ. Qual. 2018, 47, 1412–1425. [Google Scholar] [CrossRef]
- Kotulič, R.; Adamišin, P.; Kravčáková Vozárová, I.; Vavrek, R. Targeted regionalization of Slovakia to ensure economic efficiency and sustainability of agriculture. In Proceedings of the 20th International Colloquium on Regional Sciences, Kurdejov, Czech Republic, 14–16 June 2017; pp. 185–192. [Google Scholar] [CrossRef]
- Singh, A. Evaluating the effect of different management policies on the long-term sustainability of irrigated agriculture. Land Use Policy 2016, 54, 499–507. [Google Scholar] [CrossRef]
- Medeiros, A.F.Q.; Porto, W.S.; de Souza, J.A.; Oliveira, D.D. Control and assessment of performance in family agriculture from the perspective of sustainability of farmers. Cust. Agronegocio. 2012, 8, 154–171. [Google Scholar]
- Marcinkowski, M.; Narojczyk, S.; Stepien, S. Kierunki zmian Funkcjonowania Wybranych Rynków Rolnych w Kontekście Ewolucji Wspólnej Polityki Rolnej UE. In Rozwój Rolnictwa i Obszarów Wiejskich w Warunkach Ewolucji WPR; Wybrane Problem; Czyżewski, A., Stępień, S., Eds.; KPSW: Bydgoszcz, Poland, 2011. [Google Scholar]
- Sarov, A.; Kostenarov, K. The impact of CAP subsidies on the agricultural enterprise’s production structure. Bulg. J. Agric. Sci. 2019, 25, 10–17. [Google Scholar]
- Garrone, M.; Emmers, D.; Lee, H.; Olper, A.; Swinnen, J. Subsidies and agricultural productivity in the EU. Agric. Econ. 2019, 50, 803–817. [Google Scholar] [CrossRef]
- Ciaian, P.; Kancs, D.; Paloma, S.G.Y. Income distributional effects of CAP subsidies Micro evidence from the EU. Outlook Agric. 2015, 44, 19–28. [Google Scholar] [CrossRef] [Green Version]
- Kravčáková Vozárová, I.; Kotulič, R. Theoretical background of financial management in the context of cap subsidies in V4 Countries. Pol. J. Manag. Stud. 2015, 12, 77–86. [Google Scholar]
- Rizov, M.; Pokrivčák, J.; Ciaian, P. CAP Subsidies and Productivity of the EU Farms. J. Agric. Econ. 2013, 64, 537–557. [Google Scholar] [CrossRef]
- Bojnec, Š.; Ferto, I. Do CAP subsidies stabilise farm income in Hungary and Slovenia? Agric. Econ.-Czech 2019, 65, 103–111. [Google Scholar] [CrossRef] [Green Version]
- Kravčáková Vozárová, I.; Kotulič, R.; Vavrek, R. Disparities in the financial performance of agricultural entities according to the legal form: The case of Slovakia. Appl. Econ. 2019, 51, 5999–6008. [Google Scholar] [CrossRef]
- MPRV SR 2012. Správa o Poľnohospodárstve a Potravinárstve v Slovenskej Republike za rok 2011. Available online: http://www.mpsr.sk/sk/index.php?navID=122&id=6916 (accessed on 14 January 2020).
- Marcis, J.; Bortoluzzi, S.C.; de Lima, E.P.; da Costa, S.E.G. Sustainability performance evaluation of agricultural cooperatives’ operations: A systemic review of the literature. Environ. Dev. Sustain. 2019, 21, 1111–1126. [Google Scholar] [CrossRef]
- Jaksic, D.; Vukovic, B.; Mijic, K. Analysis of the financial position of agricultural companies in the Republic of Serbia. Ekon. Poljopr.-Econ. Agric. 2011, 58, 81–90. [Google Scholar] [CrossRef]
- Jenčová, S.; Litavcová, E.; Vašaničová, P. Implementation of Du Pont Model in Non-Financial Corporations. Montenegrin J. Econ. 2018, 14, 131–141. [Google Scholar] [CrossRef]
- Barak, S.; Mokfi, T. Evaluation and selection of clustering methods using a hybrid group MCDM. Expert Syst. Appl. 2019, 138, 112817. [Google Scholar] [CrossRef]
- Song, Y.M.; Peng, Y. A MCDM-Based Evaluation Approach for Imbalanced Classification Methods in Financial Risk Prediction. IEEE Access 2019, 7, 84897–84906. [Google Scholar] [CrossRef]
- Jahanshahloo, G.R.; Hosseinzadehlotfi, F.; Izadikhah, M. Extension of the TOPSIS method fod decision-making problem with fuzzy data. Appl. Math. Comput. 2006, 181, 1544–1551. [Google Scholar] [CrossRef]
- Vivas, R.; Sant’anna, A.; Esquerre, K.; Freires, F. Measuring sustainability performance with multi criteria model: A case study. Sustainability 2019, 11, 6113. [Google Scholar] [CrossRef] [Green Version]
- Bhowmik, C.; Dhar, S.; Ray, A. Comparative analysis of MCDM methods for the evaluation of optimum green energy sources: A case study. Int. J. Decis. Support Syst. Technol. 2019, 11, 1–28. [Google Scholar] [CrossRef] [Green Version]
- Shih, H.; Shyur, H.; Lee, E.S. An extension of TOPSIS for group decision making. Math. Comput. Model. 2007, 45, 801–813. [Google Scholar] [CrossRef]
- Vavrek, R.; Chovancová, J. Assessment of economic and environmental energy performance of EU countries using CV-TOPSIS technique. Ecol. Indic. 2019, 106, 105519. [Google Scholar] [CrossRef]
- Vavrek, R.; Kotulič, R.; Adamišin, P. Evaluation of Municipalities Management with the TOPSIS Technique Emphasising on the Impact of Weights of Established Criteria. Lex Localis-J. Local Self-Gov. 2015, 13, 249–264. [Google Scholar] [CrossRef]
- MPRV SR 2006. Správa o Poľnohospodárstve a Potravinárstve v Slovenskej Republike za rok 2005. Available online: http://www.mpsr.sk/index.php?navID=122&id=344 (accessed on 16 November 2019).
- MPRV SR 2014. Správa o Poľnohospodárstve a Potravinárstve v Slovenskej Republike za rok 2013. Available online: http://www.mpsr.sk/index.php?navID=122&id=8835 (accessed on 22 September 2019).
- MPRV SR 2011. Správa o Poľnohospodárstve a Potravinárstve v Slovenskej Republike za rok 2010. Available online: http://www.mpsr.sk/index.php?navID=122&id=5214 (accessed on 11 November 2019).
- Chovancová, J.; Adamišin, P. Environmentálne Aspekty Procesov a Technológií; Prešovská Univerzita v Prešove: Prešov, Slovakia, 2016; p. 133. [Google Scholar]
- Piterková, A.; Tóth, M.; Serenčéš, P. The Impact of Non-financial factors on Prosperity of Slovak agriculture sector. In Proceedings of the 9th International Conference on Applied Business Research (Proceedings from IX. International Conference on Applied Business Research), Talca, Chile, 6–10 October 2014; pp. 851–859. [Google Scholar]
- Ekonomický Potenciál Slovenského Poľnohospodárstva a Potravinárstva v Kontexte Medzinárodných Komparácií a Tvorba Indikátorov a Aplikačných Riešení pre Hodnotenie Dopadov Agrárnych Politík. Available online: https://www.scribd.com/document/380133591/EP1-2017-pdf (accessed on 11 November 2019).
- Rizov, M.; Pokrivčák, J.; Ciaian, P. CAP subsidies and productivity of the EU farms. In Proceedings of the International Association of Agricultural Economists (IAAE) Triennial Conference, Foz do Iguacu, Brazil, 18–24 August 2012. [Google Scholar]
- Kravčáková Vozárová, I.; Kotulič, R. Legal Form as a Determinant of the Evaluation of Agricultural Entities in Slovakia Using the Topsis Method. J. Environ. Manag. Tour. 2016, 3, 347–354. [Google Scholar] [CrossRef]
- Chrastinová, Z.; Burianová, V. Economic development in Slovak agriculture. Agric. Econ.-Czech 2009, 55, 67–76. [Google Scholar] [CrossRef] [Green Version]
- Ogorodnikov, P.I.; Perunov, V.B.; Chirkova, V.Y. The influence of human factor on financial sustainability of agricultural production. Econ. Reg. 2012, 2, 232–239. [Google Scholar] [CrossRef]
- Brandano, M.G.; Detotto, C.; Vannini, M. Comparative efficiency of agricultural cooperatives and conventional firms in a sample of quasi-twin companies. Ann. Public Coop. Econ. 2019, 90, 53–76. [Google Scholar] [CrossRef]
- Wang, S.W.; Manjur, B.; Kim, J.-G.; Lee, W.-K. Assessing Socio-Economic Impacts of Agricultural Subsidies: A Case Study from Bhutan. Sustainability 2019, 11, 3266. [Google Scholar] [CrossRef] [Green Version]
- Kiryluk-Dryjska, E.; Baer-Nawrocka, A. Reforms of the Common Agricultural Policy of the EU: Expected results and their social acceptance. J. Policy Model. 2019, 41, 607–622. [Google Scholar] [CrossRef]
Figure 1.
Correlation matrix of indicators of AC, 2005–2014. SUB/ha, subsidies per hectare of agricultural land. Note: * significant positive or negative correlation.
Figure 1.
Correlation matrix of indicators of AC, 2005–2014. SUB/ha, subsidies per hectare of agricultural land. Note: * significant positive or negative correlation.

Figure 2.
Correlation matrix of indicators of BC, 2005–2014. Note: * significant positive or negative correlation.
Figure 2.
Correlation matrix of indicators of BC, 2005–2014. Note: * significant positive or negative correlation.

Table 1.
Research sample. AC, agricultural cooperative; BC, business company; SR, Slovak Republic.
| 2005 | 2006 | 2007 | 2008 | 2009 | 2010 | 2011 | 2012 | 2013 | 2014 | |
|---|---|---|---|---|---|---|---|---|---|---|
| AC | 578 | 566 | 545 | 538 | 544 | 507 | 526 | 517 | 503 | 487 |
| BC | 832 | 798 | 819 | 779 | 839 | 798 | 886 | 963 | 980 | 1000 |
| SR TOTAL | 1410 | 1364 | 1364 | 1317 | 1383 | 1305 | 1412 | 1480 | 1483 | 1487 |
Table 2.
Development of parameters of agricultural enterprises in the SR, 2005–2014. ROA, return on total assets; ROS, return on sales; DPO, days payable outstanding; QR, quick ratio; SFR, self-financing ratio; ICR, interest coverage ratio.
Table 2.
Development of parameters of agricultural enterprises in the SR, 2005–2014. ROA, return on total assets; ROS, return on sales; DPO, days payable outstanding; QR, quick ratio; SFR, self-financing ratio; ICR, interest coverage ratio.
| 2005 | 2006 | 2007 | 2008 | 2009 | 2010 | 2011 | 2012 | 2013 | 2014 | ||
|---|---|---|---|---|---|---|---|---|---|---|---|
| ROA | AC | 0.44 | 1.58 | 3.52 | 2.57 | 3.10 | −3.28 | 1.06 | 3.49 | −1.74 | 2.73 |
| BC | 5.82 | 8.11 | 9.57 | 7.79 | 7.79 | 2.87 | 4.90 | 5.64 | 2.37 | 5.82 | |
| ROS | AC | 2.33 | 5.56 | 9.40 | 5.41 | 8.08 | −6.19 | 3.92 | 6.85 | −5.38 | 6.54 |
| BC | 7.56 | 11.08 | 11.77 | 11.23 | 14.58 | 9.80 | 11.44 | 13.14 | 5.70 | 9.46 | |
| DPO | AC | 118.88 | 103.12 | 109.15 | 126.20 | 143.21 | 182.59 | 165.38 | 155.00 | 165.57 | 167.61 |
| BC | 188.32 | 168.75 | 196.86 | 193.41 | 222.29 | 263.98 | 258.97 | 245.79 | 231.40 | 248.16 | |
| QR | AC | 1.77 | 1.98 | 2.08 | 1.93 | 1.94 | 1.70 | 2.07 | 1.98 | 1.92 | 2.07 |
| BC | 1.23 | 1.32 | 1.48 | 1.34 | 1.29 | 1.37 | 1.35 | 1.36 | 1.27 | 1.32 | |
| SFR | AC | 65.99 | 65.32 | 65.49 | 62.78 | 61.77 | 59.01 | 59.60 | 60.30 | 58.12 | 58.77 |
| BC | 32.13 | 35.06 | 35.88 | 36.60 | 36.08 | 33.49 | 33.72 | 33.68 | 33.06 | 33.95 | |
| ICR | AC | 1.78 | 4.17 | 7.59 | 4.01 | 4.39 | −3.76 | 1.84 | 5.94 | −3.71 | 3.69 |
| BC | 7.00 | 7.57 | 8.75 | 6.79 | 5.95 | 3.95 | 5.34 | 5.97 | 4.29 | 7.13 |
Table 3.
Results of technique for order of preference by similarity to ideal solution (TOPSIS) according to legal forms, 2005–2014.
Table 3.
Results of technique for order of preference by similarity to ideal solution (TOPSIS) according to legal forms, 2005–2014.
| 2005 | 2006 | 2007 | 2008 | 2009 | 2010 | 2011 | 2012 | 2013 | 2014 | |
|---|---|---|---|---|---|---|---|---|---|---|
| AC | 0.275 | 0.321 | 0.386 | 0.325 | 0.370 | 0.142 | 0.284 | 0.428 | 0.161 | 0.391 |
| BC | 0.725 | 0.679 | 0.614 | 0.675 | 0.630 | 0.858 | 0.716 | 0.572 | 0.839 | 0.609 |
Table 4.
ANOVA comparison of legal forms using TOPSIS, 2005–2014.
| Sum of Squares | Df | Mean Square | F-Ratio | P-Value | |
|---|---|---|---|---|---|
| Between groups | 0.734978 | 1 | 0.734978 | 80.18 | 0.0000 |
| Within groups | 0.165008 | 18 | 0.00916712 | ||
| Total (Corr.) | 0.899986 | 19 |
Table 5.
Correlation of parameters and SUB/ha by legal forms, 2005–2014.
| ROA | ROS | DPO | QR | SFR | ICR | ||
|---|---|---|---|---|---|---|---|
| SUB/ha | AC | –0.1111 (0.655) | –0.1111 (0.655) | 0.4667 (0.060) | –0.0682 (0.788) | –0.4667 (0.060) | –0.1556 (0.531) |
| BC | –0.5229 (0.039) | –0.1556 (0.531) | 0.7333 (0.003) | –0.3146 (0.210) | –0.1111 (0.655) | –0.6000 (0.015) |
Table 6.
Correlation of SUB/ha and TOPSIS results by legal forms, 2005–2014.
| AC | BC | |
|---|---|---|
| Correlation | –0.289 | 0.237 |
| TOPSIS–SUB/ha | (0.419) | (0.509) |
© 2020 by the authors. Licensee MDPI, Basel, Switzerland. This article is an open access article distributed under the terms and conditions of the Creative Commons Attribution (CC BY) license (http://creativecommons.org/licenses/by/4.0/).
Share and Cite
MDPI and ACS Style
Kravčáková Vozárová, I.; Kotulič, R.; Vavrek, R. Assessing Impacts of CAP Subsidies on Financial Performance of Enterprises in Slovak Republic. Sustainability 2020, 12, 948. https://0-doi-org.brum.beds.ac.uk/10.3390/su12030948
AMA Style
Kravčáková Vozárová I, Kotulič R, Vavrek R. Assessing Impacts of CAP Subsidies on Financial Performance of Enterprises in Slovak Republic. Sustainability. 2020; 12(3):948. https://0-doi-org.brum.beds.ac.uk/10.3390/su12030948
Chicago/Turabian StyleKravčáková Vozárová, Ivana, Rastislav Kotulič, and Roman Vavrek. 2020. "Assessing Impacts of CAP Subsidies on Financial Performance of Enterprises in Slovak Republic" Sustainability 12, no. 3: 948. https://0-doi-org.brum.beds.ac.uk/10.3390/su12030948
Note that from the first issue of 2016, this journal uses article numbers instead of page numbers. See further details here.