Coupling of Rural Energy Structure and Straw Utilization: Based on Cases in Hebei, China


1
Institute of Agricultural Resources and Regional Planning, Chinese Academy of Agricultural Sciences, Beijing 100081, China
2
Department of Economics and Rural Development, Gembloux Agro-Bio Tech, University of Liège, 5030 Gembloux, Belgium
3
Research Center for Agricultural Green Development in China, Beijing 100081, China
*
Author to whom correspondence should be addressed.
Sustainability 2020, 12(3), 983; https://0-doi-org.brum.beds.ac.uk/10.3390/su12030983
Submission received: 23 December 2019
/
Revised: 17 January 2020
/
Accepted: 23 January 2020
/
Published: 29 January 2020
(This article belongs to the Special Issue Optimal Transition toward Innovation-Led Sustainable Governance under the 2020 Paris Regime in Asia)
Abstract
:China’s coal-based energy structure is the main reason for the current high-level air pollution and carbon emissions. Now in the North China Plain, the government is vigorously promoting “coal to gas” and “coal to electricity” in the country and the vast rural areas. The development and utilization of biomass resources in agricultural areas is also an effective means of replacing coal. We propose the idea of forming a complementary rural energy structure of “biogas, briquetting, electricity (BBE)” model based on centralized biogas production (CBP) and straw briquetting fuel (SBF) to improve the rural energy structure. This article uses emergy analysis methods to analyze actual cases. It needs to have strengths and avoid weaknesses in mode selection. The process of the analysis reveals the disadvantages and improvement measures. Under the current capacity load, the emergy input and output, eco-economic indicators, sustainable development indicators, environmental load indicators, and economic value have their own advantages and disadvantages. Assuming 100% capacity load, the indicators have great optimization space. Reducing labor input during the planting phase can effectively reduce emergy input. The government needs to provide corresponding support based on the strengths and weaknesses of the project to keep the project sustainability. The development of complementary integration based on local conditions is an important measure to optimize the energy consumption structure in rural areas and improve the ecological environment.
1. Introduction
The 24th Conference of the Parties to the United Nations Framework Convention on Climate Change (COP24) was held between 2 and 15 December 2018 in Katowice, Poland. As part of its Paris Agreement commitment, China pledged to peak carbon dioxide (CO2) emissions around 2030, striving to peak earlier, and to increase the non-fossil share of primary energy to 20% by 2030 [1]. Further, China’s Energy Supply and Consumption Revolution Strategy (2016–2030) sets goals of capping China’s absolute primary energy consumption at or below 5000 million and 6000 million tons of coal equivalent (Mtce) by 2020 and 2030, respectively [2,3]. Yet by the end of 2017, China emitted 28% of the world’s energy-related CO2 emissions, 76% of which were from coal use [1,4]. China’s coal-based energy structure is the main cause of the current high-level carbon emissions and air pollution [5]. The decentralized coal consumption in rural areas accounts for 10% of total coal consumption, equivalent to 400 million tons of standard coal [6]. Since no dust removal, desulfurization, or other environmental protection measures have been taken, the pollutant discharge is 5–10 times higher than the thermal power loose coal, which is the main factor in pollution [7]. In addition, the current utilization mode of biomass energy is lagging and the development and utilization of high-tech applications are still low, resulting in the discharge of a large amount of CO2 and soot, which seriously affects the ecological environment and living environment, and has a great potential for improvement [7].
To achieve these international and domestic goals, China is considering substituting biomass energy for coal, as coal exerts the most detrimental impact on the environment. In particular, in order to cope with the severe haze in the North China Plain (NCP), since 2016 the Chinese government has promoted the replacement of decentralized coal consumption, coal to electricity, and coal to gas in Beijing, Tianjin, and Hebei. The sudden large-scale increase in gas consumption in winter led to the “gas shortage” in the winter of 2017. As a big agricultural country, straw resources are abundant in China. By 2015, the total amount of straw resources in China had exceeded 1 billion tons, accounting for 20%–30% of the total straw production in the world [8]. Among them, corn straw resources in the NCP total 80.66 million tons, accounting for 19.55% of the total corn stalk production in China [9]. By using straw as biomass energy, its efficient and rational use can not only alleviate the energy crisis but also play an important role in environmental protection and sustainable development [10]. In rural areas, in order to replace traditional fuelwood, coal, and other energy sources, the development of distributed utilization of biomass energy is also an important direction. Especially in areas where agricultural waste resources are abundant [11], there is a huge space for development and utilization. In the current stock structure, at least 900 million tons of standard coal, such as decentralized burning coal and rural fuelwood, need to be replaced to optimize China’s energy structure [5]. As renewable and clean energy, biomass energy has attracted more and more attention [12]. Especially in remote rural areas, exploring biogas or briquetting utilization of biomass energy, supplemented by electric energy (the NCP is dominated by coal power (CP)), is also a beneficial attempt to improve the environment and the living standard of rural residents. At present, the straw utilization schemes suitable for the improvement of rural living energy mainly include biogas (such as centralized biogas production (CBP)) and briquetting (such as straw briquetting fuel (SBF)).
CBP refers to the use of crop straw as the main raw material, anaerobic fermentation through a digester, and the production of high-calorific gas, which is supplied to farmers through a pipe network and used for cooking and other purposes. The raw material is more clean and sanitary, has no odor, can be located near residential areas, and has simple technology and convenient maintenance [13]. Corn straw has a very strong potential as an energetic material [14,15,16]. This project usually uses natural villages as the unit, and the system scale is hundreds of households. In recent years, the government’s related rural biogas policies are increasingly inclined to promote the development of large and medium-sized biogas projects. The SBF refers to the use of special equipment to make various crop straws, sawdust, sawdust, peanut shells, corn cob, straw, wheat straw, wheat bran, branches, and leaves into rods, granules or blocks under certain pressure and other solid formed fuels. It has good combustion characteristics, lasting firepower, high furnace temperature, and is easy to transport and store.
Therefore, this paper proposes the following model for improving rural energy structure: In rural areas, it is possible to try and build a new energy source structure based on biomass energy (e.g., CBP, SBF) and electric energy, which form a complementary rural energy structure of a “biogas, briquetting, electricity (BBE)” model to replace the loose coal and original utilization of straw. How feasible is this model? At present, research on this aspect is lacking. This study attempts to use the emergy analysis method to calculate the indicators of CBP and SBF in this respect in order to provide a theoretical basis for the development of the BBE model in rural areas.
Emergy analysis is the most common method for the comprehensive evaluation of biomass energy utilization [17,18,19,20]. Emergy analysis is an ecological-economic system research theory and method headed by H.T. Odum [21]. It is a new research method based on traditional energy analysis. It converts all forms of energy into a unified unit: solar joules (sej). Using a uniform energy value standard as a dimension, the different types and incomparable energy in the system are converted into energy values of the same standard to measure and analyze. It combines energy, economy and environment, takes emergy as dimension, and uses solar emergy conversion rate to measure energy, resources, information and services of different nature. It achieves the effect of using the same measurement standard to evaluate system structure, function, and benefit, thus realizing system environmental sustainability and efficiency [22,23,24]. Emergy analysis has been applied to the evaluation of various biomass energy sources [25,26,27].
2. Materials and Method
2.1. Object
2.1.1. Survey Process
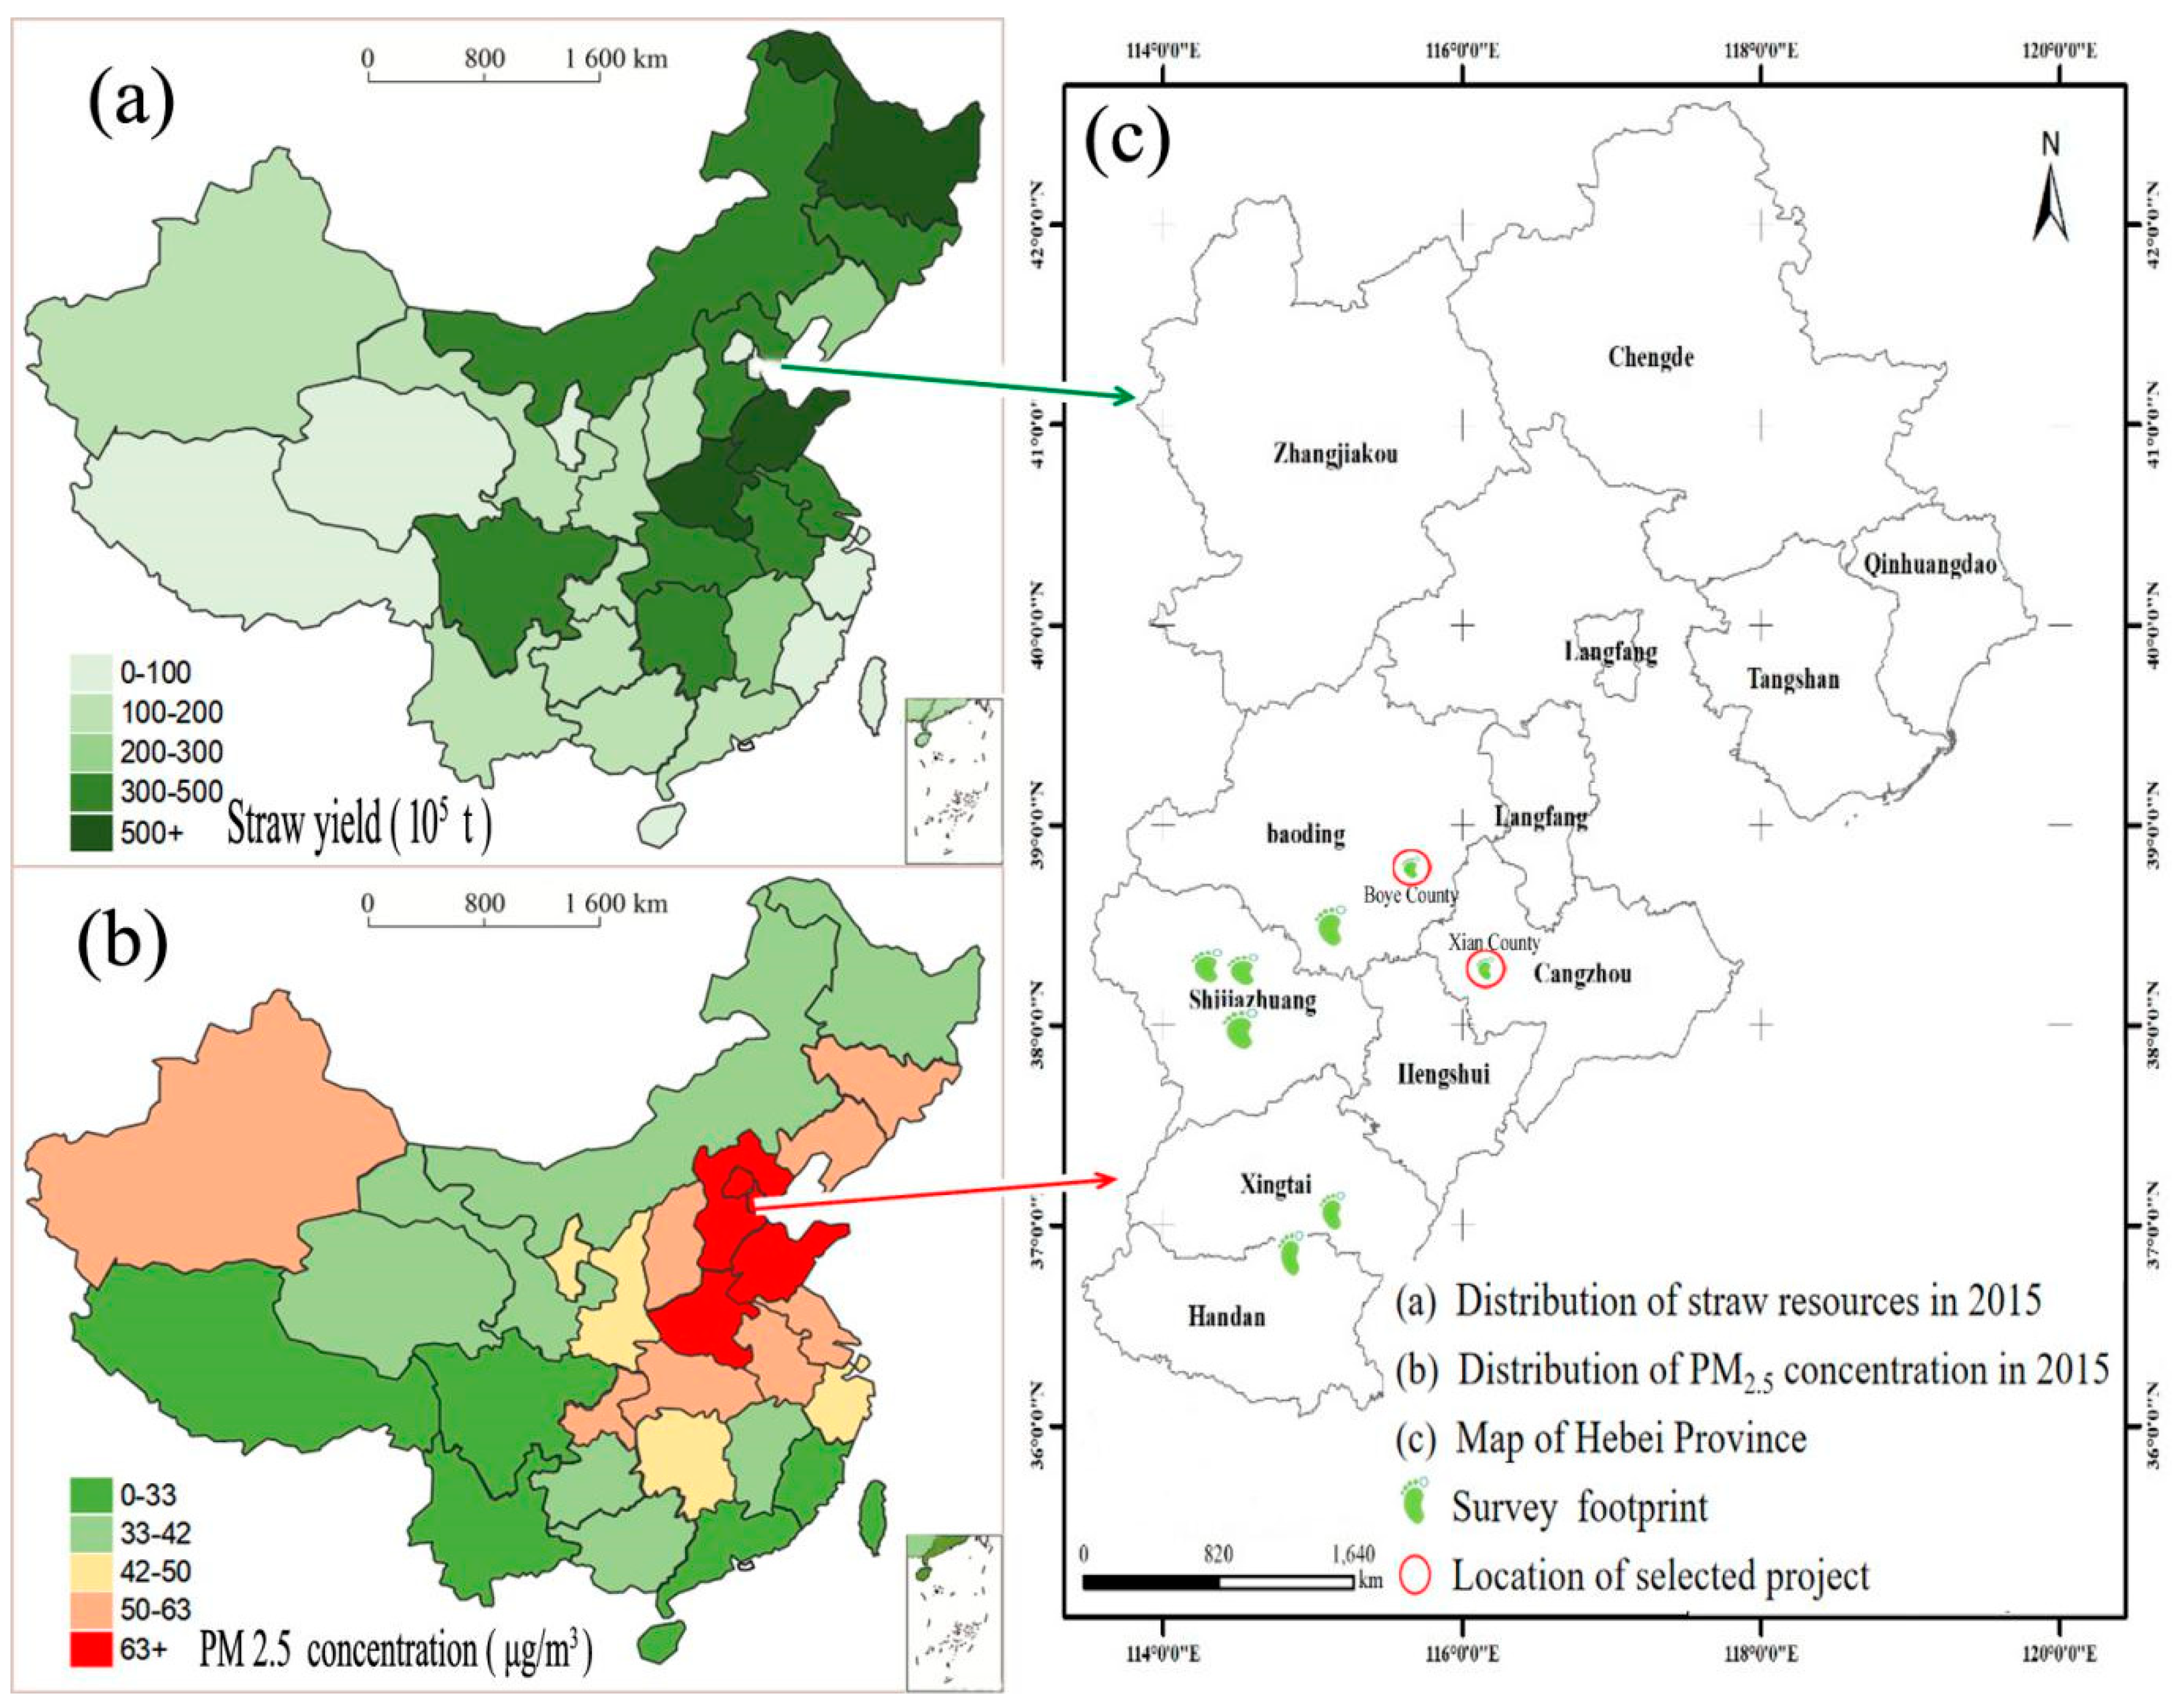
From July to August 2018, we organized a survey on the energy utilization of crop straws in Hebei Province. In Hebei Province, where the survey area is located, straw resources mainly include corn, wheat, and soybeans. In 2015, the straw output was 39 million tons, accounting for 5.4% of China’s total straw output [28] (Figure 1). The research objects were mainly straw energy utilization enterprises. The survey was conducted in the form of a symposium, field visits, and questionnaire surveys. The survey selected Shijiazhuang City (Luquan District, Xingtang County, Wuji County), Baoding City (Dingzhou City, Boye County), Cangzhou City (Xianxian County), Xingtai City (Wei County) and Handan City (Jize County) for a total of 8 counties. Among the straw biomass energy utilization enterprises in this survey, three are mainly biogas production and three are SBF enterprises. The survey found that, in addition to a few government demonstration projects, most of the projects are in the process of operation and exploration in terms of technology and mode. We chose two typical and representative projects, the CBP project in Xiaoxian Village of Xianxian County and the Minle SBF project of Boye County. In terms of technology and operation, the two projects represent the mainstream of their respective utilization models in rural areas and are representative. Xianxian County (38°20′, 116°20′) and Boye County (38°48′, 115°46′) are located in the central part of Hebei Province (Figure 1). They belong to the typical hinterland of NCP. The average annual sunshine hours are 2511 h. The annual average precipitation is 618 mm, the annual average precipitation days are 68 days, and the precipitation is concentrated in June–August, with July receiving the most. The average annual wind speed is 2.91 m/s [29]. Both counties were selected as pilot counties of straw resource utilization in Hebei Province.
2.1.2. Centralized Biogas Production Project
The project was built in 2012, with a total investment of $0.96 million (equal to 6 million Chinese Yuan (CNY), $1 = 6.25 CNY, same as below). The project covers an area of 8000 m2 and the construction area is 310 m2. The project construction investment is $0.21 million, the equipment purchase cost is $0.51 million, and the equipment engineering and installation service costs are $0.24 million. The project is equipped with 2×2000 m3 fermenters and one 1500 m3 membrane gas storage cabinet and supporting equipment. The project uses corn stalk as the main fermentation material and adopts a mesophilic fermentation process. It is wet anaerobic digestion type. The project’s full-load capacity can reach 2000 m3/d, with an annual output of 730,000 m3/a, which supplies biogas to 3000 households. The annual consumption of corn stover silage (water content 60%) is 5800 t, and the straw transportation radius is 10 km. In winter, increasing fermenter temperature with coal, generally over 2–3 months, consumes 20 t coal. The actual production capacity of the project is only 25% of the designed production capacity. Currently, it supplies 750 households with a daily gas supply of 500 m3 and a gas sales price of $0.32 per m3. The annual consumption of straw is 1450 t (water content 60%) and the annual gas production is 182,500 m3. After solid–liquid separation, most of the digestate is used for re-flux, and the solid fraction is used for organic fertilizer supply. The project produces 700 t of solid fraction (water content 60%). In winter, hot water boilers are used to increase the temperature of biogas digesters, which consume 8 t coal annually. The project rents the land in the village, and the rent is $0.48/m2 per year. It is equipped with a 90-horsepower diesel truck and a dump truck. The straw purchase price is $24/t. It uses 5860 m3 of groundwater per year, supplemented with a small amount of rainwater, and uses 8518 kWh of electricity. There are 2 workers in the straw storage stage. There are also 2 full-time operators, and the salary is $480 per month.
2.1.3. Straw Briquetting Fuel Project
The relevant data of the SBF project are obtained from the field survey of Baoding Minle New Energy Company. The project is located in the west of Tunzhuangying Village, Boye County, Baoding City. It was established in February 2015. The total investment of the project is $1.28 million, including $0.56 million for civil construction, $0.512 million for equipment investment, and $0.208 million for installation and service. It mainly deals with the production of SBF. The project has a 30 Mu storage and transportation center. The company is equipped with two 150-horsepower balers and four 30-horsepower trucks. The company’s SBF has a calorific value of 16.73–17.56 MJ/kg. The project’s full-load capacity can reach 1.5–2 t/hour, with an annual output of 15,000 tons. The current production capacity is only 20% of the design capacity. At present, it can consume 3300 tons of straw (water 10%), and produce 3000 tons of SBF. The project has a total of 20 employees currently. It is basically open all year round and works 12 h per day. The straw harvesting season employs 4–5 workers, the handyman is paid $24 per day and the machine hand $40 per day. The local straw purchase price is $40 per ton (water content 10%). At present, every ton of SBF requires 185 kWh of electricity. For every 300 tons of briquetting produced, it is necessary to replace the mold with a price of $3200.
2.2. Methods
According to the theory of H.T. Odum [21], the emergy input are classified as renewable natural resources (R), non-renewable natural resources (N), purchased renewable resources (RP), purchased non-renewable resources (NP), renewable resources (R + RP), non-renewable resources (N + NP), purchased resources (RP+NP), and total emergy input (R+RP+N+NP). The emergy output is product, referred to as Y.
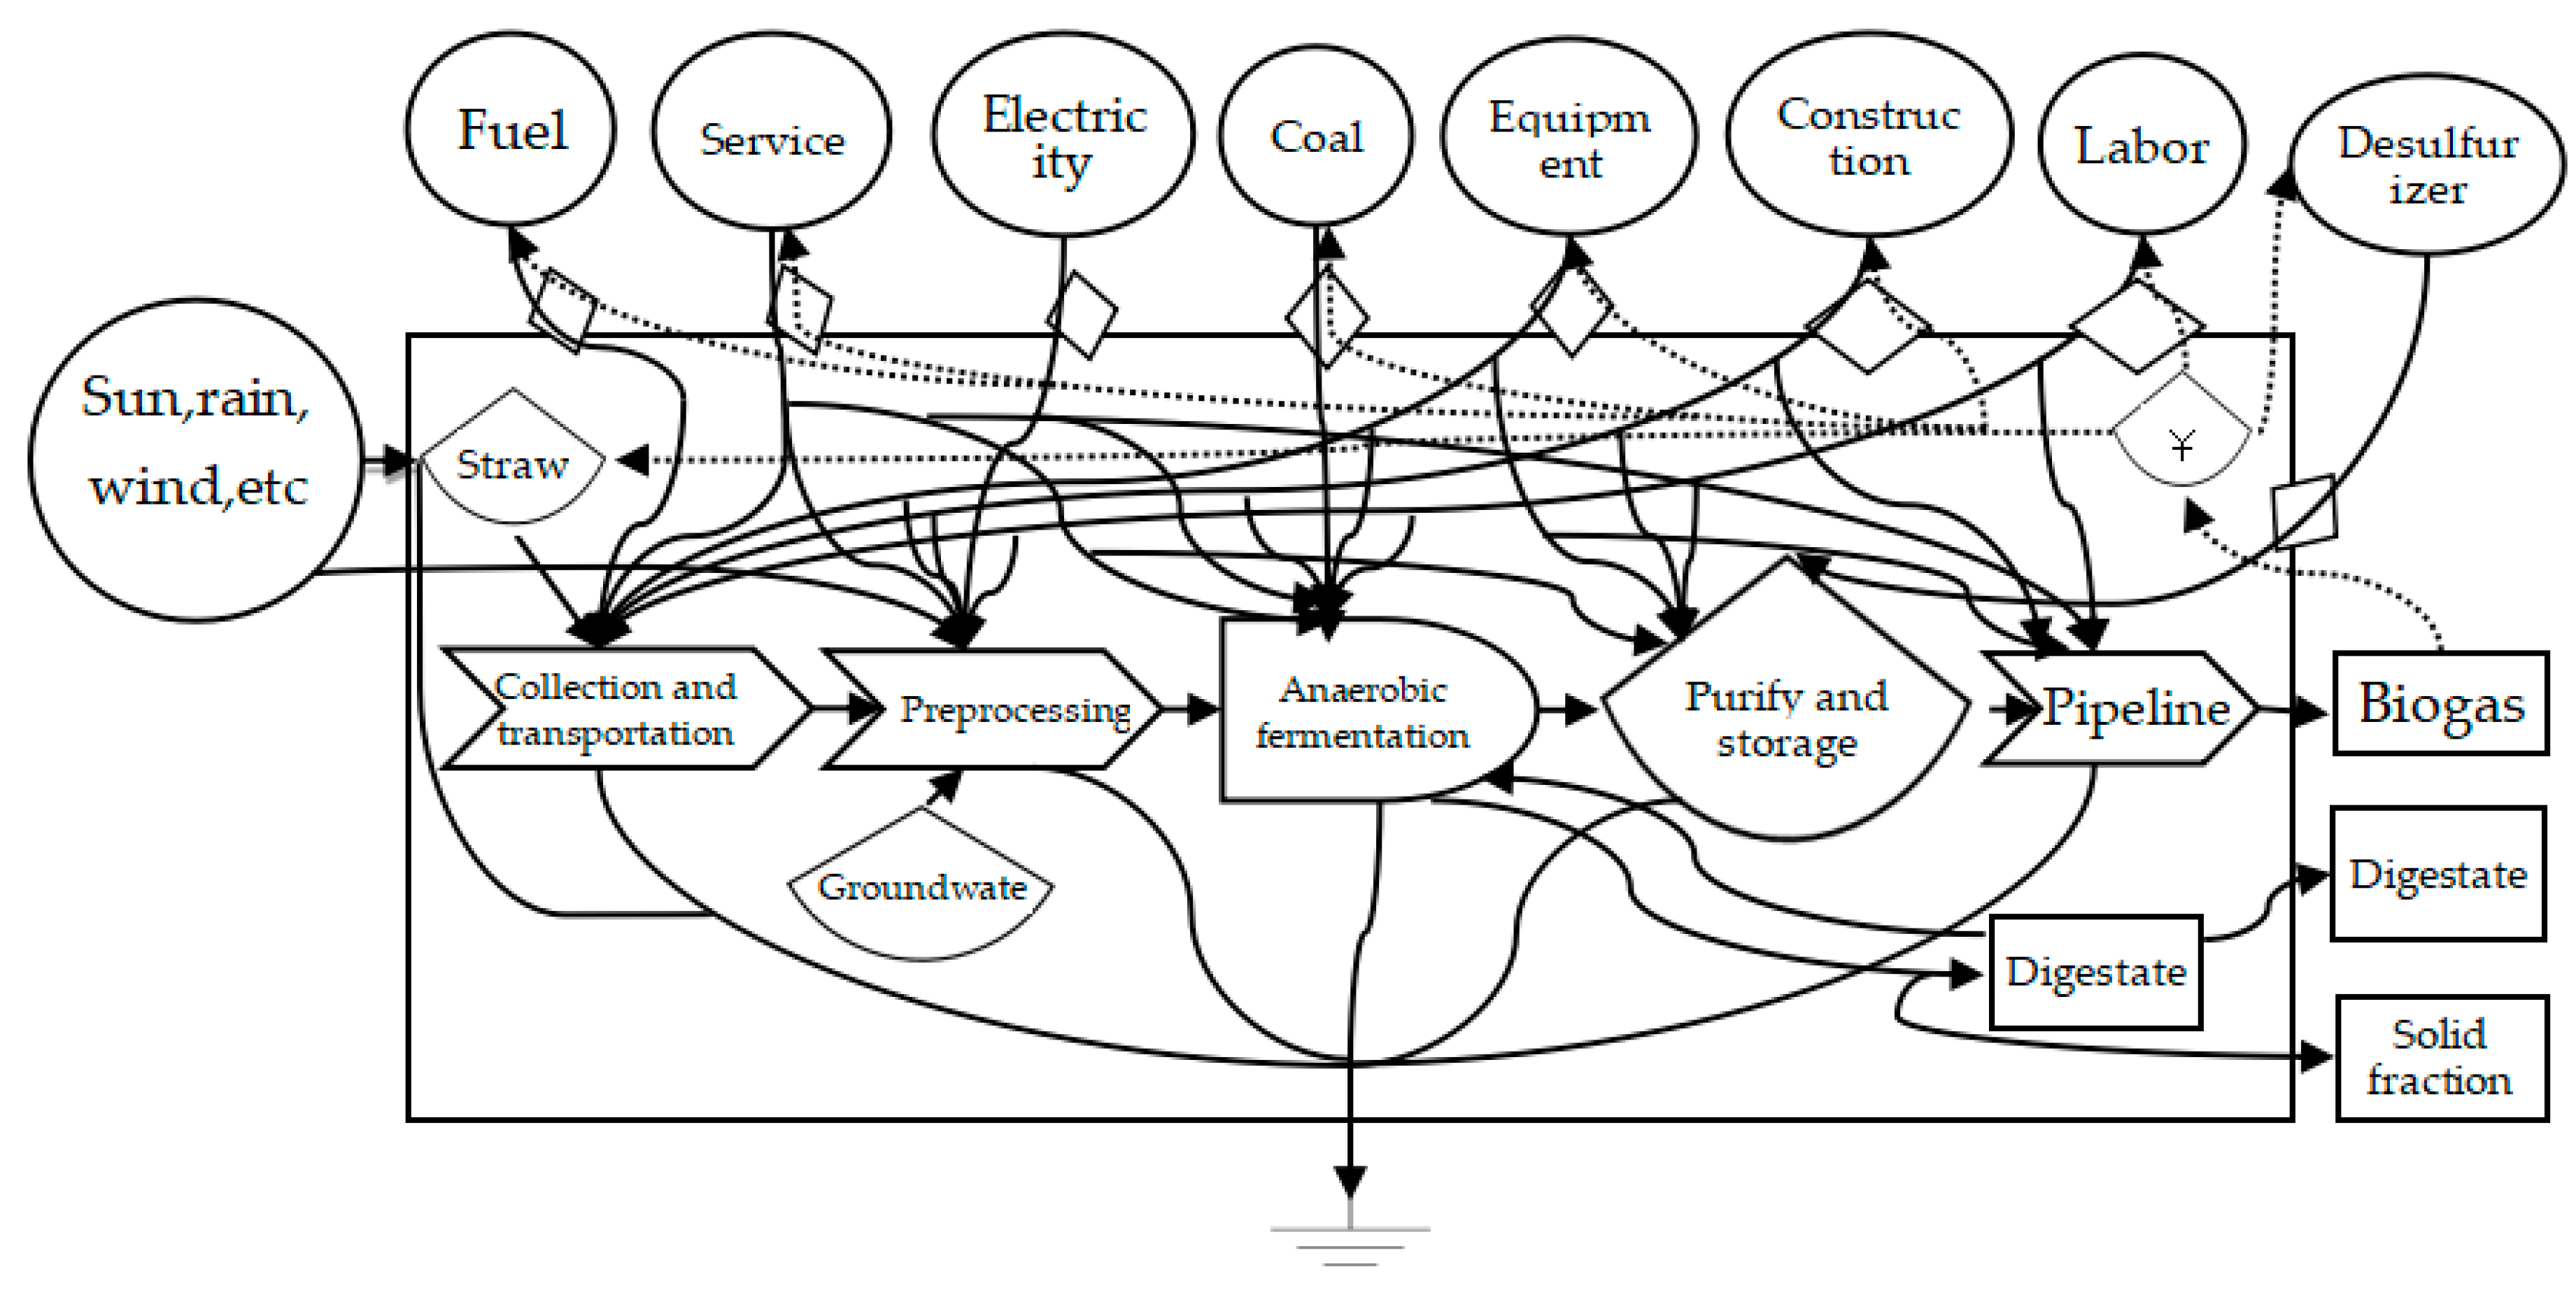
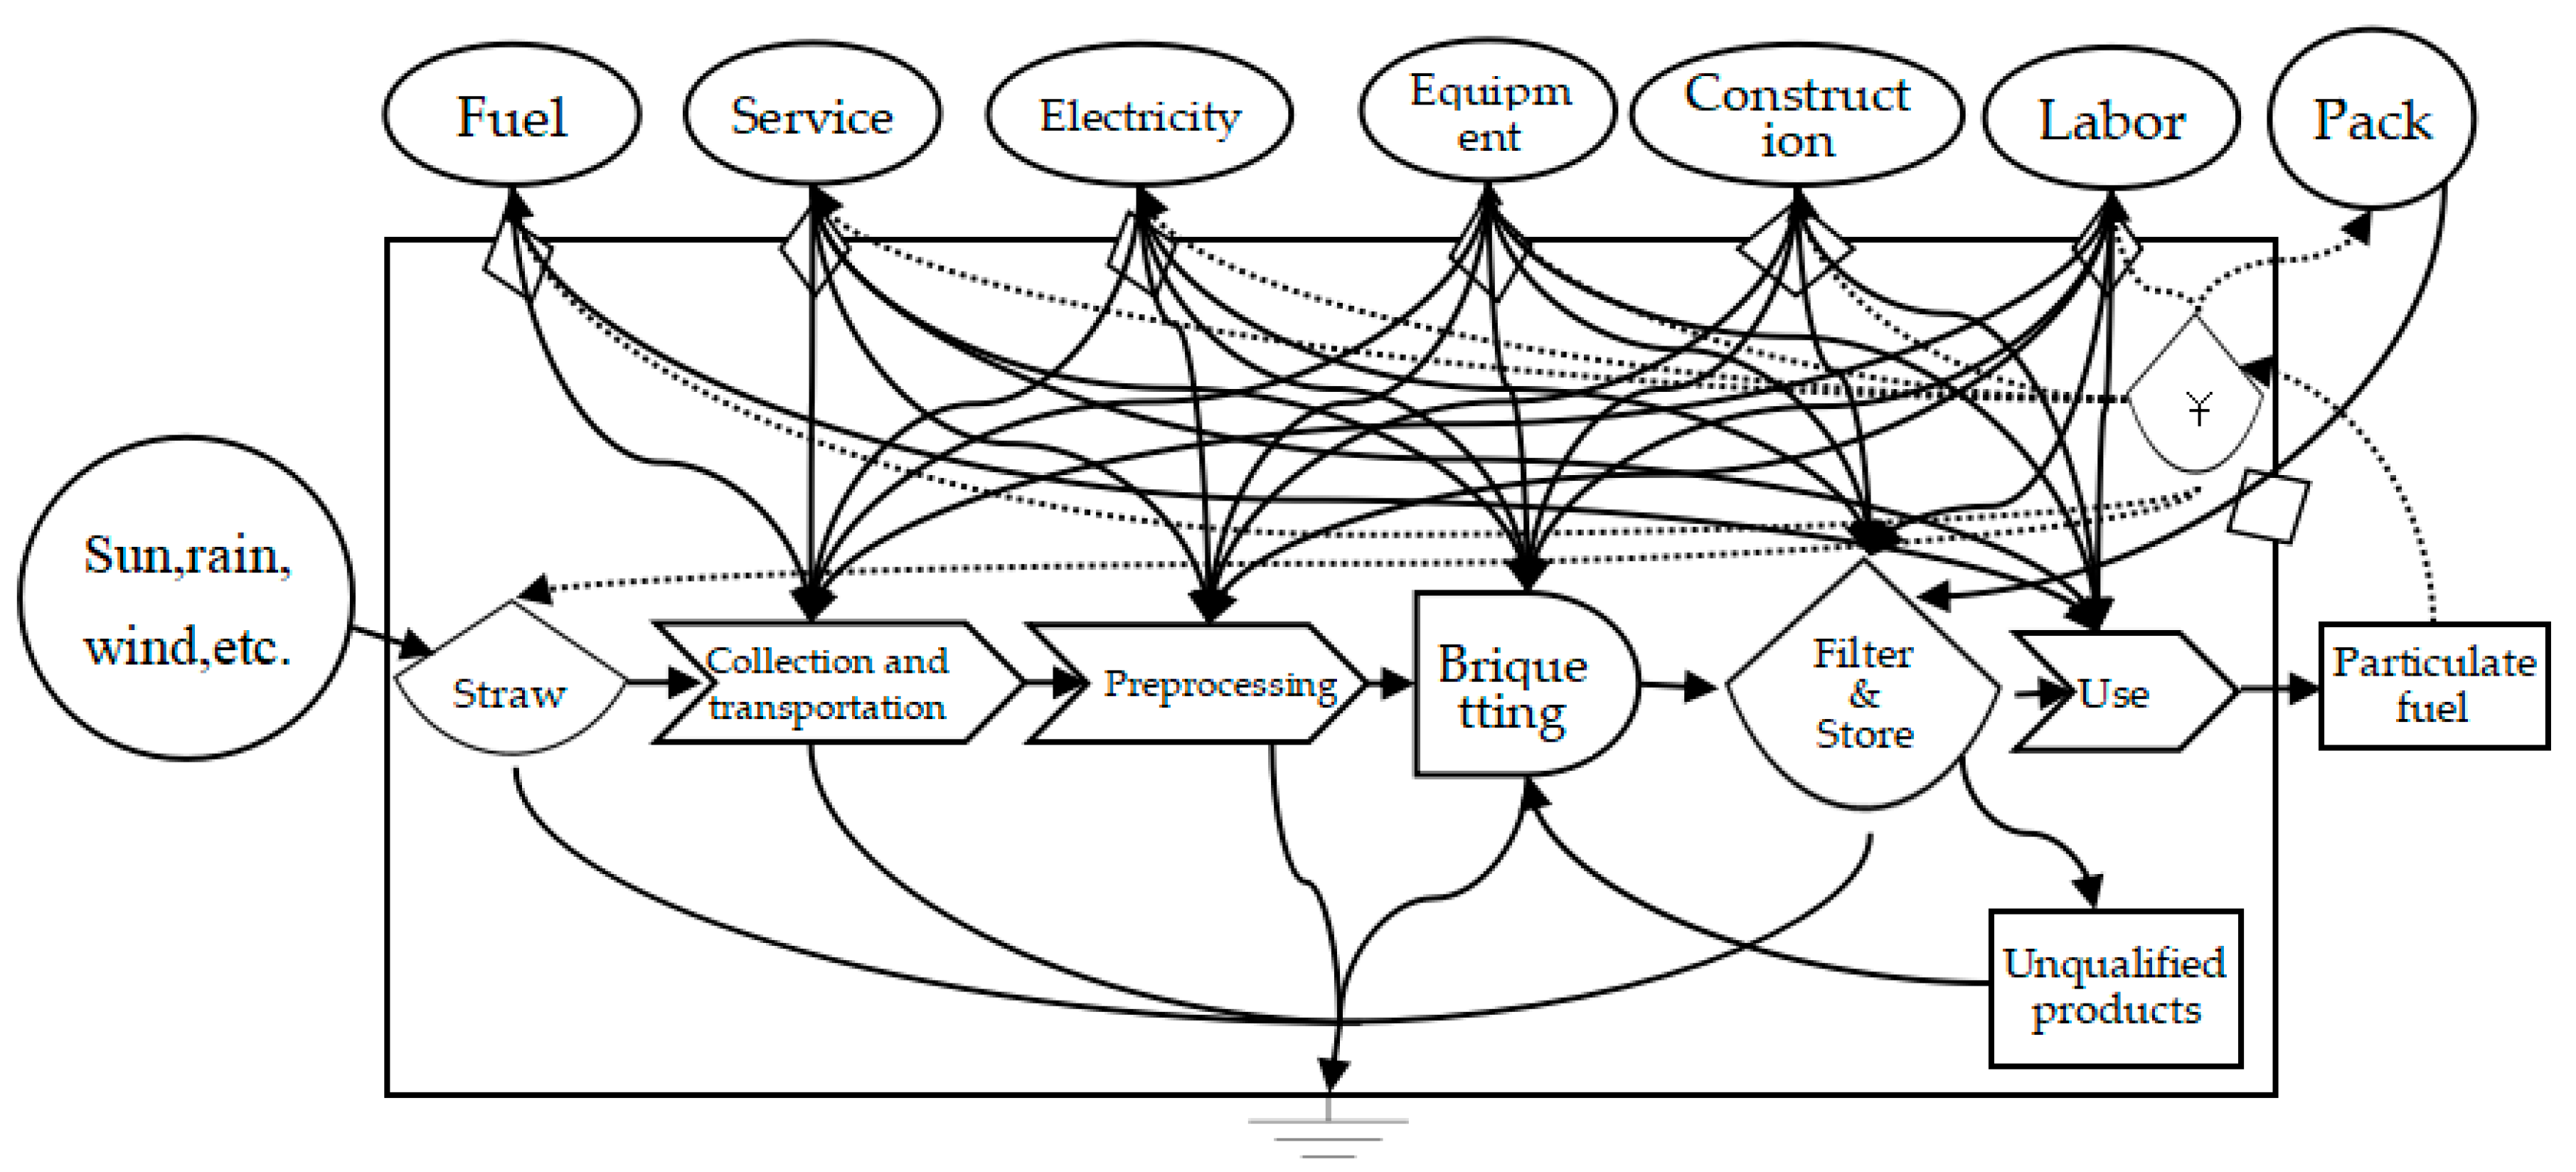
The energy flow diagrams of the two projects are plotted (Figure 2 and Figure 3). It reflects the energy inflow and output process of the system as a whole. This paper mainly uses 8 indicators in 4 thematic groups.
The ecological–economic value evaluation index includes emergy yield ratio (EYR) and emergy investment ratio (EIR). The expression of EYR is Y/(RP + NP). EYR is to measure the contribution of system output to the economy, and the higher the value, the higher the productivity of the system. The expression of EIR is (RP + NP)/(R + N). EIR is used to evaluate system cost, and the smaller the value, the lower the system input cost.
The sustainable development evaluation index includes environmental sustainability index (ESI) and renewable index (RI). The expression of ESI is EYR/ELR. When ESI < 1, the sustainable development of the system is poor, and it is difficult to develop over a long time; when ESI < 5, the sustainable development of the production process belongs to the medium level; when ESI > 5, the production process can continue for a long time. The expression of RI is (RP + R)/Y. The renewability index is inversely proportional to the environmental load rate and can be used to evaluate the renewability of the system.
The environmental evaluation index is environmental loading ratio (ELR). The expression is (NP + N)/(RP + R). It reflects the pressure of the system on the environment. The higher ELR value indicates that the system has a greater pressure on the environmental system. Generally speaking, 2 < ELR < 10 means that the environmental load rate is moderate.
Emergy–money value refers to converting the emergy of the material and energy of the ecosystem into monetary value. The conversion method is emergy divided by emergy–money ratio, which can reflect the actual value of a product. Emergy–money ratio is the ratio of the total emergy use in the year to the GNP of the year. The emergy–money ratio reflects the ratio of total applied emergy to GNP, and the ratio reflects the purchasing power of money. In addition, a market value analysis using indicators like net profit or input–output ratio will inform on the projects profitability at current market prices.
2.3. Data Source
The survey was conducted through interviews with project leaders and collection of project construction and operational data. Data collection of various input and output data for the two models is based on a complete production year. The relevant energy conversion coefficient is based on the “Agricultural Ecology” edited by [31], and the calculation method of the original data comes from [21]. The conversion rate of solar emergy in this paper comes from the relevant research of various scholars (referenced separately) and adopts a new emergy benchmark of 15.83 × 1024 sej/a.
The system boundaries of both projects start from the crop planting stage, and the product utilization is the end. The production process of the straw biogas project is divided into five stages (Figure 2): collection/storage/transportation of raw materials, pretreatment, anaerobic fermentation, purification/storage, and product utilization. The SBF project is divided into five stages (Figure 3): collection/storage/transportation of raw materials, pretreatment, pellet molding, screening and packaging, and product utilization.
In the corn planting stage, solar energy, wind energy, rain energy, and topsoil-loss data are based on the average of Hebei Province, and the corn growth cycle is calculated at 120 days. The basic data on the consumption of seeds, fertilizers, and labor costs are calculated using the average of the national statistics from 2014 to 2016 [32,33]. The amount of pesticide used is quoted [34].
Straw was used as a by-product of crop cultivation, and the planting stage was distributed using an economic value-based distribution method. Corn has a grass-to-grain ratio (including stems and cores) of 1.1 and a corncob-to-corn yield ratio of 0.21 [35]. The corn stem-to-corn yield ratio is 0.89 [36] and other studies have shown that up to 60% of straw can be collected and used as an energy source, that is, the straw utilization factor is 60%. At present, silage (water content 60%) price is $24/t, dry corn core is $48/t, corn is $256/t [37], and, through calculation, straw accounted for 9.52% of the planting process emergy input.
The moisture content of corn stalks acquired by the biogas project is 60%. The moisture content of corn stalks purchased by the briquetting project is 10%. The biogas project currently consumes 1450 tons of straw per year, and the briquetting project currently consumes 3300 tons of straw per year. At present, the average corn yield in North China is 5995 kg/ha [32]. According to the current production capacity, the biogas project can absorb 181ha of cultivated straw, and the briquetting project can absorb 928 ha of cultivated straw.
The straw collection area is a circular area centered on the biogas station, and the straw collection radius is 5 km. Straw is mainly based on direct transportation by farmers and brokers. The main means of transport for straw is the tractor trailer. The fuel consumption of the straw transport process is calculated as 0.06 L/(t·km) [38]. The average low calorific value of diesel is 38.72 MJ/L (survey data). The SBF project has a storage station with a material transportation radius of 20 km. Other aspects are similar to biogas projects.
According to [39], China currently accounts for 11.7% of renewable energy, so this article divides electricity into 11.7% renewable energy and 88.3% non-renewable energy.
3. Results
3.1. Emergy Input and Output
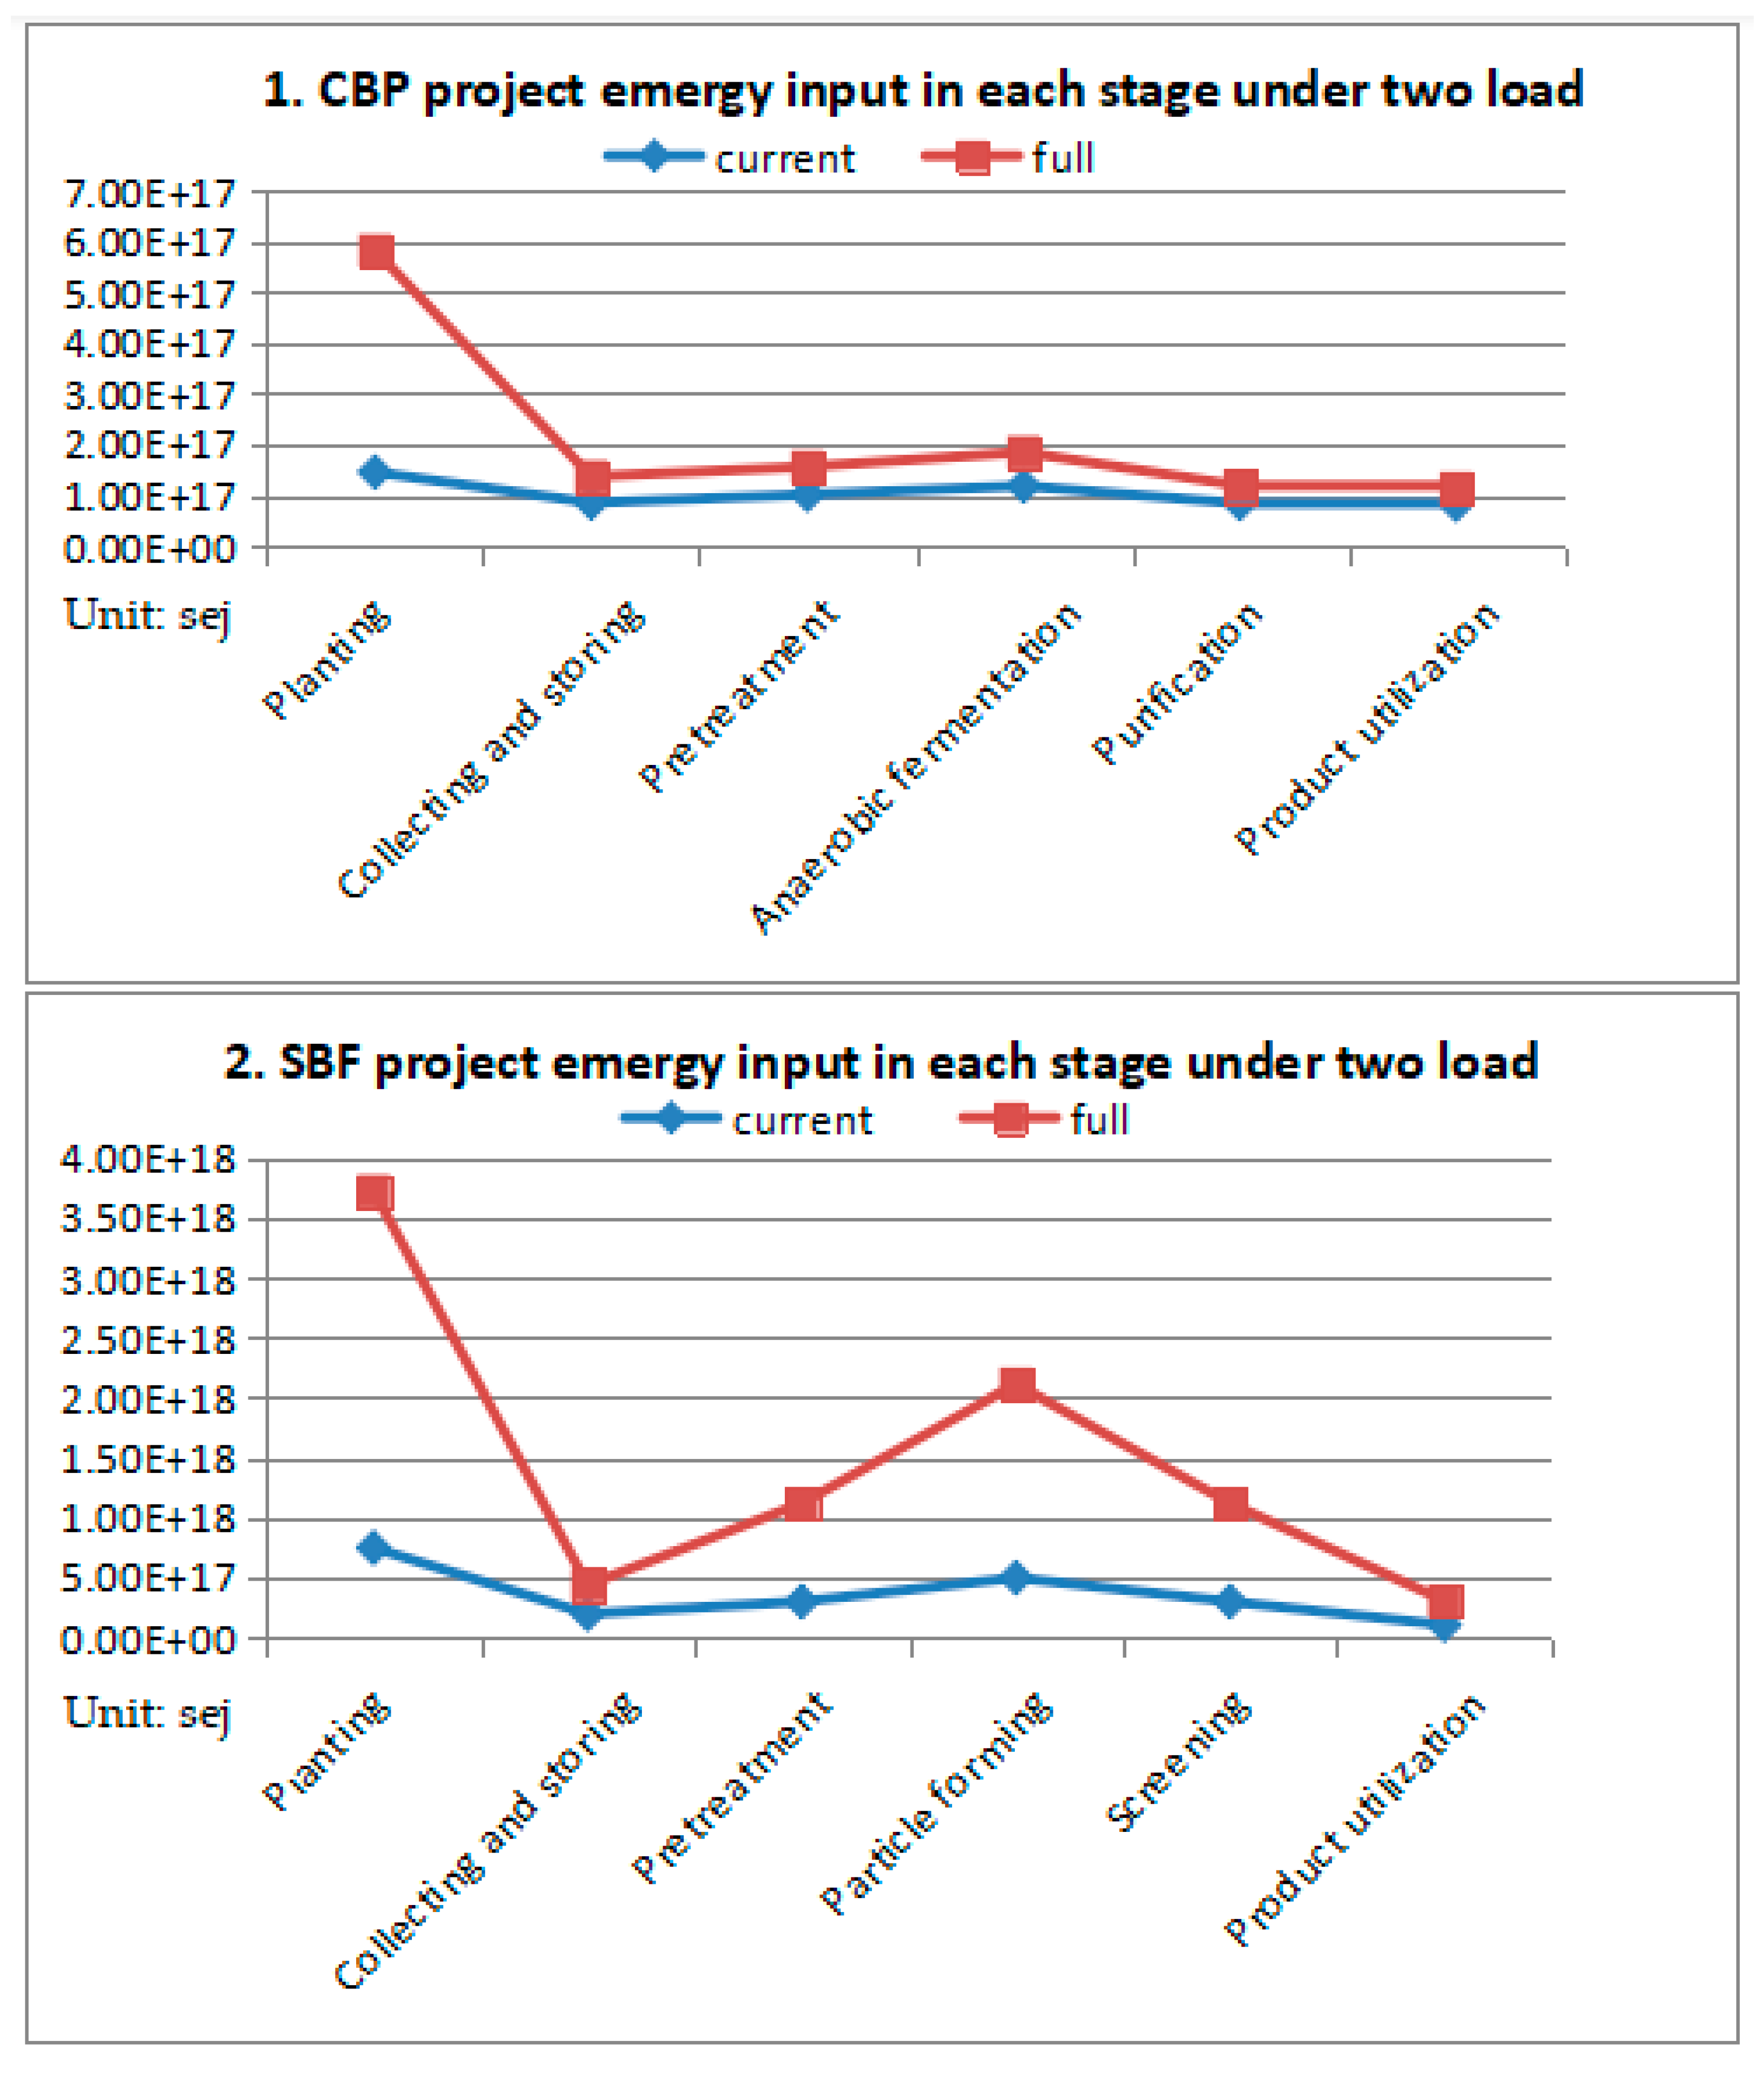
The emergy analysis lists of the CBP project are in Table 1 and Table 2. The emergy output includes biogas and digestate, and the emergy input includes renewable natural resources (solar, rain, wind, etc.), non-renewable natural resources (groundwater, topsoil), renewable purchased resources (labor, straw), and non-renewable purchased resources (construction investment, equipment investment, maintenance investment, electricity, coal, diesel, etc.). Among them, construction investment, equipment investment, labor, straw, coal burning in winter, etc., are the main input projects for biogas projects.
The emergy analysis lists of the SBF project are in Table 1 and Table 3. The emergy input includes renewable natural resources (solar, rain, wind, etc.), non-renewable natural resources (topsoil loss), renewable purchased resources (labor, straw), and non-renewable purchased resources (construction investment, equipment investment, maintenance investment, electricity, diesel, etc.). Among them, construction investment, equipment investment, labor, and straw are the main input projects.
Through the analysis of the emergy input of the two straw utilization modes (Figure 4), it can be seen that in the two modes under the current load, since the input of straw resources is limited, the emergy input of each stage is relatively uniform. However, under full load, the energy input of the two modes in the planting stage is relatively high. Under a full load of SBF mode, the emergy input of the briquetting forming stage suddenly increases, mainly because the utilization of consumables such as molds at this stage accounts for 34.39% of the emergy input in this stage. According to the current process, every 300 tons need to be replaced. A set of molds is worth $3200. The power consumption at this stage accounts for 44.95%.
3.2. Key Emergy Index
The indicators used in this section are provided in Table 4.
3.2.1. Ecological–Economic Evaluation Index
EYR is the ratio of the total output of system emergy to the value of purchased emergy. It is an indicator to measure the efficiency of input and output of the whole system. The higher the EYR, the higher the emergy output of the system with less investment and higher economic efficiency. Under the non-full-load operating conditions, the EYR of the CBP project is 1.05. The full load EYR is 1.11, similar to the EYR of CP. Comparing the two loads, it is almost equal. The EYR of the SBF project is 1.06. The full load EYR is 1.08, similar to the EYR of CP. Comparing the two loads, it is almost equal.
EIR is the ratio of the purchased emergy to the unpaid value, which is used to evaluate the system cost. The smaller the EIR, the lower the system input cost. Under the current load operation conditions, the EIR of the CBP project is 18.42, which is 9.2 at full load. Under full load, the system input cost is 50% lower than current load. Under the full-load operating conditions of the SBF project, the system input cost is 18% lower than current load.
3.2.2. Sustainability Evaluation Index
ESI is defined as the ratio of the emergy yield ratio to the environmental loading ratio. From the indicators of the two projects, the ESI of the two models under the current load is low, the sustainability is very poor, and the sustainability of the CBP project is lower than that of the SBF project. However, if it is under full load, sustainability will be significantly improved and it will have better vitality. They have a clear advantage over CP. Therefore, it is necessary to continuously optimize the process of improving the project, expand the market, strengthen government support, and improve the sustainable development capability of the project.
RI is the ratio of the renewable emergy to the total emergy of the input system. Renewability indicators are inversely related to ELR and can be used to evaluate system reproducibility. The larger the RI value, the smaller the dependence of the system on local environmental resources and external economic input, and the stronger the self-sustainability. The sustainability of the two projects is basically the same at full load. The RI values of the two projects are significantly higher than those of CP and are more sustainable than CP.
3.2.3. Environmental Assessment Index
ELR is the ratio of the total amount of non-renewable energy value of the system to the total amount of renewable energy. It is the environmental benefit to characterize the system’s impact on the environment. Under the current load, the ELR of the CBP project is 2.80. Although it is 180% higher than the ELR under full load, the environmental benefits index is still very suitable. Under the two loads, the SBF project also has very good environmental performance indicators. They have a clear advantage over CP.
3.3. Economic Value Analysis
This paper uses the two methods of emergy–money value analysis and market value analysis to compare the ecological–economic value of the two models under different loads as Table 5. The emergy–money value under the current load of the CBP project is relatively poor, but at full load, the economic benefits of the project are obvious. Since the digestate and solid fraction of the project is not fully utilized as feedback emergy, only biogas brings benefits. Therefore, the project has great potential for benefits. The benefits of the SBF project are good, and the benefits in current load are good enough. In terms of market value analysis, the biogas price of the CBP project is $0.32/m3. Currently, it can sell 182,500 m3 of desulfurization biogas per year, facing serious losses. Even under full load, the market economic benefits are still not optimistic, and the government’s support is needed to continue to operate. The market economic benefits of the SBF project are relatively good. At present, the price of the briquetting market is $128/t. Under the current load, the input–output ratio shows that the project is almost at break-even point. If the production capacity is completely released, it has very good economic benefits. Therefore, it is necessary to further expand the market to release production capacity. Therefore, we can find that the SBF model has better economic benefits, and the advantages are more obvious after full load. The economic benefits of the CBP project are relatively poor and need to be increased.
4. Discussion
The analysis results fully reflect the characteristics of the two straw utilization projects in the BBE model, and the optimal results can be achieved only in the full compliance state. Compared with the emergy analysis of household biogas in Gongcheng County (EYR, 1.10; EIR, 9.57; ESI, 0.10; ELR, 11.06) [22], all indicators of the CBP project are completely superior to household biogas under full load. Of course, because of different raw materials, the various indexes of SBF are not as good as wood briquetting fuel (EYR, 4.68; ELR, 0.27; ESI, 17.26) [44], so on the basis of consuming straw, the source of wood waste can be increased. In order to form a complementary rural energy structure of the BBE model, it needs to have strengths and avoid weaknesses in mode selection. Both projects have a low environmental load, which is important for reducing fossil energy consumption, environmental damage and slowing global warming. However, the emergy yields of both projects are low and do not have long-term sustainability. There are interdependencies between economic and environmental sustainability [45]. Although the indicators of the two projects have their own advantages and disadvantages, they must also be combined with the characteristics of the model itself. The straw collection radius of CBP is small, and many types of agricultural waste can be absorbed [46]. In addition to straw, based on reasonable site selection, it can also eliminate livestock manure and kitchen waste, which can greatly improve the rural environment [47]. The biogas directly reaches the farmer’s home, so that the farmers use the pipeline gas to purify the kitchen environment. The application of biogas fertilizer has improved the quality of agricultural products, promoted agricultural production and increased farmer income.
The process of the analysis reveals the disadvantages and improvement measures of the CBP and SBF projects. There is still a lot of optimization space in crop planting, market development, project management, and so on. In the crop planting stage, controlling the emergy input of the planting stage can effectively improve the energy output rate of the two projects. Among them, in the investment in the planting stage, labor cost investment accounted for 60.59% (Table 1, Table 2 and Table 3). It can be seen that controlling the labor cost input during the planting stage can most effectively improve the emergy output rate. In terms of market development, the CBP project does not fully exploit the market value of digestate, and there is still great potential for market development and government support. The market development capability of the SBF project also has great development potential. The project can completely develop through the market, release production capacity and achieve great benefits. In terms of project management, through the CBP model, agricultural wastes are resourced and utilized, which not only reduces atmospheric pollution and protects the environment, but also provides clean energy for biogas and returning organic matter to the field, thus promoting the construction of a modern ecological recycling agricultural system [48]. The advantage of the SBF model is that it overcomes the drawbacks of large biomass volume, is convenient for transportation and storage, has high combustion heat efficiency, and is easy to realize industrialization and large-scale application. Therefore, the material collection radius and product transportation radius can be very large. The use of the corn stalk briquetting fuel plant is expected to play an important role in increasing local resident income, improving rural ecological environments, alleviating energy shortages, guaranteeing energy security, and promoting new rural reconstruction [49]. Moreover, the use of briquetting fuel is consistent with the long-standing practice of farmers burning solid fuels such as firewood, which can be used as a good substitute for coal and fully meets the requirements of sustainable development. It can be used in a variety of small hot water boilers, home heating stoves or fireplaces, as well as small power generation heating facilities [50], so it is very convenient to promote and popularize. SBF provides convenient, clean and environmentally friendly energy for rural areas, reducing the damage of vegetation caused by rural fuel consumption; on the other hand, it is an industrial boiler with outstanding energy consumption and emissions as a substitute for coal and heavy oil. The use of it is an important boost to achieve energy conservation and emission reduction.
The government needs to provide corresponding support based on the strengths and weaknesses of the project. The government plays an essential role in the diffusion of improved technologies [30]. In Italy, the wood-pellet market serves more than 15% of the nation’s apartments. In Austria, government grants that cover 30% of the investment cost have encouraged companies and homeowners to install biomass heating systems that burn wood chips or pellets, so that biomass fuels one-third of the heating market [51]. Renewable energy technologies in Germany still enjoy a privileged position regarding their diffusion and marketing [52]. At present, in addition to subsidies for the price of biomass power generation in China, other biomass utilization projects are handled by local governments [53]. In the two typical cases selected, there are still many unreasonable places in everything from construction to operation. Product promotion and promotion are not in place, and government policy support is not in place, resulting in serious waste of production capacity. Subsidies for modern equipment purchase, policies of effective and renewable energy technologies, and educational investment in rural areas, may help for a positive transition in energy consumption for rural households [54]. It is fully capable of fully releasing production capacity, better-improving the eco-economic benefits and sustainable development capabilities of the two models, and improving the competitiveness of rural renewable energy utilization. In the end, it meets the requirements of the new socialist countryside construction and ecological civilization construction that the Chinese government is vigorously promoting [55,56].
The development of complementary integration based on local conditions is an important measure to optimize the energy consumption structure in rural areas, improve the ecological environment. The development and utilization of agricultural biomass energy and its industrial development not only have a good economic driving effect, but also can optimize the rural energy structure, adjust the structure of agricultural production, and improve the quality of life of farmers. First, in order to ensure production capacity, it is necessary to fully understand the market demand of the product. Wang et al. (2019), according to a survey, found the willingness to buy for CBP products is $10.1 per capita, and analyzed the factors affecting residents’ willingness to buy [57]. It is also necessary to adapt the needs of farmers to the local conditions and respect farmers’ living habits, improve the accessibility and affordability [58]. Second, through the biogas and briquetting of biomass energy, and the integration and utilization of electricity coupled with other renewable energy sources such as solar energy, one can better optimize the connotation and applicability of the BBE model [59]. Third, combined with the project’s own attributes and choosing the most suitable biomass energy use in rural areas, the optimal path of domestic energy use in rural areas is sought under the premise of economic and environmental sustainability. In the end, the BBE model returns the waste to the field, reduces environmental pollution, reduces the use of chemical fertilizers and pesticides, reduces production costs, improves the quality and output of agricultural products, and promotes the benign development of recycling agriculture [60]. Through the improvement of the quality of life of farmers, the improvement of rural living conditions will enable the real sustainable development of agriculture.
5. Conclusions
In order to form a complementary rural energy structure of the BBE model, it needs to have strengths and avoid weaknesses in its mode selection. The process of the analysis reveals the disadvantages and improvement measures of the two modes. Both projects have high renewability and low environmental load. The two models are in full compliance with the environmental protection requirements of the current rural ecological civilization construction in terms of environmental indicators. However, it does not have long-term sustainability because economic indicators and sustainability indicators are not good. Especially in the case of severe insufficient market demand, capacity cannot be released and the economic and sustainability of the two models are relatively poor, but with the release of the production capacity, economics and sustainability are gradually improving. The two models still have great potential for optimization and improvement. The government needs to provide corresponding support based on the strengths and weaknesses of the project. From the perspective of economic value, a certain gap needs to increase government intervention and support. The development of complementary integration based on local conditions is an important measure to optimize the energy consumption structure in rural areas and improve the ecological environment.
However, this study has several limitations that need attention. First, there are many types of projects, and the typicality of the project has certain limitations. Secondly, according to the research projects in Hebei Province, they have certain limitations to estimate the whole NCP. Third, the utilization of straw resources is now a hot topic, the updating of technologies and models is changing with each passing day, and the project parameters change rapidly. Therefore, more investigations should be conducted to enhance the reliability and applicability of the research results.
Author Contributions
All authors were involved in preparing the manuscript. Conceptualization, Q.W., T.D.and C.Y.; methodology, Q.W.; software, Q.W.; validation, Q.W., C.Y. and L.F.; formal analysis, Q.W. and X.H.; investigation, Q.W. and X.H.; resources, C.Y. and L.F.; data curation, Q.W.; writing—original draft preparation, Q.W. and T.D.; writing—review and editing, Q.W., T.D., C.Y. and X.H.; visualization, Q.W.; supervision, C.Y. and T.D.; project administration, Q.W. and L.F.; funding acquisition, C.Y. All authors have read and agreed to the published version of the manuscript.
Funding
This work was supported by Major Program of National Philosophy and Social Science Foundation of China (18ZDA048), China Agriculture Research System-Green Manure (CARS-22-G25).
Conflicts of Interest
The authors declare no conflict of interest.
Abbreviations/Nomenclature
| NCP | North China Plain |
| CBP | Centralized Biogas Production |
| SBF | Straw Briquetting Fuel |
| CNY | Chinese Yuan (¥) |
| CP | Coal Power |
| Mtce | Coal Equivalent |
| BBE | Biogas, Briquetting, Electricity |
| R | Renewable natural resources |
| N | Non-renewable natural resources |
| RP | Purchased renewable resources |
| NP | Purchased non-renewable resources |
| EYR | Emergy yield ratio |
| EIR | Emergy investment ratio |
| ESI | Environmental sustainability index |
| RI | Renewable index |
| ELR | Environmental loading ratio |
Appendix A. Straw Biogas Project
The following calculation formula is mainly based on [21,31,61] and related literature. The cost of infrastructure construction and engineering services is depreciated over 20 years, and the cost of equipment and installation services is depreciated over 10 years. $1 = 6.25 CNY (2012 exchange rate). The specific process is as follows:
Appendix A.1. Corn Planting Stage
- Sun (J) = Land area × Mean annual global radiation × (1- Albedo) × Ratio of growth period to one year = (1 ha) × (5.06 × 10¹³ J/m2) × (1 – 20%) × 120 d/365 d=1.33 × 10¹³ J/ha [21]
- Wind (J) = Land area × Atmosphere layer × Air density × Wind speed × Ratio of growth period to one year = (1 ha) × (1000 m) × (1.23 × 10⁴ kg/m3) × (2.91 m/s) × 120 d/365 d = 1.18 × 10⁷ J/ha [21]
- Rain, geopotential energy (J) = Land area × Rainfall × Average elevation × density of rain × Gravity = (10,000 m2) × (0.618 m/a) × (24.5 m) × (1000 kg/m3) × (9.8 m/s2) = 1.48 × 10⁹ J/ha [21]
- Rain, chemical energy (J) = Land area × Rainfall × Gibbs free energy × density of rain = (10,000 m2) × (0.618m/a) × (4.94 × 10³ J/kg) × (1000 kg/m3) = 3.05 × 10¹⁰ J/ha [21]
- Seed (J) = Annual consumption × Energy of seed = 26.3 kg/ha × 1.63 × 10⁷J/kg = 4.29 × 10⁸ J/ha [31]
- Groundwater (J): Average quantity × Conversion × Gibbs free energy = 180 m3/ha × 1000 kg/m3 × 4940 J/kg = 8.89 × 10⁸ J/ha [21]
- Compound fertilizer (g) = Average quantity = 9.2 × 10⁴ g/ha [33]
- Nitrogen (g) = Average quantity = 1.46 × 10⁵ g/ha [34]
- Phosphate = Average quantity = 1600 g/ha [34]
- Potash = Average quantity = 720 g/ha [34]
- Pesticide = Average quantity = 3000 g/ha [34]
- Fuel for machinery (J) = Consumption × heating value = (28.51 kg/ha) × (4.40 × 10⁷ J/kg) = 1.25 × 10⁹ J/ha [63]
- Machinery (g) = Average quantity = 4500 g/ha [63]
- Labor1 (¥) = 7030.8 CNY/ha [64]
Appendix A.2. Raw Material Collection, Transportation and Storage Stage
- Labor2 (J) = Working days (8 h/d) × Energy conversion coefficient [31] = 483 d × 1.26 × 107 J/d = 6.09 × 10⁹ J/a (According to the calculation of 6 t/d per 2 laborers, there are 2 workers responsible for the project currently.)
- Construction investment (¥) = (328,860 CNY/a)/20 = 16,443 CNY/a (survey)
- Equipment investment (¥) = (519,750 CNY/a)/10 = 51,975 CNY/a (survey)
- Service (¥) = (246,026 CNY/a)/10 = 24,603 CNY/a (survey)
Appendix A.3. Pretreatment Stage
- Labor2 (J) = Working days (8h/d) × Energy conversion coefficient [31] = 274 d × 1.26 × 107 J/d [31] = 3.45 × 10⁹ J/a (At present, there are 2 operators, working hours are 12 h a day, converted into 1.5 working days, and the total is converted into 1095 working days, which is divided into four stages of A3, A4, A5 and A6, average working days for each stage is 274 days)
- Groundwater (J) = Average quantity × Conversion × Gibbs free energy = 5.86 × 10³ m3/a × 1000 kg/m3 × 4940 J/kg = 2.89 × 10¹⁰ J/a [63]
- Electricity (J) = Consumption × Coefficient of converted energy [31] = (2130 kWh) × (3.60 × 10⁶ J/kWh) = 7.67 × 10⁹ J/a
- Construction investment (¥) = (182,385 CNY/a)/20 = 9119 CNY/a (survey)
- Equipment investment (¥) = (711,900 CNY/a)/10 = 71,190 CNY/a (survey)
- Service (¥) = (336,981 CNY/a)/10 = 33,698 CNY/a (survey)
Appendix A.4. Anaerobic Fermentation Stage
- Labor2 (J) = Working days (8 h/d) × Energy conversion coefficient = 274 d × 1.26 × 107 J/d = 3.45 × 10⁹ J [31]
- Coal (J) = Consumption × Energy conversion coefficient = (8000 kg/a) × (2.09 × 10⁷ J/kg) = 1.67 × 10¹¹ J/a [31]
- Electricity (J) = Consumption × Energy conversion coefficient = (2130 kWh) × (3.60 × 10⁶ J/kWh) = 7.67 × 10⁹ J/a [31]
- Construction investment (¥) = (182,385 CNY/a)/20 = 9119 CNY/a (survey)
- Equipment investment (¥) = (835,380 CNY/a)/10 = 83,538 CNY/a (survey)
- Service (¥) = (39,5431 CNY/a)/10 = 39,543 CNY/a (survey)
Appendix A.5. Biogas Purification Stage
- Labor2 (J) = Working days (8 h/d) × Energy conversion coefficient = 274 d × 1.26 × 107 J/d = 3.45 × 10⁹ J [31]
- Electricity (J) = Consumption × Energy conversion coefficient = (2130 kWh) × (3.60 × 10⁶ J/kWh) = 7.67 × 10⁹ J/a [31]
- Construction investment (¥) = (182,385 CNY/a)/20 = 9119 CNY/a (survey)
- Equipment investment (¥) = (609,525 CNY/a)/10 = 60,953 CNY/a (survey)
- Service (¥)= (288,521 CNY/a)/10 = 28,852 CNY/a (survey)
Appendix A.6. Product Utilization Stage
- Labor2 (J) = Working days (8 h/d) × Energy conversion coefficient = 274 d × 1.26 × 107 J/d = 3.45 × 10⁹ J [31]
- Electricity (J) = Consumption × Energy conversion coefficient = (2130 kWh) × (3.60 × 10⁶ J/kWh) = 7.67 × 10⁹ J/a [31]
- Construction investment (¥) = (423,990 CNY/a)/20 = 21,200 CNY/a (survey)
- Equipment investment (¥) = (513,450 CNY/a)/10 = 51,345 CNY/a (survey)
- Service (¥) = (243,044 CNY/a)/10 = 24,304 CNY/a (survey)
Appendix B. Straw Briquetting Project
Appendix B.1. Corn Planting Stage
Same as Appendix A.1.
Appendix B.2. Raw Material Collection, Transportation and Storage Stage
- Labor2 (J) = Working days (8 h/d) × Energy conversion coefficient = 1650 d × 1.26 × 107 J/d [31] = 2.08 × 10¹⁰ J (According to the calculation of 4 t/d per 2 laborers, there are 6 workers responsible for the project currently.)
- Fuel for machinery (J) = Amount of straw × Fuel consumption of straw transportation × Average transport distance × Energy conversion coefficient = 3300 t × 0.048 kg/(t·km) × 10 km × 4.27 × 107 J/kg = 6.76 × 10¹⁰ J [31]
- Construction investment (¥) = (911,400 CNY/a)/20 = 45,570 CNY/a
- Equipment investment (¥) = (976,500 CNY/a)/10 = 97,650 CNY/a
- Service (¥) = (384,300 CNY/a)/10 = 38,430 CNY/a
Appendix B.3. Pretreatment Stage
- Labor2 (J) = Working days (8 h/d) × Energy conversion coefficient = 1369 d × 1.26 × 107 J/d [31] = 1.72 × 10¹⁰ J/a (At present, there are 10 operators, working hours are 12 h a day, converted into 1.5 working days, and the total is converted into 5475 working days, which is divided into four stages of B3, B4, B5 and B6, average working days for each stage is 1369 days)
- Electricity (J) = Amount of production × Electricity consumption per ton × Energy conversion coefficient = (3000 t) × (55.56 kWh/t) × (3.60 × 10⁶ J/kWh) = 6.00 × 10¹¹ J/t [31]
- Construction investment (¥) = (764,890 CNY/a)/20 = 38,245 CNY/a
- Equipment investment (¥) = (613,053 CNY/a)/10 = 61,305 CNY/a
- Service (¥) = (252,756 CNY/a)/10 = 25,276 CNY/a
Appendix B.4. Particle Forming Stage
- Labor2 (J) = Working days (8 h/d) × Energy conversion coefficient = 1369 d × 1.26 × 107 J/d = 1.72 × 10¹⁰ J [31]
- Electricity (J) = Amount of production × Electricity consumption per ton × Energy conversion coefficient = (3000 t) × (74.07 kWh) × (3.60 × 10⁶ J/kWh) = 8.01 × 10¹¹ J/t [31]
- Moulds and other consumables (¥) = 200,000 CNY/a
- Construction investment (¥) = (764,890 CNY/a)/20 = 38,245 CNY/a
- Equipment investment (¥) = (613,053 CNY/a)/10 = 61,305 CNY/a
- Service (¥) = (252,756 CNY/a)/10 = 25,276 CNY/a
Appendix B.5. Screening and Packaging Stage
- Labor2 (J) = Working days (8 h/d) × Energy conversion coefficient = 1369 d × 1.26 × 107 J/d = 1.72 × 10¹⁰ J/a [31]
- Electricity (J) = Amount of production × Electricity consumption per ton × Energy conversion coefficient = (3000 t) × (55.56 kWh/t) × (3.60 × 10⁶ J/kWh) = 6.00 × 10¹¹ J/a
- Packaging bag (g) = 3.00 × 10⁶ g/a (survey)
- Construction investment (¥) = (764,890 CNY/a)/20 = 38,245 CNY/a
- Equipment investment (¥) = (613,053 CNY/a)/10 = 61,305 CNY/a
- Service (¥) = (252,756 CNY/a)/10 = 25,276 CNY/a
Appendix B.6. Product Utilization Stage
- Labor2 (J) = Working days (8 h/d) × Energy conversion coefficient = 1369 d × 1.26 × 107 J/d = 1.72 × 10¹⁰ J [31]
- Fuel for machinery (J) = Amount of production × Fuel consumption of straw transportation × Average transport distance × Energy conversion coefficient = 3000 t × 0.048 kg/(t·km) × 10 km × 4.27 × 107 J/kg = 6.15 × 10¹⁰ J [31]
- Construction investment (¥) = (294,000 CNY/a)/20 = 14,700 CNY/a
- Equipment investment (¥) = (384,300 CNY/a)/10 = 38,430 CNY/a
- Service (¥) = (157,500 CNY/a)/10 = 15,750 CNY/a
References
- Zhou, N.; Price, L.; Yande, D.; Creyts, J.; Khanna, N.; Fridley, D.; Lu, H.; Feng, W.; Liu, X.; Hasanbeigi, A.; et al. A roadmap for China to peak carbon dioxide emissions and achieve a 20% share of non-fossil fuels in primary energy by 2030. Appl. Energy 2019, 239, 793–819. [Google Scholar] [CrossRef]
- Choi, Q. Is South Korea’s Emission Trading Scheme Effective? An Analysis Based on the Marginal Abatement Cost of Coal-Fueled Power Plants. Sustainability 2019, 11, 2504. [Google Scholar] [CrossRef] [Green Version]
- NDRC. NEA, Energy Supply and Consumption Revolution Strategy (2016–2030). In National Development and Reform Commission; National Energy Agency: Paris, France, 2016. (In Chinese) [Google Scholar]
- Qi, C.; Choi, Y. A Study of the Feasibility of International ETS Cooperation between Shanghai and Korea from Environmental Efficiency and CO2 Marginal Abatement Cost Perspectives. Sustainability 2019, 11, 4468. [Google Scholar] [CrossRef] [Green Version]
- Chen, Y.; Yuan, H.; Huhe, T. Rural Energy Supply Greening and Energy Cleanliness and Facilitation, 1st ed.; China Science Publishing Hous: Beijing, China, 2019. (In Chinese) [Google Scholar]
- Du, X.; Liu, X.; Huang, Q. Research on China’s Rural Energy Revolution and Distributed Low Carbon Energy Development Strategy, 1st ed.; China Science Publishing Hous: Beijing, China, 2019. (In Chinese) [Google Scholar]
- Xie, K.; Ren, X. Rural Energy Revolution and Western Energy Development Strategy Research, 1st ed.; China Science Publishing Hous: Beijing, China, 2019. (In Chinese) [Google Scholar]
- China Agricultural Statistics Yearbook Editorial Board. China Agricultural Statistics Yearbook; China Agricultural Press: Beijing, China, 2017; p. 183. (In Chinese) [Google Scholar]
- Jia, X.; Ye, H. Selection of Policy Tools for Pollution Control of Straw Incineration—Based on Analysis of Public Policy and Economics. Arid Area Resour. Environ. 2016, 30, 36–41, (In Chinese with English abstract). [Google Scholar]
- Wu, S.; Liu, L.; Liu, W.; Chen, L.; Dong, R. Evaluation of Ecological Benefits of Solar Heating and Biogas Reuse Biogas Project. Trans. Chin. Soc. Agric. Eng. 2017, 33, 205–210, (In Chinese with English abstract). [Google Scholar]
- Fang, F.; Li, X.; Shi, Z.; Wang, F.; Chang, Z.; Zhang, S.; Sun, R.; Bao, Z.; Qiu, L. Analysis of distribution and utilization structure of crop straw resources in Huanghuaihai area. Trans. Chin. Soc. Agric. Eng. 2015, 31, 228–234, (In Chinese with English abstract). [Google Scholar]
- Cui, M.; Zhao, L.; Tian, Y.; Meng, H.; Sun, L.; Zhang, Y.; WANG, F.; Li, B. Analysis and evaluation of energy utilization of main crop straw resources in China. Trans. Chin. Soc. Agric. Eng. 2008, 24, 291–296, (In Chinese with English abstract). [Google Scholar]
- Wang, J.; Xue, Q.; Guo, T.; Mei, Z.; Long, E.; Wen, Q.; Huang, W.; Luo, T.; Huang, R. A review on CFD simulating method for biogas fermentation material fluid. Renew. Sustain. Energy Rev. 2018, 97, 64–73. [Google Scholar] [CrossRef]
- Sun, H.; Cui, X.; Stinner, W.; Mustafa Shah, G.; Cheng, H.; Shan, S.; Guo, J.; Dong, R. Synergetic effect of combined ensiling of freshly harvested and excessively wilted maize stover for efficient biogas production. Bioresour. Technol. 2019, 285, 121338. [Google Scholar] [CrossRef]
- Mazurkiewicz, J.; Marczuk, A.; Pochwatka, P.; Kujawa, S. Maize Straw as a Valuable Energetic Material for Biogas Plant Feeding. Materials 2019, 12, 3848. [Google Scholar] [CrossRef] [Green Version]
- Wandera, S.M.; Qiao, W.; Algapani, D.E.; Bi, S.; Yin, D.; Qi, X.; Liu, Y.; Dach, J.; Dong, R. Searching for possibilities to improve the performance of full scale agricultural biogas plants. Renew. Energy 2018, 116, 720–727. [Google Scholar] [CrossRef]
- Liu, J.E.; Lin, B.; Sagisaka, M. Sustainability assessment of bioethanol and petroleum fuel production in Japan based on emergy analysis. Energy Policy 2012, 44, 23–33. [Google Scholar] [CrossRef]
- Baral, A.; Bakshi, B.R. Emergy analysis using US economic input–output models with applications to life cycles of gasoline and corn ethanol. Ecol. Model. 2010, 221, 1807–1818. [Google Scholar] [CrossRef]
- Ju, L.P.; Chen, B. Embodied energy and emergy evaluation of a typical biodiesel production chain in China. Ecol. Model. 2011, 222, 2385–2392. [Google Scholar] [CrossRef]
- Wang, L.; Ni, W.; Li, Z. Emergy evaluation of combined heat and power plant eco-industrial park (CHP plant EIP). Resour. Conserv. Recycl. 2006, 48, 56–70. [Google Scholar] [CrossRef]
- Odum, H.T. Environmental Accounting: Emergy and Environmental Decision Making; John Wiley and Sons: New York, NY, USA, 1996. [Google Scholar]
- Yang, J.; Chen, B. Emergy analysis of a biogas-linked agricultural system in rural China—A case study in Gongcheng Yao Autonomous County. Appl. Energy 2014, 118, 173–182. [Google Scholar] [CrossRef]
- Wang, X.; Chen, Y.; Sui, P.; Gao, W.; Qin, F.; Wu, X.; Xiong, J. Efficiency and sustainability analysis of biogas and electricity production from a large-scale biogas project in China: An emergy evaluation based on LCA. J. Clean. Prod. 2014, 65, 234–245. [Google Scholar] [CrossRef]
- Zhang, B.; Chen, B. Sustainability accounting of a household biogas project based on emergy. Appl. Energy 2017, 194, 819–831. [Google Scholar] [CrossRef]
- Chen, S.; Chen, B. Sustainability and future alternatives of biogas-linked agrosystem (BLAS) in China: An emergy synthesis. Renew. Sustain. Energy Rev. 2012, 16, 3948–3959. [Google Scholar] [CrossRef]
- Brown, M.T.; Ulgiati, S. Emergy evaluations and environmental loading of electricity production systems. J. Clean. Prod. 2002, 10, 321–334. [Google Scholar] [CrossRef]
- Wang, X.; Dadouma, A.; Chen, Y.; Sui, P.; Gao, W.; Jia, L. Sustainability evaluation of the large-scale pig farming system in North China: An emergy analysis based on life cycle assessment. J. Clean. Prod. 2015, 102, 144–164. [Google Scholar] [CrossRef]
- Da-li, S.; Sheng-peng, H.; Xiu-bin, W.; Guo-qing, L.; Wei, Z. Nutrient resource quantity of crop straw and its potential of substituting. J. Plant Nutr. Fertil. 2018, 24, 1–21. (In Chinese) [Google Scholar]
- Encyclopedia, B. North China Plain. Available online: https://baike.baidu.com/item/华北平原/555727?fr=aladdin(5–25) (accessed on 17 January 2020).
- Zhang, W.; Wang, C.; Zhang, L.; Xu, Y.; Cui, Y.; Lu, Z.; Streets, D.G. Evaluation of the performance of distributed and centralized biomass technologies in rural China. Renew. Energy 2018, 125, 445–455. [Google Scholar] [CrossRef]
- Chen, F. Agricultural Ecology, 2nd ed.; China Agricultural University Press: Beijing, China, 2011. (In Chinese) [Google Scholar]
- Ministry of Agriculture. China Agricultural Statistics; China Agricultural Press: Beijing, China, 2017.
- Rural Social Economic Investigation Division, N.B.O.S. China Rural Statistical Yearbook; China Statistics Press: Beijing, China, 2017. [Google Scholar]
- Hu, S.; Mo, X.; Lin, Z.; Qiu, J. Emergy Assessment of a Wheat-Maize Rotation System with Different Water Assignments in the North China Plain. Environ. Manag. 2010, 46, 643–657. [Google Scholar] [CrossRef] [PubMed]
- BI, Y. Study on Evaluation and Utilization of Straw Resources; Chinese Academy of Agricultural Sciences: Beijing, China, 2010. [Google Scholar]
- Sheehan, J.; Aden, A.; Paustian, K.; Killian, K.; Brenner, J.; Walsh, M.; Nelson, R. Is Ethanol Made from Corn Stover a Sustainable Transportation Fuel? In Enzyme Sugar Platform (ESP) Project FY03 Review Meeting (2003) 26; National Renewable Energy Laboratory: Golden, CO, USA, 2003. [Google Scholar]
- Liu, H.; Nan, Z.; Tang, Z.; Wang, L. Comparison of economic benefits between alfalfa, wheat and corn. Chin. Grass Sci. 2016, 33, 990–995, (In Chinese with English abstract). [Google Scholar]
- Liu, H.; Yin, X.; Wu, C.; Liang, W.; Xu, J. Life Cycle Analysis of Eergy Consumption and Green House Gas Emissions for Wod Pellet. Acta Energiae Sol. Sin. 2013, 34, 709–713. [Google Scholar]
- National Development and Reform Commission. China Renewable Energy Industry Development Report; China Economic Press: Beijing, China, 2017. [Google Scholar]
- Yang, Z.F.; Jiang, M.M.; Chen, B.; Zhou, J.B.; Chen, G.Q.; Li, S.C. Solar emergy evaluation for Chinese economy. Energy Policy 2010, 38, 875–886. [Google Scholar] [CrossRef]
- Hongyan, W. Energy Value Analysis of Concentrated Biogas Supply Project of Straw Biogas Based on LCA. PHD; Chinese Academy of Agricultural Sciences: Beijing, China, 2016. [Google Scholar]
- Zhou, S.Y.; Zhang, B.; Cai, Z.F. Emergy analysis of a farm biogas project in China: A biophysical perspective of agricultural ecological engineering. Commun. Nonlinear Sci. 2010, 15, 1408–1418. [Google Scholar] [CrossRef]
- Ulgiati, S.; Brown, M.T. Quantifying the environmental support for dilution and abatement of process emissions: The case of electricity production. J. Clean Prod. 2002, 10, 335–348. [Google Scholar] [CrossRef]
- Liang, W.; Xu, J. Energy and energy analysis of wood-formed particles. Chin. Renew. Energy 2012, 30, 115–119, (In Chinese with English abstract). [Google Scholar]
- Azevedo, S.G.; Sequeira, T.; Santos, M.; Mendes, L. Biomass-related sustainability: A review of the literature and interpretive structural modeling. Energy 2019, 171, 1107–1125. [Google Scholar] [CrossRef]
- Chen, W.; Liu, W.; Geng, Y.; Brown, M.T.; Gao, C.; Wu, R. Recent progress on emergy research: A bibliometric analysis. Renew. Sustain. Energy Rev. 2017, 73, 1051–1060. [Google Scholar] [CrossRef]
- Deng, L.; Liu, Y.; Zheng, D.; Wang, L.; Pu, X.; Song, L.; Wang, Z.; Lei, Y.; Chen, Z.; Long, Y. Application and development of biogas technology for the treatment of waste in China. Renew. Sustain. Energy Rev. 2017, 70, 845–851. [Google Scholar] [CrossRef]
- Zhang, Y.; Yin, C.; Cao, S.; Cheng, L.; Wu, G.; Guo, J. Heavy metal accumulation and health risk assessment in soil-wheat system under different nitrogen levels. Sci. Total Environ. 2018, 622, 1499–1508. [Google Scholar] [CrossRef] [PubMed]
- Hu, J.; Lei, T.; Wang, Z.; Yan, X.; Shi, X.; Li, Z.; He, X.; Zhang, Q. Economic, environmental and social assessment of briquette fuel from agricultural residues in China—A study on flat die briquetting using corn stalk. Energy 2014, 64, 557–566. [Google Scholar] [CrossRef]
- Zhang, X.; Ma, F. Emergy Evaluation of Different Straw Reuse Technologies in Northeast China. Sustainability 2015, 7, 11360–11377. [Google Scholar] [CrossRef] [Green Version]
- Goldstein, N. Building longevity into composting buildings. BioCycle 2006, 47, 29–31. [Google Scholar]
- Glensk, B.; Madlener, R. Energiewende @ Risk: On the Continuation of Renewable Power Generation at the End of Public Policy Support. Energies 2019, 12, 3616. [Google Scholar] [CrossRef] [Green Version]
- Yuan, J.; Guo, X.; Zhang, W.; Chen, S.; Ai, Y.; Zhao, C. Deregulation of power generation planning and elimination of coal power subsidy in China. Util. Policy 2019, 57, 1–15. [Google Scholar] [CrossRef]
- Zou, B.; Luo, B. Rural household energy consumption characteristics and determinants in China. Energy 2019, 2019, 814–823. [Google Scholar] [CrossRef]
- Huang, X.; Cheng, L.; Chien, H.; Jiang, H.; Yang, X.; Yin, C. Sustainability of returning wheat straw to field in Hebei, Shandong and Jiangsu provinces: A contingent valuation method. J. Clean. Prod. 2019, 213, 1290–1298. [Google Scholar] [CrossRef]
- Yang, X.; He, L.; Xia, Y.; Chen, Y. Effect of government subsidies on renewable energy investments: The threshold effect. Energy Policy 2019, 132, 156–166. [Google Scholar] [CrossRef]
- Wang, Q.; Dogot, T.; Wu, G.; Huang, X.; Yin, C. Residents’ Willingness for Centralized Biogas Production in Hebei and Shandong Provinces. Sustainability 2019, 11, 7175. [Google Scholar] [CrossRef] [Green Version]
- Li, J.; Chen, C.; Liu, H. Transition from non-commercial to commercial energy in rural China: Insights from the accessibility and affordability. Energy Policy 2019, 127, 392–403. [Google Scholar] [CrossRef]
- Krishan, O.; Suhag, S. Techno-economic analysis of a hybrid renewable energy system for an energy poor rural community. J. Energy Storage 2019, 23, 305–319. [Google Scholar] [CrossRef]
- Zhang, Y.; Cao, S.; Zhang, Z.; Meng, X.; Hsiaoping, C.; Yin, C.; Jiang, H.; Wang, S. Nutritional quality and health risks of wheat grains from organic and conventional cropping systems. Food Chem. 2020, 308, 125584. [Google Scholar] [CrossRef]
- Lan, S.; Qin, P.; Lu, H. Energy Economic System Energy Value Analysis; Chemical Industry Press: Beijing, China, 2002; p. 427. [Google Scholar]
- Brown, M.T.; Arding, J. Tranformities Working Paper; Center for wetlands, University of Florida: Gainesville, FL, USA, 1991. [Google Scholar]
- Wang, X.; Chen, Y.; Sui, P.; Gao, W.; Qin, F.; Zhang, J.; Wu, X. Emergy analysis of grain production systems on large-scale farms in the North China Plain based on LCA. Agric. Syst. 2014, 128, 66–78. [Google Scholar] [CrossRef]
- Rural Social Economic Investigation Division, National Bureau of Statistics. National Agricultural Products Cost-benefit Data Compilation 2017; China Statistics Press: Beijing, China, 2017.
- Liu, H.; Yin, X.; Wu, C. Straw supply cost analysis. Trans. Chin. Soc. Agric. Mach. 2011, 42, 106–112, (In Chinese with English abstract). [Google Scholar]
- Lei, Z.; Yang, J.; Lei, Z.; Huibin, H.; Chao, Y.; Min, L.; Lintian, M. Preparation of soybean oil factory sludge catalyst by plasma and the kinetics of selective catalytic oxidation denitrification reaction. J. Clean. Prod. 2019, 217, 317–323. [Google Scholar] [CrossRef]

Figure 2.
Energy flow diagram of centralized biogas production (CBP) project.

Figure 3.
Energy flow diagram of straw briquetting fuel (SBF) project.

Figure 4.
Comparison of emergy input in each stage under two loads.


Table 1.
Emergy input in straw planting stage (current load).
| Item | Category | Unit | Raw Data | Emergy Transformity | Solar Energy Value | |||
|---|---|---|---|---|---|---|---|---|
| CBP | SBF | Value | Reference | CBP | SBF | |||
| Solar energy | R | J | 2.29 × 10¹⁴ | 1.17 × 10¹⁵ | 1.00 | [21] | 2.29 × 10¹⁴ | 1.17 × 10¹⁵ |
| Wind energy | R | J | 2.03 × 10⁸ | 1.04 × 10⁹ | 2.45 × 10³ | [21] | 4.98 × 10¹¹ | 2.55 × 10¹² |
| Rain, geothermal energy | R | J | 2.55 × 10¹⁰ | 1.31 × 10¹¹ | 4.70 × 10⁴ | [21] | 1.20 × 10¹⁵ | 6.15 × 10¹⁵ |
| Rai, chemical energy | R | J | 5.26 × 10¹¹ | 2.69 × 10¹² | 3.05 × 10⁴ | [21] | 1.60 × 10¹⁶ | 8.22 × 10¹⁶ |
| Topsoil loss | N | J | 6.50 × 10¹⁰ | 3.33 × 10¹¹ | 1.05 × 10⁵ | [21] | 6.82 × 10¹⁵ | 3.50 × 10¹⁶ |
| Seed | RP | J | 7.37 × 10⁹ | 3.78 × 10¹⁰ | 1.11 × 10⁵ | [21] | 8.19 × 10¹⁴ | 4.20 × 10¹⁵ |
| Water | RP | J | 1.53 × 10¹⁰ | 7.85 × 10¹⁰ | 2.25 × 10⁵ | [21] | 3.45 × 10¹⁵ | 1.77 × 10¹⁶ |
| Compound fertilizer | NP | g | 1.59 × 10⁶ | 8.13 × 10⁶ | 4.70 × 10⁹ | [21] | 7.45 × 10¹⁵ | 3.82 × 10¹⁶ |
| Nitrogen fertilizer | NP | g | 2.52 × 10⁶ | 1.29 × 10⁷ | 6.38 × 10⁹ | [21] | 1.61 × 10¹⁶ | 8.23 × 10¹⁶ |
| Phosphate fertilizer | NP | g | 2.76 × 10⁵ | 1.41 × 10⁶ | 6.55 × 10⁹ | [21] | 1.81 × 10¹⁵ | 9.26 × 10¹⁵ |
| Potash | NP | g | 1.24 × 10⁴ | 6.36 × 10⁴ | 2.96 × 10⁹ | [21] | 3.67 × 10¹³ | 1.88 × 10¹⁴ |
| Pesticide | NP | g | 5.17 × 10⁴ | 2.65 × 10⁵ | 2.72 × 10⁹ | [21] | 1.41 × 10¹⁴ | 7.21 × 10¹⁴ |
| Fuel for machinery | NP | J | 2.15 × 10¹⁰ | 1.10 × 10¹¹ | 1.11 × 10⁵ | [21] | 2.39 × 10¹⁵ | 1.23 × 10¹⁶ |
| Mechanical | NP | g | 7.75 × 10⁴ | 3.98 × 10⁵ | 1.13 × 10¹⁰ | [21] | 8.76 × 10¹⁴ | 4.49 × 10¹⁵ |
| Labor 1 | RP | ¥ | 1.21 × 10⁵ | 6.21 × 10⁵ | 7.27 × 10¹¹ | [40] | 8.81 × 10¹⁶ | 4.52 × 10¹⁷ |
| Straw | Y | g | 1.45 × 10⁹ | 5.80 × 10⁹ | / | / | 1.45 × 10¹⁷ | 5.81 × 10¹⁷ |
Note: See Appendix A (Appendix A.1).
Table 2.
Emergy input of CBP project.
| Stage | Item | Category | Unit | Raw Data | Emergy Transformity | Solar Energy Value | |||
|---|---|---|---|---|---|---|---|---|---|
| Current | Full | Value | Reference | Current | Full | ||||
| Raw material collection and storage | Labor 2 | RP | J | 6.09 × 10⁹ | 2.44 × 10¹⁰ | 2.56 × 10⁶ | [41] | 1.56 × 10¹⁶ | 6.24 × 10¹⁶ |
| Diesel | NP | J | 1.49 × 10¹⁰ | 5.96 × 10¹⁰ | 1.11 × 10⁵ | [21] | 1.65 × 10¹⁵ | 6.62 × 10¹⁵ | |
| Construction | NP | ¥ | 1.64 × 10⁴ | 1.64 × 10⁴ | 7.27 × 10¹¹ | [40] | 1.20 × 10¹⁶ | 1.20 × 10¹⁶ | |
| Equipment | NP | ¥ | 5.20 × 10⁴ | 5.20 × 10⁴ | 7.27 × 10¹¹ | [40] | 3.78 × 10¹⁶ | 3.78 × 10¹⁶ | |
| Service | NP | ¥ | 2.46 × 10⁴ | 2.46 × 10⁴ | 7.27 × 10¹¹ | [40] | 1.79 × 10¹⁶ | 1.79 × 10¹⁶ | |
| Pretreatment | Labor 2 | RP | J | 3.45 × 10⁹ | 1.38 × 10¹⁰ | 2.56 × 10⁶ | [41] | 8.83 × 10¹⁵ | 3.53 × 10¹⁶ |
| Groundwater | N | J | 2.89 × 10¹⁰ | 1.16 × 10¹¹ | 2.55 × 10⁵ | [21] | 7.37 × 10¹⁵ | 2.95 × 10¹⁶ | |
| Electricity (11.7%) | RP | J | 8.97 × 10⁸ | 3.59 × 10⁹ | 2.69 × 10⁵ | [21] | 2.41 × 10¹⁴ | 9.66 × 10¹⁴ | |
| Electricity (88.3%) | NP | J | 6.77 × 10⁹ | 2.71 × 10¹⁰ | 2.69 × 10⁵ | [21] | 1.82 × 10¹⁵ | 7.29 × 10¹⁵ | |
| Construction | NP | ¥ | 9.12 × 10³ | 9.12 × 10³ | 7.27 × 10¹¹ | [40] | 6.63 × 10¹⁵ | 6.63 × 10¹⁵ | |
| Equipment | NP | ¥ | 7.12 × 10⁴ | 7.12 × 10⁴ | 7.27 × 10¹¹ | [40] | 5.18 × 10¹⁶ | 5.18 × 10¹⁶ | |
| service | NP | ¥ | 3.37 × 10⁴ | 3.37 × 10⁴ | 7.27 × 10¹¹ | [40] | 2.45 × 10¹⁶ | 2.45 × 10¹⁶ | |
| Anaerobic fermentation | Labor 2 | RP | J | 3.45 × 10⁹ | 1.38 × 10¹⁰ | 2.56 × 10⁶ | [41] | 8.83 × 10¹⁵ | 3.53 × 10¹⁶ |
| coal | NP | J | 1.67 × 10¹¹ | 6.68 × 10¹¹ | 6.72 × 10⁴ | [21] | 1.12 × 10¹⁶ | 4.49 × 10¹⁶ | |
| Electricity (11.7%) | RP | J | 8.97 × 10⁸ | 3.59 × 10⁹ | 2.69 × 10⁵ | [21] | 2.41 × 10¹⁴ | 9.66 × 10¹⁴ | |
| Electricity (88.3%) | NP | J | 6.77 × 10⁹ | 2.71 × 10¹⁰ | 2.69 × 10⁵ | [21] | 1.82 × 10¹⁵ | 7.29 × 10¹⁵ | |
| Construction | NP | ¥ | 9.12 × 10³ | 9.12 × 10³ | 7.27 × 10¹¹ | [40] | 6.63 × 10¹⁵ | 6.63 × 10¹⁵ | |
| Equipment investment | NP | ¥ | 8.35 × 10⁴ | 8.35 × 10⁴ | 7.27 × 10¹¹ | [40] | 6.07 × 10¹⁶ | 6.07 × 10¹⁶ | |
| service | NP | ¥ | 3.95 × 10⁴ | 3.95 × 10⁴ | 7.27 × 10¹¹ | [40] | 2.87 × 10¹⁶ | 2.87 × 10¹⁶ | |
| Purification storage | Labor 2 | RP | J | 3.45 × 10⁹ | 1.38 × 10¹⁰ | 2.56 × 10⁶ | [41] | 8.83 × 10¹⁵ | 3.53 × 10¹⁶ |
| Electricity (11.7%) | RP | J | 8.97 × 10⁸ | 3.59 × 10⁹ | 2.69 × 10⁵ | [21] | 2.41 × 10¹⁴ | 9.66 × 10¹⁴ | |
| Electricity (88.3%) | NP | J | 6.77 × 10⁹ | 2.71 × 10¹⁰ | 2.69 × 10⁵ | [21] | 1.82 × 10¹⁵ | 7.29 × 10¹⁵ | |
| Desulfurizer | NP | kg | 2.50 × 10² | 1.00 × 10³ | 3.08 × 10¹² | [42] | 7.70 × 10¹⁴ | 3.08 × 10¹⁵ | |
| Construction | NP | ¥ | 9.12 × 10³ | 9.12 × 10³ | 7.27 × 10¹¹ | [40] | 6.63 × 10¹⁵ | 6.63 × 10¹⁵ | |
| Equipment | NP | ¥ | 6.10 × 10⁴ | 6.10 × 10⁴ | 7.27 × 10¹¹ | [40] | 4.43 × 10¹⁶ | 4.43 × 10¹⁶ | |
| Service | NP | ¥ | 2.89 × 10⁴ | 2.89 × 10⁴ | 7.27 × 10¹¹ | [40] | 2.10 × 10¹⁶ | 2.10 × 10¹⁶ | |
| Product utilization | Labor 2 | RP | J | 3.45 × 10⁹ | 1.38 × 10¹⁰ | 2.56 × 10⁶ | [41] | 8.83 × 10¹⁵ | 3.53 × 10¹⁶ |
| Electricity (11.7%) | RP | J | 8.97 × 10⁸ | 3.59 × 10⁹ | 2.69 × 10⁵ | [21] | 2.41 × 10¹⁴ | 9.66 × 10¹⁴ | |
| Electricity (88.3%) | NP | J | 6.77 × 10⁹ | 2.71 × 10¹⁰ | 2.69 × 10⁵ | [21] | 1.82 × 10¹⁵ | 7.29 × 10¹⁵ | |
| Construction | NP | ¥ | 2.12 × 10⁴ | 2.12 × 10⁴ | 7.27 × 10¹¹ | [40] | 1.54 × 10¹⁶ | 1.54 × 10¹⁶ | |
| Equipment | NP | ¥ | 5.13 × 10⁴ | 5.13 × 10⁴ | 7.27 × 10¹¹ | [40] | 3.73 × 10¹⁶ | 3.73 × 10¹⁶ | |
| Service | NP | ¥ | 2.43 × 10⁴ | 2.43 × 10⁴ | 7.27 × 10¹¹ | [40] | 1.77 × 10¹⁶ | 1.77 × 10¹⁶ | |
| Total input | 2.30 × 10¹⁴ | 9.20 × 10¹⁴ | 6.15 × 10¹⁷ | 1.29 × 10¹⁸ | |||||
Note: See Appendix A (Appendix A.2, Appendix A.3, Appendix A.4, Appendix A.5, Appendix A.6).
Table 3.
Emergy input of SBF project.
| Stage | Item | Category | Unit | Raw Data | Emergy Transformity | Solar Energy Value | |||
|---|---|---|---|---|---|---|---|---|---|
| Current | Full | Value | Reference | Current | Full | ||||
| Raw material collection and storage | Labor 2 | RP | J | 2.08 × 10¹⁰ | 1.04 × 10¹¹ | 2.56 × 10⁶ | [41] | 5.32 × 10¹⁶ | 2.66 × 10¹⁷ |
| Diesel | NP | J | 6.76 × 10¹⁰ | 3.38 × 10¹¹ | 1.11 × 10⁵ | [21] | 7.50 × 10¹⁵ | 3.75 × 10¹⁶ | |
| Construction | RP | J | 4.56 × 10⁴ | 4.56 × 10⁴ | 7.27 × 10¹¹ | [40] | 3.31 × 10¹⁶ | 3.31 × 10¹⁶ | |
| Equipment | NP | J | 9.77 × 10⁴ | 9.77 × 10⁴ | 7.27 × 10¹¹ | [40] | 7.10 × 10¹⁶ | 7.10 × 10¹⁶ | |
| Service | NP | ¥ | 3.84 × 10⁴ | 3.84 × 10⁴ | 7.27 × 10¹¹ | [40] | 2.79 × 10¹⁶ | 2.79 × 10¹⁶ | |
| Pretreatment | Labor 2 | NP | ¥ | 1.72 × 10¹⁰ | 8.60 × 10¹⁰ | 2.56 × 10⁶ | [41] | 4.40 × 10¹⁶ | 2.20 × 10¹⁷ |
| Electricity (11.7%) | NP | ¥ | 7.02 × 10¹⁰ | 3.51 × 10¹¹ | 2.69 × 10⁵ | [21] | 1.89 × 10¹⁶ | 9.44 × 10¹⁶ | |
| Electricity (88.3%) | RP | J | 5.30 × 10¹¹ | 2.65 × 10¹² | 2.69 × 10⁵ | [21] | 1.43 × 10¹⁷ | 7.13 × 10¹⁷ | |
| Construction | RP | J | 3.82 × 10⁴ | 3.82 × 10⁴ | 7.27 × 10¹¹ | [40] | 2.78 × 10¹⁶ | 2.78 × 10¹⁶ | |
| Equipment | NP | J | 6.13 × 10⁴ | 6.13 × 10⁴ | 7.27 × 10¹¹ | [40] | 4.46 × 10¹⁶ | 4.46 × 10¹⁶ | |
| Service | NP | ¥ | 2.53 × 10⁴ | 2.53 × 10⁴ | 7.27 × 10¹¹ | [40] | 1.84 × 10¹⁶ | 1.84 × 10¹⁶ | |
| Particle forming | Labor 2 | NP | ¥ | 1.72 × 10¹⁰ | 8.60 × 10¹⁰ | 2.56 × 10⁶ | [41] | 4.40 × 10¹⁶ | 2.20 × 10¹⁷ |
| Electricity (11.7%) | NP | ¥ | 9.36 × 10¹⁰ | 4.68 × 10¹¹ | 2.69 × 10⁵ | [21] | 2.52 × 10¹⁶ | 1.26 × 10¹⁷ | |
| Electricity (88.3%) | RP | J | 7.06 × 10¹¹ | 3.53 × 10¹² | 2.69 × 10⁵ | [21] | 1.90 × 10¹⁷ | 9.50 × 10¹⁷ | |
| Consumables | RP | J | 2.00 × 10⁵ | 1.00 × 10⁶ | 7.27 × 10¹¹ | [40] | 1.45 × 10¹⁷ | 7.27 × 10¹⁷ | |
| Construction | NP | J | 3.82 × 10⁴ | 3.82 × 10⁴ | 7.27 × 10¹¹ | [40] | 2.78 × 10¹⁶ | 2.78 × 10¹⁶ | |
| Equipment | NP | ¥ | 6.13 × 10⁴ | 6.13 × 10⁴ | 7.27 × 10¹¹ | [40] | 4.46 × 10¹⁶ | 4.46 × 10¹⁶ | |
| Service | NP | ¥ | 2.53 × 10⁴ | 2.53 × 10⁴ | 7.27 × 10¹¹ | [40] | 1.84 × 10¹⁶ | 1.84 × 10¹⁶ | |
| Screening packaging | Labor 2 | NP | ¥ | 1.72 × 10¹⁰ | 8.60 × 10¹⁰ | 2.56 × 10⁶ | [41] | 4.40 × 10¹⁶ | 2.20 × 10¹⁷ |
| Electricity (11.7%) | NP | ¥ | 7.02 × 10¹⁰ | 3.51 × 10¹¹ | 2.69 × 10⁵ | [21] | 1.89 × 10¹⁶ | 9.44 × 10¹⁶ | |
| Electricity (88.3%) | RP | J | 5.30 × 10¹¹ | 2.65 × 10¹² | 2.69 × 10⁵ | [21] | 1.43 × 10¹⁷ | 7.13 × 10¹⁷ | |
| Packaging bag | RP | J | 3.00 × 10⁶ | 1.50 × 10⁷ | 1.11 × 10⁵ | [21] | 3.33 × 10¹¹ | 1.67 × 10¹² | |
| Construction | NP | J | 3.82 × 10⁴ | 3.82 × 10⁴ | 7.27 × 10¹¹ | [40] | 2.78 × 10¹⁶ | 2.78 × 10¹⁶ | |
| Equipment | NP | g | 6.13 × 10⁴ | 6.13 × 10⁴ | 7.27 × 10¹¹ | [40] | 4.46 × 10¹⁶ | 4.46 × 10¹⁶ | |
| Service | NP | ¥ | 2.53 × 10⁴ | 2.53 × 10⁴ | 7.27 × 10¹¹ | [40] | 1.84 × 10¹⁶ | 1.84 × 10¹⁶ | |
| Product utilization | Labor 2 | NP | ¥ | 1.72 × 10¹⁰ | 8.60 × 10¹⁰ | 2.56 × 10⁶ | [41] | 4.40 × 10¹⁶ | 2.20 × 10¹⁷ |
| Diesel | NP | ¥ | 6.15 × 10¹⁰ | 3.08 × 10¹¹ | 1.11 × 10⁵ | [21] | 6.83 × 10¹⁵ | 3.41 × 10¹⁶ | |
| Construction | RP | J | 1.47 × 10⁴ | 1.47 × 10⁴ | 7.27 × 10¹¹ | [40] | 1.07 × 10¹⁶ | 1.07 × 10¹⁶ | |
| Equipment | NP | J | 3.84 × 10⁴ | 3.84 × 10⁴ | 7.27 × 10¹¹ | [40] | 2.79 × 10¹⁶ | 2.79 × 10¹⁶ | |
| Service | NP | ¥ | 1.58 × 10⁴ | 1.58 × 10⁴ | 7.27 × 10¹¹ | [40] | 1.15 × 10¹⁶ | 1.15 × 10¹⁶ | |
| Total input | / | / | 1.18 × 10¹⁵ | 5.90 × 10¹⁵ | / | / | 2.13 × 10¹⁸ | 8.82 × 10¹⁸ | |
Notes: See Appendix B.
Table 4.
Emergy indicators of CBP and SBF under different loads and coal power (CP).
| Items | CBP | SBF | CP | ||
|---|---|---|---|---|---|
| Current | Full | Current | Full | ||
| R | 1.75 × 10¹⁶ | 6.98 × 10¹⁶ | 8.95 × 10¹⁶ | 4.48 × 10¹⁷ | 3.42 × 10²⁰ |
| N | 1.42 × 10¹⁶ | 5.68 × 10¹⁶ | 3.50 × 10¹⁶ | 1.75 × 10¹⁷ | 5.44 × 10¹⁸ |
| RP | 1.44 × 10¹⁷ | 5.77 × 10¹⁷ | 7.66 × 10¹⁷ | 3.83 × 10¹⁸ | 2.58 × 10¹⁹ |
| NP | 4.39 × 10¹⁷ | 5.88 × 10¹⁷ | 1.24 × 10¹⁸ | 4.37 × 10¹⁸ | 3.81 × 10²¹ |
| R + RP | 1.62 × 10¹⁷ | 6.47 × 10¹⁷ | 8.55 × 10¹⁷ | 4.28 × 10¹⁸ | 3.42 × 10²⁰ |
| N + NP | 4.53 × 10¹⁷ | 6.44 × 10¹⁷ | 1.27 × 10¹⁸ | 4.54 × 10¹⁸ | 3.82 × 10²¹ |
| RP + NP | 5.83 × 10¹⁷ | 1.16 × 10¹⁸ | 2.00 × 10¹⁸ | 8.19 × 10¹⁸ | 3.84 × 10²¹ |
| Y | 6.15 × 10¹⁷ | 1.29 × 10¹⁸ | 2.13 × 10¹⁸ | 8.82 × 10¹⁸ | 4.18 × 10²¹ |
| EYR | 1.05 | 1.11 | 1.06 | 1.08 | 1.09 |
| EIR | 18.42 | 9.20 | 16.09 | 13.17 | 11.04 |
| ESI | 0.38 | 1.11 | 0.71 | 1.01 | 0.10 |
| RI | 0.26 | 0.50 | 0.40 | 0.49 | 0.09 |
| ELR | 2.80 | 1.00 | 1.49 | 1.06 | 10.37 |
Notes: CP is calculated from the data of [43].
Table 5.
Economic value comparison.
| Item | Emergy–Money Value | Market Value | ||||||
|---|---|---|---|---|---|---|---|---|
| CBP | SBF | CBP | SBF | |||||
| Current | Full | Current | Full | Current | Full | Current | Full | |
| Total input | 8.45 × 10⁵ | 1.78 × 10⁶ | 2.93 × 10⁶ | 1.21 × 10⁷ | 8.02 × 10⁵ | 1.60 × 10⁶ | 2.75 × 10⁶ | 5.27 × 10⁶ |
| Total output | 5.26 × 10⁵ | 2.10 × 10⁶ | 4.35 × 10⁶ | 2.18 × 10⁷ | 3.65 × 10⁵ | 1.46 × 10⁶ | 2.40 × 10⁶ | 1.20 × 10⁷ |
| Net profit | −3.19 × 10⁵ | 3.28 × 10⁵ | 1.43 × 10⁶ | 9.63 × 10⁶ | −4.37 × 10⁵ | −1.42 × 10⁵ | −3.54 × 10⁵ | 6.73 × 10⁶ |
| Input–output ratio | 0.62 | 1.18 | 1.49 | 1.79 | 0.46 | 0.91 | 0.87 | 2.28 |
© 2020 by the authors. Licensee MDPI, Basel, Switzerland. This article is an open access article distributed under the terms and conditions of the Creative Commons Attribution (CC BY) license (http://creativecommons.org/licenses/by/4.0/).
Share and Cite
MDPI and ACS Style
Wang, Q.; Dogot, T.; Huang, X.; Fang, L.; Yin, C. Coupling of Rural Energy Structure and Straw Utilization: Based on Cases in Hebei, China. Sustainability 2020, 12, 983. https://0-doi-org.brum.beds.ac.uk/10.3390/su12030983
AMA Style
Wang Q, Dogot T, Huang X, Fang L, Yin C. Coupling of Rural Energy Structure and Straw Utilization: Based on Cases in Hebei, China. Sustainability. 2020; 12(3):983. https://0-doi-org.brum.beds.ac.uk/10.3390/su12030983
Chicago/Turabian StyleWang, Qiang, Thomas Dogot, Xianlei Huang, Linna Fang, and Changbin Yin. 2020. "Coupling of Rural Energy Structure and Straw Utilization: Based on Cases in Hebei, China" Sustainability 12, no. 3: 983. https://0-doi-org.brum.beds.ac.uk/10.3390/su12030983
Note that from the first issue of 2016, this journal uses article numbers instead of page numbers. See further details here.