A Comparative Study in Vanadium and Tungsten Leaching from Various Sources of SCR Catalysts with Local Difference

 , and
, and
Abstract
:1. Introduction
2. Materials and Methods
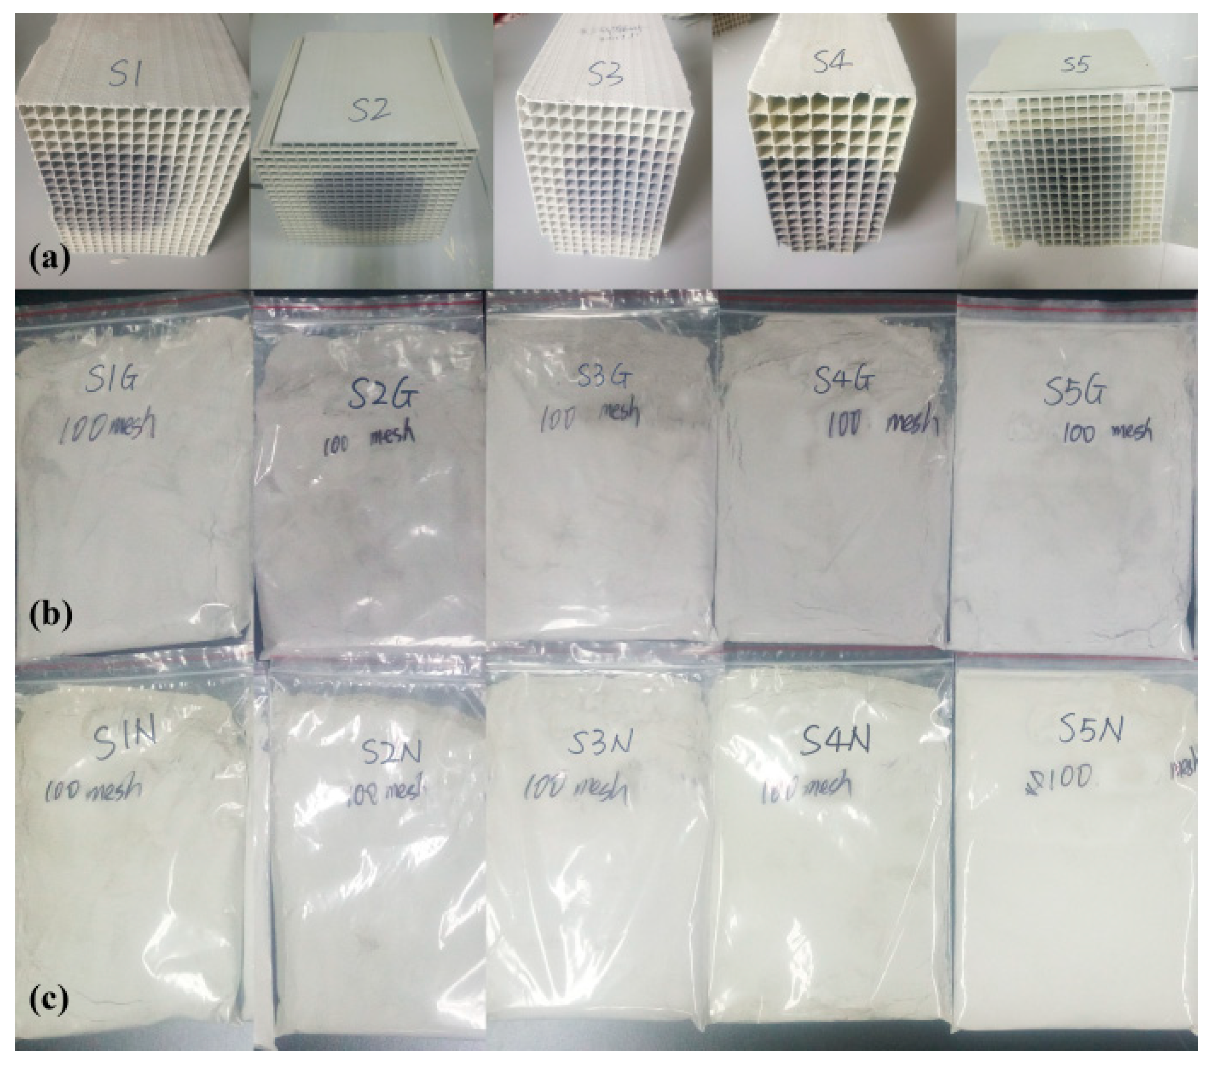
2.1. Sample Preparation
2.2. Leaching
2.3. Analysis
2.4. Characterization
3. Results
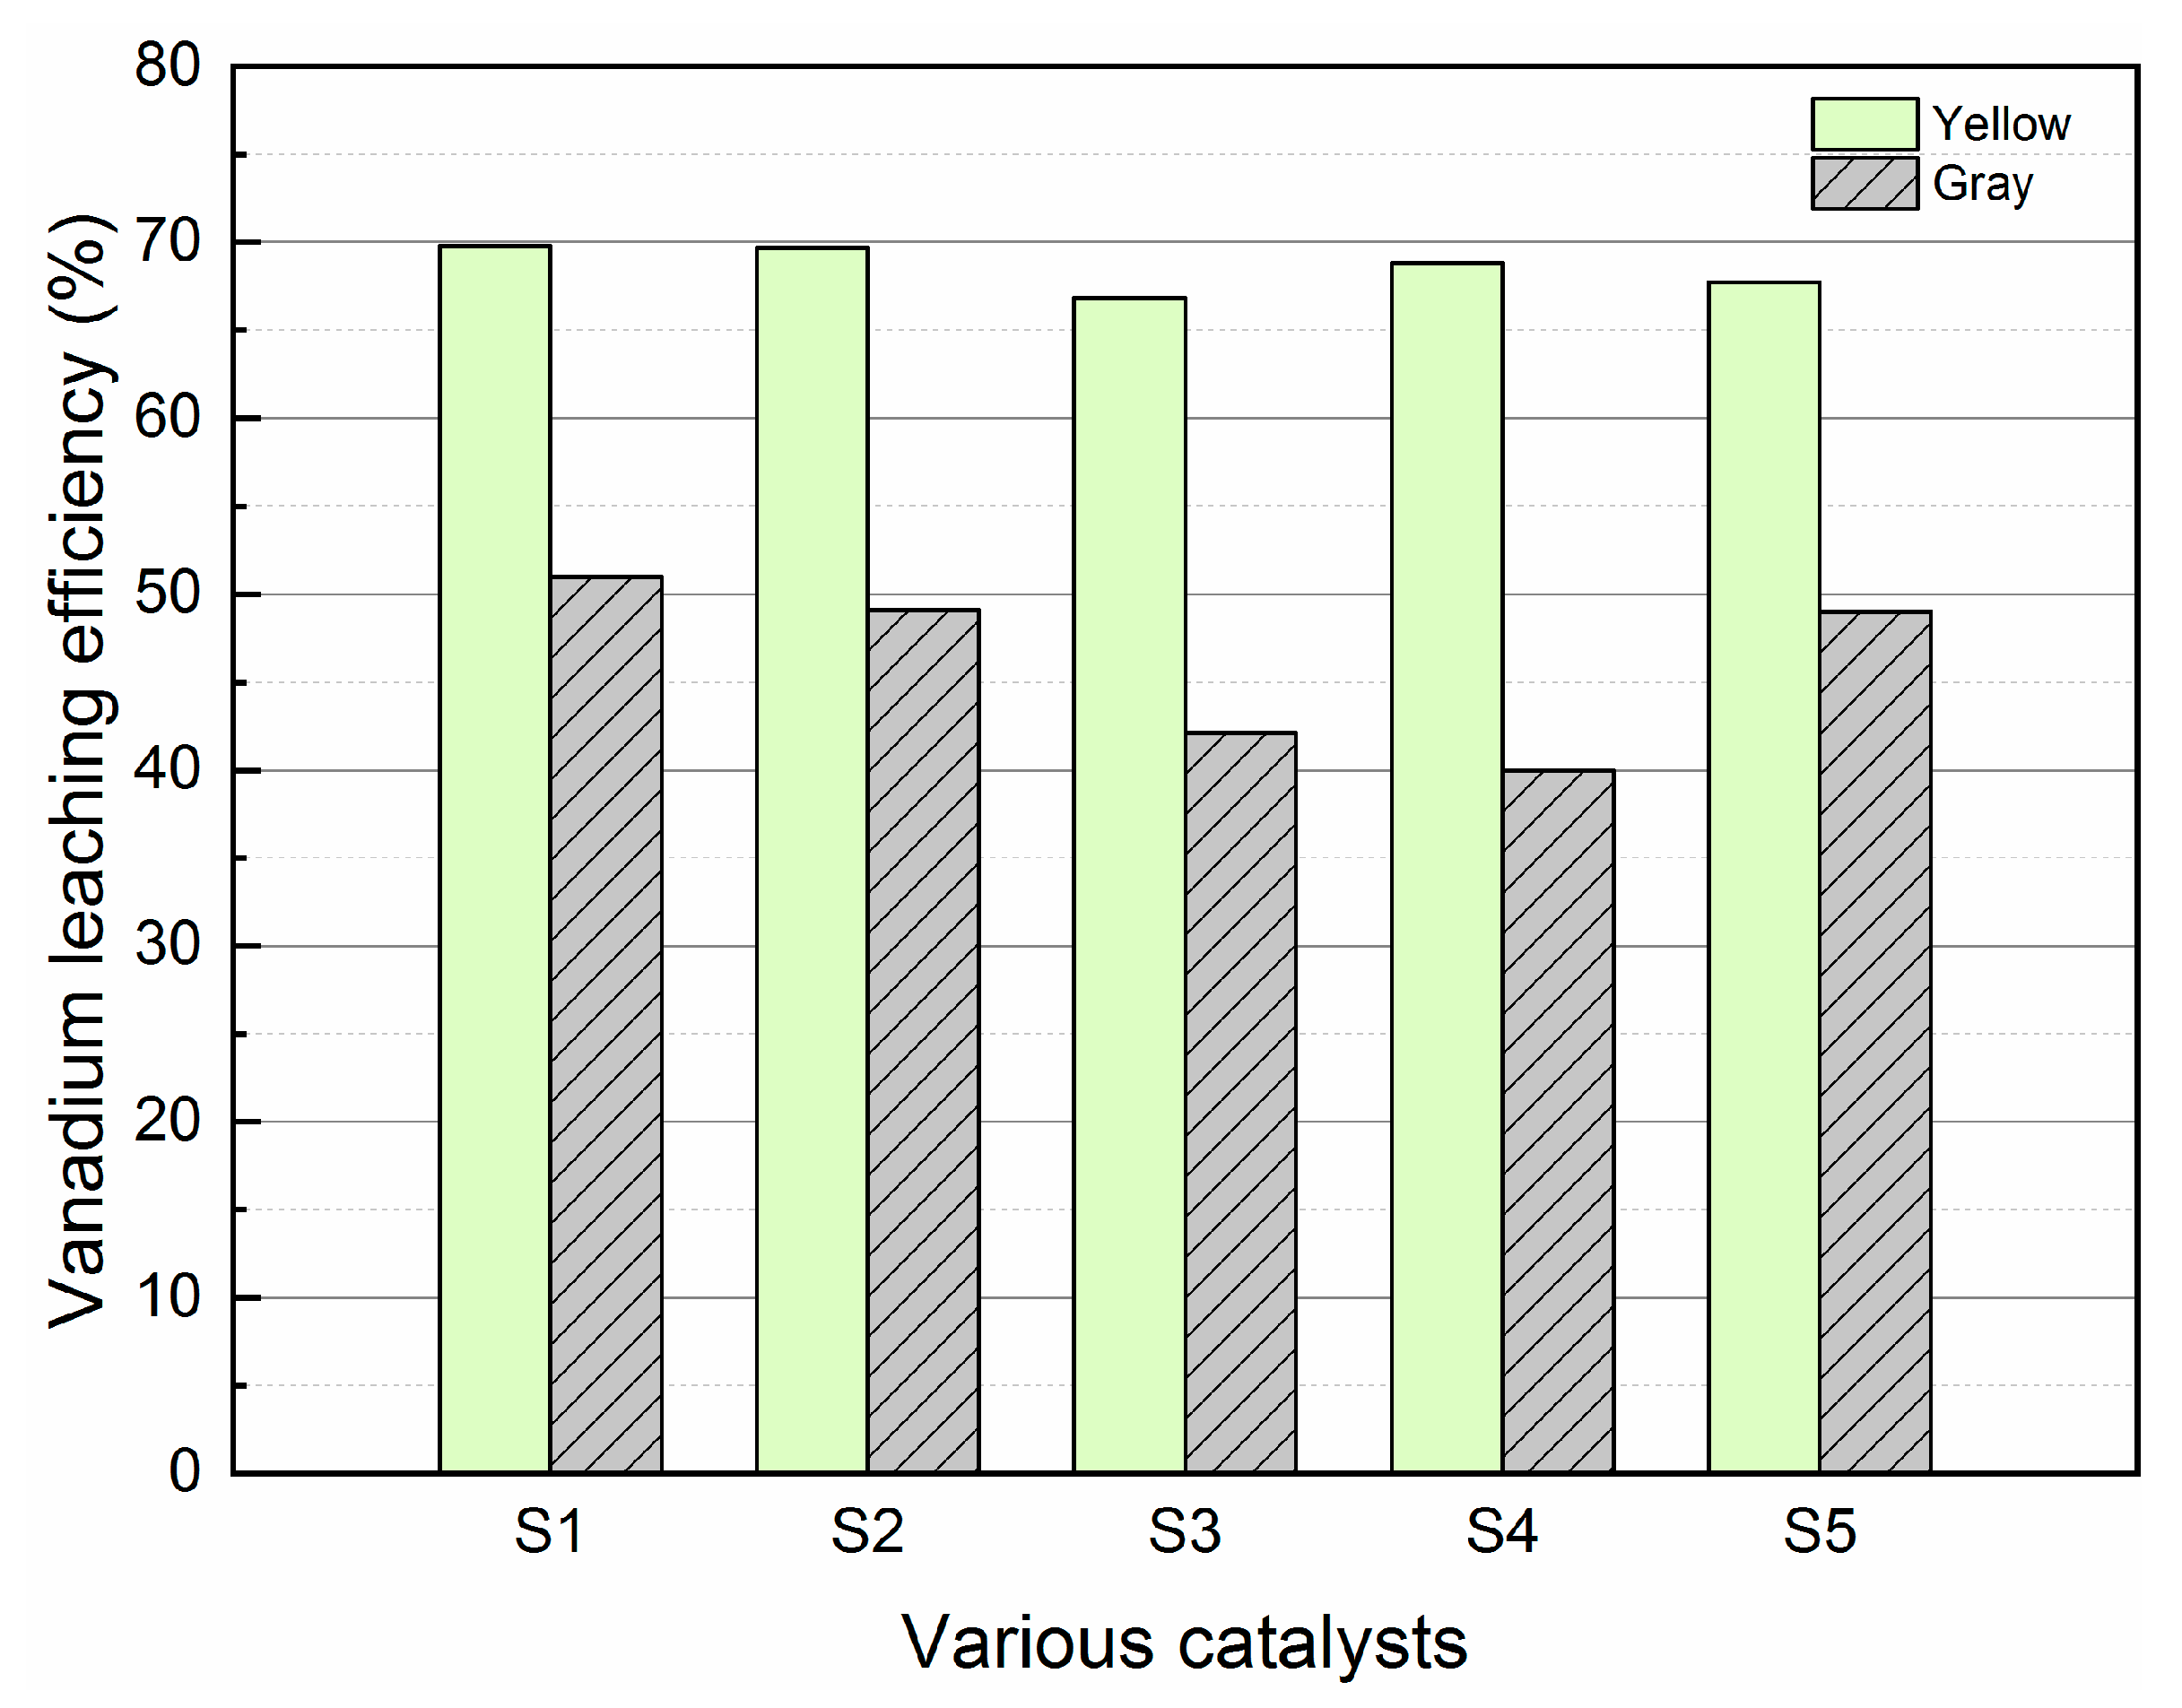
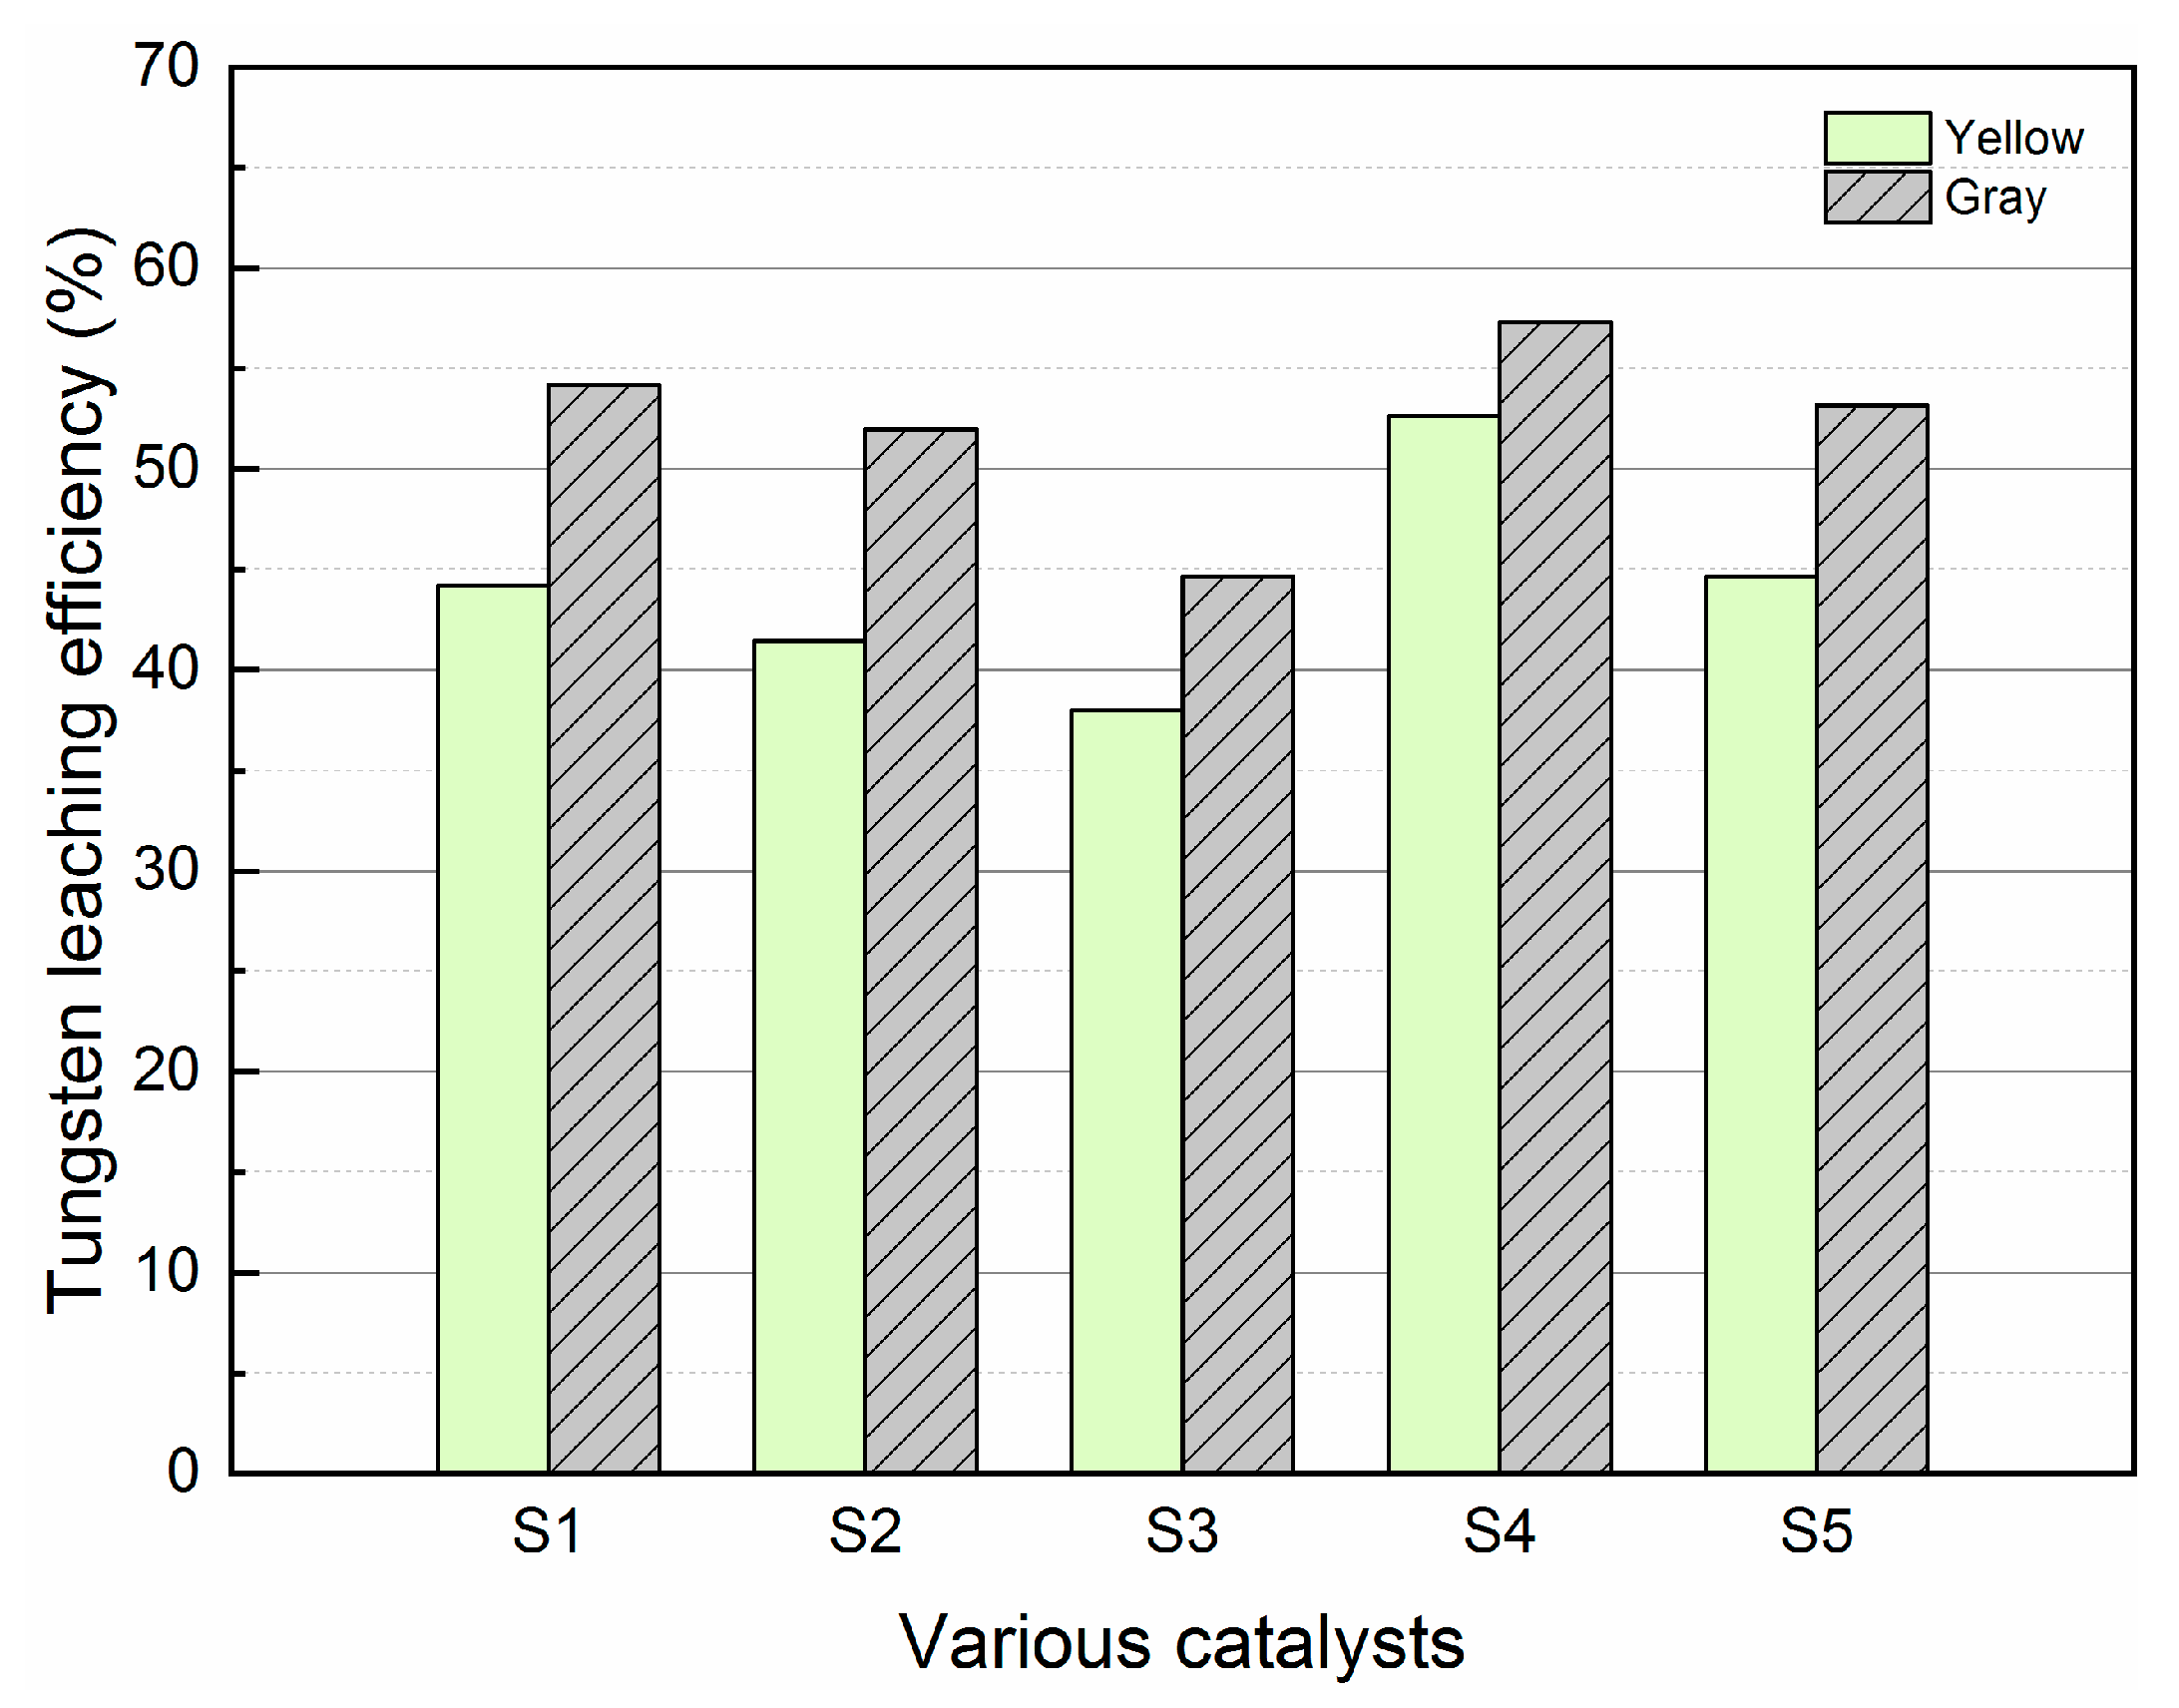
3.1. Vanadium and Tungsten Leaching Behavior
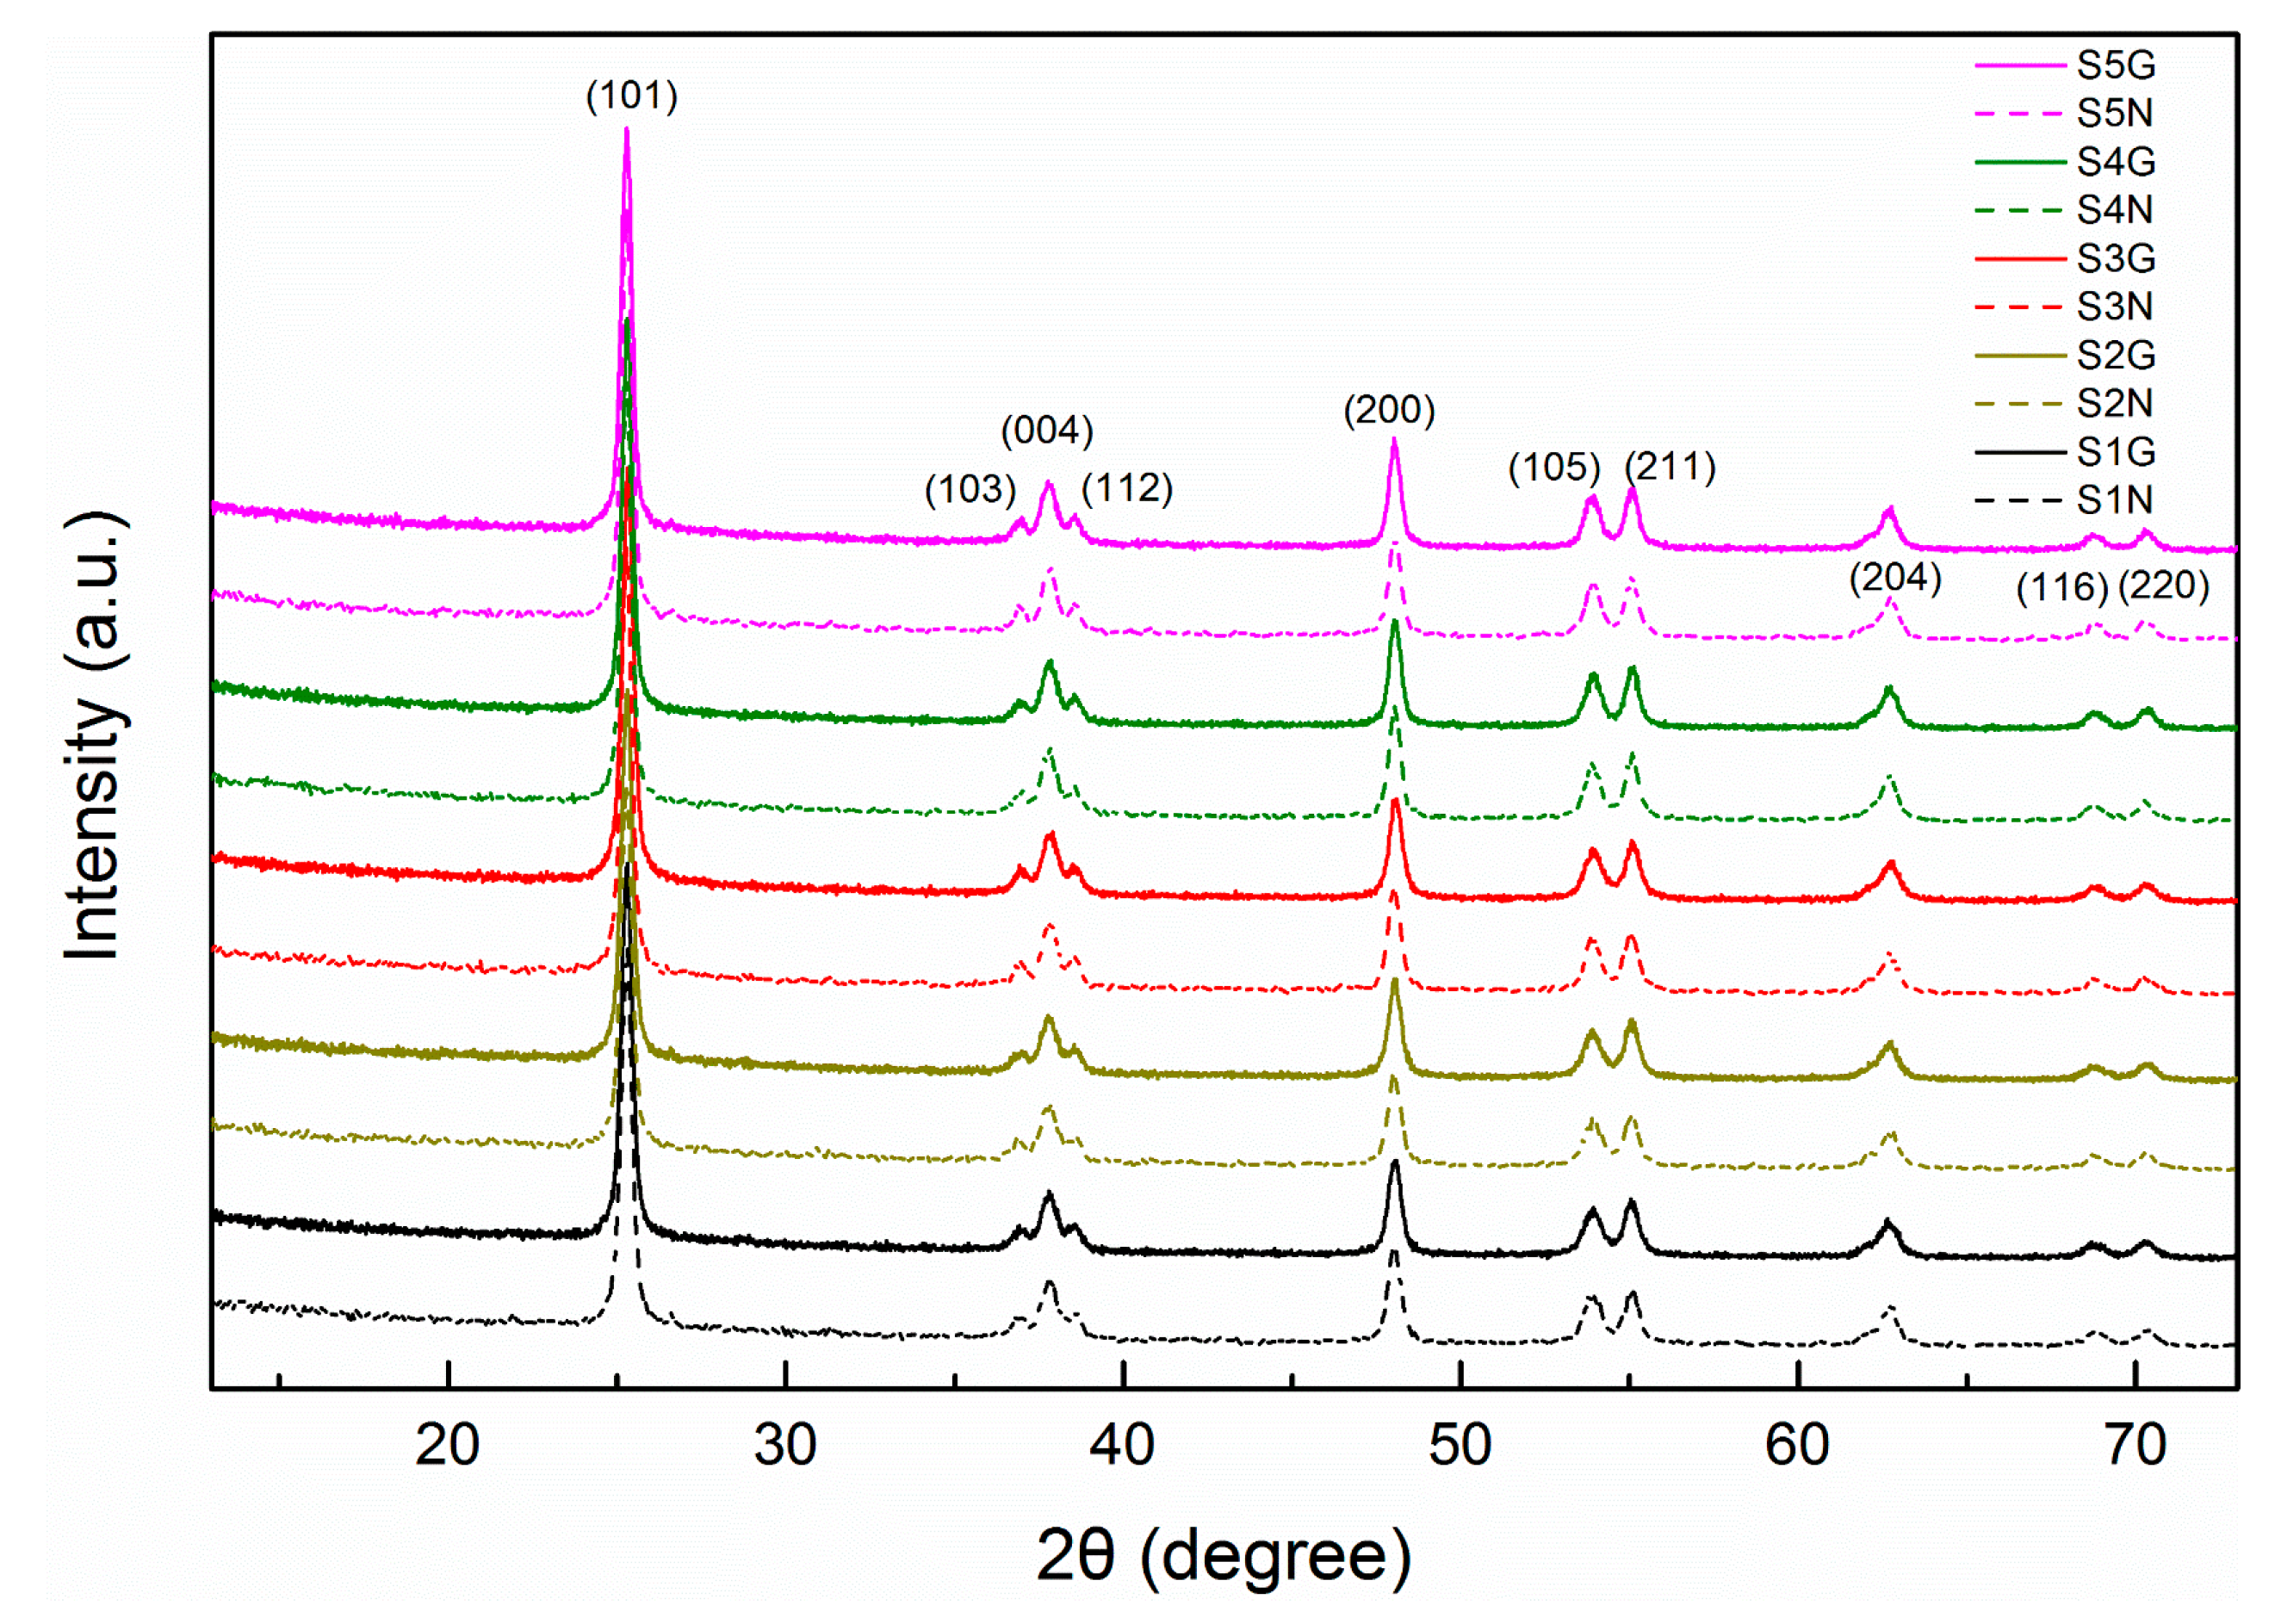
3.2. Chemical and Textural Characterizations
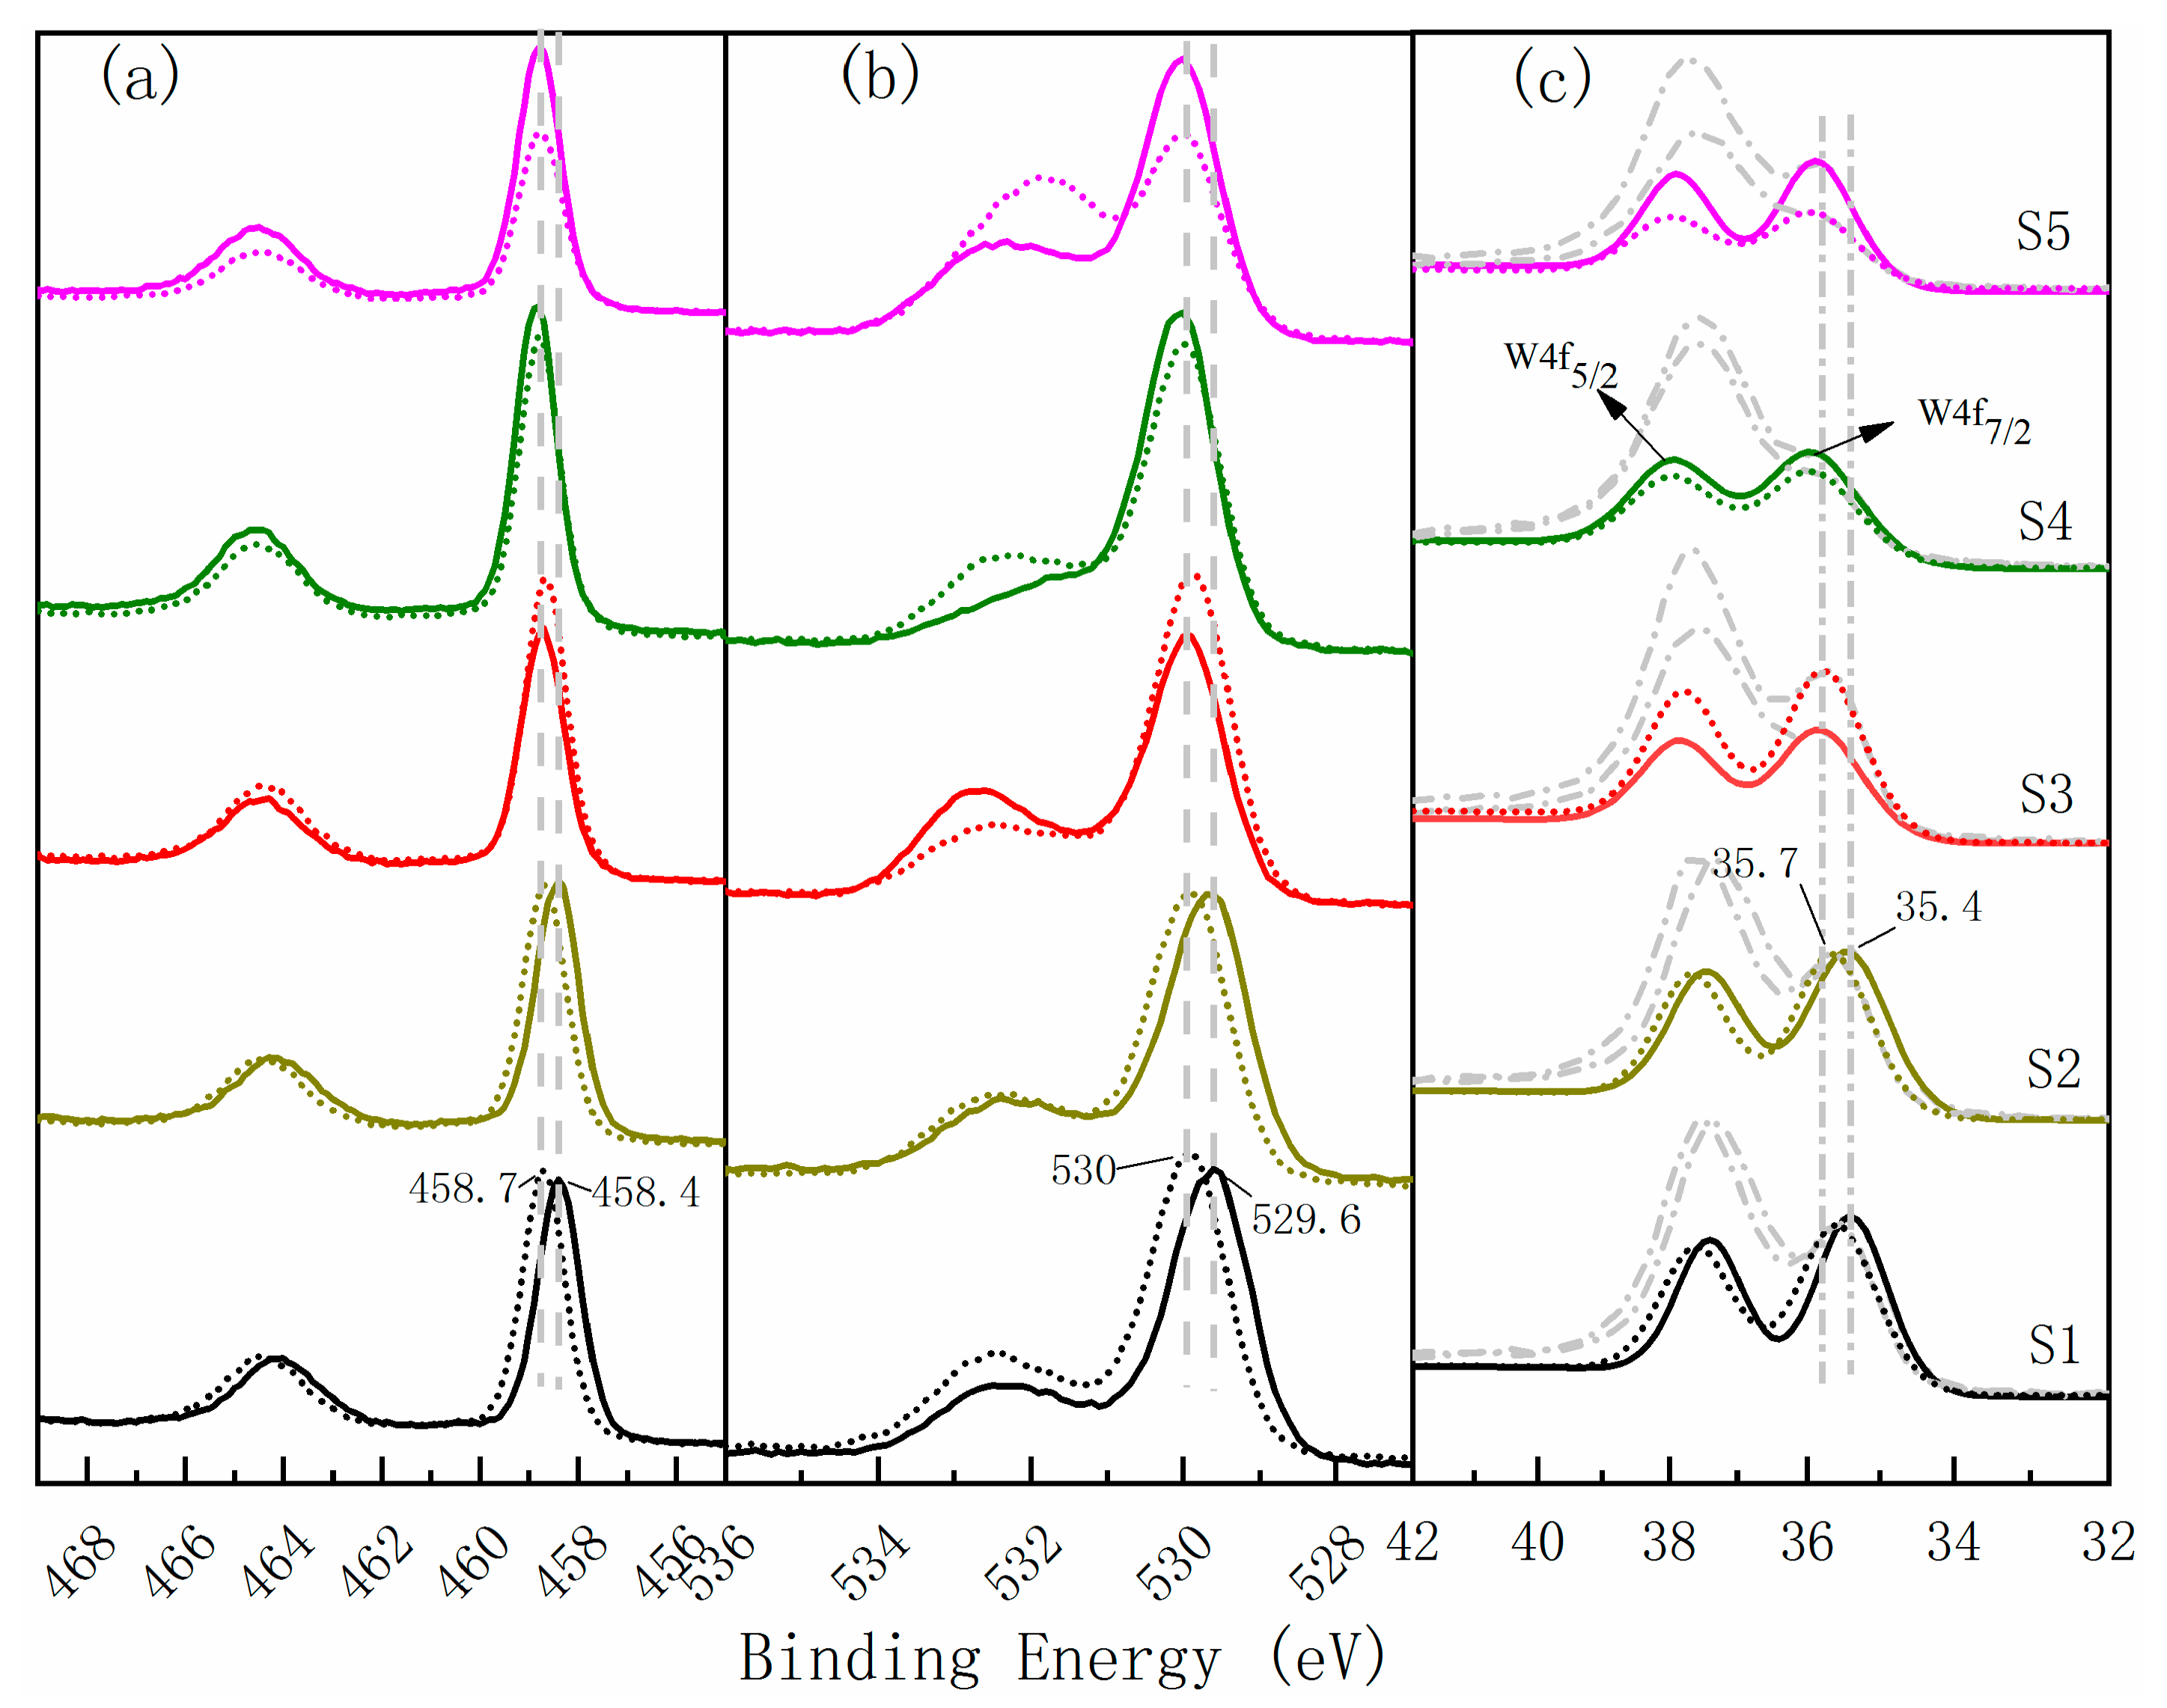
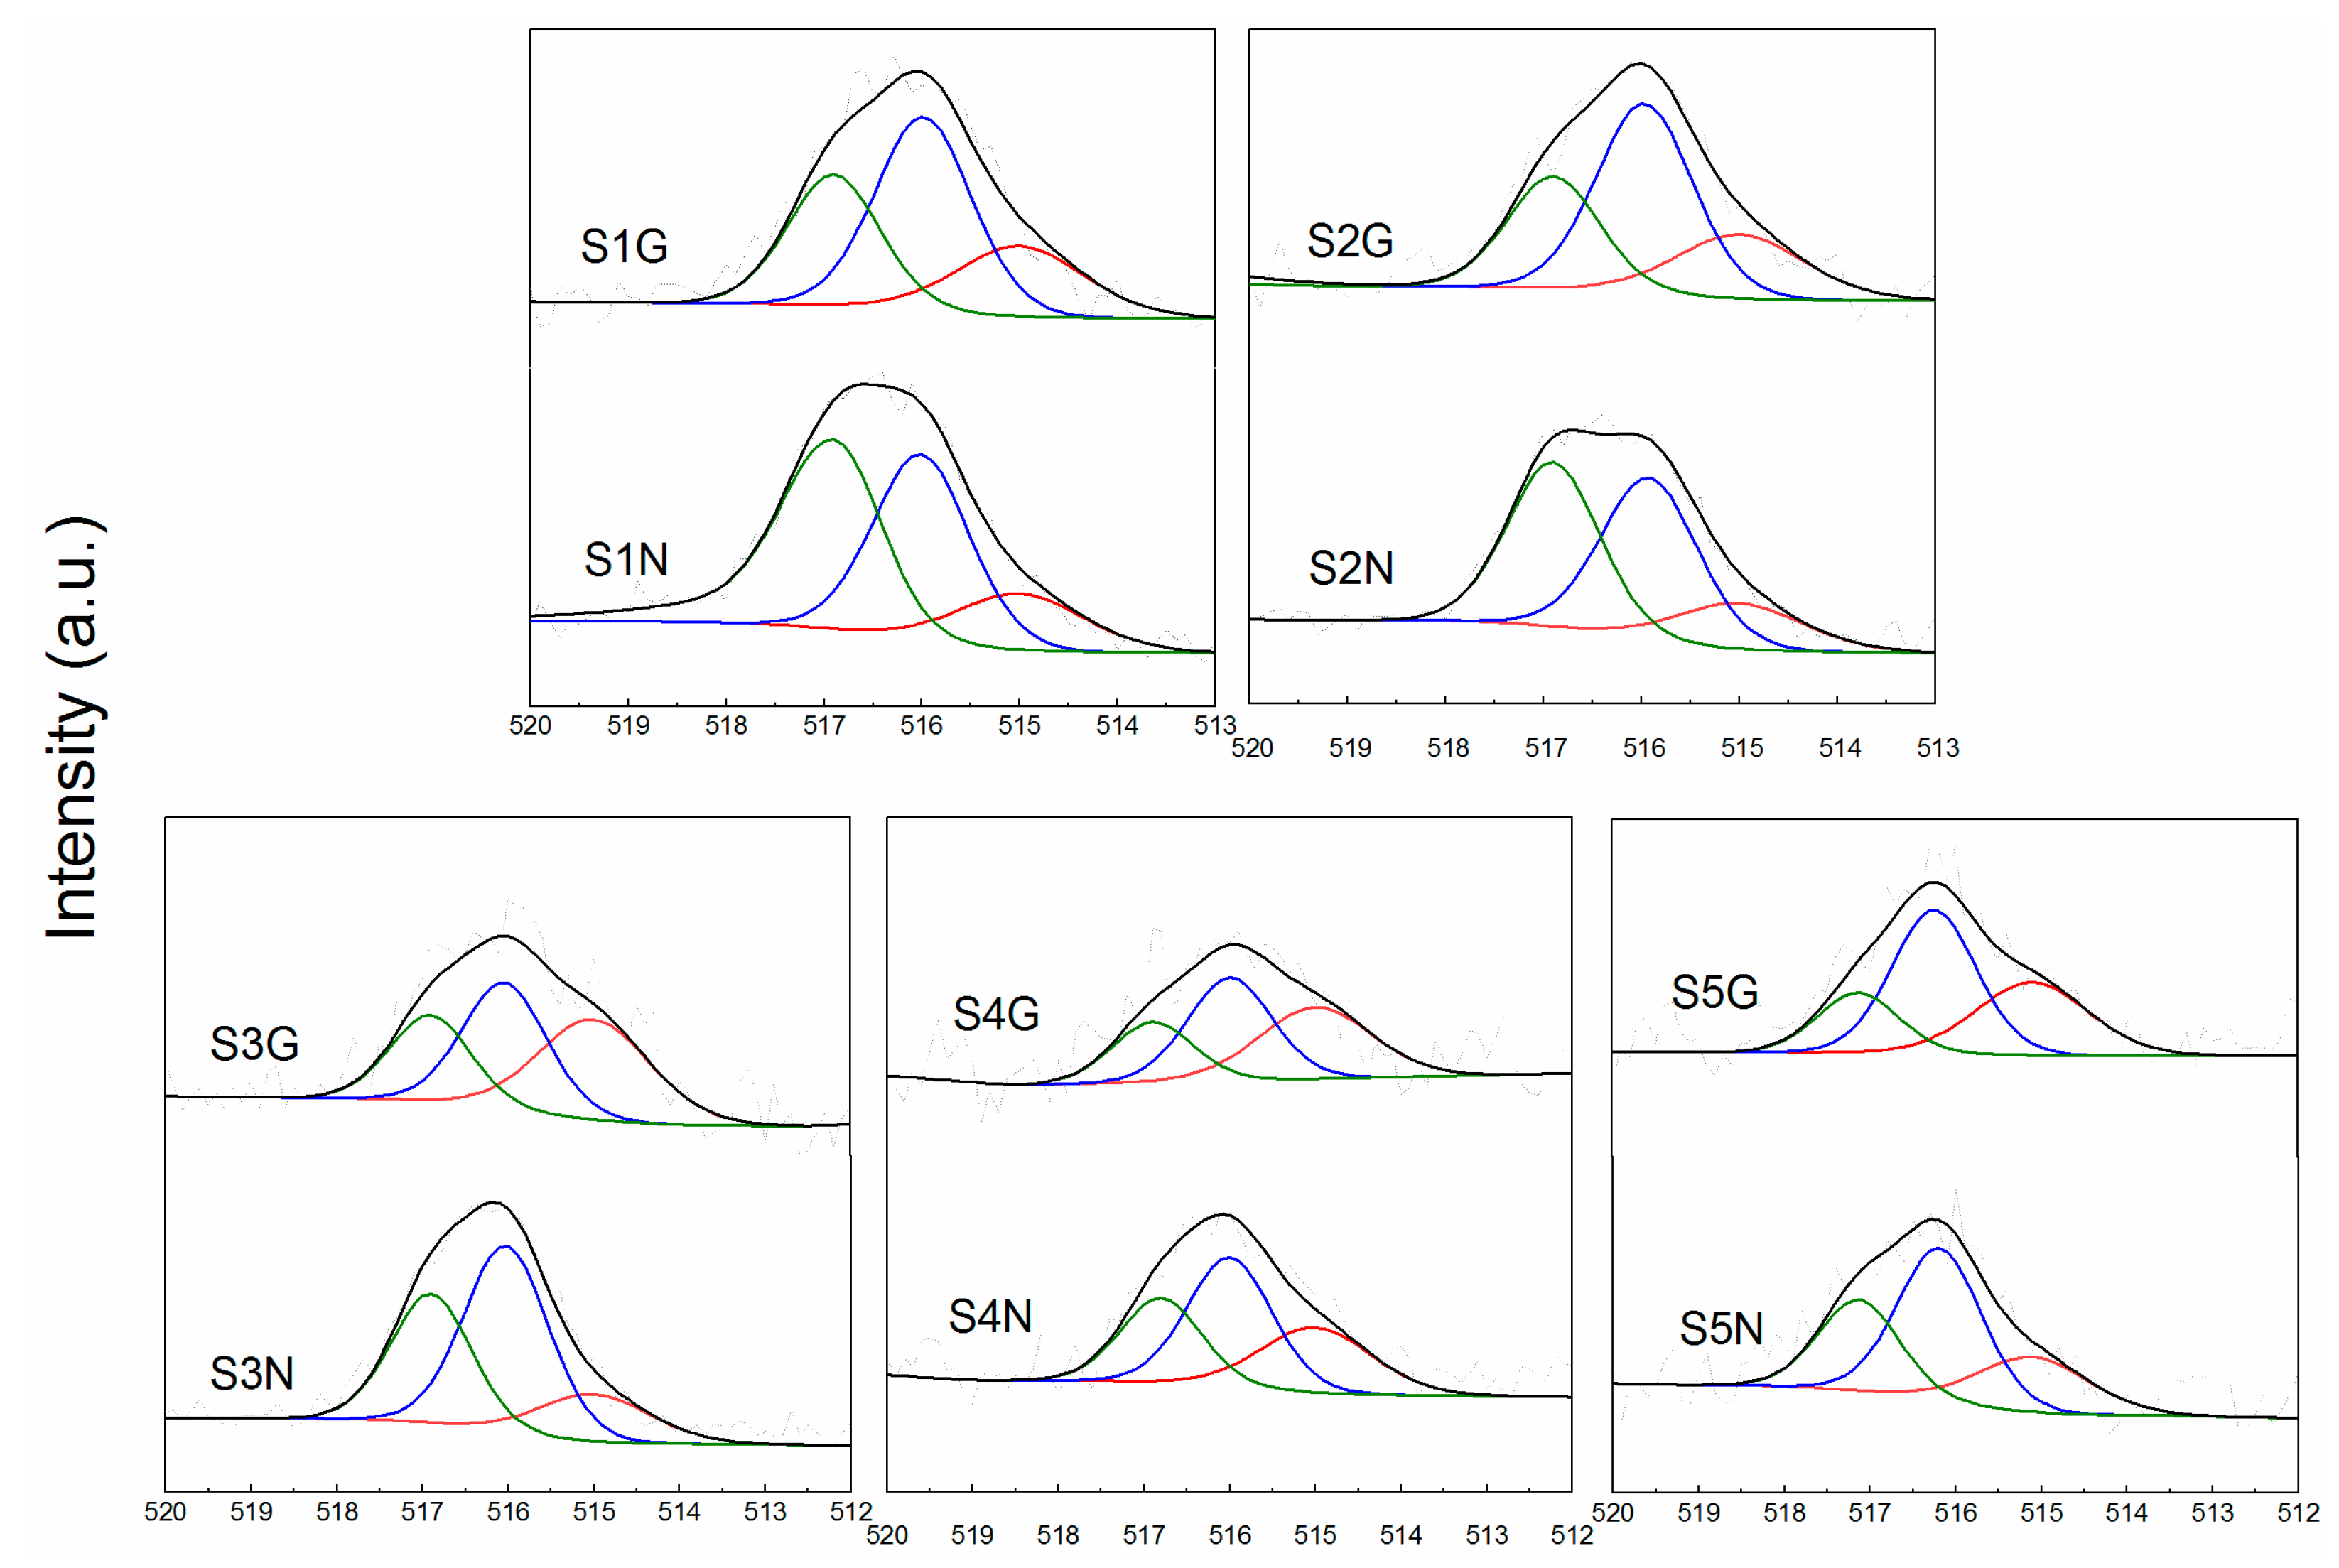
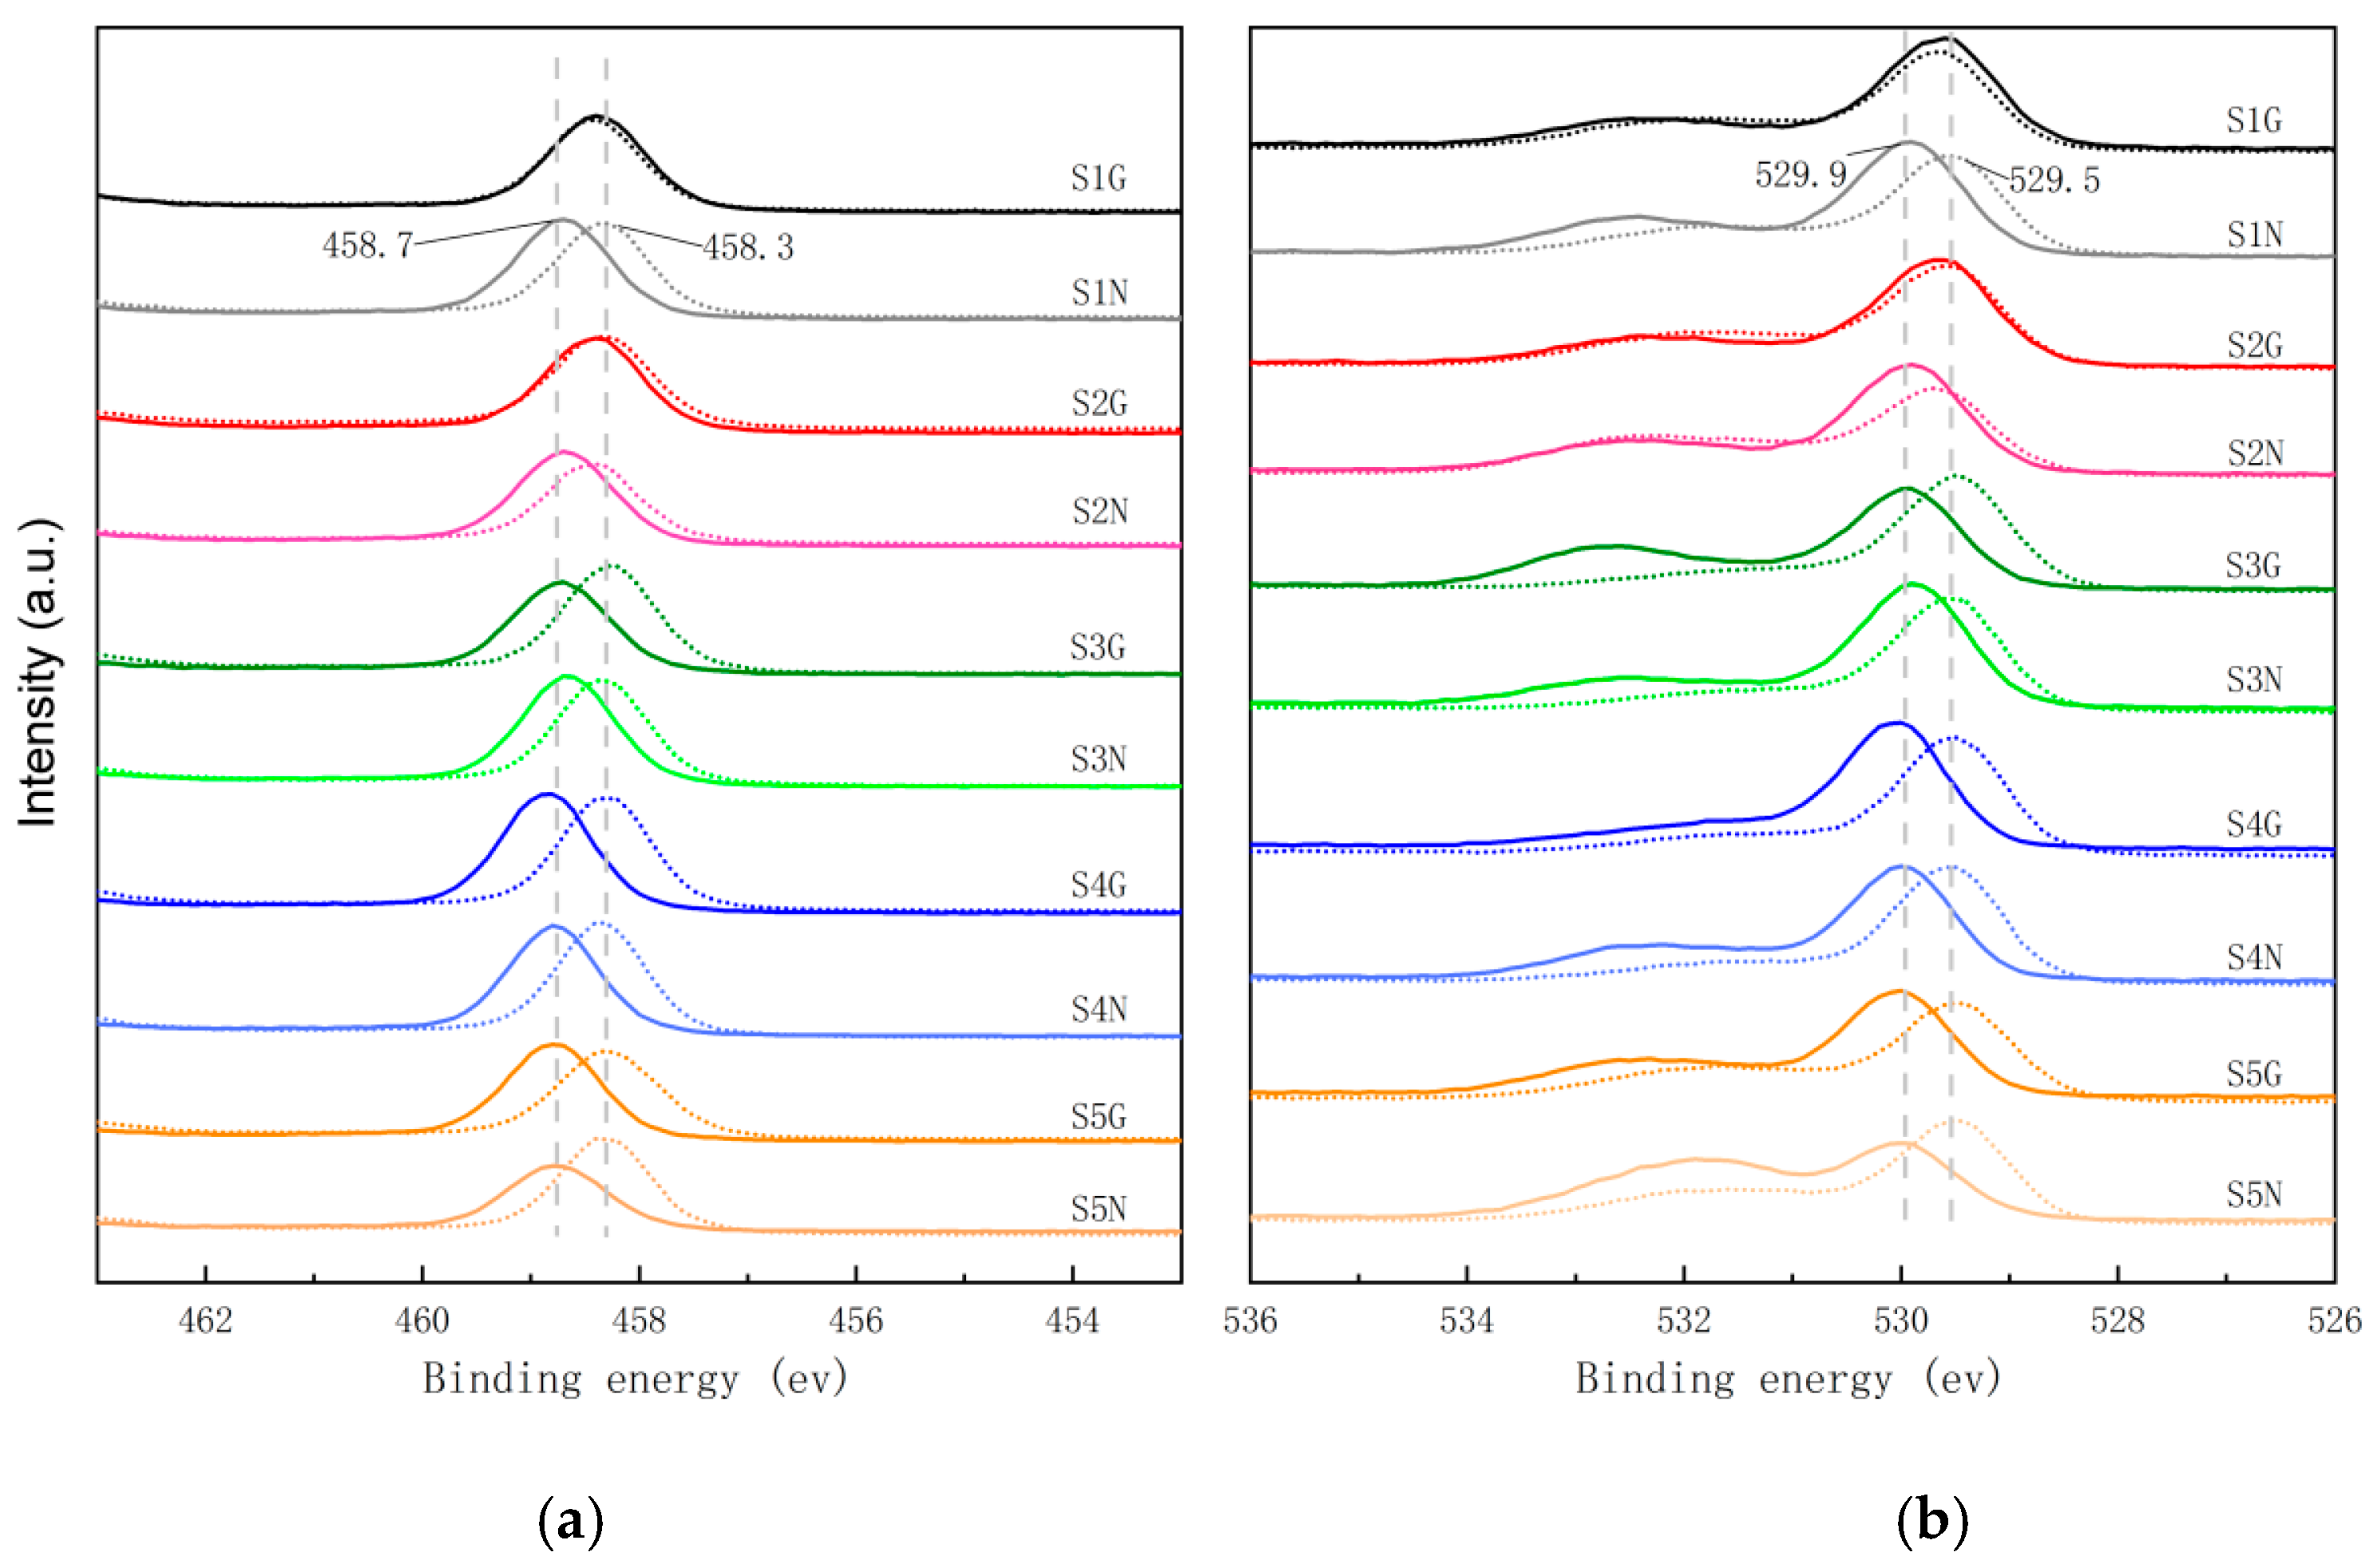
3.3. XPS Analysis
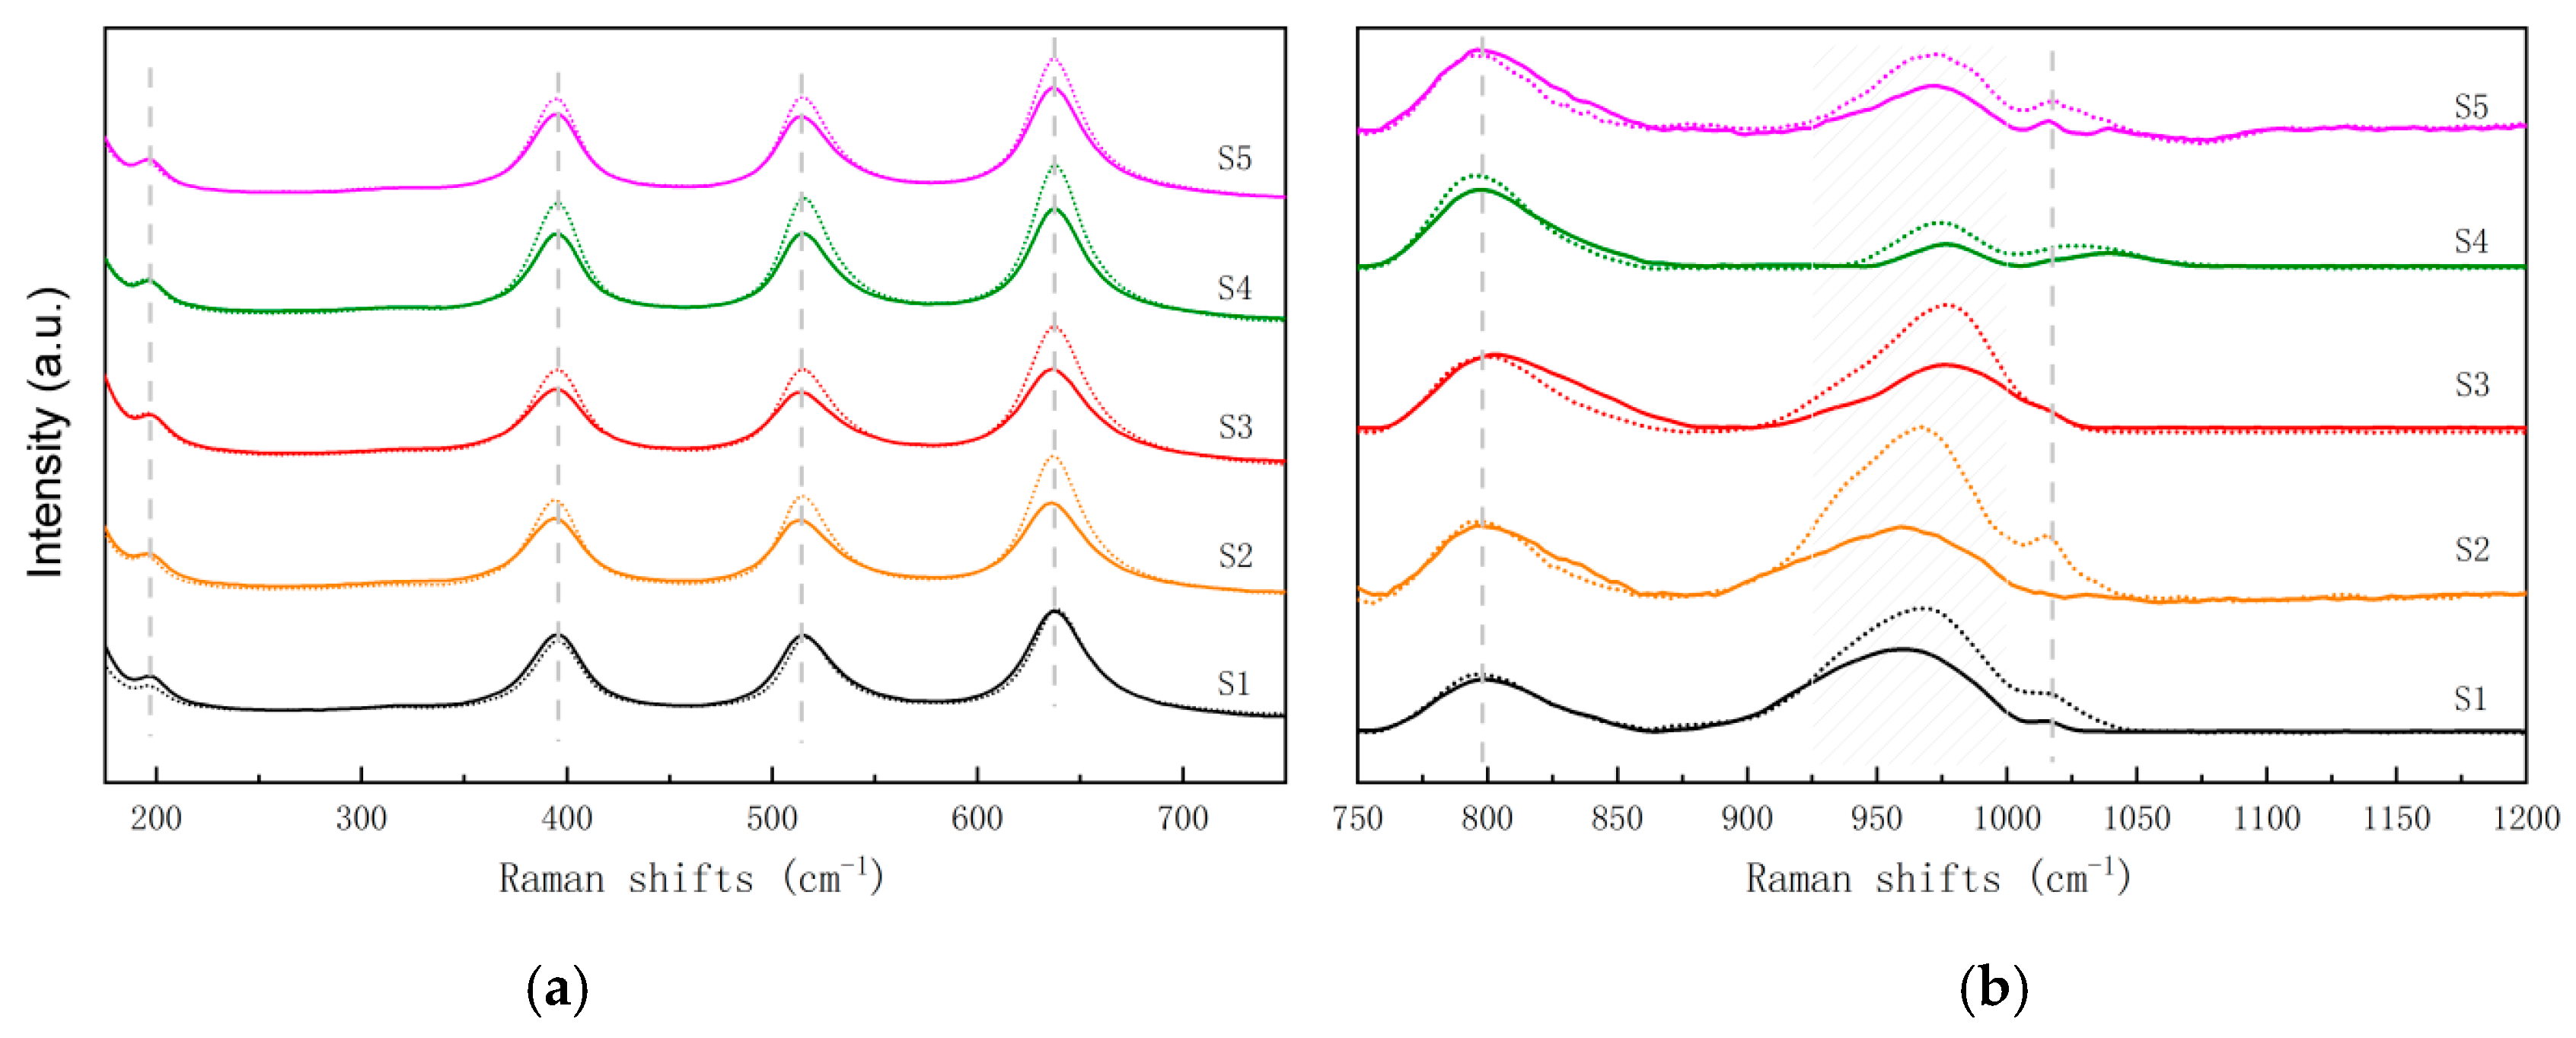
3.4. Raman Analysis
4. Conclusions
Author Contributions
Funding
Acknowledgments
Conflicts of Interest
References
- Marberger, A.; Ferri, D.; Rentsch, D.; Krumeich, F.; Elsener, M.; Krocher, O. Effect of SiO2 on co-impregnated V2O5/WO3/TiO2 catalysts for the selective catalytic reduction of NO with NH3. Catal. Today 2019, 320, 123–132. [Google Scholar] [CrossRef]
- Forzatti, P. Present status and perspectives in de-NOx SCR catalysis. Appl. Catal. A Gen. 2001, 222, 221–236. [Google Scholar] [CrossRef]
- Wang, S.; Xie, Y.; Yan, W.; Wu, X.; Wang, C.; Zhao, F. Leaching of vanadium from waste V2O5-WO3/TiO2 catalyst catalyzed by functional microorganisms. Sci. Total Environ. 2018, 639, 497–503. [Google Scholar] [CrossRef] [PubMed]
- Li, M.; Liu, B.; Wang, X.; Yu, X.; Zheng, S.; Du, H. A promising approach to recover a spent SCR catalyst: Deactivation by arsenic and alkaline metals and catalyst regeneration. Chem. Eng. J. 2018, 342, 1–8. [Google Scholar] [CrossRef]
- Choi, I.; Kim, H.; Moon, G.; Jyothi, R.; Lee, J. Spent V2O5-WO3/TiO2 catalyst processing for valuable metals by soda roasting-water leaching. Hydrometallurgy 2018, 175, 292–299. [Google Scholar] [CrossRef]
- Xiao, C.; Zeng, L.; Wei, J.; Xiao, L.; Zhang, G. Thermodynamic analysis for the separation of tungsten and aluminum in alkaline medium using solvent extraction. Hydrometallurgy 2017, 174, 91–96. [Google Scholar] [CrossRef]
- Luo, L.; Liu, K.; Shibayama, A.; Yen, W.; Fujita, T.; Shindo, O. Recovery of tungsten and vanadium from tungsten alloy scrap. Hydrometallurgy 2004, 72, 1–8. [Google Scholar] [CrossRef]
- Wu, W.; Tsai, T.; Shen, Y. Tungsten Recovery from Spent SCR Catalyst Using Alkaline Leaching and Ion Exchange. Minerals 2016, 6, 107. [Google Scholar] [CrossRef] [Green Version]
- Tang, D.; Song, H.; Liu, D.; Wu, W.; Zheng, C.; Gao, X. Study on leaching kinetics of extracting vanadium and tungsten by sodium hydroxide from spent SCR catalyst. Chin. J. Environ. Eng. 2017, 11, 1093–1100. [Google Scholar]
- Su, Q.; Miao, J.; Li, H.; Chen, Y.; Chen, J.; Wang, J. Optimizing vanadium and tungsten leaching with lowered silicon from spent SCR catalyst by pre-mixing treatment. Hydrometallurgy 2018, 181, 230–239. [Google Scholar] [CrossRef]
- Wang, J.; Miao, J.; Yu, W.; Chen, Y.; Chen, J. Study on the local difference of monolithic honeycomb V2O5-WO3/TiO2 denitration catalyst. Mater. Chem. Phys. 2017, 198, 193–199. [Google Scholar] [CrossRef]
- Lietti, L.; Ramis, G.; Berti, F.; Toledo, G.; Robba, D.; Busca, G. Chemical, structural and mechanistic aspects on NOx SCR over commercial and model oxide catalysts. Catal. Today 1998, 42, 101–116. [Google Scholar] [CrossRef]
- Kwon, D.; Park, K.; Hong, S. The influence on SCR activity of the atomic structure of V2O5/TiO2 catalysts prepared by a mechanochemical method. Appl. Catal. A Gen. 2013, 451, 227–235. [Google Scholar] [CrossRef]
- Zong, L.; Dong, F.; Zhang, G.; Han, W.; Tang, Z.; Zhang, J. Highly Efficient Mesoporous V2O5/WO3-TiO2 Catalyst for Selective Catalytic Reduction of NOx: Effect of the Valence of V on the Catalytic Performance. Catal. Surv. Asia 2017, 21, 103–113. [Google Scholar] [CrossRef]
- Lietti, L.; Forzatti, P.; Bregani, F. Steady-State and Transient Reactivity Study of TiO2-Supported V2O5−WO3 De-NOx Catalysts: Relevance of the Vanadium−Tungsten Interaction on the Catalytic Activity. Ind. Eng. Chem. Res. 1996, 35, 3884–3892. [Google Scholar] [CrossRef]
- Li, Q.; Liu, Z.; Liu, Q. Kinetics of Vanadium Leaching from a Spent Industrial V2O5/TiO2 Catalyst by Sulfuric Acid. Ind. Eng. Chem. Res. 2014, 53, 2956–2962. [Google Scholar] [CrossRef]
- Zhang, Q.; Wu, Y.; Li, L.; Zuo, T. Sustainable Approach for Spent V2O5–WO3/TiO2 Catalysts Management: Selective Recovery of Heavy Metal Vanadium and Production of Value-Added WO3–TiO2 Photocatalysts. ACS Sustain. Chem. Eng. 2018, 6, 12502–12510. [Google Scholar] [CrossRef]
- Wu, W.; Wang, C.; Bao, W.; Li, H. Selective reduction leaching of vanadium and iron by oxalic acid from spent V2O5-WO3/TiO2 catalyst. Hydrometallurgy 2018, 179, 52–59. [Google Scholar] [CrossRef]
- Dong, G.; Bai, Y.; Zhang, Y.; Zhao, Y. Effect of the V4+(3+)/V5+ ratio on the denitration activity for V2O5-WO3/TiO2 catalysts. New J. Chem. 2015, 39, 3588–3596. [Google Scholar] [CrossRef]
- Chen, H.; Xia, Y.; Fang, R.; Huang, H.; Gan, Y.; Liang, C. The effects of tungsten and hydrothermal aging in promoting NH3-SCR activity on V2O5/WO3-TiO2 catalysts. Appl. Surf. Sci. 2018, 459, 639–646. [Google Scholar] [CrossRef]
- Zhang, S.; Zhong, Q. Surface characterization studies on the interaction of V2O5-WO3/TiO2 catalyst for low temperature SCR of NO with NH3. J. Solid State Chem. 2015, 221, 49–56. [Google Scholar] [CrossRef]
- Dong, G.; Zhang, Y.; Zhao, Y.; Bai, Y. Effect of the pH value of precursor solution on the catalytic performance of V2O5-WO3/TiO2 in the low temperature NH3-SCR of NOx. J. Fuel Chem. Technol. 2014, 42, 1455–1463. [Google Scholar] [CrossRef]
- Kompio, P.; Brueckner, A.; Hipler, F.; Manoylova, O.; Auer, G.; Mestl, G. V2O5-WO3/TiO2 catalysts under thermal stress: Responses of structure and catalytic behavior in the selective catalytic reduction of NO by NH3. Appl. Catal. B Environ. 2017, 217, 365–377. [Google Scholar] [CrossRef]
- Ren, F.; Li, H.; Wang, Y.; Yang, J. Enhanced photocatalytic oxidation of propylene over V-doped TiO2 photocatalyst: Reaction mechanism between V5+ and single-electron-trapped oxygen vacancy. Appl. Catal. B Environ. 2015, 176, 160–172. [Google Scholar] [CrossRef]
- Mendialdua, J.; Casanova, R.; Barbaux, Y. XPS Studies of V2O5, V6O13, VO2 and V2O3. J. Electron Spectrosc. Phenom. 1995, 71, 249–261. [Google Scholar] [CrossRef]
- Szymczycha, A. Kinetics of Mo, Ni, V and Al leaching from a spent hydrodesulphurization catalyst in a solution containing oxalic acid and hydrogen peroxide. J. Hazard. Mater. 2011, 186, 2157–2161. [Google Scholar] [CrossRef]
- Yaws, C.L. Chapter 2—Physical Propert—Inorganic Compounds. In The Yaws Handbook of Physical Properties for Hydrocarbons and Chemicals, 2nd ed.; Gulf Professional Publishing: Boston, MA, USA, 2015; pp. 684–810. [Google Scholar]
- Zhou, X.; Wei, C.; Xia, W.; Li, M.; Li, C.; Deng, Z. Dissolution kinetics and thermodynamic analysis of vanadium trioxide during pressure oxidation. Rare Metals 2012, 31, 296–302. [Google Scholar] [CrossRef]
- Xue, Y.; Zhang, Y.; Zhang, Y.; Zheng, S.; Zhang, Y.; Jin, W. Electrochemical detoxification and recovery of spent SCR catalyst by in-situ generated reactive oxygen species in alkaline media. Chem. Eng. J. 2017, 325, 544–553. [Google Scholar] [CrossRef]
- Qiu, S.; Wei, C.; Li, M.; Zhou, X.; Li, C.; Deng, Z. Dissolution kinetics of vanadium trioxide at high pressure in sodium hydroxide-oxygen systems. Hydrometallurgy 2011, 105, 350–354. [Google Scholar] [CrossRef]
- Zhou, X.; Wei, C.; Li, M.; Qiu, S.; Li, X. Thermodynamics of vanadium–sulfur–water systems at 298K. Hydrometallurgy 2011, 106, 104–112. [Google Scholar] [CrossRef]
- Madia, G.; Elsener, M.; Koebel, M.; Raimondi, F.; Wokaun, A. Thermal stability of vanadia-tungsta-titania catalysts in the SCR process. Appl. Catal. B Environ. 2002, 39, 181–190. [Google Scholar] [CrossRef]


| Ref. | Reagents | Temperature (°C) | Time (min) | Particle size (μm) | Efficiency (%) |
|---|---|---|---|---|---|
| Wu et al. [8] | NaOH | 70 | 30 | 74 | V: 87, W: 91 |
| Tang et al. [9] | NaOH | 100 | 180 | 150 | V: 93, W: 97 |
| Su et al. [10] | NaOH | 100 | 90 | 150 | V: 66, W: 49 |
| Li et al. [4] | NH4HCO3+H2O2 | 80 | 180 | 45 | V: 95; W: 98 |
| Li et al. [16] | H2SO4 | 80 | 120 | 74 | V: 42 |
| Zhang et al. [17] | H2SO4+Na2SO3 | 95 | 120 | 74 | V: 100 |
| Wu et al. [18] | oxalic acid | 90 | 180 | 75 | V: 84 |
| Catalysts | V2O5 a | WO3 a | TiO2 b | SO3 b | SiO2 b | CaO b | Al2O3 b |
|---|---|---|---|---|---|---|---|
| S1G | 1.036 | 4.761 | 76.970 | 0.425 | 9.354 | 2.768 | 2.288 |
| S1N | 1.015 | 4.685 | 76.817 | 2.261 | 8.168 | 2.542 | 1.984 |
| S2G | 1.005 | 4.798 | 77.939 | 0.433 | 8.835 | 2.772 | 2.252 |
| S2N | 0.985 | 4.632 | 76.777 | 2.300 | 7.905 | 2.475 | 1.875 |
| S3G | 0.925 | 4.453 | 81.726 | 1.113 | 7.162 | 1.828 | 1.005 |
| S3N | 0.909 | 4.392 | 81.590 | 1.386 | 7.285 | 1.775 | 1.072 |
| S4G | 0.554 | 2.222 | 88.410 | 1.544 | 3.816 | 1.165 | 0.984 |
| S4N | 0.550 | 2.234 | 88.687 | 1.559 | 3.777 | 1.180 | 0.979 |
| S5G | 0.749 | 3.154 | 78.149 | 1.875 | 9.293 | 2.988 | 2.435 |
| S5N | 0.735 | 3.146 | 78.185 | 2.785 | 8.367 | 2.903 | 2.153 |
| Catalysts | Specific Surface Area (m2g−1) | Pore Volume (cm3g−1) | Average Pore Radius (nm) |
|---|---|---|---|
| S1G | 48.90 | 0.26 | 10.6 |
| S1N | 46.22 | 0.24 | 10.4 |
| S2G | 48.02 | 0.22 | 9.3 |
| S2N | 44.02 | 0.22 | 10.1 |
| S3G | 49.61 | 0.24 | 9.7 |
| S3N | 41.26 | 0.24 | 11.4 |
| S4G | 56.65 | 0.27 | 9.4 |
| S4N | 54.95 | 0.26 | 9.5 |
| S5G | 40.40 | 0.22 | 10.1 |
| S5N | 40.34 | 0.21 | 10.4 |
| Samples | Surface Atom Ratio (% mol/mol) | V 2P3/2 Peak Fitting | Bulk Analysis (% mol/mol) | ||||||
|---|---|---|---|---|---|---|---|---|---|
| Ti | V | W | V3+ | V4+ | V5+ | Ti | V | W | |
| S1G | 87.76 | 3.00 | 9.24 | 22.63 | 46.96 | 30.41 | 96.91 | 1.10 | 1.99 |
| S1N | 87.10 | 3.96 | 8.94 | 15.42 | 38.59 | 45.99 | 96.96 | 1.08 | 1.96 |
| S2G | 88.34 | 2.65 | 9.01 | 22.22 | 49.64 | 28.14 | 96.96 | 1.06 | 1.98 |
| S2N | 87.87 | 3.70 | 8.42 | 15.96 | 42.60 | 41.46 | 97.01 | 1.05 | 1.94 |
| S3G | 90.63 | 1.74 | 7.63 | 38.76 | 36.98 | 24.26 | 97.31 | 0.93 | 1.76 |
| S3N | 89.61 | 3.08 | 7.31 | 16.78 | 50.02 | 33.20 | 97.35 | 0.92 | 1.74 |
| S4G | 93.07 | 1.03 | 5.89 | 37.25 | 40.20 | 22.55 | 98.66 | 0.52 | 0.82 |
| S4N | 93.49 | 1.42 | 5.09 | 29.04 | 43.65 | 27.31 | 98.66 | 0.52 | 0.82 |
| S5G | 91.39 | 1.63 | 6.98 | 32.51 | 48.19 | 19.30 | 97.90 | 0.79 | 1.31 |
| S5N | 91.90 | 2.48 | 5.62 | 23.27 | 48.78 | 27.95 | 97.92 | 0.78 | 1.31 |
© 2020 by the authors. Licensee MDPI, Basel, Switzerland. This article is an open access article distributed under the terms and conditions of the Creative Commons Attribution (CC BY) license (http://creativecommons.org/licenses/by/4.0/).
Share and Cite
Su, Q.; Yi, X.; Miao, J.; Chen, Y.; Chen, J.; Wang, J. A Comparative Study in Vanadium and Tungsten Leaching from Various Sources of SCR Catalysts with Local Difference. Sustainability 2020, 12, 1499. https://0-doi-org.brum.beds.ac.uk/10.3390/su12041499
Su Q, Yi X, Miao J, Chen Y, Chen J, Wang J. A Comparative Study in Vanadium and Tungsten Leaching from Various Sources of SCR Catalysts with Local Difference. Sustainability. 2020; 12(4):1499. https://0-doi-org.brum.beds.ac.uk/10.3390/su12041499
Chicago/Turabian StyleSu, Qingfa, Xianfang Yi, Jifa Miao, Yanting Chen, Jinsheng Chen, and Jinxiu Wang. 2020. "A Comparative Study in Vanadium and Tungsten Leaching from Various Sources of SCR Catalysts with Local Difference" Sustainability 12, no. 4: 1499. https://0-doi-org.brum.beds.ac.uk/10.3390/su12041499