Ultraviolet Fluorescence in the Assessment of Quality in the Mixing of Granular Material


Faculty of Production Engineering, Opole University of Technology, 45-758 Opole, Poland
Sustainability 2020, 12(4), 1546; https://0-doi-org.brum.beds.ac.uk/10.3390/su12041546
Submission received: 30 January 2020
/
Revised: 17 February 2020
/
Accepted: 18 February 2020
/
Published: 19 February 2020
(This article belongs to the Special Issue Sustainable Production in Food and Agriculture Engineering)
Abstract
:The aim of the study was to determine the possibility of using ultraviolet fluorescence to evaluate the quality of the mixing process of industrial feed. A laboratory funnel-flow mixer was used for the mixing process. The studies were carried out using three different feeds for pigs. A key component in the form of ground grains of yellow maize covered with the fluorescent substance Rhodamine B was introduced into the mixer before the mixing process began. After the illumination of the sample by UV lamps, the images were taken with a digital camera. The images were analyzed in Patan® software. The information obtained on the percentage content of the key component was used for further calculations. At the same time, the tracer content was determined using the control method (weight method). The comparison of the results obtained by the two methods (statistical comparative analysis) did not indicate significant differences. Therefore, the usefulness of the proposed method to track the share of the key component by inducing it to glow in the ultraviolet light has been proven. The introduced tracer is also one of the components of the feed, which translates into the possibility of observing the material having the characteristics of a mixed material.
1. Introduction
Mixing granular materials is a difficult and multifaceted process which, although it was already described in the 1940s, is still a current research problem. This is due, among other things, to the development and availability of new tools, thanks to which it is possible to precisely observe the process itself, as well as to describe the behavior of selected components of the mixed bed. The degree of mixing of granular components is an important quality parameter of the final product in the context of e.g., nutrition [1,2,3]. It seems to be particularly important to conduct research on the process of mixing components with considerable fineness, such as powders. This is due, among other things, to the scale of production of products in the form of granules or powders, which reaches up to one billion pounds a year [4,5,6,7] and the aspects of safety [8].
The correct level of mixing ingredients in the mixture is important to obtain satisfactory results (mixture of good quality) in the production of farm animals; the preparation of feed in accordance with the given recipe. Incomplete mixing may result in negative nutritional effects. The appropriate uniformity of a mixture is important also for the granulation process [1,8,9]. In industrial conditions, ensuring safe feed production requires the implementation of Quality Management Systems such as Good Hygienic Practice—GHP, Good Manufacturing Practice—GMP, and Hazard Analysis and Critical Control Points—HACCP [10]. Quality control in feed production consists of verifying the correctness of the key stages and is carried out by eliminating possible biological, chemical and physical hazards. In the HACCP system, the mixing stage is often indicated as a critical control point. The assessment of homogeneity is an important Critical-To-Quality (CTQ) factor and it must be contolled periodically. This allows us, inter alia, to determine the required mixing time to obtain a high-quality product and involves the homogeneity analysis of samples taken from the mixer or from bags containing the finished mix. Determining the exact mixing time is important due to the fact that both too long and too short mixing can cause incorrect homogeneity. Moreover, the mixing time recommended by the mixers’ manufacturers may not give the declared results in industrial conditions. This is due to the multi-threading of the process of mixing granular materials, which underlies research problems. Of course, determining the effective mixing time translates into production costs. Optimizing the work of mixing devices requires quantitative means to evaluate mixing [8,11]. Moreover, even a slight change in the parameters of the mixing process, such as humidity of the mixed material, degree of filling of the mixer and others, affects the degree of mixing [5,12,13]. The quality of the feed’s raw materials is another important issue. Due to its properties (biologically active material), the feed may undergo contamination with pathogenic microflora [8,14]. However, as shown by some research carried out in Poland, this type of contaminant does not exceed accepted standards, and the use of thermal treatment such as drying allows for the additional reduction of this risk [14,15,16].
The degree of mixing of granular materials is described by various mathematical relationships in which the main element is the content of a given ingredient in the mixed bed. The determination of the state of the mixture is usually based on its deviation from the state of segregation or the state of perfect mixture. When mixing a two-component material, the determination of the state of the mixture is quite simple and is based on the analysis of sample composition [2]. When mixing heterogeneous multicomponent systems, is often impossible to analyze the composition of the samples accurately. There are only a few items in the literature where the authors have evaluated the mixing process based on the analysis of the content of each component of the mixture. However, methods of this type are very labor- and time-consuming [17,18]. A new method for determining the mixing index based on determining the distance from the adjacent particle and coordination number concept in multiple-spouted bed was proposed by Chen et al. [19].
However, most often the condition of a multicomponent granular mixture is determined on the basis of the content of the selected key component in the taken samples. The key ingredient can be a deliberately introduced element like microtracer—colored uniformly sized iron particles or microgrits [20,21,22,23,24]. This solution allows the quick assessment of the homogeneity of grain mixtures in industrial conditions. However, iron filings have different characteristics from mixed components, e.g., feed components or biologically active materials. This does not allow us to use them to track the behavior of actually mixed materials.
A number of methods for assessing the homogeneity of granular mixtures (indicator methods) are based on the determination of the content of specially dyed particles or on the use of the fluorescence emission phenomenon. Many researchers have used laser-induced fluorescence (LIF method) for this purpose. Lai et al. [25,26] used it to describe the kinetics of the pharmaceutical powder mixing process. A similar methodology was also used by Karumanchi et al. [27] for determining the dead zones in the mixer during powder mixing. Meanwhile, Durao et al. [28] determined in this way the concentration of five different substances in a multicomponent vitamin preparation. The phenomenon of X-ray fluorescence (XRF) was used, among others, in the assessment of sulphur and chlorine content in feeds for ruminants. The research was conducted for the following feeds: grass, grass silage and maize silage [29]. The use of a laser does not require physical sampling, which is the main advantage of this solution. However, it is necessary to prepare the mixer properly (window to take the sample) and the possible falsification of the results with the contaminants present. In addition, the window must be kept sufficiently clean, which may not be possible if the mixed components are very fine [30].
The analysis of the distribution of the stained components is often based on computer image analysis of the mixed material. Realpe et al. [31] used image analysis to evaluate the homogeneity of colored powders mixed in a cylindrical device. Berthiaux et al. [32] used this tool to assess the homogeneity of the mixture flowing out of the mixer. The homogeneity of the mixture at the mixer outlet was tested by Muerza et al. [33] based on on-line image analysis, and Dal Grande et al. [34] proved the usefulness of the HSV color model description for the analysis of binary grain mixture images. Computer image analysis to assess the impact of vibration intensity on the segregation of a bed consisting of steel and glass balls was used by Yang [35] and then by Tai et al. [36]. Hu et al. [37] analyzed images of samples taken during mixing in a rotating conical mixer with and without a mixing blade. Liu at al. [38] used an interesting optical technique consisting of the simultaneous acquisition of images with an infrared thermal camera and an ordinary RGB camera. Red (heated to 40 and 80 °C) and white balls (at room temperature) were used in this test. Techniques of this type are a relatively cheap and good tool, especially for analyzing the surface of a mixed material or its flow, and are most often used in laboratory conditions [30,39]. The limitation of these methods results from certain difficulties in obtaining information, e.g., a lack of access to the free space of the mixed bed, covering of the tracer by loose material [30].
In the research carried out by the authors of this work, an optical method was used that combines the fluorescence of a tracer in ultraviolet light with the acquisition of images by means of a digital camera with a standard lens. The usefulness of the proposed method in the mixing of whole grains in two- and multicomponent systems was confirmed, and the results obtained were described in the works of Matuszek et al. [40,41,42]. Referring to the commonness of powders in industrial practice and the limitations of computer image analysis in the evaluation of their mixing [4,5,6,30], the developed method was tested in the mixing of multicomponent feed consisting of ground grains and additives in the form of powders—so-called micronutrients. The aim of the study is to determine the possibility of using the method based on UV-induced fluorescence to assess the mixing of multicomponent industrial ground feed. The tests were carried out under laboratory conditions; however, the mixtures were obtained from feed factories. This makes the work more functional.
2. Materials and Methods
The mixtures used for the research consisted of components used for feed production, i.e., cereal grains and feed additives aimed at improving the nutritional value or sensory attractiveness (flavors). To assess the homogeneity of this type of mixture, indicator methods based on the assessment of the content of the key component (tracer) in feed samples were used. Therefore, there was the question of choosing the component that would properly represent the state of the mixed bed. Based on the previous experience of the author of this study and the literature information, it was decided that this ingredient may be maize. The choice was dictated, among others, by the widespread use of this ingredient in feeding farm animals and the ease of grinding or coating by coloring matter. Determining the size and number of samples is another research problem. On the one hand, the sample may consist of a single grain; on the other hand, the whole mixed system. The most important thing for the sample is to be representative. In the tests, 10 samples were taken due to the construction of the mixer. The mass of a single sample was determined experimentally. Finally, one of the most frequently appearing problems, i.e., how to assess the content of a particular ingredient against the background of many components that differ in color or fineness. The authors, using a known and proven tool, namely image analysis, attempted to eliminate this disturbance–for this, the fluorescent phenomenon was used.
Feed mixes obtained from a local feed factory were used in the study. These were one of the most commonly used mixtures intended for pigs. The mixtures were multicomponent systems (10-, 13- and 14-component systems) consisting of ground products of plant origin, such as cereal grains and minerals, and chemical additives. The types and proportions of the individual components and the degree of fineness (assessment by sieve analysis) of the tested feed are shown in Table 1.
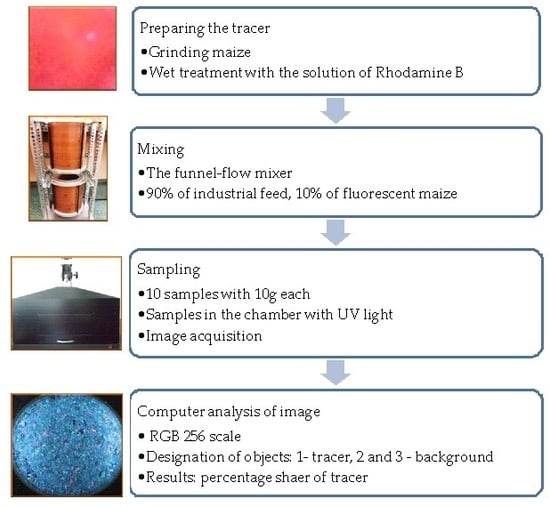
A tracer was introduced to the mixing process (before it started). The seeds of yellow maize were used as the tracer—they were subjected to grinding and then wet treated with 0.01% Rhodamine B solution (C28H31ClN2O3, red-violet powder, wavelength 627 nm, excitation area 553 nm). The dyeing was carried out in laboratory conditions and the obtained materials (after drying) were stored in identical conditions in tightly closed packages, protecting against light. Two types of tracer were obtained in this way—maize of average particle size d1 = 2.00 mm and d2 = 1.25 mm. Before starting the mixing process, the tracer was placed in the upper part of the mixer (ring 10) in the amount of 100 g (10% of the mixture). The remaining part (rings 1–9) was an industrial feed mix of 900 g (90% of the mixture). After filling the mixer, the mixing process started. Mixing was carried out in a laboratory funnel-flow mixer by means of subsequent flows from 1 to 10. The characteristics of the mixer were presented in detail in another work by the authors [43]. The mixing was completed after the 10th flow and sampling were carried out. Single samples of 10 g were taken from ten mixer locations (levels). This was possible by the special design of the mixing tanks—10 removable rings.
The samples on the Petri dishes (120 mm × 20 mm) were placed in a chamber equipped with ultraviolet fluorescent lamps (2 lamps with 15 W each, mounted inside in the upper part of chamber). The chamber was made of black material, which limited the influence of light from outside. The sample was placed on a pull-out drawer. The chamber was then closed and the lighting controlled from outside. In the upper part of the chamber was a hole for a digital camera lens. A digital camera with a standard lens, 20.1 Mpix resolution and 35 mm focal length was used. When taking pictures, the exposure correction was set to −0.5 EV. After the illumination of the sample, images with a resolution of 1600 × 1200 pixels were obtained. The images obtained were analyzed in Patan®. This program analyzes the image based on the RGB 256 scale. After the loading of the image, three areas (designation of surface fragments, assignment of pixels) responsible for individual classes were marked in the examined area (circular area): 1—tracer (fluorescent maize) and 2 and 3—background (industrial mix). Thanks to this, it was possible to capture the desired information (the tracer’s share) against a multicolored sample. The results obtained referr to the percentage content of particular classes. For further research, data on the percentage share of the first class, i.e., tracer, were used. In the next stage, the manual separation of the taken samples was performed and the separated tracer was weighed on an analytical balance with accuracy of ±0.01 g. In this way, the share of the tracer was estimated using two methods: (1) computer image analysis, (2) weighing method. The second method was used as a tool to verify the results obtained by method one. The selected stages of the methodology are schematically presented in Figure 1. On the basis of the results, the arithmetic mean, the standard deviation, the difference between the results obtained by the two methods and the coefficient of variation were calculated. The coefficient of variation (CV) was treated as a parameter indicating the degree of homogeneity of the obtained mixture. The calculations were made according to the instructions of the National Veterinary Institute [44]. The coefficient of variation was in the range from 0% to 100%. According to these instructions, the mixture is considered homogeneous when the CV ≤ 15%. In this range, a good mix of the tracer in the mixture is obtained. CV > 15% means bad homogeneity of the mixture, meaning there is poor mixing of the tracer in the mixture.
In order to verify the results obtained by the two methods, statistical comparative analysis was carried out. After checking the normality of distribution (Shapiro–Wilk test) and homogeneity of variance (Levene test), appropriate parametric (Student t-test) and non-parametric (U Mann-Whitney test) tests were used. The significance level α = 0.05 was assumed for calculations. The null hypothesis regarding no differences in results obtained by the two methods was tested compared to the alternative hypothesis about the occurrence of such differences.
3. Results
3.1. Results Obtained by Means of Computer Image Analysis and the Weighing Method
The share of the tracer and the difference in results obtained by the two methods and selected statistical parameters (arithmetic mean, standard deviation, coefficient of variation) are presented in Table 2 and Table 3. Graphical interpretations of the results are presented in diagrams (Figure 2, Figure 3 and Figure 4).
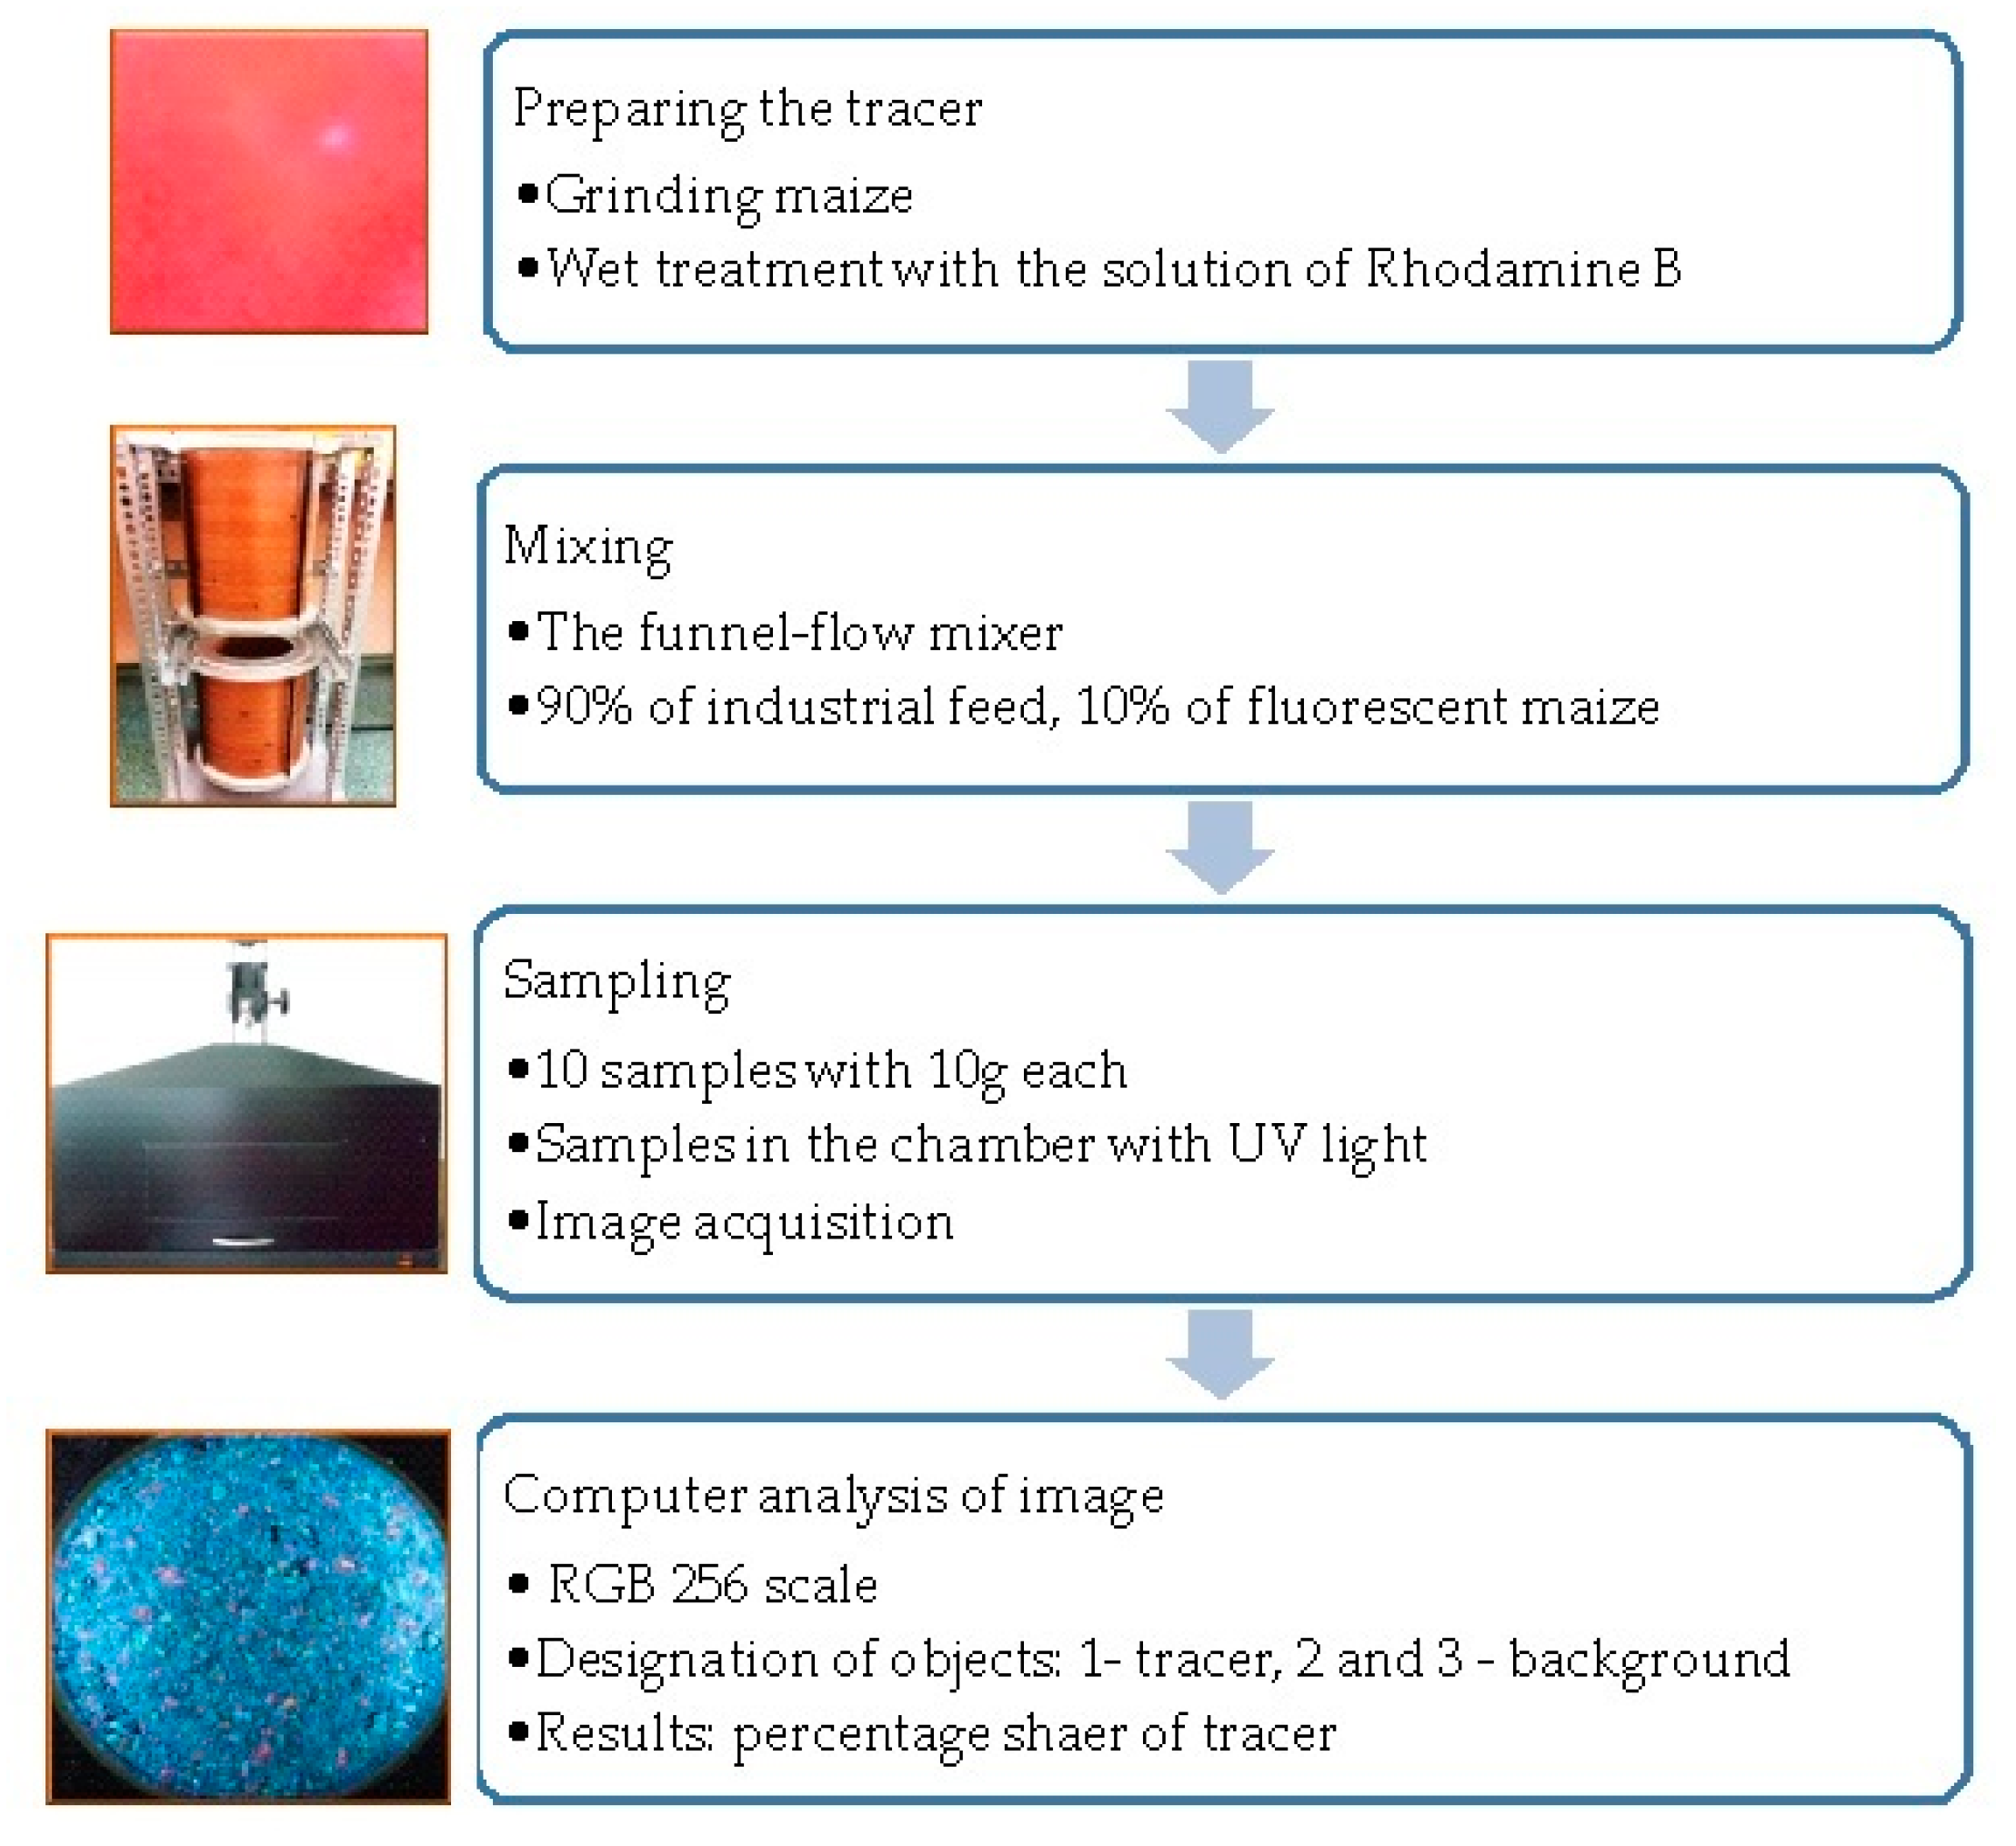
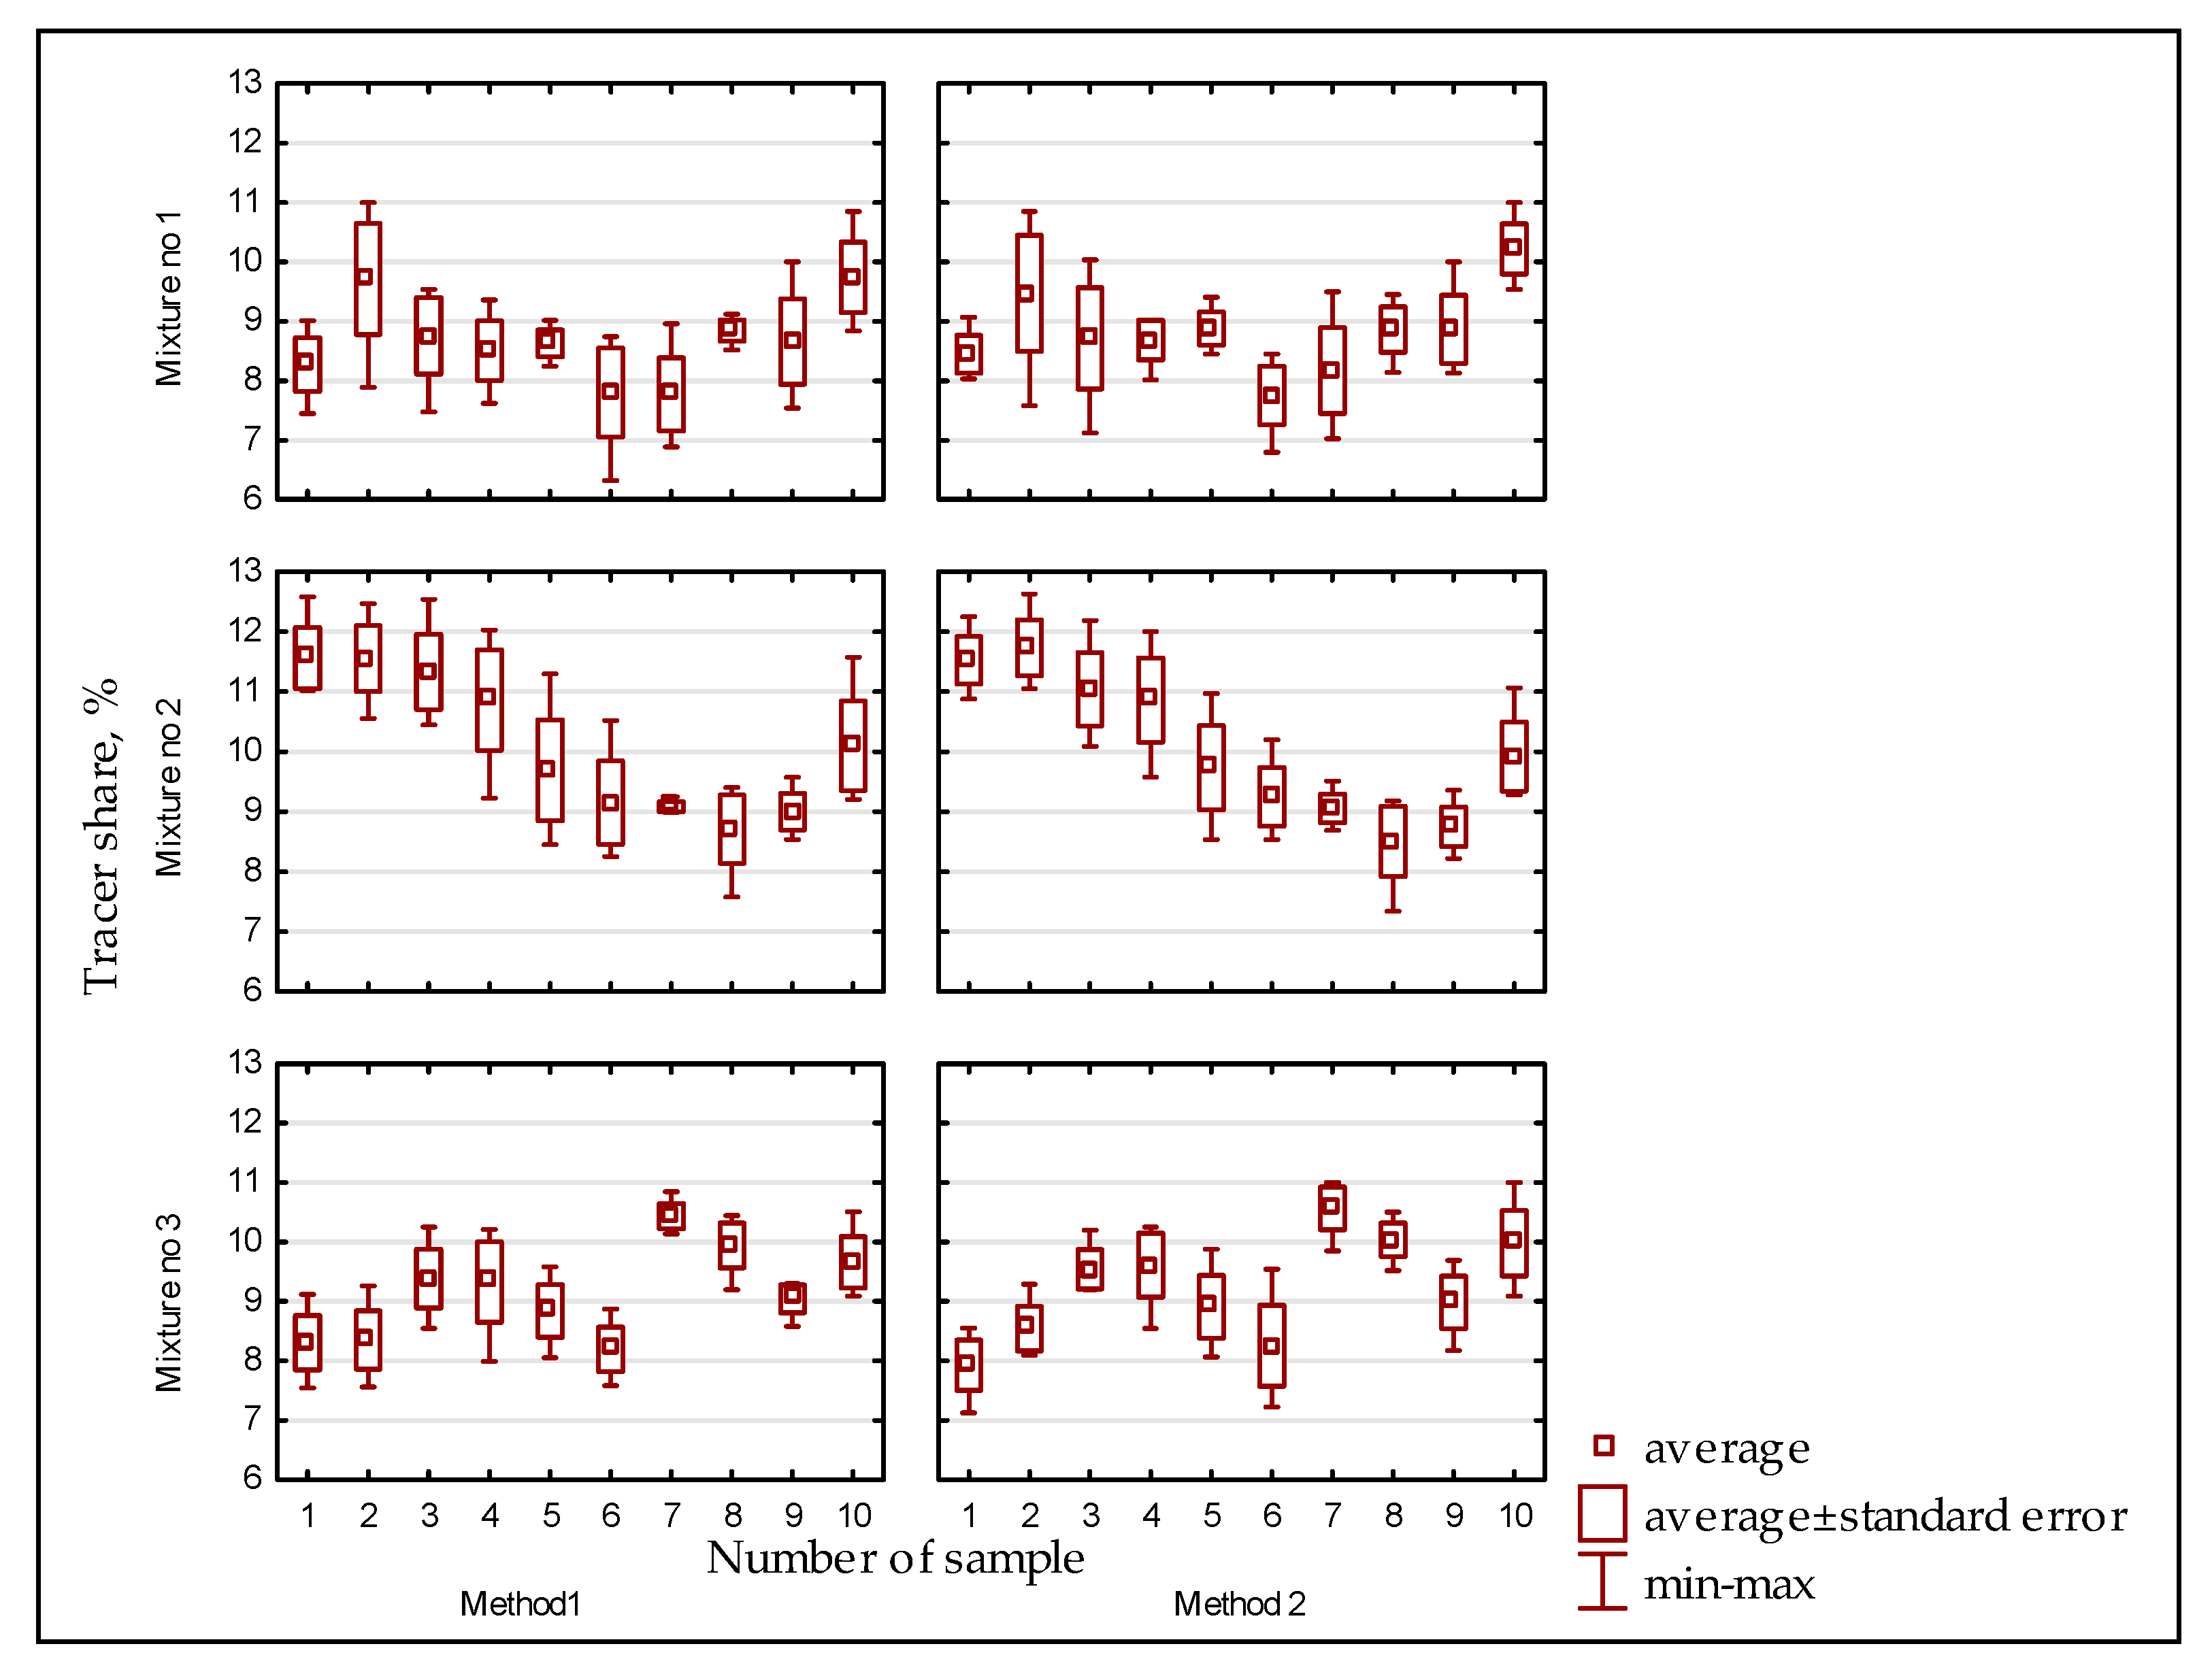
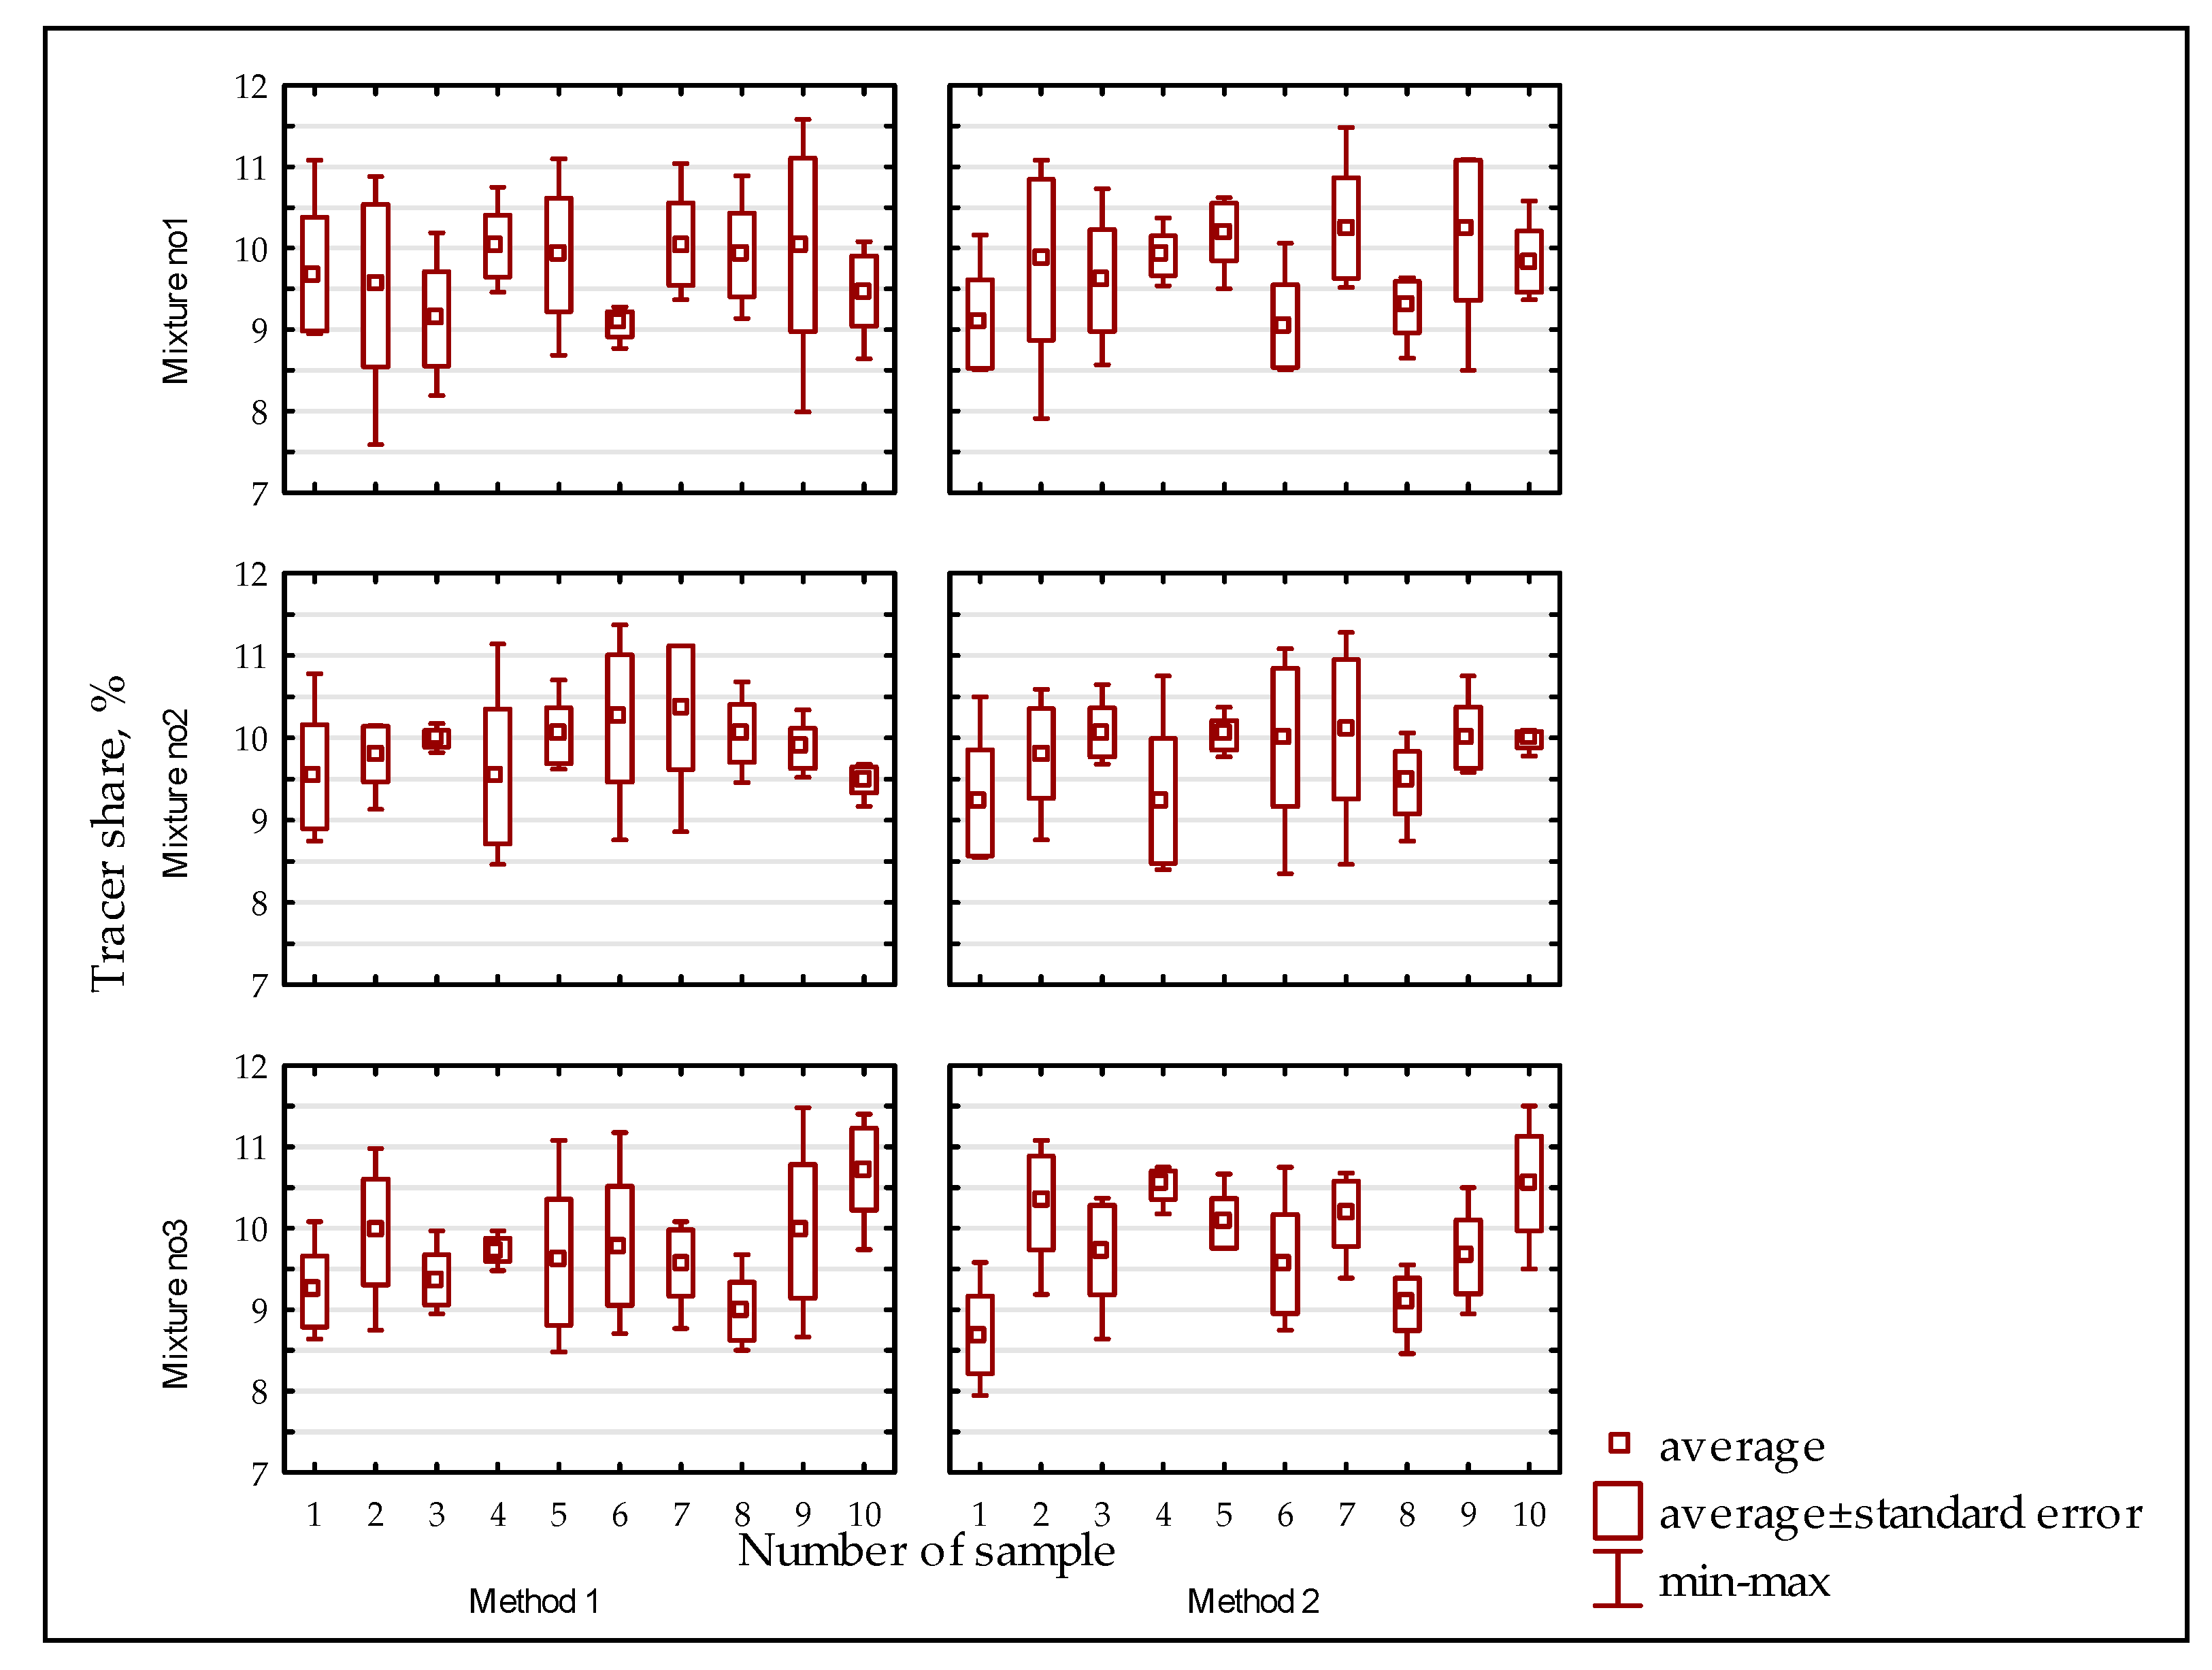
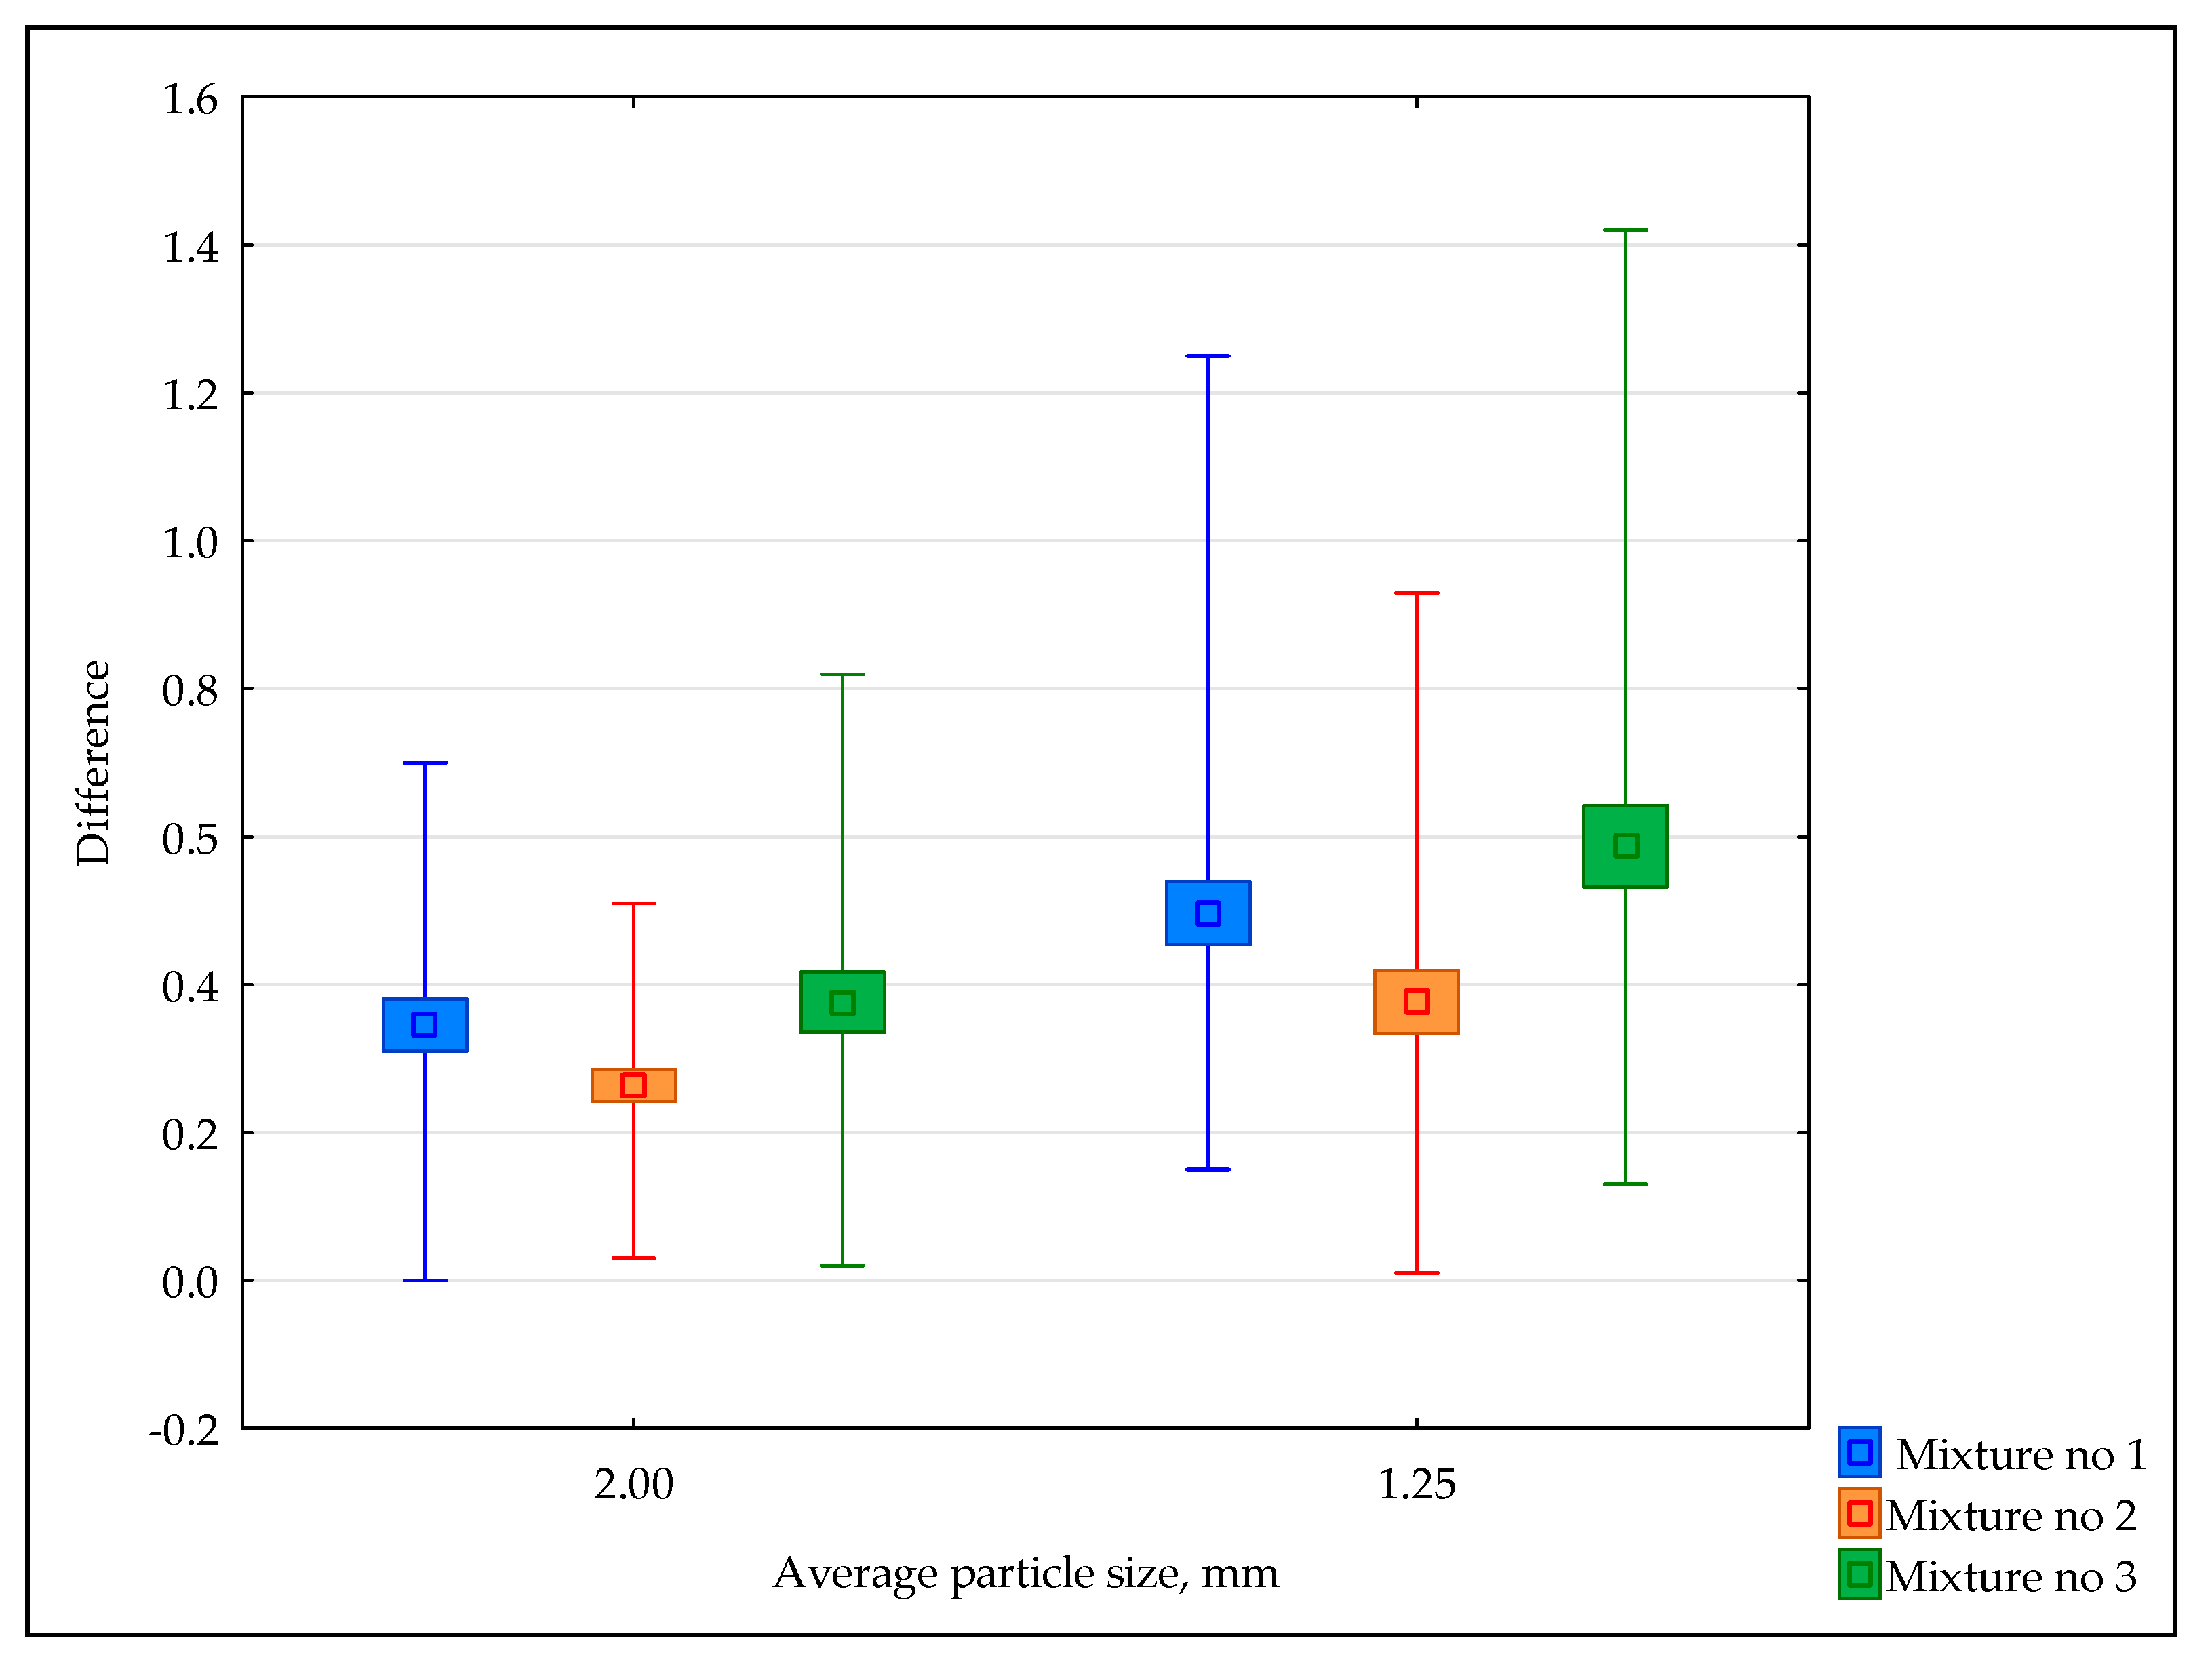
The results presented in Table 2 and Table 3 show the great similarity of the results obtained by the two methods. The mean difference of the results obtained by the two methods for the tracer with mean particle size d = 2.00 ranged from 0.3 to 0.41 for mixture 1, 0.26–0.27 for mixture 2 and 0.29–0.43 for mixture 3 (Table 2). In the case of mixing with a smaller average particle size (d = 1.25 mm), slightly larger differences were obtained: 0.44–0.53 for mix 1, 0.33–0.42 for mix 2 and 0.50–0.64 for mix 3 (Table 3). In one case, a zero difference was obtained and this concerned the results of mixing feed 1 with the maize of larger average particle size. However, the highest level of the difference of 1.42 was recorded for mixing feed 3 with the d = 1.25 mm tracer. Similar values of the tracer’s share obtained by method 1 and 2 in particular segments (samples) of the mixer after the mixing process was completed are also visible on the diagrams (Figure 2 and Figure 3). By analyzing these charts, you can also track the tracer’s distribution in the individual mixing zones (rings). For example, when mixing feed 2 with 2.00 mm maize, the tracer gathered in the lower part of the mixer (rings 1 to 3). Then, there is a decrease in its share (rings 4–8) and again a slight increase (rings 9 and 10). The graphical interpretation also shows that when using a tracer with an average particle size (d = 1.25 mm), larger deviations from the average value (average ± standard error) were obtained than in the case of a tracer with a smaller degree of fineness. Similarly, by analysing Figure 4, lower values of the differences obtained in mixing with the d = 2.00 mm tracer can be observed. In this case, lower mean values were obtained (0.34%, 0.26%, 0.43% respectively for mixtures 1, 2 and 3) than in tests with finer d = 1.25 mm (mean values 0.50%, 0.38%, 0.59% respectively for mixtures 1, 2 and 3). Additionally, in the same case, the values are more favorably (lower values) distributed in the min-max range (0–0.7, 0.03–0.51, 0.02–0.82 respectively for mixtures 1, 2 and 3). The values within the same range, for a series of tests with a d = 1.25 mm tracer, are 0.15–1.25, 0.01–0.93 and 0.13–1.42, respectively.
Referring to the results of the coefficient of variation, each of the mixtures achieved good homogeneity, and thus good mixing of the tracer. In each case, a coefficient of variation at CV ≤ 15% was obtained. This observation concerns the results obtained with two methods and with the use of two different tracers of different degrees of fineness.
3.2. Results of Statistical Comparative Analysis
The results of the statistical analysis are presented in Table 4 and Table 5 and their graphical interpretation in Figure 5 and Figure 6.
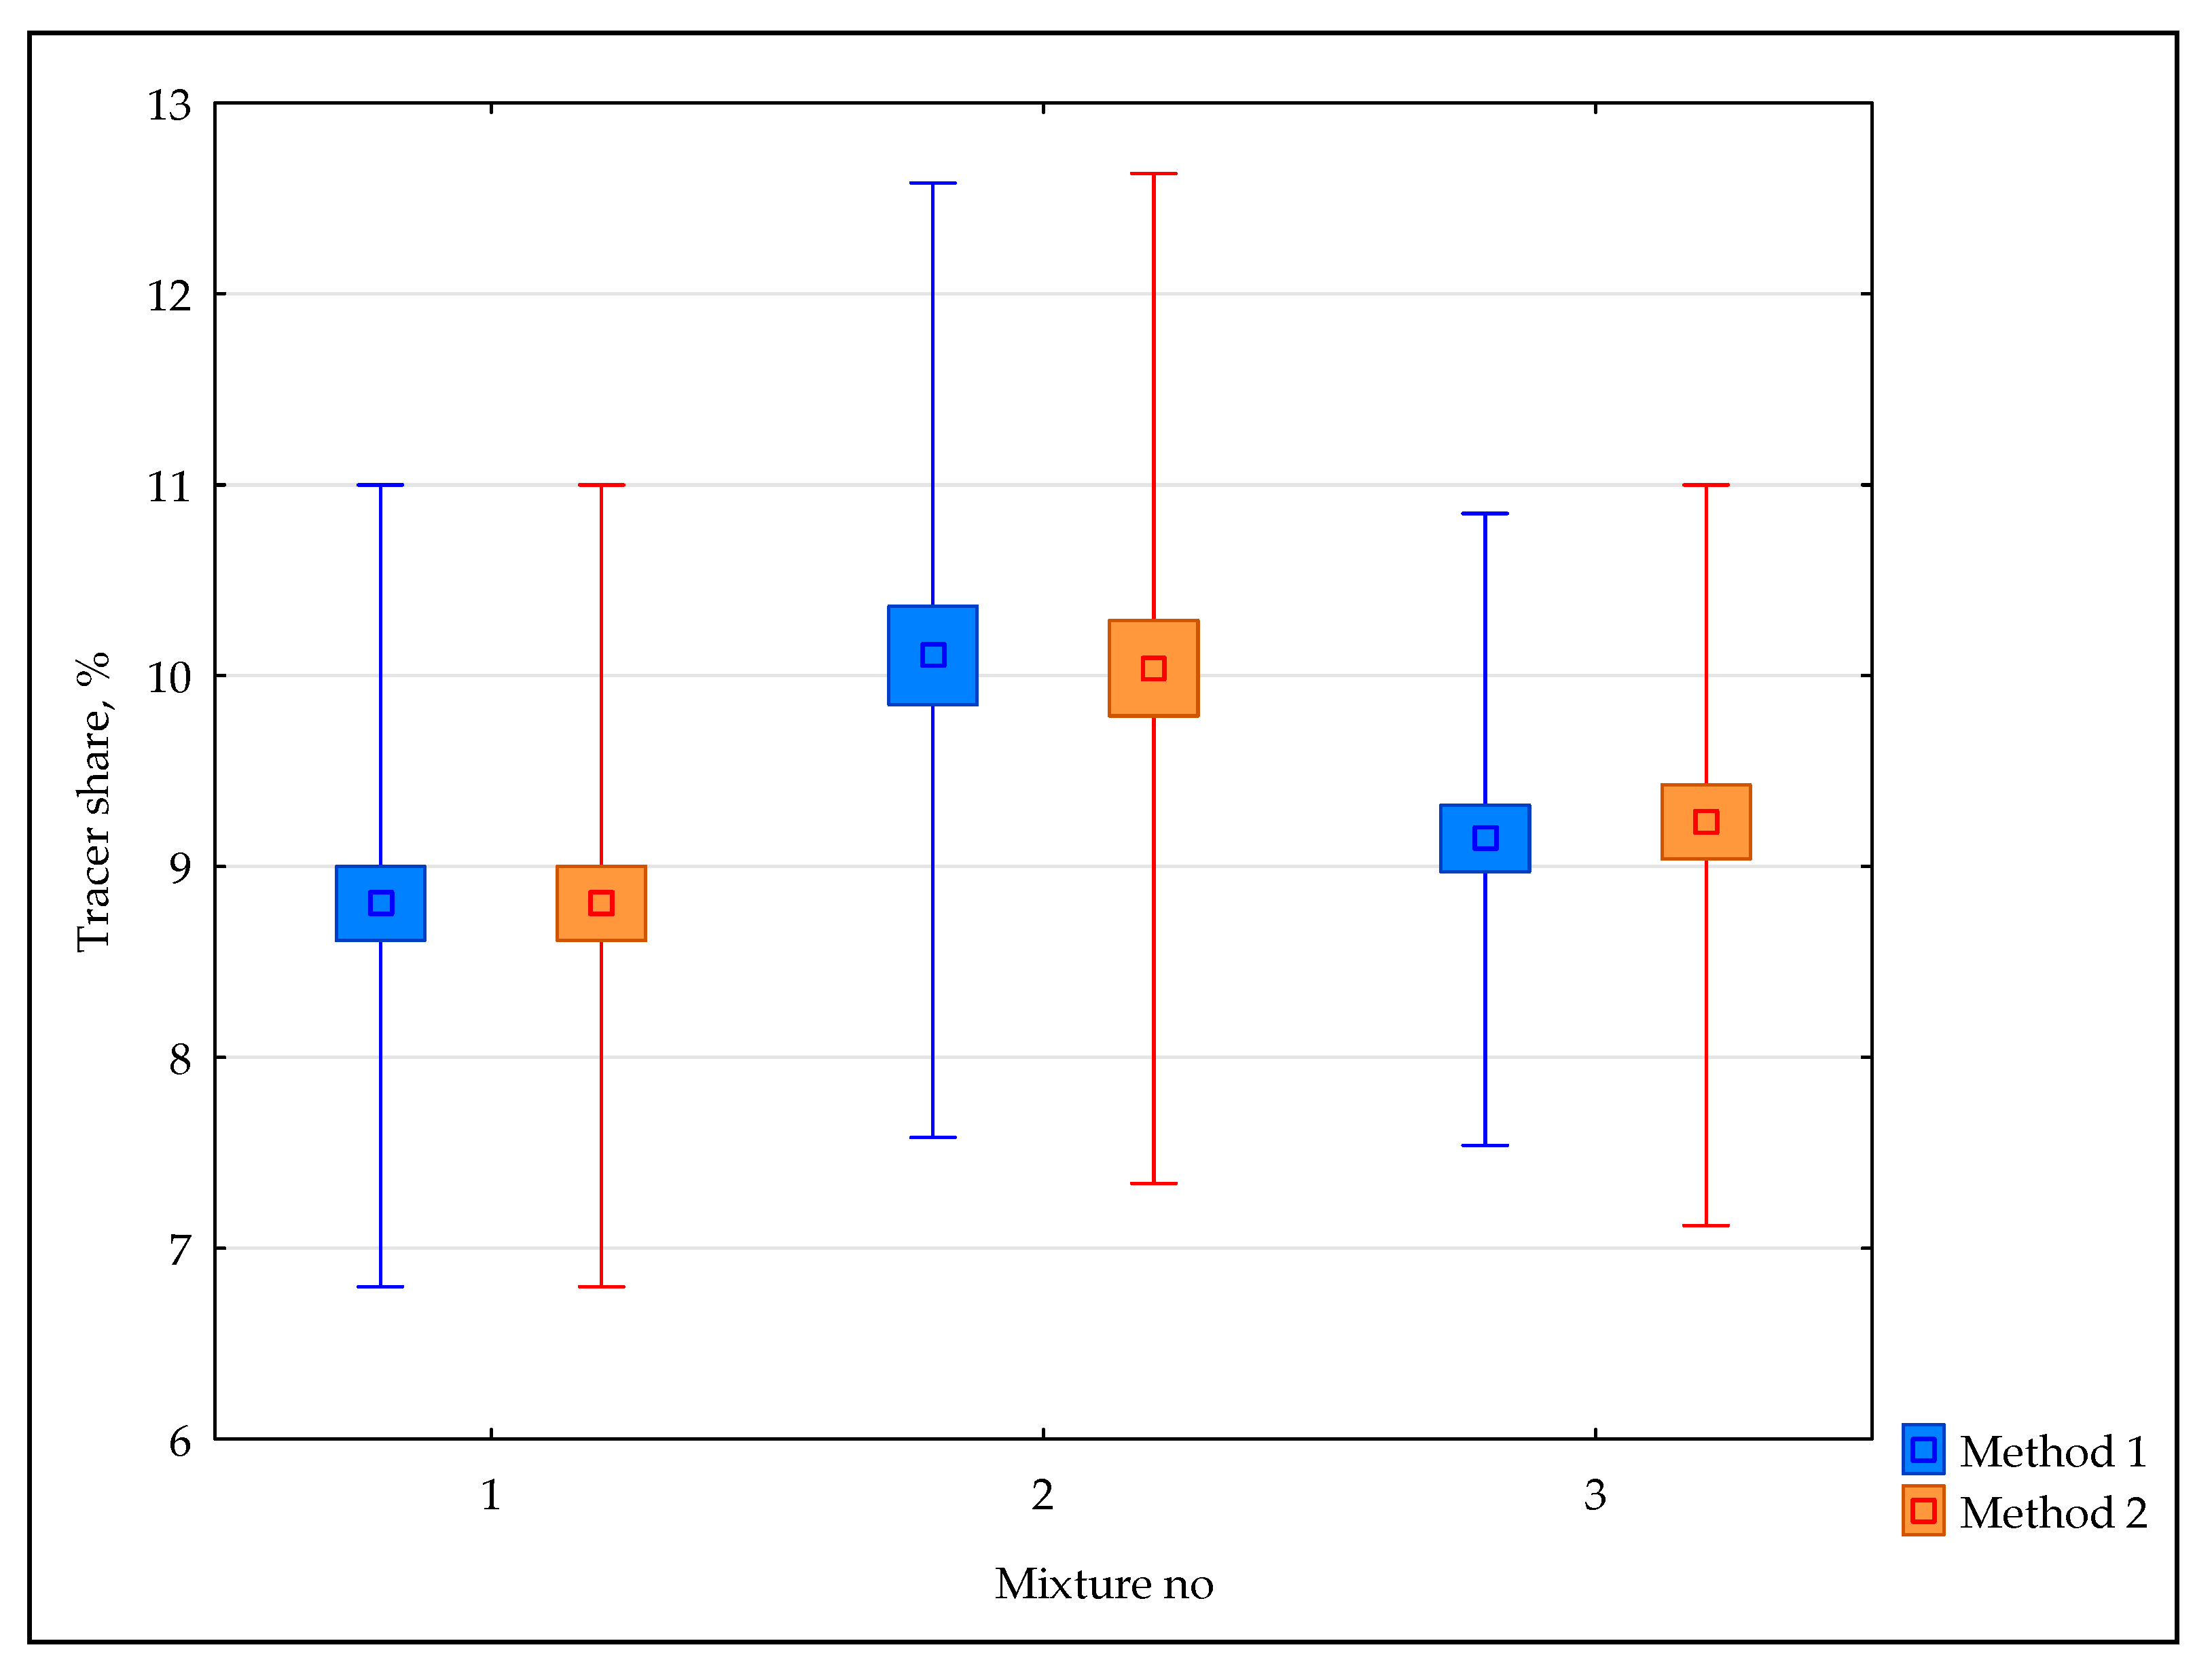
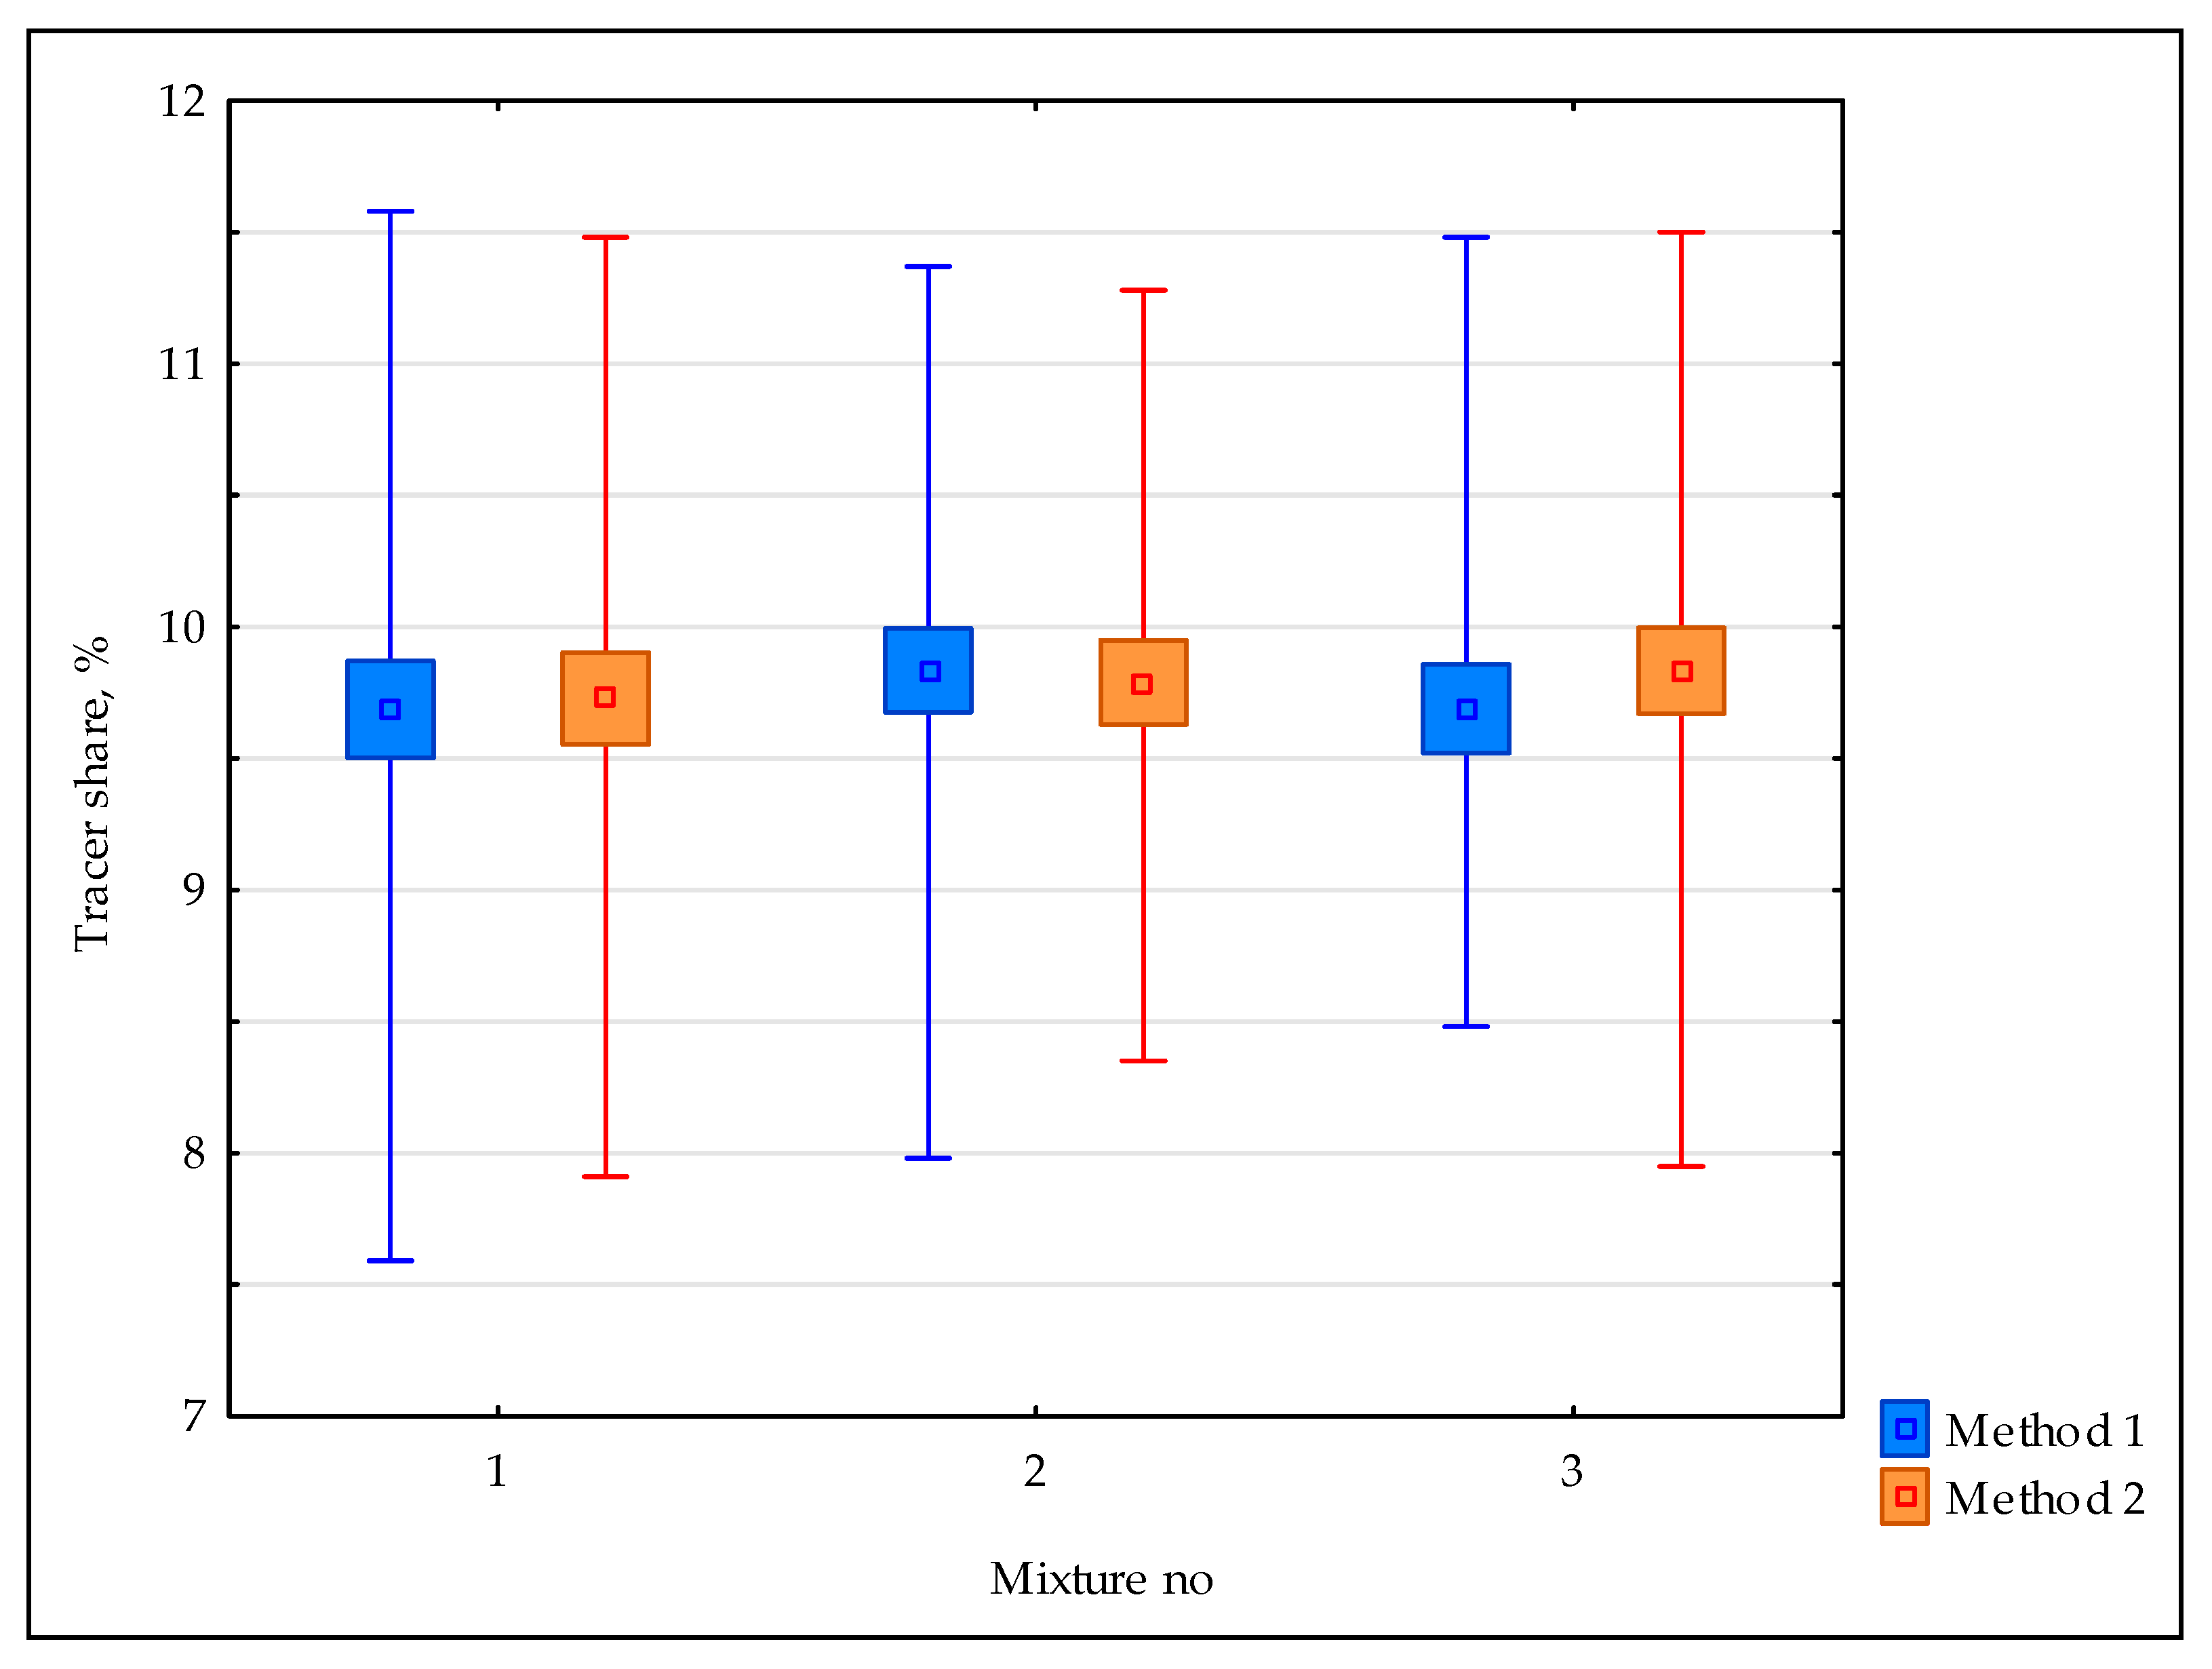
The results obtained (Table 4 and Table 5) do not allow us to reject the zero hypothesis about the lack of statistically significant differences in the results of the tracer’s share obtained with both methods (no significant statistical differences between two methods: image analysis and weighing method). This statement applies to both tests with fluorescent maize with an average particle size of d1 = 2.00 mm and d2 = 1.25 mm. This confirms the preliminary observations presented in Section 3.1. The high similarity of the results obtained by the two methods is also confirmed by the graphical interpretation of statistical analysis (Figure 5 and Figure 6).
4. Discussion
The obtained results confirm the possibility of using fluorescence induced by ultraviolet radiation to analyze the mixing process of multi-component heterogeneous feed mixtures. This method gives highly reliable results compared to the control method (weighing method), which was confirmed by appropriate statistical tests (Student’s t-test and U Mann–Whitney test). It was observed that the differences in the results obtained by the two methods using a tracer with an average particle size of d1 = 2.00 mm are smaller than in the case of a tracer with an average particle size of d2 = 1.25 mm. However, in both cases, statistical comparative analysis did not indicate the significance of these differences. In addition, a mixture with an appropriate level of homogeneity was obtained in each test series.
In the proposed method, the key component (dyed maize with 0.01% Rhodamine B solution) was observed on the basis of computer image analysis (software working on the basis of RGB 256 scale) of particular mixer segments. The special design of the tank made it possible to take significant number (N = 10) of samples and thus to track the tracer distribution in the entire volume of the mixed bed. In addition, the phenomenon of fluorescence induced by ultraviolet radiation was used, which allowed us to eliminate interference during image acquisition. The main disadvantage of computer image analysis in the evaluation of mixing of granular components subjected to the milling process is the covering of the tracer by a loose material [30]. In such a situation, image analysis may give incomplete and unreliable information. The light of the tracer allowed for its “singling out” against a multicolored sample. The disadvantage presented has therefore been eliminated. Another limitation of optical methods in the mixing of granular systems is the necessity to take samples, i.e., to interfere with the mixed bed. The proposed methodology is also based on sampling. This does not explicitly exclude its use to track the tracer’s behavior on line. Of course, this requires careful analysis and testing. It is worth noting, however, that non-invasive methods to characterize grain mixing require more advanced technology and can therefore be more expensive.
The authors have not yet come across a study in which a similar solution has been applied in the evaluation of the mixing of multi-component ground grain systems (degree of fineness M = 0.61–0.64 mm). Most of the studies using image analysis concerned the mixing of two-component systems differing significantly in colour, e.g., white and red balls [4,34,35,36,45,46,47,48]. What is more, the research carried out by the authors made use of feed mixes that are produced in a feed factory and the tracer introduced was one of the components of these mixes. Therefore, the proposed method is more likely to be used under industrial conditions. In the next stage of the research, the authors plan to verify the usefulness of the developed method by conducting tests with additional feed mixes differing in the degree of fineness and composition.
The proposed method uses a well-known computer image analysis tool. However, the use of an additional stage (illuminating the sample with ultraviolet light) allows the elimination of disturbances in the case of multi-component systems subjected to a milling process. What is more, the method allows us to assess the homogeneity of the mixture based on the ingredient used to produce feed, i.e., maize. This is important because of the properties of biologically active materials. Their parameters, such as humidity, brittleness, the ability to agglomerate and many others, can change significantly in response to the conditions of the mixing process. Materials often used by other authors (presented in introduction and discussion chapters) like steel, glass or plastic balls have definitely different properties. As presented in the introduction, slight changes in the parameters of a mixed system or mixer affect the degree of mixing or segregation. The described method is not a tool without limits. This is due to the Rhodamine B coloring agent used. This substance is a chemical reagent that has irritating properties. In laboratory conditions, when applying general precautions, it does not matter much. However, in industrial conditions, the use of this method would require appropriate handling of mixed feed (disposal). Therefore, this method is applicable only in laboratory conditions, for now.
Funding
This research received no external funding.
Conflicts of Interest
The authors declare no conflict of interest.
References
- Neumann, K.D. Work of the Mixer is crucial for additives. Feed Mag. 2000, 10, 371–383. [Google Scholar]
- Tasirin, S.M.; Kamarudin, S.K.; Hweage, A.M.A. Mixing behavior of binary polymer particles in bubbling fluidized bed. J. Phys. Sci. 2008, 19, 13–29. [Google Scholar]
- Jarray, A.; Shi, H.; Scheper, B.J.; Habibi, M.; Luding, S. Cohesion-driven mixing and segregation of dry granular media. Sci. Rep. 2019, 9, 13480. [Google Scholar] [CrossRef] [PubMed] [Green Version]
- Weinekötter, R.; Gericke, H. Mixing of Solids: Particle Technology, 1st ed.; Springer: Berlin, Germany, 2000; ISBN 978-94-015-9580-3. [Google Scholar]
- Cleary, P.W.; Sinnott, M.D. Assessing mixing characteristics of particle-mixing and granulation devices. Particuol. Simul. Modeling Part. Syst. 2008, 6, 419–444. [Google Scholar] [CrossRef]
- Sarkar, A.; Wassgren, C.R. Simulation of a continuous granular mixer: Effect of operating conditions on flow and mixing. Chem. Eng. Sci. 2009, 64, 2672–2682. [Google Scholar] [CrossRef]
- Królczyk, J.B. Metrological changes in the surface morphology of cereal grains in the mixing process. Int. Agrophys. 2016, 30, 193–202. [Google Scholar] [CrossRef] [Green Version]
- Matuszek, D.; Królczyk, J.B. Aspects of safety in production of feeds—A review. Anim. Nutr. Feed Technol. 2017, 17, 367–385. [Google Scholar] [CrossRef]
- Walczyński, S.; Korol, W. Long-term monitoring of homogeneity of compound feed in the government supervision. Krmiva Zagreb 2008, 50, 311–317. [Google Scholar]
- Zawiślak, K.; Sobczak, P.; Wełdycz, A. Mixing as CCP in the production of industrial feed. J. Cent. Eur. Agric. 2012, 13, 554–562. [Google Scholar] [CrossRef] [Green Version]
- Bothe, D. Evaluating the quality of a mixture: Degree of homogeneity and scale of segregation. In Micro and Macro Mixing. Heat and Mass Transfer; Bockhorn, H., Mewes, D., Peukert, W., Warnecke, H.J., Eds.; Springer: Berlin, Germany, 2010; pp. 17–35. [Google Scholar] [CrossRef]
- Liu, P.Y.; Yang, R.Y.; Yu, A.B. Self-diffusion of wet particles in rotating drums. Phys. Fluids 2013, 25, 063301. [Google Scholar] [CrossRef]
- Li, H.; McCarthy, J.J. Controlling Cohesive Particle Mixing and Segregation. Phys. Rev. Lett. 2003, 90, 184301. [Google Scholar] [CrossRef] [PubMed]
- Cegielska-Radziejewska, R.; Stupe, K.; Szablewsk, T. Microflora and mycotoxin contamination in poultry feed mixtures from western Poland. Ann. Agric. Environ. Med. 2013, 20, 30–35. [Google Scholar] [PubMed]
- Sobczak, P.; Zawiślak, Z.; Żukiewicz-Sobczak, W.; Mazur, J.; Nadulski, R.; Kozak, M. The assessment of microbiological purity of selected components of animal feeds and mixtures which underwent thermal processing. J. Cent. Eur. Agric. 2016, 17, 303–314. [Google Scholar] [CrossRef]
- Kwiatek, K.; Kukier, E. Microbiological contamination of animal feed. Vet. Med. 2008, 64, 24–26. [Google Scholar]
- Królczyk, J.; Matuszek, D.; Tukiendorf, M. Modelling of quality changes in a multicomponent granular mixture during mixing. Electon. J. Pol. Agric. Univ. 2010, 13. [Google Scholar]
- Królczyk, J.B. An attempt to predict quality changes in a ten-component granular system. Teh. Vjesn. 2014, 21, 255–261. [Google Scholar]
- Chen, M.; Liu, M.; Li, T.; Tang, Y.; Liu, R.; Wen, Y.; Liu, B.; Shao, Y. A novel mixing index and its application in particle mixing behavior study in multiple-spouted bed. Powder Technol. 2018, 339, 167–181. [Google Scholar] [CrossRef]
- Eisenberg, S.; Eisenberg, D. Closer to perfection. Feed Manag. 1992, 11, 8–20. [Google Scholar]
- Zawiślak, K.; Grochowicz, J.; Sobczak, P. The Analysis of mixing degree of granular products with the use of Microtracers. TEKA Kom. Mot. Energ. Roln. OL Pan 2011, 11, 335–342. [Google Scholar]
- Matuszek, D. The analysis of homogeneity of industrial fodder for cattle. J. Res. Appl. Agric. Eng. 2013, 58, 118–121. [Google Scholar]
- Królczyk, J.B. Industrial conditions of the granular material manufacturing process. App Mech. Mater. 2014, 693, 267–272. [Google Scholar] [CrossRef]
- Królczyk, J.B. Analysis of kinetics of multicomponent, heterogeneous granular mixtures—laminar and turbulent flow approach. Chem. Process. Eng. 2016, 37, 161–173. [Google Scholar] [CrossRef] [Green Version]
- Lai, C.K.; Holt, D.; Leung, J.C.; Cooney, C.L.; Raju, G.K.; Hansen, P. Real time and noninvasive monitoring of dry powder blend homogeneity. AIChE J. 2001, 47, 2618–2622. [Google Scholar] [CrossRef]
- Lai, C.K.; Cooney, C.L. Application of a fluorescence sensor for miniscale on-line monitoring of powder mixing kinetics. J. Pharm. Sci. 2004, 93, 60–70. [Google Scholar] [CrossRef] [PubMed]
- Karumanchi, V.; Taylor, M.K.; Ely, K.J.; Stagner, W.C. Monitoring powder blend homogeneity using light-induced fluorescence. AAPS Pharmscitech. 2011, 12, 1031–1037. [Google Scholar] [CrossRef] [Green Version]
- Durão, P.; Fauteux-Lefebvre, C.; Guay, J.M.; Batzoglou, N.; Gosselin, R. Using multiple process analytical technology probes to monitor multivitamin blends in a tableting feed frame. Talanta 2017, 164, 7–15. [Google Scholar] [CrossRef]
- Necemer, M.; Kump, P.; Rajcevic, M.; Jacimovic, R.; Budic, B.; Ponikvar, M. Determination of sulfur and chlorine in fodder by X-ray fluorescence spectral analysis and comparison with other analytical methods. Spectrochim. Acta 2003, 58, 1367–1373. [Google Scholar] [CrossRef]
- Nadeem, H.; Heindel, T.J. Review of noninvasive methods to characterize granular mixing. Powder Technol. 2018, 332, 331–350. [Google Scholar] [CrossRef] [Green Version]
- Realpe, A.; Barrios, K.; Rozo, M. Assessment of homogenization degree of powder mixing in a cylinder rotating under cascading regime. Int. J. Eng. Technol. 2015, 7, 394–404. [Google Scholar]
- Berthiaux, H.; Mosorov, V.; Tomczak, L.; Gatumel, C.; Demeyre, J.F. Principal component analysis for characterising homogeneity in powder mixing using image processing techniques. Chem. Eng. Process. Process. Intensif. 2006, 45, 397–403. [Google Scholar] [CrossRef] [Green Version]
- Muerza, S.; Berthiaux, H.; Massol-Chaudeur, S.; Thomas, G. A dynamic study of static mixing using on-line image analysis. Powder Technol. 2002, 128, 195–204. [Google Scholar] [CrossRef]
- Dal Grande, F.; Santomaso, A.; Canu, P. Improving local composition measurements of binary mixtures by image analysis. Powder Technol. 2008, 187, 205–213. [Google Scholar] [CrossRef]
- Yang, S.C. Density effect on mixing and segregation processes in a vibrated binary granular mixture. Powder Technol. 2006, 164, 65–74. [Google Scholar] [CrossRef]
- Tai, C.H.; Hsiau, S.S.; Kruelle, C.A. Density segregation in a vertically vibrated granular bed. Powder Technol. 2010, 204, 255–262. [Google Scholar] [CrossRef]
- Hu, G.; Gong, X.; Huang, H.; Li, Y. Effects of geometric parameters and operating conditions on granular flow in a modified rotating cone. Ind. Eng. Chem. Res. 2007, 46, 9263–9268. [Google Scholar] [CrossRef]
- Liu, X.; Gong, J.; Zhang, Z.; Wu, W. An image analysis technique for the particle mixing and heat transfer process in a pan coater. Powder Technol. 2016, 295, 161–166. [Google Scholar] [CrossRef]
- Kingston, T.A.; Heindel, T.J. Granular mixing optimization and the influence of operating conditions in a double screw mixer. Powder Technol. 2014, 266, 144–155. [Google Scholar] [CrossRef]
- Matuszek, D.; Wojtkiewicz, K. Application of fluorescent markers for homogeneity assessment of grain mixtures based on maize content. Chem. Process. Eng.-Inz. 2017, 38, 505–512. [Google Scholar] [CrossRef]
- Matuszek, D.; Biłos, Ł. Use of fluorescent tracers for the assessment of the homogeneity of multicomponent granular feed mixtures. Przem. Chem. 2017, 96, 2356–2359. [Google Scholar] [CrossRef]
- Matuszek, B.D. The use of UV-induced fluorescence for the assessment of homogeneity of granular mixtures. Open Chem. 2019, 17, 485–491. [Google Scholar] [CrossRef]
- Matuszek, D. Modelling selected parameters of granular elements in the mixing process. Int. Agrophys. 2015, 29, 75–81. [Google Scholar] [CrossRef]
- Kwiatek, K.; Przeniosło-Siwczyńska, M. Instructions for Testing the Homogeneity of Medicated Feeds and Intermediate Products on the Basis of Testing the Degree of Mixing of the Active Substance; Państwowy Instytut Weterynaryjny: Puławy, Poland, 2007. [Google Scholar]
- Weinekötter, R.; Reh, L. Characterization of particulate mixtures by in-line measurments. Part. Part. Syst. Char. 1994, 11, 284–290. [Google Scholar] [CrossRef]
- Boss, J.; Krótkiewicz, M.; Tukiendorf, M. The application of picture analysis as a method to evaluate the quality of granular mixture during funnel-flow mixing. Agric. Eng. 2002, 4, 27–32. [Google Scholar]
- Arratia, P.E.; Duong, N.H.; Muzzio, F.J.; Godpole, P.; Lange, A.; Reynolds, S. Characterizing mixing and lubrication in the Bohle bin blender. Powder Technol. 2006, 161, 202–208. [Google Scholar] [CrossRef]
- Brone, D.; Muzzio, F.J. Enhanced mixing in double-cone blenders. Powder Technol. 2010, 110, 179–189. [Google Scholar] [CrossRef]
Figure 1.
Schematic diagram of the methodology for the determination of fluorescent maize in the feed.
Figure 1.
Schematic diagram of the methodology for the determination of fluorescent maize in the feed.

Figure 2.
Results of the tracer’s share (2.0 mm maize) in individual samples obtained by two methods for three compound feed mixes.
Figure 2.
Results of the tracer’s share (2.0 mm maize) in individual samples obtained by two methods for three compound feed mixes.

Figure 3.
Results of the tracer’s share (1.25 mm maize) in individual samples obtained by two methods for three compound feed mixes.
Figure 3.
Results of the tracer’s share (1.25 mm maize) in individual samples obtained by two methods for three compound feed mixes.

Figure 4.
Box plot graph (mean, standard error, min-max) of the difference between the results obtained by the two methods for the mean tracer dimension d1 = 2.00 mm and d2 = 1.25 mm.
Figure 4.
Box plot graph (mean, standard error, min-max) of the difference between the results obtained by the two methods for the mean tracer dimension d1 = 2.00 mm and d2 = 1.25 mm.

Figure 5.
Box plot graph of the share of the tracer (maize d = 2.0 mm) obtained by two methods for the three analysed mixtures. Point: average, box: average ± standard error, whiskers: min-max.
Figure 5.
Box plot graph of the share of the tracer (maize d = 2.0 mm) obtained by two methods for the three analysed mixtures. Point: average, box: average ± standard error, whiskers: min-max.

Figure 6.
Box plot graph of the share of the tracer (maize d = 1.25 mm) obtained by two methods for the three analysed mixtures. Point: average, box: average ± standard error, whiskers: min-max.
Figure 6.
Box plot graph of the share of the tracer (maize d = 1.25 mm) obtained by two methods for the three analysed mixtures. Point: average, box: average ± standard error, whiskers: min-max.


Table 1.
Characteristics of the tested feed mixture.
| Type of Component | Percentage of Component [%] | ||
|---|---|---|---|
| Mixture 1 | Mixture 2 | Mixture 3 | |
| Fodder chalk | 9 | 1.5 | 7.1 |
| Barley | - | 30 | - |
| Maize | 8 | 9 | 7 |
| Triticale | - | 20 | - |
| Wheat | - | 20 | - |
| Soya meal | 65.55 | 12 | 72 |
| Rape meal | - | 5 | - |
| Dry maize decoction | 5.45 | - | 4.3 |
| Sodium chloride | 2.5 | 0.5 | 2 |
| Phosphate | 3.5 | 1 | 2.8 |
| Premix | 2.5 | 1 | 2 |
| Lysine | 2.5 | - | 1.8 |
| Methionine | 0.5 | - | 0.4 |
| Threonine | 0.35 | - | 0.3 |
| Phytase | 0.05 | - | 0.05 |
| Grindazyn | 0.05 | - | 0.05 |
| Luctarom (aroma) | 0.05 | - | 0.05 |
| Neubaciol | - | - | 0.15 |
| Number of components | 13 | 10 | 14 |
| Fineness degree M [mm] | 0.64 | 0.61 | 0.63 |
Table 2.
Results of the tracer’s share (maize d = 2.00 mm).
| Series of Tests | Method 1 1 | Method 2 2 | Difference 3 |
|---|---|---|---|
| Mixture 1 | |||
| 1 | 8.00 ± 0.88 | 8.12 ± 0.94 | 0.30 ± 0.20 |
| 2 | 9.04 ± 0.79 | 9.05 ± 0.73 | 0.33 ± 0.18 |
| 3 | 8.98 ± 1.14 | 9.25 ± 1.06 | 0.41 ± 0.17 |
| mean, % | 8.67 ± 1.08 | 8.81 ± 1.06 | 0.34 ± 0.19 |
| CV, % | 10.83 ± 1.62 | 10.37 ± 1.66 | 0.55 ± 0.09 |
| Mixture 2 | |||
| 1 | 10.04 ± 1.20 | 10.03 ± 1.21 | 0.27 ± 0.17 |
| 2 | 10.38 ± 1.59 | 10.24 ± 1.58 | 0.26 ± 0.07 |
| 3 | 9.90 ± 1.27 | 9.85 ± 1.18 | 0.26 ± 0.09 |
| mean, % | 10.10 ± 1.41 | 10.04 ± 1.37 | 0.26 ± 0.12 |
| CV, % | 13.46 ± 1.32 | 13.17 ± 1.60 | 0.41 ± 0.16 |
| Mixture 3 | |||
| 1 | 9.34 ± 0.93 | 9.51 ± 1.04 | 0.41 ± 0.23 |
| 2 | 8.66 ± 0.92 | 8.84 ± 1.05 | 0.43 ± 0.23 |
| 3 | 9.45 ± 0.76 | 9.35 ± 0.91 | 0.29 ± 0.16 |
| mean, % | 9.15 ± 0.96 | 9.23 ± 1.06 | 0.38 ± 0.22 |
| CV, % | 9.55 ± 1.10 | 10.87 ± 0.87 | 0.56 ± 0.01 |
1 arithmetic mean of the tracer’s share obtained by computer image analysis ± standard deviation; 2 arithmetic mean of the tracer’s share obtained by weighing ± standard deviation; 3 difference of results obtained by two methods ± standard deviation.
Table 3.
Results of the tracer’s share (maize d = 1.25 mm).
| Series of Tests | Method 1 1 | Method 2 2 | Difference 3 |
|---|---|---|---|
| Mixture 1 | |||
| 1 | 9.13 ± 0.87 | 9.37 ± 0.78 | 0.53 ± 0.20 |
| 2 | 9.49 ± 0.93 | 9.42 ± 0.96 | 052 ± 0.30 |
| 3 | 8.94 ± 1.09 | 8.89 ± 0.97 | 0.44 ± 0.17 |
| mean, % | 9.18 ± 1.01 | 9.23 ± 0.96 | 0.50 ± 0.23 |
| CV, % | 10.50 ± 1.19 | 9.83 ± 1.07 | 0.44 ± 0.09 |
| Mixture 2 | |||
| 1 | 9.39 ± 0.76 | 9.13 ± 0.79 | 0.38 ± 0.26 |
| 2 | 9.22 ± 0.75 | 9.21 ± 0.84 | 0.42 ± 0.26 |
| 3 | 9.56 ± 0.81 | 9.53 ± 0.89 | 0.33 ± 0.14 |
| mean, % | 9.39 ± 0.80 | 9.29 ± 0.87 | 0.38 ± 0.23 |
| CV, % | 8.25 ± 0.16 | 9.04 ± 0.28 | 0.58 ± 0.11 |
| Mixture 3 | |||
| 1 | 9.35 ± 0.75 | 9.61 ± 0.85 | 0.62 ± 0.26 |
| 2 | 9.09 ± 1.02 | 9.21 ± 0.94 | 0.64 ± 0.26 |
| 3 | 9.13 ± 0.92 | 9.19 ± 0.77 | 0.50 ± 0.25 |
| mean, % | 9.19 ± 0.92 | 9.33 ± 0.89 | 0.59 ± 0.30 |
| CV, % | 9.75 ± 1.33 | 9.15 ± 0.76 | 0.49 ± 0.06 |
1 arithmetic mean of the tracer’s share obtained by computer image analysis ± standard deviation; 2 arithmetic mean of the tracer’s share obtained by weighing ± standard deviation; 3 difference of results obtained by two methods ± standard deviation.
Table 4.
Results of statistical comparative analysis (Student’s t-test) of the results obtained by the two methods using the tracer d1 = 2.00 mm.
Table 4.
Results of statistical comparative analysis (Student’s t-test) of the results obtained by the two methods using the tracer d1 = 2.00 mm.
| Mixture No. | t | p |
|---|---|---|
| 1 | −0.49398 | 0.62318 |
| 2 | 0.18586 | 0.85320 |
| 3 | −0.33460 | 0.73913 |
Table 5.
Results of statistical comparative analysis (Student’s t-test and U Mann-Whitney’s test) of the results obtained by the two methods using the tracer d2 = 1.25 mm.
Table 5.
Results of statistical comparative analysis (Student’s t-test and U Mann-Whitney’s test) of the results obtained by the two methods using the tracer d2 = 1.25 mm.
| Mixture No. | Statistical Test Result | p |
|---|---|---|
| 1 1 | −0.16586 | 0.86884 |
| 22 | 0.34004 | 0.73383 |
| 3 2 | −0.73183 | 0.46427 |
1 parametric Student’s t-test. Normal distribution of variables, homogeneity of variance; 2 non-parametric U Mann-Whitney test. No normal distribution of variables, homogeneity of variance.
© 2020 by the author. Licensee MDPI, Basel, Switzerland. This article is an open access article distributed under the terms and conditions of the Creative Commons Attribution (CC BY) license (http://creativecommons.org/licenses/by/4.0/).
Share and Cite
MDPI and ACS Style
Matuszek, D.B. Ultraviolet Fluorescence in the Assessment of Quality in the Mixing of Granular Material. Sustainability 2020, 12, 1546. https://0-doi-org.brum.beds.ac.uk/10.3390/su12041546
AMA Style
Matuszek DB. Ultraviolet Fluorescence in the Assessment of Quality in the Mixing of Granular Material. Sustainability. 2020; 12(4):1546. https://0-doi-org.brum.beds.ac.uk/10.3390/su12041546
Chicago/Turabian StyleMatuszek, Dominika Barbara. 2020. "Ultraviolet Fluorescence in the Assessment of Quality in the Mixing of Granular Material" Sustainability 12, no. 4: 1546. https://0-doi-org.brum.beds.ac.uk/10.3390/su12041546
Note that from the first issue of 2016, this journal uses article numbers instead of page numbers. See further details here.