Experimental Analysis of a Novel PV/T Panel with PCM and Heat Pipes
by
 , , and
David González-Peña
1,* ,
,
Iván Alonso-deMiguel
2,
Montserrat Díez-Mediavilla
1 and
Cristina Alonso-Tristán
1
1
Research Group Solar and Wind Feasibility Technologies (SWIFT), Electromechanical Engineering Department, Universidad de Burgos, 09001 Burgos, Spain
2
Department of Physics, Universitat de les Illes Balears, 07122 Palma, Spain
*
Author to whom correspondence should be addressed.
Sustainability 2020, 12(5), 1710; https://0-doi-org.brum.beds.ac.uk/10.3390/su12051710
Submission received: 21 January 2020
/
Revised: 20 February 2020
/
Accepted: 24 February 2020
/
Published: 25 February 2020
(This article belongs to the Special Issue Design and Management of Sustainable Products, Industrial and Manufacturing Systems)
Abstract
:A new design for the use of photovoltaic and thermal (PV/T) technology with thermal storage is reported in this work. In the new design, a phase change material (PCM) tank is added to the backside of the photovoltaic panel. The advantages of this design are the storage of thermal energy and the efficiency improvement of the photovoltaic (PV) panel as a result of the temperature control of the PV cell during the phase change process. In addition, a perimeter with a black surface surrounds the PV panel to increase the absorption of thermal energy. The thermal energy is then transferred to the backside of the PCM tank by heat pipes. One prototype with lauric acid as PCM was tested under two different operating configurations and resulted in an overall daily efficiency of 50% coulding be improve by controlling the PCM temperature during the day.
1. Introduction
The environmental commitments that the signatory countries to the Paris agreement [1] have agreed to fulfill, make it essential to reduce greenhouse gas emissions and energy consumption drastically and to incorporate renewable energies as the main source of energy supply.
Solar energy is, together with wind energy, the most abundant renewable energy resource on the planet. It can be used either through direct conversion into electricity, by photovoltaic (PV) panels, or in the form of heat, by thermal collectors. Photovoltaic and thermal (PV/T) technology, has been incorporated into conventional PV and thermal solar collectors, thereby combining in a single collector the possibility of generating both electricity and hot fluids.
Most of the incident solar energy on a PV panel is converted into heat. This process produces an increase in the temperature of the PV cell which decreases its efficiency and durability [2]. Therefore, one easy way to increase the energy generated by a PV panel is by taking advantage of that residual heat, which can reduce the temperature of the cells. PV/T technology achieves higher global energy efficiency, since the PV energy and thermal energy generated are combined, reaching values of approximately 65% [3]. In addition, PV/T panels reduce the physical space and the use of installation supports that are required. Its integration in what is known as a building integrated photovoltaic and thermal (BIPV/T) system into façades and roofs provides architectural uniformity and reduces the thermal load of buildings.
2. Review of PV/T Technology
The first hybrid solar panels, developed in the early 1980s [4], were based on flat solar collectors. Those PV/T panels incorporated a thermal collector on their backside that was formed by tubes through which a fluid was warmed with the heat of the PV panel. Therefore, it is possible to cool the photovoltaic cells with their consequent increase in efficiency. Over the last few years, this initial design has been improved and adapted to other needs, so much so that numerous types of panel design can now be found in the literature.
The most widespread PV/T type is the flat collector that uses air or water as a coolant. New designs use refrigerant fluids like R134a [5], R410a [6]. Additionally, some PV/T designs use nanofluids that can improve thermal properties, achieving very good operating results [7,8], although the cost of those materials has increased. Air-cooled PV/T panels are the simplest construction design. The design features a single channel either on the back or on the front of the panel, which is used to heat air from the interior or exterior of a house. Those collectors usually use fins, due to low air thermal conductivity, to increase the heat-exchange surface [9], which is usually in contact with the back of the cells [10]. Air PV/T panels are also larger and noisier. Liquid PV/T panels, typically liquid water, are more widely developed and are even found in commercial and private systems, for the reasons stated above, and because of their high efficiency and their similarities to conventional solar thermal panels, [11]. These panels are also compatible with typical solar thermal energy installations and can be easily used in domestic applications.
A fundamental aspect in its operation is the geometry of the pipe through which the fluid is pumped. There are different alternatives proposed in literature: circular [12], rectangular [13], oval [14], trapezium, and semicircular [15]. In the case of conventional circular tube, the contact surface between the tube and the flat hot PV surface is small, but also drop in pressure is minimized. On the other hand, rectangular tubes increase the contact surface, but also increase the pressure drop in the fluid. In general, circular geometry is easier to build and is used more than any other in PV/T panels [11]. Improvements to panel absorption have been studied through the influence of such parameters as diameter, tube separation, and varied materials [16].
PV modules convert solar radiation into electrical energy with typical efficiency rates of between 5% and 20%. The absorber plays a dual role: it increases the efficiency of the photovoltaic conversion, since it cools the cell, and collects the thermal energy that can be used for other uses, typically low temperature applications such as domestic hot water (DHW) and air conditioning. Classic PV/T panel systems are expected to have a constant fluid flow during most hours of sunlight. Their low thermal inertia causes rapid panel temperature variations whenever solar radiation or wind speeds change.
These systems are likely to be improved by introducing thermal storage using phase change Materials (PCM) [3,17]. If the thermal storage system is coupled directly to the back of the panel, the thermal inertia of the assembly is increased, controlling and homogenizing the temperatures during its operation, and storing much of the heat that the panel generates during the day [18].
An important aspect of the PV/T panels is the utility of the heat, which is higher as the fluid temperature increases. However, operating at high temperature will reduce PV performance and heat loss to the atmosphere will increase. The solution proposed by some authors, such as Yuan et al. [19], is the use of PCM systems to increase the thermal inertia of the panel. In this way, the system will maintain a more uniform temperature during operation even under changing solar conditions, without keeping the fluid flow during the day. The heat in these systems is stored as latent heat during the phase change process. The possibility of selecting the type of PCM [20] allows, a priori, adjustments to the operating temperature of the PV panel. Yang et al. [21] compare fatty acid PCMs with different melting point in a PV/T panel, where the best results were shown when using PCM with a melting point of 30.1 . Although lower global efficiency of the panel is achieved when using low temperature PCM, the fluid temperature is higher, and also its utility, when using PCM with higher melting point, as shown in the real test done by Fayaz et al. [22] to a PV/T Paraffin RC44 as PCM. Most works suggest the use of PCM to increase the thermal inertia of the panel, but the PV/T panel operates like a conventional PV/T without PCM.
The implementation of a PCM in a PV/T can be also used as a local thermal energy storage. Xu et al. [23] analyze the performance of a PV/T panel with a fatty acid 37 PCM that the heat is only extracted when the PCM is completely melted and has reached a limit temperature. The efficiency of this operating configuration does not considerably affect to the global efficiency of the panel, reaching a maximum value of 91%.
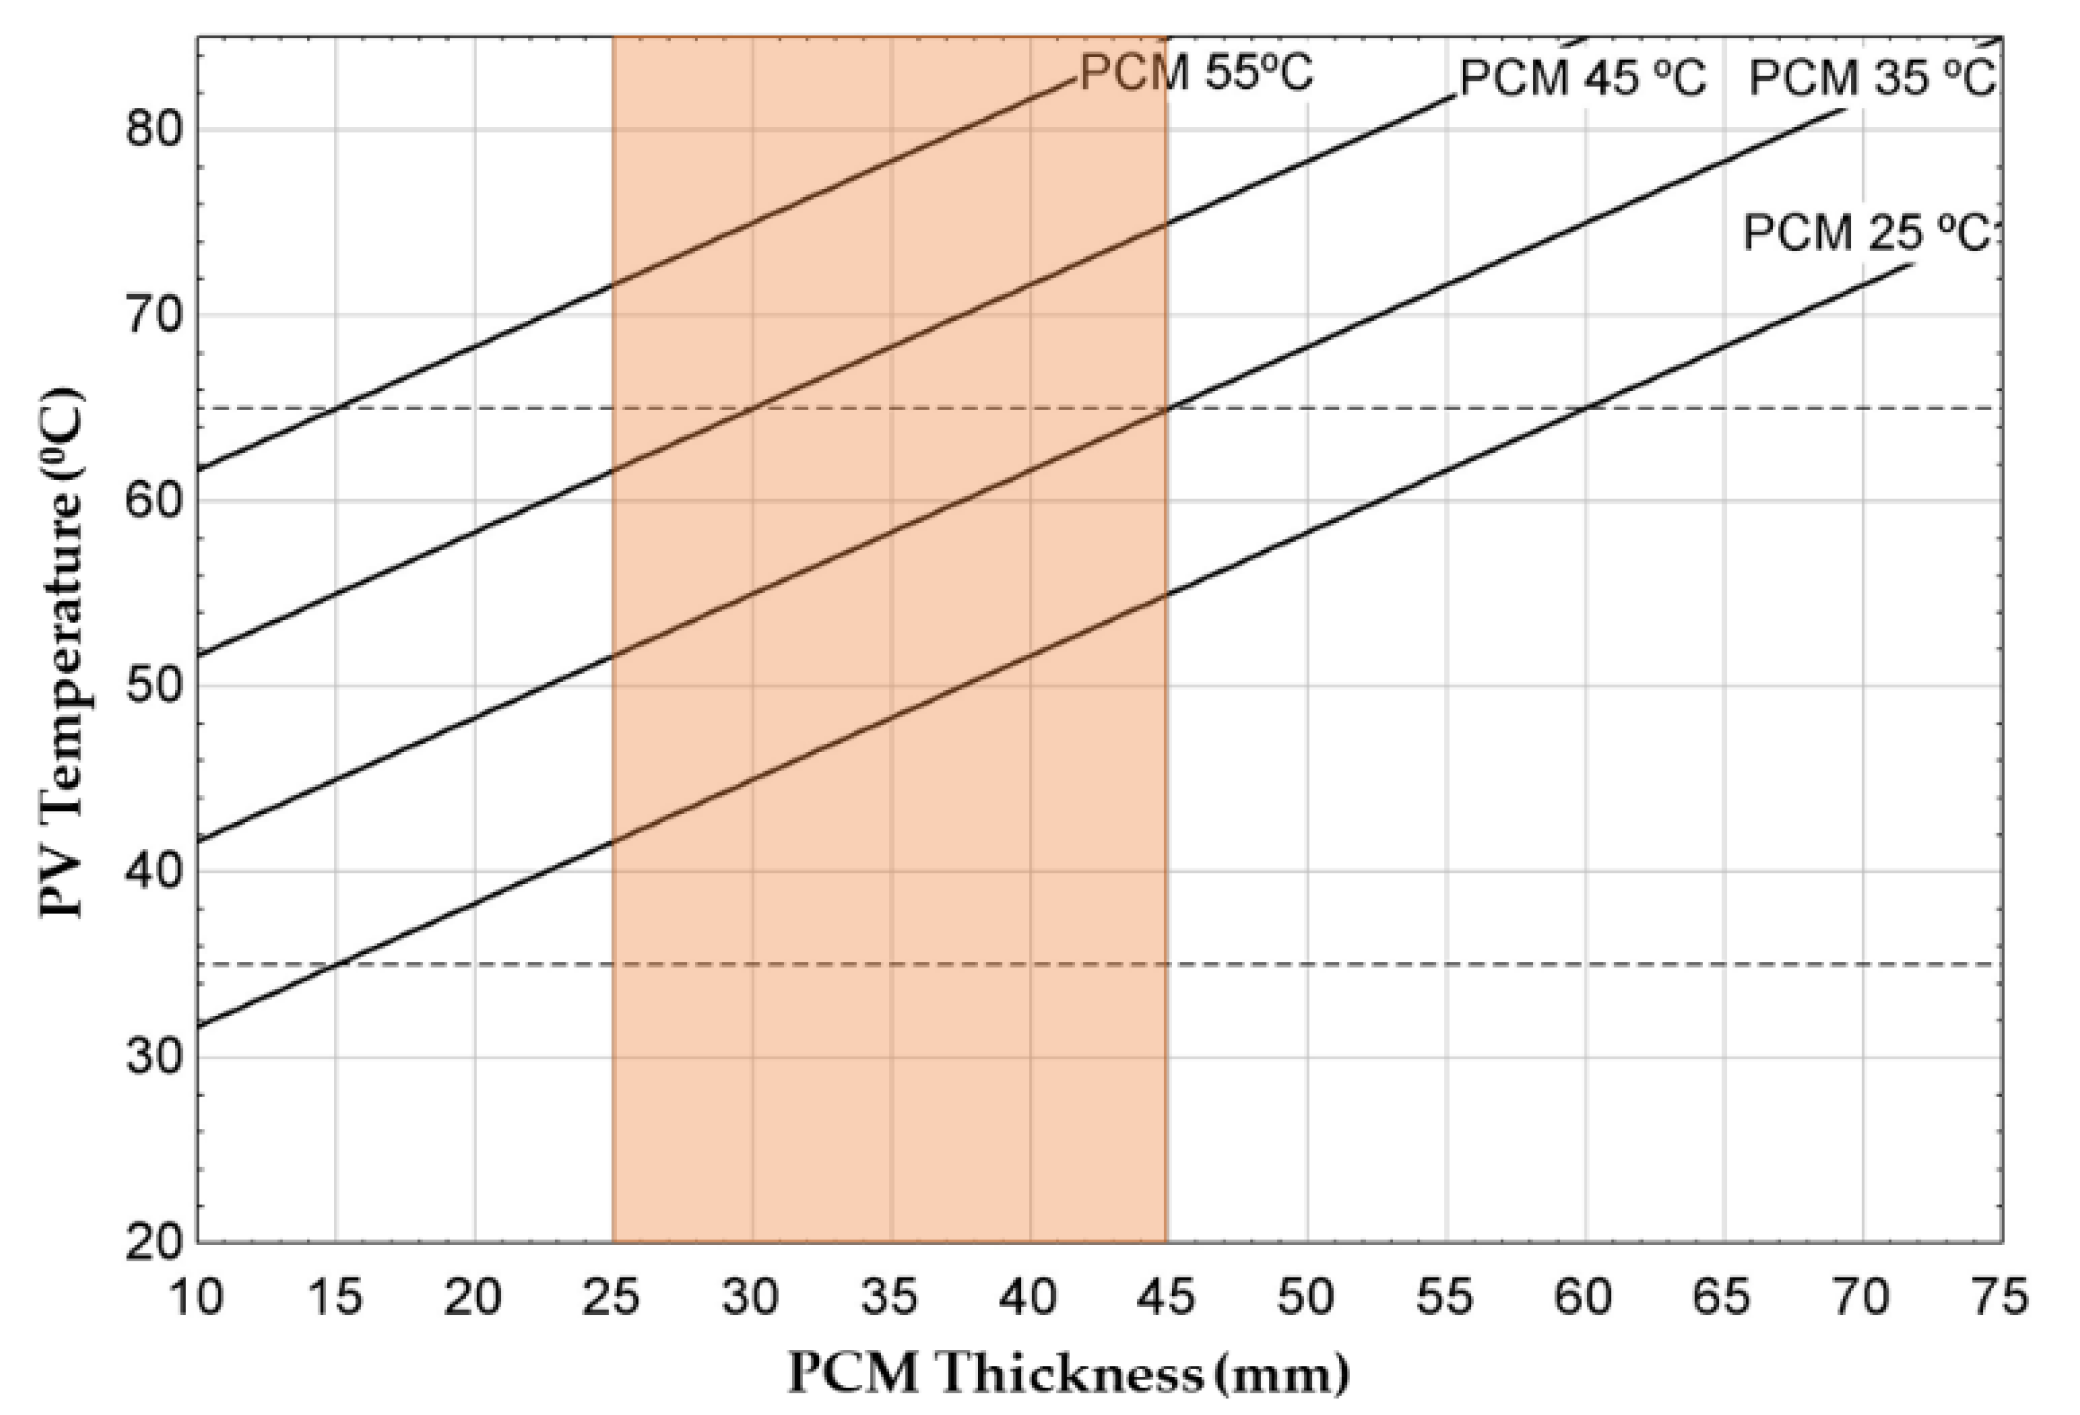
The low thermal conductivity of a PCM prohibits the use of large thicknesses. Studies conducted on PCM thickness indicate thicknesses of 30 mm as a useful limit value [24]. Figure 1 shows the variation in the temperature of the PV panel with a PCM of variable thickness or melting point, considering the solid-state thermal conduction of the PCM, and assuming one-dimensional conduction, according to Fourier’s Law (1).
where, k is the thermal conductivity ; is the density of heat flux ; L is the PCM thickness ; and, is the temperature difference between the PCM and the surface of the photovoltaic panel .
For this reason, the selection of the type of PCM is complex and very important to ensure optimal operation of the PV module. The optimum temperature range of the PCM for use in PV/T is between 30–45. In the literature, it is possible to find different studies trying to improve the low thermal conductivity of PCMs [25]. Finned systems are one solution, as they are a simple, low-cost, and efficient option. In some works, the optimization of fin geometry, separation, and construction material have been studied [25,26]. More recently, the use of PCM that incorporates nanoparticles that improve thermal properties have begun [27,28]. However, some sedimentation or degradation problems were also identified.
In this study, a flat PV/T panel design will be described, where heat pipes (HP) are incorporated as a heat transfer element to the PCM. The HP has a quick heat transfer function between each end with small temperature gradients. Internally, the fluid is vaporized and moved to the cold zone, where it condenses, releasing heat. The displacement of steam is very fast, making HPs a good option for heat transfer by passive systems. In addition, these elements can be adapted to the geometry of the system, which simplifies the design.
3. Design and Construction of the Proposed PV/T Panel
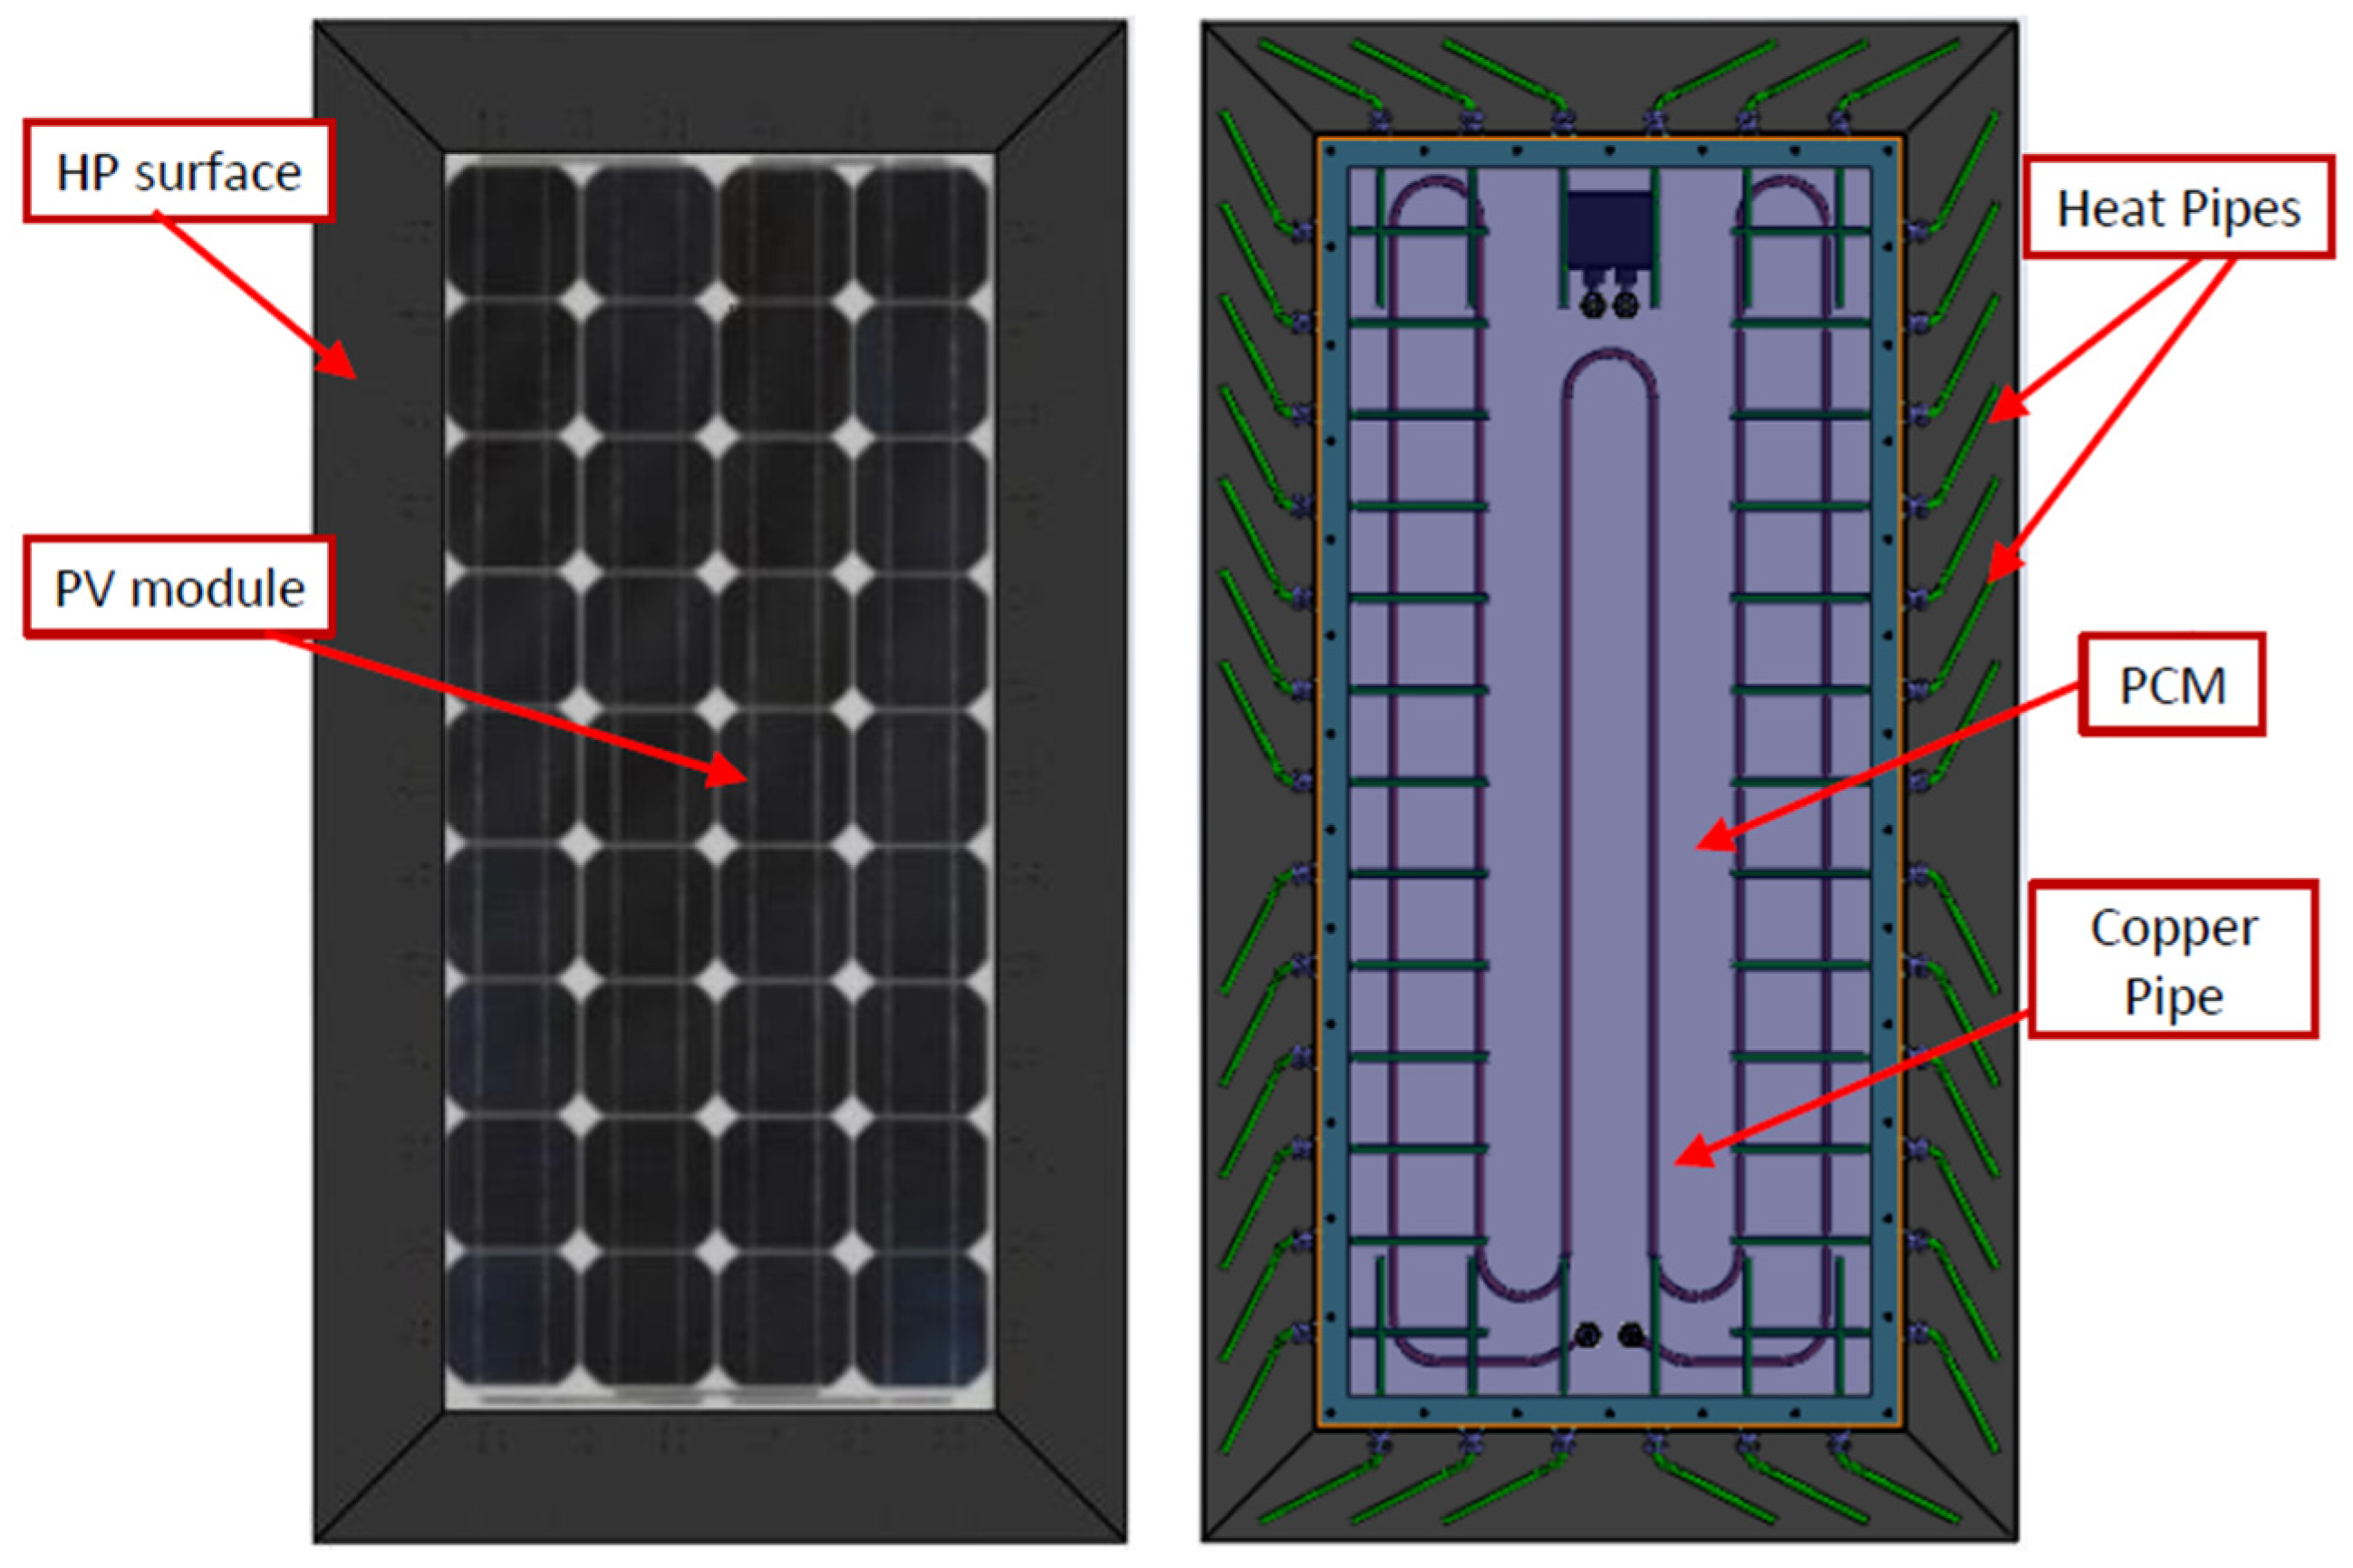
The main function of hybrid solar technology is to take advantage of the solar energy absorbed by the PV panel that is not transformed into electricity. In this new design, a solution to heat storage in a PV/T panel with PCM is proposed. To do so, heat pipes are incorporated to transfer the heat absorbed to the deepest part of the PCM from the front side of the panel. Therefore, the PCM can be heated from two zones. In one zone, the PV panel transfers heat from its backside while, in the other zone, the HP passes its heat to within a deep area of PCM. This improves the quantity of molten PCM without significantly increasing the temperature of the PV panel. Unlike other panels with PCM, the heat transferred by the HP is absorbed into an added dark perimeter on the panel surface, which acts solely as a thermal absorption area. A design scheme is shown in Figure 2. With this design, it is possible to adjust the heat/electricity ratio that is generated, thereby adapting the panel technology to the needs of the installation.
The panel described in this work has four different elements: PV panel, PCM, heat pipes, and thermal collector. The starting point is a conventional flat photovoltaic panel, which simplifies the construction and can be adapted to any type of standard geometry. This element is responsible for absorbing solar radiation and generating electricity. The PCM attached to the back can therefore be used to control panel temperatures and store heat during daylight hours, that in this design, can be increased over 30 mm, due to better heat transfer.
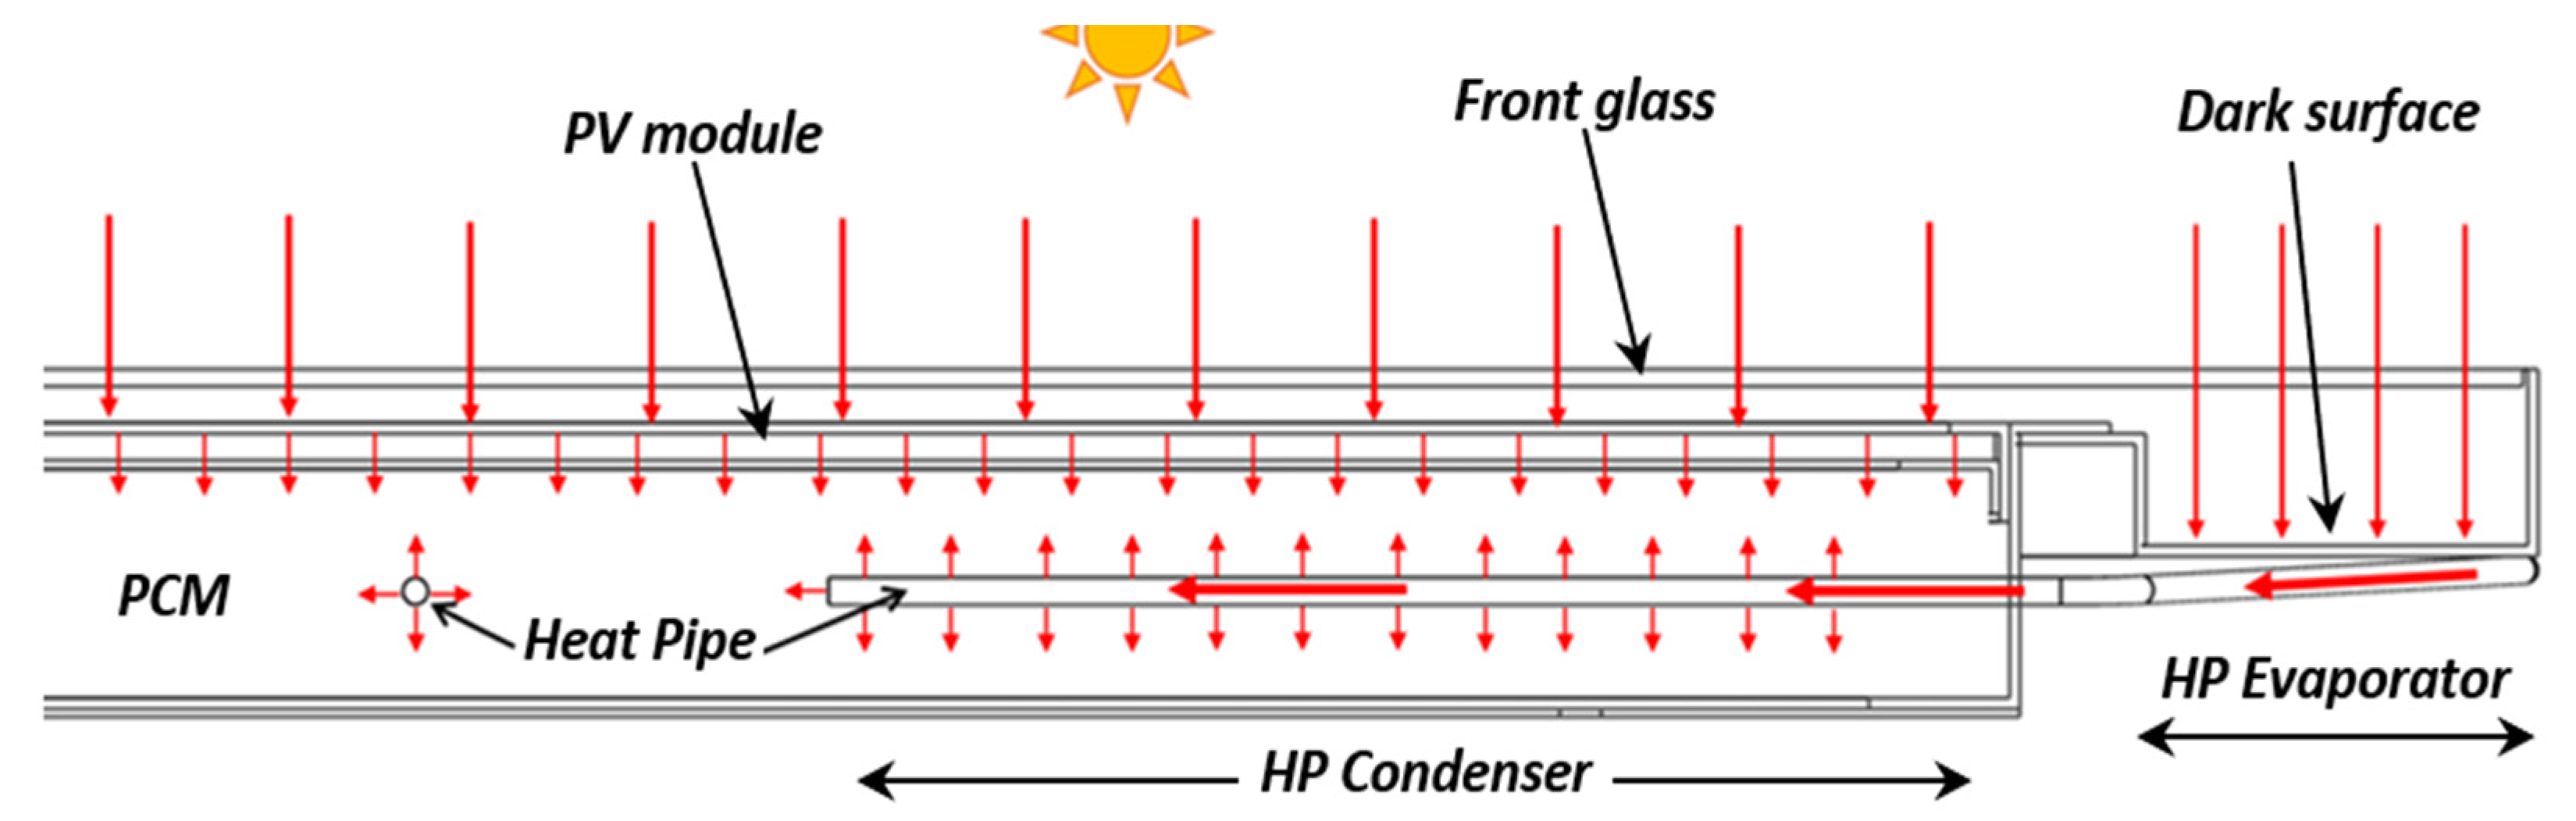
These elements are arranged in contact with the black perimeter of the panel surface where they absorb heat and transfer it to the PCM. The working temperature of the HP can be slightly higher than that of the PV panel, as they are at a slight distance from the PV and will not produce a temperature increase in the PV cells until all the PCM is molten. Energy will only be stored as sensible heat when there is an increase in the PCM temperature. The operating scheme can be seen in Figure 3, where the heat flux to the PCM, that takes place in the proposed design, is schematized.
The last element of the design is the thermal collector. This element is a copper tube fitted inside the PCM. Its function is to remove the heat that is stored during the day for delayed use. A fluid (water) circulates through it to be heated. The collector can have a grid or a coil shaped distribution. The main difference between them, when using the same fluid flow, is that, in the first case, the pressure drop is lower, but also the increase of the fluid temperature. Depending on the final thickness of PCM included in the panel, the collector must be designed at one or several levels, in order to limit the distance between the hot PCM and the tube, in order to improve the heat transfer process.
It should also be considered that, due to the storage of heat in the panel, greater insulation of the assembly is required to reduce heat losses. Higher heat losses are generated on the front surface of the PV panel, an element that cannot be insulated with conventional systems, as sunlight has to reach the PV cells so it must be transparent. In this design, a small layer of air, or an inert gas, will give some thermal insulation to the front surface and sufficient solar radiation will pass through it. This layer of air is entrapped with an additional front glass separated, at 10–15 , from the PV panel glass.
3.1. Advantages and Disadvantages of the Design
In addition to the improvement in both the PCM heating process and the effective volume of PCM that will be placed on the panel, the design has other advantages that together with its disadvantages are summarized in Table 1.
Having a local energy storage system reduces the required space in the installation for an accumulation tank. In addition, unlike traditional PV/T panels, it is not necessary to have a constant flow of fluid during its operation. Fluid should only be pumped when there is a demand for heat. On the other hand, one of the biggest advantages of this design is that the heat/electricity generated may be adjusted to the demands of the building. To do so, it is only necessary to vary the dimensions of the dark perimeter surface.
However, this design is more complex to manufacture, so it will increase the cost of the panel. The volumetric expansion of the PCMs in a molten state must be considered in the design, to avoid increasing the pressure within the panel, otherwise the panel might deteriorate. Thermal insulation should also be increased to reduce the loss of stored heat in the PCM.
3.2. Prototype Construction
A functional prototype was built for design validation. This prototype was tested under real conditions where its operation was verified. The starting point of the construction is a 100 LUXOR LX-100M PV panel. Table 2 shows the nominal characteristics. It has a photovoltaic area of 1194 × 542. Under the PV panel, the volume of the PCM was joined, the container for which consisted of aluminium profiles. The selected PCM for this first prototype was lauric acid, since its melting point is close to 43.5 °C [29] and it is suitable for use in PV/T technology. It is also characterized by its low cost and non-toxic properties. The main thermophysical characteristics are summarized in Table 3. The total mas of PCM included in the design is 24 with a depth of 35 , which has a thermal storage capacity of 4500 .
One of the biggest limitations on the materials that may be used as the PCM is volumetric expansion in a liquid state, an aspect that complicates the design of a panel. An elastomeric system that can be compressed, so that the expansion can be absorbed was therefore incorporated inside the PCM.
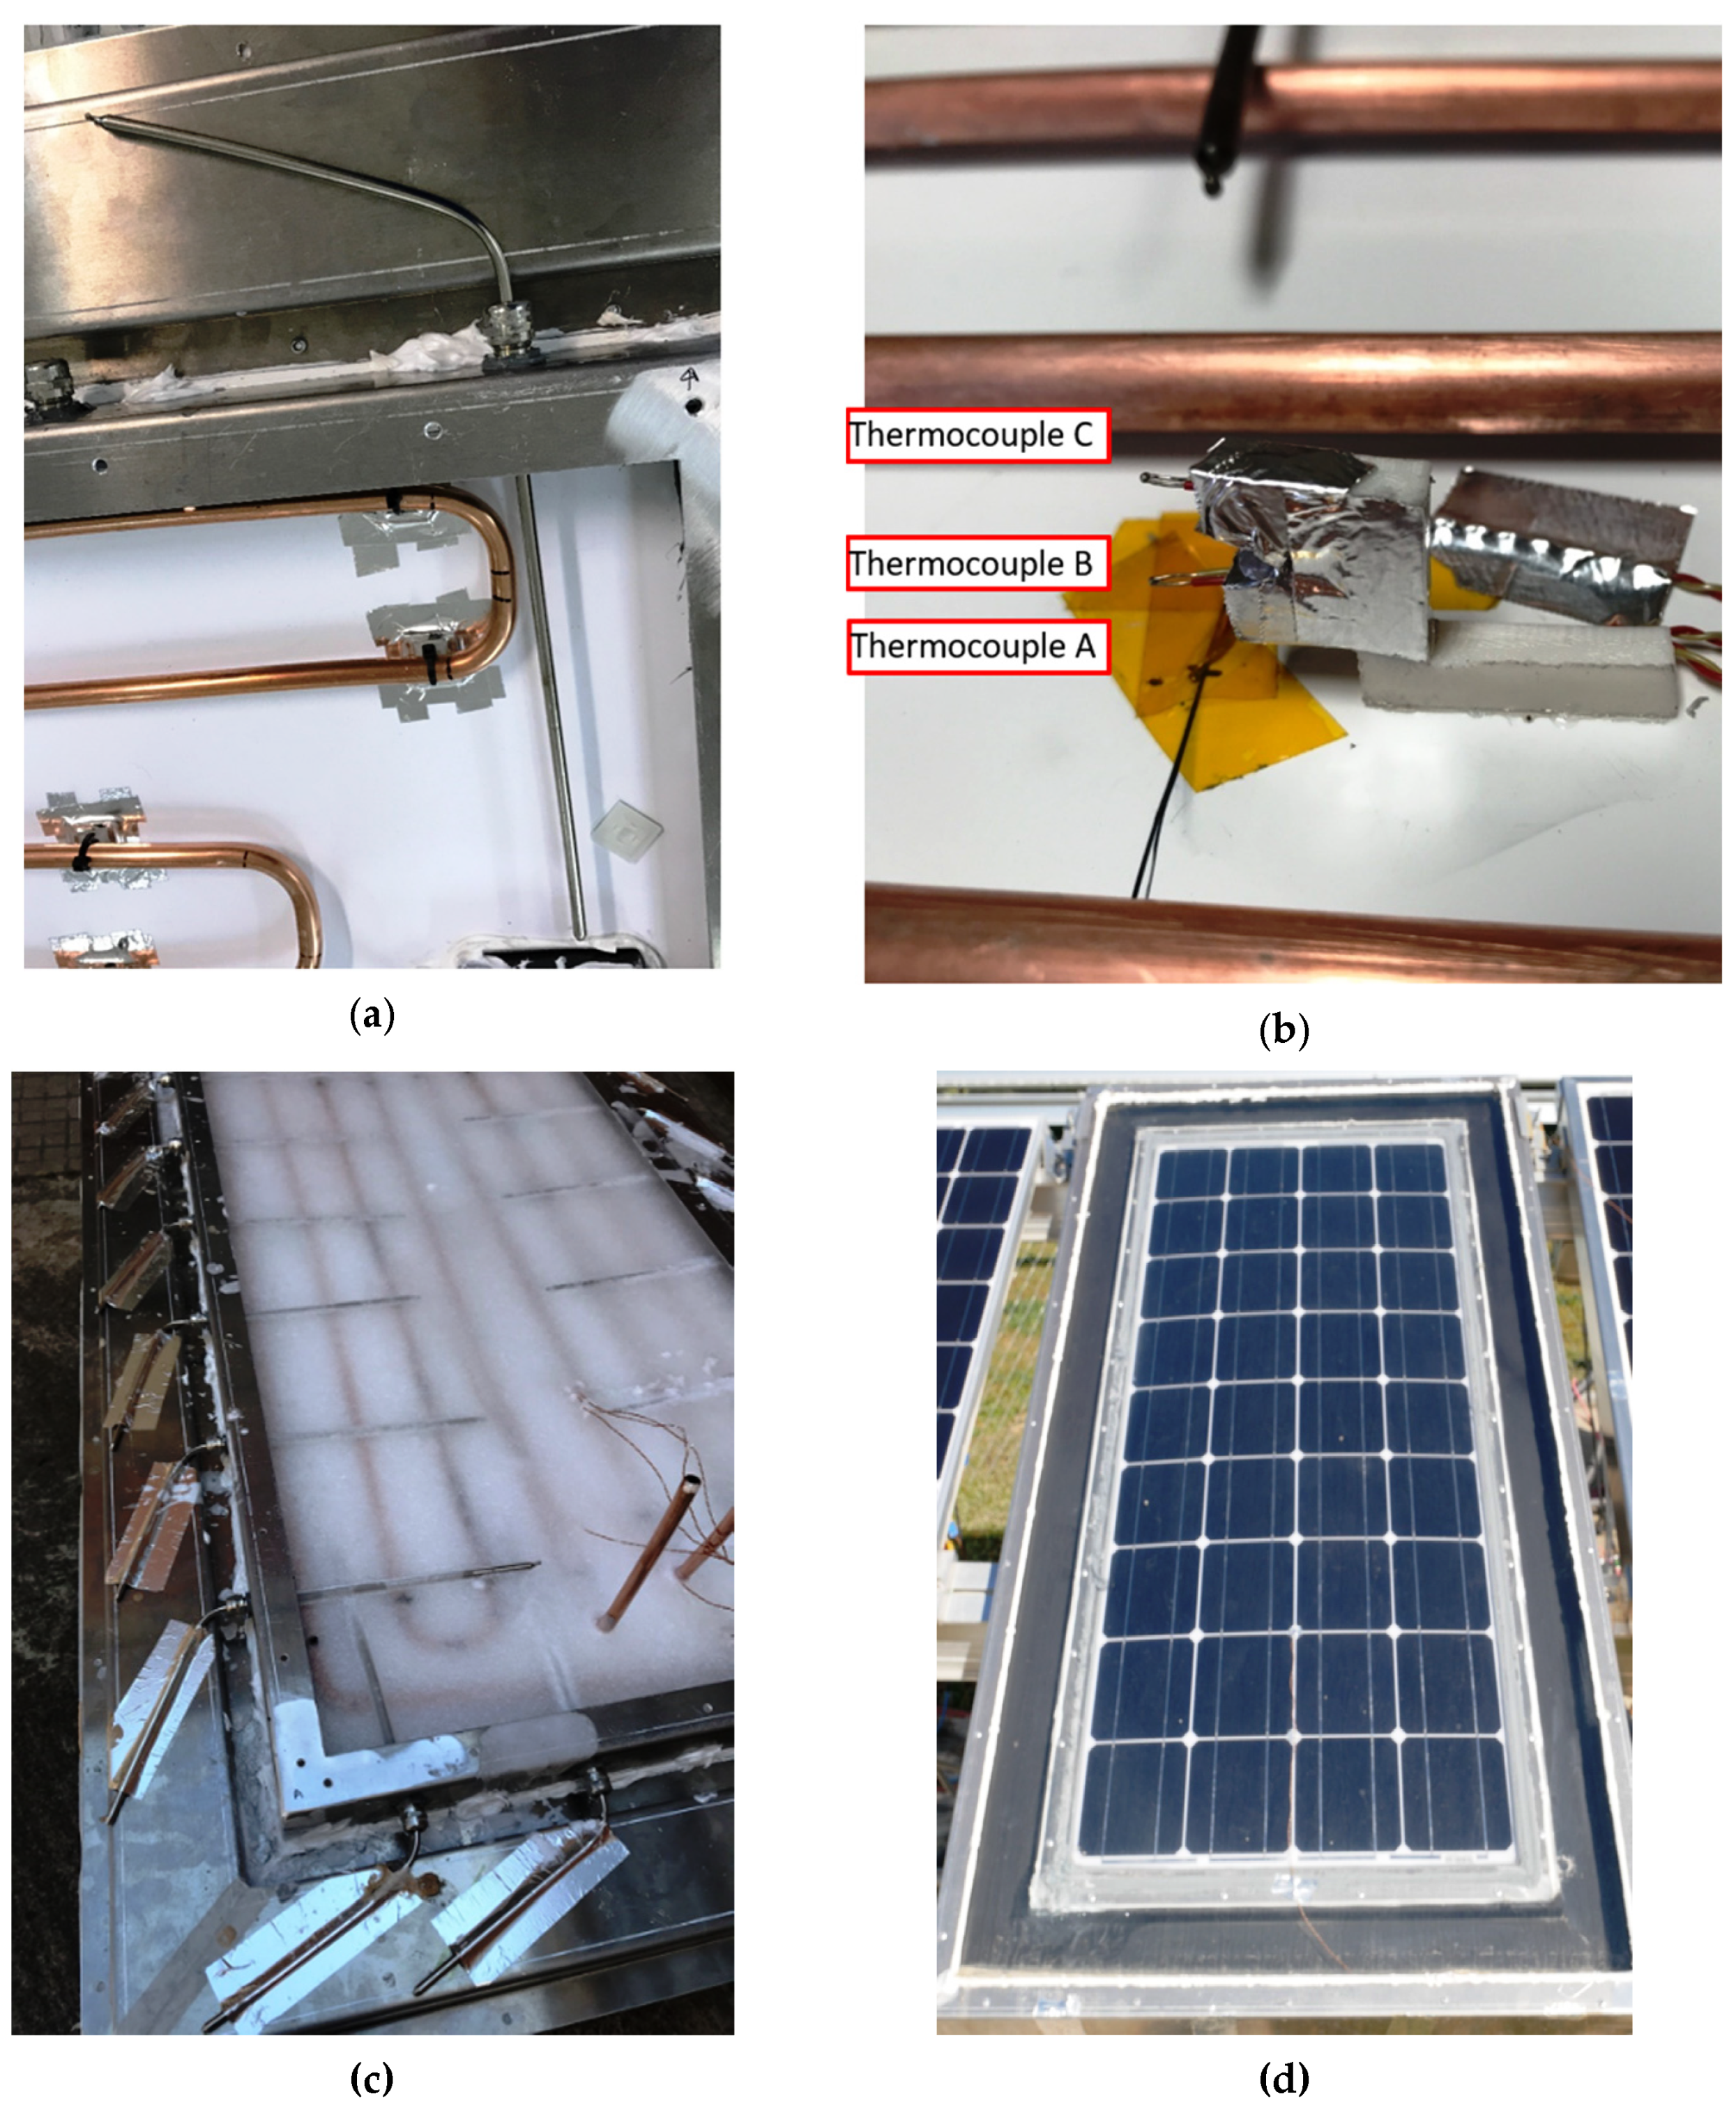
The selection of the HP must be based on the dimensions of the panel and the maximum thermal capacity of those elements. In this prototype, 22 HP model QG-SHP-D5-400MN, from Quick-Cool-Shop, were installed. They are a water-copper meshed heat pipe that has a maximum thermal capacity of 30 W. The HP diameter and length is 4 mm 400 mm respectively, which is sufficient to cover a large part of the panel surface, as shown in Figure 4c. The HPs length in contact with the PCM, condenser, is 220 mm and they were placed curved so that the effective evaporation length of the HP is increased by up to 125 mm, improving the heat transfer between the HP and the perimeter surface.
Several K-type thermocouples, distributed along a diagonal of the panel, at three different heights separated , were included inside the PCM in order to verify the correct operation of the design, as shown in Figure 4b. These measures allow the characterization of the PCM melting process during operation. Figure 4d shows the front glass that entraps the layer of air for thermal insulation of the front of the panel.
4. Experimental Tests
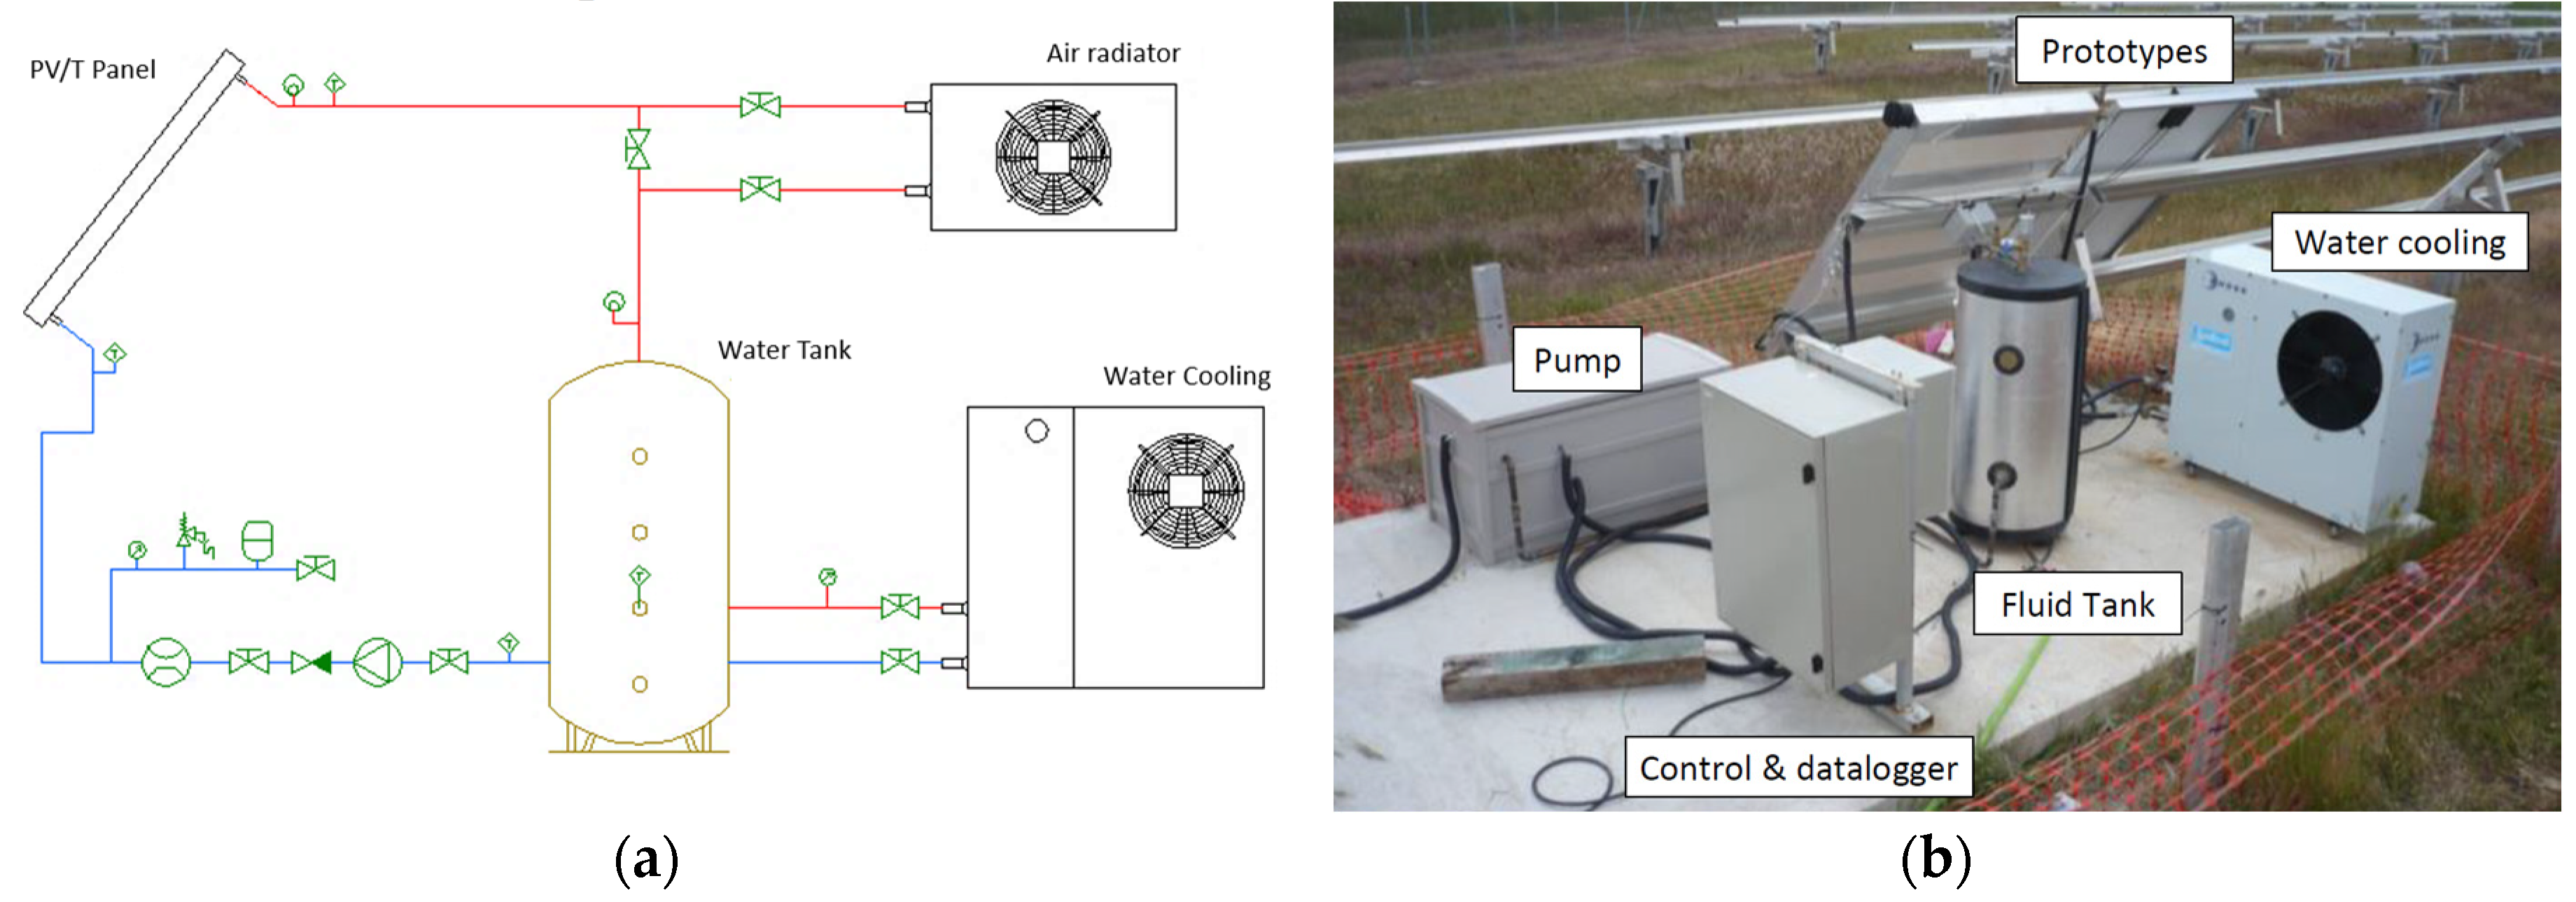
The prototype was tested under real conditions during spring and summer months. To that end, an outdoor test facility for PV/T panels was designed and built. It had all the necessary elements for operating the PV/T panels and, at the same time, it controlled and measured the different operating parameters. As it can be seen in the Figure 5, the water flow is cooled by the air radiator and a water-cooling system. In addition, the fluid tank adds thermal inertia to the installation to keep fluid temperature stable. The fluid flow is measured with a flowmeter LIQUI-VIEW Base LVB-10P and both inlet/outlet temperatures are measured with PT1000 CLASS A. Therefore, the heat generated in each panel was calculated by the expression (2):
where is the mass flow rate , is the specific heat of the fluid , and are the outlet/inlet temperatures of the fluid .
The electricity that is generated is then dissipated by a fixed 150 W resistors of 2.2 , directly connected to the panel, where both the voltage and the current that is generated are measured with a hall effect current transducer LEM HAS-50S and the voltage directly with the datalogger. Its product is instantaneous power, as defined in expression 2.
where is the voltage of the PV module () and is the electrical current ().
In addition to the energy values of the panel, different temperatures were recorded, both inside the PCM and the surface of the panel and the environment with nine internal thermocouple type K inside the PCM and other in the front surface of the PV module. A Starpyranometer type 8102 pyranometer placed at the same inclination of the panel, measured the solar radiation that reached the panel.
The heat storage capability of the PCM adds further operating modes to the panel. Two different studies were therefore conducted. The first was to remove heat during the day. The panel stores heat while, at the same time, it is removed by the flow of fluid in the thermal collector from 10:00 a.m. to 20:00 p.m. This operational mode is the one that has conventional PV/T panels without PCM. The second mode stores heat during the day that is removed during the night. The fluid flow is activated at 23:00 p.m. until 3:00 a.m. With these tests it was possible to analyse the maximum temperature levels reached in the panel, as well as the effectiveness of the thermal insulation.
Neither of the operating conditions of the panel has a constant water flow. This limits the possibility to measure the instantaneous thermal efficiency since, when there is not fluid flow, the exact thermal energy absorb by the PCM is impossible to be measured with the implemented sensors. For this reason, in this preliminary performance analysis only the total daily energy and efficiency were calculated.
5. Analysis of the Results
As mentioned above, two types of tests were performed, and the results will be individually described below. The large volume of data collected from the two tests, representing only four or five consecutive days, are shown for each type of test that is performed. Measurements of each sensor were taken every 30 s, and the average values at 10-min intervals were stored by the datalogger. In all of them, typical days of spring and summer in Spain were registered.
5.1. Test Configuration 1
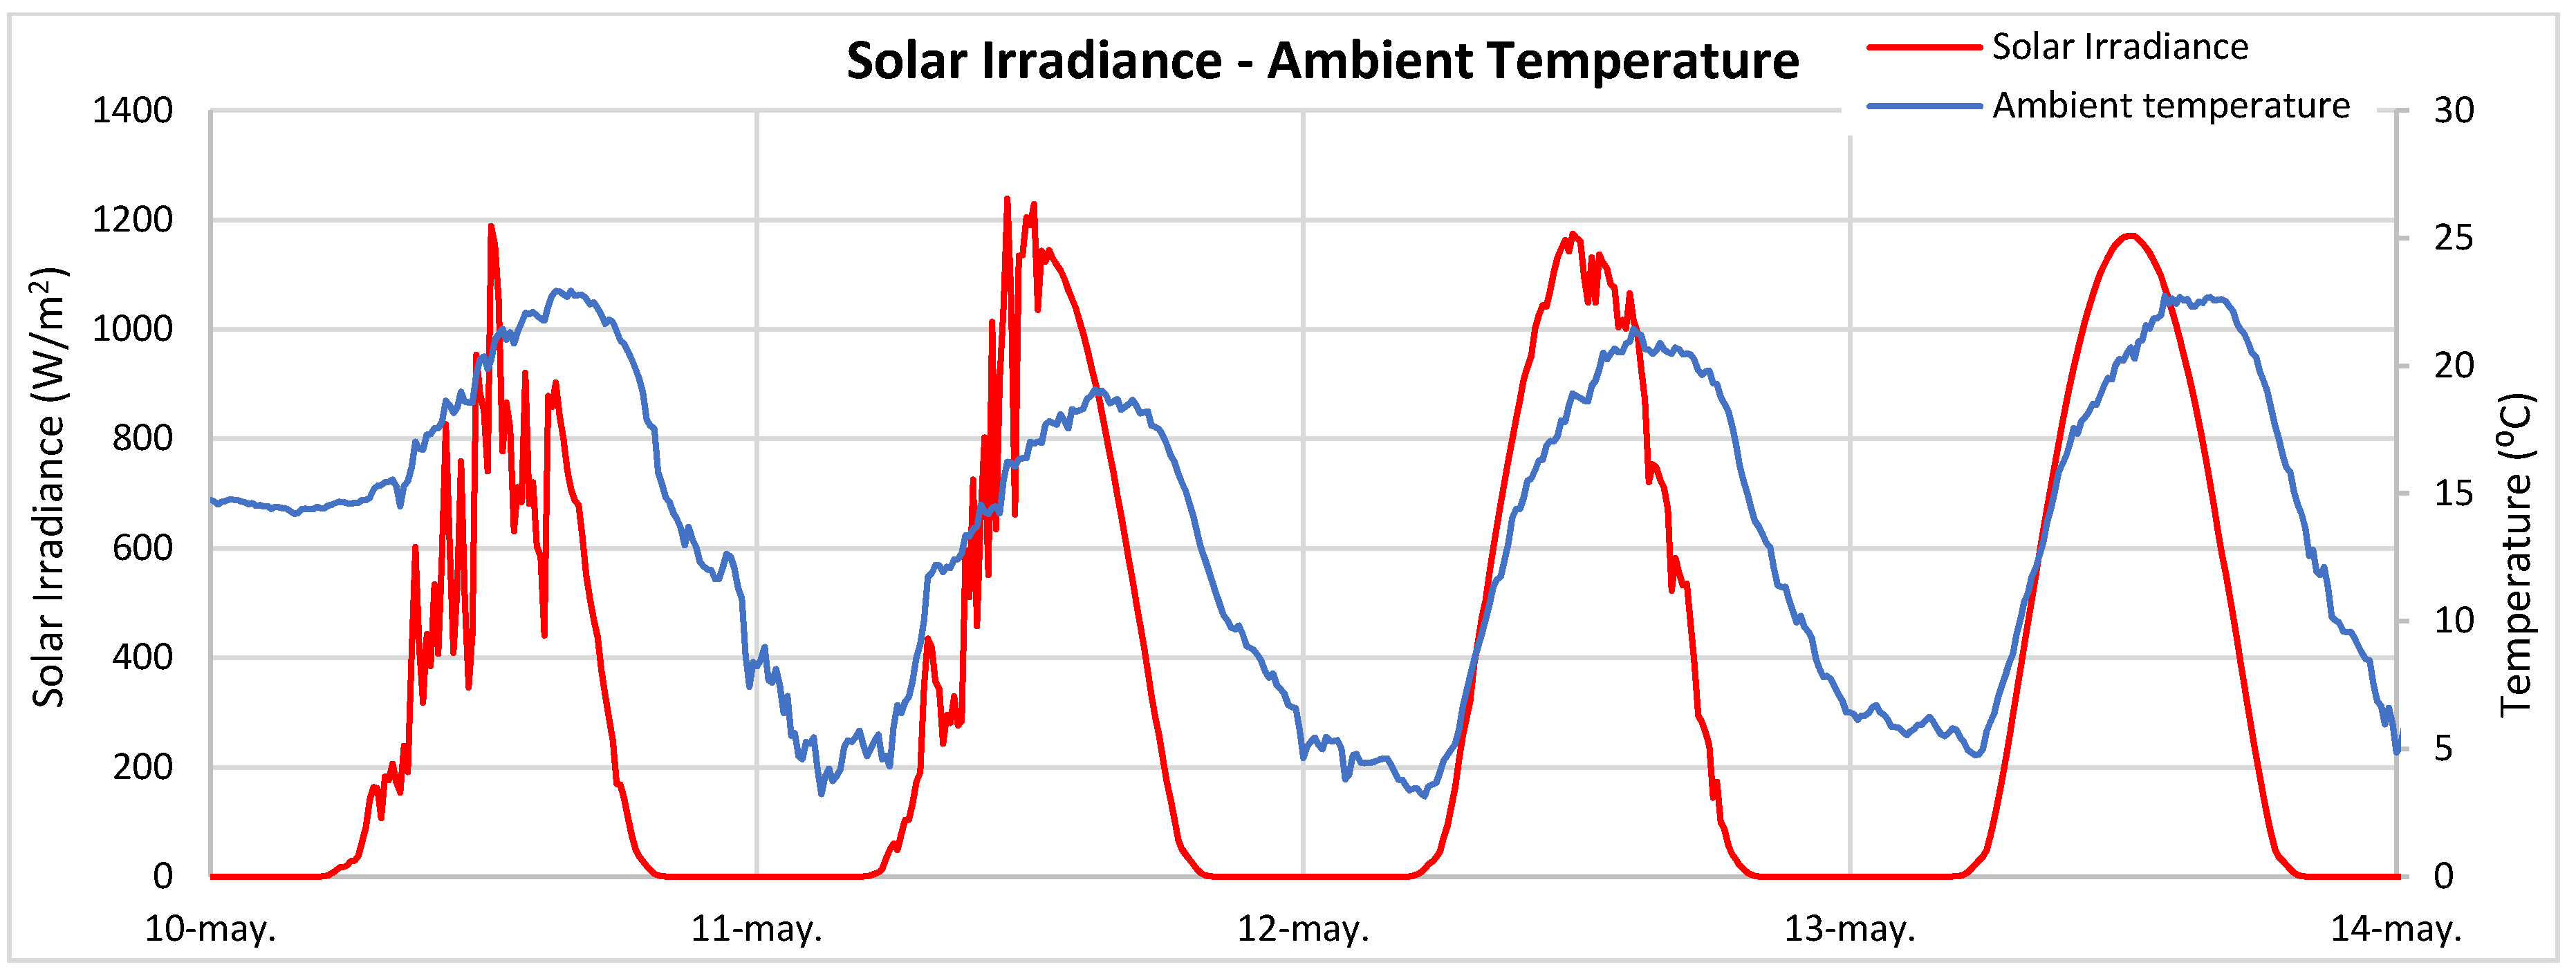
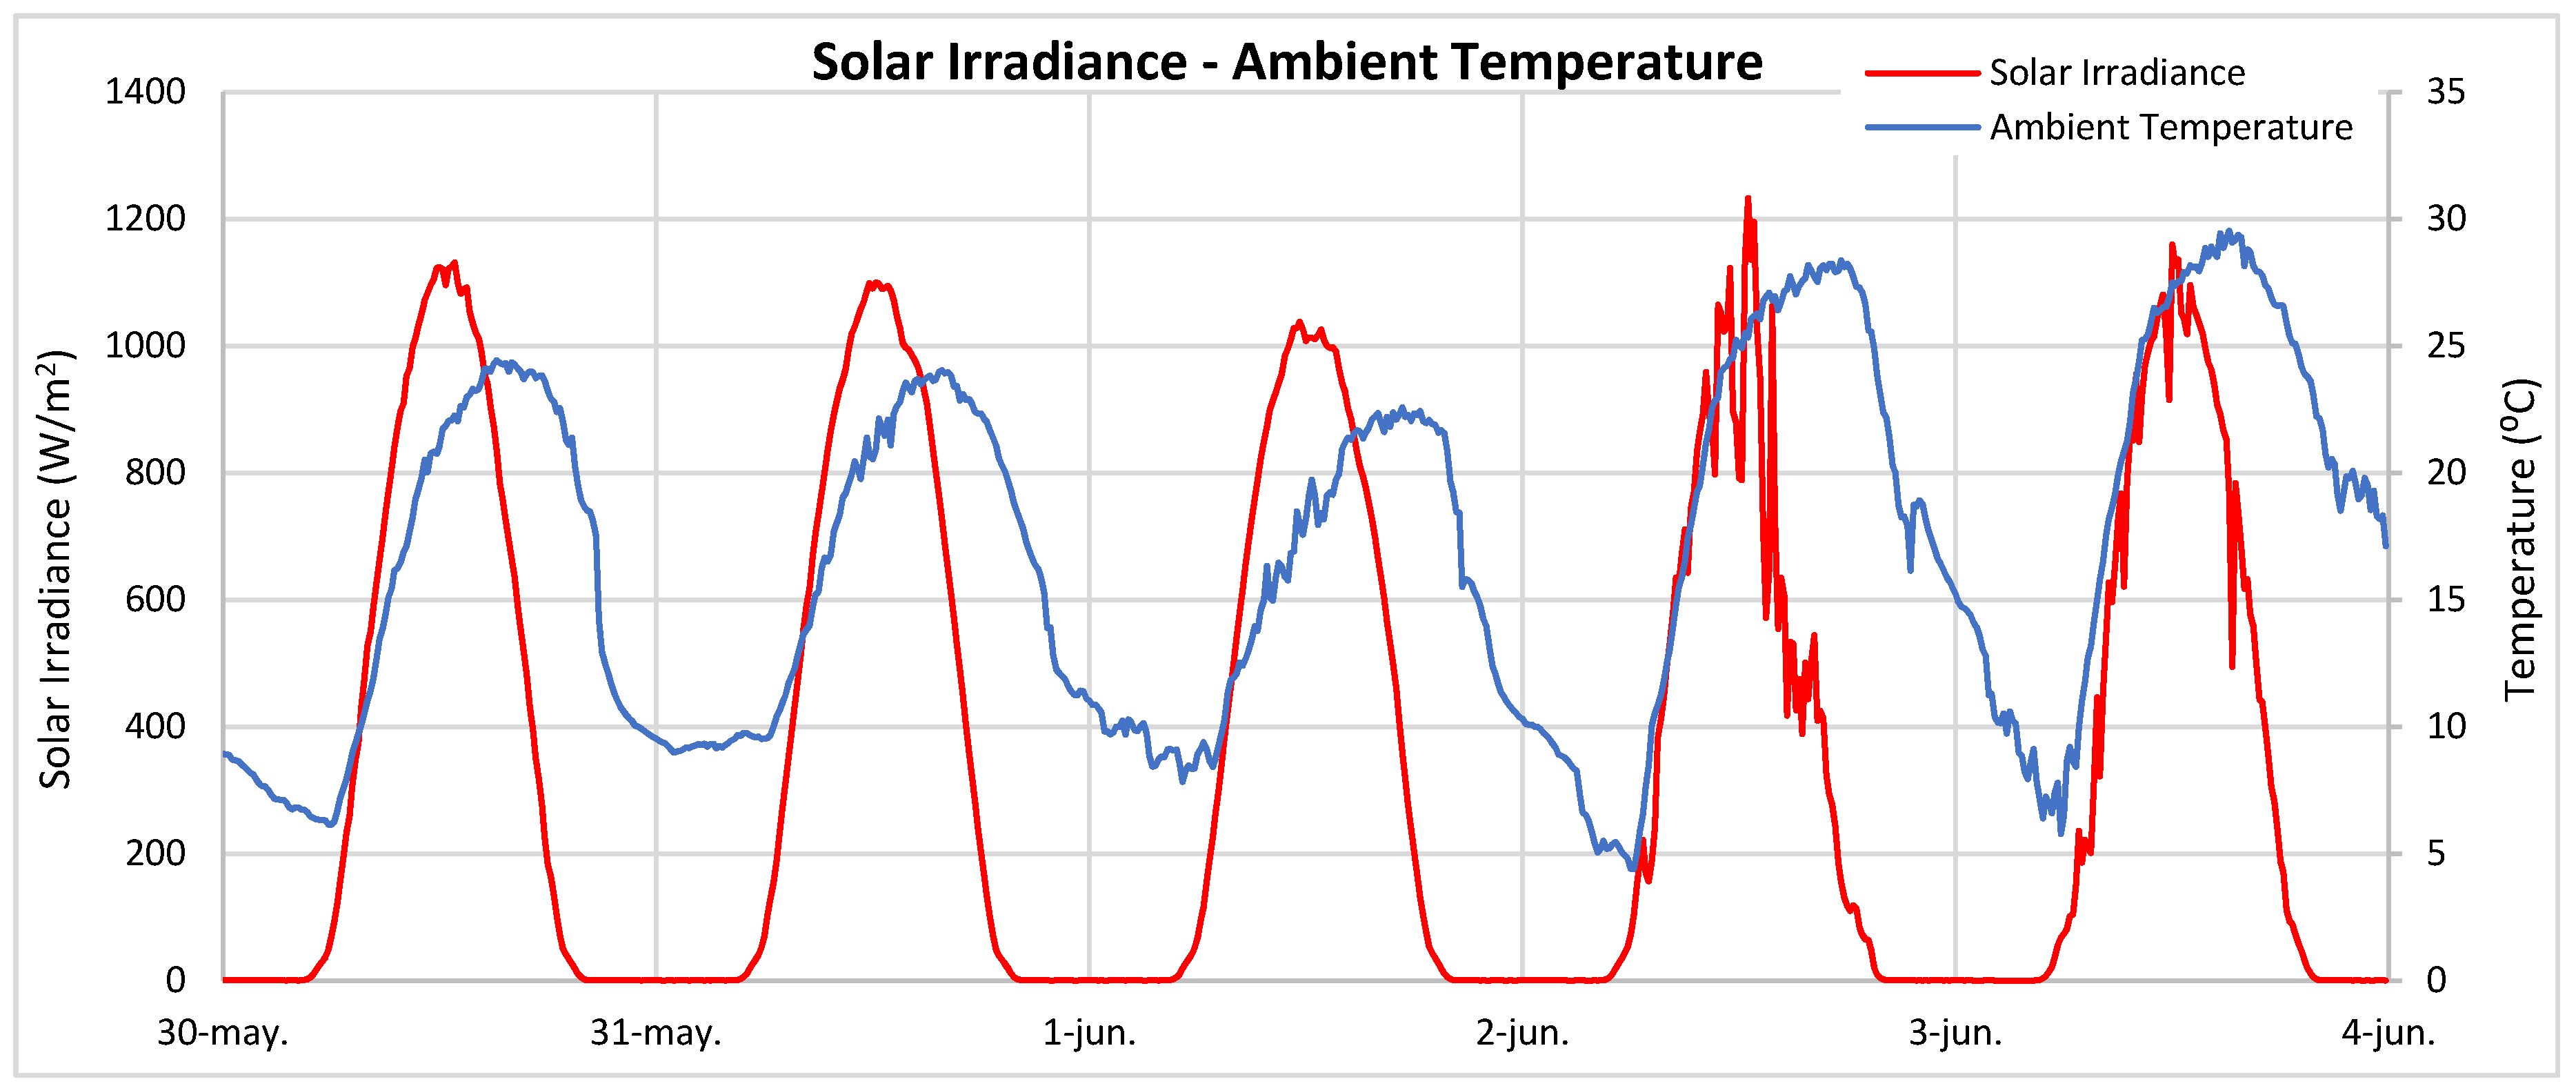
The first tests on the panel were in the month of May, when partially cloudy and clear days were registered. Figure 6 shows the solar radiation and temperature of those days. The first two days were partially cloudy while the other days were clear. The ambient temperatures of those days reached values higher than 20 although, during the night, the temperature dropped to values close to 5 °C. These temperatures are not extreme conditions, although at night the lower temperature increases the heat that is dissipated. These tests were carried out with a water flow of 2 during the central hours of the day, between 10:00 a.m. and 8:00 p.m.
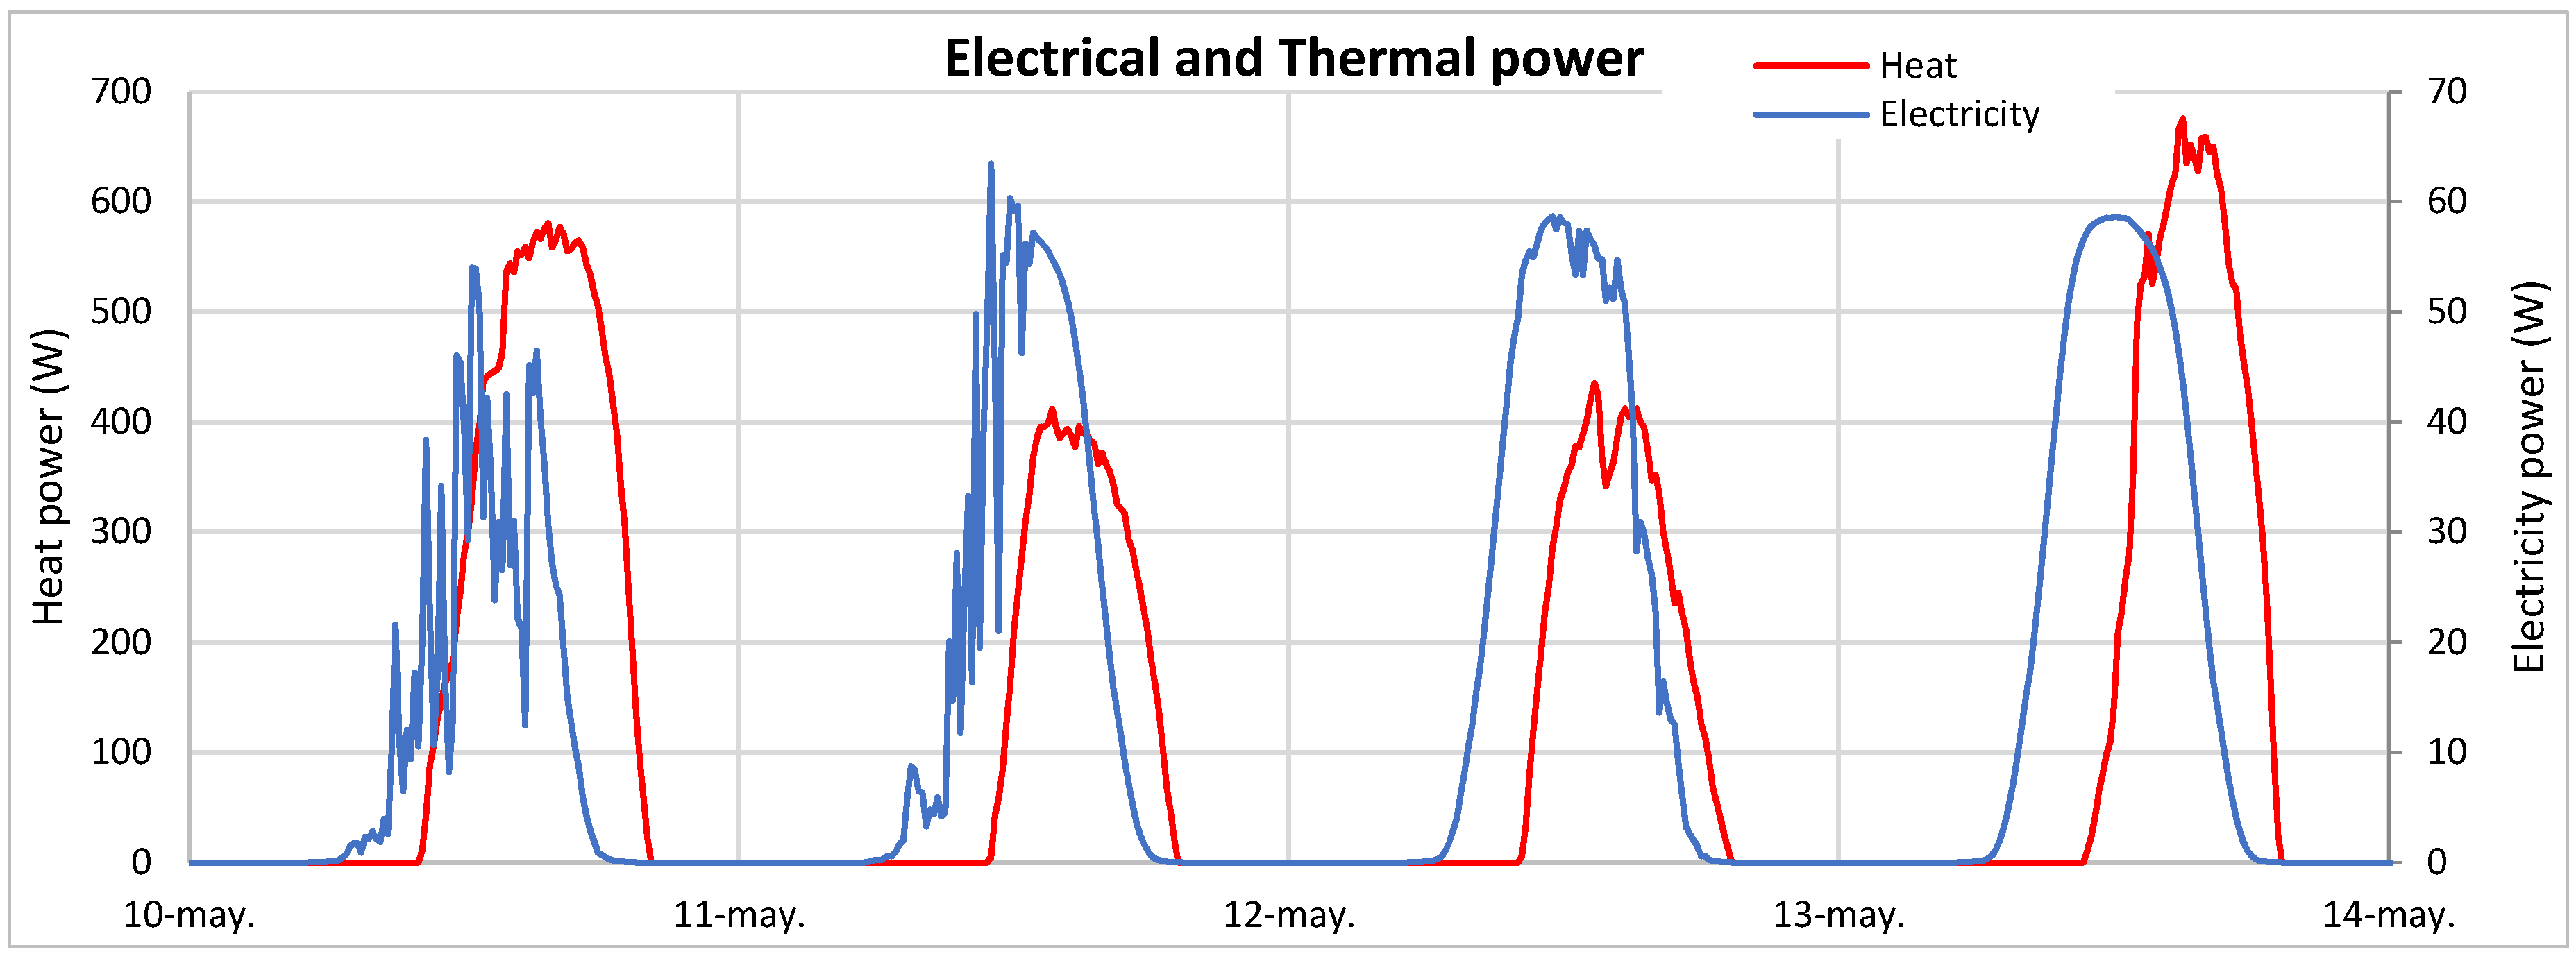
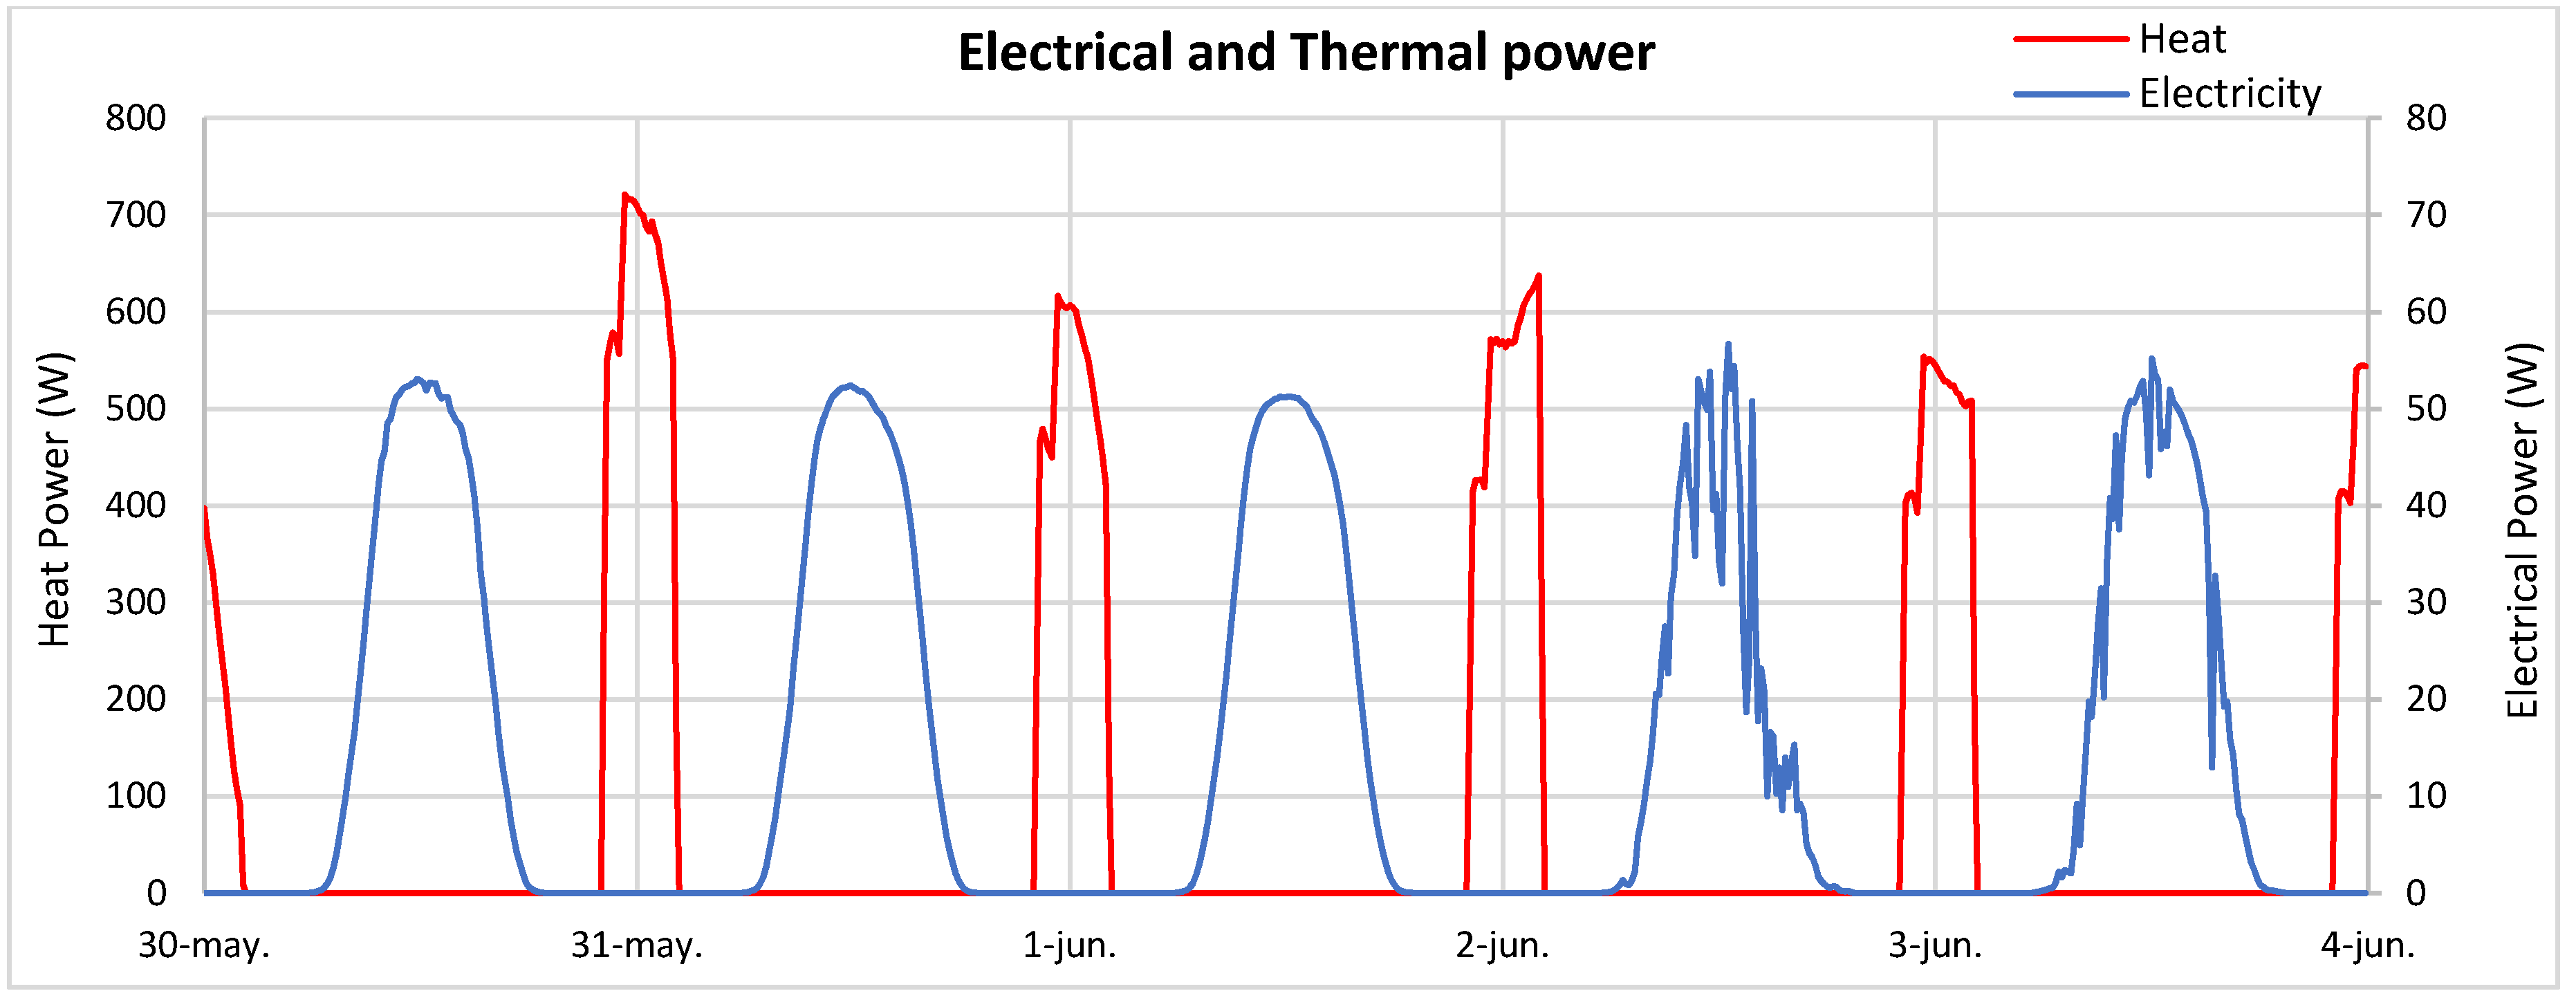
As previously mentioned, in this working configuration, the fluid pump was active for several hours of the day. In this way, heat was only obtained from the panel during those hours. The values of heat and electricity generated by the panel over the different days are represented in Figure 7. Electricity generation was similar every day, except for the first day that was cloudier and therefore with lower levels of solar irradiation. On the other days, the solar radiation was very similar, reaching peak values higher than . Likewise, the temperature of the PV panel was similar, with a maximum value of , except for the first cloudier day when the solar energy was lower and therefore its temperature. Under this configuration, the PV panel was able to generate 790 of electricity in a day with a peak power close to .
The thermal operation of the panel was different. It can be seen that, during the days with higher ambient temperature, higher levels of thermal power were generated, due to lower heat loss of this days. This observation shows the importance of an efficient thermal insulation in this type of panel. Even so, it can be seen from Figure 7 that the generation of heat (red curve), was maintained throughout the period during which the heat was removed from the PCM. Thermal energy power greater than was obtained and it generated over in one day.
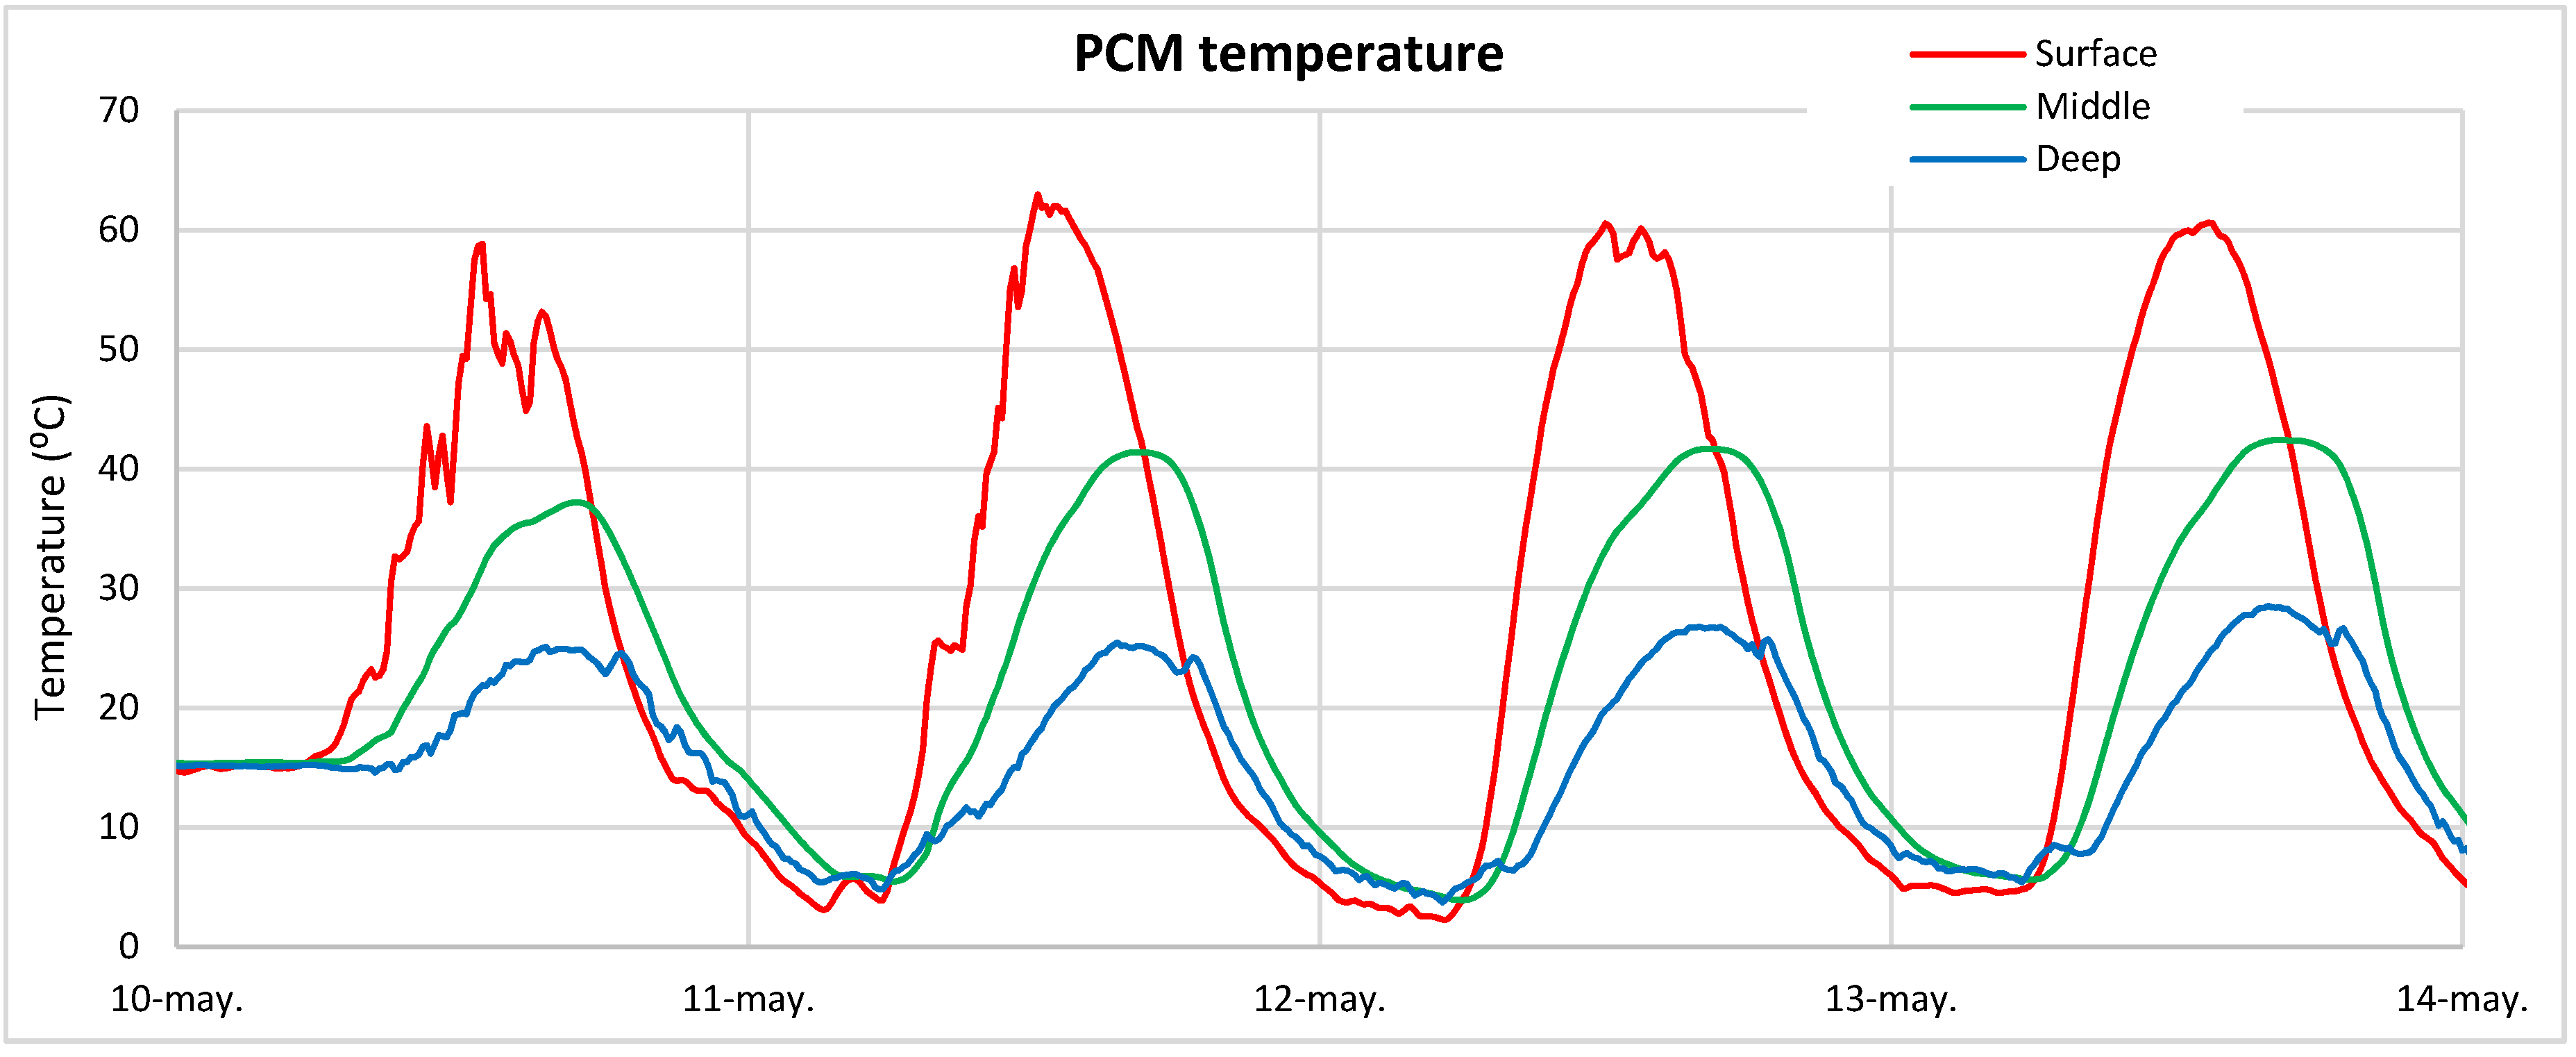
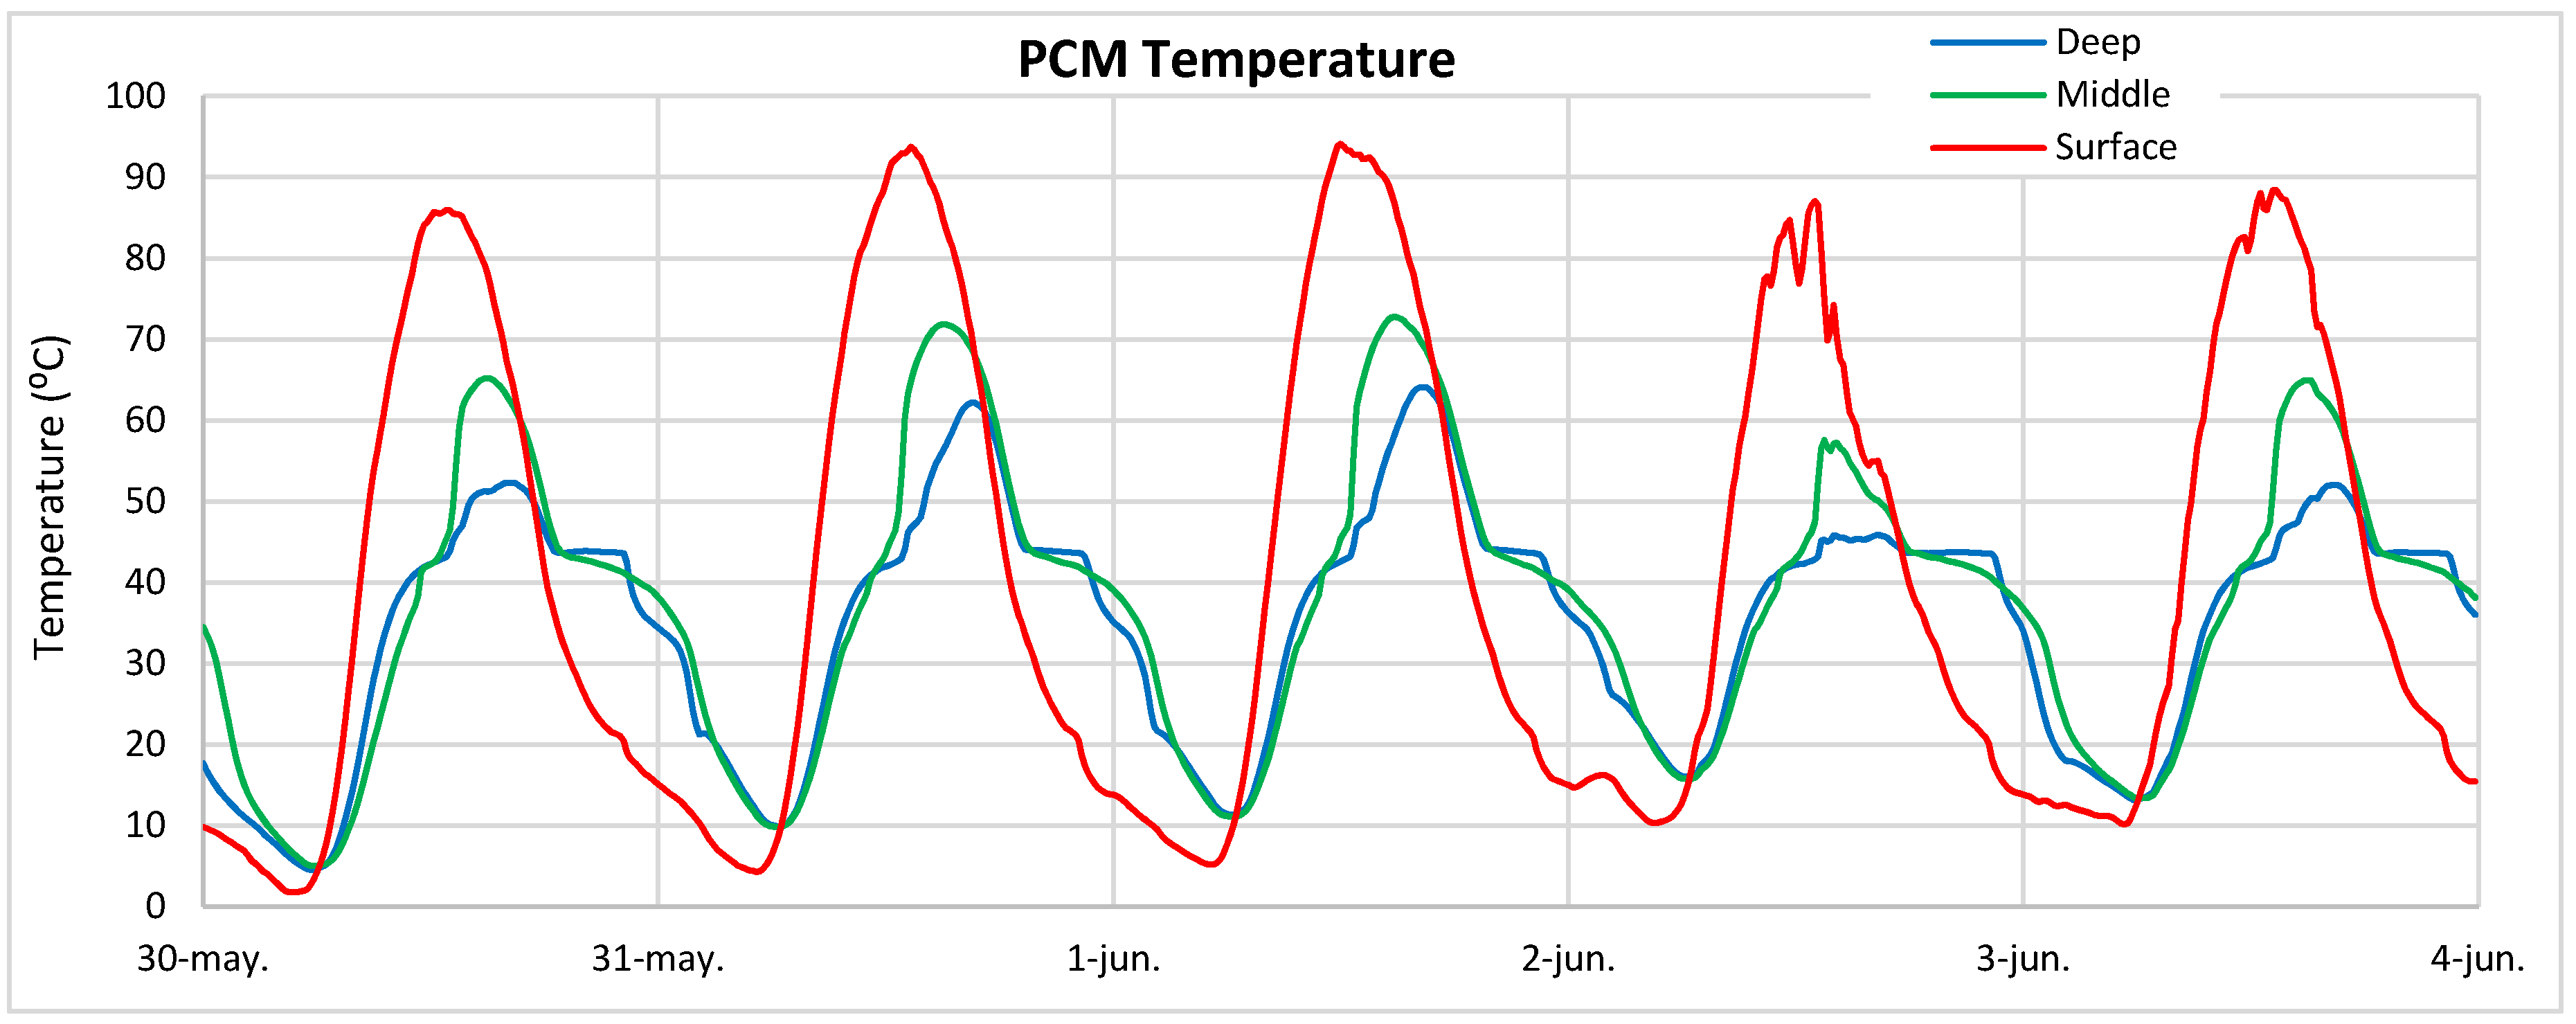
The PCM melting process is shown in Figure 8 where the temperatures within the panel are represented for the three depths of the PCM. The red line is the temperature variation of the surface temperature on the PV panel. It is observed that, during every day of operation, the maximum temperature, close to , and its variation is very similar. This temperature was sufficient to melt the PCM, so much so that the PCM close to the PV panel was molten. In contrast, lower PCM temperatures showed lower temperatures. None of them reached the melting point of . The volume of molten PCM was between the back surface of the panel and the first thermocouple. Molten temperatures were reached as heat was removed during the day, leaving the PCM refrigerated throughout most daylight hours. In this mode of operation, although the fluid temperature was warmed to only , the electricity generation was greater.
5.2. Test Configuration 2
In test configuration 2, solar energy was similar to the previous study, where peak power outputs of over were recorded. However, the ambient temperature was slightly higher, as those tests were performed on dates closer to summer, with temperatures close to during the central hours of the day, as can be seen in Figure 9, although in the night the temperature dropped below
In this operation configuration, all the heat that is generated is stored during the day in the PCM. Therefore, the panel temperatures were considerably higher, showing temperatures slightly higher than . This fact reduces the efficiency of the PV panel, as can be seen in Figure 10, where the electricity power generated by the panel during these tests are represented, in addition to the thermal energy.
The photovoltaic efficiency was lower than in configuration 1. In that case, the electricity was slightly greater than However, the thermal energy was considerably higher, because the temperature of the PCM was higher, as no heat was extracted from it during daylight hours. Therefore, greater thermal power can be obtained with values of up to , as shown in Figure 10.
The energy generated over one day was of electricity and of heat. This last value could be increased by increasing the time that the fluid is circulating, because, in this test, the PCM was still molten when the pump was turned off. The temperature reached on the surface of the panel was much higher, because as shown in Figure 11, the entire PCM melted quickly and, therefore, the sensible heat of the thermal energy was stored. It shows that in the case of storing all heat from the day for use at night, it would be necessary to increase the amount of PCM to keep the temperature under control. In a real use of the panel, it is probably that during the day some heat is extracted from the panel, reducing the PCM temperature.
Unlike the previous test, at midday, the PCM was already molten and its temperature was even increasing. The effectiveness of the HPs is evident, as the volume of PCM rapidly melted and it maintained a homogeneous temperature at all depths. The PCM remained molten for much of the night. A hot fluid was also obtained at night with a higher temperature, , when compared to the maximum reached during the previous tests.
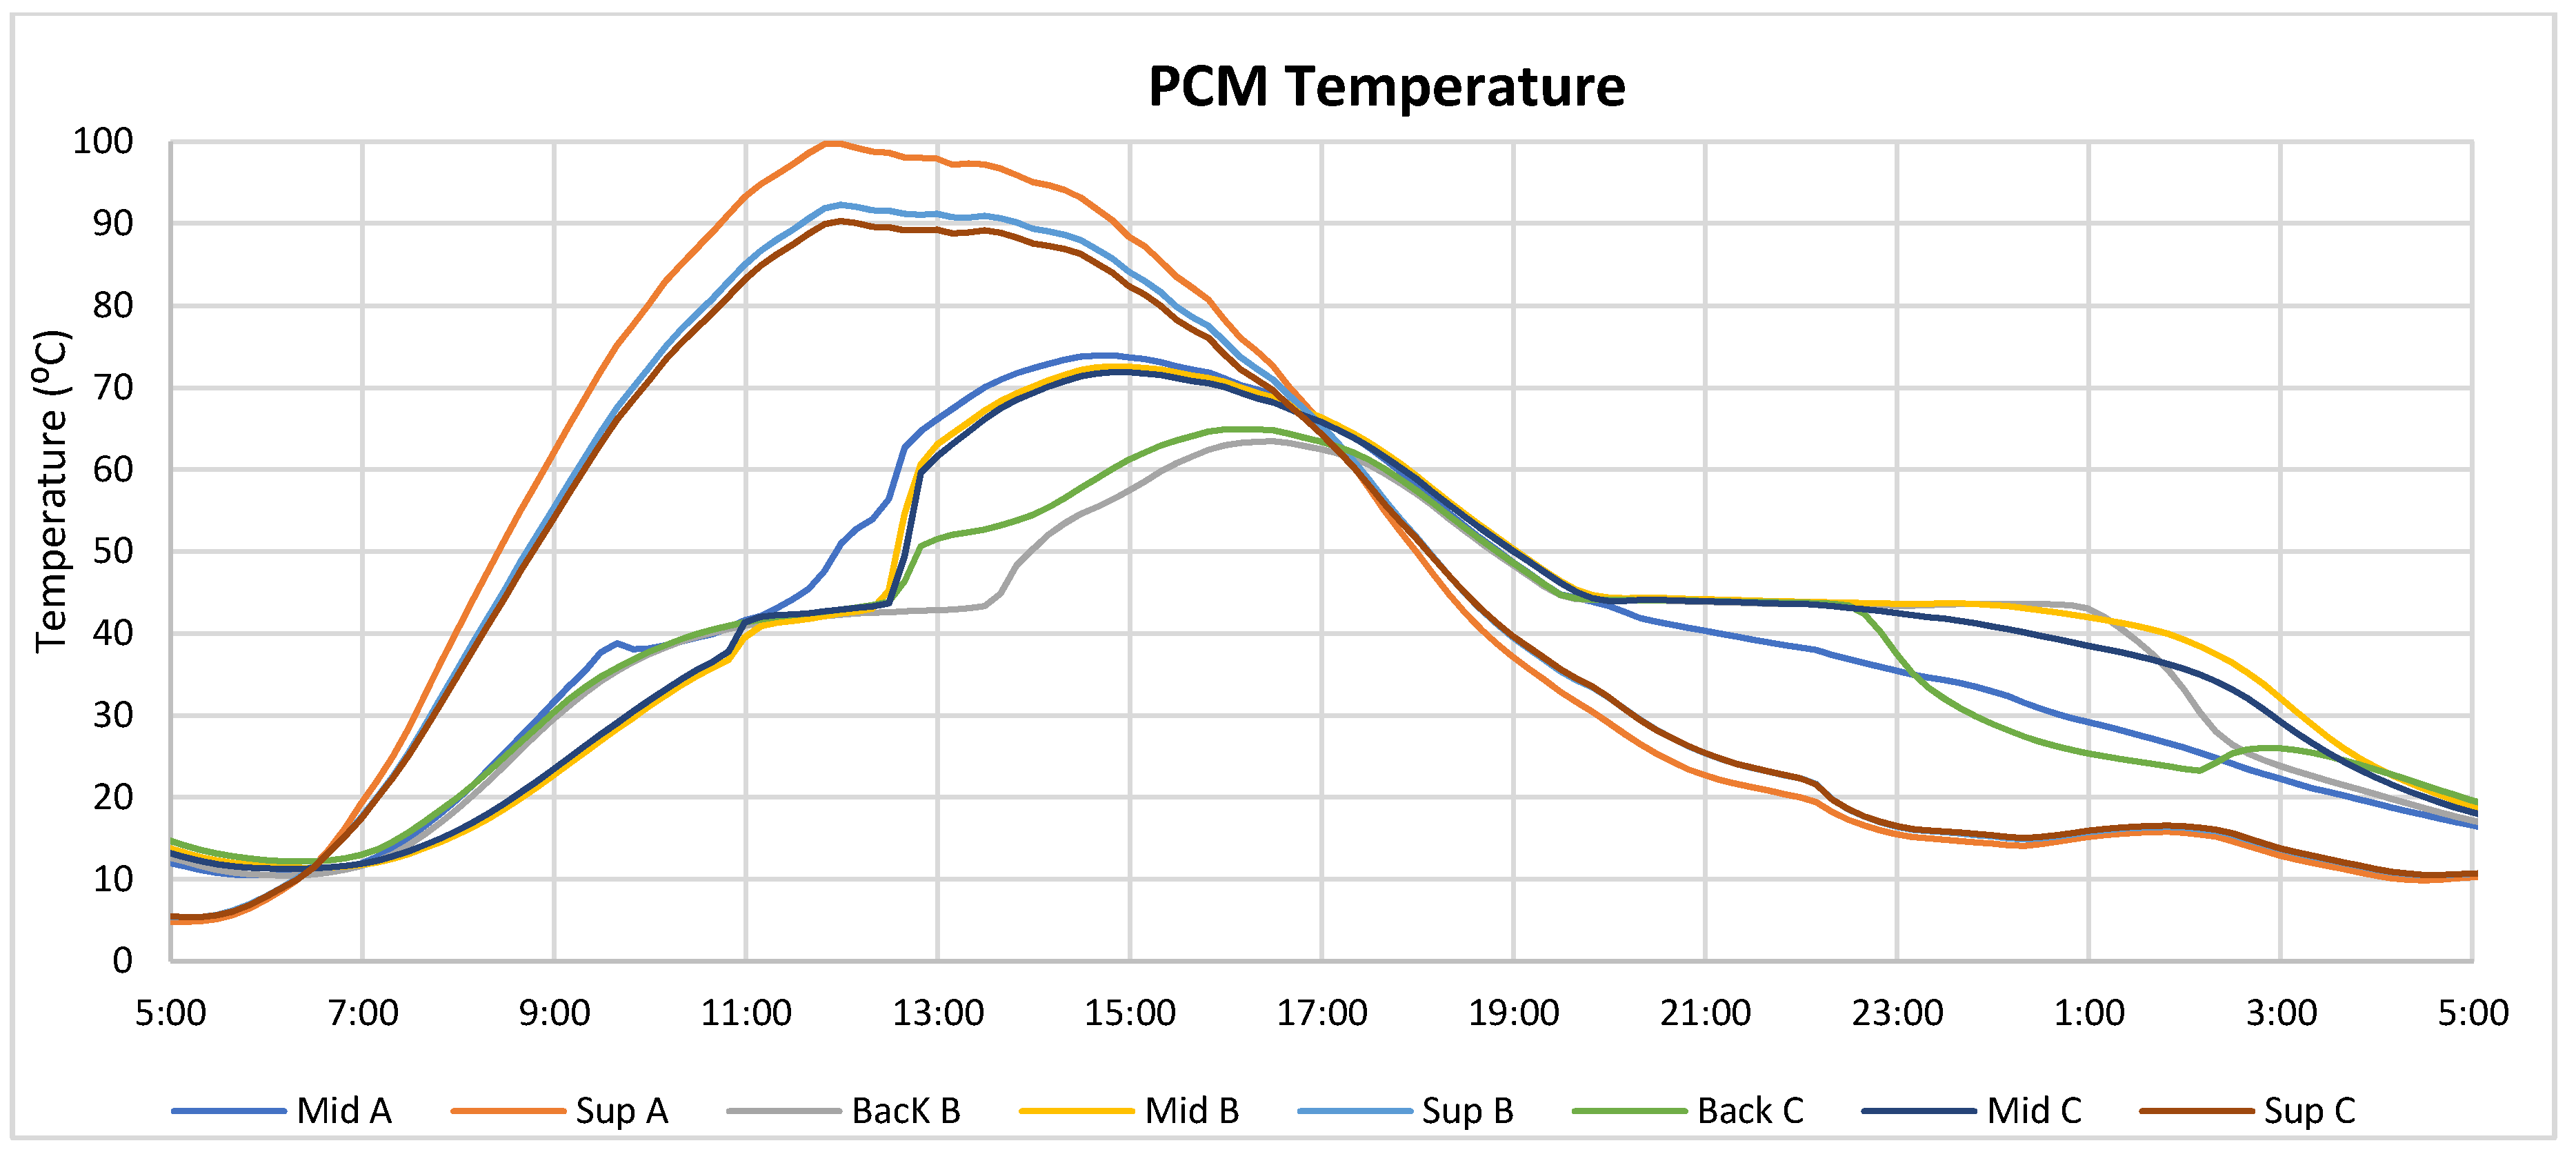
When the temperatures of all thermocouples placed inside the PCM are plotted, see Figure 12, it can be seen that the temperature was not homogeneous at each depth. There is a temperature gradient between the upper and lower zone of the panel, the differences between which at some points exceeded 10 .
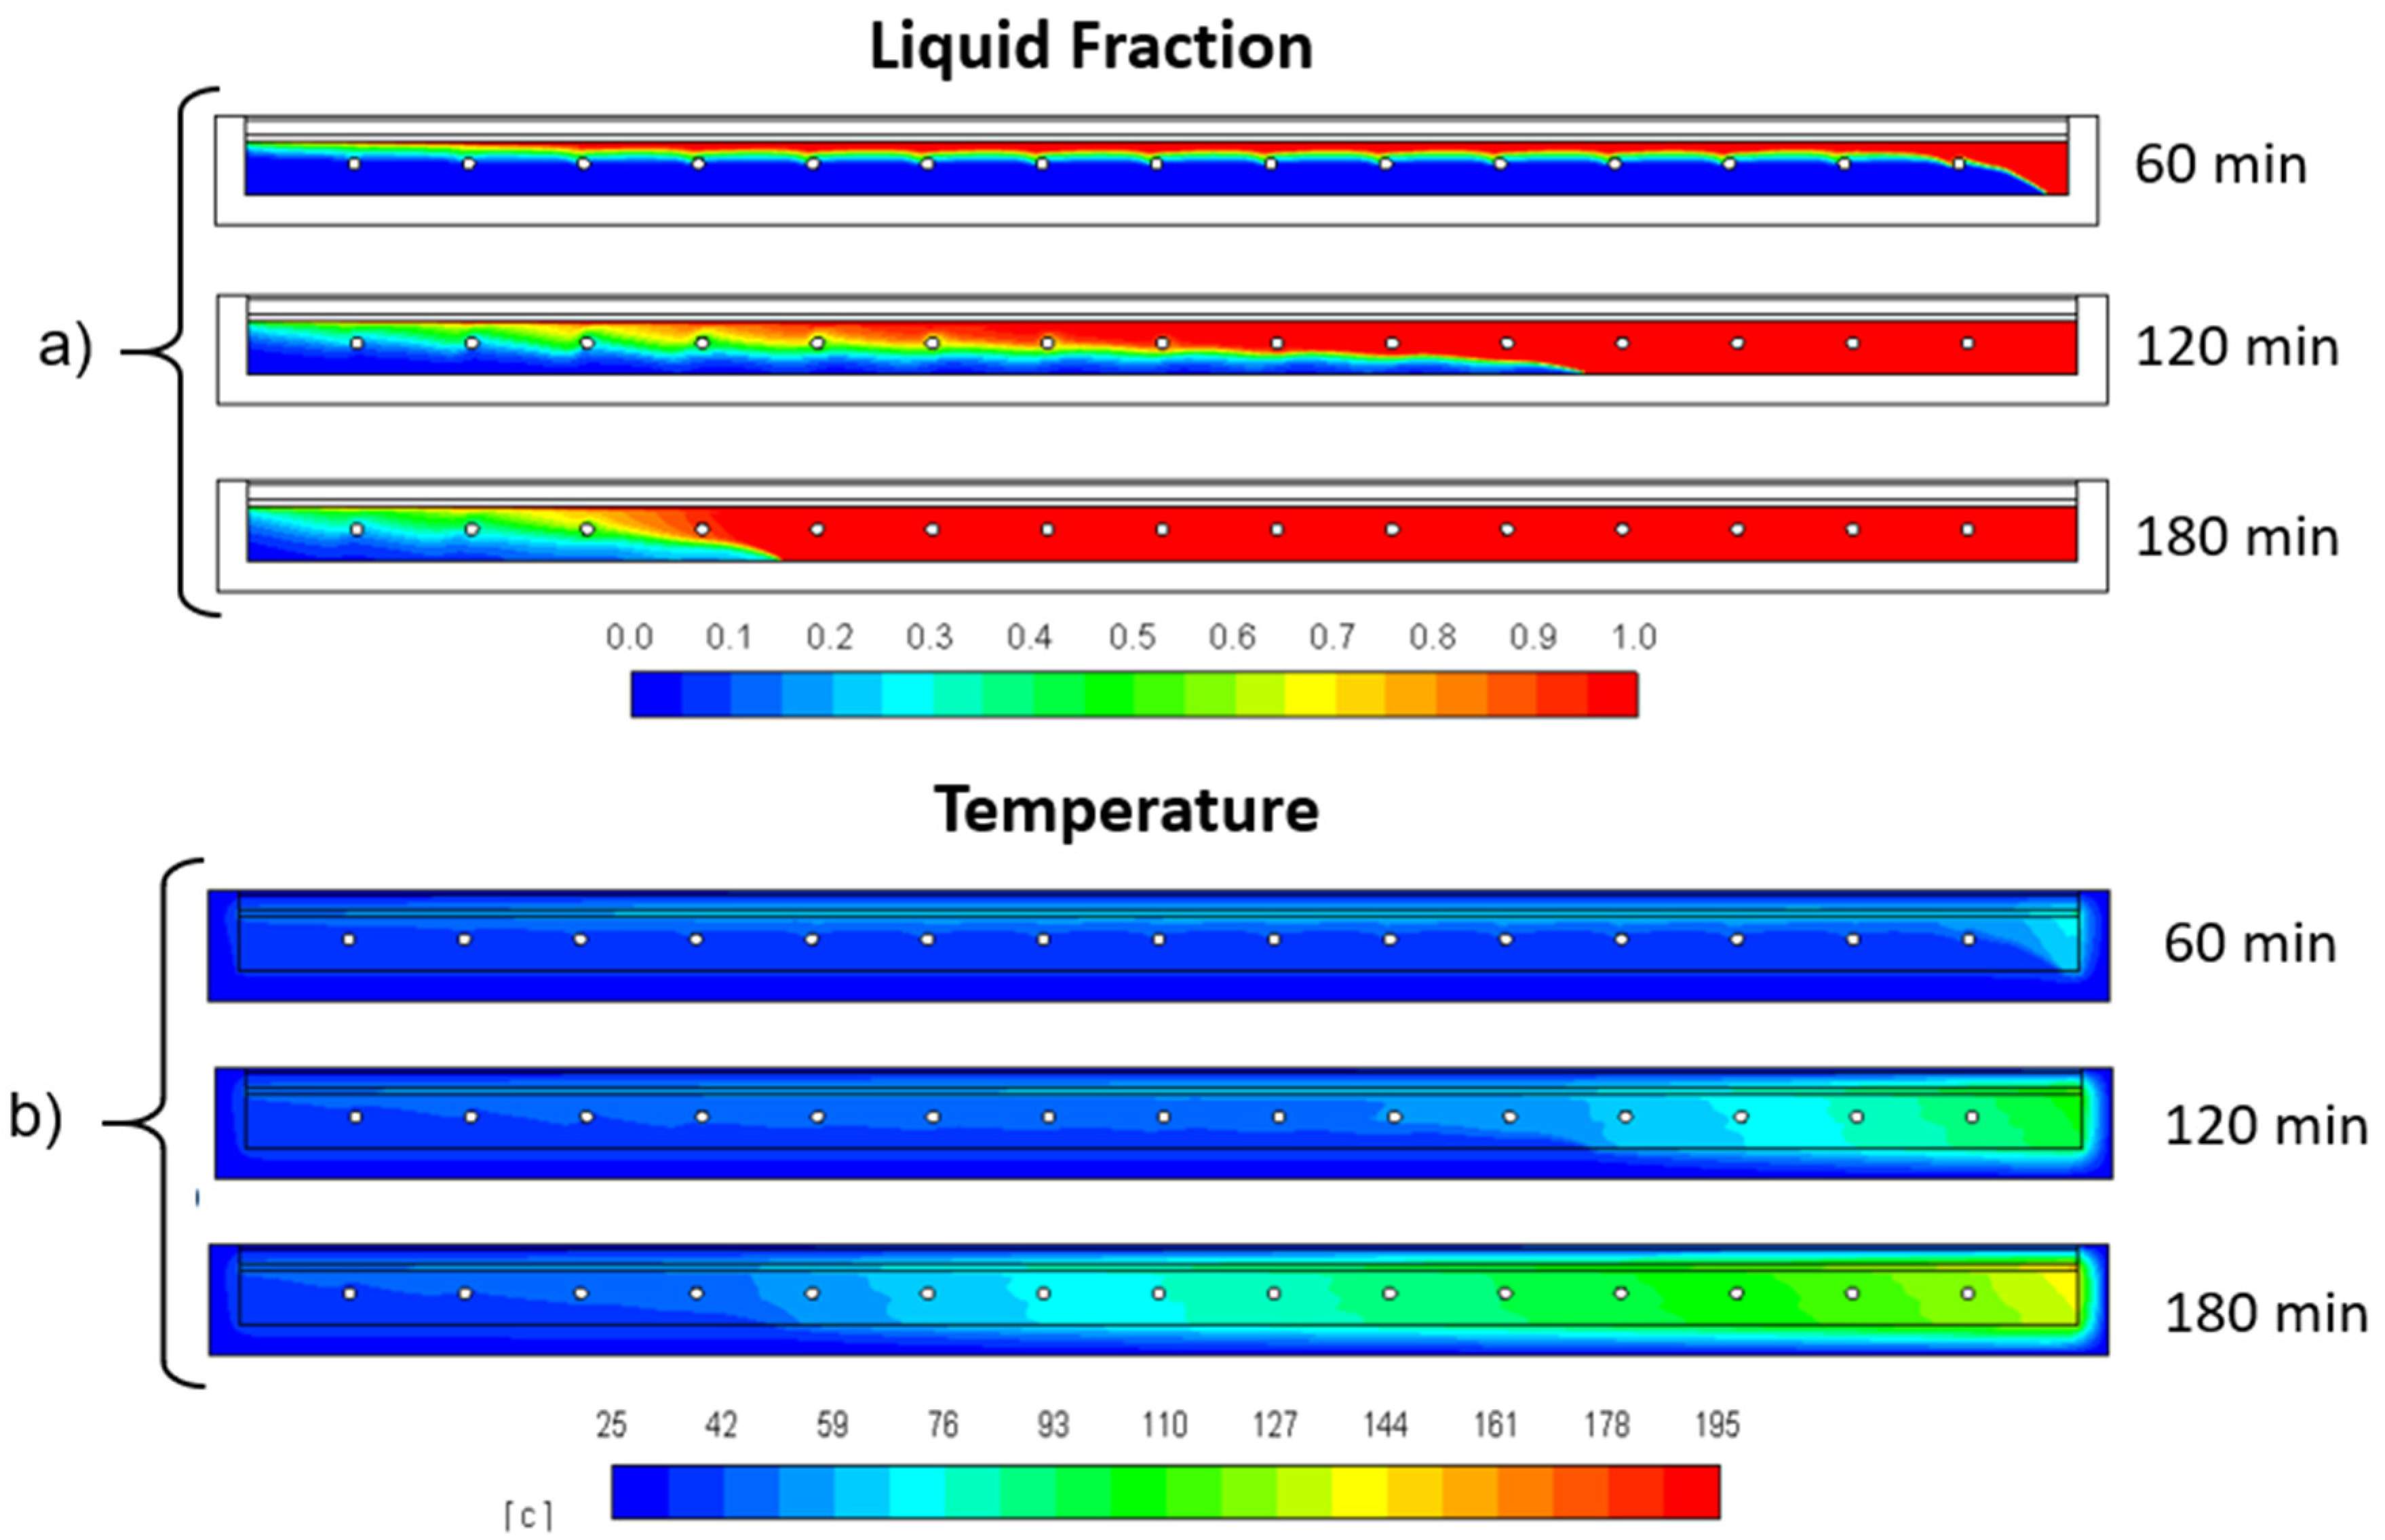
These temperature differences were because of the internal convective flows that were generated once the PCM was molten. It produced overheating in the upper zone of the PCM, due to the difference in density of the liquid PCM that was caused by temperature differences. Figure 13 shows the results of the transient 2D-CFD study of the melting process of PCM included in the PV/T-PCM design. Solar irradiance of 1000 and a titled of 42 was considered for the simulation run. In the same way as the experimental tests, these results show that PCM overheated within the upper area of the panel with a temperature difference higher than 50 . A solution to this limitation could be to compartmentalize the internal PCM, so that displacement of the hotter liquid PCM to the upper part of the PV/T panel could be prevented. In that case, there would still be some local convective flows that would increase heat transfer to the solid PCM without generating a high temperature difference within the panel.
6. Conclusions
A new PV/T panel design was proposed that optimizes the generation of electricity and heat. By incorporating PCM, the thermal inertia of the panel is increased achieving lower and more homogeneous temperatures in the panel. This design also includes heat pipes that improve heat transfer in the deeper area of the PCM. These elements transfer the heat to the farthest PCM from the PV panel and increase the effective volume of PCM that can be included in the PV/T panel.
Two configurations for operating the panel were analyzed by varying when the thermal energy is extracted from the PCM. When heat is removed during central hours of the day, electricity generation is optimized, while if done during the night, the heat is obtained at a higher temperature and with higher power, but the PV temperature is much higher.
In this preliminary test, the panel was able to generate electrical power higher than and thermal power of in a fluid at . This heat could be used for HDW and low-temperature heating systems, such as underfloor heating, where most of the energy demand could be covered with this type of panel. During the outdoor test, more than 13 in a day was obtained. It represents a global daily average efficiency of almost 50% for the first operating configuration and 30% in the second configuration.
This efficiency could easily be increased by increasing the volume of PCM to store more heat during the day without triggering higher PV panel temperatures. Additionally, the global temperature of the PCM, and therefore the temperature of the PV, can be reduced if the heat is extracted during the day when the PCM is completely melted, preventing that the PCM increase it temperature.
The ambient temperature has a big impact in the heat that is generated. More attention needs to be focused on panel insulation, since a reduction in thermal power was detected on days with lower ambient temperatures and with higher wind speeds.
When the panel is installed with an inclination, a temperature difference between the upper and lower zone of the panel is generated, due to the stratified density of the liquid PCM. The temperature of the PV panel is therefore not homogeneous. To avoid this problem, elements that limit the internal flow of the liquid PCM to the top should be included, reducing the overheating of the panel at the top, as shown in the CFD simulations.
Furthermore, the electricity/heat ratio that is generated can be adjusted with this innovative design, by increasing the perimetral dark surface of the panel. In this way, it could be adjusted to the energy demand of the installation, favouring its integration in buildings and homes.
7. Patents
The Prototype design described in this paper is protected under Spanish Law (Patent P201930047)
Author Contributions
Conceptualization, D.G.-P., M.D.-M., C.A.-T., I.A.-d.; Formal analysis, D.G.-P., C.A.-T.; Investigation, D.G.-P, M.D.-M., C.A.-T., I.A.-d.; Methodology, D.G.-P., M.D.-M., C.A.-T., I.A.-d.; Supervision, M.D.-M.; C.A.-T.; Writing—original draft, D.G.-P. Writing—review & editing, M.D.-M; C.A.-T. All authors have read and agreed to the published version of the manuscript.
Funding
This research was funded by Regional Government of Castilla y León, Spain (Ref. BU034U16) and the Spanish Ministry of Science, Innovation & Universities under the I+D+i state program “Challenges Research Projects” (Ref. RTI2018-098900-B-I00).
Acknowledgments
The authors acknowledge the assistance of CIDESOL, S.L. for the transfer of its facilities and equipment. Likewise, for financial support from the Department of Culture and Education of the Regional Government of Castilla y León, Spain (ORDEN EDU/756/2016 of 26th August). David González Peña would also like to thank the Junta de Castilla-León for economic support (PIRTU Program, ORDEN EDU/301/2015).
Conflicts of Interest
The authors declare no conflicts of interest.
References
- The Paris Agreement|UNFCCC. Available online: https://unfccc.int/process-and-meetings/the-paris-agreement/the-paris-agreement (accessed on 11 December 2019).
- Dubey, S.; Sarvaiya, J.N.; Seshadri, B. Temperature Dependent Photovoltaic (PV) Efficiency and Its Effect on PV Production in the World-A Review. Energy Procedia 2013, 33, 311–321. [Google Scholar] [CrossRef] [Green Version]
- Abdelrazik, A.S.; Al-Sulaiman, F.; Saidur, R.; Ben-Mansour, R. A review on recent development for the design and packaging of hybrid photovoltaic/thermal (PV/T) solar systems. Renew. Sustain. Energy Rev. 2018, 95, 110–129. [Google Scholar] [CrossRef]
- Kern, E.C., Jr.; Russell, M.C. Combined photovoltaic and thermal hybrid collector systems. In Proceedings of the Conference Record of the IEEE Photovoltaic Specialists Conference IEEE, Washington, DC, USA, 5 June 1978; pp. 1115–1153. [Google Scholar]
- Ren, X.; Yu, M.; Zhao, X.; Li, J.; Zheng, S.; Chen, F.; Wang, Z.; Zhou, J.; Pei, G.; Ji, J. Assessment of the cost reduction potential of a novel loop-heat-pipe solar photovoltaic/thermal system by employing the distributed parameter model. Energy 2020, 190, 116338. [Google Scholar] [CrossRef]
- Zhou, J.; Ma, X.; Zhao, X.; Yuan, Y.; Yu, M.; Li, J. Numerical simulation and experimental validation of a micro-channel PV/T modules based direct-expansion solar heat pump system. Renew. Energy 2020, 145, 1992–2004. [Google Scholar] [CrossRef]
- Arthur, O.; Karim, M.A. An investigation into the thermophysical and rheological properties of nanofluids for solar thermal applications. Renew. Sustain. Energy Rev. 2016, 55, 739–755. [Google Scholar] [CrossRef] [Green Version]
- Al-Waeli, A.H.A.; Kazem, H.A.; Sopian, K.; Chaichan, M.T. Techno-economical assessment of grid connected PV/T using nanoparticles and water as base-fluid systems in Malaysia. Int. J. Sustain. Energy 2018, 37, 558–575. [Google Scholar] [CrossRef]
- Hussain, F.; Othman, M.Y.; Sopian, K.; Yatim, B.; Ruslan, H.; Othman, H. Design development and performance evaluation of photovoltaic/thermal (PV/T) air base solar collector. Renew. Sustain. Energy Rev. 2013, 25, 431–441. [Google Scholar] [CrossRef]
- Othman, M.Y.; Yatim, B.; Sopian, K.; Abu Bakar, M.N. Performance studies on a finned double-pass photovoltaic-thermal (PV/T) solar collector. Desalination 2007, 209, 43–49. [Google Scholar] [CrossRef]
- Aste, N.; del Pero, C.; Leonforte, F. Water flat plate PV-thermal collectors: A review. Sol. Energy 2014, 102, 98–115. [Google Scholar] [CrossRef]
- Bergene, T.; Løvvik, O.M. Model calculations on a flat-plate solar heat collector with integrated solar cells. Sol. Energy 1995, 55, 453–462. [Google Scholar] [CrossRef]
- Kim, J.-H.; Kim, J.-T. The Experimental Performance of an Unglazed PVT Collector with Two Different Absorber Types. Int. J. Photoenergy 2012, 2012, 1–6. [Google Scholar] [CrossRef]
- Rossi, C.; Tagliafico, L.A.; Scarpa, F.; Bianco, V. Experimental and numerical results from hybrid retrofitted photovoltaic panels. Energy Convers. Manag. 2013, 76, 634–644. [Google Scholar] [CrossRef]
- Pieper, M.; Klein, P. A simple and accurate numerical network flow model for bionic micro heat exchangers. Heat Mass Transf. Stoffuebertragung 2011, 47, 491–503. [Google Scholar] [CrossRef]
- Charalambous, P.G.; Kalogirou, S.A.; Maidment, G.G.; Yiakoumetti, K. Optimization of the photovoltaic thermal (PV/T) collector absorber. Sol. Energy 2011, 85, 871–880. [Google Scholar] [CrossRef]
- Su, D.; Jia, Y.; Alva, G.; Liu, L.; Fang, G. Comparative analyses on dynamic performances of photovoltaic–thermal solar collectors integrated with phase change materials. Energy Convers. Manag. 2017, 131, 79–89. [Google Scholar] [CrossRef]
- Huang, M.J.; Eames, P.C.; Norton, B. Thermal regulation of building-integrated photovoltaics using phase change materials. Int. J. Heat Mass Transf. 2004, 47, 2715–2733. [Google Scholar] [CrossRef]
- Yuan, W.; Ji, J.; Modjinou, M.; Zhou, F.; Li, Z.; Song, Z.; Huang, S.; Zhao, X. Numerical simulation and experimental validation of the solar photovoltaic/thermal system with phase change material. Appl. Energy 2018, 232, 715–727. [Google Scholar] [CrossRef]
- Hasan, A.; McCormack, S.J.; Huang, M.J.; Norton, B. Evaluation of phase change materials for thermal regulation enhancement of building integrated photovoltaics. Sol. Energy 2010, 84, 1601–1612. [Google Scholar] [CrossRef] [Green Version]
- Yang, X.; Zhou, J.; Yuan, Y. Energy performance of an encapsulated phase change material PV/T System. Energies 2019, 12, 3929. [Google Scholar] [CrossRef] [Green Version]
- Fayaz, H.; Rahim, N.A.; Hasanuzzaman, M.; Rivai, A.; Nasrin, R. Numerical and outdoor real time experimental investigation of performance of PCM based PVT system. Sol. Energy 2019, 179, 135–150. [Google Scholar] [CrossRef]
- Xu, H.; Zhang, C.; Wang, N.; Qu, Z.; Zhang, S. Experimental study on the performance of a solar photovoltaic/thermal system combined with phase change material. Sol. Energy 2020, 198, 202–211. [Google Scholar] [CrossRef]
- Malvi, C.S.; Dixon-Hardy, D.W.; Crook, R. Energy balance model of combined photovoltaic solar-thermal system incorporating phase change material. Sol. Energy 2011, 85, 1440–1446. [Google Scholar] [CrossRef]
- Al-Maghalseh, M.; Mahkamov, K. Methods of heat transfer intensification in PCM thermal storage systems: Review paper. Renew. Sustain. Energy Rev. 2018, 92, 62–94. [Google Scholar] [CrossRef]
- Cao, X.; Yuan, Y.; Xiang, B.; Sun, L.; Xingxing, Z. Numerical investigation on optimal number of longitudinal fins in horizontal annular phase change unit at different wall temperatures. Energy Build. 2018, 158, 384–392. [Google Scholar] [CrossRef]
- Wu, S.; Zhu, D.; Zhang, X.; Huang, J. Preparation and Melting/Freezing Characteristics of Cu/Paraffin Nanofluid as Phase-Change Material (PCM). Energy Fuels 2010, 24, 1894–1898. [Google Scholar] [CrossRef]
- Chaichan, M.T.; Kamel, S.H.; Al-Ajeely, A.-M.N.M. Thermal conductivity enhancement by using nano-material in phase change material for latent heat thermal energy storage systems. Saussurea 2015, 5, 48–55. [Google Scholar]
- Rozanna, D.; Chuah, T.G.; Salmiah, A.; Choong, T.S.Y.; Sa’ari, M. Fatty Acids as Phase Change Materials (PCMs) for Thermal Energy Storage: A Review. Int. J. Green Energy 2005, 1, 495–513. [Google Scholar] [CrossRef]
- Bayram, Ü.; Aksöz, S.; Maraşlı, N. Temperature dependency of thermal conductivity of solid phases for fatty acids. J. Therm. Anal. Calorim. 2014, 118, 311–321. [Google Scholar] [CrossRef]
- Wang, X.; Sun, T.; Teja, A.S. Density, Viscosity, and Thermal Conductivity of Eight Carboxylic Acids from (290.3 to 473.4) K. J. Chem. Eng. Data 2016, 61, 2651–2658. [Google Scholar] [CrossRef]
Figure 1.
Variation of photovoltaic (PV) panel temperature at different phase change material (PCM) melting temperatures and thicknesses.
Figure 1.
Variation of photovoltaic (PV) panel temperature at different phase change material (PCM) melting temperatures and thicknesses.

Figure 2.
Front and back side of the hybrid solar panel design. The heat pipes (HPs), green elements, are the heat pipes and are placed under the black perimeter of the panel surface.
Figure 2.
Front and back side of the hybrid solar panel design. The heat pipes (HPs), green elements, are the heat pipes and are placed under the black perimeter of the panel surface.

Figure 3.
Cross-section of the hybrid solar panel.

Figure 4.
Prototype construction. (a) Heat pipe position; (b) Thermocouples placed within the interior of the PCM; (c) Panel filled with PCM before closure; (d) View of the final prototype with the front glass covering the air insulation layer.
Figure 4.
Prototype construction. (a) Heat pipe position; (b) Thermocouples placed within the interior of the PCM; (c) Panel filled with PCM before closure; (d) View of the final prototype with the front glass covering the air insulation layer.

Figure 5.
Hydraulic Scheme (a) and image (b) of the outdoor testing facility for PV/T panels.

Figure 6.
Incident solar irradiance (red line) and ambient temperature (blue line) for test configuration 1.
Figure 6.
Incident solar irradiance (red line) and ambient temperature (blue line) for test configuration 1.

Figure 7.
Electrical power (blue line) and thermal power (red line) generated in the first operating configuration.
Figure 7.
Electrical power (blue line) and thermal power (red line) generated in the first operating configuration.

Figure 8.
Temperature of the PCM for the different depths analyzed.

Figure 9.
Solar irradiance (red line) and ambient temperature (blue line) for test configuration 2.

Figure 10.
Electrical power (blue line) and thermal power (red line) generated in the second operating configuration.
Figure 10.
Electrical power (blue line) and thermal power (red line) generated in the second operating configuration.

Figure 11.
Temperature of the PCM for the different depths under analysis.

Figure 12.
PCM temperatures throughout one day for all the thermocouples.

Figure 13.
Evolution of the phase change process and the temperature in the PCM. Study conducted in CFD. (a) Liquid fraction (b) Temperature. (Note: simulations at a panel inclination of 42 °C).
Figure 13.
Evolution of the phase change process and the temperature in the PCM. Study conducted in CFD. (a) Liquid fraction (b) Temperature. (Note: simulations at a panel inclination of 42 °C).


Table 1.
Advantages and disadvantages of the PV/T-PCM/HP design.
| Advantages | Disadvantages |
|---|---|
| Local heat storage in the panel Greater thermal homogeneity Higher PV efficiency Heat/electricity ratio can be adjusted Dual PCM heating Less space required | Need for thermal insulation improvement More complex design and assembly Expansion absorption system |
Table 2.
PV panel technical characteristics.
| Peak Power: | |
| Voltage at max power | |
| Current at max power: | |
| Open circuit Voltage: | |
| Short circuit: | |
© 2020 by the authors. Licensee MDPI, Basel, Switzerland. This article is an open access article distributed under the terms and conditions of the Creative Commons Attribution (CC BY) license (http://creativecommons.org/licenses/by/4.0/).
Share and Cite
MDPI and ACS Style
González-Peña, D.; Alonso-deMiguel, I.; Díez-Mediavilla, M.; Alonso-Tristán, C. Experimental Analysis of a Novel PV/T Panel with PCM and Heat Pipes. Sustainability 2020, 12, 1710. https://0-doi-org.brum.beds.ac.uk/10.3390/su12051710
AMA Style
González-Peña D, Alonso-deMiguel I, Díez-Mediavilla M, Alonso-Tristán C. Experimental Analysis of a Novel PV/T Panel with PCM and Heat Pipes. Sustainability. 2020; 12(5):1710. https://0-doi-org.brum.beds.ac.uk/10.3390/su12051710
Chicago/Turabian StyleGonzález-Peña, David, Iván Alonso-deMiguel, Montserrat Díez-Mediavilla, and Cristina Alonso-Tristán. 2020. "Experimental Analysis of a Novel PV/T Panel with PCM and Heat Pipes" Sustainability 12, no. 5: 1710. https://0-doi-org.brum.beds.ac.uk/10.3390/su12051710
Note that from the first issue of 2016, this journal uses article numbers instead of page numbers. See further details here.