Topic Modeling of Online Accommodation Reviews via Latent Dirichlet Allocation


Department of Hospitality and Tourism Management, Tourism Industry Data Analytics Lab (TIDAL), Sejong University, Seoul 05006
*
Author to whom correspondence should be addressed.
Sustainability 2020, 12(5), 1821; https://0-doi-org.brum.beds.ac.uk/10.3390/su12051821
Submission received: 24 January 2020
/
Revised: 19 February 2020
/
Accepted: 27 February 2020
/
Published: 28 February 2020
(This article belongs to the Special Issue Sustainable Tourism in the Social Media and Big Data Era)
Abstract
:There is a lot of attention given to the determinants of guest satisfaction and consumer behavior in the tourism literature. While much extant literature uses a deductive approach for identifying guest satisfaction dimensions, we apply an inductive approach by utilizing large unstructured text data of 104,161 online reviews of Korean accommodation customers to frame which topics of interest guests find important. Using latent Dirichlet allocation, a generative, Bayesian, hierarchical statistical model, we extract and validate topics of interest in the dataset. The results corroborate extant literature in that dimensions, such as location and service quality, are important. However, we extend existing dimensions of importance by more precisely distinguishing aspects of location and service quality. Furthermore, by comparing the characteristics of the accommodations in terms of metropolitan versus rural and the type of accommodation, we reveal differences in topics of importance between different characteristics of the accommodations. Specifically, we find a higher importance for points of competition and points of uniqueness among the accommodation characteristics. This has implications for how managers can improve customer satisfaction and how researchers can more precisely measure customer satisfaction in the hospitality industry.
1. Introduction
Customer satisfaction is “a person’s feelings of pleasure or disappointment that results from comparing a product’s perceived performance or outcome with his/her expectations” [1]. Prior research in service industries has shown that customer satisfaction has a strong relationship with future repurchase intention, dubbed customer loyalty [2,3,4]. This link, in turn, is also suggested to have a strong impact on firm performance in service industries [5,6]. In the tourism industry specifically, research has shown that the quality of visitors’ relationship with a destination has a positive impact on their environmentally responsible behavior as well [7]. However, the subjective nature of meeting customer expectations makes measuring customer satisfaction notoriously difficult in the service sector since many dimensions exist to shape customer expectations.
A new paradigm in the form of Industry 4.0 potentially lends itself to holding many of the answers to the barriers that such difficult problems posed in the past [8,9]. Industry 4.0 combines “smart objects” (such as products and machines) with internet technology, allowing for economies of scale but for small-batch-sized productions [8]. This concept has been applied to service industries as well, and in the tourism industry it has been dubbed “Tourism 4.0” among some academics and industry professionals [10,11,12,13]. Due to the recency of the Tourism 4.0 paradigm, industry and governments have adopted the concept, for example a government project by Slovenia uses the term [10,13], though there is little academic research on the concept as of yet. Two of the key information technologies of Tourism 4.0, artificial intelligence and big data [10], are suggested by this study to be robust for identifying customers’ topics of discussion by utilizing online user-generated content. As part of the greater Industry 4.0 paradigm, Tourism 4.0 is defined by an “individualization on demand” wherein a shift to a buyer’s market rather than a seller’s market is a defining characteristic [8] (p. 239), thereby emphasizing the customers’ perspective over the sellers’.
We submit that customer satisfaction should be approached from the customer perspective. As such, we argue that online reviews offer a richer source of data than traditional survey methods for better understanding the holistic experiences of customers. Utilizing a topic modeling technique called latent Dirichlet allocation (LDA), we extract topics of discussion in online reviews because they reflect the topics that customers find important enough to discuss, but are not confined to only the service encounter itself nor confined by existing theoretical constructs of service quality. Comparing the topics between different types of accommodations and locations, a better understanding of customer satisfaction can be achieved relative to traditional, deductive approaches. Nevertheless, extant constructs of determinants of customers’ experiences in hospitality literature, are critical in the validation of useful information extracted from online reviews, and therefore are presented in greater detail in Section 2.
2. Literature Review
2.1. Measurement Scales of Customer Satisfaction in Hospitality
In 1986, Parasuraman, Zeithaml, and Berry published a multi-item survey to gauge the perceptions of service quality in four service sectors and called it SERVQUAL. Subsequent research critiqued SERVQUAL on that it does not adequately cover all service settings [14], and was found not to be optimal for application in the hospitality industry [15,16,17]. Several industry-specific modifications of the SERVQUAL scale have been introduced to suit the specific needs of customers within the context of the hospitality industry, such as LODGQUAL [15] and HOLSERV [17]. However, these measures focus mainly on hotel customers rather than customers in other accommodation types. Some researchers argue that SERVQUAL, along with similar measures, overemphasizes the provider and fails to represent a modern view of customer satisfaction wherein not only the rational functional product/service benefits, but the irrational emotional benefits affect purchasing decisions [18,19,20].
As such, the Customer Experience Quality (EXQ) construct was proposed and validated to encompass a more holistic perspective of the customers’ experiences [20,21]. However, implementation of EXQ has seen mixed results in the hospitality and tourism literature, such as a recent study in the tourism context that found that the structure of EXQ’s four dimensions were not confirmed via confirmatory factor analysis [22]. The shortcomings of currently used scales suggest that more research into customer satisfaction dimensions is still needed.
2.2. Dimensions of Customer Satisfaction in Hospitality
Measurement of customer satisfaction relies on sufficiently measuring all relevant dimensions of the customer experience. As the most commonly utilized instrument, SERVQUAL measures the perception of quality of the services provided via 22 items in five subscales, which include Tangibility (physical characteristics of the service encounter), Reliability (proper performance of services), Responsiveness (employees’ willingness to help), Assurance (employees’ knowledge and courtesy), and Empathy (employees’ ability to care) [23].
LODGQUAL identified three dimensions as important: Tangibility, Reliability, and a new dimension, Contact (representing the contact experience with employees) [15]. Similarly, HOLSERV found three dimensions: Employees (willingness to help, polite, knowledgeable, etc.), Tangibles (modern-looking equipment, fixtures and fittings, etc.), and Reliability (accurate and timely service, safe and secure stay, etc.) [17].
More recently, research has continued to develop using a variety of dimensions and questionnaire items for specific usage in different contexts within the hospitality industry. One research paper into Jordanian hotels used a modified SERVQUAL questionnaire called SERVPERF to evaluate hotel guests [24]. Research in Serbian 3-star hotels used SERVQUAL [25], and in Taiwan hotel guests were surveyed using another modified version of SERVQUAL [26].
2.3. Satisfaction and Accommodation Modalities
While a significantly large amount of research exists surrounding hotels and other traditional accommodation types, a relatively smaller amount of research has been done on specialist accommodation. While numerous studies have tried to define the concept of specialist accommodation in various ways, such as ‘supplementary accommodation’ [27], ‘boutique accommodation’ [28], and ‘specialist accommodation’ [29,30], we adhere to the terminology of ‘commercial home enterprises’ referring to accommodation in which guests may stay in private homes or other facilities that often have shared living areas with a relatively high level of interaction with owners, hosts or other guests, such as B&Bs, homestays, guesthouses, etc. [31,32,33]. In commercial home enterprises (CHEs), customers have different expectations since the products and services offered differ from traditional hotels [30]. Owners of commercial homes “prioritize personal values, quality of life, and personal interactions above economic gains” and it is reflected in the dimensions valued by CHE guests [34] (p. 115).
A study of bed and breakfasts in the United States found that important dimensions included personalized service, homeliness feel, bed comfort, privacy, cleanliness, and the helpfulness of advice about nearby restaurants and other attractions by the owner [35]. In South Africa, business travelers were observed as finding importance in several other dimensions for bed and breakfasts, such as professional and functional skills and abilities, amenities in general and those provided only for the room, ambiance, secure parking, and staff professionalism [36]. For bed and breakfasts in Taiwan, the facilities, service, environment, management, and emotive aspects were found to be important dimensions [37], while another Taiwanese bed and breakfast study found that the physical environment (e.g., equipment, décor, design ambiance), and personal interaction (e.g., staff expertise and problem solving skills) were important factors [38].
For guesthouses in China, a home atmosphere, facilities in the room and on the premises, cleanliness, service quality, value for money, and the location were found to be important dimensions in an analysis of online user-generated content (UGC) [39]. Similarly, another study of guesthouses in China found that sanitation, service and climate, room facilities, bedding, and shower were important dimensions [30]. It was found that for guesthouses in Ghana, atmospherics, enjoyment, entertainment, feeling of escape from daily life, efficiency, excellence, and economic value were important dimensions [40].
In Korea, an endemic, traditional type of CHE accommodation exists called a “hanok”, and it is popular for both domestic and international tourists. Hanok “literally means Korean house and it refers to an abode designed according to the traditional principles of Korean architectural culture” [34]. The traditional principles are known as pungsu-jiri (i.e., Feng Shui), and they direct how the traditional hanok accommodations are constructed [41]. As such, guests have very different expectations of the product and services offered at such establishments. While research is minimal on the subject of customer satisfaction dimensions for Korean hanoks, a study showed that hanok guests value staff and facilities (e.g., staff was helpful, bathrooms were clean, etc.), emotional value (e.g., pleasant stay experience), and functional value (e.g., value for price), wherein all dimensions had either direct or indirect impacts on revisit intention and word-of-mouth [42].
2.4. Extracting Dimensions of Interest in the Era of Big Data
Research suggests that big data, such as online reviews, is key to solving problems of the 21st century, such as by helping to reach sustainability development goals [43] or by giving insight into consumer experiences and behaviors [44]. Online reviews offer great insight into customer experiences for most services and products, and recent improvements in computing along with advances in methodologies have allowed for the analysis of online reviews at scale. There is evidence showing that online product ratings do not significantly impact sales [45,46]. On the other hand, many studies show a correlation between sales of products and customer’s online reviews [47,48,49,50]. Thus, implying that the content of online text reviews can be more important than numeric ratings. One study found that recommendations of book reviews were significant with book sales using 58,566 reviews of 610 books via multiple regression [47]. Similarly, another study determined a significant correlation exists between posted reviews and box office sales via pooled regression of 12,136 reviews of 40 movies [48]. Using the differences-indifferences method to analyze 134,904 reviews of 1636 books and 176,112 reviews of 2387 books, respectively, at different time points, it was demonstrated that improvement in book reviews can lead to an increase in relative book sales [49]. A logistic regression analysis of 31,522 reviews of 148 digital cameras indicates that reviews of products on review sites is an effective indicator of sales for high-involvement products [50]. Tobit regression on 1587 reviews of six products showed that while review depth is correlated with helpfulness, review extremity is less helpful particularly for experience goods [45]. Furthermore, no significant impact on box office revenues was found from the ratings of online reviews in a study of 95,867 reviews of 71 movies via three-stage least squares [46].
A comprehensive review of tourism literature for service quality showed that the most prominent issue in the literature from 2008 to 2019 was the impact on customer behavior from service quality [51]. In tourism and service sectors, such as the hospitality industry, studies show that the qualitative content in text of online reviews are influential to customers and offer rich content regarding customer experiences. One study used logistic regression on 5090 restaurant reviews to discover that the qualitative aspects of online reviews were the most influential factor in determining whether the reviews were useful or not [48]. Furthermore, another study used 5090 reviews of 45 restaurants in New York and London to find that the valence of the reviews has a U-shaped effect on usefulness and enjoyment, wherein negative ratings are more useful and positive ratings are associated with more enjoyment [52]. Using content analysis of 42,886 reviews of 774 Beijing hotels, customer satisfaction determinants were extracted through analyzing online reviews [53]. More recently, latent Dirichlet allocation was used to analyze 266,544 reviews from 39,287 unique reviewers of 25,670 hotels in 16 countries in order to extract the relative importance of customer experience dimensions [54]. A total of 29 dimensions were identified, of which, room experience and service quality were deemed most important [54]. In this study, we utilized the same technique to extract the dimensions of customer satisfaction within various accommodation types of South Korea in order to extract and compare the accommodation types without the confounding effect of country-specific differences.
3. Materials and Methods
3.1. Data Collection and Screening
This study applied latent Dirichlet allocation to Online Travel Agencies’ (OTAs) review corpora. Using scraping techniques applied through Java, the OTA reviews of accommodations across South Korea were extracted from Booking.com, Hotels.com, and Agoda.com over the course of one year, from January 1, 2018 to December 31, 2018. Subsetting the data for only English reviews, the 120,875 observations in the English subset were then cleaned to exclude duplicates and short texts of four words or less, resulting in a final dataset for analysis of 104,161 reviews. Therefore, the final dataset utilized for analysis included text reviews from 104,161 customers and several other corresponding variables including the date of review, data source, name of accommodation, location of accommodation, review rating, and type of accommodation.
Reviews were categorized by both location and accommodation type. For location types, reviews were dubbed as urban (n = 88,692) for accommodations located in seven Korean metropolitan cities: Seoul, Busan, Incheon, Daegu, Daejeon, Gwangju, and Ulsan. Otherwise, reviews were classified as rural (n = 15,469) for accommodations located outside metropolitan cities within six provinces: Gyeongi, Gyeongsang, Chungcheon, Jeolla, Gangwon, and Jeju. For accommodation types, hotels and motels were dubbed hotels (n = 22,011), Korean hanok-style accommodations in which guests usually sleep on the floor in a traditional-style Korean house were classified as hanok (n = 966), and guesthouses, bed and breakfasts, and hostels were named commercial home enterprises (CHEs) (n = 8784).
3.2. Analysis Tools and Techniques
Javascript was used for the scraping of data, whereas all data handling, screening, processing, and analysis was achieved through R versions 3.5 and 3.6. Key R packages used were stringr, tidyverse, and tm for handling data and preprocessing. Dictionary stemming was executed with the hunspell stemming dictionary via the hunspell package. For assessing the fit statistics of different levels of k, the ldatuning package was used. Training of the LDA model was accomplished through the topicmodels package. Base R coding was favored wherever applicable.
Preprocessing the text prior to modeling is a critical component of successful topic modeling. The first step in preprocessing textual data is the removing of stopwords. A list of common stopwords, such as ‘the’, ‘a’, ‘and’, etc. was used, as well as an extended list of stopwords specific to the dataset, such as ‘lol’, ‘haha’, etc. Tokenization of relevant word chunks and phrases was useful to avoid losing meaning in certain cases, such as ‘bus stop’, ‘taxi stop’, ‘metro station’, etc. Dictionary word stemming was selected over algorithmic stemming in order to minimize the occurrence of eliminating useful words, for example by avoiding short words like ‘bed’ being stemmed to ‘b’ due to the ending of ‘ed’. Dictionary stemming also proved to be more successful than algorithmic stemmers by removing proper nouns, which confounded the creation of useful topics, for example it creates topics focused on location names in reviews rather than the content of the reviews.
4. Results
4.1. Topic Extraction
The number of latent topics is an important decision in topic modeling. The optimal number of topics was assessed using several metrics [55,56,57,58]. The number of topics was set at 14 (k = 14) since it is the optimal number of topics that maximizes information divergence between all pairs of topics [58]. The information divergence criterion was chosen for its sensitivity to changes in the number of latent topics which was found to yield the most practical results in exploratory tests.
After extracting 14 topics through latent Dirichlet allocation, the topics were validated in a four-step procedure. First, a panel of four professors of hospitality and tourism management and one industry practitioner individually assessed the keywords with the highest beta values for each of the 14 topics. Second, the panel was given the topics in context using the top reviews with the highest proportions of each topic. In the third step, each topic was named accordingly by each panel member individually. Fourth, the topics were discussed and voted on until the panel reached a unanimous decision on the most suitable names for each of the 14 topics.
The reviews in the dataset were given probabilities by topic via the posterior distribution of the LDA model. Each review was classified into one of the 14 topics based on the topic that comprised the highest proportion of that review. The classifications were then analyzed by region and accommodation type.
4.2. Topic Identification
The 14 topics that were extracted via the latent Dirichlet allocation model are summarized in Table 1. Keywords were determined by those words with the highest beta value within the topic, i.e., the words with the highest relative probability of belonging to the given topic and were organized in order from most important to least important keyword per topic. As LDA is an admixture model, the same words can belong to more than one topic. Below, we briefly introduce each topic and the meaning of each.
General guest satisfaction topics include the overall evaluation and the value of the stay. The evaluation topic encompasses general guest evaluations in the veins of return intention (e.g., ‘back’, ‘plan’, ‘future’, ‘regret’), meeting/exceeding expectations (e.g., ‘expectations’, ‘satisfy’, ‘exceed’) and recommending to others (e.g., ‘recommend’, ‘mention’). The value topic relates to the price–quality relationship. Keywords related to the accommodation’s relative quality (e.g., ‘choice’, ‘quality’, ‘valuable’, ‘competitive’, ‘comparison’) signify a quality comparison with competitors in relation to keywords related to price (e.g., ‘price’, ‘money’, ‘cheap’, ‘expensive’, ‘afford’).
Service-related topics include reception, staff professionalism, hospitality, and amenities. The topic of reception includes the tasks associated with reception such as checking in and out (e.g., ‘check’, ‘booking’, ‘arrival’, ‘leave’), payment (e.g., ‘pay’, ‘charge’, ‘quote’), and others (e.g., ‘card’, ‘morning’, ‘call’, ‘request’), as well as includes the reception staff (e.g., ‘receptionist’, ‘lady’, ‘guy’, ‘rude’). The staff professionalism topic encompasses staff service quality (e.g., ‘friendly’, ‘helpful’, ‘service’, ‘polite’, ‘professional’), and communication ability (e.g., ‘speak’, ‘communicate’, ‘fluent’, ‘language’). The hospitality topic emphasizes the emotional warmth of the experience (e.g., ‘feel’, ‘experience’, ‘warm’, ‘atmosphere’) and the hospitality of the owner or staff (e.g., ‘owner’, ‘people’, ‘kind’, ‘accommodate’, ‘care’). The topic of amenities consists of bathroom amenities (e.g., ‘towel’, ‘toiletries’, ‘shampoo’), room amenities (e.g., ‘laundry’, ‘machine’, ‘fridge’, ‘kitchen’), free mini-bar items (‘free’, ‘included’, ‘provided’, ‘coffee’, ‘tea’, ‘water’ ), and breakfast (e.g., ‘breakfast’, ‘toast’, ‘egg’, ‘cereal’, ‘fresh’).
Location-related topics include accessibility, mobility, and the surrounding neighborhood. The topic of accessibility relates to transportation (e.g., ‘airport’, ‘terminal’, ‘international’, ‘stop’, ‘transfer’) to and from the accommodation from a long distance (e.g., ‘overnight’, ‘express’, ‘hour’, ‘layover’). Specifically, modes of transportation often associated with travel to and from the airport are observed (e.g., ‘shuttle’, ‘limousine’, ‘bus’, ‘taxi’, ‘flight’). The topic of mobility relates to transportation (e.g., ‘station’, ‘street’, ‘distance’, ‘road’, ‘exit’, ‘connect’) to and around the accommodation locally (e.g., ‘close’, ‘convenient’, ‘minute’, ‘nearby’). Specifically, modes of transportation often associated with travel within a localized area or city are observed (e.g., ‘subway’, ‘metro’, ‘train’, ‘walk’). The neighborhood topic encompasses the local attractions (e.g., ‘restaurant’, ‘shopping’, ‘café’, ‘market’, ‘mall’, ‘bar’, ‘sightseeing’), centrality (e.g., ‘nearby’, ‘local’, ‘centrality’, ‘district’, ‘heart’, ‘middle’), and local atmosphere (e.g., ‘quiet’, ‘busy’, ‘crowded’, ‘safe’) of the location.
Topics related to the physical condition of the room include room size, room condition and décor. The room size topic relates specifically to the size of the room (e.g., ‘room, ‘small, ‘big, ‘size’, ‘space’, ‘floor’, ‘large’, ‘bigger’), type of room (‘family’, ‘double’, ‘single’, ‘person’, ‘upgrade’, ‘standard’), and changing of rooms along with moving of luggage (e.g., ‘luggage’, ‘upgrade’, ‘move’, ‘lift’, ‘carry’, ‘stairs’, ‘elevator’). The room condition topic relates to the physical aspects of the room (e.g., ‘bathroom’, ‘shower’, ‘toilet’, ‘floor’, ‘pillow’, ‘sheet’, ‘sink’, ‘wall’, ‘door’) in relation to the condition of those physical aspects in terms of cleanliness (e.g., ‘smell’, ‘dirty’, ‘change’, ‘hair’, ‘smoke’, ‘stain’, ‘wet’, ‘mold’, ‘housekeeping’), and comfort (e.g., ‘hard’, ‘privacy’, ‘broken’, ‘soft’). The decor topic refers to the interior decoration and design of the room (e.g., ‘decorate’, ‘interior’, ‘modern’, ‘chic’, ‘stylish’, ‘furnishing’, ‘minimalist’, ‘decor’, ‘elegant’, ‘stiff’) as well as the general comfort and atmosphere (e.g., ‘clean’, ‘comfortable’, ‘cozy’, ‘spacious’, ‘neat’, ‘environment’, ‘roomy’).
Topics related to physical condition of the environment of the accommodation include the facilities and ambiance. The topic dubbed facilities relates to the facilities of the accommodation (e.g., ‘facility’, ‘pool’, ‘rooftop’, ‘gym’, ‘bar’, ‘spa’, ‘lounge’, ‘sauna’, ‘balcony’, ‘garden’, ‘terrace’), and, to a lesser extent, the view of the surrounding area (e.g., ‘view’, ‘beautiful’, ‘ocean’, ‘beach’, ‘sea’, ‘park’, ‘mountain’). The ambiance topic mainly encompasses three distinct ambient qualities of the room including sound (e.g., ‘noisy’, ‘hear’, ‘sound’, ‘loud’), light (e.g., ‘light’, ‘dark’), and air (e.g., ‘hot’, ‘cold’, ‘heat’, ‘stuffy’, ‘ventilation’). Things that directly affect these ambient qualities of the room are also included in the topic (e.g., ‘AC’, ‘air’, ‘conditioner’, ‘heater’, ‘floor’, ‘window’, ‘fan’, ‘thin’, ‘wall’, ‘construction’, ‘season’, ‘winter’, ‘summer’).
4.3. Topic Validation
In addition to keyword analysis of words with the highest beta values in each topic, validation of the topics was achieved by analyzing the review text with the highest proportion of the given topic. For example, the review with the highest proportion of the accessibility topic starts off with, “Bad memory about Airport shuttle bus to hotel. We catched a Limousine Airport bus to [the] hotel… but I didn’t know the bus stop at [the] hotel was the opposite road, we lost our way to Myeongdong…”, and continues discussing the author’s difficulties with accessibility from the airport to the hotel. Validation of topics was achieved by analyzing the top 10 reviews for each topic by each member of the panel, in addition to the keywords, and then voting until unanimity of naming the topics was achieved by the panel. For the sake of length, the full validation of topics is not expanded upon in this paper, however the authors strongly urge the importance of validating the topics in LDA by analyzing not only the top keywords, but analyzing the words in context of the reviews by evaluating the most prominent review for each topic.
4.4. Comparisons of Accommodation Characteristics
The number of reviews for each topic by the characteristics of urbanization of location, and accommodation types are reported in Table 2, while Table 3 reports the proportions of reviews as a percentage of each trait. Due to the relatively small sample size of hanok reviews, a larger discrepancy is required for statistical significance, so differences in proportion sizes should be inferred with caution in the hanok category.
Chi-square goodness of fit tests were applied to assess whether the distributions of topics within each trait (e.g., Urban, Rural, Hanok, etc.) were distributed equally. Wilcoxon Signed Rank tests were applied to assess whether there is a difference between the distribution of topics in one trait with all corresponding traits within the same characteristic (i.e., Urbanization, or Accommodation Type). Two proportions z-tests were applied to test whether a statistically significant difference exists between the proportion of each topic for each trait compared to the proportion of each topic in the corresponding traits.
4.4.1. Urbanization Comparison
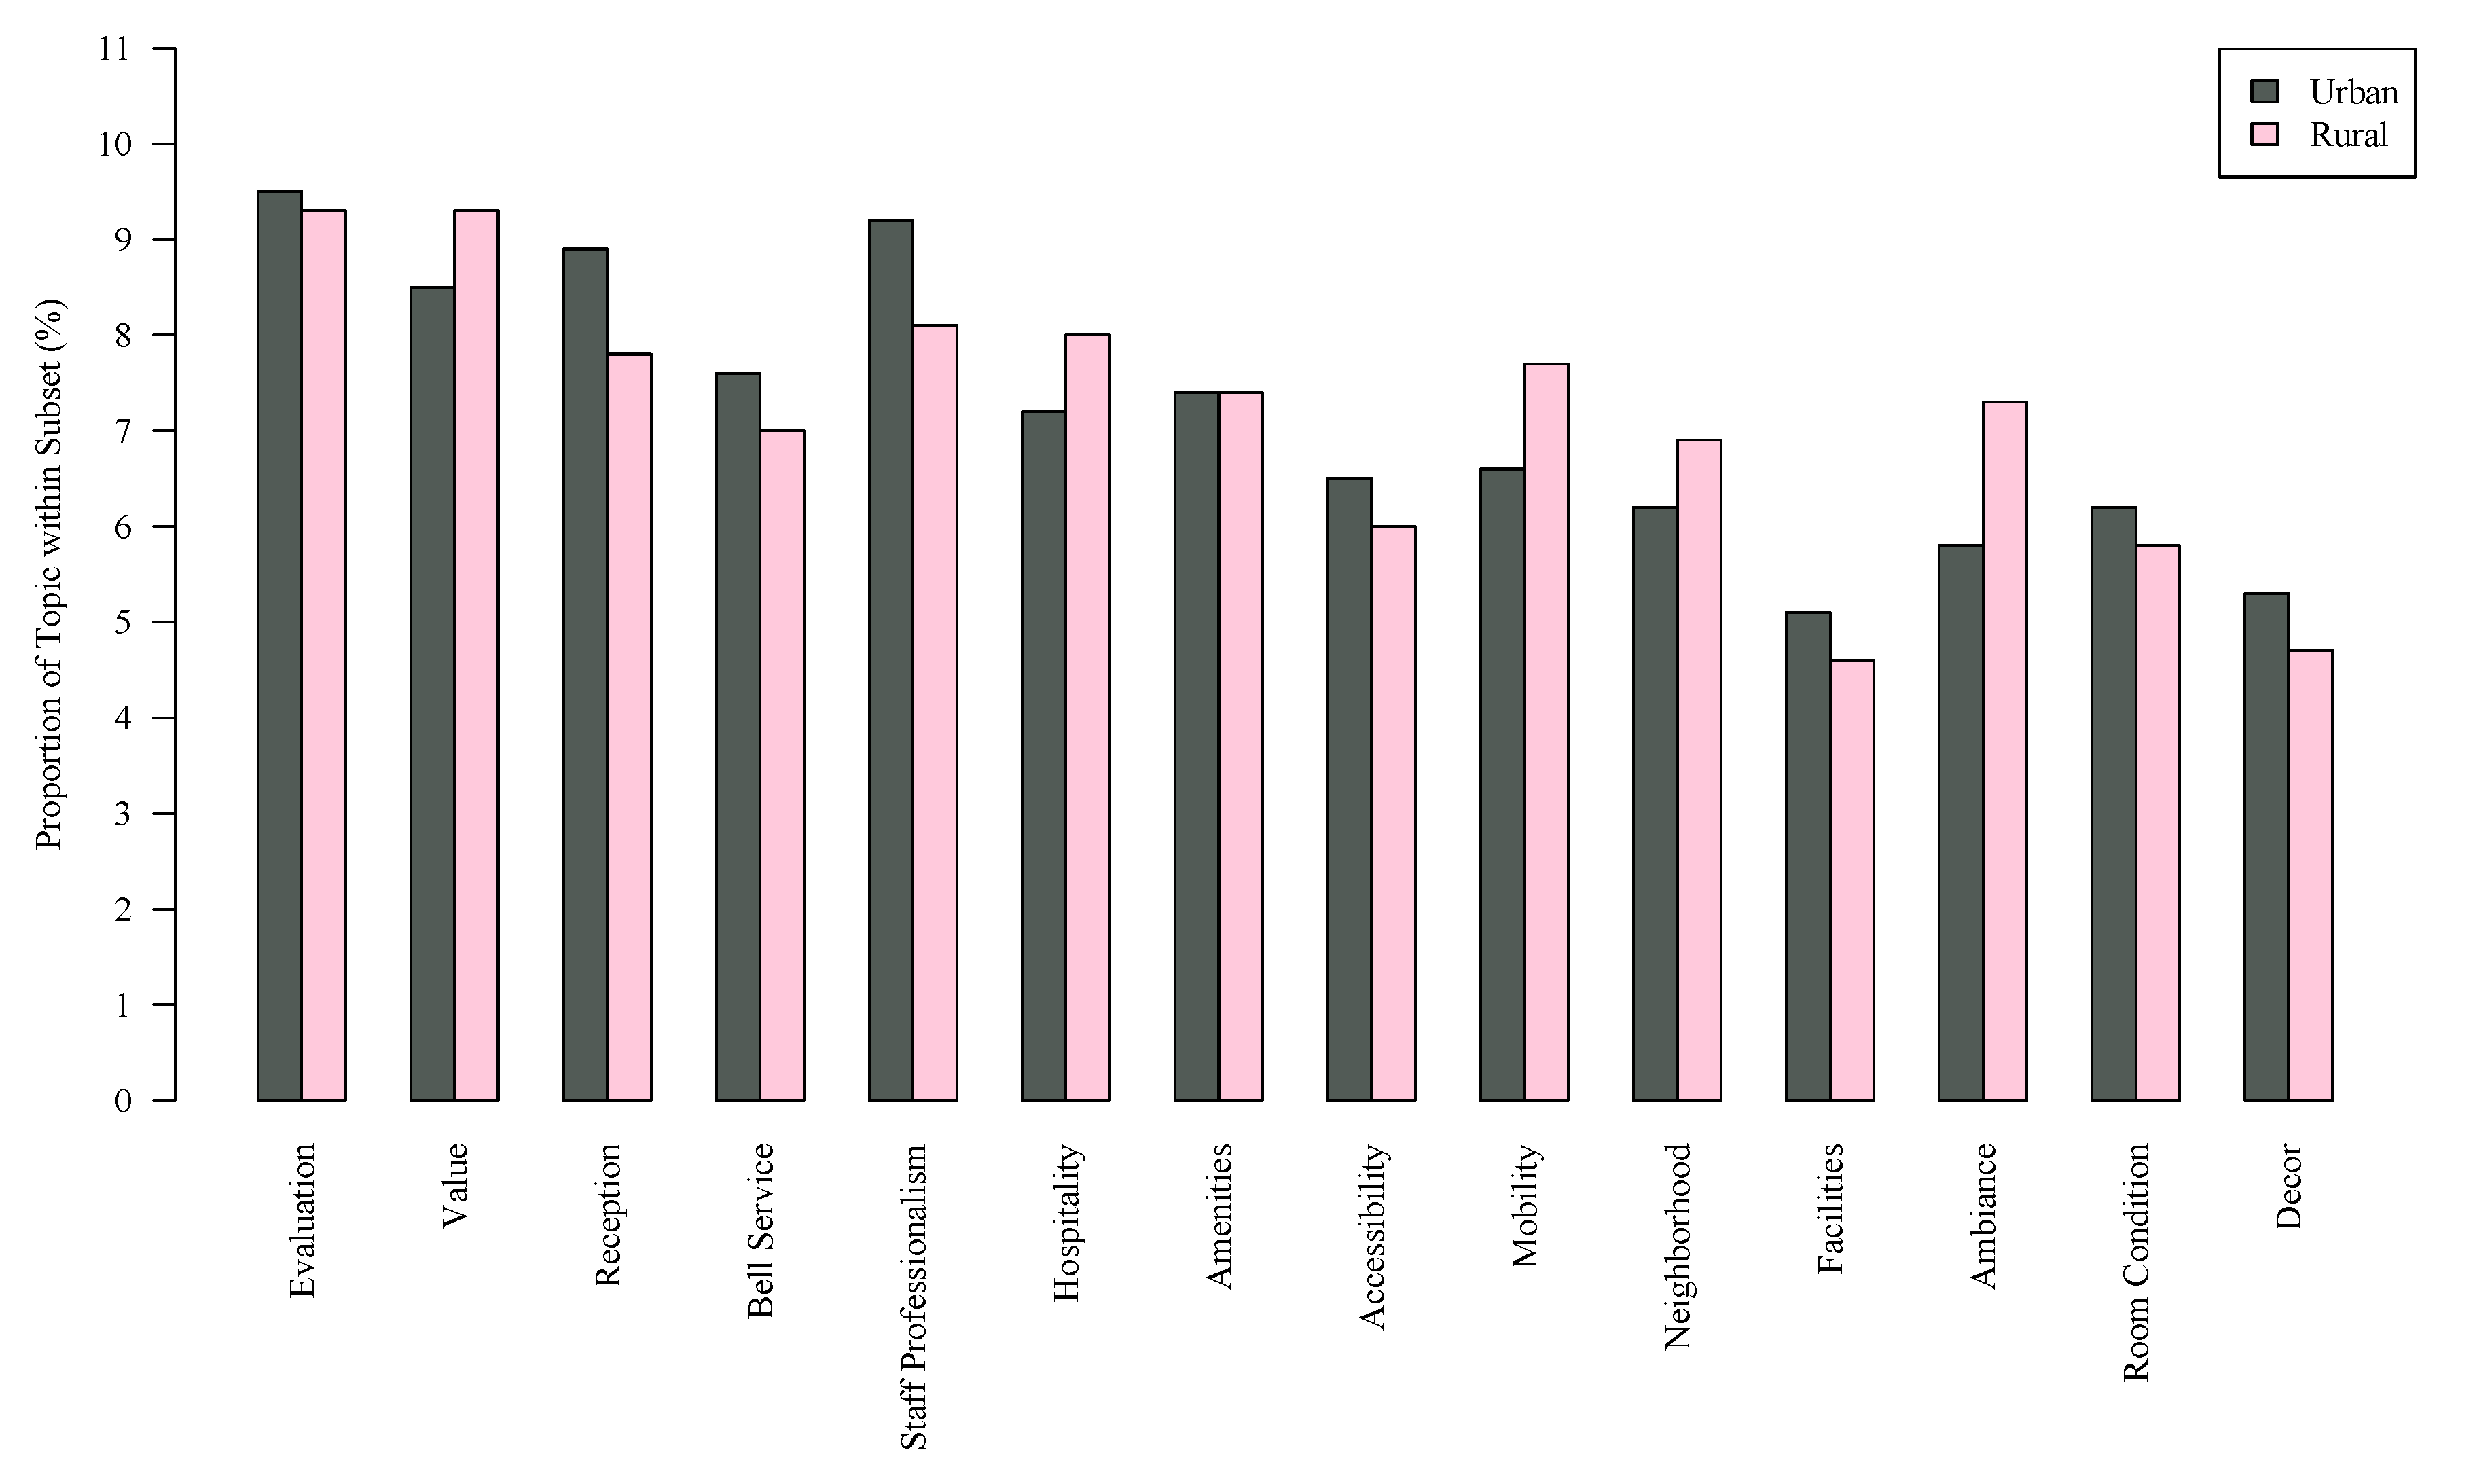
The chi-square goodness of fit tests reveal that topics are not equally distributed in reviews of urban locations (χ2 = 3339.40, p-value < 0.001) and rural locations (χ2 = 591.92, p-value < 0.001), thereby showing a difference in the importance of topics among customers staying in both urban and rural locations. Wilcoxon Signed Rank tests demonstrate that the distribution of the prominence of topics between urban versus rural locations are not the same (p-value < 0.001). Specifically, the most prominent topics for urban accommodations are evaluation, staff professionalism, and reception. Whereas, rural accommodations observe the highest proportion of reviews regarding both value and evaluation, followed by staff professionalism and hospitality. Comparisons between urban and rural accommodations via the proportions for each topic are visualized in Figure 1.
Two proportions z-tests determine whether a statistically significant difference exists between the proportion of a given topic between the urban and rural locations and their statistical significance is reported in Table 3. Reviews of rural accommodations relative to urban accommodations have a statistically higher focus on value, hospitality, ambiance, mobility, and neighborhood. We submit that the emphasis on warm hospitality in a location with easy access to the local area and sights is a response of guests wanting to connect with people and the local environment at a low price. The relatively lower emphasis on topics such as reception, room size, staff professionalism, facilities, room condition, and décor reinforce the image of customers staying in the countryside in order to escape the higher luxury and social rigidity of the metropolitan areas, in favor of stronger connections with the local people and the area.
Likewise, the higher focus on reception, room size, staff professionalism, facilities, room condition, and décor in urban accommodations relative to rural locations supports the idea that metropolitan guests tend towards professional service and chic, comfortable facilities with greater access to the airport compared to their rural counterparts. The lower emphasis on value indicates that the metropolitan clientele are less concerned about the price and more concerned with their overall satisfaction from higher service quality compared to overnight travelers to countryside towns.
4.4.2. Accommodation Type Comparison
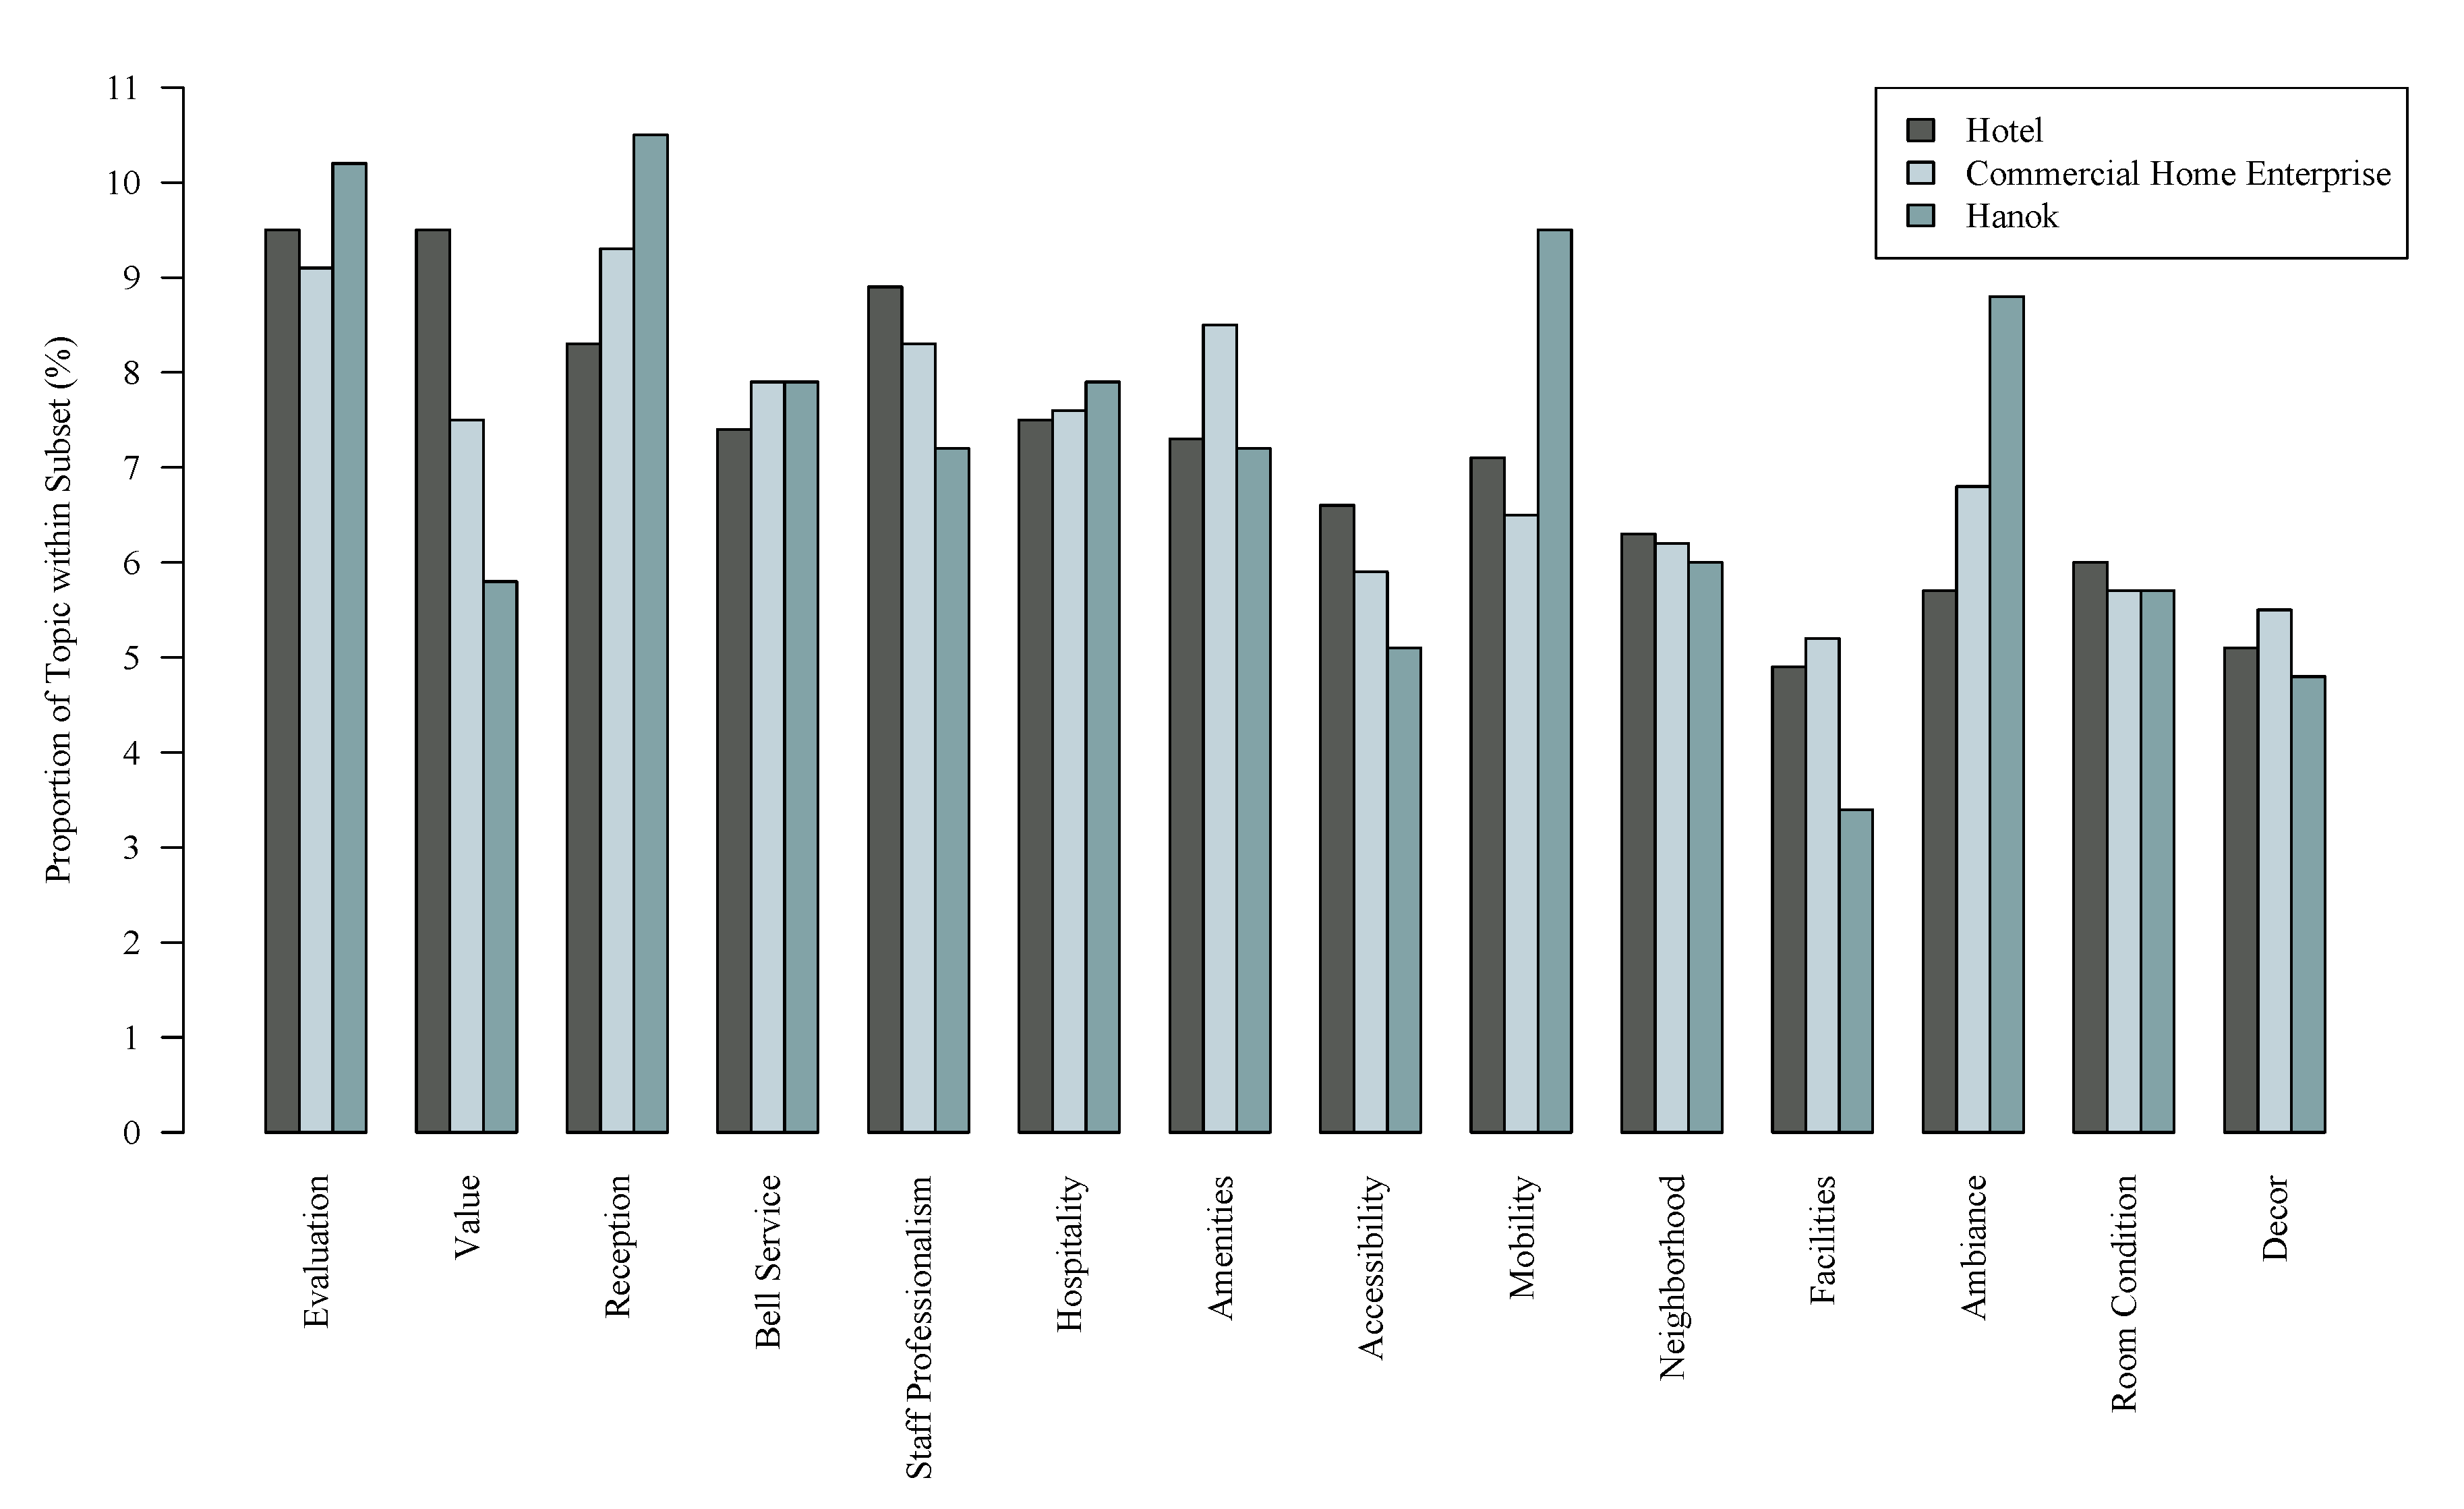
The chi-square goodness of fit tests reveal that topics are not equally distributed in reviews of hotels (χ2 = 901.02, p-value < 0.001), commercial home enterprises (χ2 = 296.12, p-value < 0.001), and hanoks (χ2 = 80.00, p-value < 0.001), thereby showing that some topics are more prominent than other topics for each accommodation type. The rank order of topics was compared using dependent two-group Wilcoxon signed rank tests between all pairs of accommodation types. All comparisons show a statistically different rank order between accommodation types at p < 0.001, meaning that the importance of topics differs between customers staying overnight at hotels, CHEs, and hanok accommodation. Specifically, hotels experience most reviews for evaluation, value, and professionalism. The most prominent topics for CHEs are reception, evaluation, and amenities. While similarly, hanok reviews are most prominent regarding reception, evaluation, and mobility.
Finally, two proportions z-tests were performed for each topic within each accommodation type and significance is reported in Table 3 as whether the topic within the type of accommodation is significantly different from the proportion of the same topic in all other accommodation types. The comparative proportions for each topic by accommodation type are visualized in Figure 2.
Points of competitiveness and uniqueness tend to be discussed topics with significantly higher proportions, while points that are often standardized or that have less variation are observed with much lower emphasis between accommodation types. A point of particular interest is the high proportion of ambiance in the traditional Korean hanok reviews relative to the lower proportions in CHEs and even lower in hotels. Hanoks are unique in that the building design virtually always has a heated ‘ondol’ floor system and guests often sleep on mats on the floor, which, from foreign travelers’ perspectives are a very unique point to overnight stays in hanoks. This ondol system is sometimes used in commercial home enterprises as well, but is much rarer in hotels. In fact, ambiance is one of the lowest ranking topics in hotels, which may be due to precisely the opposite effect—standardized control of air temperature and other ambient factors in hotels make the topic much less variable, and therefore less prominent as a topic of discussion for customers.
Another notable point of competitiveness is high price competition in hotels. The topic of value indicates that a relatively high proportion of reviews are dedicated to discussing the value of the hotel stay, while lesser so in CHEs. Commercial home enterprises, while also competitive on price, are much less so, since CHEs are comparatively less variable in price and already relatively cheap. We expect overnight travelers staying in hanoks are more interested in the experience than the price and are therefore less price sensitive.
While hanoks and hotels sometimes offer breakfast, it is not a considerably strong selling point. However, in CHEs, breakfast and other amenities are a strong selling point since many travelers staying in guesthouses, bed and breakfasts, and hostels are traveling on a budget and most CHEs offer some breakfast service, whether paid or otherwise. As might be expected, due to the competitive nature of amenities in guesthouses, it is of higher concern for reviewers, while much less so in both hotels and hanoks.
What makes each accommodation unique relative to other accommodation types is also a source for statistical differences in topic prevalence. Hotels highly prioritize professional service and, therefore, staff professionalism is notably more prevalent in hotel reviews. However, both hanoks and CHEs are considerably smaller than hotels, so without as many resources for staff service training, hanoks and CHEs instead focus on creating a more intimate and less formal relationship with customers. As such, we see a higher prominence of reception (and while not a significant difference, it may be notable that hospitality is also higher), rather than staff professionalism in CHEs and hanoks relative to hotels.
Another difference between accommodation types is the importance of location. While there are no significant differences between the prominence of the topic of neighborhood, there do exist differences in getting to and from the accommodation locations. Specifically, accessibility to the hotel from long distances is of more importance than accessibility to CHEs and hanoks. We propose that the reason is based on the purpose of stay. While access to the airport is often an important trait for hotels, the main reason of stay in a commercial home enterprise is generally price or connection with the locals, while hanok guests are generally most interested in the experience. Similarly, while mobility to and from the accommodation to the local area is also important in hotels, it is less important in CHEs, since the purpose of stay in guesthouses is price and also connecting with other people. For hanoks, however, mobility is important since hanoks are often built in clusters in close proximity to other hanoks in old neighborhoods. As such, traveling out of the old neighborhoods into the city centers and to other attractions might be an important concern.
5. Discussion
5.1. Conclusions
Latent Dirichlet allocation provides an inductive, data-driven approach that validates and extends current theory regarding the dimensions that affect customers in the hospitality industry by utilizing large, unstructured text directly coming from the consumers themselves. More precisely, important dimensions seen in literature such as service quality, location, value, etc., are corroborated by the LDA approach. However, LDA extends the theory by offering more precise distinctions between the dimensions. Whereas extant literature identifies the location as important [39,54], this study extracted three dimensions related to the location of the accommodation—its accessibility to and from out-of-town, the mobility in the local area, and the attractions and centrality of the neighborhood. LDA contributes further by distinguishing a statistical difference between different aspects of service quality in the topics of staff professionalism, hospitality, and reception as separate topics, as opposed to different items within the same dimension [24,30,37,39,40,42].
Evaluating the extracted topics by their proportionality within different characteristics of the accommodations reveals that points of competitiveness and uniqueness are the topics of higher relative prominence. Competitive points such as value in hotels, and staff professionalism in metropolitan cities are of statistically more prominence relative to the same topics in other accommodation types or rural towns. Points of uniqueness also see higher relative prominence, such as the ambient temperature in hanoks which are heated by traditional floor heating systems, or the neighborhood attractions in rural areas which generally offer more unique attractions than those in metropolitan areas.
5.2. Implications
Similarly to other studies using LDA [54], this study identifies more dimensions than traditional studies have identified. Since topics are determined statistically and inductively based on the consumers’ perspectives, the results should guide future researchers in developing more precise measurement tools that consider a holistic approach to customer determinants of satisfaction. The results also demonstrate that the importance of topics differs by accommodation characteristics, showing which topics are more important by urbanization of the city or accommodation type. We recommend researchers consider such factors when developing measurement tools, in that, all topics do not have equal weighting for shaping customer experience and those weightings differ for accommodations with different characteristics.
Results indicate topic areas that customers willingly choose to discuss and therefore the results bring the attention of industry practitioners to the topics that are relevant. However, customer reviews should be viewed with caution since they do not indicate valence. Therefore, it is of utmost importance to take the individual characteristics and preferences of the customers into account but to use the recommendations of this research to focus on which areas of interest those customers may focus on. This study helps hotel managers develop those areas of concern within their operations from the consumers perspective, not the providers perspective.
5.3. Limitations and Future Research
As the digital world, along with technologies of Tourism 4.0 such as big data and artificial intelligence, are being harnessed more efficiently and effectively in the hospitality industry [12], areas of future research are rapidly opening up. The new technologies in this paradigm shift are fundamental toward better understandings and predictions of tourist and consumer behaviors. Particularly, we hope to see future research applying topic modeling and other techniques in order to better serve the individualized preferences of customers and progress towards more sustainable business practices in the tourism industry. For example, research shows that better prediction and understanding of tourists’ behaviors can better help inform decisions on how to mitigate environmental impacts from tourism, such as cruise tourism [59], or with tourists renting cars [60]. We expect that better understanding of visitors’ behavior in the hospitality industry will better inform policymakers and managers for better environmental practices as well as business practices.
As with all research, several important limitations should be noted in the study. Using a sample of English reviews of Korean accommodations allows for a more precise understanding of the differences between accommodation types and locations since it is not confounded by the different characteristics that exist between countries within the same accommodation types. It also allows for a clearer distinction between countryside and metropolitan accommodations since, for example, there is more commonality between Korean metropolitan cities than there is between Korean metropolitan cities and other countries’ metropolitan cities. However, the inherent weakness of a single-country analysis means a lack of generalizability of the results to other countries. Therefore, we urge that further research be carried out to reveal the distinctions between accommodation characteristics in other countries as well.
Secondly, the use of online reviews may be biased in terms of the topics of interest being discussed. We expect selection bias in terms of which types of customers post reviews may exist, particularly in terms of the extremity of reviews. For example, customers with a particularly good or extremely bad experience are more likely to post an online review to recommend or warn others about the accommodation. While this would likely help to distinguish the topics of interest, it may bias the prominence of which topics are represented in terms of tending toward extremity.
Finally, due to limitations in the data available, many accommodation types are unlisted, and some are relatively broad categorizations, so more precision should reveal more distinctions between accommodation type categories. While star-rated hotels were used for the hotel categorization, lower rated hotels are often dubbed motels, and were not distinguished in the data used. Furthermore, different types of commercial home enterprises, such as hostels, guesthouses, pensions, and bed and breakfasts could also not be distinguished between. We expect more differences exist within the three broad categories of accommodation types that were used in this study, and hope that further research will shed light on those differences in the future.
Author Contributions
Conceptualization, I.S., K.K., S.K.L. and Y.S.; data collection, Y.S. and S.K.L., analysis, I.S., K.K., S.K.L. and J.B.; writing, I.S.; editing, I.S., K.K., S.K.L., J.B. and Y.S.; supervision, S.K.L. and J.B. All authors have read and agreed to the published version of the manuscript.
Funding
This research received no external funding
Acknowledgments
We would like to thank the Tourism Industry Data Analytics Lab members who helped support the research with helpful discussion—Youngjoo Ahn, Namho Lee, Young Sun Baek, Nahyoung Kim, and Cheolwoo Park.
Conflicts of Interest
The authors declare no conflict of interest.
References
- Kotler, P.; Keller, K.L. Marketing Management, 13th ed.; Pearson Education Inc.: Upper Saddle River, NJ, USA, 2009. [Google Scholar]
- Chen, S.-C. The customer satisfaction–loyalty relation in an interactive e-service setting: The mediators. J. Retail. Consum. Serv. 2012, 19, 202–210. [Google Scholar] [CrossRef]
- Kumar, V.; Pozza, I.D.; Ganesh, J. Revisiting the Satisfaction–Loyalty Relationship: Empirical Generalizations and Directions for Future Research. J. Retail. 2013, 89, 246–262. [Google Scholar] [CrossRef]
- Suh, J.-C.; Youjae, Y. When Brand Attitudes Affect the Customer Satisfaction-Loyalty Relation: The Moderating Role of Product Involvement. J. Consum. Psychol. 2006, 16, 145–155. [Google Scholar] [CrossRef]
- Bowen, J.T.; Chen McCain, S.-L. Transitioning loyalty programs: A commentary on “the relationship between customer loyalty and customer satisfaction”. Int. J. Contemp. Hosp. Manag. 2015, 27, 415–430. [Google Scholar] [CrossRef]
- Lee, H.S. Major Moderators Influencing the Relationships of Service Quality, Customer Satisfaction and Customer Loyalty. Asian Soci. Sci. 2013, 9, 2. [Google Scholar] [CrossRef] [Green Version]
- Zhou, X.; Tang, C.; Lv, X.; Xing, B. Visitor Engagement, Relationship Quality, and Environmentally Responsible Behavior. Int. J. Environ. Res. Public. Health 2020, 17, 1151. [Google Scholar] [CrossRef] [Green Version]
- Lasi, H.; Fettke, P.; Kemper, H.-G.; Feld, T.; Hoffmann, M. Industry 4.0. Bus. Inf. Syst. Eng. 2014, 6, 239–242. [Google Scholar] [CrossRef]
- Forum, W.E. The future of jobs: Employment, skills and workforce strategy for the fourth industrial revolution. In Proceedings of the Global Challenge Insight Report, World Economic Forum, Geneva, Switzerland, 22 January 2016. [Google Scholar]
- Peceny, U.S.; Urbančič, J.; Mokorel, S.; Kuralt, V.; Ilijaš, T. Tourism 4.0: Challenges in Marketing a Paradigm Shift. In Consumer Behavior and Marketing.; IntechOpen: London, UK, 2019. [Google Scholar]
- Alexis, P. R-Tourism: Introducing the Potential Impact of Robotics and Service Automation in Tourism. Ovidius Univ. Ann. Ser. Econ. Sci. 2017, 17, 211–216. [Google Scholar]
- Żukowska, M.; Szawluk, J.; Mańko, M.; Wodzyńska, A.; Panfiluk, E. TOURISM 4.0—DEVELOPMENT TRENDS OF THE HOTEL INDUSTRY. J. Szydlo Danuta Szpilko 2019, 87. [Google Scholar] [CrossRef]
- Urbančič, J.; Kuralt, V.; Ratkajec, H.; Straus, M.; Vavroš, A.; Mokorel, S.; Peceny, U.S.; Ilijaš, T. Expansion of Technology Utilization Through Tourism 4.0 in Slovenia. In Handbook of Research on Smart Technology Applications in the Tourism Industry; IGI Global: Hershey, PA, USA, 2020; pp. 229–253. [Google Scholar]
- Carman, J.M. Consumer perceptions of service quality: An assessment of T. J. Retail. 1990, 66, 33. [Google Scholar]
- Getty, J.M.; Thompson, K.N. A procedure for scaling perceptions of lodging quality. Hosp. Res. J. 1994, 18, 75–96. [Google Scholar] [CrossRef]
- Saleh, F.; Ryan, C. Analysing service quality in the hospitality industry using the SERVQUAL model. Serv. Ind. J. 1991, 11, 324–345. [Google Scholar] [CrossRef]
- Mei, A.W.O.; Dean, A.M.; White, C.J. Analysing service quality in the hospitality industry. Manag. Serv. Q. Int. J. 1999, 11, 324–345. [Google Scholar]
- Sureshchandar, G.S.; Rajendran, C.; Anantharaman, R.N. Determinants of customer-perceived service quality: A confirmatory factor analysis approach. J. Serv. Mark. 2002, 16, 9–34. [Google Scholar] [CrossRef]
- Verhoef, P.C.; Langerak, F.; Donkers, B. Understanding brand and dealer retention in the new car market: The moderating role of brand tier. J. Retail. 2007, 83, 97–113. [Google Scholar] [CrossRef] [Green Version]
- Maklan, S.; Klaus, P. Customer experience: Are we measuring the right things? Int. J. Mark. Res. 2011, 53, 771–772. [Google Scholar] [CrossRef]
- Klaus, P. ‘Phil’; Maklan, S. Towards a better measure of customer experience. Int. J. Mark. Res. 2013, 55, 227–246. [Google Scholar] [CrossRef] [Green Version]
- Milman, A.; Zehrer, A.; Tasci, A.D. Measuring the components of visitor experience on a mountain attraction: The case of the Nordkette, Tyrol, Austria. Tour. Rev. 2017, 72, 429–477. [Google Scholar] [CrossRef]
- Parasuraman, A.; Zeithaml, V.A.; Berry, L.L. Servqual: A multiple-item scale for measuring consumer perc. J. Retail. 1988, 64, 12. [Google Scholar]
- Al Khattab, S.A.; Aldehayyat, J.S. Perceptions of service quality in Jordanian hotels. Int. J. Bus. Manag. 2011, 6, 226. [Google Scholar] [CrossRef] [Green Version]
- BLEŠIĆ, I.; Ivkov-Džigurski, A.; Stankov, U.; Stamenković, I.; Bradić, M. Research of expected and perceived service quality in hotel management. Rev. Tur.-Stud. Si Cercet. Tur. 2011, 11, 6–14. [Google Scholar]
- Chang, H.-S. Increasing hotel customer value through service quality cues in Taiwan. Serv. Ind. J. 2008, 28, 73–84. [Google Scholar] [CrossRef]
- Nicod, P.; Mungall, A.; Henwood, J. Self-catering accommodation in Switzerland. Int. J. Hosp. Manag. 2007, 26, 244–262. [Google Scholar] [CrossRef]
- Morrison, A.M.; Pearce, P.L.; Moscardo, G.; Nadkarni, N.; O’Leary, J.T. Specialist accommodation: Definition, markets served, and roles in tourism development. J. Travel Res. 1996, 35, 18–26. [Google Scholar] [CrossRef]
- Pearce, P.L.; Moscardo, G.M. The boutique/specialist accommodation sector: Perceived government needs and policy initiatives. Qld. Small Bus. Res. J. 1992, 1, 34–41. [Google Scholar]
- Wang, S.; Hung, K.; Li, M. Development of measurement scale for functional congruity in guest houses. Tour. Manag. 2018, 68, 23–31. [Google Scholar] [CrossRef]
- Lynch, P.A. The commercial home enterprise and host: A United Kingdom perspective. Int. J. Hosp. Manag. 2005, 24, 533–553. [Google Scholar] [CrossRef]
- McIntosh, A.J.; Lynch, P.; Sweeney, M. “My Home Is My Castle” Defiance of the Commercial Homestay Host in Tourism. J. Travel Res. 2011, 50, 509–519. [Google Scholar] [CrossRef]
- Ye, S.; Xiao, H.; Zhou, L. Commodification and perceived authenticity in commercial homes. Ann. Tour. Res. 2018, 71, 39–53. [Google Scholar] [CrossRef] [Green Version]
- Choi, Y.; Buzinde, C.N.; Lee, C.-K. Visitor books and guest-generated discourses of hospitality: The case of the Hanok. Asia Pac. J. Tour. Res. 2015, 20, 114–132. [Google Scholar] [CrossRef]
- Zane, B. The B & B guest: A comprehensive view. Cornell Hotel Restaur. Adm. Q. 1997, 38, 69–75. [Google Scholar]
- Radder, L.; Wang, Y. Dimensions of guest house service. Int. J. Contemp. Hosp. Manag. 2006, 18, 554. [Google Scholar] [CrossRef]
- Wu, W.-C.; Yang, C.-Y. An Empirical Study on the Impact of Differences in Bed and Breakfast Service Quality Attributes on Customers’ Revisiting Desires. Int. J. Organ. Innov. Online 2010, 2, 223. [Google Scholar]
- Chen, C.M.; Chen, S.H.; Lee, H.T. Interrelationships between physical environment quality, personal interaction quality, satisfaction and behavioural intentions in relation to customer loyalty: The case of Kinmen’s bed and breakfast industry. Asia Pac. J. Tour. Res. 2013, 18, 262–287. [Google Scholar] [CrossRef]
- Wang, S.; Hung, K. Customer perceptions of critical success factors for guest houses. Int. J. Hosp. Manag. 2015, 48, 92–101. [Google Scholar] [CrossRef]
- Amoah, F.; Radder, L.; van Eyk, M. Perceived experience value, satisfaction and behavioural intentions: A guesthouse experience. Afr. J. Econ. Manag. Stud. 2016, 7, 419–433. [Google Scholar] [CrossRef]
- Hwang, D.J. Hanok Is Back; Seoul Gong Gan-Sa: Seoul, Korea, 2006. [Google Scholar]
- Behavioral Intentions of International Visitors to the Korean Hanok Guest Houses: Quality, Value and Satisfaction. Available online: https://www.cabdirect.org/cabdirect/abstract/20143249593 (accessed on 17 February 2020).
- Kharrazi, A.; Qin, H.; Zhang, Y. Urban big data and sustainable development goals: Challenges and opportunities. Sustainability 2016, 8, 1293. [Google Scholar] [CrossRef] [Green Version]
- Stoicescu, C. Big Data, the perfect instrument to study today’s consumer behavior. Database Syst. J. 2016, 6, 28–42. [Google Scholar]
- Mudambi, S.M.; Schuff, D. Research note: What makes a helpful online review? A study of customer reviews on Amazon. com. MIS Q. 2010, 34, 185–200. [Google Scholar] [CrossRef] [Green Version]
- Duan, W.; Gu, B.; Whinston, A.B. Do online reviews matter? An empirical investigation of panel data. Decis. Support Syst. 2008, 45, 1007–1016. [Google Scholar] [CrossRef]
- Chen, P.-Y.; Wu, S.; Yoon, J. The impact of online recommendations and consumer feedback on sales. ICIS 2004 Proc. 2004, 58. [Google Scholar]
- Liu, Y. Word of mouth for movies: Its dynamics and impact on box office revenue. J. Mark. 2006, 70, 74–89. [Google Scholar] [CrossRef]
- Chevalier, J.A.; Mayzlin, D. The effect of word of mouth on sales: Online book reviews. J. Mark. Res. 2006, 43, 345–354. [Google Scholar] [CrossRef] [Green Version]
- Gu, B.; Park, J.; Konana, P. Research note—the impact of external word-of-mouth sources on retailer sales of high-involvement products. Inf. Syst. Res. 2012, 23, 182–196. [Google Scholar] [CrossRef]
- Park, J.; Jeong, E. Service quality in tourism: A systematic literature review and keyword network analysis. Sustainability 2019, 11, 3665. [Google Scholar] [CrossRef] [Green Version]
- Park, S.; Nicolau, J.L. Asymmetric effects of online consumer reviews. Ann. Tour. Res. 2015, 50, 67–83. [Google Scholar] [CrossRef] [Green Version]
- Li, H.; Ye, Q.; Law, R. Determinants of customer satisfaction in the hotel industry: An application of online review analysis. Asia Pac. J. Tour. Res. 2013, 18, 784–802. [Google Scholar] [CrossRef]
- Guo, Y.; Barnes, S.J.; Jia, Q. Mining meaning from online ratings and reviews: Tourist satisfaction analysis using latent dirichlet allocation. Tour. Manag. 2017, 59, 467–483. [Google Scholar] [CrossRef] [Green Version]
- Griffiths, T.L.; Steyvers, M. Finding scientific topics. Proc. Natl. Acad. Sci. USA 2004, 101, 5228–5235. [Google Scholar] [CrossRef] [Green Version]
- Cao, J.; Xia, T.; Li, J.; Zhang, Y.; Tang, S. A density-based method for adaptive LDA model selection. Neurocomputing 2009, 72, 1775–1781. [Google Scholar] [CrossRef]
- Arun, R.; Suresh, V.; Madhavan, C.V.; Murthy, M.N. On finding the natural number of topics with latent dirichlet allocation: Some observations. In Proceedings of the Pacific-Asia Conference on Knowledge Discovery and Data Mining; Springer: Berlin/Heidelberg, Germany, 2010; pp. 391–402. [Google Scholar]
- Deveaud, R.; SanJuan, E.; Bellot, P. Accurate and effective latent concept modeling for ad hoc information retrieval. Doc. Numér. 2014, 17, 61–84. [Google Scholar] [CrossRef] [Green Version]
- Ruiz-Guerra, I.; Molina-Moreno, V.; Cortés-García, F.J.; Núñez-Cacho, P. Prediction of the impact on air quality of the cities receiving cruise tourism: The case of the Port of Barcelona. Heliyon 2019, 5, e01280. [Google Scholar] [CrossRef] [PubMed] [Green Version]
- Martín Martín, J.M.; Guaita Martínez, J.M.; Molina Moreno, V.; Sartal Rodríguez, A. An Analysis of the Tourist Mobility in the Island of Lanzarote: Car Rental Versus More Sustainable Transportation Alternatives. Sustainability 2019, 11, 739. [Google Scholar] [CrossRef] [Green Version]
Figure 1.
Proportions of topics by urbanization.

Figure 2.
Proportions of topics by accommodation type.


Table 1.
Latent topics with relevant keywords.
| Topic | Relevant Keywords |
|---|---|
| Evaluation | Stay, recommend, back, enjoy, pleasant, experience, happy, satisfy, wonderful, expectation, comfort, love, plan, future, regret, exceed, mention |
| Value | Location, price, money, facility, cheap, worth, reason, quality, afford, choice, budget, expensive, decent, paid, valuable, competitive, comparison |
| Reception | Check, book, day, desk, front, late, arrive, pay, quote, reception, morning, call, charge, wait, receptionist, key, card, leave, request, rude, lady, guy |
| Room Size | Room, small, big, luggage, size, space, floor, large, family, double, lift, person, single, upgrade, move, standard, bigger, carry, stairs, elevator |
| Staff Professionalism | Staff, friendly, helpful, service, speak, accommodate, kind, friend, polite, communicate, smile, spoke, professional, language, fluent, courteous, language |
| Hospitality | Hostel, guesthouse, guest, owner, host, kind, feel, house, home, travel, people, atmosphere, experience, love, warm, traditional, meet, beer, care, accommodate |
| Amenities | Breakfast, free, provide, coffee, water, towel, toiletries, include, available, kitchen, basic, laundry, machine, toast, drink, tea, buffet, amenity, shampoo, fridge, egg |
| Accessibility | Hotel, airport, bus, stop, convenient, taxi, shuttle, drive, terminal, pick, limousine, road, travel, transfer, international, overnight, express, layover, flight, hour |
| Mobility | Station, walk, subway, close, convenient, minute, location, distance, store, metro, train, exit, convenience, market, station, nearby, street, road, connect |
| Neighborhood | Area, restaurant, shopping, close, location, food, street, nearby, quiet, local, café, central, attraction, convenient, market, busy, mall, bar, sightseeing, district, safe |
| Facilities | Location, perfect, view, park, beach, beautiful, pool, facilities, relax, rooftop, gym, sea, bar, spa, ocean, swimming, lounge, garden, sauna, balcony, terrace, mountain |
| Ambiance | Room, night, sleep, open, hot, air, window, light, cold, noisy, problem, dark, wall, conditioner, heat, noise, warm, hear, heater, cool, floor, stuffy, fan, season, winter |
| Room Condition | Bathroom, shower, room, toilet, floor, towel, smell, bad, dirty, bath, door, pillow, sheet, hair, smoke, lock, mold, housekeeping, privacy, broken, soft, hard, stain |
| Decor | Clean, nice, comfortable, spacious, bed, modern, quiet, cozy, tidy, sign, decorate, interior, equipped, stylish, furnishing, chic, décor, minimalist, elegant, stiff, neat |
Table 2.
Latent topic review frequencies by accommodation characteristic.
| Topic | Urban | Rural | Hanok | Hotel | CHE |
|---|---|---|---|---|---|
| 1. Evaluation | 8469 | 1439 | 99 | 2097 | 796 |
| 2. Value | 7507 | 1442 | 56 | 2085 | 662 |
| 3. Reception | 7880 | 1214 | 101 | 1833 | 814 |
| 4. Room Size | 6780 | 1083 | 76 | 1623 | 695 |
| 5. Staff Professionalism | 8159 | 1259 | 70 | 1955 | 730 |
| 6. Hospitality | 6371 | 1232 | 76 | 1641 | 667 |
| 7. Amenities | 6542 | 1143 | 70 | 1609 | 751 |
| 8. Accessibility | 5721 | 934 | 49 | 1445 | 518 |
| 9. Mobility | 5832 | 1194 | 92 | 1555 | 571 |
| 10. Neighborhood | 5504 | 1064 | 58 | 1393 | 549 |
| 11. Facilities | 4555 | 716 | 33 | 1089 | 459 |
| 12. Ambiance | 5168 | 1124 | 85 | 1246 | 595 |
| 13. Room Condition | 5538 | 895 | 55 | 1316 | 497 |
| 14. Decor | 4666 | 730 | 46 | 1124 | 480 |
Table 3.
Latent topic review proportions by accommodation characteristic.
| Topic | Urban (%) | Rural (%) | Hanok (%) | Hotel (%) | CHE (%) |
|---|---|---|---|---|---|
| 1. Evaluation | 9.5 * | 9.3 | 10.2 | 9.5 | 9.1 |
| 2. Value | 8.5 *** | 9.3 *** | 5.8 *** | 9.5 *** | 7.5 *** |
| 3. Reception | 8.9 *** | 7.8 *** | 10.5 * | 8.3 *** | 9.3** |
| 4. Room Size | 7.6 *** | 7.0 ** | 7.9 | 7.4 ** | 7.9 • |
| 5. Staff Professionalism | 9.2 *** | 8.1 *** | 7.2 | 8.9 *** | 8.3 ** |
| 6. Hospitality | 7.2 *** | 8.0 *** | 7.9 | 7.5 | 7.6 |
| 7. Amenities | 7.4 | 7.4 | 7.2 | 7.3 *** | 8.5 *** |
| 8. Accessibility | 6.5 *** | 6.0* | 5.1 | 6.6 *** | 5.9 * |
| 9. Mobility | 6.6 *** | 7.7 *** | 9.5 ** | 7.1 | 6.5 * |
| 10. Neighborhood | 6.2 *** | 6.9 *** | 6.0 | 6.3 | 6.2 |
| 11. Facilities | 5.1 *** | 4.6 ** | 3.4 * | 4.9 | 5.2 |
| 12. Ambiance | 5.8 *** | 7.3 *** | 8.8 *** | 5.7 *** | 6.8 *** |
| 13. Room Condition | 6.2 *** | 5.8 * | 5.7 | 6.0 * | 5.7 |
| 14. Decor | 5.3 *** | 4.7 *** | 4.8 | 5.1 • | 5.5 |
Note: statistical significance levels are shown as 0.10 ≥ p-value > 0.05 (•), 0.05 ≥ p-value > 0.01 (*), 0.01 ≥ p-value > 0.001 (**), p-value ≤ 0.001 (***). Significance levels shown indicate statistical significance in two-proportions z-tests between the proportion of a give topic in a subset and proportion of the same topic in all other subsets.
© 2020 by the authors. Licensee MDPI, Basel, Switzerland. This article is an open access article distributed under the terms and conditions of the Creative Commons Attribution (CC BY) license (http://creativecommons.org/licenses/by/4.0/).
Share and Cite
MDPI and ACS Style
Sutherland, I.; Sim, Y.; Lee, S.K.; Byun, J.; Kiatkawsin, K. Topic Modeling of Online Accommodation Reviews via Latent Dirichlet Allocation. Sustainability 2020, 12, 1821. https://0-doi-org.brum.beds.ac.uk/10.3390/su12051821
AMA Style
Sutherland I, Sim Y, Lee SK, Byun J, Kiatkawsin K. Topic Modeling of Online Accommodation Reviews via Latent Dirichlet Allocation. Sustainability. 2020; 12(5):1821. https://0-doi-org.brum.beds.ac.uk/10.3390/su12051821
Chicago/Turabian StyleSutherland, Ian, Youngseok Sim, Seul Ki Lee, Jaemun Byun, and Kiattipoom Kiatkawsin. 2020. "Topic Modeling of Online Accommodation Reviews via Latent Dirichlet Allocation" Sustainability 12, no. 5: 1821. https://0-doi-org.brum.beds.ac.uk/10.3390/su12051821
Note that from the first issue of 2016, this journal uses article numbers instead of page numbers. See further details here.