Article

A Novel Extended Higher-Order Moment Multi-Factor Framework for Forecasting the Carbon Price: Testing on the Multilayer Long Short-Term Memory Network

1
School of Management, Hefei University of Technology, Hefei 230009, China
2
Key Laboratory of Process Optimization and Intelligent Decision-Making, Ministry of Education, Hefei 230009, China
3
Department of Education and Literacy, Government of Sindh, Hyderabad 70060, Tando Jam, Pakistan
*
Authors to whom correspondence should be addressed.
Sustainability 2020, 12(5), 1869; https://0-doi-org.brum.beds.ac.uk/10.3390/su12051869
Submission received: 15 February 2020 / Revised: 27 February 2020 / Accepted: 27 February 2020 / Published: 2 March 2020
(This article belongs to the Special Issue Forecasting Financial Markets and Financial Crisis)

Abstract

:
Predicting the carbon price accurately can not only promote the sustainability of the carbon market and the price driving mechanism of carbon emissions, but can also help investors avoid market risks and increase returns. However, previous research has only focused on the low-order moment perspective of the returns for predicting the carbon price, while ignoring the shock of extreme events and market asymmetry originating from its pricing factor markets. In this paper, a novel extended higher-order moment multi-factor framework (EHM-APT) was formed to improve the prediction and to capture the driving mechanism of the carbon price. Furthermore, a multi-layer and multi-variable Long Short-Term Memory Network (Multi-LSTM) model was constructed so that the parameters and structure could be determined experimentally for testing the performance of the proposed framework. The results show that the pricing framework considers the shock of extreme events and market asymmetry and can improve the prediction compared with a framework that does not consider the shock of higher-order moment terms. Additionally, the Multi-LSTM model is more competitive for prediction than other benchmark models. This conclusion proves the rationality and accuracy of the proposed framework. The application of the pricing framework encourages investors and financial institutions to pay more attention to the pricing factor of extreme events and market asymmetry for accurate price prediction and investment analysis.

1. Introduction

Upon signing the Kyoto protocol, the carbon market was formally established in 2005 in an attempt to reduce global greenhouse gas. The carbon market defines virtual carbon emission rights as scarce valuable assets, gives them commodity attributes, and realizes the target of resource allocation and emission reduction through market transaction among reduction entities. The signing of the Paris Agreement in December 2015 further highlights the carbon market’s capital allocation for achieving emission reduction on a global scale [1]. As a core issue of the carbon market mechanism, accurate forecasting of the carbon price can develop an efficient carbon pricing mechanism, and also help investors to avoid market risks and to increase returns. As an emerging policy-based artificial market, the carbon market is characterized by strong sensitivity to policy shocks, especially carbon dioxide (CO2) reduction policies and carbon quota policies [2]. Therefore, as for the certain pricing framework, the prediction of the carbon price should not only follow the basic pricing method of general financial assets, but also reflect the special driving mechanism of the carbon price.
Further evidence has verified that the shock of policy turbulence (like the implementation of carbon tax) and uncertainty in the energy and financial markets can easily affect the carbon price through financial channels [3]. In other words, the shock from the energy and financial markets will also have an impact on the carbon price forecast and price fluctuation. Consequently, the carbon price is vulnerable to national strategies, government regulations, international agreements, and other policy factors, as well as asymmetric influences from market participants’ behaviors that originate from its influential markets. Thus, it is worth exploring the carbon price driving mechanism, which reflects the impact of external shock and market asymmetry.
However, the common foundation of existing research only focuses on the low-order moment perspective of the returns (market return and variance), while ignoring the shock of extreme events and market asymmetry originating from its influential markets from the framework of higher-order moment (market skewness and kurtosis). That is, these ignored factors are not included in the analysis framework of the pricing mechanism. Actually, market skewness and kurtosis have proven to be valuable indicators that characterize market asymmetry information and market extreme factors for explaining portfolio returns [4]. This kind of defect makes the accuracy of the existing carbon price prediction questionable.
To overcome this weakness, the multivariate skew-GARCH (Generalized Autoregressive Conditional Heteroskedasticity) model, which incorporates the third-order moment of financial assets, was introduced to explain finance return and the asymmetric relation among some European financial markets [5]. However, the multivariate skew-GARCH model has more parameters to be estimated, and needs certain assumptions on the tail distribution of the residual. Furthermore, Fry et al. [6] developed a binary higher-order moment Capital Asset Pricing Model (CAPM) model, which considers the shock of co-skewness and co-kurtosis to represent the risk of market asymmetry and extreme event on the return of the portfolio. As a result, the higher-order moment CAPM model provides a reasonable framework to study the pricing of carbon assets under the impact of external events and information asymmetry. As we know, policy factors and information asymmetry are important external factors affecting the carbon price. While many scholars use Extreme Value Theory (EVT) to examine extreme risk shocks in financial markets [7], the EVT model ignores the extreme shock from other relevant markets and only considers the extreme impact generated by the financial market itself. Thus, the higher-order moment CAPM model is superior to EVT-based models in describing the asset prices affected by the extreme event shocks.
However, the higher-order moment CAPM model mentioned above is limited in its ability to describe the relationship between two assets, and requires that the asset returns obey the binary standard normal distribution, which makes it difficult to capture the non-linear mapping relationship between the carbon price and the multiple pricing factors.
The aim of this article is to construct a novel extended higher-order moment multi-factor framework for forecasting the carbon price, in which the framework is in line with the non-linear and peak thick tail characteristics of the carbon price. Furthermore, this paper relaxes the framework of higher-order moment CAPM mentioned above to multivariate factors, and brings the higher-order moment terms that indicate the shock of market asymmetry and extreme events originating from its influential markets into the carbon pricing framework. Thus, based on the arbitrage pricing theory (APT), an extended higher-order moment multi-factor framework (EHM-APT) that conforms to the special driving mechanism of the carbon price is formed. The above research design is to compensate for the inaccurate pricing caused by neglecting the pricing factors of extreme events and market asymmetry information. The proposed framework is convinced that the carbon price can be theoretically explained by the higher-order moment terms of its influential markets. Further, this article uses a machine learning method to empirically evaluate the accuracy and performance of the framework. Specifically, this paper utilizes the Long Short-Term Memory network with the designed multi-layer and multi-variable structure (Multi-LSTM) to predict the carbon price and capture the non-linear mapping relationship between the carbon price and its pricing factors.
The conclusion of this article summarizes that the proposed EHM-APT framework can significantly improve the prediction of the carbon price. That is to say, the co-skewness and co-kurtosis, which represent the market asymmetry and extreme events, which stem from its pricing factor markets, are indispensable factors for predicting and fitting the carbon price. Therefore, it is valuable to allocate and arrange funds for carbon investors by taking market extreme factors and market asymmetric information as indispensable pricing factors. The conclusion of this article and the proposed pricing framework will help investors to predict and analyze the carbon price both effectively and accurately.
The remaining structure of this paper is as follows: Section 2 reviews the related literature. Section 3 introduces the methodology of this paper. Section 4 presents the experiment analysis, contains the descriptive statistics and the design of the Multi-LSTM model, and offers the results and the discussion. Section 5 concludes this paper and puts forward ideas for further research.

2. Literature Review

The growing academic literature on carbon price forecasting has focused on two major perspectives: One is the traditional econometric models, the other is the artificial intelligence models.
For traditional econometric models, the GARCH model has potential advantages in capturing the non-linear characteristics of the carbon price. Chevallier [8] proposed that the asymmetric threshold GARCH model can effectively capture the characteristics of the carbon future price and improve prediction accuracy. Byun et al. [9] put forward that GARCH-type models are superior to the k-nearest neighbor model for predicting the carbon price. Koop and Tole [10] created the dynamic model averaging (DMA) method to forecast the carbon price, and the results showed a high prediction accuracy compared with the Bayesian model and the time-varying parameter regression model. Sanin et al. [11] demonstrated that the integration of Autoregressive Moving Average model (ARMAX) and the GARCH model, when using a time-varying jump process, can accurately predict the carbon price compared with a standard ARMAX–GARCH framework. Benz et al. [12] concluded that the Markov regime-switching GARCH model outperforms other Markov regime-switching or simple GARCH models in forecasting the carbon price. In addition, Chevallier [13] maintained that a nonparametric method of predicting the carbon price can reduce the prediction error by almost 15% compared with linear autoregression models. Based on the integration of the threshold dynamic conditional correlation (DCC) GARCH model and the full Baba, Engle, Kraft, and Kroner (BEKK) GARCH model, the volatility spillover from the price decrease of the energy market may have a stronger shock on carbon price, and the GARCH-based model can better reveal the price volatility mechanism of carbon assets based on the analysis of volatility spillover [14,15].
However, the applicability of traditional econometric models usually requires that the returns follow a strict hypothesis, such as normal distribution at the tail of carbon returns [16]. As a matter of fact, the carbon return has significant non-normal and non-linear characteristics, and asset returns exhibit a peak and thick tail feature [8], which results in traditional pricing methods failing to predict the carbon price accurately.
Being capable of mapping non-linear functions and not needing to consider the tail distribution of return series, artificial intelligence methods include artificial neural network (ANN), support vector machine (SVM), least squares support vector machine (LSSVM), multilayer perceptron (MLP), and Hybrid Fuzzy Neural Network (HFNN), which are superior to traditional econometric models in solving forecasting issues [17,18]. To determine the parameters of the LSSVM model, Zhu et al. [19] proposed an integration approach of a group method of data handling (GMDH), particle swarm optimization (PSO), and the LSSVM model for carbon price prediction, in which the prediction accuracy is higher than that of ANN and the autoregressive integrated moving average (ARIMA) model. Fan et al. [20] established an MLP–ANN prediction model, and the results showed that the proposed model has good performance compared with the models of ARIMA, ANN, and LSSVM. Recently, research has found that an integrated model that combines the EMD (Empirical model decomposition) method with ANN and LSSVM can achieve better performance for forecasting the carbon price than that of the EMD method alone [21]. Additionally, Atsalakis [22] proposed a computational intelligence-based model with a novel hybrid neuro-fuzzy controller for forecasting the carbon price, which obtained a higher accuracy. Zhu et al. [23] combined variational mode decomposition (VMD) and spiking neural networks (SNNs) to improve forecasting accuracy and reliability.
There are two defects in the above research. Firstly, the foundation of these studies may ignore the shock of the higher-order moment attribute (skewness–kurtosis) of the pricing factors on the carbon price. The common theoretical basis of the above models is exploring the linear or non-linear regression relationship between the carbon price and its pricing factors under the multi-factor framework, which is a manner of the low-order moment of return. Correspondingly, the previous studies imply the hypothesis that the shock of extreme events or information asymmetry that stem from its pricing factor markets will not affect carbon price. Secondly, the forecasting models mentioned in previous research are flawed in their ability to predict carbon price accurately. Because the traditional statistical and econometric models require that the return follows a strict hypothesis, artificial intelligence methods are easily able to fall into local minima for solving forecasting issues and have difficulty in achieving a globally optimal situation.
Therefore, to remedy the shortcomings of the existing research, the contributions of this paper are as follows: firstly, this article relaxes the framework of binary higher-order moment CAPM to multivariate factors. That is, to bring the higher-order moment terms that indicate the shock of market asymmetry and extreme events into the carbon pricing framework. As for the framework, a complex non-linear and non-structural relationship between the carbon price and its pricing factors cannot be ignored. Therefore, the second innovation is the creation of a model of Multi-LSTM with the designed multi-layer and multi-variable structure to capture the non-linear mapping relationship between the carbon price and its pricing factors. The reasons for selecting the Multi-LSTM network are as follows: on the one hand, the Multi-LSTM has an advantage in handling time series data with non-linear and complex relationships, which is consistent with the time lag characteristic of the carbon price sequence. On the other hand, a remarkable feature of Multi-LSTM in the training process is that the model adjusts adaptively for obtaining optimal parameters and structure, and can also avoid falling into the local optimal solution [24], rather than the other optimization models such as the genetic algorithm and the backpropagation algorithm used in the process of neural network training [25,26].

3. Methodology

In this section, we theoretically explain the construction process of the novel extended higher-order moment multi-factor pricing framework. Based on this, the Multi-LSTM network for fitting the pricing framework is introduced.

3.1. A Novel Extended Higher-Order Moment Multi-Factor Framework (EHM-APT)

According to the higher-order moment CAPM model proposed by Hwang et al. [27], the return of financial assets is affected not only by systemic risk, but also by irrational behavior and extreme external shock represented by co-skewness and co-kurtosis. Therefore, the higher-order moment CAPM model can reveal more price characteristics than the traditional CAPM model.
The higher-order moment CAPM model, according to Hwang et al. [27], is as follows:
E ( R i ) R f = a 1 β i m + a 2 γ i m + a 3 δ i m
and
β i m = E [ ( r i , t E ( r i , t ) ) × ( r m , t E ( r m , t ) ) ] E ( r i ) × E ( r m )
γ i m = E [ ( r i , t E ( r i , t ) ) × ( r m , t E ( r m , t ) ) 2 ] E ( r i ) × E ( r m ) 2
δ i m = E [ ( r i , t E ( r i , t ) ) × ( r m , t E ( r m , t ) ) 3 ] E ( r i ) × E ( r m ) 3
where E ( R i ) R f is the excess return of the asset portfolio, a 1 , a 2 , a 3 represents the risk premium coefficient of β i m , γ i m , δ i m respectively. β i m is the coefficient of co-variance and represents the shock of the first-order centered moment (return) of asset portfolio m on the first-order centered moment (return) of asset i, γ i m is the coefficient of co-skewness and represents the shock of the second-order centered moment (variance) of asset portfolio m on the first-order centered moment (return) of asset i, and δ i m is the coefficient of co-kurtosis and represents the shock of the third-order centered moment (skewness) of asset portfolio m on the first-order centered moment (return) of asset i. The co-skewness reflects the information asymmetry of market investment, and the negative skewness results in the probability of return decline exceeding the probability of rise, thus increasing the losses for investors [6]. Correspondingly, higher co-kurtosis increases the probability of extreme events, which reflects the impact of external events on market investment.
For examining the shock of higher-order moment terms on the portfolio return, Fry et al. [6] developed an extended higher-order moment CAPM model by introducing co-skewness and co-kurtosis into the traditional CAPM framework. The suggested model, which incorporates bivariate normal distribution under the shock of co-skewness and co-kurtosis, is shown as
f cos k n e s s ( r 1 , t , r 2 , t ) = exp ( 1 2 ( 1 1 ρ 2 ) ( ( r 1 , t μ 1 σ 1 ) 2 + ( r 2 , t μ 2 σ 2 ) 2 2 ρ ( r 1 , t μ 1 σ 1 ) ( r 2 , t μ 2 σ 2 ) ) + θ 12 ( r 1 , t μ 1 σ 1 ) 1 ( r 2 , t μ 2 σ 2 ) 2 η )
f c o k u r t o s i s ( r 1 , t , r 2 , t ) = exp ( 1 2 ( 1 1 ρ 2 ) ( ( r 1 , t μ 1 σ 1 ) 2 + ( r 2 , t μ 2 σ 2 ) 2 2 ρ ( r 1 , t μ 1 σ 1 ) ( r 2 , t μ 2 σ 2 ) ) + θ 13 ( r 1 , t μ 1 σ 1 ) 1 ( r 2 , t μ 2 σ 2 ) 3 η )
where f cos k n e s s ( r 1 , t , r 2 , t ) and f c o k u r t o s i s ( r 1 , t , r 2 , t ) represents the portfolio return considering the impact of co-skewness and co-kurtosis, respectively, θ 12 represents the impact coefficient of co-skewness, that is, the shock of the second-order centered moment (variance) of asset 2 on the first-order centered moment (return) of asset 1, θ 13 denotes the impact coefficient of co-kurtosis, that is, the shock of the third-order centered moment (skewness) of asset 2 on the first-order centered moment (return) of asset 1, r 1 , t , μ 1 , σ 1 and r 2 , t , μ 2 , σ 2 represent the return, mean, and variance of assets 1 and 2, respectively, ρ refers to the correlation coefficient between assets 1 and 2, and η indicates the residual.
However, the above extended higher-order moment CAPM model is only applicable to the pricing of binary assets, and the assumption of the binary standard normal distribution is required. To overcome this limitation, this paper proposes an extended higher-order moment multi-factor framework by introducing the co-skewness and co-kurtosis of multivariate pricing factors into the framework. The novel pricing foundation, which considers the shock of market asymmetry and extreme events, is shown as
f ( r 0 , t ) = α 1 r 1 , t + α 2 r 2 , t + α 3 r 3 , t + α n r n , t + i = 1 n θ i ( r 0 , t μ 0 σ 0 ) 1 ( r i , t μ i σ i ) 2 + i = 1 n δ i ( r 0 , t μ 0 σ 0 ) 1 ( r i , t μ i σ i ) 3 + η i , t
where
η i , t = ln exp [ α 1 r 1 , t + α 2 r 2 , t + α 3 r 3 , t + α n r n , t + i = 1 n θ i ( r 0 , t μ 0 σ 0 ) 1 ( r i , t μ i σ i ) 2 + i = 1 n δ i ( r 0 , t μ 0 σ 0 ) 1 ( r i , t μ i σ i ) 3 ] d r 1 d r 2 d r n
where f ( r 0 , t ) represents the carbon return, α 1 , α 2 , … α n represents the impact coefficient of the pricing factors, r 0 , t , μ 0 , σ 0 and r i , t , μ i , σ i represent the return, mean, and variance of the carbon market and its pricing factors, respectively, θ i denotes the impact coefficient of the second-order centered moment (variance) of carbon pricing factors on the first-order centered moment (return) of carbon return, that is, the shock of market asymmetry, and δ i denotes the impact coefficient of the third-order centered moment (skewness) of carbon pricing factors on the first-order centered moment (return) of carbon return, that is, the shock of extreme events.

3.2. A Multi-Layer and Multi-Variable LSTM (Multi-LSTM) Model for Predicting the Carbon Price

This paper constructs a multi-layer and multi-variable LSTM model based on the research of Hochreiter et al. [24] for predicting the carbon price and investigating the performance of the proposed EHM-APT framework.
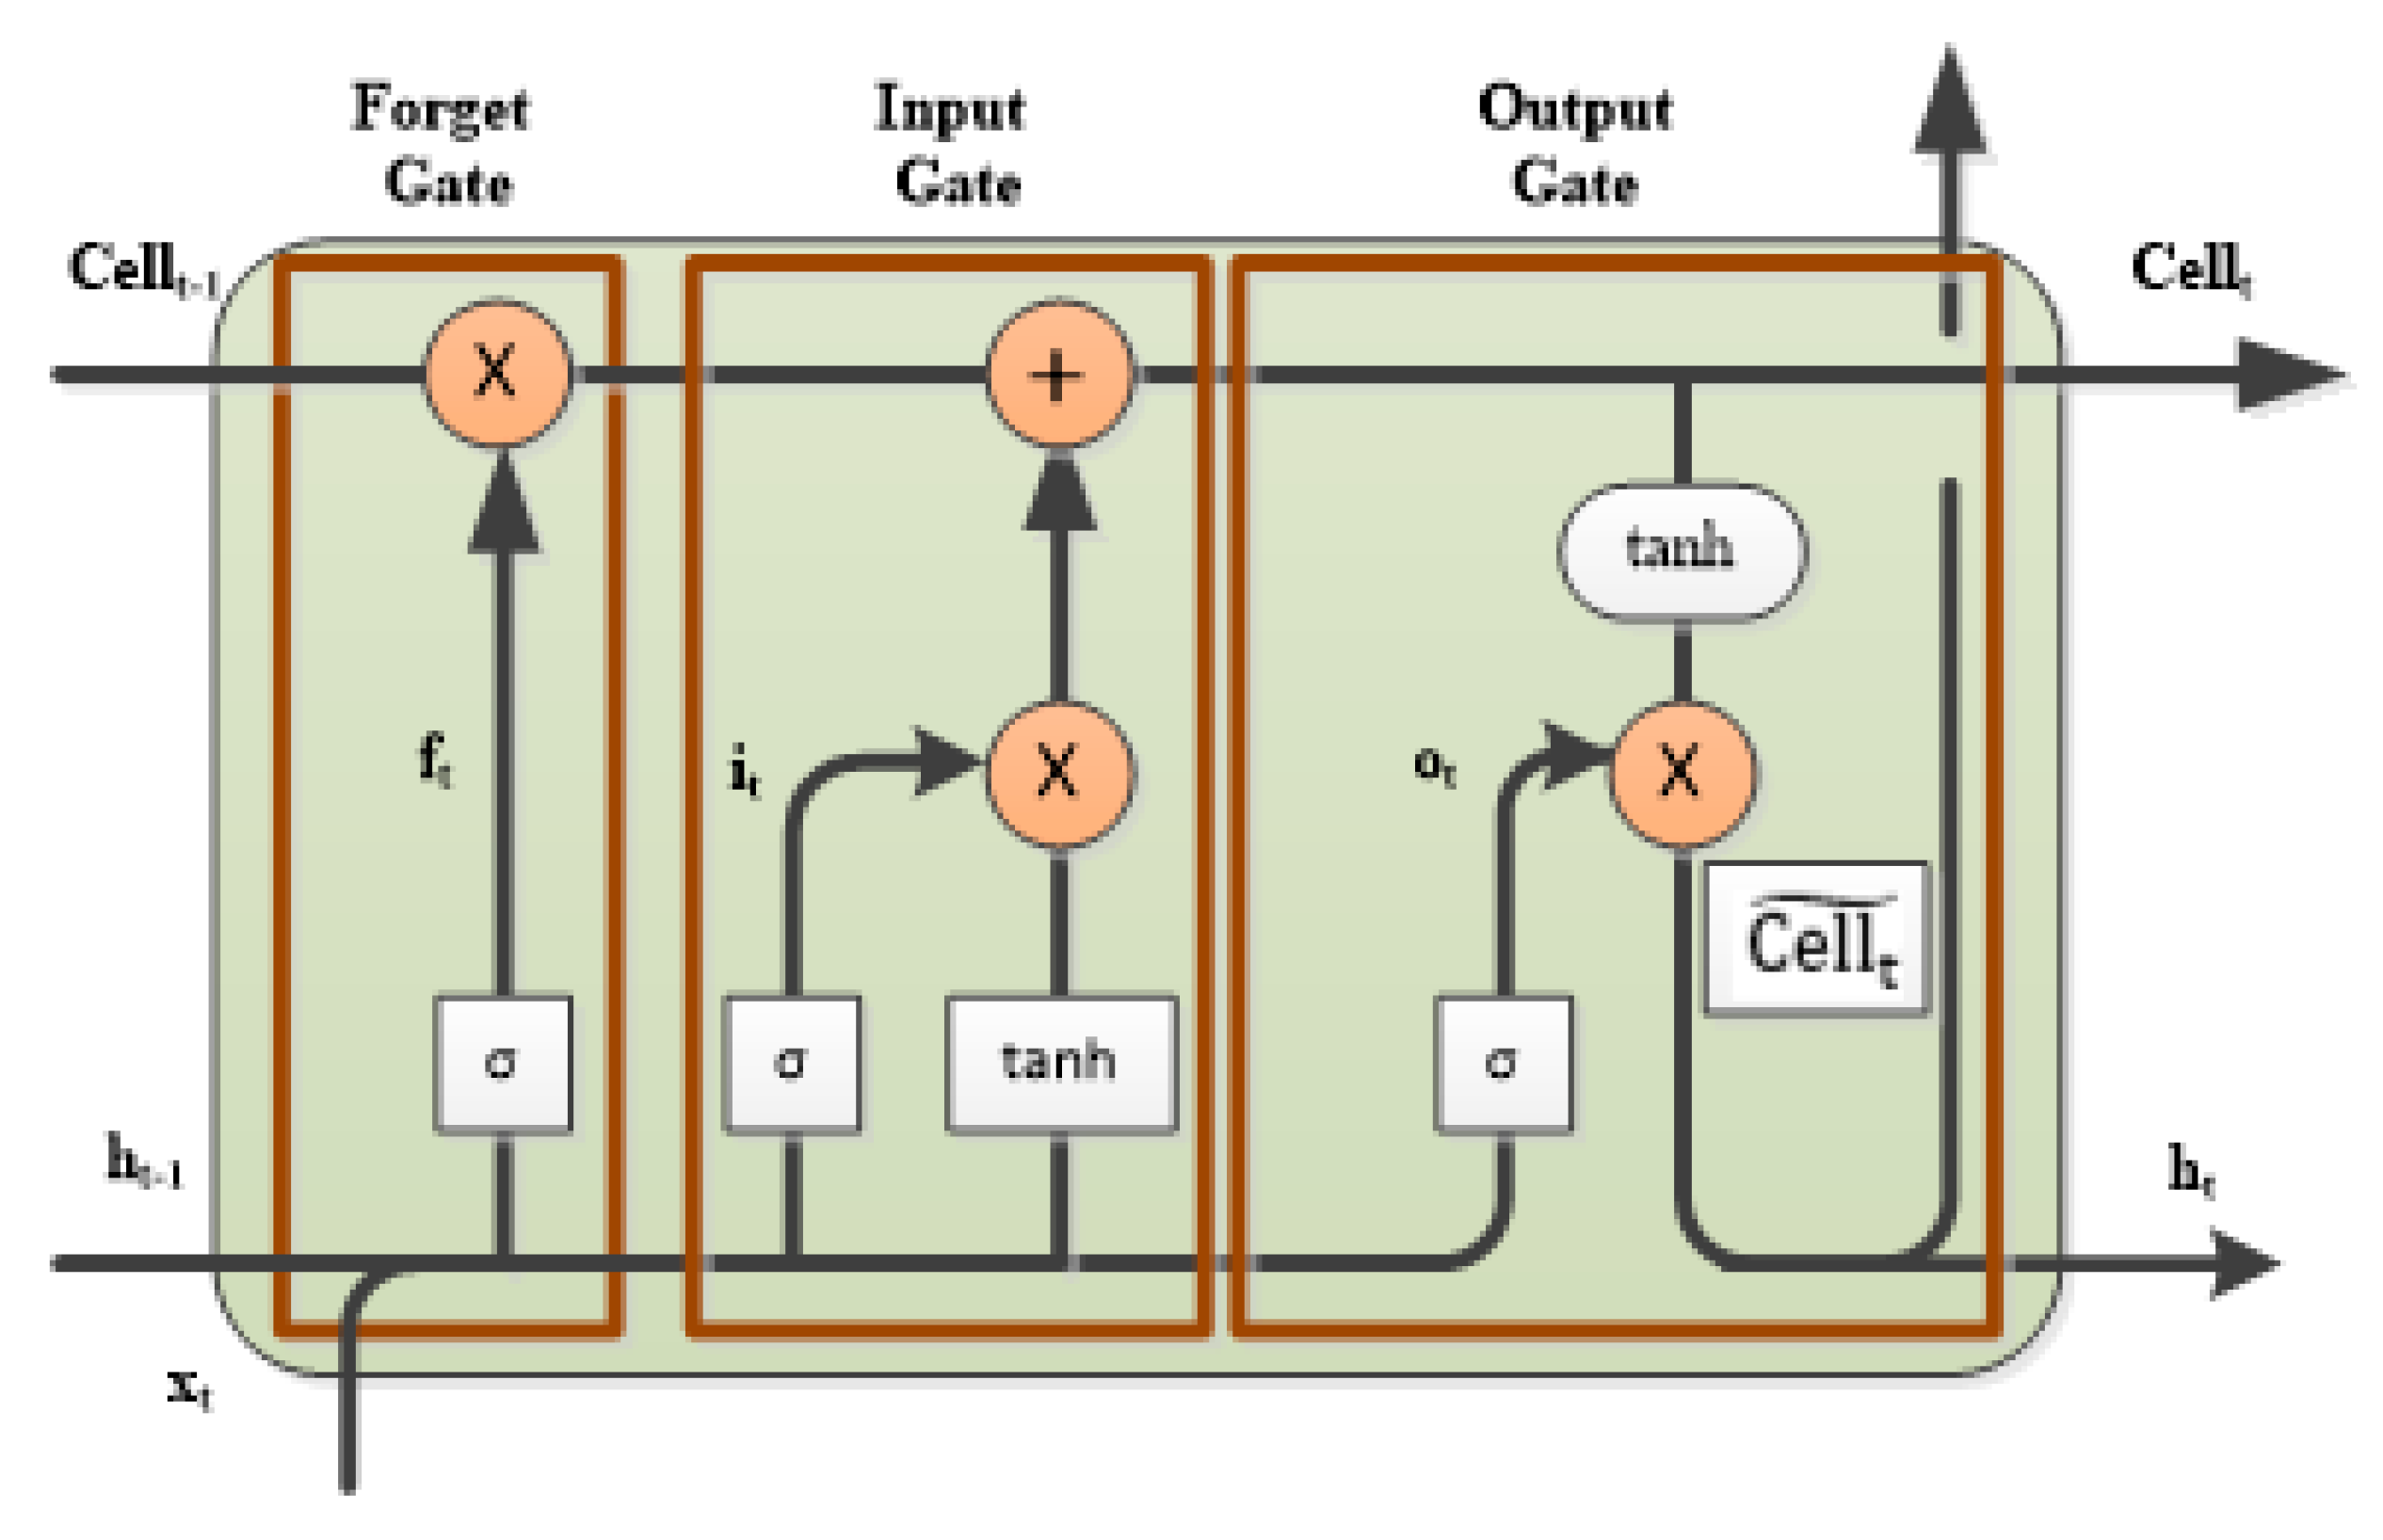
The LSTM network consists of an input layer, an output layer, and a hidden layer. Remarkably, the hidden layer of the LSTM is no longer a common neuron compared with the traditional Recurrent Neural Network (RNN), but rather an LSTM cell with special memory function. As the core of LSTM, the cell can eliminate or enhance the transmission of input data to the cell by controlling the structure of the designed gate. That is, the forget gate, the input gate, and the output gate. Furthermore, the Multi-LSTM model contains more cells and hidden layers based on single layers. The Multi-LSTM with a multi-layer chain structure and recursive network features can extract and mine the feature of input data, thus significantly improving the ability of learning and training.
During the training of LSTM, the three gates of LSTM receive two kinds of external information at time t, that is, Xt represents the input of the current state and Ht-1 denotes the output of the hidden layer at the previous state. In addition, each gate receives internal information, that is, the memory unit of Ct-1 at the previous state. Among the three gates, the forget gate determines the discarded information in the cell, which is equivalent to decay of information in each dimension [24]. The input gate determines the type of updated and input information in the cell. In this process, a sigmoid function is responsible for updating the information and the tanh function creates a new candidate vector of Ct at the current cell state. The output gate determines the output of the current cell through the sigmoid function, while the tanh function is used to convert the current output into a value between –1 and 1, and then the final output of LSTM is obtained after multiplying the output of the above two functions. The training structure of the Long Short-Term Memory network is shown in Figure 1.
The information filtering of the forget gate is shown as
f t = σ ( W f × [ h t 1 , x t ] + b f )
The information updating of the input gate is shown as
i t = σ ( W i × [ h t 1 , x t ] + b i )
C t ˜ = t a n h ( W C × [ h t 1 , x t ] + b C )
C t = f t × C t 1 + i t × C t ˜
The information screening of the output gate is shown as
o t = σ ( W o × [ h t 1 , x t ] + b o )
h t = o t × t a n h ( C t )
where ⊗ means the Kronecker product and ⊕ means the XOR logic operation. The information updating vector, the candidate vector, and the update vector of the input gate at the current cell are represented by i t , C t ˜ , and C t . h t refers to the final output of the LSTM network. W f , W i , W C , and W o represent the weight vectors. b f , b i , b C , and b o show the bias of the training process and σ is the sigmoid function.

3.3. Evaluation Criteria of Multi-LSTM for Determining the Performance of the Proposed Framework

This paper conducts the following criteria to evaluate the parameters and performance of the Multi-LSTM model. The five criteria are
R M S E = i = 1 T ( y i y ^ i ) 2 T
M A E = 1 T i = 1 T | y i y ^ i |
M A P E = 1 T i = 1 T | y i y ^ i y i |
D A = 1 T i = 1 T a i   where   a i = { 1 , i f ( y i + 1 y i ) × ( y ^ i + 1 y i ) > 0 0 , o t h e r w i s e
C O R R = E ( Y Y ^ ) E ( Y ) × E ( Y ^ ) E ( Y 2 ) E 2 ( Y ) × E ( Y ^ 2 ) E 2 ( Y ^ )
where Y = { y 1 , y 2 , , y T } represents the time series of actual carbon return, Y ^ = { y ^ 1 , y ^ 2 , , y ^ T } means the series of predicted carbon return, and T denotes the observations.
Furthermore, we chose the criteria of Root-Mean-Square Error (RMSE), Mean Absolute Error (MAE), and Mean Absolute Percentage Error (MAPE) because they are utilized in model performance judgment and are often used in the existing literature. These indicators are all real numbers and are between 0 and 1. If their values are smaller, then the closer the true value to the predicted value, and thus the better the prediction performance of the model. As for the investors, the criterion of direction accuracy (DA) means the probability that the market trend is consistent with the correctly predicted direction. Investors generally pay more attention to the probability of the market’s predicted value deviating from the true value, as the right investment direction can help investors make more valuable decisions. If the value of DA is larger, it means the predicted carbon return is closer to the psychological expectation of investors. CORR represents the Pearson correlation coefficient, which is used to measure the correlation between the true carbon return and the predicted return. The value of CORR is between 0 and 1. The closer the CORR value is to 1, the stronger the correlation, and vice versa.

4. Experiment Analysis and Discussion

4.1. The Data and Basic Statistical Analysis

The pricing factors of the carbon market include the prices of carbon homogeneous products, capital market products, and energy market products [13]. Therefore, this paper selects the EUAF (European Union Allowance Future) as the representative product of the carbon market for its large volume in EU ETS (European Union Emissions Trading System). Additionally, we chose the EUAS (European Union Allowance Spot) as the variable of carbon homogeneous products, took the DJIA (Dow Jones Industrial Average) and EURUSD as the typical products of capital market, and selected coal, crude oil, and natural gas as the representations of the energy market for their larger consumption. The data of EUAF and EUAS were sourced from the database of Intercontinental Exchange (ICE), and the other data were sourced from the Wind database. The research samples ranged from the period of 2 June 2009 to 8 May 2019, and there was a total of 2521 observations by eliminating the samples with missing information or time inconsistency. The return is expressed as: r t , and r t = 100 × ( l n P t l n P t 1 ) , where P t denotes the product’s settlement price.
We can draw the following conclusions from the descriptive statistics, as shown in Table 1: Firstly, all of the return series have good stationarity and are significant at the 1% level. Secondly, the mean difference of each return is small, but the standard deviation is big. As an example, the products of EUAF, EUAS, and gas show larger variance statistics, while that of EURUSD has a smaller variance. Thirdly, all of the return series show negative skewness, while the kurtosis values of DJIA and gas are the largest. This result indicates that the probability of return decline is greater than that of rise, and these markets are more vulnerable to the shock of extreme events. Furthermore, this paper also discloses the co-skewness and co-kurtosis statistics of each sample market. Negative co-skewness indicates information asymmetry from the pricing factor markets, which can easily increase the probability of a decline in carbon return. Positive co-kurtosis, especially the larger co-kurtosis presented by EUAS and DJIA, indicates that the external events suffered by these two markets will spread to the carbon market in a greater probability.
Furthermore, in the joint distribution of EUAF and DJIA, EURUSD, coal has a large kurtosis, as shown in Figure 2. This indicates that the portfolios are more vulnerable to the shock of extreme events. This result provides further strong evidence for studying the shock of pricing factor markets on the carbon price from the perspective of higher-order moment.

4.2. Designing the Structure of Multi-LSTM

The number of hidden layers is a critical parameter for designing the Multi-LSTM network. However, there is no mature method to determine the number of hidden layers for a deep network, although extensive research by Le and Bengio [28] suggests that several hidden layers are better than one. Correspondingly, this paper applied an experimental method to determine the number of hidden layers.
In this experiment, six levels of the hidden layer number ranging from 1 to 6 and hidden nodes 4, 8, 16, 32, 64, and 128 were used according to the research experience of Shen et al. [29]. In carbon price forecasting, the number of input nodes corresponds to the number of past observations, that is, the number of carbon pricing factors return series and their co-skewness and co-kurtosis terms. Meanwhile, the number of output nodes is set to 1, because the carbon return series is the prediction target. The sample data were divided into two parts in our experiment, that is, 80% of samples were used to train model parameters, and the other 20% were used to test the performance of the model in predicting carbon returns. The empirical results, as shown in Table 2, suggest that the Multi-LSTM model with two hidden layers has the lowest RMSE and MAE values, which can effectively reflect the carbon pricing model under the shock of higher-order moment.
The number of hidden layers in the Multi-LSTM network reflects the non-linear processing ability to fit the input data. By using the LSTM network with a few hidden layers, it may difficult to fit the input data. Meanwhile, it may also be unreasonable to design too many hidden layers, as this may waste a lot of training time and may easily lead to the model being overfitted. The results shown in Table 2 report that the best performance regarding RMSE and MAPE occurs with two hidden layers, because the values of RMSE and MAE are 0.13435 and 1.91017, respectively, which is the lowest value of the entire alternate hidden layer. Further analysis shows that there exists the smallest RMSE and MAE when the number of hidden layer nodes is 64, with the values of 0.1075 and 1.55172, respectively. Therefore, the optimal number of hidden nodes in the Multi-LSTM under the shock of higher-order moment is 64, and the appropriate architecture of Multi-LSTM is 18–64–64–1, where 18 is the number of input nodes and 1 is the output node.
For comparison, we also trained the network structure of the pricing model without considering the shock of higher-order moment, and the optimal architecture is 18–128–128–1, which is different from the structure of Multi-LSTM under the shock of higher-order moment.

4.3. Discussing the Performance of the Proposed Pricing Model

For evaluating the performance of Multi-LSTM in forecasting the carbon price under the shock of higher-order moment of pricing factors, in this section, we take the following classifier as the benchmark model for comparison.
The first is the BP (Back Propagation) model, which is a kind of neural network structure with error backpropagation algorithm and has the ability of non-linear mapping. We took it as a baseline to fit the non-linear relationship of the carbon price and its pricing factors. The second is the GARCH model, which has an advantage in simulating the volatility of the carbon price series. This model has been proven to perform well in previous research. The third one is the Multilayer Perceptron model (MLP), which is a deep neural network structure with many hidden layers, and it can improve the non-linear mapping ability and prediction accuracy in predicting the carbon price. The fourth one is the recurrent neural network (RNN), which a kind of neural network with special memory ability, and has a remarkable advantage in processing time series data. The fifth is the gated recurrent unit (GRU), which belongs to another improved structure of the RNN model compared with the Multi-LSTM. The GRU model combines the forget gate and the input gate into a single update gate compared to the LSTM structure.
During the experiment, we tested the benchmark models of BP, GARCH, MLP, RNN, and Multi-GRU in forecasting the carbon price with the same series data. That is, we studied the out-of-sample performance of the proposed model and the other comparative models in carbon price prediction. During the experiment, the comparison models maintained the same number of input nodes, hidden layers, hidden nodes, and output nodes as the Multi-LSTM model. The actual return and forecasting return of the different models are shown, as in Figure 3 and Figure 4.
The results presented in Table 3 show that the Multi-LSTM model exhibits better accuracy than the other benchmark models in the five criteria for predicting carbon price when considering the shock of higher-order moment. Specifically, RMSE, MAE, and MAPE represent the stability of the model. The values of the three variables (that is, 1.7347, 0.9884, and 0.0575, respectively) of the Multi-LSTM model are significantly lower than those of the other benchmark models. Therefore, we can conclude that the Multi-LSTM model is more superior in stability and reliability for forecasting the carbon price. As for DA, the direction accuracy of the Multi-LSTM model is 0.9189, that is, significantly higher than other models, and the results prove that the Multi-LSTM model presents more accurate prediction for supporting investor decisions. The correlation coefficient for the Multi-LSTM model is 0.954, which is better than that of Multi-GRU (0.9083), RNN (–0.068), MLP (0.0357), GARCH (0.034), and BP (–0.0332).
The performance of the carbon pricing model without considering the shock of higher-order moment is also listed for comparison. As shown in Table 3, the superiority of the Multi-LSTM model is further proven in all of the five criteria. Figure 5 reports the prediction error curve of the proposed model and the benchmark models when both considering and not considering the shock of higher-order moment, respectively. It is noteworthy that the values of RMSE, MAE, and MAPE for the Multi-LSTM model when considering the shock of higher-order moment are significantly lower than those when not considering the shock of higher-order moment. Meanwhile, the values of DA and CORR for the Multi-LSTM model under the shock of higher-order moment are significantly larger than those when not considering the shock of higher-order moment. Therefore, we can draw a unified conclusion that the Multi-LSTM model based on the proposed EHM-APT framework can significantly improve the prediction accuracy when considering the shock of higher-order moment compared with the pricing models that do not consider the shock of higher-order moment.

5. Conclusions and Prospects

In this paper, we developed an extended higher-order moment Multi-factor framework (EHM-APT) for predicting the carbon price by extending the theory of the binary higher-order moment CAPM model developed by Fry et al. [6] to multivariate factors. The proposed EHM-APT framework in this paper not only helps to promote the construction of an effective carbon pricing mechanism, but also provides a more effective market-oriented means for carbon emission reduction and the sustainability of low-carbon economy. As for the EHM-APT framework, we considered the impact of market asymmetry and extreme events that stem from its pricing factor markets on the carbon price compared with the traditional APT model. Furthermore, a multi-layer and multi-variable LSTM (Multi-LSTM) model was constructed so that the parameters and structure can be determined experimentally for testing the performance of the proposed EHM-APT framework in predicting the carbon price. Some main conclusions are summarized as follows.
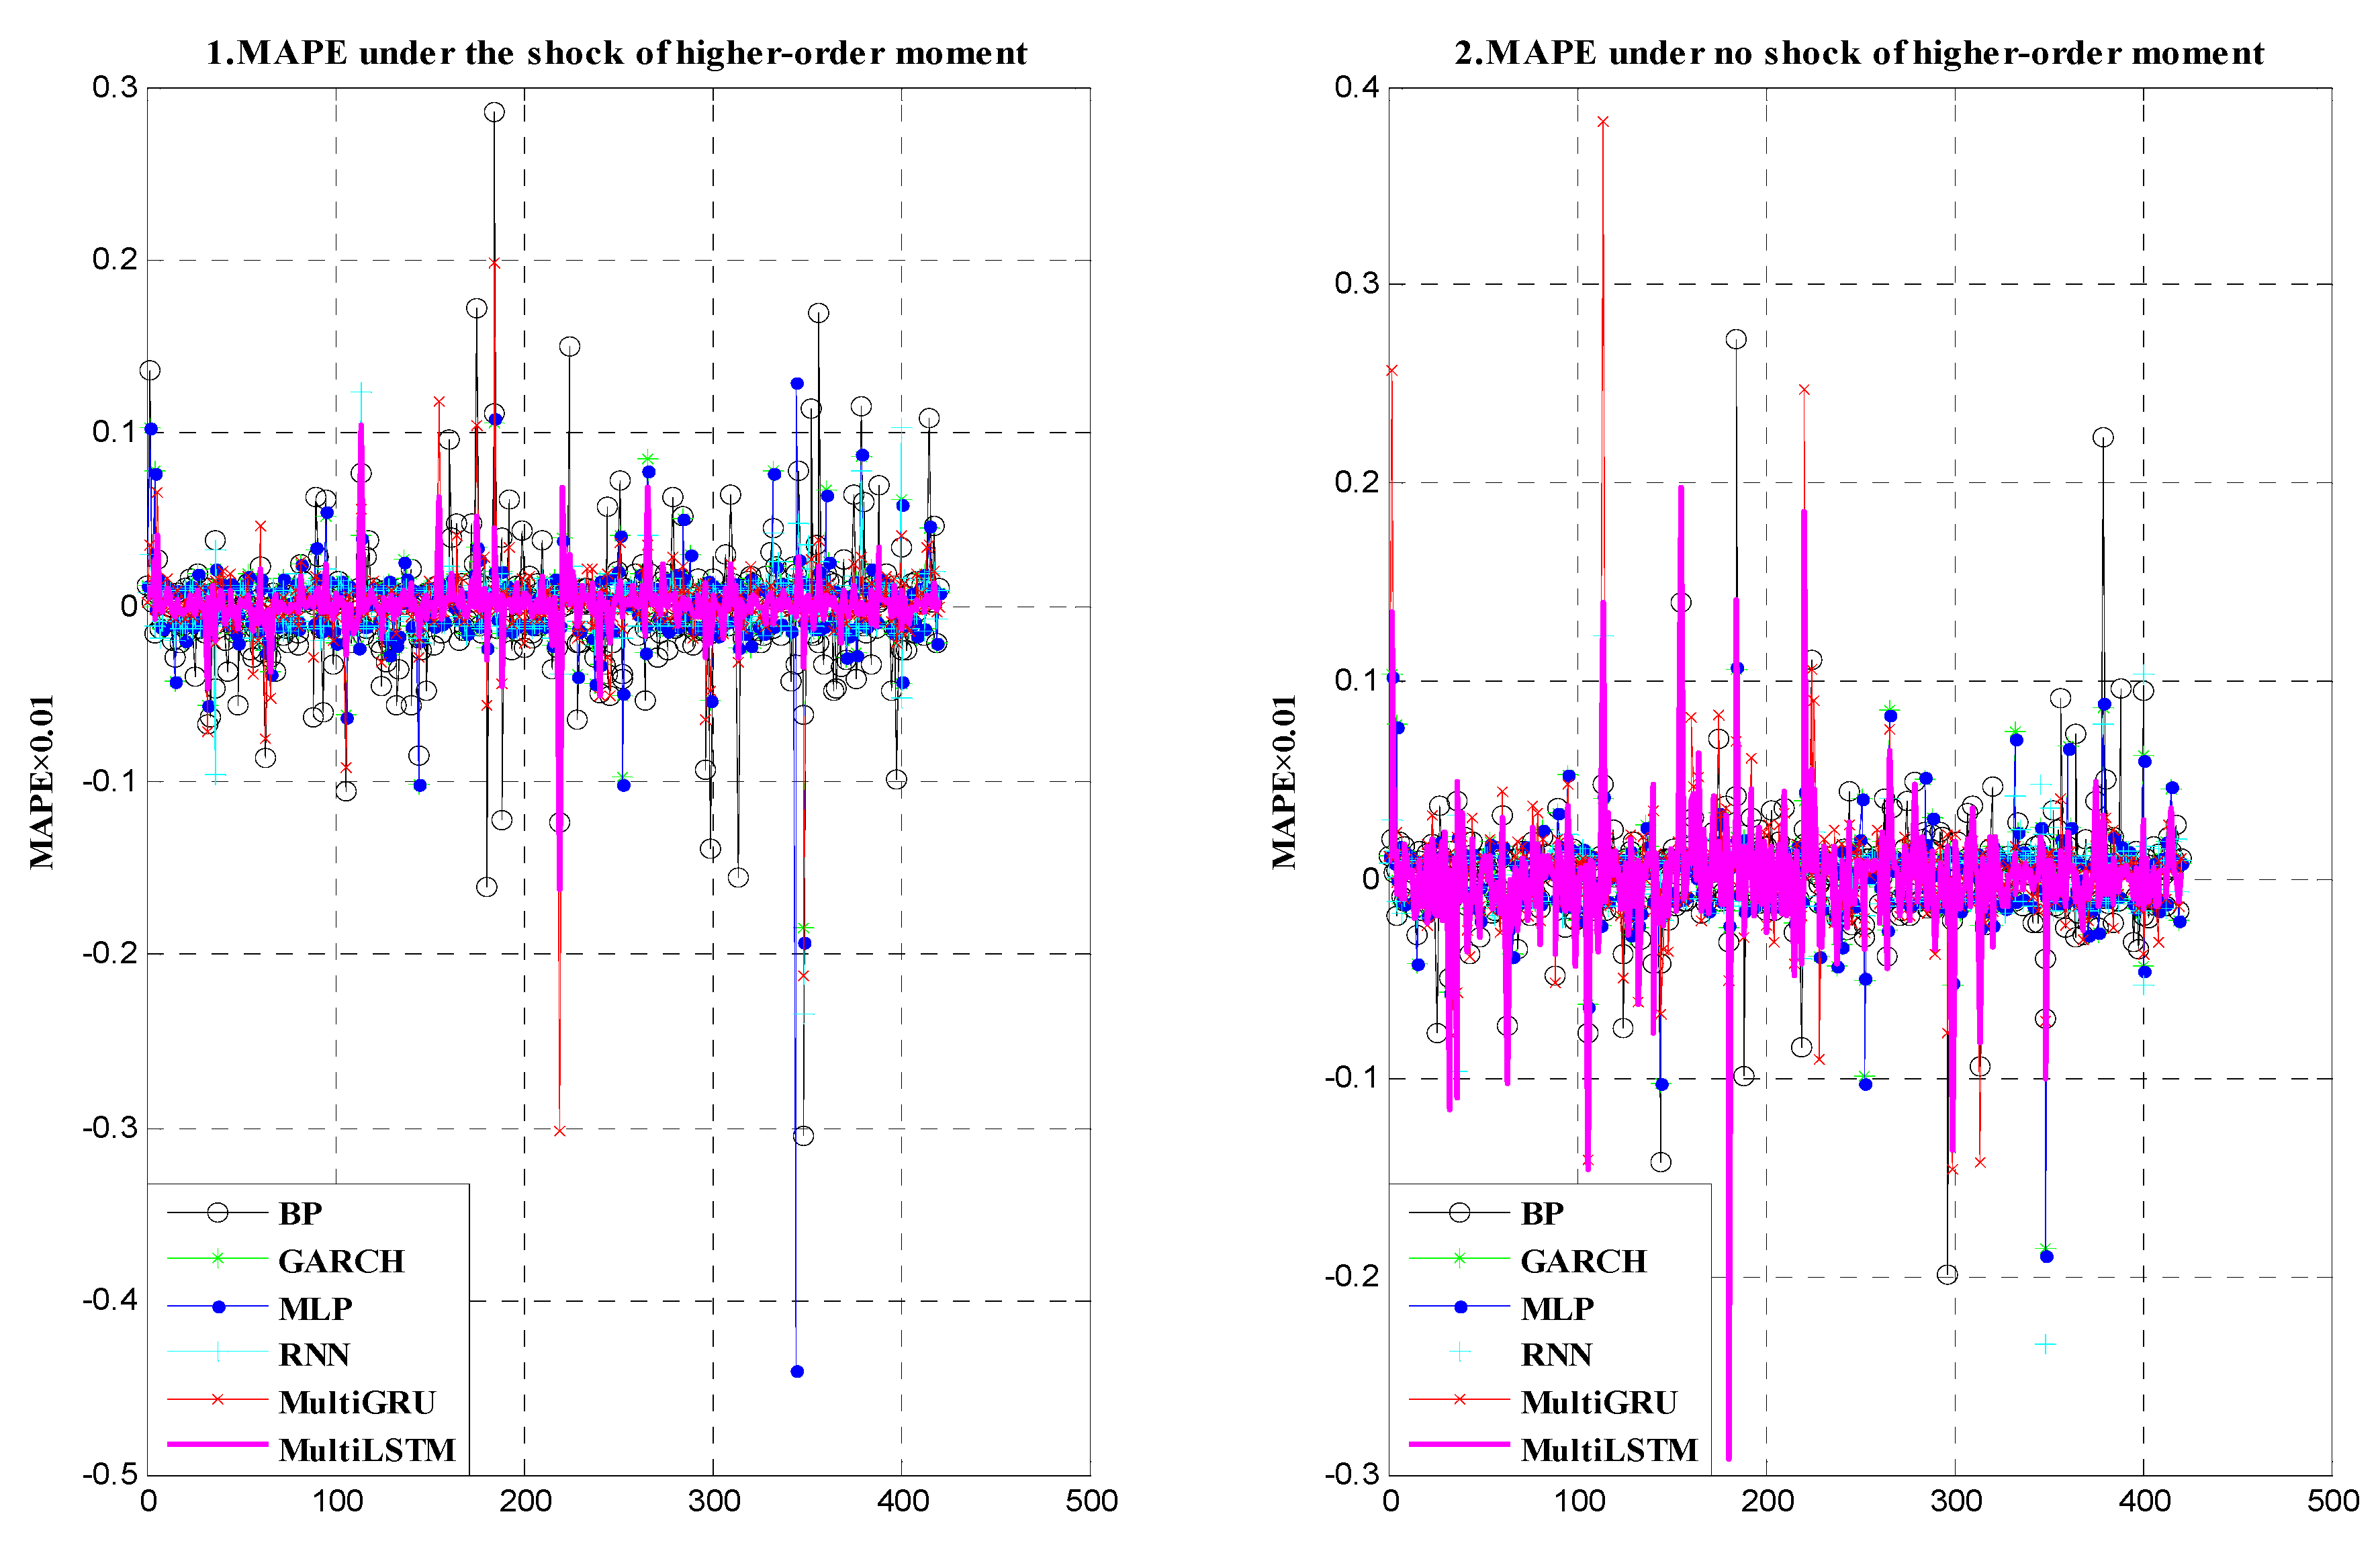
Firstly, the proposed EHM-APT framework, when considering the shock of higher-order moment, can significantly improve the prediction accuracy of the carbon price compared with the framework when not considering the shock higher-order moment. This conclusion further proves that the shock of market asymmetry and extreme events that stem from its pricing factors is an indispensable factor for predicting and fitting the carbon price, which is ignored by previous research. In fact, it has been proven in many studies that co-skewness and co-kurtosis, which represent the market asymmetry and extreme events, are used as the pricing factors of financial assets [4]. Based on this idea, this paper further proves that co-skewness and co-kurtosis are also important and indispensable factors for explaining the pricing mechanism of carbon assets.
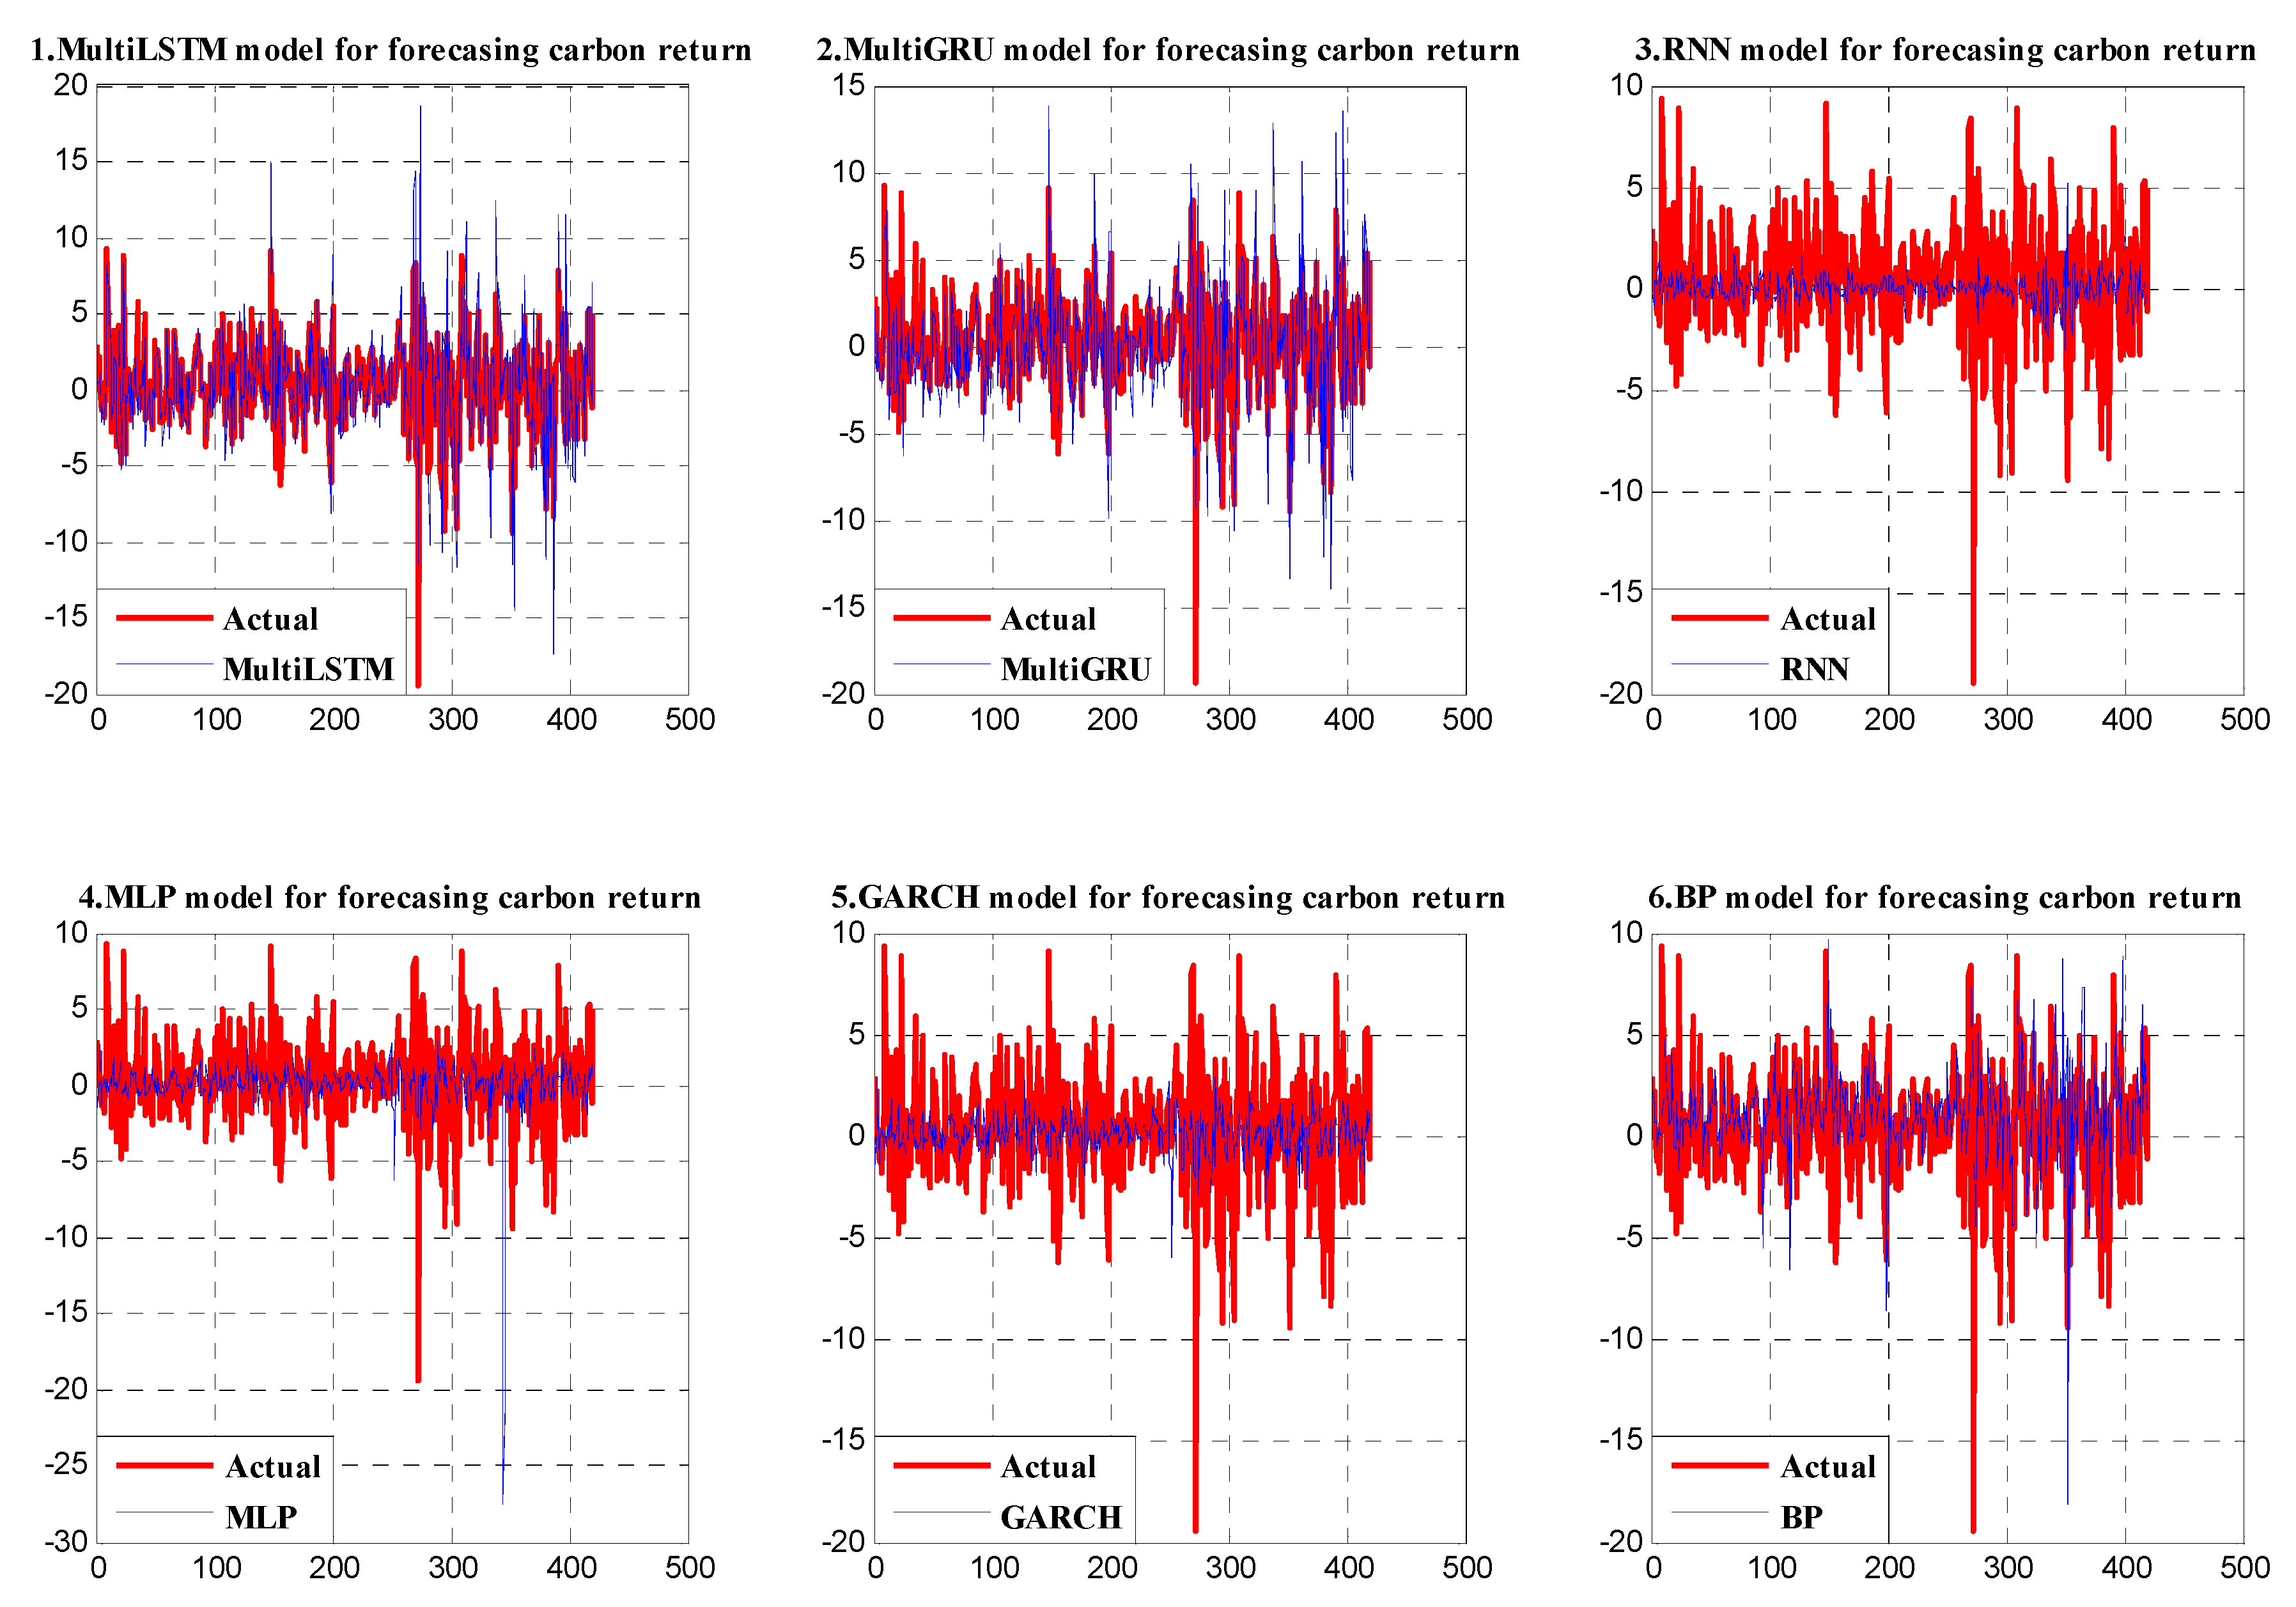
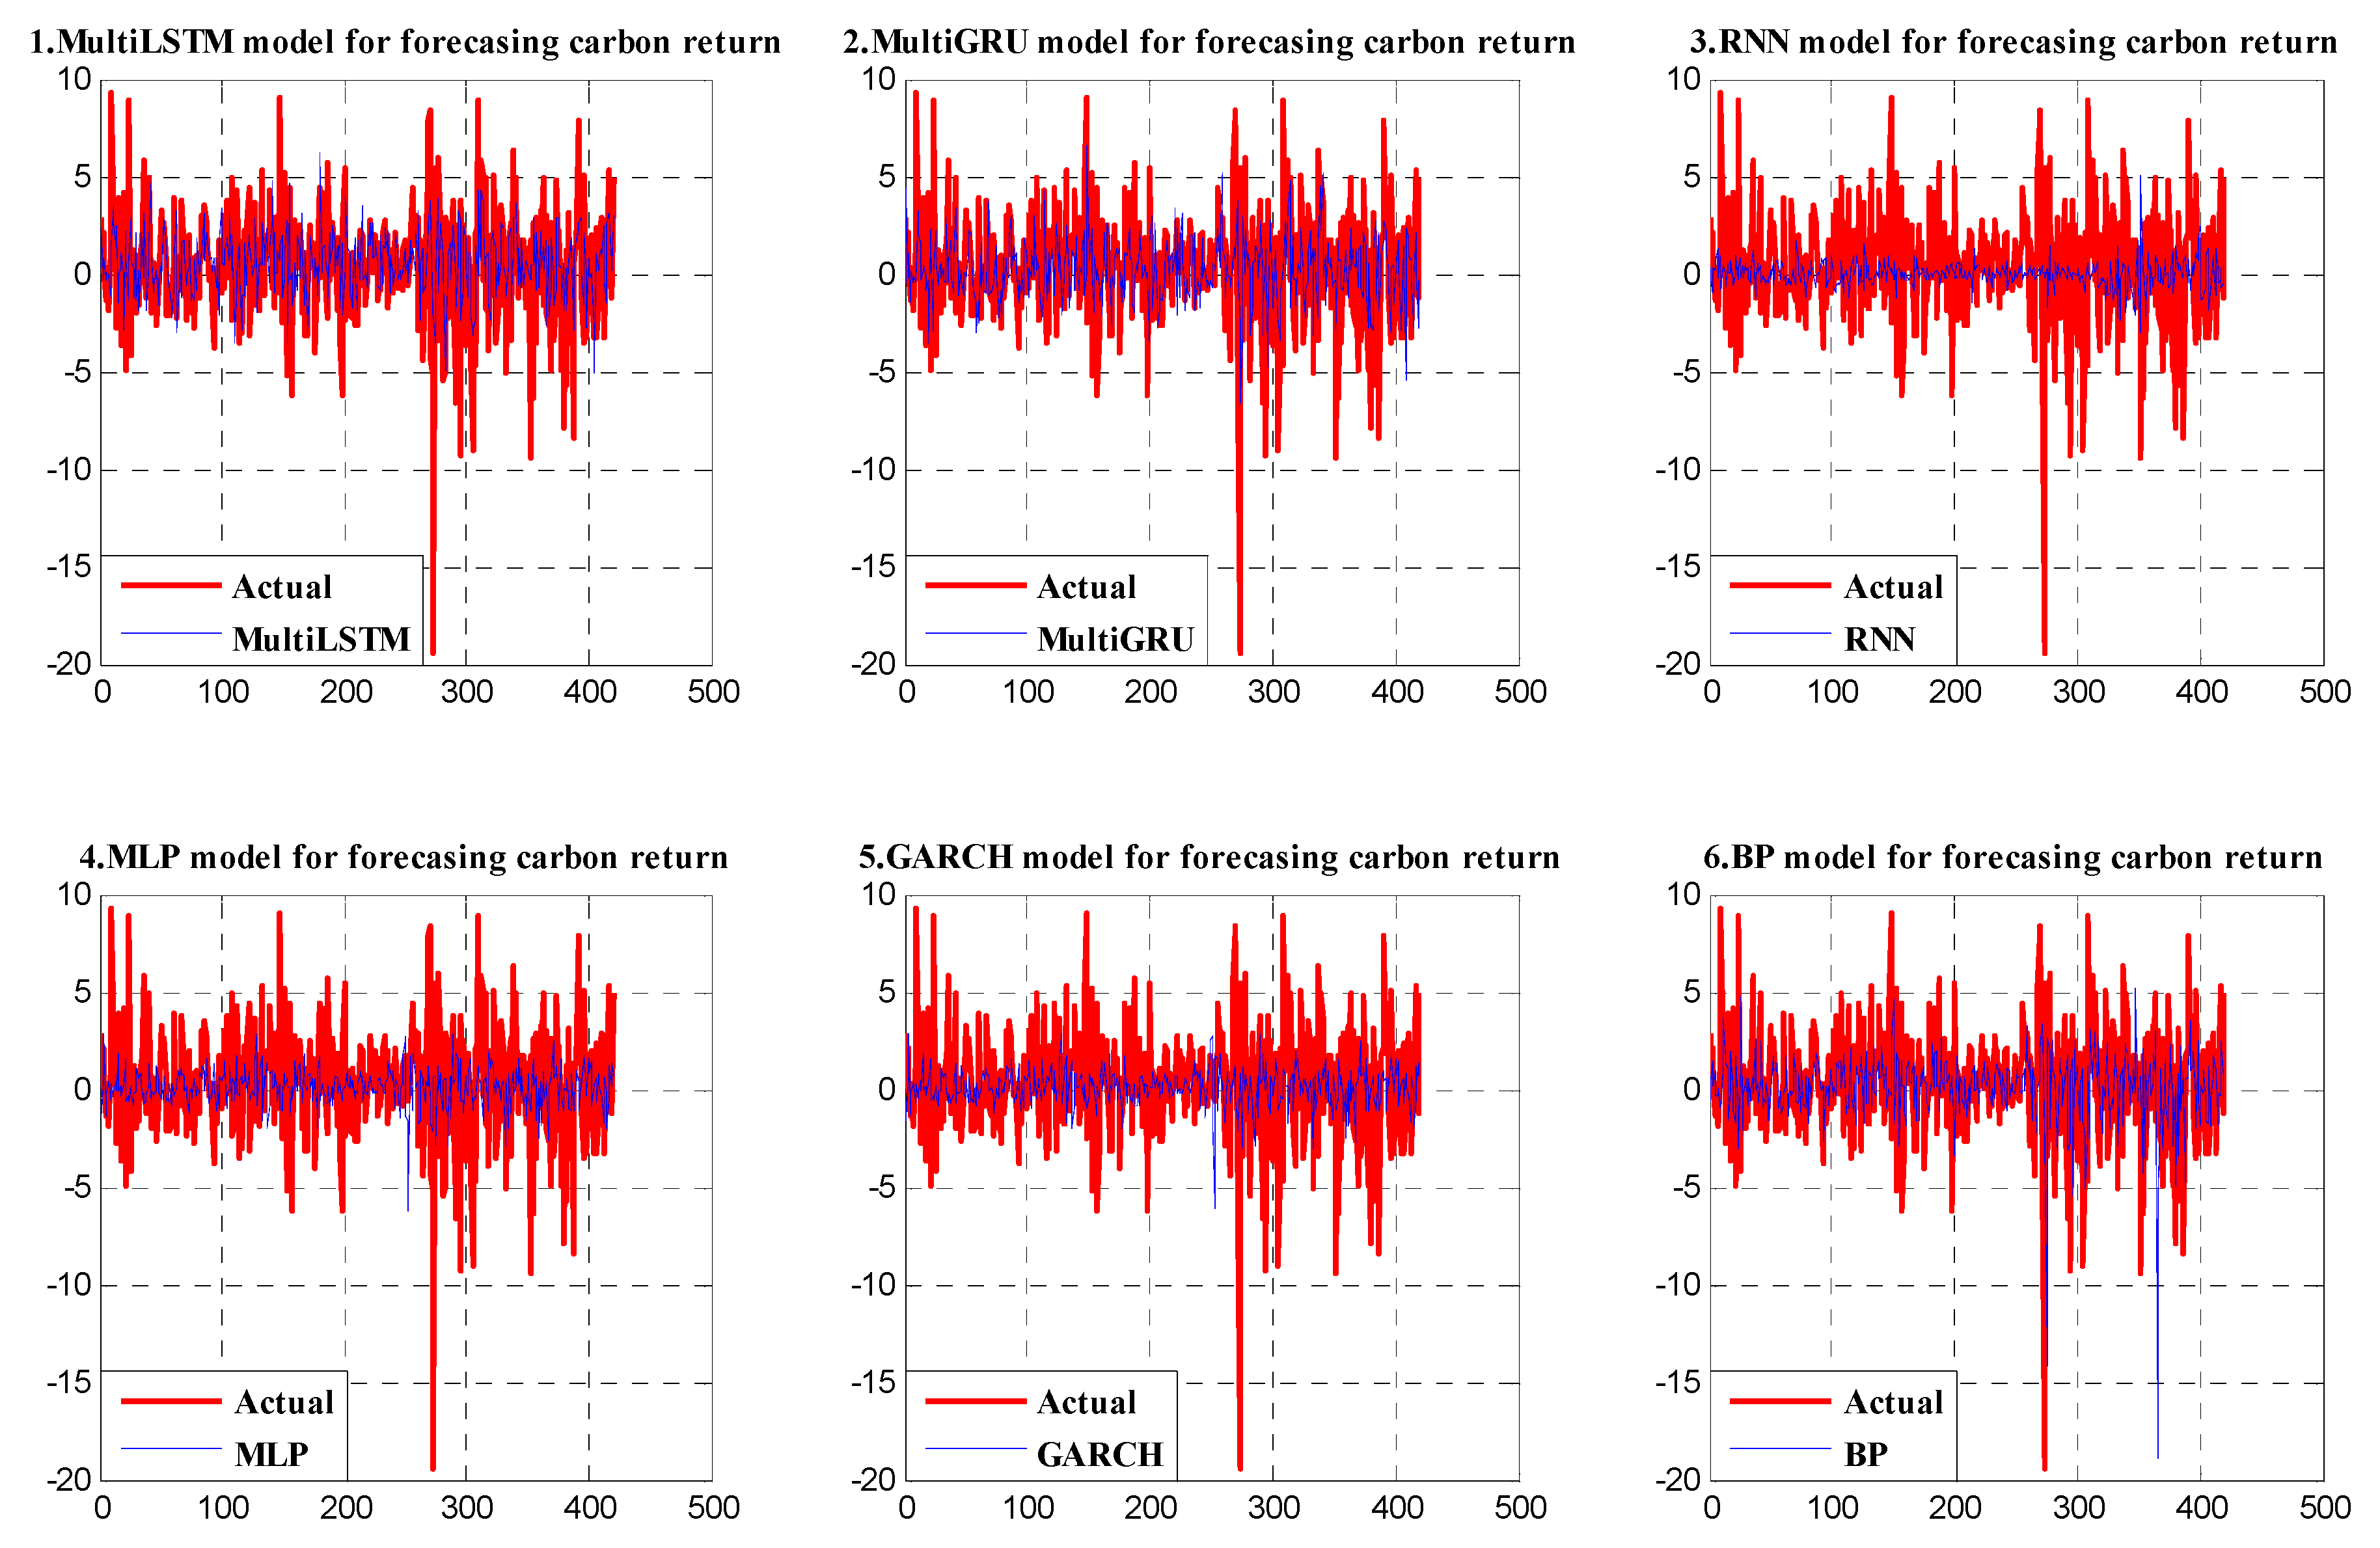
Secondly, the Multi-LSTM model for which the parameters and structure were determined experimentally (the structure of 18–64–64–1) in this article, is a suitable network for predicting the carbon price, and its performance is superior to the other benchmark models (that is, the Multi-GRU, RNN, MLP, GARCH, and BP models) in all of the evaluation criteria. This result suggests that the Multi-LSTM model is competitive for predicting the carbon price under the proposed EHM-APT framework. Therefore, we conclude that the model has advantages in effectively capturing and mapping the complex non-linear network relationship between the carbon price and its pricing factors.
This study predicts the carbon price based on the structured pricing factors that the data sourced from certain financial markets. As evidenced in this article, the proposed EHM-APT framework has good applicability, and can support valuable references for solving pricing problems in other financial markets as well. In fact, in addition to the higher-order moment terms, we can also explore pricing factors that can measure market asymmetry information and external shock by means of big data text mining. Future research can explore the non-structured pricing factors obtained by text information technology by applying the proposed multi-factor pricing framework, such as the factor of investor sentiment, policy events, and others. Based on this, another valuable exploration prospect is derived, that is, as the increase of data information by means of text mining technology or other machine learning technologies, the way to achieve information fusion and sharing of data features between the structured and unstructured pricing factors within the established pricing framework is a key issue that requires an outcome.

Author Contributions

Conceptualization, P.Y. and C.Z.; Methodology, P.Y. and Y.W.; Model code analysis, P.Y. and X.Y.; Formal Analysis, Y.W. and X.Y.; Writing—Original Draft Preparation, P.Y. and Z.A.W.; Writing—Review and Editing, P.Y. and C.Z.; Supervision, C.Z. All authors have read and agreed to the published version of the manuscript.

Funding

This paper is supported by the following fund projects: the National Natural Science Foundation of China, No. 71971071 and 71373065.

Acknowledgments

The authors thank the editors and reviewers for their attention and concern.

Conflicts of Interest

The authors declare no conflict of interest.

References

  1. Schneider, L.; La Hoz Theuer, S. Environmental integrity of international carbon market mechanisms under the Paris Agreement. Clim. Policy 2019, 19, 386–400. [Google Scholar] [CrossRef] [Green Version]
  2. Yang, B.; Liu, C.; Gou, Z.; Ma, J.; Su, Y. How Will Policies of China’s CO2 ETS Affect its Carbon Price: Evidence from Chinese Pilot Regions. Sustainability 2018, 10, 605. [Google Scholar] [CrossRef] [Green Version]
  3. Hammoudeh, S.; Lahiani, A.; Nguyen, D.K.; Sousa, R.M. An empirical analysis of energy cost pass-through to CO2 emission prices. Energy Econ. 2015, 49, 149–156. [Google Scholar] [CrossRef]
  4. Amaya, D.; Christoffersen, P.; Jacobs, K.; Vasquez, A. Does realized skewness predict the cross-section of equity returns. J. Financ. Econom. 2015, 118, 135–167. [Google Scholar] [CrossRef] [Green Version]
  5. De Luca, G.; Loperfido, N. Modelling multivariate skewness in financial returns: A SGARCH approach. Europ. J. Financ. 2015, 21, 1113–1131. [Google Scholar] [CrossRef]
  6. Fry, R.; Hsiao, C.Y.L. Extremal dependence tests for contagion. Econom. Rev. 2016, 37, 626–649. [Google Scholar]
  7. Karmakar, M.; Paul, S. Intraday risk management in international stock markets: A conditional EVT approach. Int. Rev. Financ. Anal. 2016, 44, 34–55. [Google Scholar] [CrossRef]
  8. Chevallier, J. Carbon futures and macroeconomic risk factors: A view from the EU ETS. Energy Econ. 2009, 31, 614–625. [Google Scholar] [CrossRef]
  9. Byun, S.J.; Cho, H. Forecasting carbon futures volatility using GARCH models with energy volatilities. Energy Econ. 2013, 40, 207–221. [Google Scholar] [CrossRef]
  10. Koop, G.; Tole, L. Forecasting the European carbon market. J. R. Stat. Soc. A Stat. 2013, 176, 723–741. [Google Scholar] [CrossRef] [Green Version]
  11. Sanin, M.E.; Violante, F.; Mansanet-Bataller, M. Understanding volatility dynamics in the EU-ETS market. Energy Policy 2015, 82, 321–331. [Google Scholar] [CrossRef] [Green Version]
  12. Benz, E.; Stefan, T. Modeling the price dynamics of CO2 emission allowances. Energy Econ. 2009, 31, 4–15. [Google Scholar] [CrossRef]
  13. Chevallier, J. Nonparametric modeling of carbon prices. Energy Econ. 2011, 33, 1267–1282. [Google Scholar] [CrossRef]
  14. Zhang, Y.J.; Sun, Y.F. The dynamic volatility spillover between European carbon trading market and fossil energy market. J. Clean. Prod. 2016, 112, 2654–2663. [Google Scholar] [CrossRef]
  15. Wu, Q.; Wang, M.; Tian, L. The market-linkage of the volatility spillover between traditional energy price and carbon price on the realization of carbon value of emission reduction behavior. J. Clean. Prod. 2020, 245, 1–12. [Google Scholar] [CrossRef]
  16. Ji, Q.; Zhang, D.; Geng, J.B. Information linkage, dynamic spillovers in prices and volatility between the carbon and energy markets. J. Clean. Prod. 2018, 198, 972–978. [Google Scholar] [CrossRef]
  17. Oliveira, F.A.; Nobre, C.N.; Luis, E.Z. Applying artificial neural networks to prediction of stock price and improvement of the directional prediction index-Case study of PETR4, Petrobras, Brazil. Expert Syst. Appl. 2013, 40, 7596–7606. [Google Scholar] [CrossRef]
  18. Garcia, F.; Guijarro, F.; Oliver, J.; Tamosiuniene, R. Hybrid Fuzzy Neural Network to Predict Price Direction in the German Dax-30 Index. Technol. Econ. Develp. Econom. 2018, 24, 2161–2178. [Google Scholar] [CrossRef]
  19. Zhu, B.Z.; Wei, Y.M. Carbon price prediction based on integration of GMDH, particle swarm optimization and least squares support vector machines. Syst. Eng. Theory Pract. 2011, 31, 2264–2271. [Google Scholar]
  20. Fan, X.; Li, S.; Tian, L. Chaotic characteristic identification for carbon price and an multi-layer perceptron network prediction model. Expert Syst. Appl. 2015, 42, 3945–3952. [Google Scholar] [CrossRef]
  21. Zhu, B.; Ye, S.; Wang, P.; He, K.; Zhang, T.; Wei, Y.M. A novel multiscale nonlinear ensemble leaning paradigm for carbon price forecasting. Energy Econ. 2018, 70, 143–157. [Google Scholar] [CrossRef]
  22. Atsalakis, G.S. Using computational intelligence to forecast carbon prices. Appl. Soft. Comput. 2016, 43, 107–116. [Google Scholar] [CrossRef]
  23. Zhu, J.; Wu, P.; Chen, H.; Liu, J.; Zhou, L. Carbon price forecasting with variational mode decomposition and optimal combined model. Phys. A 2019, 519, 140–158. [Google Scholar] [CrossRef]
  24. Hochreiter, S.; Schmidhuber, J. Long short-term memory. Neural Comput. 1997, 9, 1735–1780. [Google Scholar] [CrossRef]
  25. Qiu, M.; Song, Y. Predicting the direction of stock market index movement using an optimized artificial neural network model. PLoS ONE 2016. [Google Scholar] [CrossRef] [Green Version]
  26. Moghaddam, A.H.; Moghaddam, M.H.; Esfandyari, M. Stock market index prediction using artificial neural network. J. Econom. Financ. Admin. Sci. 2016, 21, 89–93. [Google Scholar] [CrossRef] [Green Version]
  27. Hwang, S.; Satchell, S.E. Modelling emerging market risk premia using higher moments. Int. J. Financ. Econom. 1999, 4, 271–296. [Google Scholar] [CrossRef]
  28. Le, R.N.; Bengio, Y. Representational power of Restricted Boltzmann Machines and Deep Belief Networks. Neural Comput. 2008, 20, 1631–1649. [Google Scholar]
  29. Shen, F.; Chao, J.; Zhao, J. Forecasting exchange rate using deep belief networks and conjugate gradient method. Neurocomputing 2015, 167, 243–253. [Google Scholar] [CrossRef]
Figure 1. The training structure of the Long Short-Term Memory (LSTM) network.
Sustainability 12 01869 g001
Figure 2. The joint probability density of carbon market and its related markets.
Sustainability 12 01869 g002
Figure 3. The actual value and prediction value of the proposed model and benchmark model under the shock of higher-order moment. GRU, gated recurrent unit; RNN, recurrent neural network; MLP, multilayer perceptron model; GARCH, generalized autoregressive conditional heteroskedasticity model; BP, backpropagation.
Sustainability 12 01869 g003
Figure 4. The actual value and the prediction value of the proposed model and the benchmark models without considering the shock of higher-order moment.
Sustainability 12 01869 g004
Figure 5. Prediction error curve of the proposed model and the benchmark models. Note: The horizontal axis represents the sample sequence, and the vertical axis uses RMSE to represent the prediction error of the Multi-LSTM and benchmark models. Figure 5 shows the performance of the different models visually, and highlights the superiority of multi-LSTM in fitting the proposed EHM-APT framework.
Sustainability 12 01869 g005
Table 1. Descriptive statistics.
EUAFEUASDJIAEURUSDCoalOilGas
ADF−37.846 ***−38.472 ***−43.7 ***−52.285***−53.306 ***−47.82 ***−32.362 ***
Mean0.01970.0230.0429−0.00970.0013−0.0129−0.0211
Std.Dev.3.10253.25371.30540.57561.90561.27813.9581
Skewness−0.2114−0.9289−0.9225−0.0826−0.0013−1.4089−0.0362
Kurtosis19.169320.5059353.45184.56825.841642.281469.4135
Coskewness12 −0.9686−0.1506−0.0647−0.0462−0.1343−0.0146
Cokurtosis13 15.48410.09990.21090.35010.36060.5036
Note: *** denotes the statistical significance at the 1% level. Coskewness12 and Cokurtosis13 mean the co-skewness and co-kurtosis coefficients between EUAF and the other market products, and the value is calculated by E ( r x , t E ( r x , t ) ) ( r y , t E ( r x , t ) ) 2 / σ x σ y 2 and E ( r x , t E ( r x , t ) ) ( r y , t E ( r x , t ) ) 3 / σ x σ y 3 , respectively, where r x , t and r y , t denote the return of EUAF and the other market products.
Table 2. Effects of pricing factors on the performance of the Multi-LSTM: Hidden layers and hidden nodes.
Hidden-
Layer
NodesMulti-LSTM
(Under no Shock)
Multi-LSTM
(Under the Shock of Higher-Order Moment)
Hidden-
Layer
NodesMulti-LSTM
(Under no Shock)
Multi-LSTM
(Under the Shock of Higher-Order Moment)
RMSEMAERMSEMAERMSEMAERMSEMAE
140.159402.343080.129871.75720440.165622.390670.166682.23491
180.185232.687530.174762.68161480.180452.644590.217302.83494
1160.197223.012260.202642.987334160.180832.764790.181542.70020
1320.182422.773700.143422.148564320.162852.526260.125511.87687
1640.190302.930940.164012.426674640.157922.394680.113561.61738
11280.181162.821950.141562.0579841280.148332.236010.109781.56807
Avg0.182622.761580.159382.34323 Avg0.166002.492830.152402.13873
240.163542.361040.138981.86684540.170042.419430.176532.42557
280.181782.651260.161172.41483580.182232.738350.154572.28414
2160.181362.734100.161642.196025160.183962.772950.142882.01281
2320.171522.672790.123081.815845320.153332.376360.125431.86661
2640.154522.271380.107501.551725640.152522.273000.105791.54763
21280.137232.150570.113751.6157451280.148452.287430.112771.65257
Avg0.164992.473520.134351.91017 Avg0.165092.477920.136331.96489
340.165682.442130.156652.18888640.164892.354900.155672.40574
380.162942.483700.165902.39876680.173252.618370.169842.43092
3160.188592.813350.150312.275956160.186922.693220.144512.15412
3320.181012.696560.121371.780226320.163432.518140.118311.66406
3640.150182.321660.110921.606746640.155122.356400.125101.79310
31280.154792.387950.114701.6771361280.149212.244980.109541.57611
Avg0.167202.524230.136641.98795 Avg0.165472.464330.137162.00401
Note: Bold numbers are the minimum root-mean-square error (RMSE) and mean absolute percentage error (MAPE), respectively. MAE, mean absolute error.
Table 3. The performance of the proposed model and the benchmark models for predicting the carbon price.
Performance CriteriaThe Proposed ModelThe Benchmark Model
Multi-LSTMMulti-GRURNNMLPGARCHBP
Considering the shock of higher-order momentRMSE1.73471.89183.19623.61533.17834.0036
MAE0.98841.26822.35482.49552.38332.9328
MAPE0.05750.06320.19230.12460.13650.0732
DA0.91890.87110.47490.53460.54420.3914
CORR0.95400.9083−0.0680.03570.034−0.0332
Not considering the shock of higher-order momentRMSE3.09033.17363.19503.17713.17753.7228
MAE2.28472.35172.35342.38272.38262.7083
MAPE0.02080.27310.18930.13460.13550.2138
DA0.54290.54050.47140.47620.47570.4357
CORR0.24460.1926−0.08470.02060.0191−0.0785
Note: DA (direction accuracy) means the probability that the market trend is consistent with the correctly predicted direction. CORR represents the Pearson correlation coefficient between the true carbon return and the predicted return.

