Financial Performance of SDG Mutual Funds Focused on Biotechnology and Healthcare Sectors


1
Business Department, Universitat Autònoma de Barcelona, 08193 Bellaterra, Spain
2
Business School, University of Edinburgh, Edinburgh EH8 9YL, UK
Sustainability 2020, 12(5), 2032; https://0-doi-org.brum.beds.ac.uk/10.3390/su12052032
Submission received: 6 January 2020
/
Revised: 2 March 2020
/
Accepted: 3 March 2020
/
Published: 6 March 2020
(This article belongs to the Special Issue Financial Markets, Instruments and Intermediaries for Social, Environmental and Fiscal Sustainability)
Abstract
:Measures favoring healthy lives among populations around the world are essential to reduce social inequalities. Mutual funds could play an important role funding these measures if they are able to attract socially concerned investors by improving their wealth. This study analyzes the financial performance of mutual funds focused on the biotechnology and healthcare sectors related to UN sustainable development goal 3 (SDG 3), comparing their risk-adjusted return with that achieved by conventional mutual funds. This study implements Carhart’s multifactor model and Bollen and Busse’s timing multifactor model on a sample of 34 biotechnology and 178 healthcare mutual funds and 4352 conventional mutual funds. The results show that biotechnology and healthcare mutual funds perform similarly, while both of them outperform conventional mutual funds. This outperformance of biotechnology and healthcare funds is driven by the superior stock-picking skills of their managers with regards to those of conventional fund managers, while managers of biotechnology, healthcare, and conventional mutual funds present similar poor market timing ability. Mutual funds specialized in biotechnology and healthcare sectors related to sustainable development goal 3 (SDG 3) outperform conventional mutual funds.
1. Introduction
The main aim of this study is to examine the financial performance of biotechnology and healthcare mutual funds, comparing it with that achieved by conventional mutual funds. To do this, we implement Carhart’s model for studying the funds’ financial performance and Bollen and Busse’s model for analyzing managerial abilities on a sample composed of 34 biotechnology and 178 healthcare mutual funds and 4352 conventional mutual funds. The results obtained indicate that biotechnology and healthcare mutual funds are able to beat their conventional peers, mainly due to the ability of their managers to pick stocks that are undervalued in the global markets.
This study adds to previous finance literature by being, to the best of our knowledge, the first to analyze the financial performance of sustainable development goals (SDG)-related funds (so called thematic mutual funds) focused on the biotechnology and healthcare sectors (SDG 3). While previous studies have focused on analyzing SDG funds related to the water sector [1], the renewable energy sector [2,3,4,5,6] or several thematic sectors as a group [7], limited attention has been paid to mutual funds focused on sustainable development goals in the area of health, although the United Nations encourages the private sector to contribute to progress towards sustainable development goals by also investing in firms related to healthcare issues.
Mutual funds focused on the biotechnology and/or healthcare sectors could play an important role by providing financial capital to achieve the third sustainable development goal, given that they accumulate large amounts of money that are channeled towards firms developing innovative projects to find a cure or provide immunity for certain debilitating diseases such as HIV or malaria, to mitigate infant and maternal mortality, or to improve the quality of life for unhealthy persons, all of which form part of the third sustainable development goal. These mutual funds focused on one specific sustainable development goal have been called by Eurosif [8] thematic or SDG mutual funds, including healthcare funds [9]. This investment strategy has grown considerably over the last five years and it could be mixed with other socially responsible investment (SRI) strategies such as best in class, stewardship and engagement, and impact investing as proposed by Eurosif [8].
The findings of this study could be interesting for policy makers, investors, firms, and managers. In the case of policy makers, biotechnology and healthcare mutual funds allow them to align global sustainable development policies with private investment. Investors putting their savings in biotechnology or healthcare mutual funds benefit from diversified portfolios in one specific sector, managed by professionals who search for and monitor undervalued biotechnology and healthcare firms in the stock markets in order to increase the investors’ wealth while meeting investors’ needs linked to the third sustainable development goal (SDG 3). Biotechnology and healthcare firms receiving financial resources from mutual funds reduce the cost of capital [10], which would improve corporate financial performance and consequently, the fund’s financial performance and investors’ wealth. Managers managing biotechnology or healthcare mutual funds could attract investors concerned about health innovation, increasing the assets under management and therefore their earnings, given that they are able to comply with their fiduciary duties of increasing the investors’ wealth.
2. Literature Review and Development of Hypotheses
Extensive literature has examined the financial performance of mutual funds with diversified portfolios [11,12] created under the postulates of modern portfolio theory [13]. These postulates assume that portfolio managers and rational investors seek to maximize investment return while minimizing risk exposure through investment portfolios composed of stocks selected from several economic sectors. From this point of view, fund portfolios that concentrate all their stocks mainly in one specific sector, such as the healthcare or biotechnology sectors, could lose investment opportunities generated in other sectors, increasing their idiosyncratic risk, which lessens funds’ risk-adjusted return. Recent empirical evidence provides support for modern portfolio theory in the energy sector [2,3,4] and in other specific sectors analyzed as a group [7], assuming that the state of the economy remains unchanged over time in global markets. However, managers usually adjust their management strategy to the economic situation by incorporating a dynamic trading strategy into the fund portfolios. Taking into account that the state of the economy changes, Ibikunle and Steffen [2] and Martí-Ballester [5] find that global renewable energy (green) mutual funds perform similarly to conventional mutual funds, using a conventional index as a market benchmark. Similar empirical evidence is showed by Álvarez and Rodríguez [1], whose mutual funds investing in the water sector perform similarly to the market. This refutes the claim of Solnik [14] that internationally diversified portfolios substantially reduce the idiosyncratic risk derived from the concentration of stocks in one specific economic sector.
These potential diversification benefits could be high in the reduction of idiosyncratic risk for mutual funds focused on biotechnology and healthcare sectors, due to healthcare and biotechnology firms located in different countries usually developing projects and products associated with the diseases prevalent in their countries or regions, such as tropical diseases and tuberculosis in less developed countries or chronic diseases and cancer in industrialized countries, benefiting from governmental support [15]. Additionally, biotechnology and healthcare mutual funds could also benefit from reduced monitoring and search costs by restricting the investment universe, which would allow their managers to identify firms with long-term superior abnormal returns in the stock markets more quickly than conventional mutual fund managers who monitor the firms’ behavior in several sectorial stock markets in order to select firms’ stocks with the best short-term earnings [16], leading funds specialized in the biotechnology and healthcare sectors to achieve better long-term risk-adjusted return than conventional mutual funds diversified across sectors and countries. Therefore, we hypothesize that:
Hypothesis 1.
Mutual funds specialized in the biotechnology or healthcare sectors outperform conventional mutual funds.
The identification of good investment opportunities may be difficult in the biotechnology sector in which firms bear large research and development costs and take on scientific risks that become increasingly dependent on (1) the type of drug that firms develop and bring to the market and (2) the state of the economy [10,17]. The cost of biopharmaceutical treatments is much higher than that of using small-molecule treatments [18,19], due to the large failure rates in clinical trials and the long development process period, both of them contributing to increasing the drug prices [20]. This disparity in drug prices decreases when the patent of biopharmaceutical products expires and similar biotherapeutic products appear in the market [21], while orphan drugs are too expensive to develop, requiring governments to provide firms with market exclusivity and public funding in order to recoup the firm’s initial investments, to reduce the high financial costs taken on by firms, and to ensure fair and equal access to treatments by patients [17].
The efforts of developing biotechnology drugs provide benefits coming from an increasing number of biotechnology scientific publications that improve the reputation of the firms; an increasing number of licenses and patents that allow firms to capitalize on their discoveries; and an increasing number of drug products based on conventional treatments for chronic diseases that provide incomes for biopharmaceutical firms during the life of patients and/or based on gene therapies for curing patients of chronic or lethal diseases in exchange for receiving a single payment which increases the treatment costs. This increasing cost of treatments, along with the existence of multiple products for the treatment of the same diseases, has led small biotechnology firms to achieve negative profits, on average, underperforming the market, especially in crisis times. Meanwhile, large biotechnology and pharmaceutical firms, capable of manufacturing and commercializing their drugs, achieve positive profits, on average, performing better than the market [10,17]. Mutual funds investing in biotechnology firms could benefit from these good results, generating a win-win situation for both mutual funds—which could achieve positive financial performance—and biotechnology firms—which may obtain financial resources with low capital costs to implement innovative projects.
Biotechnology and high-tech innovations increasingly influence the healthcare sector. In the healthcare sector, policymakers and governments provide incentives that facilitate the entrance of private healthcare firms—some of them owned by insurance companies—in publicly funded systems [22]. Private hospitals located in countries (such as Canada, Taiwan, among others) having a universal system of health service provision, which is highly regulated and weakly competitive, could seek a high financial return by implementing a cost leadership business strategy, given that in any case, the price of the health services is established by the contract with the government. This cost leadership strategy may be focused on selecting heathier patients, leading more risky and costly patients to public hospitals [22], allowing them to improve their corporate financial performance. On the other hand, private hospitals located in countries (such as the United States) without a universal healthcare system might adopt a quality differentiation business strategy focused on innovation in treatments (using products that come from the biotechnology sector) and medical care that increases the healthcare service prices—paid by patients and/or insurance payers when the former have private health insurance, and therefore their corporate financial performance.
The adoption of a differentiation or a cost leadership business strategy depending on the lack or existence of a universal healthcare system is congruent with the findings of Lin et al. [23], that Taiwanese privately owned hospitals bear lower operational costs than those owned publicly, and those of Woolhandler et al. [24] showing that the costs of delivering health services are higher for US private hospitals than for Canadian private hospitals [25]. These operational costs could increase due to the implementation of high-tech medical technologies as a differentiation business strategy [26], allowing them to grow their revenues proportionately, justified by a higher value added of rare and imperfectly imitable medical technology resources that provide them with a competitive advantage, enhancing long-term corporate financial performance according to the firm resource-based theory [27]. However, admissions to private hospitals decrease at times of financial crisis, with patients moving into public hospitals [28], which could affect private hospitals’ financial performance. Given that both biotechnology and healthcare sectors are strongly dependent on innovations and the economic situation, and the healthcare sector depends increasingly on the biotechnology sector advances, we hypothesize that:
Hypothesis 2.
Mutual funds specialized in the biotechnology sector perform similarly to mutual funds specialized in the healthcare sector.
3. Research Method
3.1. Sample
The data source to collect mutual fund information is the EIKON/Lipper/Datastream service provided by Thomson Reuters. This database groups mutual funds using the Lipper Global categories, depending on mutual fund investment objective, asset type, and geographic focus. The Lipper Global database defines equity sector biotechnology mutual funds as those maintaining a predominant and strategic weighting in stocks of firms related to the biotechnology industry; equity sector healthcare mutual funds maintain a predominant and strategic weighting in the healthcare sector by investing in firms related to healthcare equipment and supplies, healthcare providers and services, healthcare technology, pharmaceuticals and life sciences tools, and service industries; and equity global mutual funds invest in firms across several industries and geographical markets. Our mutual fund final sample consists of 34 biotechnology and 178 healthcare mutual funds with global equity investment orientation, labelled as primary share class and domiciled in: Australia, Austria, Belgium, Brazil, Canada, China, Czech Republic, Finland, France, Germany, Hungary, Ireland, Israel, Italy, Japan, Republic of Korea, Liechtenstein, Luxembourg, Malta, Netherlands, Norway, Poland, Russia, Saudi Arabia, Singapore, Slovenia, Spain, Sweden, Switzerland, Taiwan, Thailand, UK, USA. For methodological reasons, we incorporate into our final sample 4352 conventional (equity global) mutual funds—that invest globally across industries and geographical markets—domiciled in the previously mentioned countries. For each mutual fund, we have the daily total return index (expressed in dollars), which is net of operating expenses, from January 2007 to December 2018. Furthermore, we obtain the daily total net assets (TNA) and total expenses ratio (TER) for some mutual funds in our sample during the 2007–2018 period as reported in Table 1. All mutual funds in our final sample have more than two years of data, as in Martí-Ballester [5,6], including active, liquidated, and merged mutual funds and therefore it is free of survivorship bias.
On the other hand, the information relative to market benchmark, that is the daily total return index of the S&P Global 1200 Index, is collected from the Datastream database; the one-month Treasury bill return and the size, book-to-market, and momentum factors are obtained from Kenneth French’s website (daily version for global markets); and the daily yield on a constant-maturity 3-month US Treasury Bill and the daily Moody’s AAA-and BAA-rated corporate bond yield are taken from the Federal Reserve Bank of St Louis as proxy for global economic information. To check the robustness of the main results, we also use the FTSE Global Index as an alternative conventional index, and the S&P Global 1200 Biotech Index and the S&P Global 1200 Health Care Index, as specialized indexes for mutual funds categorized as biotechnology funds and healthcare funds, respectively, all of them downloaded from Datastream database as indicated in Table 2. The Standard and Poors Company provides indexes for global markets across industries and for global markets specializing in biotechnology or healthcare industries that fit the characteristics of our sample. Furthermore, S&P indexes have been used by Alvarez and Rodriguez [1] and Nofsinger and Varma [29].
3.2. Financial Performance Models
We examine whether mutual funds financing health projects can contribute to sustainable development goals by employing a Carhart’s [30] model as follows:
where Rf,t is the daily excess returns on fund f over risk-free asset (using the one-month Treasure Bill as a proxy) return at time t; αf represents the average annualized four-factor adjusted return on fund f over period p; Rm,t is the daily excess return on market (using the S&P Global 1200 Index as a proxy) at time t; SMBt is the return difference between the lowest capitalization stock portfolio and the largest capitalization stock portfolio at time t; HMLt is the return difference between value and growth of stock portfolios at time t; WMLt is the return difference between the best and the worst stock portfolios in the previous year at time t; βm,f, βsmb,f, βhml,f, and βwml,f are the average factor loadings for market, size, book-to-market, and momentum factors on fund f over period p; εf,t is the error term in fund f over period p (from January 2007 to December 2018). The standard errors are obtained by Newey and West’s [31] technique.
Rf,t = αf + βm,fRm,t + βsmb,fSMBt + βhml,fHMLt + βwml,fWMLt + εf,t
This unconditional Carhart model assumes that return and risk remain constant over time. However, the activity of biotechnology firms is highly correlated with economic fluctuations [10], which would lead managers to employ dynamic trading strategies to manage their fund portfolios. For this reason, we incorporate time-varying alphas and betas into the Carhart model, following Ferson and Schadt [32], Christopherson et al. [33], and Silva and Cortez [34], as follows:
where αf represents the average annualized conditional risk-adjusted return on fund f over period p; βm,f, βsmb,f, βhml,f, and βwml,f are the average conditional factor loadings for market, size, book-to-market, and momentum risk factors on fund f over period p; Zt−1 is a set of three month lagged economic information variables [5,34] including the daily constant-maturity 3-month US Treasury Bill return and the daily return difference between Moody’s BAA-rated corporate bond and Moody’s AAA-rated corporate bond; α′f represents the effect of economic information variables on the conditional risk-adjusted return; and β′m,f, β′smb,f, β′hml,f, and β′wml,f represent the effect of economic information variables on the conditional betas. The other variables are as explained in model (1). The standard errors are obtained by Newey and West’s [31] technique.
Rf,t = αf + α′fZt−1 + βm,fRm,t + β′m,fZt−1Rm,t + βsmb,fSMBt + β′smb,fZt−1SMBt + βhml,fHMLt + β′hml,fZt−1HMLt + βwml,fWMLt + β′wml,fZt−1WMLt + εf,t
Models (1) and (2) are implemented to each mutual fund in our sample. On the results obtained from these models, we implement descriptive statistics (mean, standard deviation, maximum and minimum), indicating the number of estimates that, individually, perform similarly to the market benchmark, those which perform significantly better than the market, and those that significantly outperform the market benchmark for each mutual fund category.
Additionally, the inferential statistics on the results obtained from models (1) and (2) are adopted by means of the t-Student parametric test for independent samples, which allows us to check significant mean differences in financial performance reached by biotechnology, healthcare, and conventional mutual funds. In this case, the dependent variable is “financial performance” and the independent variable is “mutual fund category” taking into account two groups: biotechnology and healthcare, biotechnology and conventional, or healthcare and conventional.
3.3. Managerial Abilities Models
To check whether the financial performance reached by mutual fund managers is due to their selectivity and/or market timing skills, we implement a Bollen and Busse’s [35] model as follows:
where αf represents the ability of managers to select the undervalued stocks, that is the stock-picking skill over period p; Rm,t2 denotes the market timing risk factor as proposed by Treynor and Mazuy [36]; βm,f2 measures the ability of managers to time the market. The other variables were explained in model (1). The standard errors are obtained by Newey and West’s [31] technique.
Rf,t = αf + βm,fRm,t + βsmb,fSMBt + βhml,fHMLt + βwml,fWMLt + βm,f2Rm,t2 + εf,t
Given that managers could take economic information into account to manage their fund portfolios, we examine managerial abilities implementing the extended Bollen and Busse’s [35] model, as in Martí-Ballester [5,37]:
where αf denotes the conditional selectivity skill over period p; Rm,t2 denotes the market timing risk factor at time t; and βm,f2 indicates the average conditional market timing ability over period p. The other variables are as explained in models (1), (2), and (3). The standard errors are obtained by Newey and West’s [31] technique.
Rf,t = αf + α′fZt−1 + βm,fRm,t + β′m,fZt−1Rm,t + βsmb,fSMBt + β′smb,fZt−1SMBt + βhml,fHMLt + β′hml,fZt−1HMLt + βwml,fWMLt + β′wml,fZt−1WMLt + βm,f2Rm,t2 + β′m,f2Zt−1Rm,t2 + εf,t
4. Empirical Results and Discussion
4.1. Financial Performance of Biotechnology, Healthcare, and Conventional Mutual Funds
The financial performance of biotechnology, healthcare, and conventional mutual funds is assessed according to the unconditional and conditional version of Carhart’s [30] model, as explained in the previous section. Table 3 (For a more convenient comparison, graphs showing the results for Table 2, Table 3, Table 4 and Table 5 are presented in Appendix A.) shows the mean estimated regression coefficients for the unconditional Carhart model using the S&P Global 1200 Index as the market benchmark. The biotechnology funds have an average annualized alpha of 1.6 percent, which is not significantly different than the 1.9 percent, on average, achieved by healthcare mutual funds according to the Student-t test for independent samples (Student-t test = 0.308; p-value = 0.758), supporting hypothesis H2. However, both average annualized alphas are significantly different than the conventional fund alpha—which amounts to −1.5 percent—according to the Student-t test on comparing two independent samples integrated by alphas of biotechnology and conventional funds (Student-t test = 3.014; p-value = 0.000) and on comparing samples of healthcare and conventional fund alphas (Student-t test = 0.161; p-value = 0.005), which supports hypothesis H1, consistent with Martí-Ballester [37] in the pension fund industry. As a robustness check, we reach the same findings regarding the Student-t test using alternative conventional and specialized market benchmarks (The results of these analyses are available upon request). At the individual fund level, most biotechnology, healthcare, and conventional mutual funds achieve similar unconditional financial performance to that of the market. Specifically, 5.88 percent of biotechnology mutual funds show a statistically significant positive mean unconditional financial performance, while the remaining biotechnology funds perform similarly to the market benchmark. For the healthcare fund category, we find that 12.36 percent of funds are able to significantly beat the market benchmark, while only 2.25 percent of funds significantly underperform the market, the remaining 85.39 percent of funds presenting neutral financial performance. For the conventional fund category, the results show that only 1.15 percent of funds significantly outperform the market benchmark, while 83.11 percent of conventional funds exhibit neutral financial performance and 15.74 percent of funds achieve a statistically significant negative financial performance.
These findings scarcely change when it is assumed that managers use dynamic management strategies, as observed in Table 4, which reports the mean estimated regression coefficients for the conditional Carhart model using the S&P Global 1200 Index as the market benchmark. The biotechnology funds have an average annualized alpha of 2.9 percent, which is not significantly different than the 0.3 percent, on average, achieved by healthcare mutual funds, according to the Student-t test for independent samples (Student-t test = −1.581; p-value = 0.115), which is congruent with hypothesis H2. However, both average annualized alphas are significantly different than the conventional fund alpha—which amounts to −1.4 percent—according to the Student-t test on comparing two independent samples integrated by alphas of biotechnology and conventional funds (Student-t test = 2.645; p-value = 0.008) and on comparing samples of healthcare and conventional fund alphas (Student-t test = 2.533; p-value = 0.012), confirming hypothesis H1. As a robustness check, we reach the same findings regarding the Student-t test using alternative conventional and specialized market benchmarks (The results of these analyses are available upon request). At the individual fund level, the conditional alpha coefficients are significantly positive for 5.88 percent of biotechnology mutual funds and similar to the market for the remaining biotechnology funds. For the healthcare fund category, we find that 9.55 percent of funds are able to significantly beat the market benchmark, while only 3.93 percent of funds significantly underperform the market, the remaining healthcare funds presenting neutral financial performance. For the conventional fund category, the results show a slight improvement in the number of outperformers in relation to the results for the unconditional model, given that 1.47 per cent of funds significantly outperform the market benchmark, while 14.48 percent of conventional funds achieve statistically significant negative conditional financial performance, the remaining conventional mutual funds exhibiting neutral conditional alpha coefficients.
These results indicate that mutual funds specialized in the biotechnology and healthcare sectors outperform conventional mutual funds—diversified across sectors and countries—which is striking, taking into account that Thakor et al. [10] suggest that biotechnology firms consistently underperform the market due to their unprofitable business models. This could affect healthcare firms that are increasingly dependent on biotechnology firms [38], reducing the investment opportunities in both the biotechnology and the healthcare sectors. The reduced investment opportunities increase the idiosyncratic risk in the investment portfolios—specialized in one of the biotechnology and the healthcare sectors—reducing the portfolio financial performance according to Markowitz [13]. However, our findings seem to indicate that specialization in the biotechnology or healthcare sectors allows fund managers to find investment opportunities around the world more quickly—likely among small biotechnology and healthcare firms, as indicated by the ßsmb coefficients, with projects in a mature phase of development with licensing, manufacturing, and/or commercialization agreements with large firms [10]—and/or to reduce the monitoring and search costs, leading biotechnology and healthcare mutual funds to outperform conventional mutual funds, which is congruent with Solnik [14].
4.2. Managerial Skills for Biotechnology, Healthcare, and Conventional Mutual Funds
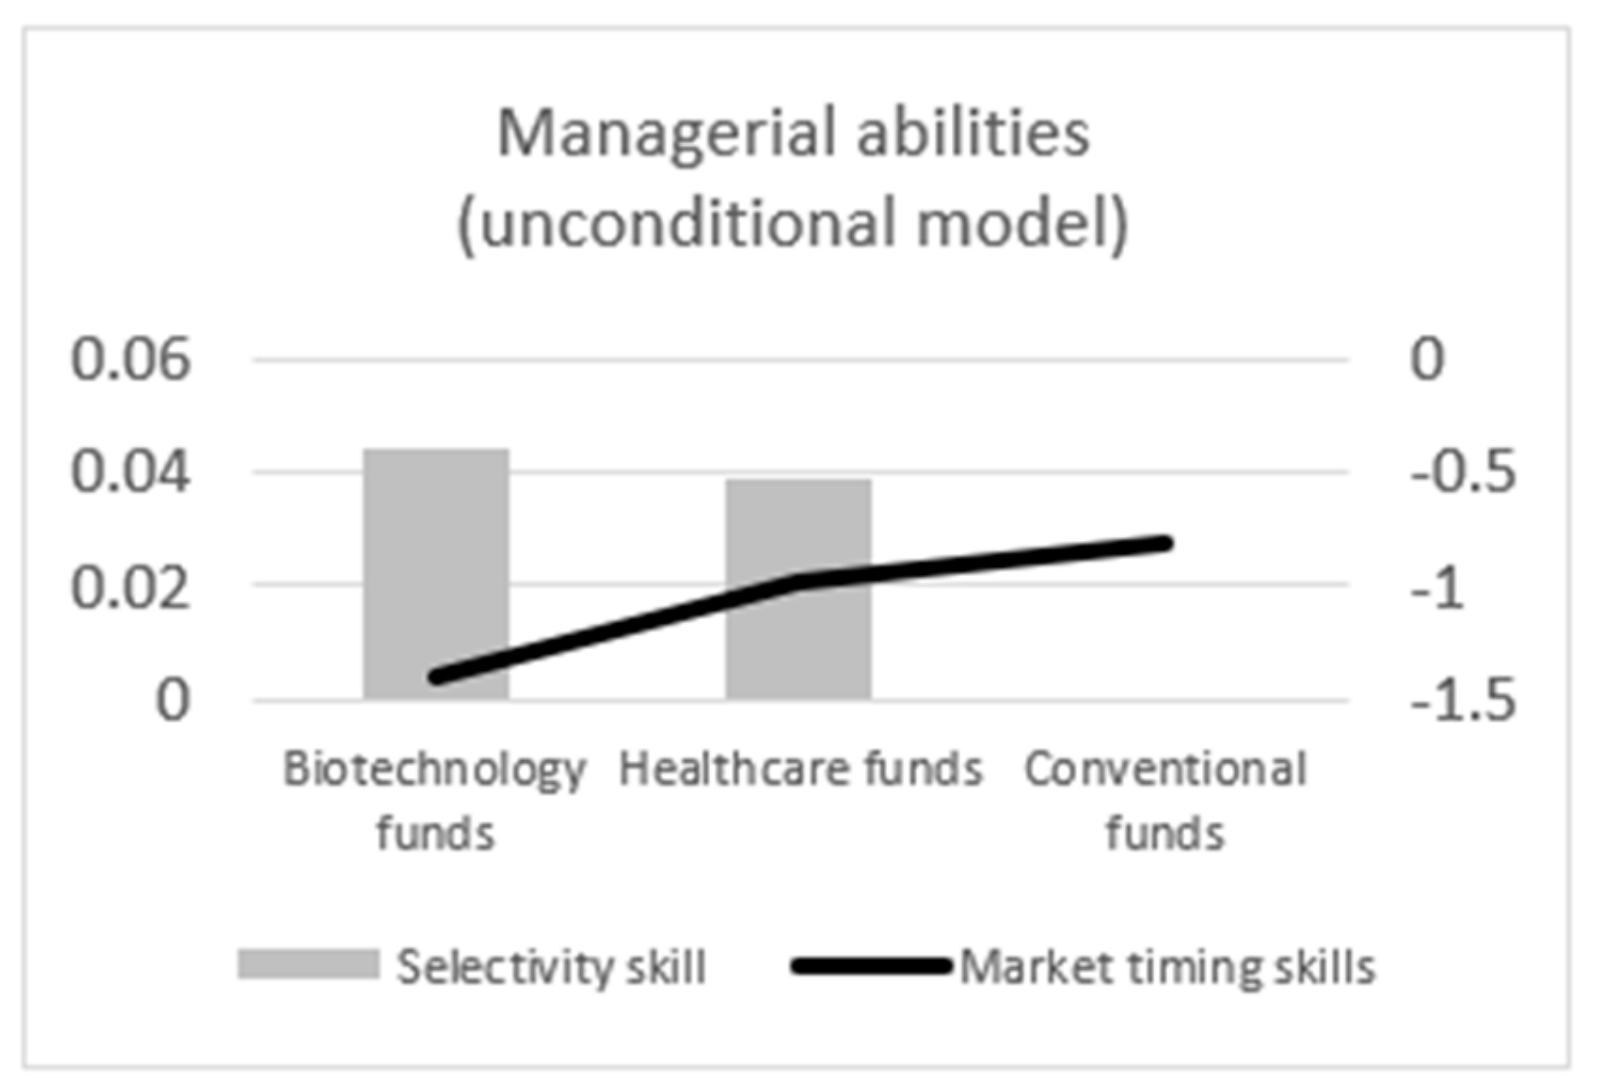
The selectivity and market timing abilities of the biotechnology, healthcare, and conventional mutual funds are examined implementing the unconditional and conditional version of Bollen and Busse’s [35] timing multifactor model, as in Martí-Ballester [5,37]. Table 5 reports the results of the mean estimated regression coefficients for the unconditional Bollen and Busse’s model, adopting the S&P Global 1200 Index as the market benchmark. At the aggregate fund level, the average alpha coefficient is higher for the biotechnology fund category than for the healthcare fund category, but the differences in mean alphas of both fund categories are not significant, as verified by the Student-t test results for independent samples (Student-t test = −0.437; p-value = 0.663), indicating that biotechnology and healthcare fund managers exhibit similar selectivity skills, which is congruent with hypothesis H2. Both of them present significantly better stock-picking abilities than those detected for conventional fund managers, according to the Student-t test results for biotechnology and conventional mean alpha coefficients (Student-t test = 3.744; p-value = 0.000) and for healthcare and conventional mean alpha coefficients (Student-t test = 7.551; p-value = 0.000), supporting hypothesis H1. Similar findings regarding the Student-t test are achieved using alternative conventional and specialized market benchmarks (The results of these analyses are available upon request). Managers in all fund categories exhibit, on average, similar poor market timing abilities, as indicated by the Student-t test results comparing biotechnology and conventional mean benchmark squared coefficients (Student-t test = −1.249; p-value = 0.212), healthcare, and conventional mean benchmark squared coefficients (Student-t test = −0.821; p-value = 0.412) and biotechnology and healthcare mean benchmark squared coefficients (Student-t test = 0.925; p-value = 0.356). However, on using a specialized index as a market benchmark, biotechnology and healthcare fund managers present significantly worse market timing skill than that detected for conventional mutual fund managers, while, on adopting an alternative conventional index as a market benchmark, only healthcare fund managers show significantly worse market timing abilities than conventional fund managers (The results of these analyses are available upon request).
At the individual fund level, we find that alpha coefficients are statistically significant and positive for 20.59 percent of funds and none is significantly negative for the biotechnology fund category. This indicates that some managers implement successful selectivity strategies. However, none of them is able to exhibit successful market timing abilities, while managers of 20.59 percent of biotechnology funds show a statistically significant negative market timing ability. For the healthcare fund category, the alpha coefficient is significantly positive for 32.58 percent of funds, indicating that their managers exhibit successful selectivity skills, while it is significantly negative for 1.69 percent of funds in our sample, their managers showing poor stock-picking skills. The benchmark squared coefficient achieves significantly positive values for 1.12 percent of funds, indicating that their managers are able to follow successful market timing skills, while 15.17 percent of funds present significantly negative benchmark squared coefficients, their managers showing poor market timing abilities. The conventional mutual fund managers exhibit successful stock-picking ability in 5.54 percent of cases, while 9.01 percent of conventional funds have managers with poor selectivity skills. The benchmark squared coefficient achieves significantly positive values for 2.23 percent of funds, indicating that their managers exhibit successful market timing skills, while managers of 15.40 percent of conventional funds show poor market timing abilities. The lack of successful stock-picking abilities of conventional fund managers, combined with the poor market timing skills of managers, drives the underperformance of conventional mutual funds.
These findings scarcely change when it is assumed that managers use dynamic management strategies, as observed in Table 6, which reports the results of the mean estimated regression coefficients for the conditional Bollen and Busse’s model, adopting the S&P Global 1200 Index as the market benchmark. At the aggregate fund level, the average alpha coefficient is higher for the biotechnology fund category than for the healthcare fund category, but the differences in mean alphas of both fund categories are not significant, as verified by the Student-t test results for independent samples (Student-t test = −1.506; p-value = 0.133), indicating that biotechnology and healthcare fund managers exhibit similar selectivity skills. Both of them present significantly better stock-picking abilities than those detected for conventional fund managers, according to the Student-t test results for biotechnology and conventional mean alpha coefficients (Student-t test = 3.036; p-value = 0.002) and for healthcare and conventional mean alpha coefficients (Student-t test = 3.212; p-value = 0.001). Similar findings regarding the Student-t test are achieved using alternative conventional and specialized market benchmarks (The results of these analyses are available upon request). Managers in all fund categories exhibit, on average, similar poor market timing abilities, as indicated by the Student-t test results comparing biotechnology and conventional mean benchmark squared coefficients (Student-t test = −0.021; p-value = 0.983), healthcare and conventional mean benchmark squared coefficients (Student-t test = −1.484; p-value = 0.139), and biotechnology and healthcare mean benchmark squared coefficients (Student-t test = −0.621; p-value = 0.535). However, on using a specialized index as a market benchmark, healthcare fund managers present significantly worse market timing skill than that detected for conventional mutual fund managers, while, on adopting an alternative conventional index as a market benchmark, healthcare fund managers show significantly worse market timing abilities than biotechnology and conventional fund managers (The results of these analyses are available upon request).
At the individual fund level, we find that alpha coefficients are statistically significant and positive for 14.71 percent of funds and none is significantly negative for the biotechnology fund category. This indicates that some managers implement successful selectivity strategies. Furthermore, when we take into account that managers use economic information in the portfolio management, we find that 5.88 percent of funds are able to exhibit successful market timing abilities, while the number of funds whose managers show a statistically significant negative market timing ability is reduced to 17.65 percent. For the healthcare fund category, the alpha coefficient is significantly positive for 26.97 percent of funds, indicating that their managers exhibit successful selectivity skills, while it is significantly negative for 3.93 percent of our sample’s funds, whose managers show poor stock-picking skills. The benchmark squared coefficient presents significantly positive values for 6.74 percent of funds, indicating that their managers are able to follow successful market timing skills, while 20.79 percent of funds show significantly negative benchmark squared coefficients, their managers showing poor market timing abilities. The conventional mutual fund managers exhibit successful stock-picking ability in 7.26 percent of cases, while 13.35 percent of conventional funds have managers with poor selectivity skills. The benchmark squared coefficient achieves significantly positive values for 7.86 percent of funds, indicating that their managers exhibit successful market timing skills, while managers of 12.32 percent of conventional funds show poor market timing abilities. The reduced number of conventional fund managers with stock-picking abilities, combined with the poor market timing skills of managers, drives the underperformance of conventional mutual funds.
These results indicate that biotechnology and healthcare fund managers are able to find undervalued stocks in a narrower investment universe more quickly than conventional fund managers who seek investment opportunities in a wide investment universe of stocks. The reduction of sectors composing fund portfolios generates a competitive advantage for biotechnology and healthcare fund managers, who have greater knowledge about firms in these sectors and/or bear less monitoring and search costs than conventional fund managers. This allows biotechnology and healthcare fund managers to implement a higher risk-adjusted return active management strategy, which it is congruent with Solnik [14]. Startlingly, most biotechnology, healthcare, and conventional fund managers have similar difficulties to time the market, with conventional fund managers presenting better market timing abilities than healthcare fund managers, using alternative market benchmarks. This could be due to biotechnology and healthcare sectors presenting a low correlation with other sectors as a whole [39], taking into account that the market benchmark (S&P Global 1200 Index) used in the financial performance and managerial models includes firms’ stock across industries and countries or it could be because the effect of the economic situation on the healthcare sector differs to that of other sectors on the whole.
5. Conclusions
Mutual funds focused on the biotechnology and healthcare sectors are able to outperform conventional mutual funds due to the better selectivity ability of biotechnology and healthcare fund managers than that of conventional fund managers. This contrasts with the traditional portfolio theory [13] that points out that the concentration of firms’ stocks in one industry reduces its investment opportunities, which increases the fund portfolio’s diversifiable risk and, consequently, lessens the fund’s financial performance. According to our findings, the diversifiable risk of a portfolio focused on specific biotechnology and healthcare sectors can be reduced by diversifying across countries, as stated by Solnik [14]. Additionally, mutual funds specializing in biotechnology or healthcare sectors could benefit from reduced monitoring and search costs––finding investment opportunities more quickly than conventional fund managers who have to monitor several industries [37]. The reduction of both diversifiable risk and monitoring and search costs allows biotechnology and healthcare mutual funds to outperform conventional mutual funds. However, this superior financial performance in relation to conventional mutual funds has not been found by previous studies focused on the renewable energy sector [2,4,5] in spite of incorporating mutual funds whose renewable energy specialized portfolios are diversified across countries in their samples, which indicates that the investment opportunities vary across sectors or areas of sustainable development goals—likely due to different stakeholder pressures in each area, as pointed by Martí-Ballester [37].
Successful financial performance leads biotechnology and healthcare mutual funds to increase their assets under management, which are channeled toward biotechnology and healthcare firms, located around the world, that are developing innovative health projects. These mutual funds exert their voting power in the Board of Directors, being able to promote sustainable development goals-related initiatives in biotechnology and healthcare firms in which they invest. As members of the Boards of Directors of firms in which they invest, mutual funds can pressure firms to implement fair financial mechanisms for all patients, for example, biotechnology firms establishing lower drug prices in less developed countries than in developed countries; healthcare firms providing healthcare and services to all patients by means of health coverage plans linked to a fair percentage of the worker’s salary or admitting patients from collapsed public healthcare hospitals, establishing fair prices.
Given that the results indicate that biotechnology and healthcare mutual funds possess considerable negotiating power with biotechnology and healthcare firms, future research could examine whether these mutual funds are pressurizing biotechnology and healthcare firms to adopt strategic social measures which allow policymakers to improve the equity and to achieve the universal health coverage mentioned in sustainable development goal 3 (SDG3).
5.1. Implications for Policy Maker
Progress in the sustainable development goal related to the health sector requires large investments for governments and firms. Biotechnology and healthcare firms could obtain financial resources from mutual funds, reducing the cost of capital arising from the high financial risks taken on by firms in both sectors. Mutual funds investing in biotechnology and healthcare firms, that implement strategic social measures improving universal health coverage, could attract more investors concerned with ensuring healthy lives, and consequently increase the assets under management if these mutual funds are easily identifiable, for example including the sustainable development goal labelled in the fund name. Policymakers could encourage mutual funds to identify their commitment to sustainable development goals and establish fiscal benefits for biotechnology and healthcare firms and mutual funds contributing to sustainable development.
5.2. Implications for The Public
This study suggests that firms in which biotechnology and healthcare funds invest are efficiently managed, generating profit. Investors concerned about health issues are able to increase their wealth while contributing to reducing diseases; managers are able to comply with their fiduciary duties.
5.3. Limitations of This Study
This study has several limitations. First, although our sample incorporates mutual funds investing in global geographical markets, we do not know the percentage of portfolio invested in each country. Second, while healthcare mutual funds invest in firms related to healthcare equipment and supplies, healthcare providers and services, healthcare technology, pharmaceuticals and life sciences tools, and service industries, we do not know the weight of each industry in their portfolio. Third, despite taking into account economic variables’ effects on fund performance by using conditional models, we are not able to examine differences in performance during a crisis and a non-crisis period, as the global crisis period in our sample is from December 2007 to June 2009 (18 months) [29] and we need at least two years’ data to achieve reliable estimators adopting Carhart’s [30] and Bollen and Busse’s [35] models.
Funding
This research received no external funding.
Acknowledgments
The author thanks the editor and four anonymous referees whose valuable suggestions and recommendations greatly improved the quality of this article. The English language of this manuscript has been revised by Servei de Llengües-Universitat Autònoma de Barcelona (UAB). This study was revised while Carmen-Pilar Martí-Ballester was visiting the Business School of Edinburgh University.
Conflicts of Interest
The author declares no conflict of interest.
Appendix A
Figure A1.
Unconditional Carhart’s [30] model results (on average) for mutual funds.
Figure A1.
Unconditional Carhart’s [30] model results (on average) for mutual funds.

Figure A2.
Conditional Carhart’s [30] model results (on average) for mutual funds.
Figure A2.
Conditional Carhart’s [30] model results (on average) for mutual funds.

Figure A3.
Unconditional Bollen and Busse’s [35] model results (on average) for mutual funds.
Figure A3.
Unconditional Bollen and Busse’s [35] model results (on average) for mutual funds.

Figure A4.
Conditional Bollen and Busse’s [35] model results (on average) for mutual funds.
Figure A4.
Conditional Bollen and Busse’s [35] model results (on average) for mutual funds.

References
- Alvarez, M.; Rodríguez, J. Water-related mutual funds: Investment performance and social role. Soc. Responsib. J. 2015, 11, 502–512. [Google Scholar] [CrossRef]
- Ibikunle, G.; Steffen, T. European green mutual fund performance: A comparative analysis with their conventional and black peers. J. Bus. Ethics 2017, 145, 337–355. [Google Scholar] [CrossRef] [Green Version]
- Reboredo, J.C.; Quintela, M.; Otero, L.A. Do investors pay a premium for going green? Evidence from alternative energy mutual funds. Renew. Sustain. Energy Rev. 2017, 73, 512–520. [Google Scholar] [CrossRef]
- Martí-Ballester, C.P. The role of mutual funds in the sustainable energy sector. Bus. Strategy Environ. 2019, 28, 1107–1120. [Google Scholar] [CrossRef]
- Martí-Ballester, C.P. Do European renewable energy mutual funds foster the transition to a low-carbon economy? Renew. Energy 2019, 143, 1299–1309. [Google Scholar] [CrossRef]
- Martí-Ballester, C.P. Analysing Alternative Energy Mutual Fund Performance in the Spanish Market. In Energy Sustainability in Built and Urban Environments; Springer: Singapore, 2019; pp. 201–213. [Google Scholar]
- Ielasi, F.; Rossolini, M. Responsible or Thematic? The True Nature of Sustainability-Themed Mutual Funds. Sustainability 2019, 11, 3304. [Google Scholar] [CrossRef] [Green Version]
- Eurosif. European SRI Study 2018. Available online: http://www.eurosif.org/wp-content/uploads/2018/11/European-SRI-2018-Study.pdf (accessed on 30 January 2020).
- Eurosif. SDGs for SRI investors. Available online: http://www.eurosif.org/wp-content/uploads/2018/01/Eurosif-SDGs-brochure.pdf (accessed on 30 January 2020).
- Thakor, R.T.; Anaya, N.; Zhang, Y.; Vilanilam, C.; Siah, K.W.; Wong, C.H.; Lo, A.W. Just how good an investment is the biopharmaceutical sector? Nat. Biotechnol. 2017, 35, 1149. [Google Scholar] [CrossRef]
- Ferreira, M.A.; Keswani, A.; Miguel, A.F.; Ramos, S.B. The determinants of mutual fund performance: A cross-country study. Rev. Financ. 2013, 17, 483–525. [Google Scholar] [CrossRef] [Green Version]
- Ferson, W.; Mo, H. Performance measurement with selectivity, market and volatility timing. J. Financ. Econ. 2016, 121, 93–110. [Google Scholar] [CrossRef]
- Markowitz, H. Portfolio selection. J. Financ. 1952, 7, 77–91. [Google Scholar]
- Solnik, B.H. Why not diversify internationally rather than domestically? Financ. Anal. J. 1995, 51, 89–94. [Google Scholar] [CrossRef]
- Abuduxike, G.; Aljunid, S.M. Development of health biotechnology in developing countries: Can private-sector players be the prime movers? Biotechnol. Adv. 2012, 30, 1589–1601. [Google Scholar] [CrossRef] [PubMed]
- Chunhua, L.; Moneta, F.; Wermers, R. Mutual Fund Investment Horizon and Performance. 2015. Available online: https://www.econstor.eu/bitstream/10419/113656/1/833265369.pdf. (accessed on 1 September 2019).
- Lalor, F.; Fitzpatrick, J.; Sage, C.; Byrne, E. Sustainability in the biopharmaceutical industry: Seeking a holistic perspective. Biotechnol. Adv. 2019, 37, 698–707. [Google Scholar] [CrossRef] [PubMed]
- Walsh, G. Biopharmaceutical benchmarks. Nat. Biotechnol. 2014, 32, 992. [Google Scholar]
- Hong, M.S.; Severson, K.A.; Jiang, M.; Lu, A.E.; Love, J.C.; Braatz, R.D. Challenges and opportunities in biopharmaceutical manufacturing control. Comput. Chem. Eng. 2018, 110, 106–114. [Google Scholar] [CrossRef]
- Shin, K.; Choy, M.; Lee, C.; Park, G. Government R&D Subsidy and Additionality of Biotechnology Firms: The Case of the South Korean Biotechnology Industry. Sustainability 2019, 11, 1583. [Google Scholar]
- Vondeling, G.T.; Cao, Q.; Postma, M.J.; Rozenbaum, M.H. The impact of patent expiry on drug prices: A systematic literature review. Appl. Health Econ. Health Policy 2018, 16, 653–660. [Google Scholar] [CrossRef] [Green Version]
- Cooper, Z.; Gibbons, S.; Skellern, M. Does competition from private surgical centres improve public hospitals’ performance? Evidence from the English National Health Service. J. Public Econ. 2018, 166, 63–80. [Google Scholar] [CrossRef]
- Lin, H.C.; Kao, S.; Wen, H.C.; Wu, C.S.; Chung, C.L. Length of stay and costs for asthma patients by hospital characteristics—A five-year population-based analysis. J. Asthma 2005, 42, 537–542. [Google Scholar] [CrossRef]
- Woolhandler, S.; Campbell, T.; Himmelstein, D.U. Costs of health care administration in the United States and Canada. New Engl. J. Med. 2003, 349, 768–775. [Google Scholar] [CrossRef] [Green Version]
- Bel, G.; Esteve, M. Is Private Production of Hospital Services Cheaper than Public Production? A Meta-Regression of Public Versus Private Costs and Efficiency for Hospitals. Int. Public Manag. 2019. [Google Scholar] [CrossRef]
- García-Cornejo, B.; Pérez-Méndez, J.A. Assessing the effect of standardized cost systems on financial performance. A difference-in-differences approach for hospitals according to their technological level. Health Policy 2018, 122, 396–403. [Google Scholar] [CrossRef] [PubMed]
- Irwin, J.G.; Hoffman, J.J.; Lamont, B.T. The effect of the acquisition of technological innovations on organizational performance: A resource-based view. J. Eng. Technol. Manag. 1998, 15, 25–54. [Google Scholar] [CrossRef]
- Simou, E.; Koutsogeorgou, E. Effects of the economic crisis on health and healthcare in Greece in the literature from 2009 to 2013: A systematic review. Health Policy 2014, 115, 111–119. [Google Scholar] [CrossRef] [Green Version]
- Nofsinger, J.; Varma, A. Socially responsible funds and market crises. J. Bank. Financ. 2014, 48, 180–193. [Google Scholar] [CrossRef]
- Carhart, M.M. On persistence in mutual fund performance. J. Financ. 2014, 52, 57–82. [Google Scholar] [CrossRef]
- Newey, W.K.; West, K.D. A Simple, Positive Semi-Definite, Heteroskedasticity and Autocorrelation Consistent Covariance Matrix. Econometrica 1987, 55, 703–708. [Google Scholar] [CrossRef]
- Ferson, W.E.; Schadt, R.W. Measuring fund strategy and performance in changing economic conditions. J. Financ. 1996, 51, 425–461. [Google Scholar] [CrossRef]
- Christopherson, J.A.; Ferson, W.E.; Glassman, D.A. Conditioning manager alphas on economic information: Another look at the persistence of performance. Rev. Financ. Stud. 1998, 11, 111–142. [Google Scholar] [CrossRef]
- Silva, F.; Cortez, M.C. The performance of US and European green funds in different market conditions. J. Clean. Prod. 2016, 135, 558–566. [Google Scholar] [CrossRef]
- Bollen, N.P.; Busse, J.A. On the timing ability of mutual fund managers. J. Financ. 2001, 56, 1075–1094. [Google Scholar] [CrossRef]
- Treynor, J.; Mazuy, K. Can mutual funds outguess the market. Harv. Bus. Rev. 1966, 44, 131–136. [Google Scholar]
- Martí-Ballester, C.P. Examining the financial performance of pension funds focused on sectors related to sustainable development goals. Int. J. Sustain. Dev. World Ecol. 2020, 27, 179–191. [Google Scholar] [CrossRef]
- Mitropoulos, P. Production and quality performance of healthcare services in EU countries during the economic crisis. Oper. Res. 2019. [Google Scholar] [CrossRef]
- Cao, D.; Long, W.; Yang, W. Sector indices correlation analysis in China’s stock market. Procedia Comput. Sci. 2013, 17, 1241–1249. [Google Scholar] [CrossRef] [Green Version]

Table 1.
Summary statistics on biotechnology, healthcare, and conventional mutual funds for the final sample.
Table 1.
Summary statistics on biotechnology, healthcare, and conventional mutual funds for the final sample.
| Category | Return | Standard Deviation | TNA ($ Millions) | TER | Number of Funds | Of Which are Active |
|---|---|---|---|---|---|---|
| Biotechnology | 0.059 | 0.014 | 97.837 | 2.196 | 34 | 25 |
| Healthcare | 0.057 | 0.011 | 126.916 | 1.886 | 178 | 151 |
| Conventional | 0.019 | 0.011 | 174.680 | 1.655 | 4352 | 3049 |
| Full sample | 0.021 | 0.011 | 172.237 | 1.668 | 4564 | 3225 |
Table 2.
Data source for each variable.
| Variable | Type of Variable | Database |
|---|---|---|
| Mutual fund category Biotechnology Healthcare Conventional | Independent variables (t-Student test) | Lipper Global (EIKON) |
| Rf,t | Dependent variable (Models 1–4) | Datastream (funds’ raw returns) Kenneth French’s website (one-month Treasury bill return) |
| Rm,t | Independent variable (Models 1–4) | Datastream (benchmarks) Kenneth French’s website (one-month Treasury bill return) |
| SMB HML WML | Control variables (Models 1–4) | Kenneth French’s website |
| Zt−1 Constant-maturity 3-month US Treasury Bill Moody’s AAA-rated corporate bond yield Moody’s BAA-rated corporate bond yield | Moderating variables (Models 2 and 4) | Federal Reserve Bank of St Louis |
| Financial performance αf (Models 1–2) αf (Models 3–4) βm,f2 (Models 3–4) | Dependent variables (t-Student test) | From Models 1–4 |
Table 3.
Unconditional Carhart’s [30] model results for mutual funds.
Table 3.
Unconditional Carhart’s [30] model results for mutual funds.
| Panel A | Alpha | Benchmark | SMB | HML | WML | R-squared |
|---|---|---|---|---|---|---|
| Biotechnology (1) | ||||||
| Mean | 0.016 | 0.686 | 0.522 | −0.560 | −0.074 | 0.259 |
| Std dev | 0.060 | 0.349 | 0.507 | 0.537 | 0.166 | 0.194 |
| Max | 0.159 | 1.451 | 1.767 | 0.172 | 0.160 | 0.585 |
| Min | −0.146 | 0.159 | −0.101 | −1.711 | −0.541 | 0.010 |
| No. of +/0/− estimates | 2/32/0 | 34/0/0 | 25/9/0 | 1/9/24 | 7/17/10 | |
| Healthcare (2) | ||||||
| Mean | 0.019 | 0.610 | 0.376 | −0.312 | −0.010 | 0.363 |
| Std dev | 0.049 | 0.254 | 0.504 | 0.357 | 0.120 | 0.234 |
| Max | 0.192 | 1.072 | 2.012 | 0.240 | 0.229 | 0.718 |
| Min | −0.184 | −0.036 | −0.267 | −1.341 | −0.393 | 0.001 |
| No. of +/0/− estimates | 22/152/4 | 172/6/0 | 105/44/29 | 11/53/114 | 54/89/35 | |
| Conventional funds (3) | ||||||
| Mean | −0.015 | 0.657 | 0.433 | 0.062 | −0.056 | 0.418 |
| Std dev | 0.050 | 0.312 | 0.437 | 0.199 | 0.130 | 0.292 |
| Max | 0.419 | 1.639 | 3.334 | 1.965 | 1.241 | 0.965 |
| Min | −1.156 | −0.248 | −1.594 | −1.844 | −1.912 | 0.000 |
| No. of +/0/− estimates | 50/3617/685 | 4176/147/29 | 3284/747/321 | 1693/1962/697 | 502/2164/1686 | |
| Panel B | Student-t test | |||||
| Biotechnology vs. (2) | 0.308 | |||||
| Biotechnology vs. (3) | 3.014 | *** | ||||
| Healthcare vs. (3) | 0.161 | *** | ||||
***, **, * indicate significance at the 1%, 5%, and 10% levels, respectively.
Table 4.
Conditional Carhart’s [30] model results for mutual funds.
Table 4.
Conditional Carhart’s [30] model results for mutual funds.
| Panel A | Alpha | Benchmark | SMB | HML | WML | R-squared |
|---|---|---|---|---|---|---|
| Biotechnology | ||||||
| Mean | 0.029 | 0.705 | 0.426 | −0.834 | −0.251 | 0.288 |
| Std dev | 0.077 | 0.340 | 0.573 | 0.812 | 0.448 | 0.192 |
| Max | 0.224 | 1.323 | 1.818 | 0.761 | 0.172 | 0.593 |
| Min | −0.107 | 0.144 | −0.569 | −2.646 | −2.210 | 0.020 |
| No. of +/0/− estimates | 2/32/0 | 32/2/0 | 18/15/1 | 0/7/27 | 1/22/11 | |
| Healthcare | ||||||
| Mean | 0.003 | 0.613 | 0.308 | −0.405 | −0.024 | 0.382 |
| Std dev | 0.088 | 0.327 | 0.564 | 0.503 | 0.249 | 0.236 |
| Max | 0.391 | 1.627 | 1.685 | 0.659 | 1.682 | 0.728 |
| Min | −0.411 | −1.211 | −1.309 | −2.077 | −0.979 | 0.011 |
| No. of +/0/− estimates | 17/154/7 | 164/13/1 | 86/55/37 | 7/59/112 | 27/112/39 | |
| Conventional funds | ||||||
| Mean | −0.014 | 0.664 | 0.394 | −0.008 | −0.066 | 0.443 |
| Std dev | 0.094 | 0.330 | 0.467 | 0.265 | 0.204 | 0.290 |
| Max | 1.832 | 3.225 | 5.448 | 4.135 | 2.086 | 0.966 |
| Min | −2.793 | −1.226 | −1.781 | −3.382 | −1.775 | 0.000 |
| No. of +/0/− estimates | 64/3658/630 | 4034/289/29 | 2983/951/418 | 883/2517/952 | 408/1962/1982 | |
| Panel B | Student-t test | |||||
| Biotechnology vs. (2) | −1.581 | |||||
| Biotechnology vs. (3) | 2.645 | *** | ||||
| Healthcare vs. (3) | 2.533 | ** | ||||
***, **, * indicate significance at the 1%, 5%, and 10% levels, respectively.
Table 5.
Unconditional Bollen and Busse’s [35] model results.
Table 5.
Unconditional Bollen and Busse’s [35] model results.
| Panel A | Alpha | Benchmark | SMB | HML | WML | Benchmark 2 | R-squared |
|---|---|---|---|---|---|---|---|
| Biotechnology | |||||||
| Mean | 0.044 | 0.678 | 0.512 | −0.559 | −0.073 | −1.390 | 0.260 |
| Std dev | 0.073 | 0.349 | 0.504 | 0.538 | 0.167 | 2.724 | 0.193 |
| Max | 0.191 | 1.411 | 1.741 | 0.177 | 0.160 | 5.671 | 0.585 |
| Min | −0.186 | 0.149 | −0.130 | −1.719 | −0.542 | −8.982 | 0.011 |
| No. of +/0/− estimates | 7/27/0 | 34/0/0 | 25/8/1 | 1/9/24 | 7/17/10 | 0/27/7 | |
| Healthcare | |||||||
| Mean | 0.039 | 0.604 | 0.369 | −0.312 | −0.009 | −0.977 | 0.364 |
| Std dev | 0.067 | 0.257 | 0.504 | 0.357 | 0.120 | 2.301 | 0.234 |
| Max | 0.310 | 1.068 | 2.015 | 0.244 | 0.230 | 6.049 | 0.719 |
| Min | −0.185 | −0.041 | −0.276 | −1.341 | −0.393 | −10.898 | 0.005 |
| No. of +/0/− estimates | 58/117/3 | 171/7/0 | 104/44/30 | 11/53/114 | 54/90/34 | 2/149/27 | |
| Conventional funds | |||||||
| Mean | 0.000 | 0.651 | 0.428 | 0.062 | −0.056 | −0.808 | 0.420 |
| Std dev | 0.069 | 0.314 | 0.435 | 0.199 | 0.130 | 2.705 | 0.291 |
| Max | 0.507 | 1.811 | 3.434 | 1.983 | 1.244 | 41.183 | 0.966 |
| Min | −1.629 | −0.274 | −1.566 | −1.808 | −1.923 | −27.811 | 0.000 |
| No. of +/0/− estimates | 241/3719/392 | 4160/162/30 | 3266/745/341 | 1711/1942/699 | 509/2147/1696 | 97/3585/670 | |
| Panel B | Selectivity skills | Market timing skill | |||||
| Student-t test | Student-t test | ||||||
| Biotechnology vs. (2) | −0.437 | 0.925 | |||||
| Biotechnology vs. (3) | 3.744 | *** | −1.249 | ||||
| Healthcare vs. (3) | 7.551 | *** | −0.821 | ||||
***, **, * indicate significance at the 1%, 5%, and 10% levels, respectively.
Table 6.
Conditional Bollen and Busse’s [35] model results.
Table 6.
Conditional Bollen and Busse’s [35] model results.
| Panel A | Alpha | Benchmark | SMB | HML | WML | Benchmark 2 | R-squared |
|---|---|---|---|---|---|---|---|
| Biotechnology | |||||||
| Mean | 0.072 | 0.689 | 0.426 | −0.846 | −0.260 | −1.188 | 0.291 |
| Std dev | 0.137 | 0.347 | 0.572 | 0.810 | 0.463 | 6.846 | 0.191 |
| Max | 0.472 | 1.342 | 1.801 | 0.652 | 0.175 | 16.701 | 0.594 |
| Min | −0.262 | −0.031 | −0.519 | −2.650 | −2.319 | −31.690 | 0.023 |
| No. of +/0/− estimates | 5/29/0 | 32/2/0 | 18/15/1 | 0/7/27 | 1/20/13 | 2/26/6 | |
| Healthcare | |||||||
| Mean | 0.035 | 0.600 | 0.308 | −0.410 | −0.029 | −2.544 | 0.385 |
| Std dev | 0.129 | 0.326 | 0.564 | 0.503 | 0.249 | 12.322 | 0.236 |
| Max | 0.880 | 1.337 | 1.690 | 0.646 | 1.692 | 14.720 | 0.730 |
| Min | −0.348 | −1.212 | −1.278 | −2.071 | −0.976 | −98.445 | 0.011 |
| No. of +/0/− estimates | 48/123/7 | 163/15/0 | 85/55/38 | 8/57/113 | 26/111/41 | 12/129/37 | |
| Conventional funds | |||||||
| Mean | 0.003 | 0.656 | 0.393 | −0.010 | −0.066 | −1.154 | 0.446 |
| Std dev | 0.133 | 0.333 | 0.465 | 0.267 | 0.206 | 9.044 | 0.289 |
| Max | 2.329 | 3.347 | 5.648 | 4.342 | 2.465 | 40.220 | 0.966 |
| Min | −3.163 | −1.295 | −1.804 | −3.416 | −1.759 | −261.395 | 0.000 |
| No. of +/0/− estimates | 316/3455/581 | 3991/331/30 | 2986/936/430 | 882/2508/962 | 410/1965/1977 | 342/3474/536 | |
| Panel B | Selectivity skills | Market timing skill | |||||
| Student-t test | Student-t test | ||||||
| Biotechnology vs. (2) | −1.506 | −0.621 | |||||
| Biotechnology vs. (3) | 3.036 | *** | −0.021 | ||||
| Healthcare vs. (3) | 3.212 | *** | −1.484 | ||||
***, **, * indicate significance at the 1%, 5%, and 10% levels, respectively.
© 2020 by the author. Licensee MDPI, Basel, Switzerland. This article is an open access article distributed under the terms and conditions of the Creative Commons Attribution (CC BY) license (http://creativecommons.org/licenses/by/4.0/).
Share and Cite
MDPI and ACS Style
Martí-Ballester, C.-P. Financial Performance of SDG Mutual Funds Focused on Biotechnology and Healthcare Sectors. Sustainability 2020, 12, 2032. https://0-doi-org.brum.beds.ac.uk/10.3390/su12052032
AMA Style
Martí-Ballester C-P. Financial Performance of SDG Mutual Funds Focused on Biotechnology and Healthcare Sectors. Sustainability. 2020; 12(5):2032. https://0-doi-org.brum.beds.ac.uk/10.3390/su12052032
Chicago/Turabian StyleMartí-Ballester, Carmen-Pilar. 2020. "Financial Performance of SDG Mutual Funds Focused on Biotechnology and Healthcare Sectors" Sustainability 12, no. 5: 2032. https://0-doi-org.brum.beds.ac.uk/10.3390/su12052032
Note that from the first issue of 2016, this journal uses article numbers instead of page numbers. See further details here.